Catchment-Scale Conservation Units Identified for the Threatened Yarra Pygmy Perch (Nannoperca...
13
Catchment-Scale Conservation Units Identified for the Threatened Yarra Pygmy Perch (Nannoperca obscura) in Highly Modified River Systems Chris J. Brauer 1 , Peter J. Unmack 2 , Michael P. Hammer 3,4,5 , Mark Adams 3,5 , Luciano B. Beheregaray 1 * 1 Molecular Ecology Laboratory, School of Biological Sciences, Flinders University, Adelaide, South Australia, Australia, 2 Institute for Applied Ecology and Collaborative Research Network for Murray-Darling Basin Futures, University of Canberra, Canberra, Australian Capital Territory, Australia, 3 School of Earth and Environmental Sciences, University of Adelaide, South Australia, Australia, 4 Curator of Fishes, Museum and Art Gallery of the Northern Territory, Darwin, Northern Territory, Australia, 5 Evolutionary Biology Unit, South Australian Museum, Adelaide, South Australia, Australia Abstract Habitat fragmentation caused by human activities alters metapopulation dynamics and decreases biological connectivity through reduced migration and gene flow, leading to lowered levels of population genetic diversity and to local extinctions. The threatened Yarra pygmy perch, Nannoperca obscura, is a poor disperser found in small, isolated populations in wetlands and streams of southeastern Australia. Modifications to natural flow regimes in anthropogenically-impacted river systems have recently reduced the amount of habitat for this species and likely further limited its opportunity to disperse. We employed highly resolving microsatellite DNA markers to assess genetic variation, population structure and the spatial scale that dispersal takes place across the distribution of this freshwater fish and used this information to identify conservation units for management. The levels of genetic variation found for N. obscura are amongst the lowest reported for a fish species (mean heterozygosity of 0.318 and mean allelic richness of 1.92). We identified very strong population genetic structure, nil to little evidence of recent migration among demes and a minimum of 11 units for conservation management, hierarchically nested within four major genetic lineages. A combination of spatial analytical methods revealed hierarchical genetic structure corresponding with catchment boundaries and also demonstrated significant isolation by riverine distance. Our findings have implications for the national recovery plan of this species by demonstrating that N. obscura populations should be managed at a catchment level and highlighting the need to restore habitat and avoid further alteration of the natural hydrology. Citation: Brauer CJ, Unmack PJ, Hammer MP, Adams M, Beheregaray LB (2013) Catchment-Scale Conservation Units Identified for the Threatened Yarra Pygmy Perch (Nannoperca obscura) in Highly Modified River Systems. PLoS ONE 8(12): e82953. doi:10.1371/journal.pone.0082953 Editor: Stefano Mariani, School of Environment & Life Sciences, United Kingdom Received August 8, 2013; Accepted October 29, 2013; Published December 13, 2013 Copyright: ß 2013 Brauer et al. This is an open-access article distributed under the terms of the Creative Commons Attribution License, which permits unrestricted use, distribution, and reproduction in any medium, provided the original author and source are credited. Funding: Financial support for this study was provided by the Australian Research Council (LP100200409 to LB Beheregaray, J Harris & M Adams). Support was provided to CJB by the AJ & IM Naylon Honours scholarship. PJU was supported as a Murray-Darling Basin futures research fellow through the Australian Government’s Collaborative Research Networks (CRN) Program. MPH was provided support by the Cooperative Research Centre for Freshwater Ecology and an Australian Postgraduate Award. The funders had no role in study design, data collection and analysis, decision to publish, or preparation of the manuscript. Competing Interests: The authors have declared that no competing interests exist. * E-mail: [email protected] Introduction Human activities such as land development, agriculture, and exploitation of natural resources have long been acknowledged as driving processes behind habitat fragmentation and degradation [1,2]. This can decrease population connectivity through reduced migration and gene flow, leading to higher genetic differentiation among populations and lowered levels of genetic diversity within [3]. When populations become isolated they become vulnerable to extirpation due to environmental [1], demographic [4] and genetic [5] processes that increase the chances of local extinction. If habitat fragmentation is widespread on a regional scale then there is the potential for loss of biodiversity and species extinctions [6]. It is therefore important for conservation and natural resource managers to consider patterns and processes related to population connectivity and gene flow at both local and regional scales [7]. Conservation genetics is the application of evolutionary principles and molecular methods to species and biodiversity conservation [8]. Riverscapes have long been recognised for their ecological complexity and sensitivity to human impacts [9,10], and have been the focus of many recent conservation genetics studies [11–15]. Understanding the spatial scale of patterns of genetic diversity is also important for species conservation in order to identify the evolutionary processes shaping these patterns and to detect when populations become demographically and genetically independent [16,17]. This information can be used to estimate the geographical extent of conservation units defined by genetic criteria [18,19], such as the popularly used Evolutionarily Significant Units (ESUs) and Management Units (MUs) (see Moritz [20] and Crandall [21] for definitions). These conservation units can inform conservation management strategies by recog- nising the historical isolation of evolutionary lineages (i.e. ESU), and the functional and demographic independence of populations (i.e. MU) [22]. In this study we identify units for conservation in a threatened freshwater fish, Nannoperca obscura (Yarra pygmy perch), found across two biogeographic provinces [23] in a series of adjacent, but highly fragmented Australian riverine ecosystems. One is the PLOS ONE | www.plosone.org 1 December 2013 | Volume 8 | Issue 12 | e82953
Transcript of Catchment-Scale Conservation Units Identified for the Threatened Yarra Pygmy Perch (Nannoperca...
Catchment-Scale Conservation Units Identified for theThreatened Yarra Pygmy Perch (Nannoperca obscura) inHighly Modified River SystemsChris J. Brauer1, Peter J. Unmack2, Michael P. Hammer3,4,5, Mark Adams3,5, Luciano B. Beheregaray1*
1 Molecular Ecology Laboratory, School of Biological Sciences, Flinders University, Adelaide, South Australia, Australia, 2 Institute for Applied Ecology and Collaborative
Research Network for Murray-Darling Basin Futures, University of Canberra, Canberra, Australian Capital Territory, Australia, 3 School of Earth and Environmental Sciences,
University of Adelaide, South Australia, Australia, 4 Curator of Fishes, Museum and Art Gallery of the Northern Territory, Darwin, Northern Territory, Australia,
5 Evolutionary Biology Unit, South Australian Museum, Adelaide, South Australia, Australia
Abstract
Habitat fragmentation caused by human activities alters metapopulation dynamics and decreases biological connectivitythrough reduced migration and gene flow, leading to lowered levels of population genetic diversity and to local extinctions.The threatened Yarra pygmy perch, Nannoperca obscura, is a poor disperser found in small, isolated populations in wetlandsand streams of southeastern Australia. Modifications to natural flow regimes in anthropogenically-impacted river systemshave recently reduced the amount of habitat for this species and likely further limited its opportunity to disperse. Weemployed highly resolving microsatellite DNA markers to assess genetic variation, population structure and the spatial scalethat dispersal takes place across the distribution of this freshwater fish and used this information to identify conservationunits for management. The levels of genetic variation found for N. obscura are amongst the lowest reported for a fishspecies (mean heterozygosity of 0.318 and mean allelic richness of 1.92). We identified very strong population geneticstructure, nil to little evidence of recent migration among demes and a minimum of 11 units for conservation management,hierarchically nested within four major genetic lineages. A combination of spatial analytical methods revealed hierarchicalgenetic structure corresponding with catchment boundaries and also demonstrated significant isolation by riverinedistance. Our findings have implications for the national recovery plan of this species by demonstrating that N. obscurapopulations should be managed at a catchment level and highlighting the need to restore habitat and avoid furtheralteration of the natural hydrology.
Citation: Brauer CJ, Unmack PJ, Hammer MP, Adams M, Beheregaray LB (2013) Catchment-Scale Conservation Units Identified for the Threatened Yarra PygmyPerch (Nannoperca obscura) in Highly Modified River Systems. PLoS ONE 8(12): e82953. doi:10.1371/journal.pone.0082953
Editor: Stefano Mariani, School of Environment & Life Sciences, United Kingdom
Received August 8, 2013; Accepted October 29, 2013; Published December 13, 2013
Copyright: � 2013 Brauer et al. This is an open-access article distributed under the terms of the Creative Commons Attribution License, which permitsunrestricted use, distribution, and reproduction in any medium, provided the original author and source are credited.
Funding: Financial support for this study was provided by the Australian Research Council (LP100200409 to LB Beheregaray, J Harris & M Adams). Support wasprovided to CJB by the AJ & IM Naylon Honours scholarship. PJU was supported as a Murray-Darling Basin futures research fellow through the AustralianGovernment’s Collaborative Research Networks (CRN) Program. MPH was provided support by the Cooperative Research Centre for Freshwater Ecology and anAustralian Postgraduate Award. The funders had no role in study design, data collection and analysis, decision to publish, or preparation of the manuscript.
Competing Interests: The authors have declared that no competing interests exist.
* E-mail: [email protected]
Introduction
Human activities such as land development, agriculture, and
exploitation of natural resources have long been acknowledged as
driving processes behind habitat fragmentation and degradation
[1,2]. This can decrease population connectivity through reduced
migration and gene flow, leading to higher genetic differentiation
among populations and lowered levels of genetic diversity within
[3]. When populations become isolated they become vulnerable to
extirpation due to environmental [1], demographic [4] and genetic
[5] processes that increase the chances of local extinction. If
habitat fragmentation is widespread on a regional scale then there
is the potential for loss of biodiversity and species extinctions [6]. It
is therefore important for conservation and natural resource
managers to consider patterns and processes related to population
connectivity and gene flow at both local and regional scales [7].
Conservation genetics is the application of evolutionary
principles and molecular methods to species and biodiversity
conservation [8]. Riverscapes have long been recognised for their
ecological complexity and sensitivity to human impacts [9,10], and
have been the focus of many recent conservation genetics studies
[11–15]. Understanding the spatial scale of patterns of genetic
diversity is also important for species conservation in order to
identify the evolutionary processes shaping these patterns and to
detect when populations become demographically and genetically
independent [16,17]. This information can be used to estimate the
geographical extent of conservation units defined by genetic
criteria [18,19], such as the popularly used Evolutionarily
Significant Units (ESUs) and Management Units (MUs) (see
Moritz [20] and Crandall [21] for definitions). These conservation
units can inform conservation management strategies by recog-
nising the historical isolation of evolutionary lineages (i.e. ESU),
and the functional and demographic independence of populations
(i.e. MU) [22].
In this study we identify units for conservation in a threatened
freshwater fish, Nannoperca obscura (Yarra pygmy perch), found
across two biogeographic provinces [23] in a series of adjacent, but
highly fragmented Australian riverine ecosystems. One is the
PLOS ONE | www.plosone.org 1 December 2013 | Volume 8 | Issue 12 | e82953
Murray-Darling Basin (MDB), arguably Australia’s most impor-
tant agricultural region, given it contributes 50% of the water used
for agricultural irrigation in the country [24]. Modifications to the
natural flow regime, water abstraction, drainage of wetlands, and
the introduction of exotic species have all contributed to the
decline of native fishes across the MDB, and this trend is expected
to continue in the face of future climate change [25]. In recent
years drought has led to extremely low inflows and reduced water
levels throughout the system and this is especially evident in the
Lower Lakes region of the MDB [26,27]. Bass Province is the
second biogeographically distinct area which contains many
smaller separate catchments encompassing most of the range of
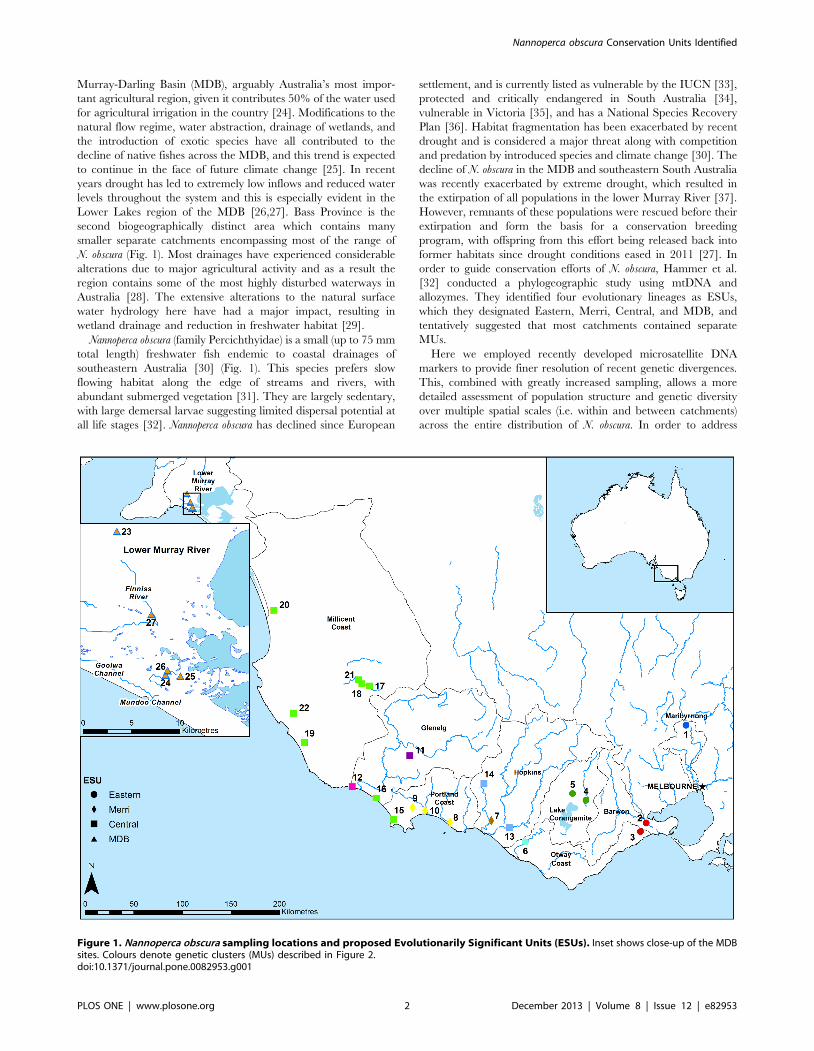
N. obscura (Fig. 1). Most drainages have experienced considerable
alterations due to major agricultural activity and as a result the
region contains some of the most highly disturbed waterways in
Australia [28]. The extensive alterations to the natural surface
water hydrology here have had a major impact, resulting in
wetland drainage and reduction in freshwater habitat [29].
Nannoperca obscura (family Percichthyidae) is a small (up to 75 mm
total length) freshwater fish endemic to coastal drainages of
southeastern Australia [30] (Fig. 1). This species prefers slow
flowing habitat along the edge of streams and rivers, with
abundant submerged vegetation [31]. They are largely sedentary,
with large demersal larvae suggesting limited dispersal potential at
all life stages [32]. Nannoperca obscura has declined since European
settlement, and is currently listed as vulnerable by the IUCN [33],
protected and critically endangered in South Australia [34],
vulnerable in Victoria [35], and has a National Species Recovery
Plan [36]. Habitat fragmentation has been exacerbated by recent
drought and is considered a major threat along with competition
and predation by introduced species and climate change [30]. The
decline of N. obscura in the MDB and southeastern South Australia
was recently exacerbated by extreme drought, which resulted in
the extirpation of all populations in the lower Murray River [37].
However, remnants of these populations were rescued before their
extirpation and form the basis for a conservation breeding
program, with offspring from this effort being released back into
former habitats since drought conditions eased in 2011 [27]. In
order to guide conservation efforts of N. obscura, Hammer et al.
[32] conducted a phylogeographic study using mtDNA and
allozymes. They identified four evolutionary lineages as ESUs,
which they designated Eastern, Merri, Central, and MDB, and
tentatively suggested that most catchments contained separate
MUs.
Here we employed recently developed microsatellite DNA
markers to provide finer resolution of recent genetic divergences.
This, combined with greatly increased sampling, allows a more
detailed assessment of population structure and genetic diversity
over multiple spatial scales (i.e. within and between catchments)
across the entire distribution of N. obscura. In order to address
Figure 1. Nannoperca obscura sampling locations and proposed Evolutionarily Significant Units (ESUs). Inset shows close-up of the MDBsites. Colours denote genetic clusters (MUs) described in Figure 2.doi:10.1371/journal.pone.0082953.g001
Nannoperca obscura Conservation Units Identified
PLOS ONE | www.plosone.org 2 December 2013 | Volume 8 | Issue 12 | e82953

issues of relatedness between isolated river systems, we treat each
river with an independent connection to the ocean as a separate
unit, herein defined as a catchment. Firstly, we used these data to
test the proposed ESUs of Hammer et al. [32], which were defined
with more conservative molecular markers using a relatively small
sample of individuals (n = 156) and localities (18). Secondly, we
tested the hypothesis derived from life history and ecological
requirements that N. obscura are poor dispersers and should
therefore display very low connectivity between catchments and
low connectivity between sites within catchments, with many
populations representing different MUs within highly structured
ESUs. For this hypothesis, we use a combination of frequency-
based and genotypic-based statistical methods to assess the
number and spatial distribution of MUs within inferred ESUs.
Finally, we explore factors that have shaped the spatial distribution
of genetic diversity in N. obscura and highlight the direct
implications of our findings for conservation management.
Materials and Methods
Ethics StatementPermission to undertake field work and collect specimens was
obtained under the following permits: Victorian Fisheries research
permits RP 581 and RP 945, Victorian Flora and Fauna permits
10002072 and 10004939, Victorian National Parks permit
10004939, South Australian Primary Industries and Resources -
Section 59 and 115 Exemptions. Specimens were obtained under
Arizona State University Institutional Animal Care and Use
Committee (IACUC) approval 09-1018R, Brigham Young Uni-
versity IACUC approval 070403, University of Adelaide Animal
Ethics Committee approval S-32-2002 and Flinders University
Animal Welfare Committee approval E313.
Sampling and genotypingA total of 541 individuals were sampled from 27 locations
(n = 5–40 per site) across the entire extant range of N. obscura
(Fig. 1). DNA was extracted from caudal fin clips following a
modified salting out process [38]. Fourteen microsatellite loci
designed specifically for N. obscura were amplified in two
polymerase chain reaction (PCR) multiplexes of six and eight
loci, respectively [39] (Table S1). The PCR conditions were based
on a modified touchdown procedure [40]. The PCR product was
diluted 1:5 with H2O, sized with GS500LIZ size standard and
analysed using an automated ABI 3130 capillary electrophoresis
system (Applied Biosystems) with one run per multiplex PCR.
Genotypes were binned and scored visually with GeneMapper 4.0
(Applied Biosystems). Genotypes were checked for scoring errors
putatively related to null alleles, stuttering, and large allele drop-
out using Micro-Checker 2.2.3 [41]. To ensure all loci were scored
consistently, we repeated amplification and genotyping procedures
for 86 individuals.
Genetic variationFisher’s exact test of linkage disequilibrium and tests for
departures from Hardy-Weinberg equilibrium (HWE) were
conducted using GENEPOP 4.1.4 [42], and GenoDive 2.0 [43],
respectively. Significance levels were Bonferroni-corrected to avoid
type I errors associated with multiple tests [44]. For each site, the
number of alleles (NA), expected (HE) and observed (HO)
heterozygosity, and inbreeding coefficient (FIS) were calculated
in GenoDive 2.0 [43]. Allelic richness (AR) was estimated using the
rarefaction procedure in HP-RARE [45], and the percentage of
polymorphic loci was calculated in GenAlEx 6.5 [46].
Population structurePopulation genetic structure was assessed at multiple spatial
scales, both across the entire distribution and within each of the
proposed ESUs, using a combination of several frequency-based
and genotype-based statistical methods. Pairwise FST [47] and RST
[48] tests were performed in Arlequin 3.5.1.2 [49] to evaluate
between-site differentiation. Given the potential for temporal
variation in population structure, an assessment of pairwise FST
and RST was also performed between years at 12 sites where
samples were collected on multiple occasions. In order to
determine if either FST or RST was more appropriate for this
study, the relative contribution of genetic drift and mutation to
population differentiation was assessed [50]. SPAGeDi 1.3 [51]
was used to permutate global allele sizes for each locus and to
compare observed RST with permutated RST (pRST) values.
Arlequin was used to perform an analysis of molecular variance
(AMOVA) with 1000 permutations based on FST [47]. Hierar-
chical structure was assessed using AMOVA among the major
genetic lineages, among sites within lineages, and among
individuals within sites. Separate AMOVAs were also performed
for each primary lineage.
A Bayesian clustering analysis of individual genotypes using
STRUCTURE 2.3.4 [52] was initially performed using all
samples to identify primary population structure across the entire
distribution, before repeating the analysis within each of the
primary clusters to assess hierarchical population structure at
smaller spatial scales [53]. Twenty independent runs for each K
value (1–27) were completed to ensure reproducibility [54], using a
burn in of 100 000 followed by 1 million Monte-Carlo Markov
chain (MCMC) iterations. We used the admixture model, with
independent allele frequencies among populations and no prior
information on sampling location. The most likely K value was
inferred using the Evanno et al. method [53] implemented in
STRUCTURE HARVESTER [55]. Results of the 20 replications
were then combined using the software CLUMPP 1.1.2 [56], and
visualised using Distruct 1.1 [57]. A different analytical approach
based on assignment of individual genotypes was performed using
GeneClass2 [58]. This was conducted using the Bayesian
approach of Rannala and Mountain [59] to calculate the
probability that each individual originates from its sampling
locality or from other sites.
Principal coordinates analysis (PCA) was also employed to allow
visual examination of the genetic affinities of individuals across the
entire distribution and to clusters identified within each lineage.
Pairwise genetic distances [60] between individuals were first
calculated before those results were subjected to PCA analysis.
Both procedures were completed in GenAlEx 6.5 [46].
Gene flowWe used BayesAss 3.0 [61] to estimate recent migration among
lineages and also between clusters identified within lineages.
BayesAss implements a Bayesian MCMC resampling method
using multilocus genotypes to estimate asymmetrical rates of
recent migration, where migration (m) is the proportion of each
population having migrant ancestry. First generation migrants, or
the offspring of at least one first generation migrant, are
considered as having migrant ancestry. The software was run for
10 million iterations with a 1 million iteration burn in. Mixing
parameters for allele frequencies, inbreeding coefficients and
migration rate were adjusted to achieve optimum acceptance rates
of 20–40% [61]. Convergence was confirmed by plotting the
cumulative log likelihoods of the iterations using the program
Tracer 1.5 [62]. Each run was also repeated five times using
Nannoperca obscura Conservation Units Identified
PLOS ONE | www.plosone.org 3 December 2013 | Volume 8 | Issue 12 | e82953
different seeds and the posterior estimates compared for consis-
tency [61].
Spatial analysesSpatial genetic structure was assessed at both the population
and individual level. At the population level isolation by distance
(IBD) was assessed using Mantel tests. These tests were applied to
each of the three lineages that displayed evidence of population
structure to determine the association between pairwise population
FST and geographic distance. Euclidean distance was calculated
because most sites occur in isolated catchments and are not
connected by continuous stream lengths.
Results of a test for IBD can be difficult to interpret when
population structure is strongly influenced by sharply divided
spatial groups [63]. This can occur when hierarchical structure
due to the presence of strong barriers for dispersal (physical or
ecological) creates clusters of populations that are not necessarily
better explained by spatial distances between demes. To assess this
possibility partial Mantel tests were performed to assess for
hierarchical population structure, such as that identified by the
AMOVAs and STRUCTURE. These tests assessed the associa-
tion between FST and geographic distance while controlling for
hierarchical population structure by using a binary model matrix
describing whether comparisons were made either between or
within the identified clusters [64]. Finally a simple Mantel test was
performed for C4, the largest genetic cluster identified within a
lineage (no other clusters contained a sufficient number of sites), in
order to test for IBD at a local scale. Performing this test separately
within predefined clusters removes any potential bias of hierar-
chical structure [63]. All Mantel and partial Mantel tests were
performed in GenoDive 2.0 using 1000 permutations.
To further evaluate spatial dimensions of genetic structure at an
individual level within each lineage we used spatial autocorrelation
[65] in two ways. Firstly, correlograms were constructed using the
method of Smouse and Peakall [60] implemented in GenAlEx 6.5.
The autocorrelation coefficient (r) was plotted as a function of
discrete distance classes, partitioned so as to achieve a similar
number of pairwise comparisons for each class [18]. A positive r
value indicates the presence of IBD and the x intercept can provide
an estimate of the extent of IBD for each lineage [17–19]. Peakall
et al. [17] also suggest a second autocorrelation method to
accurately identify the scale at which population genetic structure
is detectable. In this case, r was calculated using multiple distance
class analysis, also in GenAlEx 6.5. This method plots r as a
function of increasing distance class sizes [17]. The first class is
based on the minimum distance between sites (0–10 km for all
lineages) and each successive class adds individuals from more
distant groups (i.e. 0–10 km, 0–20 km, 0–30 km, etc.). When
significant IBD exists, the value of r is expected to decrease with
the increasing size of each distance class. The last distance class for
which r is significant is considered the limit of detectable IBD [17].
Significance was assessed for both tests using 95% confidence
intervals for the null hypothesis of no spatial structure using 999
random permutations, and for estimates of r by bootstrapping
1000 pairwise comparisons for each distance class [46].
Results
Data quality and genetic variationThere was no consistent evidence for stuttering or large allele
drop-out for any locus, or for linkage disequilibrium between any
pairs of loci. Null alleles were detected for Nob26 at sites 14 and
26, Nob30 at sites 2, 5 and 17 and Nob35 at site 27. However as
these findings were not consistent across populations, and when
analyses were run without these loci similar results were obtained,
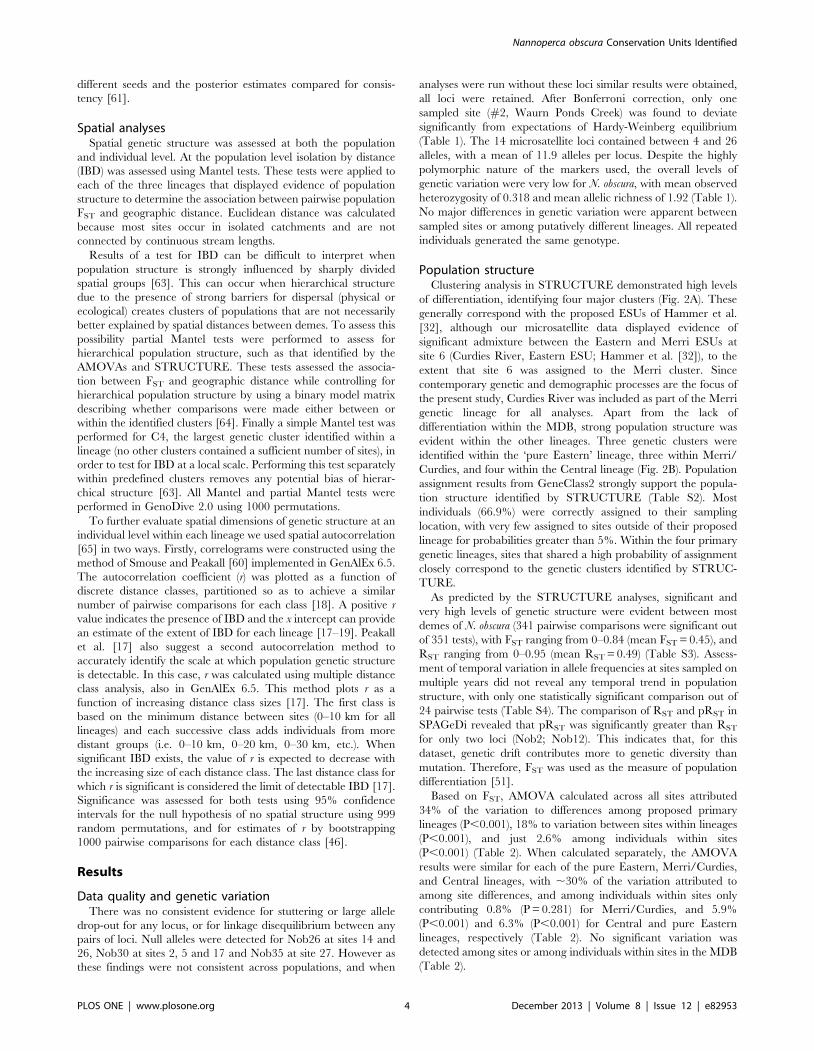
all loci were retained. After Bonferroni correction, only one
sampled site (#2, Waurn Ponds Creek) was found to deviate
significantly from expectations of Hardy-Weinberg equilibrium
(Table 1). The 14 microsatellite loci contained between 4 and 26
alleles, with a mean of 11.9 alleles per locus. Despite the highly
polymorphic nature of the markers used, the overall levels of
genetic variation were very low for N. obscura, with mean observed
heterozygosity of 0.318 and mean allelic richness of 1.92 (Table 1).
No major differences in genetic variation were apparent between
sampled sites or among putatively different lineages. All repeated
individuals generated the same genotype.
Population structureClustering analysis in STRUCTURE demonstrated high levels
of differentiation, identifying four major clusters (Fig. 2A). These
generally correspond with the proposed ESUs of Hammer et al.
[32], although our microsatellite data displayed evidence of
significant admixture between the Eastern and Merri ESUs at
site 6 (Curdies River, Eastern ESU; Hammer et al. [32]), to the
extent that site 6 was assigned to the Merri cluster. Since
contemporary genetic and demographic processes are the focus of
the present study, Curdies River was included as part of the Merri
genetic lineage for all analyses. Apart from the lack of
differentiation within the MDB, strong population structure was
evident within the other lineages. Three genetic clusters were
identified within the ‘pure Eastern’ lineage, three within Merri/
Curdies, and four within the Central lineage (Fig. 2B). Population
assignment results from GeneClass2 strongly support the popula-
tion structure identified by STRUCTURE (Table S2). Most
individuals (66.9%) were correctly assigned to their sampling
location, with very few assigned to sites outside of their proposed
lineage for probabilities greater than 5%. Within the four primary
genetic lineages, sites that shared a high probability of assignment
closely correspond to the genetic clusters identified by STRUC-
TURE.
As predicted by the STRUCTURE analyses, significant and
very high levels of genetic structure were evident between most
demes of N. obscura (341 pairwise comparisons were significant out
of 351 tests), with FST ranging from 0–0.84 (mean FST = 0.45), and
RST ranging from 0–0.95 (mean RST = 0.49) (Table S3). Assess-
ment of temporal variation in allele frequencies at sites sampled on
multiple years did not reveal any temporal trend in population
structure, with only one statistically significant comparison out of
24 pairwise tests (Table S4). The comparison of RST and pRST in
SPAGeDi revealed that pRST was significantly greater than RST
for only two loci (Nob2; Nob12). This indicates that, for this
dataset, genetic drift contributes more to genetic diversity than
mutation. Therefore, FST was used as the measure of population
differentiation [51].
Based on FST, AMOVA calculated across all sites attributed
34% of the variation to differences among proposed primary
lineages (P,0.001), 18% to variation between sites within lineages
(P,0.001), and just 2.6% among individuals within sites
(P,0.001) (Table 2). When calculated separately, the AMOVA
results were similar for each of the pure Eastern, Merri/Curdies,
and Central lineages, with ,30% of the variation attributed to
among site differences, and among individuals within sites only
contributing 0.8% (P = 0.281) for Merri/Curdies, and 5.9%
(P,0.001) and 6.3% (P,0.001) for Central and pure Eastern
lineages, respectively (Table 2). No significant variation was
detected among sites or among individuals within sites in the MDB
(Table 2).
Nannoperca obscura Conservation Units Identified
PLOS ONE | www.plosone.org 4 December 2013 | Volume 8 | Issue 12 | e82953
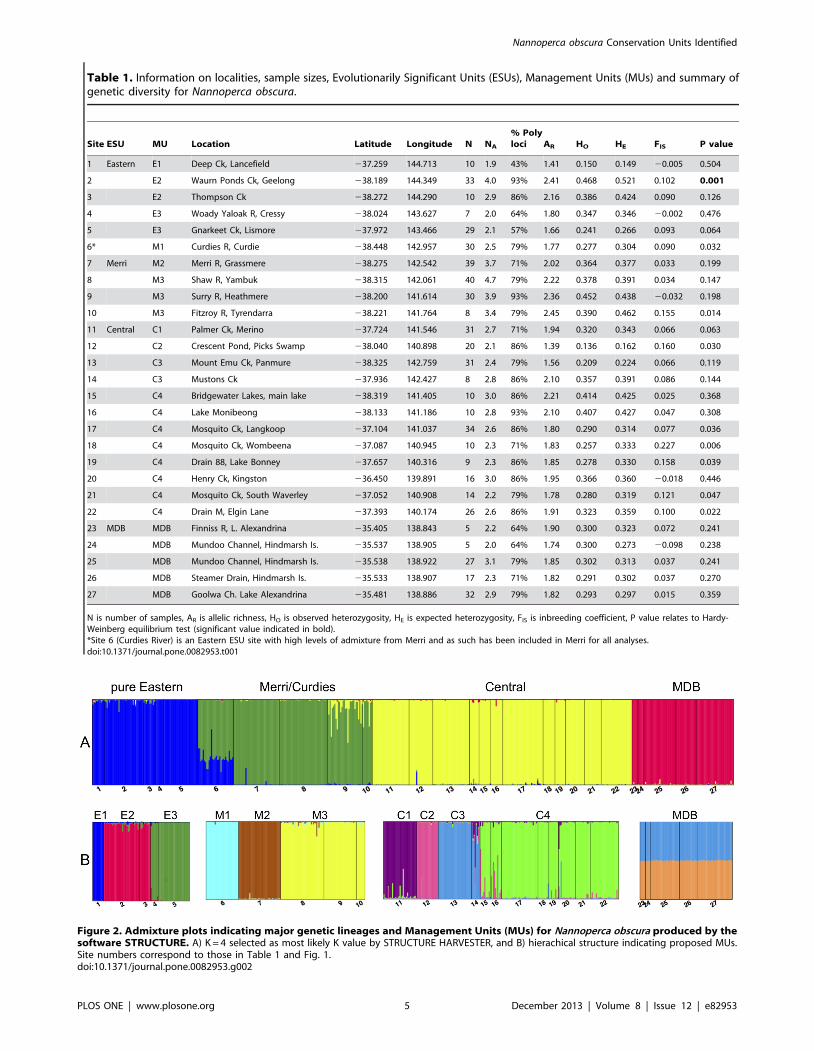
Table 1. Information on localities, sample sizes, Evolutionarily Significant Units (ESUs), Management Units (MUs) and summary ofgenetic diversity for Nannoperca obscura.
Site ESU MU Location Latitude Longitude N NA
% Polyloci AR HO HE FIS P value
1 Eastern E1 Deep Ck, Lancefield 237.259 144.713 10 1.9 43% 1.41 0.150 0.149 20.005 0.504
2 E2 Waurn Ponds Ck, Geelong 238.189 144.349 33 4.0 93% 2.41 0.468 0.521 0.102 0.001
3 E2 Thompson Ck 238.272 144.290 10 2.9 86% 2.16 0.386 0.424 0.090 0.126
4 E3 Woady Yaloak R, Cressy 238.024 143.627 7 2.0 64% 1.80 0.347 0.346 20.002 0.476
5 E3 Gnarkeet Ck, Lismore 237.972 143.466 29 2.1 57% 1.66 0.241 0.266 0.093 0.064
6* M1 Curdies R, Curdie 238.448 142.957 30 2.5 79% 1.77 0.277 0.304 0.090 0.032
7 Merri M2 Merri R, Grassmere 238.275 142.542 39 3.7 71% 2.02 0.364 0.377 0.033 0.199
8 M3 Shaw R, Yambuk 238.315 142.061 40 4.7 79% 2.22 0.378 0.391 0.034 0.147
9 M3 Surry R, Heathmere 238.200 141.614 30 3.9 93% 2.36 0.452 0.438 20.032 0.198
10 M3 Fitzroy R, Tyrendarra 238.221 141.764 8 3.4 79% 2.45 0.390 0.462 0.155 0.014
11 Central C1 Palmer Ck, Merino 237.724 141.546 31 2.7 71% 1.94 0.320 0.343 0.066 0.063
12 C2 Crescent Pond, Picks Swamp 238.040 140.898 20 2.1 86% 1.39 0.136 0.162 0.160 0.030
13 C3 Mount Emu Ck, Panmure 238.325 142.759 31 2.4 79% 1.56 0.209 0.224 0.066 0.119
14 C3 Mustons Ck 237.936 142.427 8 2.8 86% 2.10 0.357 0.391 0.086 0.144
15 C4 Bridgewater Lakes, main lake 238.319 141.405 10 3.0 86% 2.21 0.414 0.425 0.025 0.368
16 C4 Lake Monibeong 238.133 141.186 10 2.8 93% 2.10 0.407 0.427 0.047 0.308
17 C4 Mosquito Ck, Langkoop 237.104 141.037 34 2.6 86% 1.80 0.290 0.314 0.077 0.036
18 C4 Mosquito Ck, Wombeena 237.087 140.945 10 2.3 71% 1.83 0.257 0.333 0.227 0.006
19 C4 Drain 88, Lake Bonney 237.657 140.316 9 2.3 86% 1.85 0.278 0.330 0.158 0.039
20 C4 Henry Ck, Kingston 236.450 139.891 16 3.0 86% 1.95 0.366 0.360 20.018 0.446
21 C4 Mosquito Ck, South Waverley 237.052 140.908 14 2.2 79% 1.78 0.280 0.319 0.121 0.047
22 C4 Drain M, Elgin Lane 237.393 140.174 26 2.6 86% 1.91 0.323 0.359 0.100 0.022
23 MDB MDB Finniss R, L. Alexandrina 235.405 138.843 5 2.2 64% 1.90 0.300 0.323 0.072 0.241
24 MDB Mundoo Channel, Hindmarsh Is. 235.537 138.905 5 2.0 64% 1.74 0.300 0.273 20.098 0.238
25 MDB Mundoo Channel, Hindmarsh Is. 235.538 138.922 27 3.1 79% 1.85 0.302 0.313 0.037 0.241
26 MDB Steamer Drain, Hindmarsh Is. 235.533 138.907 17 2.3 71% 1.82 0.291 0.302 0.037 0.270
27 MDB Goolwa Ch. Lake Alexandrina 235.481 138.886 32 2.9 79% 1.82 0.293 0.297 0.015 0.359
N is number of samples, AR is allelic richness, HO is observed heterozygosity, HE is expected heterozygosity, FIS is inbreeding coefficient, P value relates to Hardy-Weinberg equilibrium test (significant value indicated in bold).*Site 6 (Curdies River) is an Eastern ESU site with high levels of admixture from Merri and as such has been included in Merri for all analyses.doi:10.1371/journal.pone.0082953.t001
Figure 2. Admixture plots indicating major genetic lineages and Management Units (MUs) for Nannoperca obscura produced by thesoftware STRUCTURE. A) K = 4 selected as most likely K value by STRUCTURE HARVESTER, and B) hierachical structure indicating proposed MUs.Site numbers correspond to those in Table 1 and Fig. 1.doi:10.1371/journal.pone.0082953.g002
Nannoperca obscura Conservation Units Identified
PLOS ONE | www.plosone.org 5 December 2013 | Volume 8 | Issue 12 | e82953

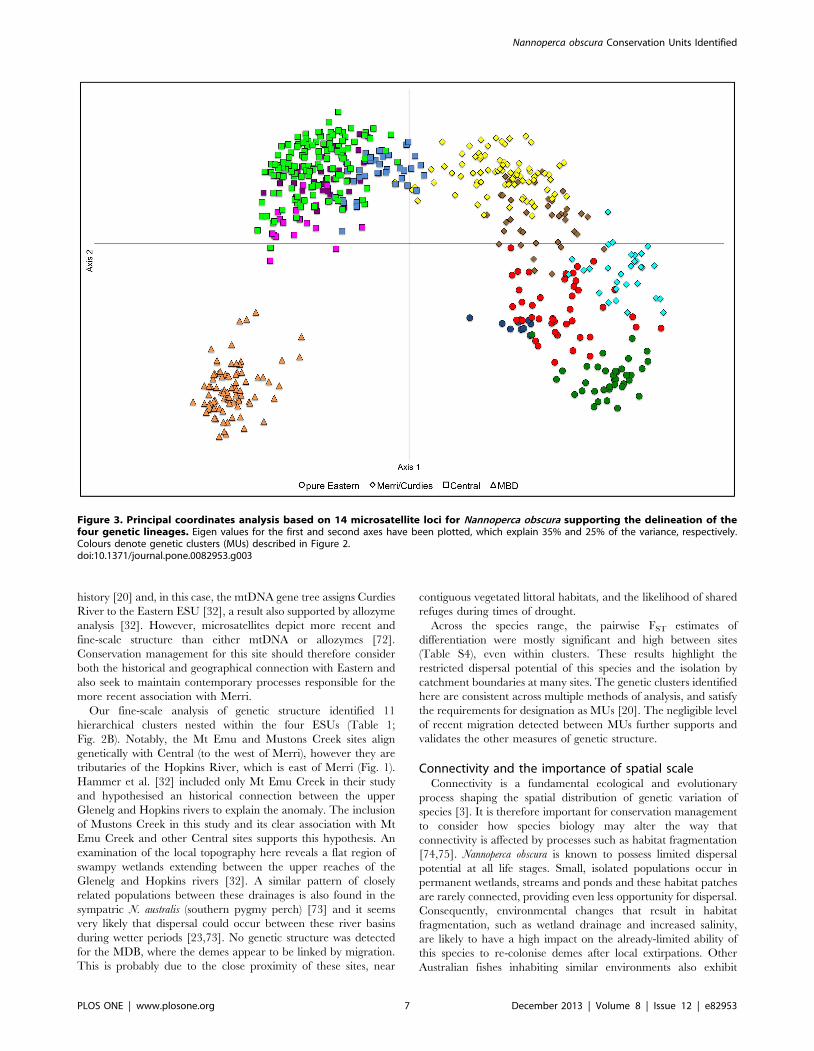
The PCA results were also generally concordant with the other
analyses of geographic population structure. The four primary
genetic lineages were well supported in the initial analysis of all
individuals (Fig. 3), while the genetic clusters identified within
primary lineages (Table 1; Fig. 2B) were mostly supported when
each was run separately (Fig. S1). Importantly, as also demon-
strated by all other analyses, the PCA plot for MBD provided no
evidence for population structure within this lineage (Fig. S1D).
Gene flowEstimates of recent gene flow in BayesAss demonstrate
extremely low exchange of migrants both among lineages (0.2–
0.7%) (Table S5) and between clusters within each primary genetic
lineage (0.2–2.1%) (Table S6). All pairwise estimates of m were
within the 95% credible interval and there was no evidence for
asymmetric gene flow between populations. These results validate
the delineation of genetically and demographically isolated clusters
within the four lineages, and are in line with expectations given the
high level of population structure indicated by the other analyses.
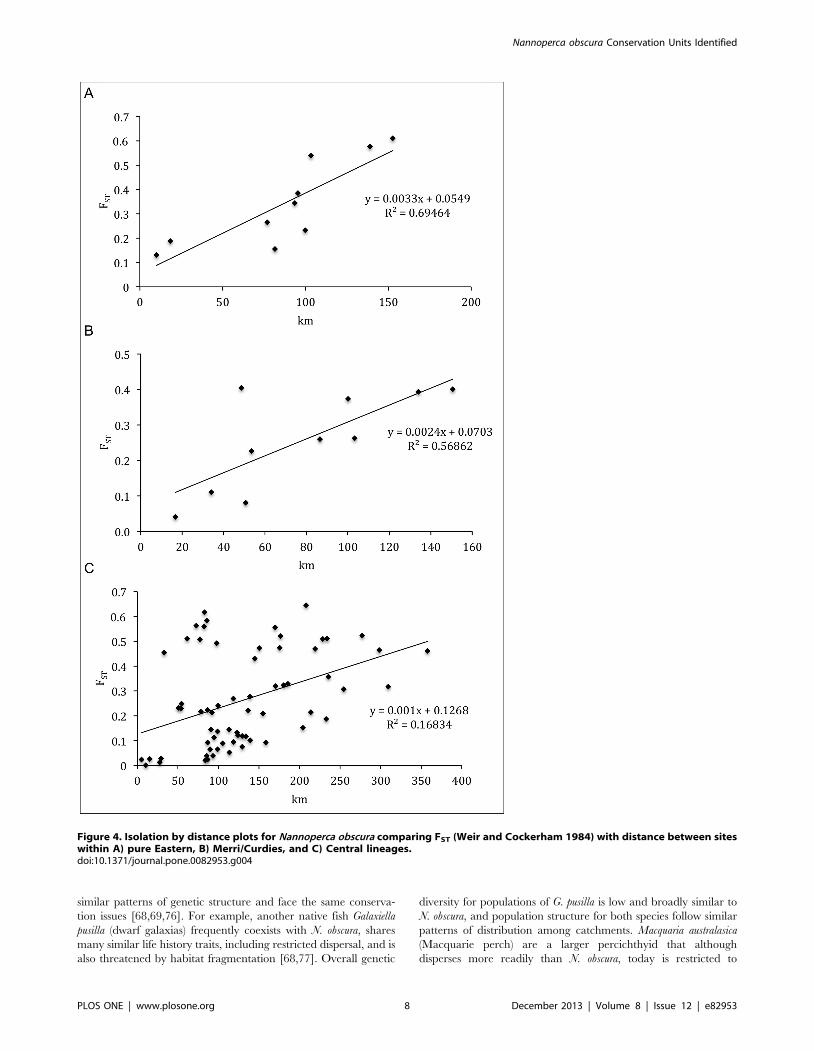
Spatial analysesPatterns of IBD and hierarchical population structure were
revealed at multiple scales for N. obscura. Mantel tests demonstrat-
ed a strong, significant association between population FST and
geographic distance (r values ranged between 0.411 and 0.833)
(Table 3), indicating the presence of IBD between sites within the
pure Eastern, Merri/Curdies, and Central lineages (Fig. 4). The
results of the partial Mantel tests were not significant for Merri/
Curdies (r = 0.43, P = 0.192) and Central (r = 0.18, P = 0.219) but
were significant for the pure Eastern lineage (r = 0.0, P = 0.005)
(Table 3). Although these tests suggest that hierarchical population
structure due to catchment divisions is not evident within two
lineages, they suffer from relatively low power due to the general
lack of multiple samples representing each catchment. Finally, the
strong and highly significant results of the Mantel test within the
C4 genetic cluster (r = 0.785, P = 0.001) demonstrate the pattern of
IBD also exists at a smaller scale for N. obscura (Table 3).
At the individual level, there was significant positive spatial
autocorrelation for the first distance class (0–60 km), which
intercepted the x-axes at 81 km, 84 km, and 115 km for the pure
Eastern, Merri/Curdies, and Central correlograms, respectively
(Fig. 5). This strongly indicates that on average, individuals from
each locality had a higher probability of being born locally,
providing support to the IBD signal demonstrated by the Mantel
tests. To determine the extent to which this pattern of IBD exists,
the autocorrelation coefficient r was also calculated for increasing
distance class sizes. The positive r values became non-significant at
150 km for both pure Eastern and Merri/Curdies lineages (Fig.
S2) and at 300 km for the putatively more connected Central
lineage (Fig. S3). Significant IBD is therefore confirmed within the
pure Eastern and Merri/Curdies lineages for sites up to 140 km
apart, beyond which positive spatial autocorrelation is no longer
detectable. The results are similar for the Central lineage, where
IBD can be detected for sites up to 290 km apart.
Discussion
We employed highly resolving microsatellite markers to assess
genetic variation and population structure across the distribution
of a threatened freshwater fish, N. obscura. Remarkably strong
population genetic structure that corresponds with catchment
boundaries was detected in a pattern that broadly validates the
four ESUs previously proposed for this species [32]. Spatial
analysis of genetic variation demonstrated that both significant
IBD and hierarchical population structure exist in N. obscura.
Several MUs were identified within each of the pure Eastern (3
MUs), Merri/Curdies (3 MUs), and Central (4 MUs) lineages
(Table 1; Fig. 2B). The MDB however appears to contain a single
genetic population which is consistent with the close geographic
proximity of sampled sites (Fig. 1). A combination of spatial
analytical methods was also implemented to determine the scale
and extent of IBD within each ESU. Here we describe the spatial
context of the strong subdivision detected, discuss evolutionary
processes that might have accounted for these patterns, and
consider conservation management implications for this threat-
ened freshwater fish species.
Genetic diversity and population structureOverall N. obscura exhibits very low genetic diversity [66], even
when compared to other Australian freshwater fishes (mean
HO = 0.32 compared to golden perch HO = 0.52 [67], dwarf
galaxias HO = 0.40 [68], southern pygmy perch HO = 0.57 [69],
and purple spotted gudgeon HO = 0.58 [70]. In addition to overall
low levels of diversity, substantial genetic structure was also
observed for N. obscura. Natural wet and dry cycles, as well as more
recent habitat fragmentation have likely resulted in repeated
extirpation and re-colonisation events in this species. This boom-
bust cycle is thought to account for the small effective population
sizes of other freshwater fishes in Australia [71], and accompanied
with habitat specificity may be responsible for the low level of
genetic diversity observed here. All results of population structure
analyses were in agreement with the delineation of the four ESUs
proposed by Hammer et al. [32]. Our study builds substantially on
the findings of Hammer et al. [32] by the use of highly resolving
microsatellite markers, a greater number of sites, and much larger
sample size (n = 156, 18 sites Hammer et al. [32], n = 541, 27 sites
this study). The high resolution data generated here provide
evidence for recent admixture between Merri and Eastern ESUs at
site 6 (Curdies River). Mitochondrial DNA reflects evolutionary
Table 2. Hierarchical analysis of molecular variance (AMOVA)based on FST for Nannoperca obscura.
Group Source of variation d. f.% ofvariance P value
All sites
Among lineages 3 34.9% ,0.001
Among sites within lineages 23 18.2% ,0.001
Among individuals within sites 514 2.6% ,0.001
pure Eastern
Among sites 4 29.7% ,0.001
Among individuals within sites 84 6.3% ,0.001
Merri/Curdies
Among sites 4 30.6% ,0.001
Among individuals within sites 142 0.8% 0.281
Central
Among sites 11 32.2% ,0.001
Among individuals within sites 207 5.9% ,0.001
MDB
Among sites 4 2.5% 0.131
Among individuals within sites 81 2.7% 0.200
Significant values indicated in bold.doi:10.1371/journal.pone.0082953.t002
Nannoperca obscura Conservation Units Identified
PLOS ONE | www.plosone.org 6 December 2013 | Volume 8 | Issue 12 | e82953
history [20] and, in this case, the mtDNA gene tree assigns Curdies
River to the Eastern ESU [32], a result also supported by allozyme
analysis [32]. However, microsatellites depict more recent and
fine-scale structure than either mtDNA or allozymes [72].
Conservation management for this site should therefore consider
both the historical and geographical connection with Eastern and
also seek to maintain contemporary processes responsible for the
more recent association with Merri.
Our fine-scale analysis of genetic structure identified 11
hierarchical clusters nested within the four ESUs (Table 1;
Fig. 2B). Notably, the Mt Emu and Mustons Creek sites align
genetically with Central (to the west of Merri), however they are
tributaries of the Hopkins River, which is east of Merri (Fig. 1).
Hammer et al. [32] included only Mt Emu Creek in their study
and hypothesised an historical connection between the upper
Glenelg and Hopkins rivers to explain the anomaly. The inclusion
of Mustons Creek in this study and its clear association with Mt
Emu Creek and other Central sites supports this hypothesis. An
examination of the local topography here reveals a flat region of
swampy wetlands extending between the upper reaches of the
Glenelg and Hopkins rivers [32]. A similar pattern of closely
related populations between these drainages is also found in the
sympatric N. australis (southern pygmy perch) [73] and it seems
very likely that dispersal could occur between these river basins
during wetter periods [23,73]. No genetic structure was detected
for the MDB, where the demes appear to be linked by migration.
This is probably due to the close proximity of these sites, near
contiguous vegetated littoral habitats, and the likelihood of shared
refuges during times of drought.
Across the species range, the pairwise FST estimates of
differentiation were mostly significant and high between sites
(Table S4), even within clusters. These results highlight the
restricted dispersal potential of this species and the isolation by
catchment boundaries at many sites. The genetic clusters identified
here are consistent across multiple methods of analysis, and satisfy
the requirements for designation as MUs [20]. The negligible level
of recent migration detected between MUs further supports and
validates the other measures of genetic structure.
Connectivity and the importance of spatial scaleConnectivity is a fundamental ecological and evolutionary
process shaping the spatial distribution of genetic variation of
species [3]. It is therefore important for conservation management
to consider how species biology may alter the way that
connectivity is affected by processes such as habitat fragmentation
[74,75]. Nannoperca obscura is known to possess limited dispersal
potential at all life stages. Small, isolated populations occur in
permanent wetlands, streams and ponds and these habitat patches
are rarely connected, providing even less opportunity for dispersal.
Consequently, environmental changes that result in habitat
fragmentation, such as wetland drainage and increased salinity,
are likely to have a high impact on the already-limited ability of
this species to re-colonise demes after local extirpations. Other
Australian fishes inhabiting similar environments also exhibit
Figure 3. Principal coordinates analysis based on 14 microsatellite loci for Nannoperca obscura supporting the delineation of thefour genetic lineages. Eigen values for the first and second axes have been plotted, which explain 35% and 25% of the variance, respectively.Colours denote genetic clusters (MUs) described in Figure 2.doi:10.1371/journal.pone.0082953.g003
Nannoperca obscura Conservation Units Identified
PLOS ONE | www.plosone.org 7 December 2013 | Volume 8 | Issue 12 | e82953
similar patterns of genetic structure and face the same conserva-
tion issues [68,69,76]. For example, another native fish Galaxiella
pusilla (dwarf galaxias) frequently coexists with N. obscura, shares
many similar life history traits, including restricted dispersal, and is
also threatened by habitat fragmentation [68,77]. Overall genetic
diversity for populations of G. pusilla is low and broadly similar to
N. obscura, and population structure for both species follow similar
patterns of distribution among catchments. Macquaria australasica
(Macquarie perch) are a larger percichthyid that although
disperses more readily than N. obscura, today is restricted to
Figure 4. Isolation by distance plots for Nannoperca obscura comparing FST (Weir and Cockerham 1984) with distance between siteswithin A) pure Eastern, B) Merri/Curdies, and C) Central lineages.doi:10.1371/journal.pone.0082953.g004
Nannoperca obscura Conservation Units Identified
PLOS ONE | www.plosone.org 8 December 2013 | Volume 8 | Issue 12 | e82953

isolated headwaters and shows reduced connectivity associated
with human-induced habitat fragmentation [13]. In contrast, the
large-bodied percichthyid Maccullochella peelii (Murray cod) inhabits
the main river channels and larger tributaries, tends to encounter
fewer natural barriers to dispersal and is therefore less affected by
habitat fragmentation [78].
Environmental and evolutionary processes affecting populations
at a local level may differ from those affecting the same species at a
regional level [16,17]. Spatial analyses revealed strong patterns of
IBD and population structure at multiple scales for N. obscura. At a
regional level there is very strong genetic structure with significant
divergence between ESUs (Fig. 2A). Within the Eastern ESU a
combination of both hierarchical structure (due to population
differences between catchments) and IBD exists, while significant
IBD was also detectable at a smaller spatial scale within MUs.
Spatial autocorrelation has been used to examine the scale and
extent of IBD in several studies [17–19]. By identifying the distance
at which samples can be considered genetically and demographi-
cally independent, and thus defining the range over which this
pattern persists, conservation measures can be designed to ensure
maximum genetic diversity is preserved [18,19]. Sampling regimes
for genetic monitoring or future ecological studies can also then be
designed more efficiently and with confidence that most genetic
diversity will be sampled [18]. In the case of N. obscura, genetically
similar patches are approximately 80 km in diameter for Eastern
and Merri and 115 km for Central. This is consistent with the
geographic extent of the MUs identified in this study and the
proposal that MUs are confined mostly to single catchments.
Evolutionary processesIdentifying the spatial patterns and scale of genetic variation can
help to ensure conservation management strategies capture the
overall diversity of a species [79]. To maintain species persistence
in the long term, it is also important to identify and conserve the
evolutionary processes responsible for generating genetic diversity
[22]. The complex patterns of genetic structure observed in this
study appear to operate at a range of spatial scales. Findings of
previous studies of Australian freshwater fishes [11,14,74,80] have
often reported a general pattern of genetic structure concordant
with the stream hierarchy model proposed by Meffe and
Vrijenhoek [81]. In this model, it is expected that genetic structure
will be distributed according to hierarchical drainage structure,
with gene flow primarily occurring within rather than among
catchments [81]. The strong correspondence between ESU and
catchment boundaries across the entire distribution of N. obscura
suggests that, at a regional scale, the stream hierarchy model is
broadly applicable for this species. The significant patterns of IBD
evident within three of the ESUs are also predicted under the
stream hierarchy model, further supporting this assessment [81].
At a smaller spatial scale however, hydrology has been subjected
to significant anthropogenic modification. For example, an
extensive network of flood mitigation drains have been constructed
throughout the Millicent Coast region [29]. This alteration to the
natural hydrology has drained wetlands, and reduced the
incidence of flooding by directing surface water to several new
coastal outlets [29,82]. The natural path of flood waters parallel to
the coast has therefore been disrupted and isolated coastal
populations are now less likely to be linked by floods [29]. As a
result, re-colonisation following local extirpation events is unlikely
to occur. In many ways the modified hydrological regime
described above simulates the drier climate and reduction in
frequency of flooding predicted for the wider southeast coastal
region under future climate change scenarios [83], which may
have implications for N. obscura conservation. Indeed, since
samples were collected for this study, several Central ESU
populations have come under threat or become extirpated
[32,34]. There is also more recent evidence of an increase in the
incidence of hybridisation with the co-distributed N. australis at
some locations [32] and this may be interpreted as a symptom of
populations under environmental stress [84,85]. For instance,
Heath et al. [86] showed that a combination of environmental
factors was associated with increased levels of hybridisation
between sympatric Oncorhynchus clarkii clarkii (coastal cutthroat
trout) and O. mykiss (rainbow trout). The increase in hybridisation
observed for N. obscura provides further evidence of the negative
effects of habitat fragmentation and degradation in this region.
Conservation implicationsThe findings presented here have several direct implications for
conservation management of N. obscura. Using a combination of
spatial and non-spatial, and both individual and population based
analyses, we identified 11 MUs confined mostly to individual
catchments, within which individuals are largely genetically and
demographically independent. Conservation of these units should
therefore be managed separately in order to maintain the genetic
integrity of populations. The MDB lineage appears to be one
highly connected population, indicating that family groups for the
breeding program can be formed using any combination of fish
from different MDB sites. Also, offspring from the breeding
program can therefore be released into any MDB site regardless of
the specific MDB site of their parents’ origin. This permits greater
flexibility in selecting the best habitat for release sites. However,
populations from other ESUs should not be mixed with the MDB
ESU as, due to their significant genetic divergence, this could lead
to a reduction in overall fitness because of issues related to local
adaptation, and perhaps to outbreeding depression [79,87].
In addition to providing information for management of the
conservation breeding program, there is potential for the same
principles to be used to directly manage fragmented wild
populations in other ESUs [79]. Translocation has recently
received more attention as a viable tool for managing fragmented
populations in situ [88,89]. This method has the advantage of
maintaining populations in a natural environment, thereby
avoiding the potential for adaptation to captivity [89]. The MUs
proposed here define the boundaries within which translocations
of N. obscura might occur should this be considered as a
conservation management option in the future. Translocations
Table 3. Results for Mantel and partial Mantel tests for majorgenetic lineages, and genetic cluster C4 for Nannopercaobscura.
Lineage Matrix A Matrix B Covariate Mantel’s r P value
pure Eastern Genetic Geographic – 0.833 0.014
Genetic Geographic Clusters 0.900 0.005
erri/Curdies Genetic Geographic – 0.754 0.018
Genetic Geographic Clusters 0.431 0.192
entral Genetic Geographic – 0.411 0.030
Genetic Geographic Clusters 0.181 0.219
Cluster
4 Genetic Geographic – 0.785 0.001
Genetic distance is FST, geographic distance is Euclidean distance between sites(km). Significant values indicated in bold.doi:10.1371/journal.pone.0082953.t003
Nannoperca obscura Conservation Units Identified
PLOS ONE | www.plosone.org 9 December 2013 | Volume 8 | Issue 12 | e82953

have however generally had a low success rate in the past [90]. For
instance, first and second generation hybrids of native and mixed
source translocated Cottus cognatus (slimy sculpin) exhibited reduced
fitness in a study of the consequences of freshwater fish
translocations in southeast Minnesota [91], highlighting the need
for further investigation into the genetic effects of translocations.
Habitat fragmentation has clearly had a major influence on the
decline of N. obscura across its range. Modifications to natural flow
regimes have reduced both the amount of available habitat and
population connectivity. Given the patchy distribution and low
abundance that characterises N. obscura, the low genetic diversity
and highly differentiated populations uncovered in this study are
not surprising. The limited opportunities for dispersal appear
dependent upon intermittent flooding that occasionally connects
isolated habitat patches. It is therefore critical for the conservation
of N. obscura that no further modifications to the natural hydrology
of this region are undertaken. Furthermore, it is vital that habitat is
protected wherever extant populations persist and, where possible,
connectivity between populations within MUs is restored to allow
natural evolutionary processes to continue.
Supporting Information
Table S1 Microsatellite markers (Carvalho et al. 2011) amplified
for Nannoperca obscura.
(DOCX)
Figure 5. Correlograms showing the autocorrelation coefficient r as a function of distance for A) pure Eastern, B) Merri/Curdies, andC) Central lineages. Distances are the maximum for each class, dashed lines are the 95% CI about the null hypothesis of a random distribution ofgenotypes, and error bars are 95% confidence of r. Intercept values are 81 km, 84 km, and 115 km for A, B, and C respectively.doi:10.1371/journal.pone.0082953.g005
Nannoperca obscura Conservation Units Identified
PLOS ONE | www.plosone.org 10 December 2013 | Volume 8 | Issue 12 | e82953

Table S2 Geneclass2% probability of individual population
assignment of Nannoperca obscura.
(DOCX)
Table S3 Pairwise population FST and RST for Nannoperca
obscura.
(DOCX)
Table S4 Pairwise population FST and RST for sites where
Nannoperca obscura samples were collected in multiple years.
(DOCX)
Table S5 Estimated migration rates (m) between Evolutionarily
Significant Units (ESUs) and 95% credible intervals (CI) calculated
with BayesAss.
(DOCX)
Table S6 Estimated migration rates (m) between Management
Units (MUs) and 95% credible intervals (CI) calculated with
BayesAss.
(DOCX)
Figure S1 Principal coordinates analysis based on 14microsatellite loci for Nannoperca obscura individualsfrom each genetic lineage. A) pure Eastern. Eigen values for
the first and second axes have been plotted, which explain 38%
and 23% of the variance, respectively. E1, E2 and E3 refer to
genetic clusters identified within this lineage; B) Merri/Curdies.
Eigen values for the first and second axes explain 40% and 26% of
the variance, respectively. M1, M2, and M3 refer to genetic
clusters identified within this lineage; C) Central. Eigen values for
the first and second axes explain 34% and 26% of the variance,
respectively. C1, C2, C3, and C4 refer to genetic clusters identified
within this lineage; D) Murray-Darling basin. Eigen values for the
first and second axes explain 24% and 22% of the variance,
respectively. No genetic structure was apparent within this ESU.
(DOCX)
Figure S2 Correlograms showing the autocorrelationcoefficient r as a function of increasing distance classesfor A) pure Eastern, and B) Merri/Curdies ESUs.Distances are the maximum for each class, grey bars indicate
95% CI about the null hypothesis of no genetic structure, and
error bars about r indicate 95% CI as determined by boot-
strapping.
(DOCX)
Figure S3 Correlogram showing the autocorrelationcoefficient r as a function of increasing distance classesfor Central ESU. Distances are the maximum for each class,
grey bars indicate 95% CI about the null hypothesis of no genetic
structure and error bars about r indicate 95% CI as determined by
bootstrapping.
(DOCX)
Acknowledgments
We thank the many people who helped with field work and other aspects
relative to obtaining specimens, especially M. Bachmann, N. Evengelou, C.
Kemp, G. Knowles, T. Raadik, T. Ristic, R. Remington, M. Roberts, J.
Rowntree, S. Slater, M. Tucker, S. Wedderburn and S. Westergaard. We
also thank M. Sasaki for laboratory assistance.
Author Contributions
Conceived and designed the experiments: LBB MA. Performed the
experiments: CJB. Analyzed the data: CJB LBB MA. Contributed
reagents/materials/analysis tools: LBB PJU MPH MA. Wrote the paper:
CJB LBB MA PJU.
References
1. Fischer J, Lindenmayer DB (2007) Landscape modification and habitat
fragmentation: a synthesis. Global Ecol Biogeogr 16: 265–280.
2. Lande R (1998) Anthropogenic, ecological and genetic factors in extinction and
conservation. Res Popul Ecol 40: 259–269.
3. Lowe WH, Allendorf FW (2010) What can genetics tell us about population
connectivity? Mol Ecol 19: 3038–3051.
4. Lande R (1988) Genetics and demography in biological conservation. Science
241: 1455–1460.
5. Frankham R (2005) Genetics and extinction. Biol Conserv 126: 131–140.
6. Hanski I (1998) Metapopulation dynamics. Nature 396: 41–49.
7. Segelbacher G, Cushman S, Epperson B, Fortin M-J, Francois O, et al. (2010)
Applications of landscape genetics in conservation biology: concepts and
challenges. Conserv Genet 11: 375–385.
8. Frankham R (2010) Where are we in conservation genetics and where do we
need to go? Conserv Genet 11: 661–663.
9. Fausch KD, Torgersen CE, Baxter CV, Li HW (2002) Landscapes to
riverscapes: bridging the gap between research and conservation of stream
fishes. Bioscience 52: 483–498.
10. Palmer MA, Reidy Liermann CA, Nilsson C, Florke M, Alcamo J, et al. (2008)
Climate change and the world’s river basins: anticipating management options.
Front Ecol Environ 6: 81–89.
11. Hughes JM, Schmidt DJ, Finn DS (2009) Genes in streams: using DNA to
understand the movement of freshwater fauna and their riverine habitat.
Bioscience 59: 573–583.
12. Cook BD, Kennard MJ, Real K, Pusey BJ, Hughes JM (2011) Landscape genetic
analysis of the tropical freshwater fish Mogurnda mogurnda (Eleotridae) in a
monsoonal river basin: importance of hydrographic factors and population
history. Freshwat Biol 56: 812–827.
13. Faulks LK, Gilligan DM, Beheregaray LB (2011) The role of anthropogenic vs.
natural in-stream structures in determining connectivity and genetic diversity in
an endangered freshwater fish, Macquarie perch (Macquaria australasica). Evol
Appl 4: 589–601.
14. Huey JA, Baker AM, Hughes JM (2006) Patterns of gene flow in two species of
eel-tailed catfish, Neosilurus hyrtlii and Porochilus argenteus (Siluriformes: Plotosidae),
in western Queensland’s dryland rivers. Biol J Linn Soc 87: 457–467.
15. Cooke GM, Chao NL, Beheregaray LB (2012) Natural selection in the water:
freshwater invasion and adaptation by water colour in the Amazonian pufferfish.
J Evol Biol 25: 1305–1320.
16. Anderson CD, Epperson BK, Fortin M-J, Holderegger R, James PMA, et al.
(2010) Considering spatial and temporal scale in landscape-genetic studies of
gene flow. Mol Ecol 19: 3565–3575.
17. Peakall R, Ruibal M, Lindenmayer DB (2003) Spatial autocorrelation analysis
offers new insights into gene flow in the Australian bush rat, Rattus fuscipes
Evolution 57: 1182–1195.
18. Diniz-Filho JAF, De Campos Telles MP (2002) Spatial autocorrelation analysis
and the identification of operational units for conservation in continuous
populations. Conserv Biol 16: 924–935.
19. Primmer CR, Veselov AJ, Zubchenko A, Poututkin A, Bakhmet I, et al. (2006)
Isolation by distance within a river system: genetic population structuring of
Atlantic salmon, Salmo salar, in tributaries of the Varzuga River in northwest
Russia. Mol Ecol 15: 653–666.
20. Moritz C (1994) Defining ‘Evolutionarily Significant Units’ for conservation.
Trends Ecol Evol 9: 373–375.
21. Crandall KA, Bininda-Emonds ORP, Mace GM, Wayne RK (2000)
Considering evolutionary processes in conservation biology. Trends Ecol Evol
15: 290–295.
22. Moritz C (2002) Strategies to protect biological diversity and the evolutionary
processes that sustain it. Syst Biol 51: 238–254.
23. Unmack PJ (2001) Biogeography of Australian freshwater fishes. J Biogeogr 28:
1053–1089.
24. Murray–Darling Basin Authority (2010) Guide to the proposed basin plan:
overview. Murray–Darling Basin Authority, Canberra.
25. Lintermans M (2013) Conservation and management. In: Humphries P, Walker
K, editors. Ecology of Australian freshwater fishes. Collingwood, VIC: CSIRO
Publishing. pp. 283–316.
26. Kingsford RT, Walker KF, Lester RE, Young WJ, Fairweather PG, et al. (2011)
A Ramsar wetland in crisis - the Coorong, Lower Lakes and Murray Mouth,
Australia. Mar Freshwat Res 62: 255–265.
27. Hammer M, Bice C, Hall A, Frears A, Watt A, et al. (2013) Freshwater fish
conservation in the face of critical water shortages in the southern Murray-
Darling Basin, Australia. Mar Freshwat Res 64: 807–821.
28. Stein JL, Stein JA, Nix HA (2002) Spatial analysis of anthropogenic river
disturbance at regional and continental scales: identifying the wild rivers of
Australia. Landscape Urban Plann 60: 1–25.
Nannoperca obscura Conservation Units Identified
PLOS ONE | www.plosone.org 11 December 2013 | Volume 8 | Issue 12 | e82953
29. Taffs KH (2001) The role of surface water drainage in environmental change: a
case example of the upper south east of South Australia; an historical review.
Aust Geogr Stud 39: 279–301.
30. Saddlier S, Koehn J, Hammer M (2013) Lets not forget the small fishes –
conservation of two threatned species of pygmy perch in south-eastern Australia.
Mar Freshwat Res 64: 874–886.
31. Kuiter RH, Humphries P, Arthington A (1996) Pygmy perches: Family
Nannopercidae. In: McDowall RM, editor. Freshwater Fishes of South-Eastern
Australia 2nd Edition. Chatswood, NSW: Reed Books.
32. Hammer M, Unmack P, Adams M, Johnson J, Walker K (2010) Phylogeo-
graphic structure in the threatened Yarra pygmy perch Nannoperca obscura
(Teleostei: Percichthyidae) has major implications for declining populations.
Conserv Genet 11: 213–223.
33. IUCN (2011) International union for conservation of nature red list of threatned
species. Available: http://www.iucnredlist.org/details/39301/0. Accessed 2013
Nov 11.
34. Hammer M, Wedderburn S, van Weenen J (2009) Action plan for South
Australian freshwater fishes. Native Fish Australia (SA) Inc. Adelaide.
35. Victorian Government Department of Sustainability and Environment (2013)
Advisory list of threatned vertebrate fauna in Victoria. Melbourne.
36. Saddlier S, Hammer M (2010) National recovery plan for the Yarra pygmy
perch Nannoperca obscura. Department of Sustainability and Environment,
Melbourne.
37. Wedderburn S, Hammer M, Bice C (2012) Shifts in small-bodied fish
assemblages resulting from drought-induced water level recession in terminating
lakes of the Murray-Darling Basin, Australia. Hydrobiologia 691: 35–46.
38. Sunnucks P, Hales DF (1996) Numerous transposed sequences of mitochondrial
cytochrome oxidase I–II in aphids of the genus Sitobion (Hemiptera: Aphididae).
Mol Biol Evol 13: 510–524.
39. Carvalho D, Rodriguez-Zarate C, Hammer M, Beheregaray L (2011)
Development of 21 microsatellite markers for the threatened Yarra pygmyperch (Nannoperca obscura) through 454 shot-gun pyrosequencing. Conserv Genet
Resour 3: 601–604.
40. Beheregaray LB, Moller LM, Schwartz TS, Chao NL, Caccone A (2004)
Microsatellite markers for the cardinal tetra Paracheirodon axelrodi, a commercially
important fish from central Amazonia. Mol Ecol Notes 4: 330–332.
41. Van Oosterhout C, Hutchinson WF, Wills DPM, Shipley P (2004) Micro-
checker: software for identifying and correcting genotyping errors in microsat-
ellite data. Mol Ecol Notes 4: 535–538.
42. Rousset F (2008) genepop’007: a complete re-implementation of the genepop
software for Windows and Linux. Mol Ecol Resour 8: 103–106.
43. Meirmans PG, Van Tienderen PH (2004) GenoType and GenoDive: two
programs for the analysis of genetic diversity of asexual organisms. Mol Ecol
Notes 4: 792–794.
44. Rice WR (1989) Analyzing tables of statistical tests. Evolution 43: 223–225.
45. Kalinowski ST (2005) hp-rare 1.0: a computer program for performing
rarefaction on measures of allelic richness. Mol Ecol Notes 5: 187–189.
46. Peakall R, Smouse P (2012) GenAlEx 6.5: Genetic analysis in Excel. Population
genetic software for teaching and research, an update. Bioinformatics 28: 2537–
2539.
47. Weir BS, Cockerham CC (1984) Estimating F-statistics for the analysis of
population structure. Evolution 38: 1358–1370.
48. Slatkin M (1995) A measure of population subdivision based on microsatellite
allele frequencies. Genetics 139: 457–462.
49. Excoffier L, Lischer HEL (2010) Arlequin suite ver 3.5: a new series of programs
to perform population genetics analyses under Linux and Windows. Mol Ecol
Resour 10: 564–567.
50. Hardy OJ, Charbonnel N, Freville H, Heuertz M (2003) Microsatellite allele
sizes: a simple test to assess their significance on genetic differentiation. Genetics
163: 1467–1482.
51. Hardy OJ, Vekemans X (2002) SPAGeDi: a versatile computer program to
analyse spatial genetic structure at the individual or population levels. Mol EcolNotes 2: 618–620.
52. Pritchard JK, Stephens M, Donnelly P (2000) Inference of population structure
using multilocus genotype data. Genetics 155: 945–959.
53. Evanno G, Regnaut S, Goudet J (2005) Detecting the number of clusters of
individuals using the software STRUCTURE: a simulation study. Mol Ecol 14:
2611–2620.
54. Gilbert KJ, Andrew RL, Bock DG, Franklin MT, Kane NC, et al. (2012)
Recommendations for utilizing and reporting population genetic analyses: the
reproducibility of genetic clustering using the program structure. Mol Ecol 21:
4925–4930.
55. Earl D, vonHoldt B (2012) STRUCTURE HARVESTER: a website and
program for visualizing STRUCTURE output and implementing the Evanno
method. Conserv Genet Resour 4: 359–361.
56. Jakobsson M, Rosenberg NA (2007) CLUMPP: a cluster matching and
permutation program for dealing with label switching and multimodality in
analysis of population structure. Bioinformatics 23: 1801–1806.
57. Rosenberg NA (2004) distruct: a program for the graphical display of population
structure. Mol Ecol Notes 4: 137–138.
58. Piry S, Alapetite A, Cornuet J-M, Paetkau D, Baudouin L, et al. (2004)
GENECLASS2: A software for genetic assignment and first-generation migrant
detection. J Hered 95: 536–539.
59. Rannala B, Mountain JL (1997) Detecting immigration by using multilocusgenotypes. Proceedings of the National Academy of Sciences 94: 9197–9201.
60. Smouse PE, Peakall R (1999) Spatial autocorrelation analysis of individual
multiallele and multilocus genetic structure. Heredity 82: 561–573.
61. Wilson GA, Rannala B (2003) Bayesian inference of recent migration rates using
multilocus genotypes. Genetics 163: 1177–1191.
62. Rambaut A, Drummond AJ (2009) Tracer v1.5, Available: http://beast.bio.ed.ac.uk/Tracer.Accessed 2013 Nov 11.
63. Meirmans PG (2012) The trouble with isolation by distance. Mol Ecol 21: 2839–2846.
64. Drummond CS, Hamilton MB (2007) Hierarchical components of genetic
variation at a species boundary: population structure in two sympatric varietiesof Lupinus microcarpus (Leguminosae). Mol Ecol 16: 753–769.
65. Legendre P (1993) Spatial autocorrelation: trouble or new paradigm? Ecology74: 1659–1673.
66. DeWoody JA, Avise JC (2000) Microsatellite variation in marine, freshwater and
anadromous fishes compared with other animals. J Fish Biol 56: 461–473.
67. Faulks LK, Gilligan DM, Beheregaray LB (2010) Islands of water in a sea of dry
land: hydrological regime predicts genetic diversity and dispersal in a widespreadfish from Australia’s arid zone, the golden perch (Macquaria ambigua). Mol Ecol
19: 4723–4737.
68. Coleman RA, Pettigrove V, Raadik TA, Hoffmann AA, Miller AD, et al. (2010)Microsatellite markers and mtDNA data indicate two distinct groups in dwarf
galaxias, Galaxiella pusilla (Mack) (Pisces: Galaxiidae), a threatened freshwater fishfrom south-eastern Australia. Conserv Genet 11: 1911–1928.
69. Cook BD, Bunn SE, Hughes JM (2007) Molecular genetic and stable isotope
signatures reveal complementary patterns of population connectivity in theregionally vulnerable southern pygmy perch (Nannoperca australis). Biol Conserv
138: 60–72.
70. Hughes JM, Real KM, Marshall JC, Schmidt DJ (2012) Extreme geneticstructure in a small-bodied freshwater fish, the purple spotted gudgeon, Mogurnda
adspersa (Eleotridae). PLoS ONE 7: e40546.
71. Huey JA, Baker AM, Hughes JM (2008) The effect of landscape processes upon
gene flow and genetic diversity in an Australian freshwater fish, Neosilurus hyrtlii.
Freshwat Biol 53: 1393–1408.
72. Sunnucks P (2000) Efficient genetic markers for population biology. Trends Ecol
Evol 15: 199–203.
73. Unmack PJ, Hammer MP, Adams M, Johnson JB, Dowling TE (2013) The role
of continental shelf width in determining freshwater phylogeographic patterns in
south-eastern Australian pygmy perches (Teleostei: Percichthyidae). Mol Ecol22: 1683–1699.
74. Hughes JM, Huey JA, Schmidt DJ (2013) Is realised connectivity amongpopulations of aquatic fauna predictable from potential connectivity? Freshwat
Biol 58: 951–966.
75. Luque S, Saura S, Fortin M-J (2012) Landscape connectivity analysis forconservation: insights from combining new methods with ecological and genetic
data. Landscape Ecol 27: 153–157.
76. Hughes J, Ponniah M, Hurwood D, Chenoweth S, Arthington A (1999) Strong
genetic structuring in a habitat specialist, the Oxleyan Pygmy Perch Nannoperca
oxleyana. Heredity 83: 5–14.
77. Unmack PJ, Bagley JC, Adams M, Hammer MP, Johnson JB (2012) Molecular
phylogeny and phylogeography of the Australian freshwater fish genus Galaxiella,with an emphasis on dwarf galaxias (G. pusilla). PLoS ONE 7: e38433.
78. Rourke ML, McPartlan HC, Ingram BA, Taylor AC (2010) Biogeography and
life history ameliorate the potentially negative genetic effects of stocking onMurray cod (Maccullochella peelii peelii). Mar Freshwat Res 61: 918–927.
79. Frankham R (2010) Challenges and opportunities of genetic approaches to
biological conservation. Biol Conserv 143: 1919–1927.
80. McGlashan DJ, Hughes JM (2002) Extensive genetic divergence among
populations of the Australian freshwater fish, Pseudomugil signifer (Pseudomugi-lidae), at different hierarchical scales. Mar Freshwat Res 53: 897–907.
81. Meffe GK, Vrijenhoek RC (1988) Conservation genetics in the management of
desert fishes. Conserv Biol 2: 157–169.
82. Wear RJ, Eaton A, Tanner JE, Murray-Jones S (2006) The impact of drain
discharges on seagrass beds in the south east of South Australia. Final reportprepared for the south east natural resource consultative committee and the
south east catchment water management board. Adelaide: South Australian
Research and Development Institute (Aquatic sciences) and the Department ofEnvironment and Heritage, Coast Protection branch.
83. IPCC (2001) Climate change 2001: working group I: the scientific basis.Contribution of working group I to the third assessment report of the
intergovernmental panel on climate change. Eds J. T. Houghton, Y. Ding, D.
J. Griggs, M. Noguer, P. J. van der Linden, X. Dai, K. Maskell and C. A.Johnson. Cambridge University Press. Cambridge.
84. Marie AD, Bernatchez L, Garant D (2012) Environmental factors correlate withhybridization in stocked brook charr (Salvelinus fontinalis). Can J Fish Aquat Sci
69: 884–893.
85. Seehausen O, van Alphen JJM, Witte F (1997) Cichlid fish diversity threatenedby eutrophication that curbs sexual selection. Science 277: 1808–1811.
86. Heath D, Bettles CM, Roff D (2010) Environmental factors associated withreproductive barrier breakdown in sympatric trout populations on Vancouver
Island. Evol Appl 3: 77–90.
87. Allendorf FW, Hohenlohe PA, Luikart G (2010) Genomics and the future ofconservation genetics. Nat Rev Genet 11: 697–709.
Nannoperca obscura Conservation Units Identified
PLOS ONE | www.plosone.org 12 December 2013 | Volume 8 | Issue 12 | e82953

88. Groce MC, Bailey LL, Fausch KD (2012) Evaluating the success of Arkansas
darter translocations in Colorado: an occupancy sampling approach. Trans AmFish Soc 141: 825–840.
89. Weeks AR, Sgro CM, Young AG, Frankham R, Mitchell NJ, et al. (2011)
Assessing the benefits and risks of translocations in changing environments: agenetic perspective. Evol Appl 4: 709–725.
90. Fischer J, Lindenmayer DB (2000) An assessment of the published results of
animal relocations. Biol Conserv 96: 1–11.
91. Huff DD, Miller LM, Chizinski CJ, Vondracek B (2011) Mixed-source
reintroductions lead to outbreeding depression in second-generation descendents
of a native North American fish. Mol Ecol 20: 4246–4258.
Nannoperca obscura Conservation Units Identified
PLOS ONE | www.plosone.org 13 December 2013 | Volume 8 | Issue 12 | e82953