Assessing accumulation and biliary excretion of naphthenic acids in yellow perch exposed to oil...
10
This article appeared in a journal published by Elsevier. The attached copy is furnished to the author for internal non-commercial research and education use, including for instruction at the authors institution and sharing with colleagues. Other uses, including reproduction and distribution, or selling or licensing copies, or posting to personal, institutional or third party websites are prohibited. In most cases authors are permitted to post their version of the article (e.g. in Word or Tex form) to their personal website or institutional repository. Authors requiring further information regarding Elsevier’s archiving and manuscript policies are encouraged to visit: http://www.elsevier.com/authorsrights
Transcript of Assessing accumulation and biliary excretion of naphthenic acids in yellow perch exposed to oil...
This article appeared in a journal published by Elsevier. The attachedcopy is furnished to the author for internal non-commercial researchand education use, including for instruction at the authors institution
and sharing with colleagues.
Other uses, including reproduction and distribution, or selling orlicensing copies, or posting to personal, institutional or third party
websites are prohibited.
In most cases authors are permitted to post their version of thearticle (e.g. in Word or Tex form) to their personal website orinstitutional repository. Authors requiring further information
regarding Elsevier’s archiving and manuscript policies areencouraged to visit:
http://www.elsevier.com/authorsrights
Author's personal copy
Assessing accumulation and biliary excretion of naphthenicacids in yellow perch exposed to oil sands-affected waters
Michael R. van den Heuvel a,⇑, Natacha S. Hogan d, Gillian Z. MacDonald a, Fabrice Berrue b, Rozlyn F. Young c,Collin J. Arens a, Russell G. Kerr b, Phillip M. Fedorak c
a Canadian Rivers Institute, Department of Biology, University of Prince Edward Island, Canadab Department of Chemistry, University of Prince Edward Island, Canadac Department of Biological Sciences, University of Alberta, Canadad Toxicology Centre, University of Saskatchewan, Saskatoon, Canada
h i g h l i g h t s
� Naphthenic acids did not accumulate in muscle tissue of yellow perch exposed to oil sands-affected waters.� Naphthenic acids were detected in bile of yellow perch exposed to waterborne naphthenic acids using GC–MS and LC–HRMS.� Naphthenic acids measured by GC–MS was correlated with bile fluorescence at phenanthrene wavelengths.� LC–HRMS was shown to be the most sensitive, selective promising technique for biliary naphthenic acids.
a r t i c l e i n f o
Article history:Received 12 June 2013Received in revised form 5 October 2013Accepted 7 October 2013Available online 30 October 2013
Keywords:Oil sandsFishNaphthenic acidsAccumulationExcretionBile metabolite
a b s t r a c t
Naphthenic acids are known to be the most prevalent group of organic compounds in oil sands tailings-associated waters. Yellow perch (Perca flavescens) were exposed for four months to oil sands-influencedwaters in two experimental systems located on an oil sands lease 30 km north of Fort McMurray Alberta:the Demonstration Pond, containing oil sands tailings capped with natural surface water, and the SouthBison Pond, integrating lean oil sands. Yellow perch were also sampled from three lakes: Mildred Lakethat receives water from the Athabasca River, Sucker Lake, at the edge of oil sands extraction activity,and Kimowin Lake, a distant reference site. Naphthenic acids were measured in perch muscle tissue usinggas chromatography–mass spectrometry (GC–MS). Bile metabolites were measured by GC–MS tech-niques and by high performance liquid chromatography (HPLC) with fluorescence detection at phenan-threne wavelengths. A method was developed using liquid chromatography–high resolution massspectrometry (LC–HRMS) to evaluate naphthenic acids in bile. Tissue analysis did not show a patternof naphthenic acids accumulation in muscle tissue consistent with known concentrations in exposedwaters. Bile fluorescence and LC–HRMS methods were capable of statistically distinguishing samplesoriginating from oil sands-influenced waters versus reference lakes. Although the GC–MS and HPLC fluo-rescence methods were correlated, there were no significant correlations of these methods and the LC–HRMS method. In yellow perch, naphthenic acids from oil sands sources do not concentrate in tissue at ameasurable amount and are excreted through a biliary route. LC–HRMS was shown to be a highly sensi-tive, selective and promising technique as an indicator of exposure of biota to oil sands-derived naph-thenic acids.
� 2013 Elsevier Ltd. All rights reserved.
1. Introduction
The oil sands of northern Alberta, Canada have an immenseenvironmental footprint with currently over 600 km2 of disturbedboreal forest. Materials chemically influenced by the oil sands,
including close to a billion m3 of tailings, must be incorporated intothe reclaimed landscape (Royal Society of Canada, 2010). The mostprevalent organic contaminant associated with the oil sands arenaphthenic acids. Naphthenic acids are relatively water solubleand remain in the aqueous phase during the caustic hot waterextraction of oil sands. Naphthenic acids are thought to be respon-sible for the acute lethality of fresh tailings water that quickly dis-appears as the material is aged (MacKinnon and Boerger, 1986).
Naphthenic acids are a complex family of saturated, cyclic andacyclic carboxylic acids that are native to most sources of
0045-6535/$ - see front matter � 2013 Elsevier Ltd. All rights reserved.http://dx.doi.org/10.1016/j.chemosphere.2013.10.021
⇑ Corresponding author. Address: Canadian Rivers Institute, Department ofBiology, University of Prince Edward, Island, 550 University Avenue, Charlottetown,PE C1A 4P3, Canada. Tel.: +1 902 566 6072; fax: +1 902 566 0740.
E-mail address: [email protected] (M.R. van den Heuvel).
Chemosphere 95 (2014) 619–627
Contents lists available at ScienceDirect
Chemosphere
journal homepage: www.elsevier .com/locate /chemosphere
Author's personal copy
petroleum (Seifert et al., 1969). Naphthenic acids are weak acidswith a pKa of approximately 5–6 (Havre, 2002). Chemical analysishas determined that only approximately half of the acid extract-able material from oil sands fits the classical chemical formulafor naphthenic acids (Grewer et al., 2010). Fluorescence spectros-copy of naphthenic acids extracted from oil sands showed that thismaterial contains unsaturated or aromatic compounds. This sug-gests that chromophoric compounds may serve as surrogates forthe analysis of oil sands associated exposure (Mohamed et al.,2008, Kavanagh et al., 2009). Naphthenic acids have also been ob-served to biodegrade in the environment. In particular, the satu-rated groups of naphthenic acids are most easily degraded,whereas the more cyclic/unsaturated forms are quite recalcitrantto degradation (Han et al., 2009).
Our understanding of the environmental fate of naphthenicacids is currently limited due to the complexity of the mixture.In laboratory exposures to commercial naphthenic acids and oilsands process affected waters, fingerling trout were all observedto have detectable tissue levels of naphthenic acids (Young et al.,2007). Subsequent experiments estimated the bioconcentrationfactor of commercial naphthenic acids to be approximately twoand naphthenic acids depurated quickly when fish were trans-ferred to clean water for 1 d (Young et al., 2008). The rapid excre-tion of naphthenic acids suggests that bile concentrations mayserve as a measure of exposure to these compounds.
The analysis of biliary metabolites is a frequently used tech-nique to quantify metabolized organic compounds that are ex-creted via biliary routes. Resin acids associated with pulp andpaper effluent exposure are carboxylic acids that are similar tonaphthenic acids in molecular weight and pKa. Bile resin acids havebeen frequently utilized as a measure of exposure (Leppanen andOikari, 1999; van den Heuvel and Ellis, 2002). Bile analysis for fluo-rescent metabolites has also frequently been used to detect expo-sure to polycyclic aromatic hydrocarbons and petroleumhydrocarbon contamination (Aas et al., 2000). Fishes exposed towaters influenced by oil sands and oil sands tailings have also beenfound to contain elevated levels of fluorescent bile metabolites(van den Heuvel et al., 1999a).
The purpose of this study was to determine if naphthenic acidswere accumulated in tissue and/or excreted by a biliary route inyellow perch (Perca flavescens) exposed to oil sands-affectedwaters from process-affected and unextracted bitumen sources.Yellow perch were allowed to range freely for four months inexperimental ponds that contained varying levels of naphthenicacids. Perch muscle and bile was then collected from fish in theexperimental exposure ponds and from three local lakes both on,and removed from the oil sands deposits. Naphthenic acids weremeasured in perch muscle tissue and bile using gas chromatogra-phy–mass spectrometry (GC–MS) methods. In order to determineif fluorescent metabolites in fish bile was related to naphthenicacids, high performance liquid chromatography (HPLC) fluores-cence analysis was carried out and compared to measured naph-thenic acids. A liquid chromatography–high resolution massspectrometry (LC–HRMS) analysis method was subsequentlydeveloped as a more selective method of examining specific naph-thenic acid ions in the bile of exposed fishes.
2. Materials and methods
2.1. Site descriptions
The Demonstration Pond, constructed in 1993, is a 4 ha pondcontaining, a total of 70 000 m3 of mature oil sands fine tailingscapped with 70 000 m3 of natural surface water. The South BisonPond, was formed in 1987 as a drainage basin in an area
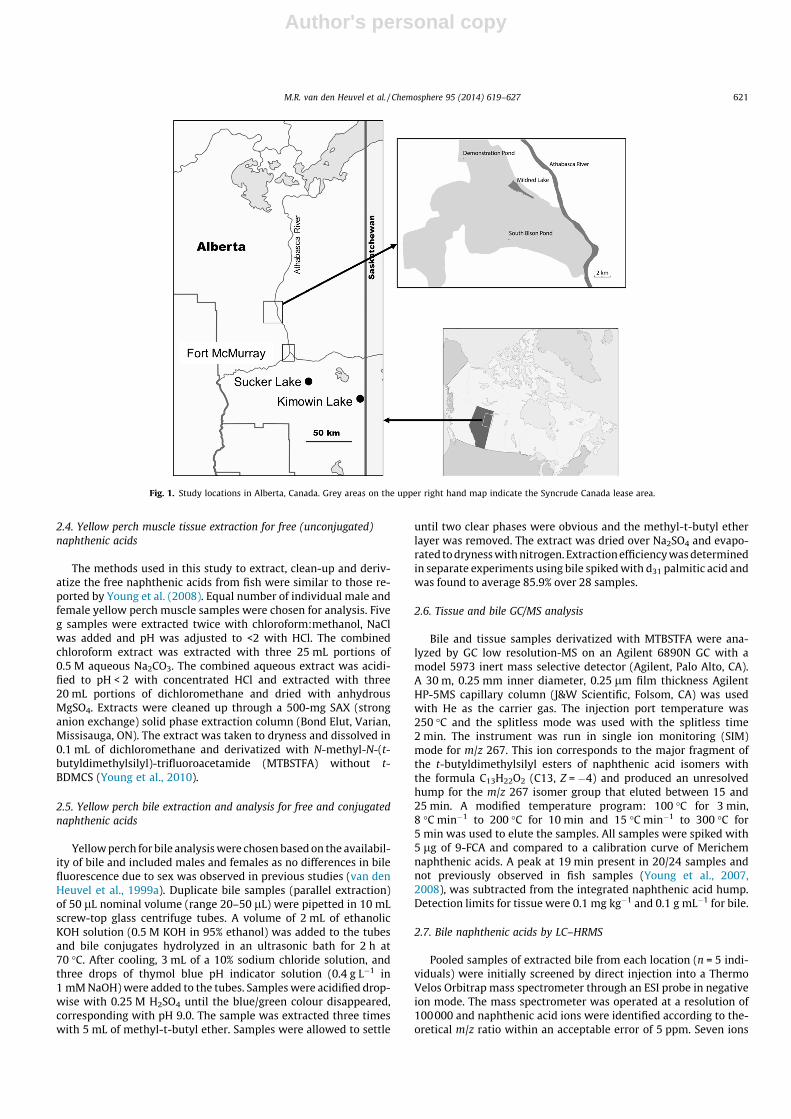
designated to be reclaimed as bison pasture on the south portionof the oil sands lease. The basin and the area surrounding thepond, received overburden and materials deemed not suitablefor extraction (lean oil sands, <7% bitumen). Surface capping witha mixture of soil and peat and planting of pasture on the area sur-rounding the South Bison Pond was completed in 1996. Thesource of the experimental yellow perch was Mildred Lake, lo-cated on the Syncrude Canada Ltd. mining lease and present priorto the initiation of mining. Beginning in 1975, Mildred Lake wasmodified from its natural state and currently serves as a reservoirfor extraction plant water that is pumped into Mildred Lake fromthe Athabasca River. To provide a comparison with natural lakes,the perch populations of two reference lakes, Kimowin Lake andSucker Lake were also evaluated (Fig. 1). Full site locations,descriptions and detailed water chemistry data for the systemsexamined was published in detail elsewhere (van den Heuvelet al., 2012).
2.2. Yellow perch exposure and sampling
Stocking of yellow perch into the experimental ponds was pre-viously described (van den Heuvel et al., 1999b, 2012). In May2009, 300 yellow perch were captured in Mildred Lake in mid-May using a combination of boat electroshocking and hoop nets.Yellow perch were sacrificed September 15–23 in 2009 as previ-ously described (van den Heuvel et al., 2012). For the purposes ofnaphthenic acid analysis, a skinless, boneless dorsal muscle fillet(between 3 and 20 g depending on fish size) was placed in aWhirl-Pak� bag and frozen at �20 �C. The gall bladder was re-moved intact, placed in a 2.0 mL cryovial, immediately frozen in li-quid nitrogen, and later stored at �20 �C.
2.3. Naphthenic acid analysis in water
The oil sands industry standard for quantifying naphthenicacids is a FTIR spectroscopy method developed by Syncrude Can-ada Ltd. (Jivraj et al., 1995). This method measures all carboxylicacids, including those that deviate from the classical naphthenicacid formula CnH2n+zO2. The FTIR method detection limit is0.5 mg L�1 as total naphthenic acids. Analysis of the relative abun-dance of classical structure naphthenic acids in the waters of theDemonstration and South Bison Ponds was conducted by C-18extraction followed by high resolution mass spectrometry on a sin-gle water sample. A 4 L grab sample was acidified to pH 2.0 usingH2SO4 (Sigma, Mississauga, Canada) and methanol was added toeach sample at a concentration of 5%. Cartridges were eluted with10 mL of methanol and transferred to 1:1 10 mM ammoniumhydroxide:acetonitrile. The sample was infused into an OrbitrapVelos mass spectrometer at a rate of 2.5 lL min�1. The mass spec-trometer was equipped with an electrospray ionization (ESI)source operated in negative mode. Analyses were recorded withthe highest mass resolution mode (100000) and the observed ions[M–H]� were compared with the theoretical evaluated against thepredicted molecular weights of naphthenic acids according to theformula CnH2n+ZO2. A comparison of relative quantities of naph-thenic acids was conducted by comparing the relative responsefactor of naphthenic acid ion intensity to the ion intensity of aninternal standard, d31 palmitic acid. Eleven ions were used for anal-ysis with molecular weights corresponding to the most predomi-nant naphthenic acid structures: C11H15O2, C11H19O2, C12H19O2,C13H19O2, C13H21O2, C14H21O2, C14H23O2, C15H23O2, C15H25O2,C16H25O2, C16H27O2. The ratio of the average relative response fac-tors was compared between sites to get an average ratio of concen-tration between the waters evaluated.
620 M.R. van den Heuvel et al. / Chemosphere 95 (2014) 619–627
Author's personal copy
2.4. Yellow perch muscle tissue extraction for free (unconjugated)naphthenic acids
The methods used in this study to extract, clean-up and deriv-atize the free naphthenic acids from fish were similar to those re-ported by Young et al. (2008). Equal number of individual male andfemale yellow perch muscle samples were chosen for analysis. Fiveg samples were extracted twice with chloroform:methanol, NaClwas added and pH was adjusted to <2 with HCl. The combinedchloroform extract was extracted with three 25 mL portions of0.5 M aqueous Na2CO3. The combined aqueous extract was acidi-fied to pH < 2 with concentrated HCl and extracted with three20 mL portions of dichloromethane and dried with anhydrousMgSO4. Extracts were cleaned up through a 500-mg SAX (stronganion exchange) solid phase extraction column (Bond Elut, Varian,Missisauga, ON). The extract was taken to dryness and dissolved in0.1 mL of dichloromethane and derivatized with N-methyl-N-(t-butyldimethylsilyl)-trifluoroacetamide (MTBSTFA) without t-BDMCS (Young et al., 2010).
2.5. Yellow perch bile extraction and analysis for free and conjugatednaphthenic acids
Yellow perch for bile analysis were chosen based on the availabil-ity of bile and included males and females as no differences in bilefluorescence due to sex was observed in previous studies (van denHeuvel et al., 1999a). Duplicate bile samples (parallel extraction)of 50 lL nominal volume (range 20–50 lL) were pipetted in 10 mLscrew-top glass centrifuge tubes. A volume of 2 mL of ethanolicKOH solution (0.5 M KOH in 95% ethanol) was added to the tubesand bile conjugates hydrolyzed in an ultrasonic bath for 2 h at70 �C. After cooling, 3 mL of a 10% sodium chloride solution, andthree drops of thymol blue pH indicator solution (0.4 g L�1 in1 mM NaOH) were added to the tubes. Samples were acidified drop-wise with 0.25 M H2SO4 until the blue/green colour disappeared,corresponding with pH 9.0. The sample was extracted three timeswith 5 mL of methyl-t-butyl ether. Samples were allowed to settle
until two clear phases were obvious and the methyl-t-butyl etherlayer was removed. The extract was dried over Na2SO4 and evapo-rated to dryness with nitrogen. Extraction efficiency was determinedin separate experiments using bile spiked with d31 palmitic acid andwas found to average 85.9% over 28 samples.
2.6. Tissue and bile GC/MS analysis
Bile and tissue samples derivatized with MTBSTFA were ana-lyzed by GC low resolution-MS on an Agilent 6890N GC with amodel 5973 inert mass selective detector (Agilent, Palo Alto, CA).A 30 m, 0.25 mm inner diameter, 0.25 lm film thickness AgilentHP-5MS capillary column (J&W Scientific, Folsom, CA) was usedwith He as the carrier gas. The injection port temperature was250 �C and the splitless mode was used with the splitless time2 min. The instrument was run in single ion monitoring (SIM)mode for m/z 267. This ion corresponds to the major fragment ofthe t-butyldimethylsilyl esters of naphthenic acid isomers withthe formula C13H22O2 (C13, Z = �4) and produced an unresolvedhump for the m/z 267 isomer group that eluted between 15 and25 min. A modified temperature program: 100 �C for 3 min,8 �C min�1 to 200 �C for 10 min and 15 �C min�1 to 300 �C for5 min was used to elute the samples. All samples were spiked with5 lg of 9-FCA and compared to a calibration curve of Merichemnaphthenic acids. A peak at 19 min present in 20/24 samples andnot previously observed in fish samples (Young et al., 2007,2008), was subtracted from the integrated naphthenic acid hump.Detection limits for tissue were 0.1 mg kg�1 and 0.1 g mL�1 for bile.
2.7. Bile naphthenic acids by LC–HRMS
Pooled samples of extracted bile from each location (n = 5 indi-viduals) were initially screened by direct injection into a ThermoVelos Orbitrap mass spectrometer through an ESI probe in negativeion mode. The mass spectrometer was operated at a resolution of100000 and naphthenic acid ions were identified according to the-oretical m/z ratio within an acceptable error of 5 ppm. Seven ions
Fig. 1. Study locations in Alberta, Canada. Grey areas on the upper right hand map indicate the Syncrude Canada lease area.
M.R. van den Heuvel et al. / Chemosphere 95 (2014) 619–627 621
Author's personal copy
were chosen corresponding to C13 Z = �4 (m/z 209.1536), C13Z = �2 (m/z 211.1693), C15 Z = �8 (m/z 233.1536), C15 Z = �6(m/z 235.1693), C15 Z = �4 (m/z 237.1849), C15 Z = �2 (m/z239.2006), C17 Z = �8 (m/z 261.1849). An average of the resultsof all seven ions were used to quantify total naphthenic acidsagainst an extracted and purified naphthenic acid preparation(MacDonald et al., 2013). Briefly, the purification followed themethod of Frank et al. (2006) involving the acid precipitation ofsurface water from a small 17-year-old tailings holding pond. Hu-mic acids were removed using DEAE cellulose, neutral compoundsby solvent extraction of a basic aqueous solution, followed by acidprecipitation, distilled water washing, and freeze drying.
A Thermo Scientific Acella liquid chromatograph with a ThermoVelos Orbitrap mass spectrometer using an electrospray ionizationinterface was used to separate naphthenic acids for quantification.Samples were separated on an Agilent Zorbax extend C-18 column(2.1 � 100 mm, 3.5 lm particle size) using a solvent profile start-ing with 50% water (0.1% formic acid) and 50% methanol (0.1% for-mic acid) held for the first minute and increasing in a lineargradient to 100% methanol/0.1 M formic acid in 5 min and heldfor an additional 3 min. The mass range for the ion detection wasset up from m/z 110–400 amu with a 30000 mass resolution.Detection limits varied for individual ions, but the average limitof detection was determined to be 0.1 lg mL�1.
2.8. Bile fluorescence analysis
Extracted bile samples were diluted by a factor of 100 in dis-tilled water then filtered using 13 mm polypropylene syringe fil-ters (0.45 lm pore size; Pall, Ville St. Laurent, Canada) into glassautosampler vials. HPLC-fluorescence analysis was conducted witha Varian Prostar model 240 HPLC pump, a model 410 autosampler,and a model 363 fluorescence detector using a 150 � 4.6 mm Var-ian Microsob-MV C-18 column. Flow rate was 1 mL min�1 at a35 �C column temperature. Solvent profile was 5% acetonitrile(Caledon Laboratories, Georgetown, Canada) and 95% HPLC gradewater (Caledon) to 98% acetonitrile and 2% water over 25 minand held for 5 min. Excitation and emission wavelengths usedwere that of phenanthrene: 256 nm and 380 nm, respectively.The phenanthrene equivalent concentration was derived by sum-ming the area of all metabolite peaks that eluted between 3 and15 min.
2.9. Statistics
Bray–Curtis similarity indices for the untransformed relativeabundance of 90 naphthenic acid ions were calculated in PRIMERv. 6.1. Parametric data were tested for assumptions of normalityusing probability plots, and homogeneity of variance using Le-vene’s and Brown–Forsythe tests. Data were logarithmically trans-formed and re-tested to ensure data met assumptions. Bilenaphthenic acid and fluorescence concentrations were evaluatedby ANOVA followed by multiple comparisons using Tukey’s test.Comparisons of bile analysis techniques were evaluated usingSpearman correlations. All parametric analyses were conductedin STATISTICA v. 10 using an experiment-wise error of alpha = 0.05.
3. Results
3.1. Water chemistry
The total naphthenic acids in the five experimental sites wereestimated using the FTIR method from grab samples taken be-tween 2008 and 2010. The mean (SEM, n individual water samples)concentration of naphthenic acids was 13 mg L�1 (0.4,8) for
Demonstration Pond, 4.6 mg L�1 (0.4,5) for South Bison Pond,1.0 mg L�1 (0.2,7) for Mildred Lake, 1.7 mg L�1 (0.3,3) for SuckerLake, and <1 mg L�1 (0,1) for Kimowin Lake. Naphthenic acid pro-files from Demonstration Pond, South Bison Pond, and MildredLake were subsequently evaluated using direct infusion HRMS.The relative ratio of the concentrations was 12.1:1 DemonstrationPond:Mildred Lake:, and 22.6:1 Demonstration Pond:South BisonPond.
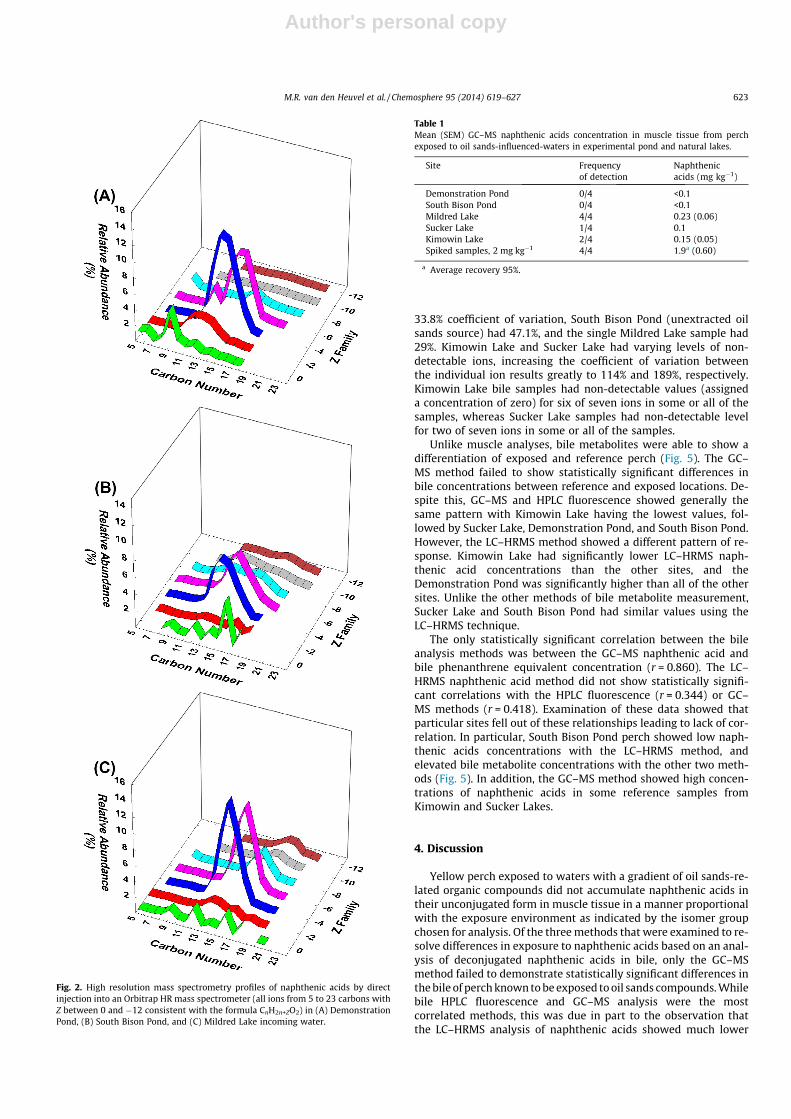
Profiles of naphthenic acids from Demonstration Pond, SouthBison Pond, and Mildred Lake showed a signature of weatherednaphthenic acids with relatively low contributions from Z = 0 andZ = �2 ions (Fig. 2). Bray–Curtis similarity analysis of the relativeabundance of 90 naphthenic acid ions (screening for exact massof all of the 118 possible ions using the classical formula CnH2n+ZO2
between carbon numbers 5 and 23, and Z values 0 to �12) thatwere detected in all samples indicated that Demonstration Pondand Mildred Lake samples shared 79% similarity, whereas South Bi-son Pond naphthenic acid ion profile was only 65.6% and 65.3%similar to the Demonstration Pond and Mildred Lake samples,respectively. In general, the carboxylic acid profile of the South Bi-son Pond has relatively higher contribution of fatty acids and an in-creased relative proportion of lower molecular weight carboxylicacids. South Bison Pond water had an average carbon number of13.6 and Demonstration Pond had an average of 14.6.
3.2. Muscle tissue naphthenic acids
Using the GC–MS method, naphthenic acids were not detectedin muscle tissue of fish taken from the Demonstration Pond (Ta-ble 1). Low concentrations of naphthenic acids were detected inall 4 of the Mildred Lake samples (Table 1), and in some of the ref-erence site samples. A spike of muscle tissue with Merichem naph-thenic acids, indicated that the average recovery of the extractiontechnique was 95% (Table 1).
3.3. Bile naphthenic acid and fluorescence analysis
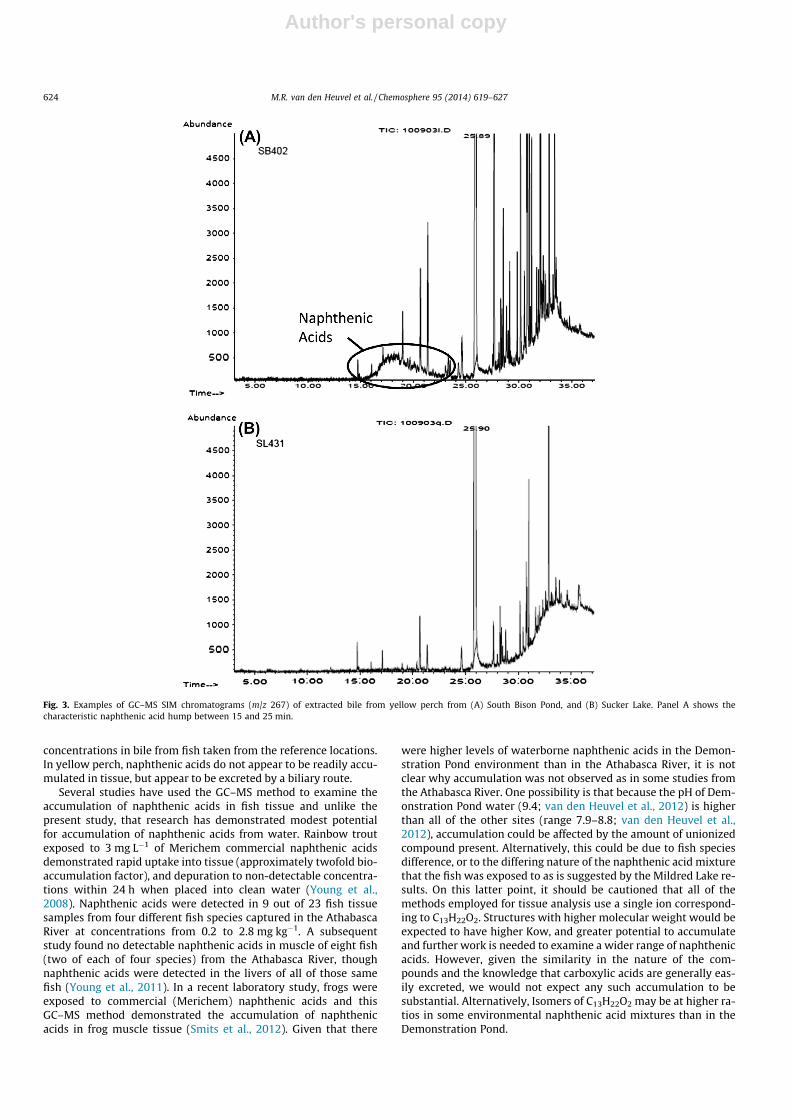
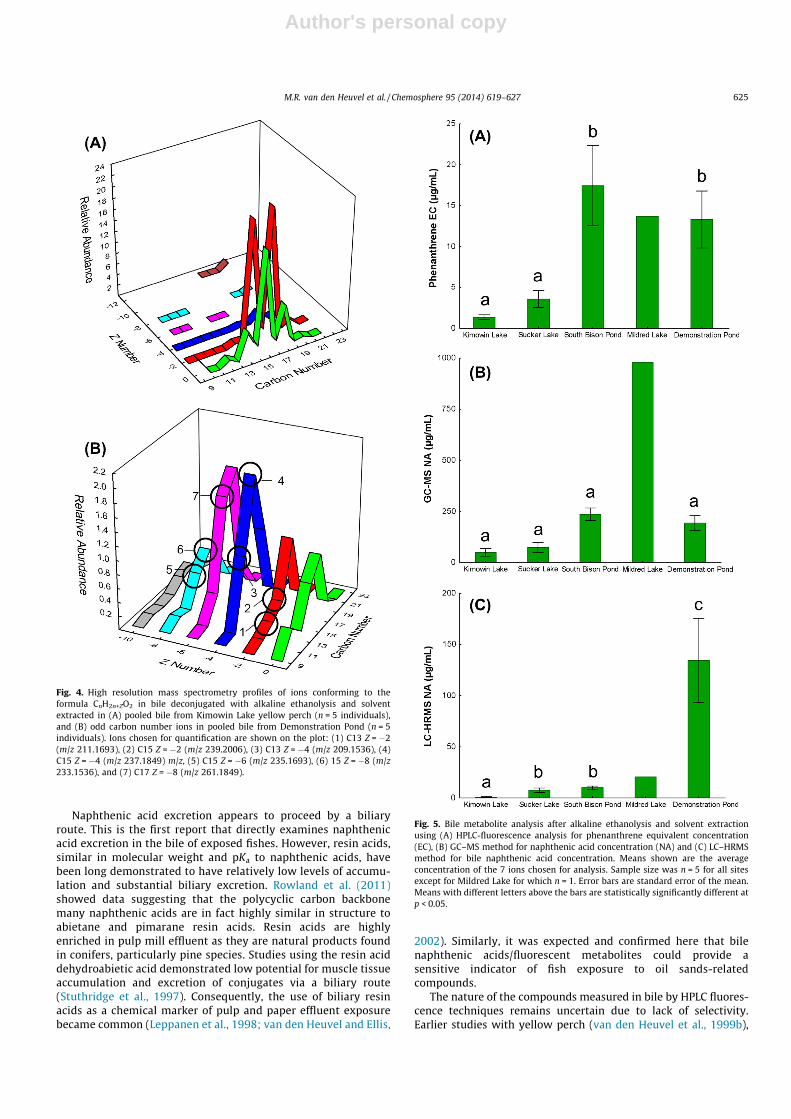
Bile analyzed by the GC–MS method (using SIM m/z 267) re-vealed an unresolved hump corresponding to the t-butyldimethyl-silyl esters with the formula C13H22O2 (C13, Z = �4) between 15and 25 min retention time (Fig. 3A). The use of LC–HRMS allowedfor the selection of individual ions that were characteristic of oilsands exposure. Bile is typically high in fatty acids (Z = 0 andZ = �2) as can be observed in bile from the unexposed KimowinLake perch (Fig. 4A). Many fatty acids correspond to the CnH2n+ZO2
formula and thus cannot be differentiated from oil sands naph-thenic acids on the basis of their molecular mass. Signatures offatty acids, including unsubstituted fatty acids, were strong forthe even numbered carbons 16 and 18, though for saturated com-pounds (Z = 0) both odd and even numbered structures were pres-ent from 12 to 20 carbons. As a result, any attempt to use evennumbered carbon ions, or Z = 0 ions as markers of oil sands expo-sure would lead to high background levels presumably due to fattyacids in bile. Target ions were selected from the odd numbered car-bon, saturated (Z = �2 to Z = �8) ions on the basis of their relativeabundance in a Demonstration Pond pooled bile sample, with somefurther refinement to eliminate ions that showed high backgroundin the Kimowin Lake pooled bile sample. In particular, high back-ground was observed for some of the unsubstituted C17 ions inthe Kimowin Lake sample. This resulted in seven ions being chosenfor quantification (Fig. 4B). Because results from the seven chosenions were averaged to determine the bile naphthenic acid concen-tration by LC–HRMS against a purified naphthenic acid prepara-tion, the variability increased among the results obtainedbetween individual ions as the source of naphthenic acid sourcechanged. Demonstration Pond (tailings source) samples had
622 M.R. van den Heuvel et al. / Chemosphere 95 (2014) 619–627
Author's personal copy
33.8% coefficient of variation, South Bison Pond (unextracted oilsands source) had 47.1%, and the single Mildred Lake sample had29%. Kimowin Lake and Sucker Lake had varying levels of non-detectable ions, increasing the coefficient of variation betweenthe individual ion results greatly to 114% and 189%, respectively.Kimowin Lake bile samples had non-detectable values (assigneda concentration of zero) for six of seven ions in some or all of thesamples, whereas Sucker Lake samples had non-detectable levelfor two of seven ions in some or all of the samples.
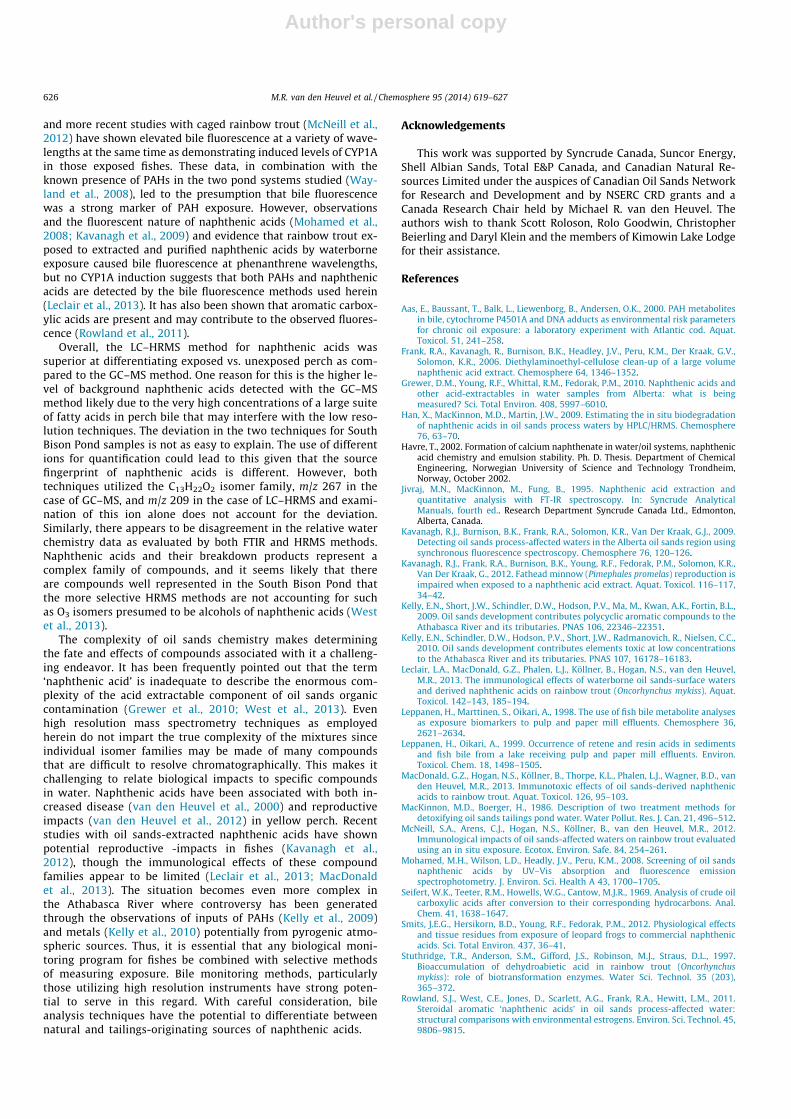
Unlike muscle analyses, bile metabolites were able to show adifferentiation of exposed and reference perch (Fig. 5). The GC–MS method failed to show statistically significant differences inbile concentrations between reference and exposed locations. De-spite this, GC–MS and HPLC fluorescence showed generally thesame pattern with Kimowin Lake having the lowest values, fol-lowed by Sucker Lake, Demonstration Pond, and South Bison Pond.However, the LC–HRMS method showed a different pattern of re-sponse. Kimowin Lake had significantly lower LC–HRMS naph-thenic acid concentrations than the other sites, and theDemonstration Pond was significantly higher than all of the othersites. Unlike the other methods of bile metabolite measurement,Sucker Lake and South Bison Pond had similar values using theLC–HRMS technique.
The only statistically significant correlation between the bileanalysis methods was between the GC–MS naphthenic acid andbile phenanthrene equivalent concentration (r = 0.860). The LC–HRMS naphthenic acid method did not show statistically signifi-cant correlations with the HPLC fluorescence (r = 0.344) or GC–MS methods (r = 0.418). Examination of these data showed thatparticular sites fell out of these relationships leading to lack of cor-relation. In particular, South Bison Pond perch showed low naph-thenic acids concentrations with the LC–HRMS method, andelevated bile metabolite concentrations with the other two meth-ods (Fig. 5). In addition, the GC–MS method showed high concen-trations of naphthenic acids in some reference samples fromKimowin and Sucker Lakes.
4. Discussion
Yellow perch exposed to waters with a gradient of oil sands-re-lated organic compounds did not accumulate naphthenic acids intheir unconjugated form in muscle tissue in a manner proportionalwith the exposure environment as indicated by the isomer groupchosen for analysis. Of the three methods that were examined to re-solve differences in exposure to naphthenic acids based on an anal-ysis of deconjugated naphthenic acids in bile, only the GC–MSmethod failed to demonstrate statistically significant differences inthe bile of perch known to be exposed to oil sands compounds. Whilebile HPLC fluorescence and GC–MS analysis were the mostcorrelated methods, this was due in part to the observation thatthe LC–HRMS analysis of naphthenic acids showed much lower
Fig. 2. High resolution mass spectrometry profiles of naphthenic acids by directinjection into an Orbitrap HR mass spectrometer (all ions from 5 to 23 carbons withZ between 0 and �12 consistent with the formula CnH2n+ZO2) in (A) DemonstrationPond, (B) South Bison Pond, and (C) Mildred Lake incoming water.
Table 1Mean (SEM) GC–MS naphthenic acids concentration in muscle tissue from perchexposed to oil sands-influenced-waters in experimental pond and natural lakes.
Site Frequencyof detection
Naphthenicacids (mg kg�1)
Demonstration Pond 0/4 <0.1South Bison Pond 0/4 <0.1Mildred Lake 4/4 0.23 (0.06)Sucker Lake 1/4 0.1Kimowin Lake 2/4 0.15 (0.05)Spiked samples, 2 mg kg�1 4/4 1.9a (0.60)
a Average recovery 95%.
M.R. van den Heuvel et al. / Chemosphere 95 (2014) 619–627 623
Author's personal copy
concentrations in bile from fish taken from the reference locations.In yellow perch, naphthenic acids do not appear to be readily accu-mulated in tissue, but appear to be excreted by a biliary route.
Several studies have used the GC–MS method to examine theaccumulation of naphthenic acids in fish tissue and unlike thepresent study, that research has demonstrated modest potentialfor accumulation of naphthenic acids from water. Rainbow troutexposed to 3 mg L�1 of Merichem commercial naphthenic acidsdemonstrated rapid uptake into tissue (approximately twofold bio-accumulation factor), and depuration to non-detectable concentra-tions within 24 h when placed into clean water (Young et al.,2008). Naphthenic acids were detected in 9 out of 23 fish tissuesamples from four different fish species captured in the AthabascaRiver at concentrations from 0.2 to 2.8 mg kg�1. A subsequentstudy found no detectable naphthenic acids in muscle of eight fish(two of each of four species) from the Athabasca River, thoughnaphthenic acids were detected in the livers of all of those samefish (Young et al., 2011). In a recent laboratory study, frogs wereexposed to commercial (Merichem) naphthenic acids and thisGC–MS method demonstrated the accumulation of naphthenicacids in frog muscle tissue (Smits et al., 2012). Given that there
were higher levels of waterborne naphthenic acids in the Demon-stration Pond environment than in the Athabasca River, it is notclear why accumulation was not observed as in some studies fromthe Athabasca River. One possibility is that because the pH of Dem-onstration Pond water (9.4; van den Heuvel et al., 2012) is higherthan all of the other sites (range 7.9–8.8; van den Heuvel et al.,2012), accumulation could be affected by the amount of unionizedcompound present. Alternatively, this could be due to fish speciesdifference, or to the differing nature of the naphthenic acid mixturethat the fish was exposed to as is suggested by the Mildred Lake re-sults. On this latter point, it should be cautioned that all of themethods employed for tissue analysis use a single ion correspond-ing to C13H22O2. Structures with higher molecular weight would beexpected to have higher Kow, and greater potential to accumulateand further work is needed to examine a wider range of naphthenicacids. However, given the similarity in the nature of the com-pounds and the knowledge that carboxylic acids are generally eas-ily excreted, we would not expect any such accumulation to besubstantial. Alternatively, Isomers of C13H22O2 may be at higher ra-tios in some environmental naphthenic acid mixtures than in theDemonstration Pond.
Fig. 3. Examples of GC–MS SIM chromatograms (m/z 267) of extracted bile from yellow perch from (A) South Bison Pond, and (B) Sucker Lake. Panel A shows thecharacteristic naphthenic acid hump between 15 and 25 min.
624 M.R. van den Heuvel et al. / Chemosphere 95 (2014) 619–627
Author's personal copy
Naphthenic acid excretion appears to proceed by a biliaryroute. This is the first report that directly examines naphthenicacid excretion in the bile of exposed fishes. However, resin acids,similar in molecular weight and pKa to naphthenic acids, havebeen long demonstrated to have relatively low levels of accumu-lation and substantial biliary excretion. Rowland et al. (2011)showed data suggesting that the polycyclic carbon backbonemany naphthenic acids are in fact highly similar in structure toabietane and pimarane resin acids. Resin acids are highlyenriched in pulp mill effluent as they are natural products foundin conifers, particularly pine species. Studies using the resin aciddehydroabietic acid demonstrated low potential for muscle tissueaccumulation and excretion of conjugates via a biliary route(Stuthridge et al., 1997). Consequently, the use of biliary resinacids as a chemical marker of pulp and paper effluent exposurebecame common (Leppanen et al., 1998; van den Heuvel and Ellis,
2002). Similarly, it was expected and confirmed here that bilenaphthenic acids/fluorescent metabolites could provide asensitive indicator of fish exposure to oil sands-relatedcompounds.
The nature of the compounds measured in bile by HPLC fluores-cence techniques remains uncertain due to lack of selectivity.Earlier studies with yellow perch (van den Heuvel et al., 1999b),
Fig. 4. High resolution mass spectrometry profiles of ions conforming to theformula CnH2n+ZO2 in bile deconjugated with alkaline ethanolysis and solventextracted in (A) pooled bile from Kimowin Lake yellow perch (n = 5 individuals),and (B) odd carbon number ions in pooled bile from Demonstration Pond (n = 5individuals). Ions chosen for quantification are shown on the plot: (1) C13 Z = �2(m/z 211.1693), (2) C15 Z = �2 (m/z 239.2006), (3) C13 Z = �4 (m/z 209.1536), (4)C15 Z = �4 (m/z 237.1849) m/z, (5) C15 Z = �6 (m/z 235.1693), (6) 15 Z = �8 (m/z233.1536), and (7) C17 Z = �8 (m/z 261.1849).
Fig. 5. Bile metabolite analysis after alkaline ethanolysis and solvent extractionusing (A) HPLC-fluorescence analysis for phenanthrene equivalent concentration(EC), (B) GC–MS method for naphthenic acid concentration (NA) and (C) LC–HRMSmethod for bile naphthenic acid concentration. Means shown are the averageconcentration of the 7 ions chosen for analysis. Sample size was n = 5 for all sitesexcept for Mildred Lake for which n = 1. Error bars are standard error of the mean.Means with different letters above the bars are statistically significantly different atp < 0.05.
M.R. van den Heuvel et al. / Chemosphere 95 (2014) 619–627 625
Author's personal copy
and more recent studies with caged rainbow trout (McNeill et al.,2012) have shown elevated bile fluorescence at a variety of wave-lengths at the same time as demonstrating induced levels of CYP1Ain those exposed fishes. These data, in combination with theknown presence of PAHs in the two pond systems studied (Way-land et al., 2008), led to the presumption that bile fluorescencewas a strong marker of PAH exposure. However, observationsand the fluorescent nature of naphthenic acids (Mohamed et al.,2008; Kavanagh et al., 2009) and evidence that rainbow trout ex-posed to extracted and purified naphthenic acids by waterborneexposure caused bile fluorescence at phenanthrene wavelengths,but no CYP1A induction suggests that both PAHs and naphthenicacids are detected by the bile fluorescence methods used herein(Leclair et al., 2013). It has also been shown that aromatic carbox-ylic acids are present and may contribute to the observed fluores-cence (Rowland et al., 2011).
Overall, the LC–HRMS method for naphthenic acids wassuperior at differentiating exposed vs. unexposed perch as com-pared to the GC–MS method. One reason for this is the higher le-vel of background naphthenic acids detected with the GC–MSmethod likely due to the very high concentrations of a large suiteof fatty acids in perch bile that may interfere with the low reso-lution techniques. The deviation in the two techniques for SouthBison Pond samples is not as easy to explain. The use of differentions for quantification could lead to this given that the sourcefingerprint of naphthenic acids is different. However, bothtechniques utilized the C13H22O2 isomer family, m/z 267 in thecase of GC–MS, and m/z 209 in the case of LC–HRMS and exami-nation of this ion alone does not account for the deviation.Similarly, there appears to be disagreement in the relative waterchemistry data as evaluated by both FTIR and HRMS methods.Naphthenic acids and their breakdown products represent acomplex family of compounds, and it seems likely that thereare compounds well represented in the South Bison Pond thatthe more selective HRMS methods are not accounting for suchas O3 isomers presumed to be alcohols of naphthenic acids (Westet al., 2013).
The complexity of oil sands chemistry makes determiningthe fate and effects of compounds associated with it a challeng-ing endeavor. It has been frequently pointed out that the term‘naphthenic acid’ is inadequate to describe the enormous com-plexity of the acid extractable component of oil sands organiccontamination (Grewer et al., 2010; West et al., 2013). Evenhigh resolution mass spectrometry techniques as employedherein do not impart the true complexity of the mixtures sinceindividual isomer families may be made of many compoundsthat are difficult to resolve chromatographically. This makes itchallenging to relate biological impacts to specific compoundsin water. Naphthenic acids have been associated with both in-creased disease (van den Heuvel et al., 2000) and reproductiveimpacts (van den Heuvel et al., 2012) in yellow perch. Recentstudies with oil sands-extracted naphthenic acids have shownpotential reproductive -impacts in fishes (Kavanagh et al.,2012), though the immunological effects of these compoundfamilies appear to be limited (Leclair et al., 2013; MacDonaldet al., 2013). The situation becomes even more complex inthe Athabasca River where controversy has been generatedthrough the observations of inputs of PAHs (Kelly et al., 2009)and metals (Kelly et al., 2010) potentially from pyrogenic atmo-spheric sources. Thus, it is essential that any biological moni-toring program for fishes be combined with selective methodsof measuring exposure. Bile monitoring methods, particularlythose utilizing high resolution instruments have strong poten-tial to serve in this regard. With careful consideration, bileanalysis techniques have the potential to differentiate betweennatural and tailings-originating sources of naphthenic acids.
Acknowledgements
This work was supported by Syncrude Canada, Suncor Energy,Shell Albian Sands, Total E&P Canada, and Canadian Natural Re-sources Limited under the auspices of Canadian Oil Sands Networkfor Research and Development and by NSERC CRD grants and aCanada Research Chair held by Michael R. van den Heuvel. Theauthors wish to thank Scott Roloson, Rolo Goodwin, ChristopherBeierling and Daryl Klein and the members of Kimowin Lake Lodgefor their assistance.
References
Aas, E., Baussant, T., Balk, L., Liewenborg, B., Andersen, O.K., 2000. PAH metabolitesin bile, cytochrome P4501A and DNA adducts as environmental risk parametersfor chronic oil exposure: a laboratory experiment with Atlantic cod. Aquat.Toxicol. 51, 241–258.
Frank, R.A., Kavanagh, R., Burnison, B.K., Headley, J.V., Peru, K.M., Der Kraak, G.V.,Solomon, K.R., 2006. Diethylaminoethyl-cellulose clean-up of a large volumenaphthenic acid extract. Chemosphere 64, 1346–1352.
Grewer, D.M., Young, R.F., Whittal, R.M., Fedorak, P.M., 2010. Naphthenic acids andother acid-extractables in water samples from Alberta: what is beingmeasured? Sci. Total Environ. 408, 5997–6010.
Han, X., MacKinnon, M.D., Martin, J.W., 2009. Estimating the in situ biodegradationof naphthenic acids in oil sands process waters by HPLC/HRMS. Chemosphere76, 63–70.
Havre, T., 2002. Formation of calcium naphthenate in water/oil systems, naphthenicacid chemistry and emulsion stability. Ph. D. Thesis. Department of ChemicalEngineering, Norwegian University of Science and Technology Trondheim,Norway, October 2002.
Jivraj, M.N., MacKinnon, M., Fung, B., 1995. Naphthenic acid extraction andquantitative analysis with FT-IR spectroscopy. In: Syncrude AnalyticalManuals, fourth ed.. Research Department Syncrude Canada Ltd., Edmonton,Alberta, Canada.
Kavanagh, R.J., Burnison, B.K., Frank, R.A., Solomon, K.R., Van Der Kraak, G.J., 2009.Detecting oil sands process-affected waters in the Alberta oil sands region usingsynchronous fluorescence spectroscopy. Chemosphere 76, 120–126.
Kavanagh, R.J., Frank, R.A., Burnison, B.K., Young, R.F., Fedorak, P.M., Solomon, K.R.,Van Der Kraak, G., 2012. Fathead minnow (Pimephales promelas) reproduction isimpaired when exposed to a naphthenic acid extract. Aquat. Toxicol. 116–117,34–42.
Kelly, E.N., Short, J.W., Schindler, D.W., Hodson, P.V., Ma, M., Kwan, A.K., Fortin, B.L.,2009. Oil sands development contributes polycyclic aromatic compounds to theAthabasca River and its tributaries. PNAS 106, 22346–22351.
Kelly, E.N., Schindler, D.W., Hodson, P.V., Short, J.W., Radmanovich, R., Nielsen, C.C.,2010. Oil sands development contributes elements toxic at low concentrationsto the Athabasca River and its tributaries. PNAS 107, 16178–16183.
Leclair, L.A., MacDonald, G.Z., Phalen, L.J., Köllner, B., Hogan, N.S., van den Heuvel,M.R., 2013. The immunological effects of waterborne oil sands-surface watersand derived naphthenic acids on rainbow trout (Oncorhynchus mykiss). Aquat.Toxicol. 142–143, 185–194.
Leppanen, H., Marttinen, S., Oikari, A., 1998. The use of fish bile metabolite analysesas exposure biomarkers to pulp and paper mill effluents. Chemosphere 36,2621–2634.
Leppanen, H., Oikari, A., 1999. Occurrence of retene and resin acids in sedimentsand fish bile from a lake receiving pulp and paper mill effluents. Environ.Toxicol. Chem. 18, 1498–1505.
MacDonald, G.Z., Hogan, N.S., Köllner, B., Thorpe, K.L., Phalen, L.J., Wagner, B.D., vanden Heuvel, M.R., 2013. Immunotoxic effects of oil sands-derived naphthenicacids to rainbow trout. Aquat. Toxicol. 126, 95–103.
MacKinnon, M.D., Boerger, H., 1986. Description of two treatment methods fordetoxifying oil sands tailings pond water. Water Pollut. Res. J. Can. 21, 496–512.
McNeill, S.A., Arens, C.J., Hogan, N.S., Köllner, B., van den Heuvel, M.R., 2012.Immunological impacts of oil sands-affected waters on rainbow trout evaluatedusing an in situ exposure. Ecotox. Environ. Safe. 84, 254–261.
Mohamed, M.H., Wilson, L.D., Headly, J.V., Peru, K.M., 2008. Screening of oil sandsnaphthenic acids by UV–Vis absorption and fluorescence emissionspectrophotometry. J. Environ. Sci. Health A 43, 1700–1705.
Seifert, W.K., Teeter, R.M., Howells, W.G., Cantow, M.J.R., 1969. Analysis of crude oilcarboxylic acids after conversion to their corresponding hydrocarbons. Anal.Chem. 41, 1638–1647.
Smits, J.E.G., Hersikorn, B.D., Young, R.F., Fedorak, P.M., 2012. Physiological effectsand tissue residues from exposure of leopard frogs to commercial naphthenicacids. Sci. Total Environ. 437, 36–41.
Stuthridge, T.R., Anderson, S.M., Gifford, J.S., Robinson, M.J., Straus, D.L., 1997.Bioaccumulation of dehydroabietic acid in rainbow trout (Oncorhynchusmykiss): role of biotransformation enzymes. Water Sci. Technol. 35 (203),365–372.
Rowland, S.J., West, C.E., Jones, D., Scarlett, A.G., Frank, R.A., Hewitt, L.M., 2011.Steroidal aromatic ‘naphthenic acids’ in oil sands process-affected water:structural comparisons with environmental estrogens. Environ. Sci. Technol. 45,9806–9815.
626 M.R. van den Heuvel et al. / Chemosphere 95 (2014) 619–627

Author's personal copy
Royal Society of Canada, 2010. Environmental and Health Impacts of Canada’s OilSands Industry. <http://www.rscsrc.ca/documents/expert/RSC%20report%20complete%20secured%209Mb.pdfS>.
van den Heuvel, M.R., Power, M., Richards, J., Mackinnon, M., Dixon, D.G., 2000.Disease and gill lesions in yellow perch (Perca flavescens) exposed to oil sandsmining-associated waters. Ecotox. Environ. Safe. 46, 334–341.
van den Heuvel, M.R., Ellis, R.J., 2002. Timing of exposure to pulp and paper effluentinfluences the manifestation of reproductive effects in rainbow trout. Environ.Toxicol. Chem. 21, 2338–2347.
van den Heuvel, M.R., Power, M., MacKinnon, M.D., Dixon, D.G., 1999a. Effects of oilsands related aquatic reclamation on yellow perch (Perca flavescens). II.Chemical and biochemical indicators of exposure to oil sands related waters.Can. J. Fish. Aquat. Sci. 56, 1226–1233.
van den Heuvel, M.R., Power, M., MacKinnon, M.D., Van Meer, T., Dobson, E.P.,Dixon, D.G., 1999b. Effects of oil sands related aquatic reclamation onyellow perch (Perca flavescens). I. Water quality characteristics and yellowperch physiological and population responses. Can. J. Fish. Aquat. Sci. 56, 1213–1225.
van den Heuvel, M.R., Hogan, N.S., Roloson, S.D., Van Der Kraak, G.J., 2012.Reproductive development of yellow perch (Perca flavescens) exposed to oilsands-affected waters. Environ. Toxicol. Chem. 31, 654–662.
Wayland, M., Headley, J.V., Peru, K.M., Crosley, R., Brownlee, B.G., 2008. Levels ofpolycyclic aromatic hydrocarbons and dibenzothiophenes in wetlandsediments and aquatic insects in the oil sands area of Northeastern Alberta,Canada. Environ. Monit. Assess. 136, 167–182.
West, C.E., Scarlett, A.G., Pureveen, J., Tegelaar, E.W., Rowland, S.J., 2013. Abundantnaphthenic acids in oil sands process-affected water: studies by synthesis,derivatisation and two-dimensional gas chromatography/high-resolution massspectrometry. Rapid Commun. Mass Spectrom. 27, 357–365.
Young, R.F., Orr, E.A., Goss, G.G., Fedorak, P.M., 2007. Detection of naphthenic acidsin fish exposed to commercial naphthenic acids and oil sands process-affectedwater. Chemosphere 68, 518–527.
Young, R.F., Wismer, W.V., Fedorak, P.M., 2008. Estimating naphthenic acidsconcentrations in laboratory-exposed fish and in fish from the wild.Chemosphere 73, 498–505.
Young, R.F., Coy, D.L., Fedorak, P.M., 2010. Evaluating MTBSTFA derivatizationreagents for measuring naphthenic acids by gas chromatography-massspectrometry. Anal. Methods 2, 765–770.
Young, R.F., Martínez, Michel L., Fedorak, P.M., 2011. Distribution of naphthenicacids in tissues of laboratory-exposed fish and in wild fishes from near theAthabasca oil sands in Alberta. Can. Ecotox. Environ. Saf. 74, 889–896.
M.R. van den Heuvel et al. / Chemosphere 95 (2014) 619–627 627