An extension of the group contribution model for thermodynamic and transport properties of dilute...
20
Korean J. Chem. Eng., 19(5), 843-862 (2002) 843 † To whom correspondence should be addressed. E-mail: [email protected] An Extension of the Group Contribution Model for Thermodynamic and Transport Properties of Dilute Gases Seung-Kyo Oh* † and Chol-Ho Sim *Department of Chemical and Environmental Engineering, Kon-Yang University, San 26, Naedong, Nonsan, Chungnam 320-711, Korea Department of Chemistry, Sang-Ji University, 600, Woosandong, Wonju, Kwangwon 220-702, Korea (Received 28 February 2002 • accepted 13 June 2002) Abstract -Earlier work of the group contribution method presented by Oh and Campbell [Oh and Campbell, 1997] for prediction of second virial coefficients and dilute gas transport properties has been repeated with a new set of normal alkane second virial coefficient data (methane, ethane, propane, and normal pentane critically compiled by Dymond and Smith [1980], normal hexane recommended by Dymond et al. [1986], and the recommendation for normal butane, heptane and octane updated by Tsonopoulos and Dymond [1997]). This method has been extended to molecular linear gases (carbon monoxide, oxygen and hydrogen) and to alkanes-gases mixtures. The functional group parameters were revised from the simultaneous regression of second virial coefficient and viscosity data. Group parameters values (CH 0 , CH 1 , CH 2 , CH 3 , CH 4 , double-bonded CH 1 , double-bonded CH 2 , N 2 , and CO 2 groups) and 8 binary group interaction parameters (k N2-CH0, GC , k N2-CH1, GC , k N2-CH2, GC , k N2-CH3, GC ; k CO2-CH0, GC , k CO2-CH1, GC , k CO2-CH2, GC and k CO2-CH3, GC ) were revised. New group parameter values are given for gases beyond those presented earlier (CO, O 2 and H 2 ) and 19 group binary interac- tion parameter values (k N2-CH1D, GC , k N2-CH2D, GC ; k CO2-CH1D, GC , k CO2-CH2D, GC ; k CO-CH1, GC , k CO2-CH2, GC , k CO-CH3, GC , k CO-CH1D, GC , k CO-CH2D, GC ; k O2-CH0, GC , k O2-CH1, GC , k O2-CH2, GC , k O2-CH3, GC ; k H2-CH0, GC , k H2-CH1, GC , k H2-CH2, GC , k H2-CH3, GC , k H2-CH1D, GC , k H2-CH2D, GC ) are presented for hydrocarbon mixtures with gases. Application of the model shows that second virial coefficient data can be re- presented with results comparable to those obtained by Oh and Campbell [1997] and by the corresponding states method of Tsonopoulos [1974]. The accuracy of the model in viscosity and diffusion coefficient predictions of dilute gases is comparable to the methods of Lucas [1980] and of the Fuller method [Fuller et al., 1966]. Key words: Theory, Group Contribution, Second Virial Coefficient, Viscosity, Diffusion Coefficient INTRODUCTION The group contribution concept becomes an alternative to the corresponding states framework for the prediction of second virial coefficients and dilute gas transport properties. Here, a single set of parameters, appearing in an intermolecular potential function, is assigned to interactions between intermolecular functional groups. An advantage of this method is that it does not require values for the critical properties and acentric factors, which may not be avail- able for all of the compounds in question, and that it is applicable with only information of both functional group and van der Waals volume [Bondi, 1964] in molecules. Since the number of func- tional groups is much smaller than the number of possible chemi- cal species, a relatively small number of group parameters can de- scribe a large number of different mixtures. This concept forms the basis for the UNIFAC [Fredenslund et al., 1975] and ASOG [Derr and Deal, 1969] activity coefficient models and for the GPSCT [Jin et al., 1986] and GSPHCT [Georgeton and Teja, 1988] equations of state. Campbell [1989] applied a group contribution concept to the Ki- hara potential function for second virial coefficients of pure gases and its mixture. Group parameters for alkane groups, obtained from second virial coefficient data for pure alkanes, were used to pre- dict, without additional parameters, second virial cross coefficients of alkane mixtures. The model was found to perform well, even for such asymmetric systems as methane-eicosane. Based on an intermolecular potential function, the group contribution method is applicable to the calculation of dilute gas transport properties as well. Swelling models combined with group contribution models (UNI- FAC, ASOG) was introduced to calculate the swelling equilibria of water(1)/poly(AM-SAS-AA)(2) systems [Kim et al., 2000]. Yeom et al. [2000] developed a semi-empirical equation of state for freely jointed square-well chain fluid adopting for the second and third virial coefficients for compressibility factor and the first two terms of the radial distribution function. Theories based on free- volume concepts have been developed to characterize the self and mutual diffusion coefficients of low molecular weight penetrants in rubbery and glassy polymer-solvent systems by Ramesh and Duda [2000]. Oh [1989] and Oh and Campbell [1997] proved the feasi- bility of applying the group contribution method to simultaneous representation of second virial coefficient, dilute gas viscosity and dilute gas diffusion coefficient. By introducing the concept of a binary group interaction coefficient, they extended the model to nitrogen- and carbon dioxide-alkane mixtures with success. Here, with the exception of n-hexane, second virial coefficient data from ethane through n-octane recommended by Dymond et al. [1986] were used for the evaluation of functional group parameters for alkanes. In the mean time, the extensive 1986 analysis of Dymond et al. [1986] was extended to include recent data on C 4 -C 6 alkanes, and
-
Upload
independent -
Category
Documents
-
view
4 -
download
0
Transcript of An extension of the group contribution model for thermodynamic and transport properties of dilute...
Korean J. Chem. Eng., 19(5), 843-862 (2002)
ntsen
on an iswell.I-ria
tatendstree-lf and inudasi-
usnd
aryen- theanesed.t al.
843
†To whom correspondence should be addressed.E-mail: [email protected]
An Extension of the Group Contribution Model for Thermodynamic andTransport Properties of Dilute Gases
Seung-Kyo Oh*† and Chol-Ho Sim
*Department of Chemical and Environmental Engineering, Kon-Yang University,San 26, Naedong, Nonsan, Chungnam 320-711, Korea
Department of Chemistry, Sang-Ji University, 600, Woosandong, Wonju, Kwangwon 220-702, Korea(Received 28 February 2002 • accepted 13 June 2002)
Abstract−−−−Earlier work of the group contribution method presented by Oh and Campbell [Oh and Campbell, 1997]for prediction of second virial coefficients and dilute gas transport properties has been repeated with a new set of normalalkane second virial coefficient data (methane, ethane, propane, and normal pentane critically compiled by Dymondand Smith [1980], normal hexane recommended by Dymond et al. [1986], and the recommendation for normal butane,heptane and octane updated by Tsonopoulos and Dymond [1997]). This method has been extended to molecular lineargases (carbon monoxide, oxygen and hydrogen) and to alkanes-gases mixtures. The functional group parameters wererevised from the simultaneous regression of second virial coefficient and viscosity data. Group parameters values (CH0,CH1, CH2, CH3, CH4, double-bonded CH1, double-bonded CH2, N2, and CO2 groups) and 8 binary group interactionparameters (kN2-CH0, GC, kN2-CH1,GC, kN2-CH2,GC, kN2-CH3,GC; kCO2-CH0, GC, kCO2-CH1, GC, kCO2-CH2,GC and kCO2-CH3,GC) were revised. Newgroup parameter values are given for gases beyond those presented earlier (CO, O2 and H2) and 19 group binary interac-tion parameter values (kN2-CH1D, GC, kN2-CH2D, GC; kCO2-CH1D, GC, kCO2-CH2D, GC; kCO-CH1, GC, kCO2-CH2,GC, kCO-CH3,GC, kCO-CH1D, GC, kCO-CH2D, GC;kO2-CH0,GC, kO2-CH1, GC, kO2-CH2,GC, kO2-CH3, GC; kH2-CH0,GC, kH2-CH1,GC, kH2-CH2, GC, kH2-CH3,GC, kH2-CH1D, GC, kH2-CH2D, GC) are presentedfor hydrocarbon mixtures with gases. Application of the model shows that second virial coefficient data can be re-presented with results comparable to those obtained by Oh and Campbell [1997] and by the corresponding statesmethod of Tsonopoulos [1974]. The accuracy of the model in viscosity and diffusion coefficient predictions of dilutegases is comparable to the methods of Lucas [1980] and of the Fuller method [Fuller et al., 1966].
Key words: Theory, Group Contribution, Second Virial Coefficient, Viscosity, Diffusion Coefficient
INTRODUCTION
The group contribution concept becomes an alternative to thecorresponding states framework for the prediction of second virialcoefficients and dilute gas transport properties. Here, a single setof parameters, appearing in an intermolecular potential function, isassigned to interactions between intermolecular functional groups.An advantage of this method is that it does not require values forthe critical properties and acentric factors, which may not be avail-able for all of the compounds in question, and that it is applicablewith only information of both functional group and van der Waalsvolume [Bondi, 1964] in molecules. Since the number of func-tional groups is much smaller than the number of possible chemi-cal species, a relatively small number of group parameters can de-scribe a large number of different mixtures. This concept forms thebasis for the UNIFAC [Fredenslund et al., 1975] and ASOG [Derrand Deal, 1969] activity coefficient models and for the GPSCT [Jinet al., 1986] and GSPHCT [Georgeton and Teja, 1988] equationsof state.
Campbell [1989] applied a group contribution concept to the Ki-hara potential function for second virial coefficients of pure gasesand its mixture. Group parameters for alkane groups, obtained fromsecond virial coefficient data for pure alkanes, were used to pre-
dict, without additional parameters, second virial cross coefficieof alkane mixtures. The model was found to perform well, evfor such asymmetric systems as methane-eicosane. Based intermolecular potential function, the group contribution methodapplicable to the calculation of dilute gas transport properties as Swelling models combined with group contribution models (UNFAC, ASOG) was introduced to calculate the swelling equilibof water(1)/poly(AM-SAS-AA)(2) systems [Kim et al., 2000].
Yeom et al. [2000] developed a semi-empirical equation of sfor freely jointed square-well chain fluid adopting for the secoand third virial coefficients for compressibility factor and the firtwo terms of the radial distribution function. Theories based on fvolume concepts have been developed to characterize the semutual diffusion coefficients of low molecular weight penetrantsrubbery and glassy polymer-solvent systems by Ramesh and D[2000]. Oh [1989] and Oh and Campbell [1997] proved the feability of applying the group contribution method to simultaneorepresentation of second virial coefficient, dilute gas viscosity adilute gas diffusion coefficient. By introducing the concept of a bingroup interaction coefficient, they extended the model to nitrogand carbon dioxide-alkane mixtures with success. Here, withexception of n-hexane, second virial coefficient data from eththrough n-octane recommended by Dymond et al. [1986] were ufor the evaluation of functional group parameters for alkanes
In the mean time, the extensive 1986 analysis of Dymond e[1986] was extended to include recent data on C4-C6 alkanes, and
844 S.-K. Oh and C.-H. Sim
heed Eq.the
eenre.
l-
es
cti-me-ces.
the recommendation for C4-C8 alkanes was updated by Tsonopoulosand Dymond [1997].
In this paper, as a continuation of the previous works on the ap-plication of the group contribution method to the intermolecularpotentials, a set of functional group parameters for pure alkanes werere-evaluated with revised recommendations of pure alkane secondvirial coefficient data in order to improve the reliability of the predic-tions. Also, functional group parameters beyond those presentedearlier are extended to industrially important linear molecular gases(carbon monoxide, oxygen and hydrogen), as well as to a variety ofmixtures of these gases. As in the 1997 paper [Oh and Campbell,1997], the group contribution concept applied to the Kihara inter-molecular potential function was examined for normal and branchedalkanes, alkenes, nitrogen and carbon dioxide.
The description for the second virial coefficient derived from thespherical core potential of Kihara [1978] and the Chapman and Ens-kog theory [Chapman and Cowling, 1939] for the viscosity and dif-fusivity of dilute gases is not made here, but a full description canbe found either in the original paper [Campbell, 1989] or in 1997extension [Oh, 1989]. Also, values of the collision integrals for vis-cosity and diffusion (ΩV and ΩD) for Kihara potential function, need-ed for the Chapman and Enskog theory, were tabulated in Oh andCampbell [1997].
GROUP CONTRIBUTION MODEL
The expression for group contribution rules for functional groupparameters appearing in Kihara potential function was given in theprevious paper [Oh and Campbell, 1997]. For better understand-ing, however, it is necessary to describe it briefly.
Group contribution rules for the Kihara potential parameters arewritten for the general case of non-identical molecules 1 and 2. Cal-culations for pure gases are made by setting molecule 2 identicalto molecule 1. The rules for ε12 and σ12 are
(1)
and
(2)
where Ni1 is the number of functional groups of type i in molecule1, Nj2 is the number of functional groups of type j in molecule 2,ε12 and σ12 are the well depth and collision diameter for interactionsbetween molecules 1 and 2, and εij and σij are the well depth andcollision diameter for interactions between intermolecular groups iand j, respectively. This rule for the Kihara potentials is also re-quired for the core radius a12, where the group additivity of the re-duced core radii is assumed:
(3)
and
(4)
followed by
(5)
where
(6)
with an analogous expression for a22.The rules given above express ε12, σ12 and a12 in terms of group
interaction parameters εij and σij and group core parameters aii. Forinteractions between two identical groups i, we assume
(7)
(8)
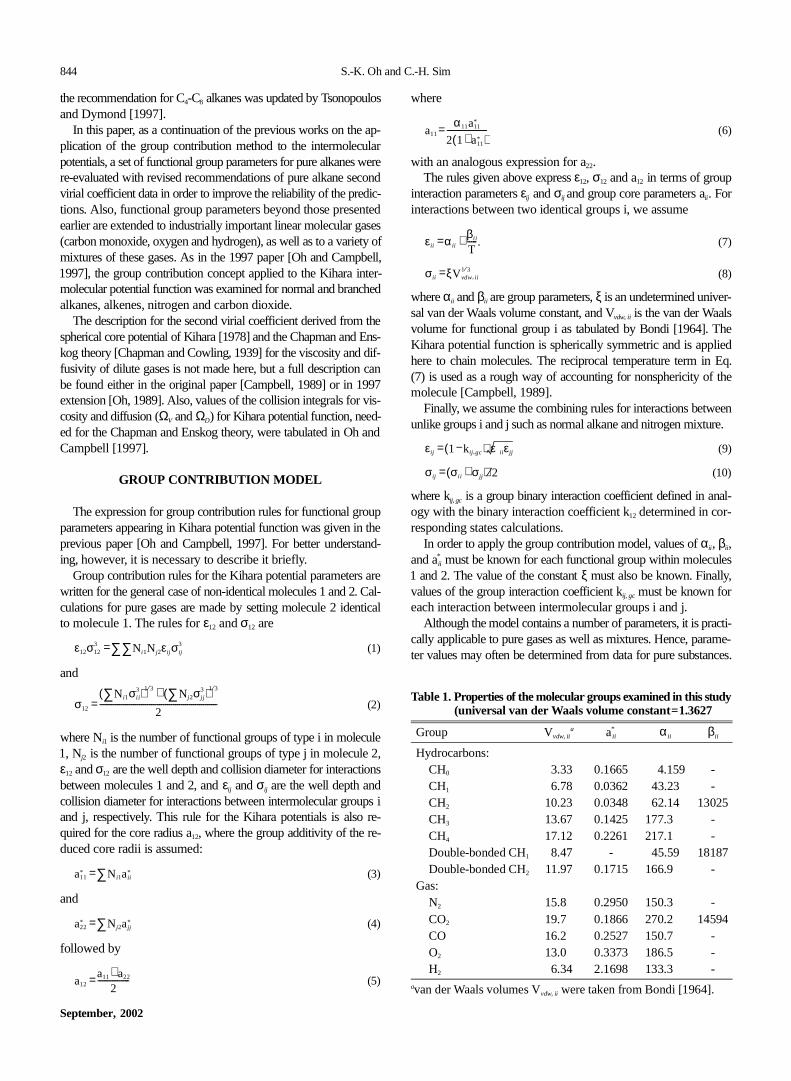
where αii and βii are group parameters, ξ is an undetermined univer-sal van der Waals volume constant, and Vvdw, ii is the van der Waalsvolume for functional group i as tabulated by Bondi [1964]. TKihara potential function is spherically symmetric and is applihere to chain molecules. The reciprocal temperature term in(7) is used as a rough way of accounting for nonsphericity of molecule [Campbell, 1989].
Finally, we assume the combining rules for interactions betwunlike groups i and j such as normal alkane and nitrogen mixtu
(9)
(10)
where kij,gc is a group binary interaction coefficient defined in anaogy with the binary interaction coefficient k12 determined in cor-responding states calculations.
In order to apply the group contribution model, values of αii, βii,and a*ii must be known for each functional group within molecul1 and 2. The value of the constant ξ must also be known. Finally,values of the group interaction coefficient kij, gc must be known foreach interaction between intermolecular groups i and j.
Although the model contains a number of parameters, it is pracally applicable to pure gases as well as mixtures. Hence, parater values may often be determined from data for pure substan
ε12σ123
= Ni1Nj2εij σij3∑∑
σ12 =
Ni1σi i3∑( )1 3⁄
+ Nj2σj j3∑( )1 3⁄
2-----------------------------------------------------------
a11*
= Ni1aii*∑
a22*
= Nj2ajj*∑
a12 = a11+ a22
2----------------
a11= α11a11
*
2 1+ a11*( )
--------------------
εii = αii + βi i
T-----.
σii = ξV vdw ii,1 3⁄
εij = 1− kij gc,( ) εiiεjj
σij = σi i + σjj( ) 2⁄
Table 1. Properties of the molecular groups examined in this study(universal van der Waals volume constant=1.3627
Group Vvdw, iia a*
ii αii βii
Hydrocarbons:CH0 3.33 0.1665 004.159 -CH1 6.78 0.0362 043.230 -CH2 10.23 0.0348 062.140 13025CH3 13.67 0.1425 177.300 -CH4 17.12 0.2261 217.100 -Double-bonded CH1 8.47 - 045.590 18187Double-bonded CH2 11.97 0.1715 166.900 -
Gas:N2 15.80 0.2950 150.300 -CO2 19.70 0.1866 270.200 14594CO 16.20 0.2527 150.700 -O2 13.00 0.3373 186.50v -H2 6.34 2.1698 133.300 -
avan der Waals volumes Vvdw, ii were taken from Bondi [1964].
September, 2002
An Extension of the Group Contribution Model for Thermodynamic and Transport Properties of Dilute Gases 845
Korean J. Chem. Eng.(Vol. 19, No. 5)
Tabl
e2.
Dev
iatio
ns b
etw
een
expe
rimen
tal s
econ
d vi
rial c
oeffi
cien
ts a
nd v
isco
sitie
s, a
nd th
ose
calc
ulat
ed u
sing
the
grou
p pa
ram
eter
s o
btai
ned
in th
is s
tudy
Co
mpo
und
Nu
mbe
ro
f poi
ntsa
Ave
rag
e R
MS
D in
B (
cm3 m
ol− 1
)
Dat
a so
urce
Num
ber
of p
oint
sb
RA
D in
η (
%)
Dat
a so
urce
Pre
sent
stu
dyO
h &
Cam
pbe
llTs
onop
-ou
lou
sC
ampb
ell
Pre
sent
stu
dyO
h &
Cam
pbel
lLu
cas
No
rmal
alk
ane
s
A. R
egr
essi
on r
esul
ts:
Met
hane
28
23
31
[Dym
ond
et
al.,
1986
]31
2.9
4.4
3.1
[Ste
pha
n a
nd L
uca
s, 1
979]
Eth
ane
22
78
53
[Dym
ond
et
al.,
1986
]35
1.3
1.3
0.9
[Ste
pha
n a
nd L
uca
s, 1
979]
Pro
pan
e2
03
33
12[D
ymon
d e
t al
., 19
86]
292.
22
.63.
6[S
tep
han
and
Luc
as,
197
9]n
-but
ane
19
713
256
[Dym
ond
et
al.,
1986
]32
1.8
2.5
1.7
[Ste
pha
n a
nd L
uca
s, 1
979]
n-p
enta
ne
16
49
618
[Dym
ond
et
al.,
1986
]27
1.6
1.8
2.5
[Ste
pha
n a
nd L
uca
s, 1
979]
n-h
exan
e1
56
1628
26[A
l-Biz
reh
and
Wor
mal
d, 1
978
;D
i Zio
et a
l., 1
966
;S
trei
n et
al.,
19
71]
271.
21
.70.
8[S
tep
han
and
Luc
as,
197
9]
n-h
epta
ne
14
10
1017
7[D
ymon
d e
t al
., 19
86]
203.
43
.03.
4[S
tep
han
and
Luc
as,
197
9]n
-oct
ane
111
39
1714
[Dym
ond
et
al.,
1986
]23
5.3
5.2
4.1
[Ste
pha
n a
nd L
uca
s, 1
979]
Ave
rag
e6
812
102.
32
.72.
4B
ran
che
d a
lkan
es
A. R
egr
essi
on r
esul
ts:
2-m
ethy
lpro
pan
e11
1124
2837
[Das
et a
l., 1
973
]35
1.7
2.3
6.0
[Ste
pha
n a
nd L
uca
s, 1
979]
2-m
ethy
lbut
ane
78
1125
4[D
as e
t al.,
19
73]
92.
42
.03.
5[V
arga
ftik
, 19
75]
2,2
-dim
ethy
lpro
pane
10
43
36
[Dym
ond
an
d S
mith
, 198
0]
44.
72
.42.
3[L
amb
ert e
t al.,
19
55]
Ave
rag
e8
1318
182.
12
.35.
2B
. Pre
dict
ion
resu
lts:
2-m
ethy
lpen
tane
44
028
3836
[Wad
ding
sto
n et
al.,
19
49]
3-m
ethy
lpen
than
e4
39
4156
30[W
addi
ngst
on
et a
l., 1
949
]2
,3-d
imet
hylb
uth
ane
52
052
6523
[Wad
ding
sto
n et
al.,
19
49]
Ave
rag
e3
241
5428
Alk
ene
s
A. R
egr
essi
on r
esul
ts:
Eth
ylen
e9
16
21
-[D
ymon
d a
nd
Sm
ith, 1
980
]21
0.9
1.5
0.7
[Ste
pha
n a
nd L
uca
s, 1
979]
Pro
pyl
ene
81
04
1-
[Dym
ond
an
d S
mith
, 198
0]
290.
90
.61.
8[S
tep
han
and
Luc
as,
197
9]ci
s-2-
but
ene
52
116
33-
[Dym
ond
an
d S
mith
, 198
0]
tran
s-2
-but
ene
58
1225
-[D
ymon
d a
nd
Sm
ith, 1
980
]b
ut-1
-ene
12
118
9-
[Dym
ond
an
d S
mith
, 198
0]
pen
t-1-
ene
12
1112
85-
[Dym
ond
an
d S
mith
, 198
0]
hep
-1-e
ne1
01
914
33-
[Dym
ond
an
d S
mith
, 198
0]
oct
-1-e
ne11
18
1848
-[D
ymon
d a
nd
Sm
ith, 1
980
]A
vera
ge
14
1129
0.9
1.0
1.4
846 S.-K. Oh and C.-H. Sim
September, 2002
Tabl
e2.
Con
tinue
d
Co
mpo
und
Nu
mbe
ro
f poi
ntsa
Ave
rag
e R
MS
D in
B (
cm3 m
ol− 1
)
Dat
a so
urce
Num
ber
of p
oint
sb
RA
D in
η (
%)
Dat
a so
urce
Pre
sent
stu
dyO
h &
Com
pbe
llTs
onop
-o
ulou
sC
amp
bell
Pre
sent
stu
dyO
h &
Co
mp
bell
Luc
as
Gas
A. R
egr
essi
on r
esul
ts:
Nitr
oge
n9
1.1
1.0
1.9
0.5
[Dym
ond
an
d S
mith
, 198
0]
331.
42.
10.
7[S
tep
han
and
Luc
as,
197
9]C
arb
on d
ioxi
de
13
0.4
0.3
0.6
-[D
ymon
d a
nd
Sm
ith, 1
980
]25
2.0
1.8
2.5
[Ste
pha
n a
nd L
uca
s, 1
979]
Ca
rbon
mo
noxi
de1
20.
9-
2.2
-[D
ymon
d a
nd
Sm
ith, 1
980
]16
1.2
-1.
7[S
tep
han
and
Luc
as,
197
9]O
xyg
en11
2.0
-4.
2-
[Dym
ond
an
d S
mith
, 198
0]
462.
1-
1.8
[Ste
pha
n a
nd L
uca
s, 1
979]
Hyd
roge
n5
0.4
-4.
3-
[Dym
ond
an
d S
mith
, 198
0]
74.
5-
13.1
0[S
tep
han
and
Luc
as,
197
9]A
vera
ge
1.02.
01.
92.
3a N
um
ber
of d
ata
poi
nts
for
seco
nd v
irial
coe
ffici
ent.
b Nu
mbe
r of
dat
a p
oint
s fo
r vi
scos
ity.
Tabl
e3.
Dev
iatio
ns b
etw
een
pred
icte
d an
d ex
perim
enta
l sec
ond
viria
l cro
ss c
oeffi
cien
ts (h
ydro
carb
ons)
Mix
ture
sN
umbe
ro
f po
ints
Ave
rage
RM
SD
in B
(cm
3 mol
− 1)
Dat
a s
ourc
eP
rese
nt s
tud
yO
h &
Cam
pbe
llTs
onop
oulo
s co
rrel
atio
nC
am
pbel
lK
12=
0K
12≠ 0
Nor
mal
- n
orm
al a
lkan
esM
etha
ne-
etha
ne
1603
-1.
70.
6-
[McE
lroy
and
Fan
g, 1
994;
Sie
bert
an
d K
nobl
er, 1
983
;L
otfi
, 198
7]-
n-bu
tane
2106
0600
808
09[B
eatti
e e
t al.,
194
1;D
antz
ler
et a
l., 1
968;
Wo
rmal
d e
t al.,
19
79]
- n-
hexa
ne
101
012
026
0907
[Da
ntzl
er e
t al.,
196
8;
Wo
rmal
d e
t al.,
19
79]
- n-
octa
ne
0203
0302
915
12
[Wor
mal
d e
t al.,
197
9]-
n-de
cane
046
153
119
283
6[D
’Avi
la e
t al.,
197
6]
- n-
dode
cane
124
229
116
0405
[D’A
vila
et a
l., 1
976
]-
n-he
xad
ecan
e05
95
6922
532
33
[Ka
ul a
nd
Pra
usn
itz, 1
978
]-
n-ei
cosa
ne04
73
4318
911
09[K
aul
an
d P
raus
nitz
, 19
78]
Eth
ane
- n-
buta
ne07
24
1401
113
12
[Da
ntzl
er e
t al.,
196
8;
Wo
rmal
d e
t al.,
19
79]
- n-
hexa
ne
0708
0802
308
11[D
ant
zler
et a
l., 1
968
;W
orm
ald
et a
l., 1
979
]-
n-oc
tan
e02
0602
041
101
6[W
orm
ald
et a
l., 1
979]
- n-
hexa
dec
ane
038
331
308
253
9[D
aul
an
d P
raus
nitz
, 19
78]
- n-
eico
sane
0415
1097
341
482
7[D
aul
an
d P
raus
nitz
, 19
78]
An Extension of the Group Contribution Model for Thermodynamic and Transport Properties of Dilute Gases 847
Korean J. Chem. Eng.(Vol. 19, No. 5)
Tabl
e3.
Con
tinue
d
Mix
ture
sN
umb
erof
po
ints
Ave
rage
RM
SD
in B
(cm
3 mo
l− 1)
Dat
a so
urce
Pre
sent
stu
dy
Oh
& C
amp
bell
Tso
nop
oulo
s co
rrel
atio
nC
ampb
ell
K1
2=
0K
12≠ 0
Pro
pan
e-
n-h
exa
ne07
0504
023
0506
[Dan
tzle
r et
al.,
196
8;W
orm
ald
et a
l., 1
979
]-
n-h
epta
ne
031
31
201
21
51
3[W
orm
ald
et a
l., 1
979
]B
utan
e-
n-h
exa
ne08
13
1102
111
18
[Dan
tzle
r et
al.,
196
8;W
orm
ald
et a
l., 1
979
]-
n-o
ctan
e03
0606
020
12
09[W
orm
ald
et a
l., 1
979
]B
ran
ched
- n
orm
al a
lkan
es
Met
han
e-
2-m
ethy
lpro
pan
e07
0706
010
0605
[Gun
n, 1
958
]-
2-m
ethy
lbu
tan
e03
24
16
039
22
24
[Pec
sok
and
Win
dsor
, 196
8;M
ason
an
d E
akin
, 196
1]-
2-m
ethy
lpen
tane
026
96
606
76
86
6[P
ecso
k an
d W
inds
or, 1
968]
- 2
,2,5
-trim
eth
ylhe
xane
043
53
71
245
33
8[D
’Avi
la e
t al.,
197
6]-
2,2
-dim
eth
ylpr
opan
e36
20
16
032
14
13
[Str
ein
et a
l.,1
971
;H
aman
n et
al.,
195
5;B
ellm
et a
l., 1
974;
Bau
ghm
an e
t al.,
19
75]
- 2
,2-d
imet
hyl
buta
ne
021
41
305
32
01
3[P
ecso
k an
d W
inds
or, 1
968]
- sq
uala
ne02
1330
1070
686
2680
69
[Kau
l and
Pra
usn
itz, 1
978]
Eth
ane
- sq
uala
ne02
2650
2190
1170
056
9015
80[K
aul a
nd P
rau
snitz
, 197
8]A
lken
es
- n
orm
al a
lkan
es
Eth
ylen
e-
met
han
e18
0508
011
10
-[M
aso
n an
d E
akin
, 196
1;M
cMat
h a
nd
Ed
mis
ter,
196
9;L
ee a
nd E
dmis
ter,
1970
;L
ee, 1
976
]-
n-h
exa
deca
ne
037
57
42
9711
-[K
aul a
nd P
rau
snitz
, 197
8]P
rop
ylen
e-
etha
ne04
0102
004
04-
[Gun
n, 1
958
]-
pro
pan
e01
18
19
013
14
-[M
aso
n an
d E
akin
, 196
1]-
n-b
utan
e01
041
30.
505
-[M
aso
n an
d E
akin
, 196
1]
848 S.-K. Oh and C.-H. Sim
ns
pre-
ble0]).fortane)997]sec-cor-
er-aluesweenfromanected themayima-
theved the
in-alue
inedch by
renner.
Data used here for the functional group parameter evaluations andpredictions of thermodynamic properties and dilute gas transportproperties for pure gases and mixtures are discussed below.
RESULTS AND DISCUSSION
1. Normal AlkanesFor the determination of group parameters αii, βii and a*ii for the
CH2 and CH3 groups, second virial coefficient and viscosity dataof pure alkanes from ethane through n-octane were simultaneouslyregressed. The van der Waals volume constant ξ, evaluated in thisregression, was used in all subsequent calculations and evaluations.It should also be noted that the group interaction parameter kij ,gc wasassumed to be zero for all interactions between hydrocarbon groups.Methane was considered to consist of a single CH4 group and pa-rameters αii, βii and a*ii for the CH4 group were evaluated from sec-ond virial coefficient and viscosity data for pure methane.
Tsonopoulos et al. [1989] made extensive analysis for C4-C6 al-kanes from earlier recommendation proposed by Dymond et al.[1986]. Subsequently, the 1989 re-analysis was updated for C4-C8
alkanes by Tsonopoulos and Dymond [1997]. A more recent criti-cal analysis of the data has been considered prior to this parameterestimation. Among C4-C8 alkanes recommended by the 1997 an-alysis, data for n-pentane are determined to be less reliable than theprevious ones from the preliminary regression results, and thereforesecond virial coefficient data for n-pentane were not replaced forbetter evaluations. Since the recommended values for normal hexane[Dymond et al., 1986] did not appear to us to be consistent withthose of the other n-alkanes, smoothed values proposed by Tso-nopoulos et al. [1989] were used instead. Consequently, data foronly four alkanes (methane, ethane, propane and pentane), recom-mended by the compilation of Dymond et al. [1986], were equiva-lent to those used in the previous work [Oh and Campbell, 1997].All viscosity data used here were taken from Stephan and Lucas[1979].
The parameter βii for the CH4 group was assumed a priori to bezero since methane molecules are essentially spherical. The 95 per-cent confidence region for βii of the CH3 group bracketed zero so itwas set to zero and the regression was repeated to obtain values ofthe other parameters.
The group parameters were obtained using a non-linear least squareparameter estimation program based on the Levenberg-Marguardt al-gorithm supplied by IMSL stat library. Each data point was weight-ed by its estimated experimental uncertainty.
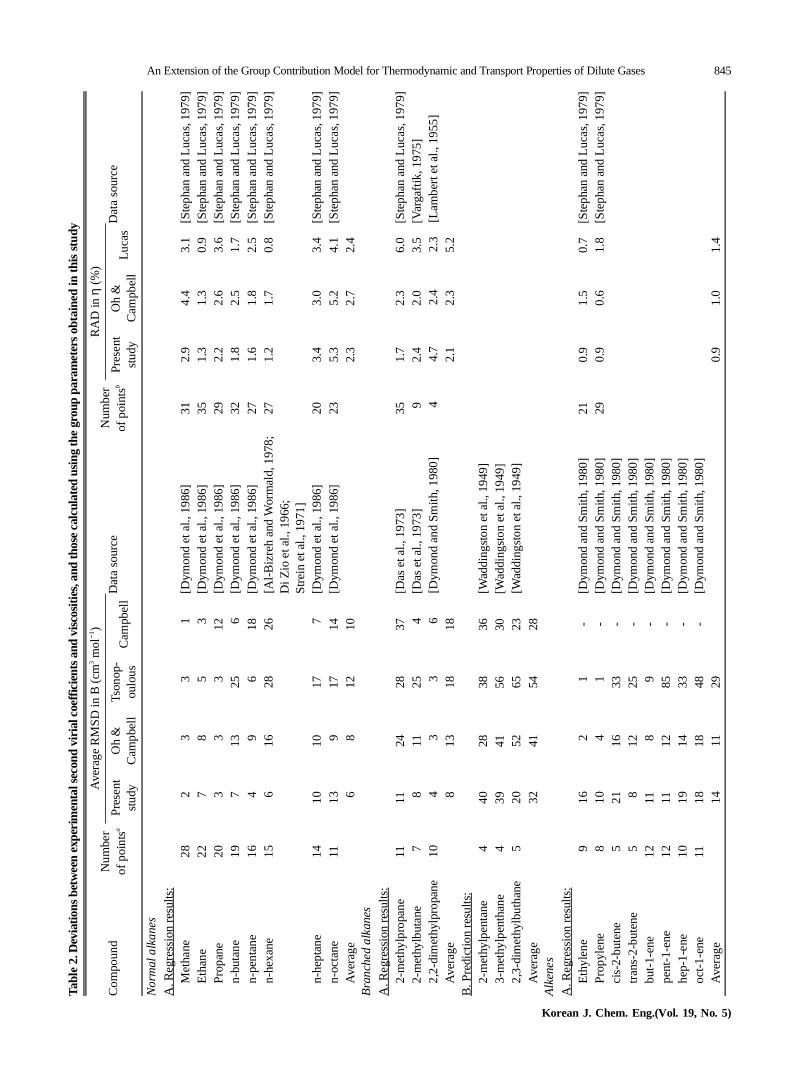
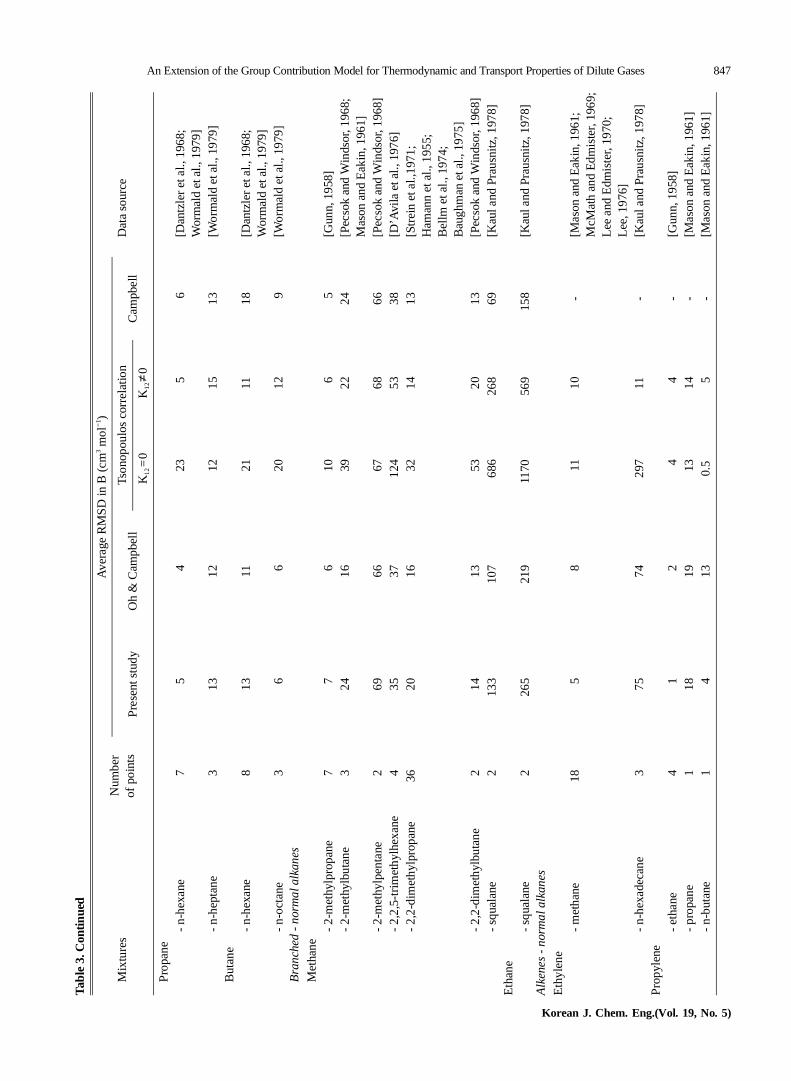
Resulting parameter values for the CH2, CH3 and CH4 groupsare given in Table 1 and the sources of data used are indicated inTable 2. Resulting deviations between experimental and calculatedsecond virial coefficients and viscosities for n-alkanes up to n-octane,along with previous work of the author, are given in Table 2. Alsoincluded is a comparison of the present model to the Tsonopouloscorrelation for second virial coefficient [Tsonopoulos, 1974] andthe Lucas method for dilute gas viscosity [Lucas, 1980], which re-quire the critical temperature and pressure of the pure species in ques-tion. The results from Campbell [1989] listed in Table 2 are the samegroup contribution model applied here except that parameters wereobtained only from second virial coefficient data. The predictionresults obtained here are also compared to those of both Oh and
Campbell [1997] and of Tsonopoulos, showing better predictioof average deviation of 6 cm3 mol−1 than 8 cm3 mol−1 and 12 cm3
mol−1 on a RMS (root mean square) basis, respectively. For thedictions of viscosity of pure normal alkanes, resulting deviations of2.3% in RAD (relative average deviation) basis is quite comparato other two methods (Oh and Campbell [1997] and Lucas [198
With the exception that a different set of second virial data pure normal alkanes (normal butane, hexane, heptane and ocis used in regression, both this method and the previous work [1are identical. The present study provides lower deviations for ond virial coefficients because our previous works evaluated responding parameters from a slightly different data base.
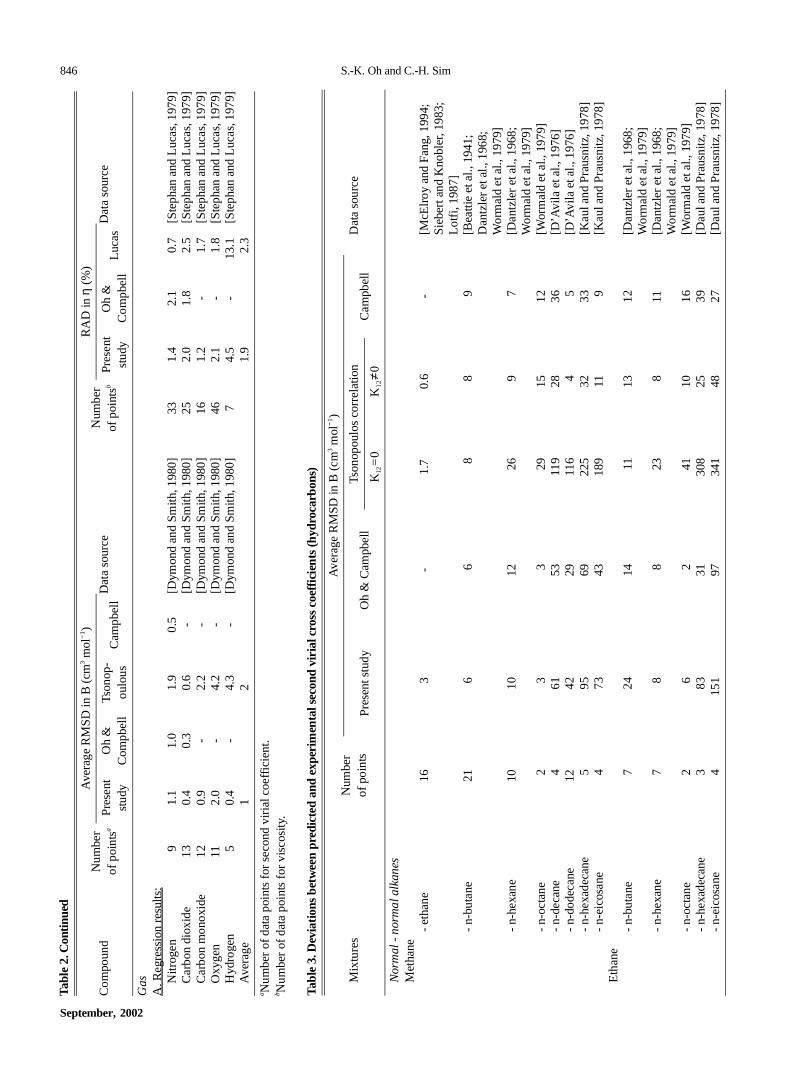
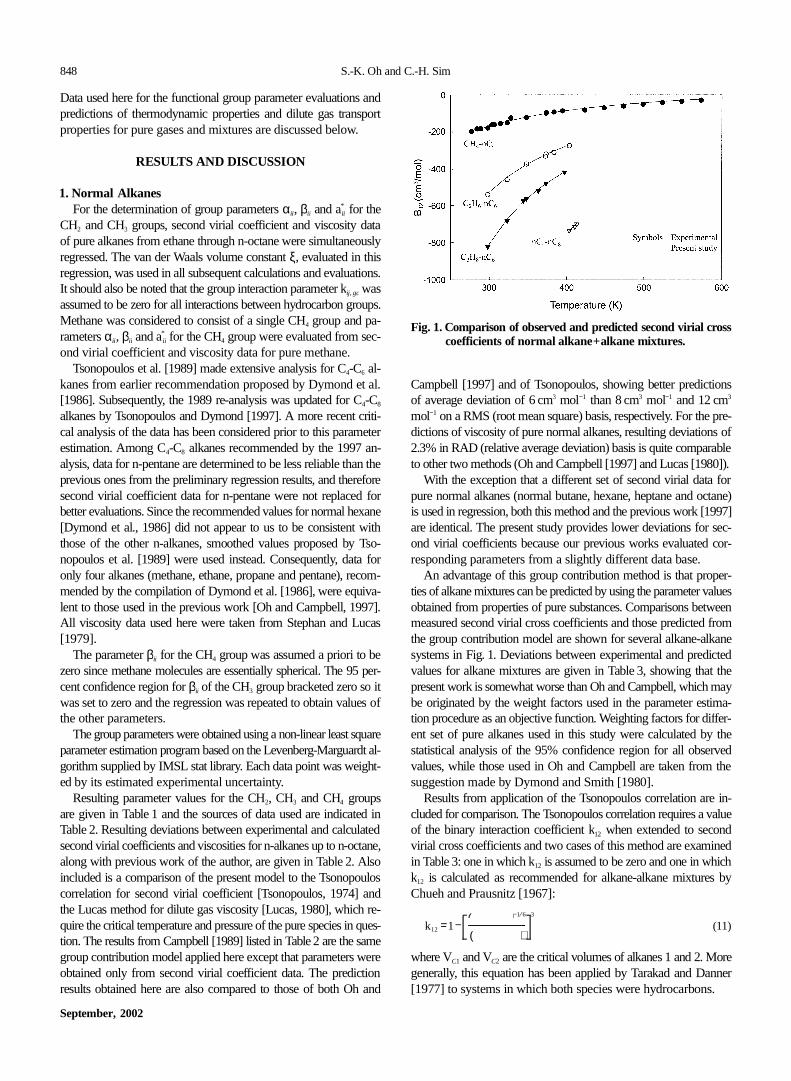
An advantage of this group contribution method is that propties of alkane mixtures can be predicted by using the parameter vobtained from properties of pure substances. Comparisons betmeasured second virial cross coefficients and those predicted the group contribution model are shown for several alkane-alksystems in Fig. 1. Deviations between experimental and predivalues for alkane mixtures are given in Table 3, showing thatpresent work is somewhat worse than Oh and Campbell, which be originated by the weight factors used in the parameter esttion procedure as an objective function. Weighting factors for differ-ent set of pure alkanes used in this study were calculated bystatistical analysis of the 95% confidence region for all observalues, while those used in Oh and Campbell are taken fromsuggestion made by Dymond and Smith [1980].
Results from application of the Tsonopoulos correlation arecluded for comparison. The Tsonopoulos correlation requires a vof the binary interaction coefficient k12 when extended to secondvirial cross coefficients and two cases of this method are examin Table 3: one in which k12 is assumed to be zero and one in whik12 is calculated as recommended for alkane-alkane mixturesChueh and Prausnitz [1967]:
(11)
where VC1 and VC2 are the critical volumes of alkanes 1 and 2. Mogenerally, this equation has been applied by Tarakad and Da[1977] to systems in which both species were hydrocarbons
k12 = 1− 2VC1VC2( )1 6⁄
VC11 3⁄
+ VC21 3⁄( )
-----------------------------3
Fig. 1. Comparison of observed and predicted second virial crosscoefficients of normal alkane+alkane mixtures.
September, 2002
An Extension of the Group Contribution Model for Thermodynamic and Transport Properties of Dilute Gases 849
htlyitiesodarybe vis- dif-wnupata
rom.
d al-d
]
The group contribution model does not require interaction coef-ficients for this type of symmetric mixture and it is observed, formixtures where the size difference between two alkanes is small,to be comparable in accuracy to the Tsonopoulos correlation withbinary interaction coefficients calculated from Eq. (11). As the sizedifference increases, the present study becomes somewhat less ac-curate than the Tsonopoulos correlation with k12≠0, but is much moreaccurate than the Tsonopoulos correlation with k12=0.
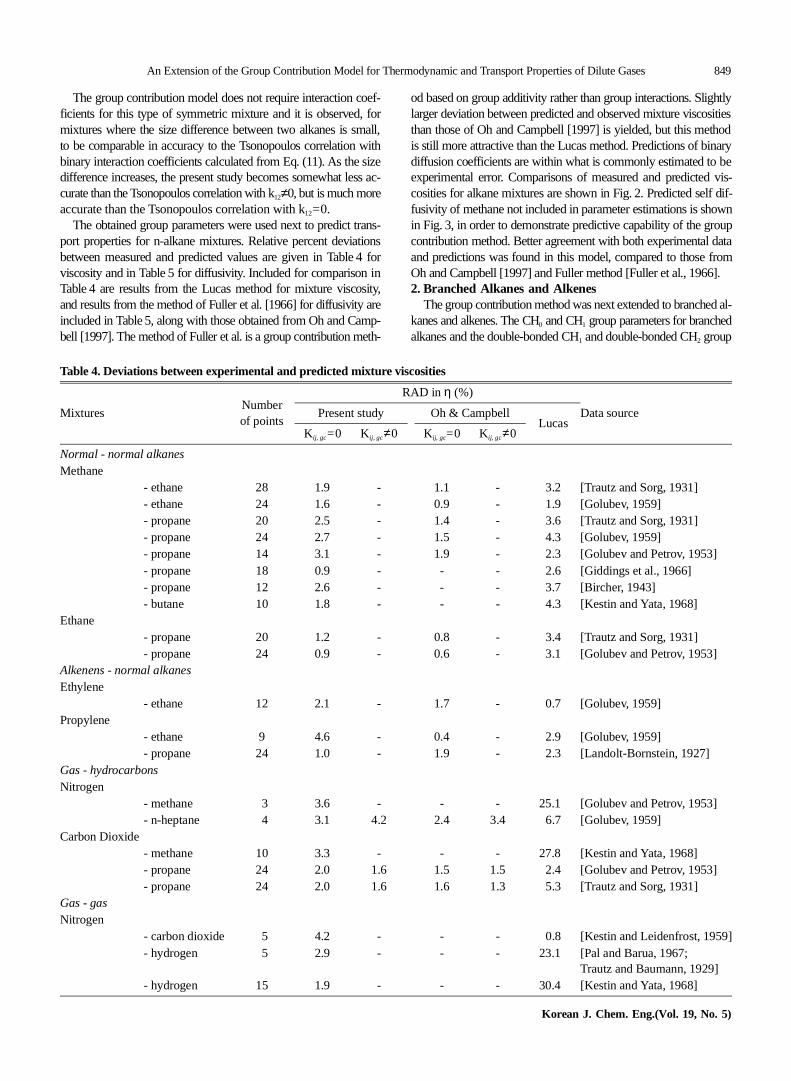
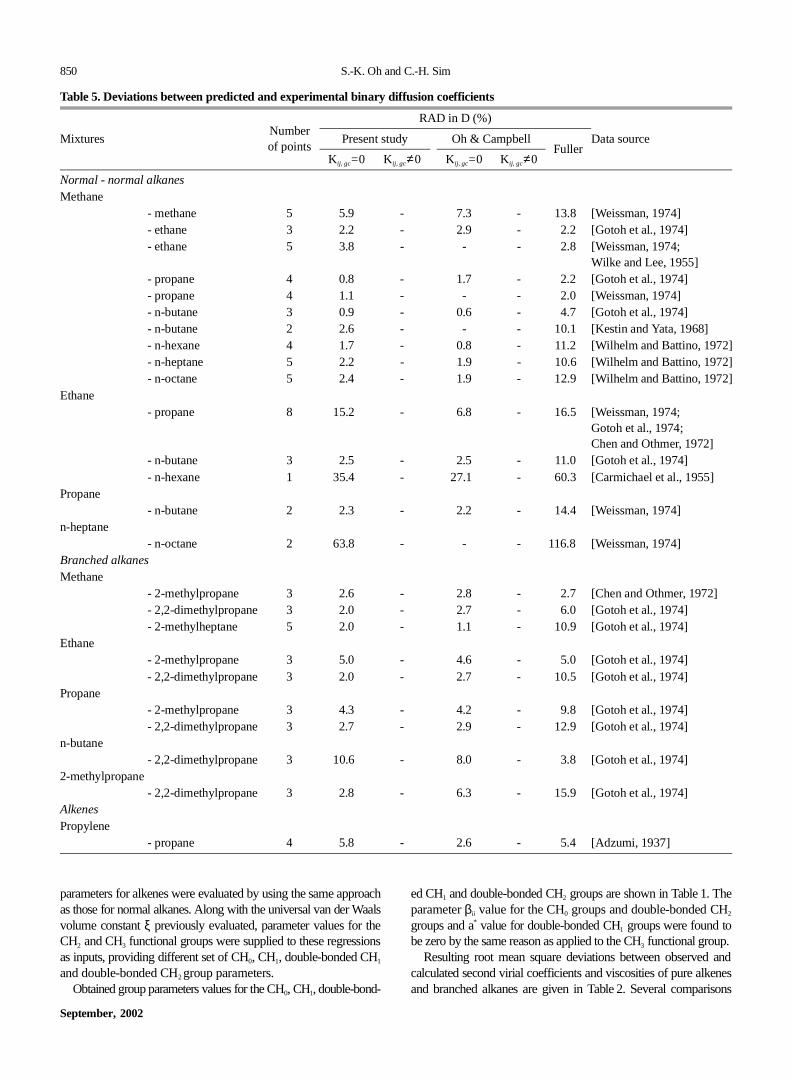
The obtained group parameters were used next to predict trans-port properties for n-alkane mixtures. Relative percent deviationsbetween measured and predicted values are given in Table 4 forviscosity and in Table 5 for diffusivity. Included for comparison inTable 4 are results from the Lucas method for mixture viscosity,and results from the method of Fuller et al. [1966] for diffusivity areincluded in Table 5, along with those obtained from Oh and Camp-bell [1997]. The method of Fuller et al. is a group contribution meth-
od based on group additivity rather than group interactions. Sliglarger deviation between predicted and observed mixture viscosthan those of Oh and Campbell [1997] is yielded, but this methis still more attractive than the Lucas method. Predictions of bindiffusion coefficients are within what is commonly estimated to experimental error. Comparisons of measured and predictedcosities for alkane mixtures are shown in Fig. 2. Predicted selffusivity of methane not included in parameter estimations is shoin Fig. 3, in order to demonstrate predictive capability of the grocontribution method. Better agreement with both experimental dand predictions was found in this model, compared to those fOh and Campbell [1997] and Fuller method [Fuller et al., 1966]2. Branched Alkanes and Alkenes
The group contribution method was next extended to branchekanes and alkenes. The CH0 and CH1 group parameters for branchealkanes and the double-bonded CH1 and double-bonded CH2 group
Table 4. Deviations between experimental and predicted mixture viscosities
MixturesNumberof points
RAD in η (%)
Data sourcePresent study Oh & CampbellLucas
K ij, gc=0 Kij , gc≠0 Kij, gc=0 Kij, gc≠0
Normal - normal alkanesMethane
- ethane 28 1.9 - 1.1 - 3.2 [Trautz and Sorg, 1931]- ethane 24 1.6 - 0.9 - 1.9 [Golubev, 1959]- propane 20 2.5 - 1.4 - 3.6 [Trautz and Sorg, 1931]- propane 24 2.7 - 1.5 - 4.3 [Golubev, 1959]- propane 14 3.1 - 1.9 - 2.3 [Golubev and Petrov, 1953]- propane 18 0.9 - - - 2.6 [Giddings et al., 1966]- propane 12 2.6 - - - 3.7 [Bircher, 1943]- butane 10 1.8 - - - 4.3 [Kestin and Yata, 1968]
Ethane- propane 20 1.2 - 0.8 - 3.4 [Trautz and Sorg, 1931]- propane 24 0.9 - 0.6 - 3.1 [Golubev and Petrov, 1953]
Alkenens - normal alkanesEthylene
- ethane 12 2.1 - 1.7 - 0.7 [Golubev, 1959]Propylene
- ethane 9 4.6 - 0.4 - 2.9 [Golubev, 1959]- propane 24 1.0 - 1.9 - 2.3 [Landolt-Bornstein, 1927]
Gas - hydrocarbonsNitrogen
- methane 03 3.6 - - - 25.10 [Golubev and Petrov, 1953]- n-heptane 04 3.1 4.2 2.4 3.4 6.7 [Golubev, 1959]
Carbon Dioxide- methane 10 3.3 - - - 27.80 [Kestin and Yata, 1968]- propane 24 2.0 1.6 1.5 1.5 2.4 [Golubev and Petrov, 1953]- propane 24 2.0 1.6 1.6 1.3 5.3 [Trautz and Sorg, 1931]
Gas - gasNitrogen
- carbon dioxide 05 4.2 - - - 0.8 [Kestin and Leidenfrost, 1959- hydrogen 05 2.9 - - - 23.10 [Pal and Barua, 1967;
Trautz and Baumann, 1929]- hydrogen 15 1.9 - - - 30.40 [Kestin and Yata, 1968]
Korean J. Chem. Eng.(Vol. 19, No. 5)
850 S.-K. Oh and C.-H. Sim
e
andnesisons
parameters for alkenes were evaluated by using the same approachas those for normal alkanes. Along with the universal van der Waalsvolume constant ξ previously evaluated, parameter values for theCH2 and CH3 functional groups were supplied to these regressionsas inputs, providing different set of CH0, CH1, double-bonded CH1and double-bonded CH2 group parameters.
Obtained group parameters values for the CH0, CH1, double-bond-
ed CH1 and double-bonded CH2 groups are shown in Table 1. Thparameter βii value for the CH0 groups and double-bonded CH2
groups and a* value for double-bonded CH1 groups were found tobe zero by the same reason as applied to the CH3 functional group.
Resulting root mean square deviations between observedcalculated second virial coefficients and viscosities of pure alkeand branched alkanes are given in Table 2. Several compar
Table 5. Deviations between predicted and experimental binary diffusion coefficients
MixturesNumberof points
RAD in D (%)
Data sourcePresent study Oh & CampbellFuller
K ij , gc=0 Kij , gc≠0 Kij , gc=0 Kij, gc≠0
Normal - normal alkanesMethane
- methane 5 5.9 - 7.3 - 13.80 [Weissman, 1974]- ethane 3 2.2 - 2.9 - 2.2 [Gotoh et al., 1974]- ethane 5 3.8 - - - 2.8 [Weissman, 1974;
Wilke and Lee, 1955]- propane 4 0.8 - 1.7 - 2.2 [Gotoh et al., 1974]- propane 4 1.1 - - - 2.0 [Weissman, 1974]- n-butane 3 0.9 - 0.6 - 4.7 [Gotoh et al., 1974]- n-butane 2 2.6 - - - 10.10 [Kestin and Yata, 1968]- n-hexane 4 1.7 - 0.8 - 11.20 [Wilhelm and Battino, 1972]- n-heptane 5 2.2 - 1.9 - 10.60 [Wilhelm and Battino, 1972]- n-octane 5 2.4 - 1.9 - 12.90 [Wilhelm and Battino, 1972]
Ethane- propane 8 15.20 - 6.8 - 16.50 [Weissman, 1974;
Gotoh et al., 1974;Chen and Othmer, 1972]
- n-butane 3 2.5 - 2.5 - 11.00 [Gotoh et al., 1974]- n-hexane 1 35.40 - 27.10 - 60.30 [Carmichael et al., 1955]
Propane- n-butane 2 2.3 - 2.2 - 14.40 [Weissman, 1974]
n-heptane- n-octane 2 63.80 - - - 116.800[Weissman, 1974]
Branched alkanesMethane
- 2-methylpropane 3 2.6 - 2.8 - 2.7 [Chen and Othmer, 1972]- 2,2-dimethylpropane 3 2.0 - 2.7 - 6.0 [Gotoh et al., 1974]- 2-methylheptane 5 2.0 - 1.1 - 10.90 [Gotoh et al., 1974]
Ethane- 2-methylpropane 3 5.0 - 4.6 - 5.0 [Gotoh et al., 1974]- 2,2-dimethylpropane 3 2.0 - 2.7 - 10.50 [Gotoh et al., 1974]
Propane- 2-methylpropane 3 4.3 - 4.2 - 9.8 [Gotoh et al., 1974]- 2,2-dimethylpropane 3 2.7 - 2.9 - 12.90 [Gotoh et al., 1974]
n-butane- 2,2-dimethylpropane 3 10.60 - 8.0 - 3.8 [Gotoh et al., 1974]
2-methylpropane- 2,2-dimethylpropane 3 2.8 - 6.3 - 15.90 [Gotoh et al., 1974]
AlkenesPropylene
- propane 4 5.8 - 2.6 - 5.4 [Adzumi, 1937]
September, 2002
An Extension of the Group Contribution Model for Thermodynamic and Transport Properties of Dilute Gases 851
nd) arerevi-ntri-put
ivent
vis-oseereodpbellane,rse
;
]
3]]]953]
955]]
]
]
between measured and predicted second virial coefficients for branch-ed alkanes are also included in this table. Second virial coefficientand viscosity data for pure branched alkanes and alkenes are equiv-alent to those used in the previous work Oh and Campbell [1997].It is indicated that the group contribution method is comparable toboth the previous work and the Tsonopoulos [1974] method forsecond virial coefficient, and to the Lucas method [Lucas, 1980]for viscosity.
In order to show predictive capabilities, the obtained group pa-rameters were next used to predict second virial cross coefficients,mixture viscosities, and binary diffusion coefficients for mixturesof normal and branched alkanes and mixtures of alkenes with nor-mal alkanes. Table 3 shows deviations between predicted and ob-served second virial cross coefficients. The group contribution modelis observed to be as accurate as the Tsonopoulos correlation withk12 evaluated from Eq. (11) and is almost identical to the results of
Oh and Campbell [1997].As shown in Table 3, the results for mixtures of methane a
ethane with squalane (2,6,10,15,19,23 hexamethyltetracosaneof particular interest, showing the same comments as those in pous works. This comments point to an advantage of group cobution methods in which critical properties are not required as indata.
Deviations between measured and predicted properties are gfor mixture viscosity in Table 4 and for binary diffusion coefficienin Table 5. Comparison with observed and calculated mixture cosity for propylene-propane mixture was made in Fig. 4, while thof diffusion coefficients for methane-branched alkane mixtures wfound in Fig. 5. In Fig. 4, calculated values by the Lucas methare higher than the observed data and those by Oh and Camare lower than the observed ones for all mole fractions of propshowing the overall bias. And the present work is becoming wo
Table 5. Continued
MixturesNumber of
points0
RAD in D (%)
Data sourcePresent study Oh & CampbellFuller
K ij, gc=0 Kij, gc≠0 Kij , gc=0 Kij , gc≠0
Gas - hydrocarbonsNitrogen
- n-butane 4 3.7 0.9 5.0 2.0 2.0 [Gotoh et al., 1974]- n-heptane 4 4.4 0.7 5.5 1.4 2.4 [Fuller et al., 1966;
McD. Cummings et al., 1955;McD. Cummings and Ubbelohde, 1955Clarke and Ubbelohde, 1957]
- n-octane 2 9.1 4.6 10.00 5.9 2.1 [McD. Cummings et al., 1955;McD. Cummings and Ubbelohde, 1955
- n-nonane 1 3.0 8.1 1.9 6.6 9.4 [McD. Cummings et al., 1955]- n-decane 1 6.8 12.20 5.0 5.3 7.2 [McD. Cummings and Ubbelohde, 195- n-dodecane 1 5.8 11.20 5.8 10.50 11.40 [McD. Cummings and Ubbelohde, 1953- 2-methylpropane 1 5.4 6.8 - - 10.10 [McD. Cummings and Ubbelohde, 1953- 2,3-dimethylbutane 1 4.9 3.3 6.1 3.9 0.4 [McD. Cummings and Ubbelohde, 1- 2,4-dimethylpentane 1 3.8 1.6 4.9 2.4 1.5 [Clarke and Ubbelohde, 1957]- 2,2,4-trimethylpentane 3 5.3 3.9 6.7 5.5 1.1 [McD. Cummings and Ubbelohde, 1- 2,3,3-trimethylheptane 1 21.20 23.80 20.40 22.80 25.40 [McD. Cummings and Ubbelohde, 1955
Carbon Dioxide- methane 2 5.1 - - - 4.0 [Kestin and Yata, 1968]- propane 5 8.7 3.9 8.6 3.7 3.2 [Wall and Kidder, 1946]- propane 1 8.4 2.9 - - 7.3 [Fuller et al., 1966]- propane 1 8.7 3.3 - - 7.0 [Wilke and Lee, 1955]
Oxygen- hexane 2 9.4 0.0 - - 3.2 [Fuller et al., 1966;
McD. Cummings and Ubbelohde, 1955- octane 2 9.1 0.0 - - 2.7 [Fuller et al., 1966;
McD. Cummings and Ubbelohde, 1955Gas - gasNitrogen
- carbon dioxide 1 12.40 - - - 3.0 [Walker and Westenberg, 1958]- carbon monoxide 1 7.5 - - - 4.2 [Amdur and Shuler, 1963]- hydrogen 2 3.0 - - - 3.2 [Kestin and Yata, 1968]- hydrogen 2 7.9 - - - 0.7 [Scott and Cox, 1960]
Korean J. Chem. Eng.(Vol. 19, No. 5)
852 S.-K. Oh and C.-H. Sim
.
ole-
ated di-
tersl co-om are
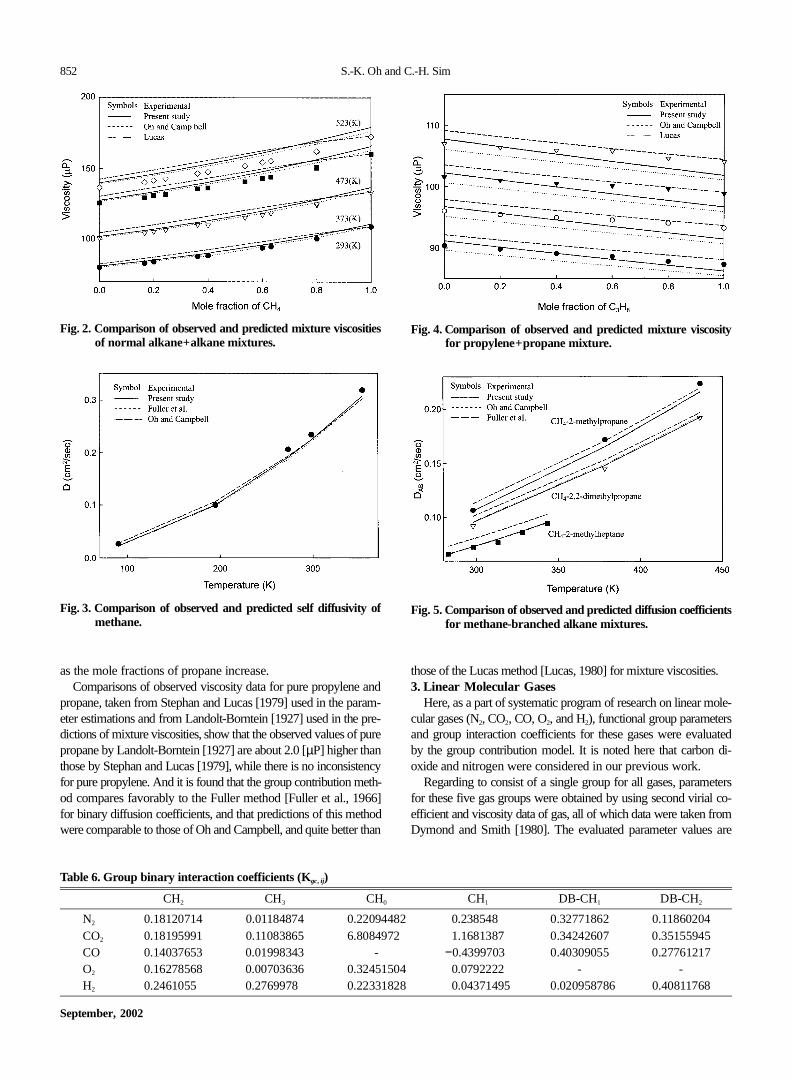
as the mole fractions of propane increase.Comparisons of observed viscosity data for pure propylene and
propane, taken from Stephan and Lucas [1979] used in the param-eter estimations and from Landolt-Borntein [1927] used in the pre-dictions of mixture viscosities, show that the observed values of purepropane by Landolt-Borntein [1927] are about 2.0 [µP] higher thanthose by Stephan and Lucas [1979], while there is no inconsistencyfor pure propylene. And it is found that the group contribution meth-od compares favorably to the Fuller method [Fuller et al., 1966]for binary diffusion coefficients, and that predictions of this methodwere comparable to those of Oh and Campbell, and quite better than
those of the Lucas method [Lucas, 1980] for mixture viscosities3. Linear Molecular Gases
Here, as a part of systematic program of research on linear mcular gases (N2, CO2, CO, O2, and H2), functional group parametersand group interaction coefficients for these gases were evaluby the group contribution model. It is noted here that carbonoxide and nitrogen were considered in our previous work.
Regarding to consist of a single group for all gases, paramefor these five gas groups were obtained by using second viriaefficient and viscosity data of gas, all of which data were taken frDymond and Smith [1980]. The evaluated parameter values
Fig. 5. Comparison of observed and predicted diffusion coefficientsfor methane-branched alkane mixtures.
Table 6. Group binary interaction coefficients (Kgc, ij)
CH2 CH3 CH0 CH1 DB-CH1 DB-CH2
N2 0.18120714 0.01184874 0.22094482 0.2385480 0.32771862 0.11860204CO2 0.18195991 0.11083865 6.80849720 1.1681387 0.34242607 0.35155945CO 0.14037653 0.01998343 - −0.43997030 0.40309055 0.27761217O2 0.16278568 0.00703636 0.32451504 0.0792222 - -H2 0.24610550 0.27699780 0.22331828 00.04371495 00.020958786 0.40811768
Fig. 4. Comparison of observed and predicted mixture viscosityfor propylene+propane mixture.
Fig. 2. Comparison of observed and predicted mixture viscositiesof normal alkane+alkane mixtures.
Fig. 3. Comparison of observed and predicted self diffusivity ofmethane.
September, 2002
An Extension of the Group Contribution Model for Thermodynamic and Transport Properties of Dilute Gases 853
.3%ork
pre-arythatas- andsitynt,
res
]
;
also included in Table 1. With the exception of carbon dioxide, thepotential well depth for all gas groups was assumed independentof temperature since the molecule is essentially spherical. Regres-sion results proved it, as expected. Table 2 presents resulting de-viations between calculated and experimental second virial coeffi-cients and viscosities for five gases (pure nitrogen, carbon dioxide,carbon monoxide, oxygen, and hydrogen). As shown in Table 2,average root mean square deviation of second virial coefficientsfor five pure gases was 1 cm3 mol−1 and 2 cm3 mol−1 for this meth-od and for Tsonopoulos, respectively. For the predictions of viscos-ity, percent relative average deviation between observed and pre-
dicted pure viscosities of linear molecular gases were 1.9% and 2by this method and by Lucas, respectively, indicating that this wis more reliable than the Lucas method.
The obtained group parameters for gases were then used todict second virial cross coefficients, mixture viscosities, and bindiffusion coefficients for gas-gas mixtures. It is assumed here group binary interaction coefficients are equal to zero for all ggas mixtures. Resulting deviations between experimental datapredictions are shown in Tables 4, 5 and 7 for mixture viscoand binary diffusion coefficient, and second virial cross coefficiein order.
Table 7. Deviations between calculated and experimental second virial cross coefficients for gas-hydrocarbon and gas-gas mixtu
MixturesNumberof points
Average RMSD in B (cm3 mol−1)
Data sourcePresent study Oh & Campbell Tsonopoulos
K ij , gc=0 Kij , gc≠0 Kij , gc=0 Kij , gc≠0 Kij =0 Kij ≠0
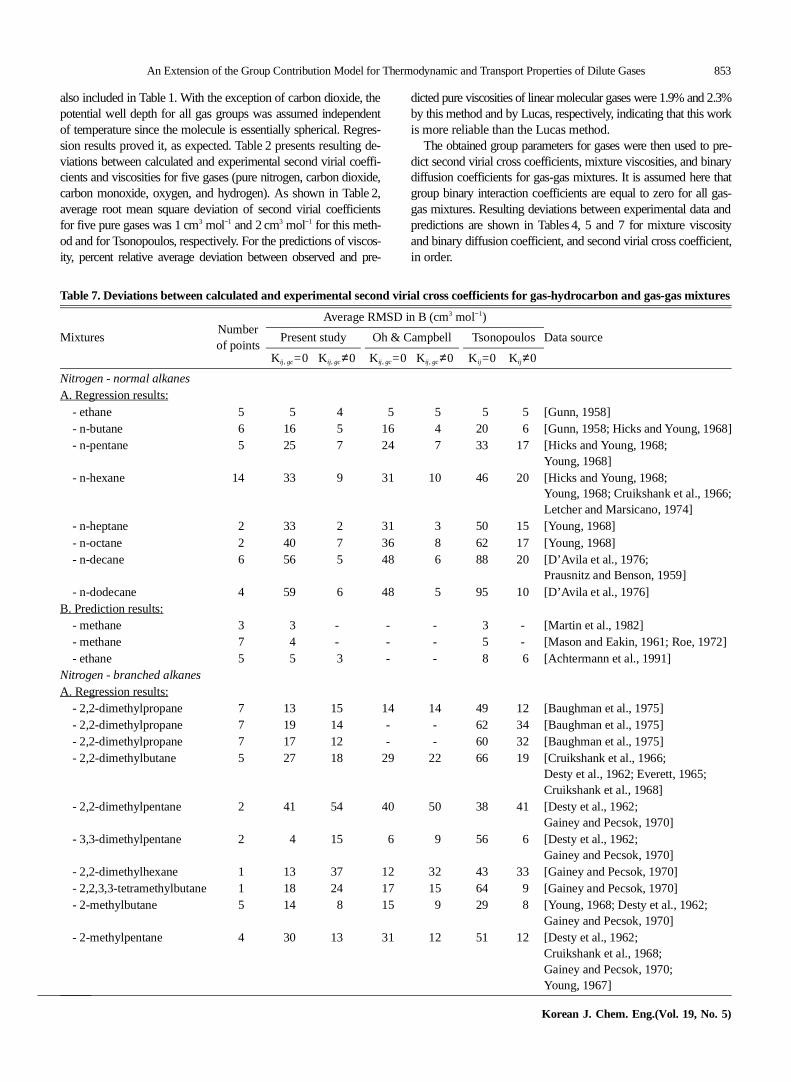
Nitrogen - normal alkanesA. Regression results:
- ethane 05 05 04 05 05 05 05 [Gunn, 1958]- n-butane 06 16 05 16 04 20 06 [Gunn, 1958; Hicks and Young, 1968- n-pentane 05 25 07 24 07 33 17 [Hicks and Young, 1968;
Young, 1968]- n-hexane 14 33 09 31 10 46 20 [Hicks and Young, 1968;
Young, 1968; Cruikshank et al., 1966Letcher and Marsicano, 1974]
- n-heptane 02 33 02 31 03 50 15 [Young, 1968]- n-octane 02 40 07 36 08 62 17 [Young, 1968]- n-decane 06 56 05 48 06 88 20 [D’Avila et al., 1976;
Prausnitz and Benson, 1959]- n-dodecane 04 59 06 48 05 95 10 [D’Avila et al., 1976]
B. Prediction results:- methane 03 03 - - - 03 - [Martin et al., 1982]- methane 07 04 - - - 05 - [Mason and Eakin, 1961; Roe, 1972]- ethane 05 05 03 - - 08 06 [Achtermann et al., 1991]
Nitrogen - branched alkanesA. Regression results:
- 2,2-dimethylpropane 07 13 15 14 14 49 12 [Baughman et al., 1975]- 2,2-dimethylpropane 07 19 14 - - 62 34 [Baughman et al., 1975]- 2,2-dimethylpropane 07 17 12 - - 60 32 [Baughman et al., 1975]- 2,2-dimethylbutane 05 27 18 29 22 66 19 [Cruikshank et al., 1966;
Desty et al., 1962; Everett, 1965;Cruikshank et al., 1968]
- 2,2-dimethylpentane 02 41 54 40 50 38 41 [Desty et al., 1962;Gainey and Pecsok, 1970]
- 3,3-dimethylpentane 02 04 15 06 09 56 06 [Desty et al., 1962;Gainey and Pecsok, 1970]
- 2,2-dimethylhexane 01 13 37 12 32 43 33 [Gainey and Pecsok, 1970]- 2,2,3,3-tetramethylbutane 01 18 24 17 15 64 09 [Gainey and Pecsok, 1970]- 2-methylbutane 05 14 08 15 09 29 08 [Young, 1968; Desty et al., 1962;
Gainey and Pecsok, 1970]- 2-methylpentane 04 30 13 31 12 51 12 [Desty et al., 1962;
Cruikshank et al., 1968;Gainey and Pecsok, 1970;Young, 1967]
Korean J. Chem. Eng.(Vol. 19, No. 5)
854 S.-K. Oh and C.-H. Sim
ltingeth-ialow
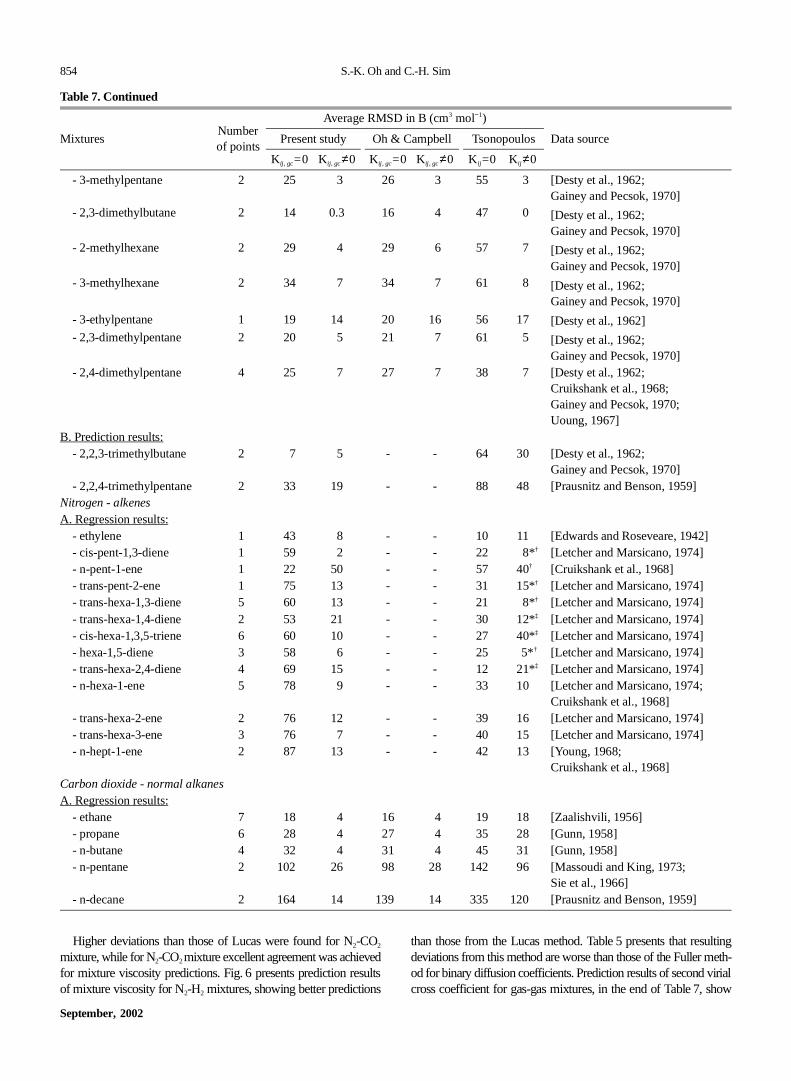
Higher deviations than those of Lucas were found for N2-CO2
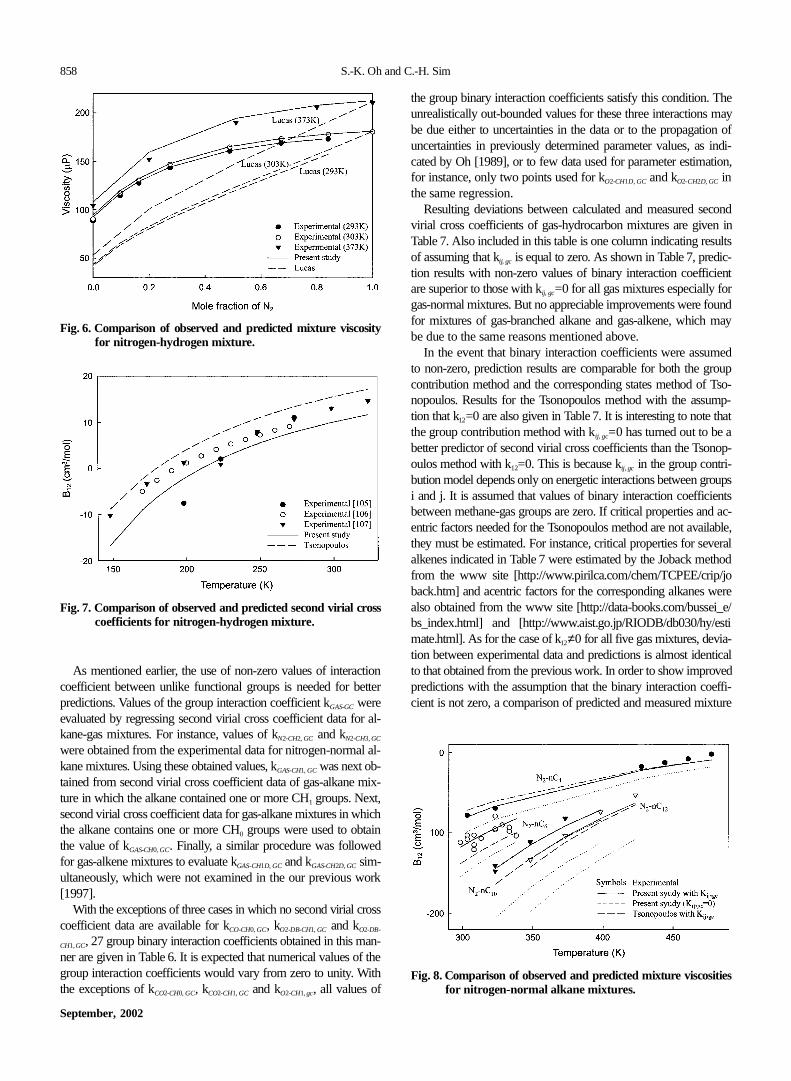
mixture, while for N2-CO2 mixture excellent agreement was achievedfor mixture viscosity predictions. Fig. 6 presents prediction resultsof mixture viscosity for N2-H2 mixtures, showing better predictions
than those from the Lucas method. Table 5 presents that resudeviations from this method are worse than those of the Fuller mod for binary diffusion coefficients. Prediction results of second vircross coefficient for gas-gas mixtures, in the end of Table 7, sh
Table 7. Continued
MixturesNumberof points
Average RMSD in B (cm3 mol−1)
Data sourcePresent study Oh & Campbell Tsonopoulos
K ij , gc=0 Kij , gc≠0 Kij , gc=0 Kij , gc≠0 Kij =0 Kij ≠0
- 3-methylpentane 02 25 03 26 03 55 03 [Desty et al., 1962;Gainey and Pecsok, 1970]
- 2,3-dimethylbutane 02 14 0.3 16 04 47 00 [Desty et al., 1962;Gainey and Pecsok, 1970]
- 2-methylhexane 02 29 04 29 06 57 07 [Desty et al., 1962;Gainey and Pecsok, 1970]
- 3-methylhexane 02 34 07 34 07 61 08 [Desty et al., 1962;Gainey and Pecsok, 1970]
- 3-ethylpentane 01 19 14 20 16 56 17 [Desty et al., 1962]- 2,3-dimethylpentane 02 20 05 21 07 61 05 [Desty et al., 1962;
Gainey and Pecsok, 1970]- 2,4-dimethylpentane 04 25 07 27 07 38 07 [Desty et al., 1962;
Cruikshank et al., 1968;Gainey and Pecsok, 1970;Uoung, 1967]
B. Prediction results:- 2,2,3-trimethylbutane 02 07 05 - - 64 30 [Desty et al., 1962;
Gainey and Pecsok, 1970]- 2,2,4-trimethylpentane 02 33 19 - - 88 48 [Prausnitz and Benson, 1959]
Nitrogen - alkenesA. Regression results:
- ethylene 01 43 08 - - 10 11 [Edwards and Roseveare, 1942]- cis-pent-1,3-diene 01 59 02 - - 22 *†08*† [Letcher and Marsicano, 1974]- n-pent-1-ene 01 22 50 - - 57 †40† [Cruikshank et al., 1968]- trans-pent-2-ene 01 75 13 - - 31 *†15*† [Letcher and Marsicano, 1974]- trans-hexa-1,3-diene 05 60 13 - - 21 *†08*† [Letcher and Marsicano, 1974]- trans-hexa-1,4-diene 02 53 21 - - 30 *‡12*‡ [Letcher and Marsicano, 1974]- cis-hexa-1,3,5-triene 06 60 10 - - 27 *‡40*‡ [Letcher and Marsicano, 1974]- hexa-1,5-diene 03 58 06 - - 25 * ‡05*† [Letcher and Marsicano, 1974]- trans-hexa-2,4-diene 04 69 15 - - 12 *‡21*‡ [Letcher and Marsicano, 1974]- n-hexa-1-ene 05 78 09 - - 33 10 [Letcher and Marsicano, 1974;
Cruikshank et al., 1968]- trans-hexa-2-ene 02 76 12 - - 39 16 [Letcher and Marsicano, 1974]- trans-hexa-3-ene 03 76 07 - - 40 15 [Letcher and Marsicano, 1974]- n-hept-1-ene 02 87 13 - - 42 13 [Young, 1968;
Cruikshank et al., 1968]Carbon dioxide - normal alkanesA. Regression results:
- ethane 07 18 04 16 04 19 18 [Zaalishvili, 1956]- propane 06 28 04 27 04 35 28 [Gunn, 1958]- n-butane 04 32 04 31 04 45 31 [Gunn, 1958]- n-pentane 02 1020 26 98 28 1420 96 [Massoudi and King, 1973;
Sie et al., 1966]- n-decane 02 1640 14 1390 14 3350 1200 [Prausnitz and Benson, 1959]
September, 2002
An Extension of the Group Contribution Model for Thermodynamic and Transport Properties of Dilute Gases 855
ix-
c-
Table 7. Continued
MixturesNumberof points
Average RMSD in B (cm3 mol−1)
Data sourcePresent study Oh & Campbell Tsonopoulos
K ij , gc=0 Kij , gc≠0 Kij , gc=0 Kij , gc≠0 Kij =0 Kij ≠0
B. Prediction results:- methane 02 10 - - - 8 - [Brugge et al., 1989]- methane 02 10 - - - 8 - [Esper, 1987]- methane 05 07 - - - 5 - [McElroy et al., 1990]- methane 03 10 - - - 8 - [Martin et al., 1987]- methane 01 18 - - - 16 - [Mason and Eakin, 1961]- ethane 01 20 08 - - 23 21 [Jaeschke, 1987]- ethane 01 20 07 - - 24 21 [Jaeschke, 1988]- ethane 02 23 07 - - 27 24 [Brugge et al., 1989]- ethane 05 17 10 - - 22 20 [McElroy et al., 1990]- ethane 01 22 06 - - 25 23 [Weber, 1992]- ethane 06 28 09 - - 35 32 [Holste et al., 1982]- propane 08 33 14 - - 44 34 [McElroy et al., 1990]
Carbon dioxide - branched alkanesA. Regression results:
- 2,2-dimethylbutane 01 1670 26 1830 24 2830 2120 [Desty et al., 1962]- 2,2-dimethylpentane 01 1910 12 1650 13 2980 1960 [Desty et al., 1962]- 3,3-dimethylpentane 01 1860 09 1680 10 3120 2060 [Desty et al., 1962]- 2-methylbutane 01 1850 36 1680 34 2190 1730 [Desty et al., 1962]- 2-methylpentane 01 1700 37 1890 35 2710 1910 [Desty et al., 1962]- 3-methylpentane 01 1930 32 1840 30 2680 1900 [Desty et al., 1962]- 2,3-dimethylbutane 01 1890 13 2050 12 2830 1890 [Desty et al., 1962]- 2-methylhexane 01 1730 15 1880 13 3050 1890 [Desty et al., 1962]- 3-methylhexane 01 1690 11 1840 09 2980 1890 [Desty et al., 1962]- 3-ethylpentane 01 1730 05 1670 08 2840 1710 [Desty et al., 1962]- 2,3-dimethylpentane 01 1880 34 1710 44 2830 1950 [Desty et al., 1962]- 2,4-dimethylpentane 01 1720 19 1860 29 3020 1940 [Desty et al., 1962]
B. Prediction results:- 2,2,3-trimethylbutane 01 1720 36 - - 3190 2190 [Desty et al., 1962]- 2,2,4-trimethylpentane 02 66 1150 - - 1970 91 [Prausnitz and Benson, 1959]
Carbon dioxide - alkenesA. Regression results:
- 1,3-butadiene 01 78 58 - - 1020 85 [Sie et al., 1966]Carbon monoxide - normal alkanesA. Regression results:
- propane 11 01 01 - - 05 01 [McElroy and Moser, 1995]- n-butane 02 04 01 - - 10 02 [McElroy and Moser, 1995]- n-butane 03 02 06 - - 09 02 [McElroy, 1994]- n-octane 07 22 05 - - 40 07 [Everette et al., 1968;
Connolly, 1964]B. Prediction results:
- methane 01 26 - - - 18 - [Mason and Eakin, 1961]- ethane 06 01 03 - - 02 01 [McElory and Ababio, 1994]
comparability of both the present method and Tsonopoulos meth-od. Presents prediction results of second virial cross coefficient forN2-H2 mixture are shown in Fig. 7 with those of the Tsonopoulosmethod.
4. Mixtures of Hydrocarbons with Linear Molecular GasesAs a continuation of our systematic research on asymmetric m
tures containing hydrocarbons with linear molecular gases (N2, CO2,CO, O2, and H2), functional group parameters and group intera
Korean J. Chem. Eng.(Vol. 19, No. 5)
856 S.-K. Oh and C.-H. Sim
on.fordro-
]
tion coefficients for such mixtures were evaluated by the group con-tribution model. Up to this point, the group interaction coefficientskij ,gc were assumed to zero for all hydrocarbon mixtures, as indi-cated by Eq. (9). This assumption would not be expected to apply
when one of the compounds in the mixture is not a hydrocarbIn this event, a group binary interaction coefficient is required every possible interaction between a hydrocarbon and a non-hycarbon group.
Table 7. Continued
MixturesNumberof points
Average RMSD in B (cm3 mol−1)
Data sourcePresent study Oh & Campbell Tsonopoulos
K ij , gc=0 Kij , gc≠0 Kij , gc=0 Kij , gc≠0 Kij =0 Kij ≠0
Carbon monoxide - branched alkanesA. Regression results:
- 2-methylpropane 05 09 05 - - 07 08 [McElroy and Moser, 1995;McElroy, 1994]
Carbon monoxide - alkenesA. Regression results:
- ethylene 01 39 0.3 - - 20 20 [Mason and Eakin, 1961]- propylene 01 42 0.2 - - 24 20 [Mason and Eakin, 1961]
Oxygen - normal alkanesA. Regression results:
- n-pentane 01 13 10 - - 10 19 [Desty et al., 1962]- n-hexane 01 03 02 - - 35 09 [Desty et al., 1962]- n-heptane 01 10 06 - - 52 09 [Desty et al., 1962]
Oxygen - branched alkanesA. Regression results:
- 2,2-dimethylbutane 01 35 30 - - 38 00 [Desty et al., 1962]- 3,3-dimethylpentane 01 26 37 - - 56 02 [Desty et al., 1962]- 2-methylbutane 01 09 11 - - 31 04 [Desty et al., 1962]- 2-methylpentane 01 22 24 - - 36 06 [Desty et al., 1962]- 3-methylpentane 01 30 32 - - 30 12 [Desty et al., 1962]- 2,3-dimethylbutane 01 18 22 - - 36 04 [Desty et al., 1962]- 2-methylhexane 01 25 27 - - 52 05 [Desty et al., 1962]- 3-methylhexane 01 30 32 - - 46 08 [Desty et al., 1962]- 3-ethylpentane 01 26 28 - - 52 05 [Desty et al., 1962]- 2,3-dimethylpentane 01 17 20 - - 56 04 [Desty et al., 1962]- 2,4-dimethylpentane 01 15 18 - - 54 0.2 [Desty et al., 1962]
B. Prediction results:- 2,2,3-trimethylbutane 01 26 23 - - 57 07 [Desty et al., 1962]
Hydrogen - normal alkanesA. Regression results:
- ethane 01 16 02 - - 09 07 [Mason and Eakin, 1961]- propane 01 18 02 - - 08 04 [Mason and Eakin, 1961]- n-butane 01 29 04 - - 17 10 [Mason and Eakin, 1961]- n-pentane 04 30 04 - - 16 07 [Mason and Eakin, 1966;
Cruikshank et al., 1996;Desty et al., 1962; Everett, 1965]
- n-hexane 02 33 03 - - 17 04 [Cruikshank et al., 1966;Desty et al., 1962]
- n-octane 11 25 04 - - 12 07 [Everette et al., 1968; Connelly, 1961B. Prediction results:
- methane 01 05 - - - 0.3 - [Mason and Eakin, 1961]- methane 06 03 - - - 07 - [Mueller et al., 1961]- n-heptane 01 72 25 - - 18 37 [Desty et al., 1962]- n-decane 02 85 57 - - 97 66 [Prausnitz and Benson, 1959]
September, 2002
An Extension of the Group Contribution Model for Thermodynamic and Transport Properties of Dilute Gases 857
Korean J. Chem. Eng.(Vol. 19, No. 5)
Table 7. Continued
MixturesNumberof points
Average RMSD in B (cm3 mol−1)
Data sourcePresent study Oh & Campbell Tsonopoulos
K ij , gc=0 Kij , gc≠0 Kij , gc=0 Kij , gc≠0 Kij =0 Kij ≠0
Hydrogen - branched alkanesA. Regression results:
- 2,2-dimethylbutane 02 34 08 - - 31 19 [Cruikshank et al., 1966;Desty et al., 1962]
- 2,2-dimethylpentane 01 09 33 - - 03 15 [Desty et al., 1962]- 3,3-dimethylpentane 01 14 31 - - 07 10 [Desty et al., 1962]- 2-methylbutane 01 42 17 - - 35 25 [Desty et al., 1962]- 2-methylpentane 01 14 15 - - 06 08 [Desty et al., 1962]- 3-methylpentane 01 24 05 - - 17 03 [Desty et al., 1962]- 2,3-dimethylbutane 01 17 03 - - 23 10 [Desty et al., 1962]- 2-methylhexane 01 23 17 - - 18 36 [Desty et al., 1962]- 3-methylhexane 01 08 17 - - 15 32 [Desty et al., 1962]- 3-ethylpentane 01 05 42 - - 18 35 [Desty et al., 1962]- 2,3-dimethylpentane 01 02 39 - - 12 04 [Desty et al., 1962]- 2,4-dimethylpentane 01 13 43 - - 11 06 [Desty et al., 1962]
B. Prediction results:- 2,2,3-trimethylbutane 01 0.3 29 - - 12 04 [Desty et al., 1962]- 2,2,4-trimethylpentane 04 22 21 - - 38 24 [Prausnitz and Benson, 1959;
Everette et al., 1968]Hydrogen - alkenesA. Regression results:
- ethylene 01 27 08 - - 11 10 [Mason and Eakin, 1961]- propylene 01 37 17 - - 16 13 [Mason and Eakin, 1961]- n-pent-1-ene 01 10 17 - - 13 22 [Cruikshank et al., 1968]- n-hex-1-ene 01 21 10 - - 04 16 [Cruikshank et al., 1968]- n-hept-1-ene 01 38 02 - - 10 06 [Cruikshank et al., 1968]
Gas - gasNitrogen
- carbon dioxide 02 2.2 - - - 0.8 - [Brugge et al., 1989]- carbon dioxide 02 2.3 - - - 0.8 - [Esper, 1987]- carbon dioxide 01 3.9 - - - 7.3 - [Edwards and Roseveare, 1942]- carbon dioxide 01 1.0 - - - 0.4 - [Gorski and Miller, 1953]- carbon dioxide 01 1.4 - - - 1.9 - [Pfefferle et al., 1955]- carbon dioxide 03 4.2 - - - 6.7 - [Cottrell et al., 1956]- carbon dioxide 01 4.7 - - - 1.2 - [Mason and Eakin, 1961]- carbon dioxide 05 1.2 - - - 3.6 - [Gunn, 1958]
Nitrogen- oxygen 01 10.30 - - - 0.2 - [Gorski and Miller, 1953]- oxygen 03 1.6 - - - 0.7 - [Martin et al., 1982]
Nitrogen- hydrogen 01 4.2 - - - 1.3 - [Edwards and Roseveare, 1942]- hydrogen 04 3.3 - - - 6.7 - [Ostronov et al., 1967]- hydrogen 11 2.7 - - - 3.3 - [Zandbergen and Beenakker, 1967]- hydrogen 08 3.8 - - - 3.3 - [Brewer and Vaughn, 1969]
Carbon dioxide- oxygen 01 6.6 - - - 8.0 - [Edwards and Roseveare, 1942]- oxygen 01 6.3 - - - 4.9 - [Gorski and Miller, 1953]- oxygen 03 8.1 - - - 7.1 - [Cottrell et al., 1956]
Carbon dioxide- hydrogen 03 2.9 - - - 9.3 - [Cottrell et al., 1956]
*Critical properties were taken form [http://www.pirika.com/chem/TCPEE/TCPE.htm].† Acentric factors were taken form [http://data-books.com/bussei_e/bs_index.html].‡ Acentric factors were taken form [http://www.aist.go.jp/RIODB/db030/hy/estimate.html].
858 S.-K. Oh and C.-H. Sim
hemayn ofindi-tion,
cond in
ultsc-nt
undmay
edoupTso-mp-at
op-
oupsntsd ac-able,eralthodoere
i_e/ti
ticaledffi-ture
As mentioned earlier, the use of non-zero values of interactioncoefficient between unlike functional groups is needed for betterpredictions. Values of the group interaction coefficient kGAS-GC wereevaluated by regressing second virial cross coefficient data for al-kane-gas mixtures. For instance, values of kN2-CH2,GC and kN2-CH3,GC
were obtained from the experimental data for nitrogen-normal al-kane mixtures. Using these obtained values, kGAS-CH1,GC was next ob-tained from second virial cross coefficient data of gas-alkane mix-ture in which the alkane contained one or more CH1 groups. Next,second virial cross coefficient data for gas-alkane mixtures in whichthe alkane contains one or more CH0 groups were used to obtainthe value of kGAS-CH0,GC. Finally, a similar procedure was followedfor gas-alkene mixtures to evaluate kGAS-CH1D, GC and kGAS-CH2D,GC sim-ultaneously, which were not examined in the our previous work[1997].
With the exceptions of three cases in which no second virial crosscoefficient data are available for kCO-CH0,GC, kO2-DB-CH1,GC and kO2-DB-
CH1,GC, 27 group binary interaction coefficients obtained in this man-ner are given in Table 6. It is expected that numerical values of thegroup interaction coefficients would vary from zero to unity. Withthe exceptions of kCO2-CH0,GC, kCO2-CH1,GC and kO2-CH1,gc, all values of
the group binary interaction coefficients satisfy this condition. Tunrealistically out-bounded values for these three interactions be due either to uncertainties in the data or to the propagatiouncertainties in previously determined parameter values, as cated by Oh [1989], or to few data used for parameter estimafor instance, only two points used for kO2-CH1D, GC and kO2-CH2D, GC inthe same regression.
Resulting deviations between calculated and measured sevirial cross coefficients of gas-hydrocarbon mixtures are givenTable 7. Also included in this table is one column indicating resof assuming that kij, gc is equal to zero. As shown in Table 7, predition results with non-zero values of binary interaction coefficieare superior to those with kij, gc=0 for all gas mixtures especially forgas-normal mixtures. But no appreciable improvements were fofor mixtures of gas-branched alkane and gas-alkene, which be due to the same reasons mentioned above.
In the event that binary interaction coefficients were assumto non-zero, prediction results are comparable for both the grcontribution method and the corresponding states method of nopoulos. Results for the Tsonopoulos method with the assution that k12=0 are also given in Table 7. It is interesting to note ththe group contribution method with kij, gc=0 has turned out to be abetter predictor of second virial cross coefficients than the Tsonoulos method with k12=0. This is because kij ,gc in the group contri-bution model depends only on energetic interactions between gri and j. It is assumed that values of binary interaction coefficiebetween methane-gas groups are zero. If critical properties anentric factors needed for the Tsonopoulos method are not availthey must be estimated. For instance, critical properties for sevalkenes indicated in Table 7 were estimated by the Joback mefrom the www site [http://www.pirilca.com/chem/TCPEE/crip/jback.htm] and acentric factors for the corresponding alkanes walso obtained from the www site [http://data-books.com/bussebs_index.html] and [http://www.aist.go.jp/RIODB/db030/hy/esmate.html]. As for the case of k12≠0 for all five gas mixtures, devia-tion between experimental data and predictions is almost idento that obtained from the previous work. In order to show improvpredictions with the assumption that the binary interaction coecient is not zero, a comparison of predicted and measured mix
Fig. 6. Comparison of observed and predicted mixture viscosityfor nitrogen-hydrogen mixture.
Fig. 7. Comparison of observed and predicted second virial crosscoefficients for nitrogen-hydrogen mixture.
Fig. 8. Comparison of observed and predicted mixture viscositiesfor nitrogen-normal alkane mixtures.
September, 2002
An Extension of the Group Contribution Model for Thermodynamic and Transport Properties of Dilute Gases 859
ain-sion twoere
pre-val-pro-ticalrtiestera-
sity
d-
q.
viscosities is shown in Fig. 8 for nitrogen-normal alkane systems.For the prediction of mixture viscosities and binary diffusion co-
efficients for mixtures of hydrocarbons (normal and branched alkanesand alkenes) with linear molecular gases, the group binary interac-tion coefficients given in Table 6 were used. Table 4 indicates thatpredicted and experimental mixture viscosities are in very good agree-ment, showing better predictions with non-zero values of binary in-teraction coefficient, and that accuracy of the group contributionmethod exceeds that of the corresponding states method of Lucas.In Table 5, binary diffusion coefficients were predicted with an ac-curacy, comparable to both the Fuller method and the previous work.No effect of binary interaction coefficient on predictions was foundin mixtures of nitrogen and alkanes above n-octane and nitrogen-2,2,3-trimethylheptane mixture, which indicates that experimentaldata might be in doubt since both the previous work and the Fullermethod yield similar results. But in mixtures of carbon dioxide, non-zero values of binary interaction coefficient improve predictions well.
CONCLUSIONS
The group contribution method proposed by Oh and Campbell[1997] for prediction of second virial coefficients and dilute gastransport properties has been repeated with a new set of normal al-kane second virial coefficient data either from the recent data fornormal C6 by Dymond et al. [1986], or from the recommendationfor C4, C7 and C8 alkanes updated by Tsonopoulos and Dymond[1997]. This method has been extended to molecular linear gases(carbon monoxide, oxygen and hydrogen) and to mixtures of alkanesand those gases.
The functional group parameters are revised from the simulta-neous regression of second virial coefficient and viscosity data. Groupparameters values (CH0, CH1, CH2, CH3, CH4, double-bonded CH1,double-bonded CH2, N2, and CO2 groups) and 8 binary group in-teraction parameters (kN2-CH0,GC, kN2-CH1,GC, kN2-CH2,GC, kN2-CH3,GC;kCO2-CH0,GC, kCO2-CH1, GC, kCO2-CH2,GC and kCO2-CH3, GC) were revised.
New group parameter values are given for gases beyond thosepresented earlier (CO, O2 and H2) and 19 group binary interactionparameter values (kN2-CH1D, GC, kN2-CH2D, GC; kCO2-CH1D, GC, kCO2-CH2D, GC;kCO-CH1, GC, kCO2-CH2,GC, kCO-CH3,GC, kCO-CH1D, GC, kCO-CH2D, GC; kO2-CH0,GC,kO2-CH1,GC, kO2-CH2,GC, kO2-CH3,GC; kH2-CH0, GC, kH2-CH1,GC, kH2-CH2,GC,kH2-CH3,GC, kH2-CH1D,GC, kH2-CH2D, GC) are presented for hydrocarbon mix-tures with gases. Three group binary interaction parameter values(kCO-CH0,GC, kO2-CH1D, GC, and kO2-CH2D,GC) can not be estimated since nosecond virial cross coefficient data are available.
Application of the model shows that second virial coefficient datacan be represented with results comparable to those obtained byOh and Campbell [1997] and by the corresponding states methodof Tsonopoulos [1974]. The accuracy of the model in viscosity anddiffusion coefficient predictions is comparable to both methods ofLucas [1980] and of Fuller [Fuller et al., 1966], respectively.
Prediction results show that the accuracy of the model decreasesas molecular size increases. This may be due to the fact that the Chap-man-Enskog theory used here does not account for inelastic colli-sions which become more pronounced with increased number ofgroups in a molecule. It is also possible that the empirical modifi-cation used to extend the Kihara spherical core potential to chainmolecules is not accurate as the length of the chain increases. It is
noted that values for the group interaction coefficients kij, gc weresometimes physically unrealistic, which may be due to uncertties in experimental data, or to the propagated errors of regreswhen parameter values were evaluated in advance. Althoughof these interaction coefficients had unrealistic values, they wstill predicted accurate property values.
A strong advantage of the method is that it is capable of resenting several different properties with one set of parameter ues. Thus, it may use data for one property to predict a different perty. On top of that, since this method does not require the criproperties and acentric factor, it may be used to predict propeof substances in question for which no data are available in the liture.
ACKNOWLEDGEMENTS
This work was supported by the grants from Sang-Ji Univerin the year of 2001.
NOMENCLATURE
a : core radius [Å]a* : reduced core radius [2a/(σ− 2a)]B : second virial coefficient [cm3 mol−1]D : diffusion coefficient [cm2 sec−1]k12 : binary interaction coefficient for Tsonopoulos methokij , gc : group binary interaction coefficient for interactions be
tween intermolecular groups i and jn : number of data pointsNi1 : number of groups i in molecule 1Nj2 : number of groups j in molecule 2P : pressure [atm]
RAD(%): relative average deviation (%),
RMSD: root mean square deviation,
T : temperature [K]T* : reduced temperature, kT/εV : molar volume [cm3 mol−1]Vvdw, ii : van der Waals volume of group i [cm3 mol−1]x : mole fraction
Greek Lettersα : functional group well depth parameter [J]β : functional group well depth parameter [J K]ε : potential well depth [J]η : viscosity [µP]ξ : universal van der Waals volume constant (1.3627) in E
(18)σ : collision diameter [Å]ΩV : collision integral for viscosityΩD : collision integral for diffusivity
Subscripts1, 11 : property of molecule 1
100n
--------- i = 1
n ηexp i, − ηcal i,
ηexp i,
-----------------------
2
∑
i = 1
nBexp i, − Bcal i,( ) 2∑
n-----------------------------------------
Korean J. Chem. Eng.(Vol. 19, No. 5)
860 S.-K. Oh and C.-H. Sim
me-ane,”
as76
ds-
esrd
nk-n-
y
um
d-lu-
of
ub-w,
Dif-by
).
ionthe
2, 22 : property of molecule 212 : interaction property for molecules 1 and 2ij : interaction property for intermolecular groups i and jAB : interaction property for molecule A and BC : critical propertyCH1D : property of double-bonded CH1 groupCH2D : property of double-bonded CH2 groupGAS : property of gas groupGC : property of binary interaction coefficient of group contri-
butionmix : mixture property
REFERENCES
Achtermann, H. J., Magnus, G., Hinze, H. M. and Jaeschke, M., “PVTData from Refractive Index Measurements for the Ethane+NitrogenSystem from 270 to 350 K and Pressures to 28 MPa,” Fluid PhaseEquilibria, 64, 263 (1991).
Adzumi, H., Bull. Chem. Soc. Japan, 12, 292 (1937).Al-Bizreh, N. and Wormald, C. J., J. Chem. Thermodyn., 10, 231
(1978).Amdur, I. and Shuler, L. M., J. Chem. Phys., 38, 188 (1963).Baughman, G. L., Westoff, S. P., Dincer, S., Duston, D. D. and Kidnay,
A. J., J. Chem. Thermodyn., 7, 875 (1975).Beattie, J. A., Stockmayer, W. H. and Ingersoll, H. G., J. Chem. Phys.,
9, 871 (1941).Bellm, J., Reineke, W., Schafer, K. and Schramm, B., Ber. Bunsenges.
Phys. Chem., 78, 282 (1974).Bircher, L. B., Ph.D. Thesis, University of Michigan, Ann Arbor Mich.
(1943).Bondi, A., “van der Waals Volumes and Radii,” J. Phys. Chem., 68, 441
(1964).Brewer, J. and Vaughn, G. W., J. Chem. Phys., 50, 2960 (1969).Brugge, H.B., Hwang, C.-A., Rogers, W. J., Holste, J. C. and Hall, K.R.,
“Experimental Cross Virial Coefficients for Binary Mixtures of Car-bon Dioxide with Nitrogen, Methane and Ethane at 300 and 320 K,”Physica A., 156, 382 (1989).
Campbell, S. W., “Application of the Group Contribution Concept tothe Kihara Potential for the Calculation of Second Virial Coeffi-cients,” Fluid Phase Equilibria, 47, 47 (1989).
Carmichael, L. T., Sage, B. H. and Lacey, W. N., AIChE J., 1, 385(1955).
Chapman, S. and Cowling, T. G., ”The Mathematical Theory of Non-uniform Gases,” Cambridge University Press, New York (1939).
Chen, N. H. and Othmer, D. F., J. Chem. Data, 7, 38 (1972).Chueh, P. L. and Prausnitz, J. M., AIChE J., 13, 1099 (1967).Clarke, J. K. and Ubbelohde, A. R., J. Am. Chem. Soc., 79, 2050
(1957).Connelly, J. F., Physics Fluids, 4, 1494 (1961).Connolly, J. F., Physics Fluids, 7, 1023 (1964).Cottrell, T. L., Hamilton, R. A. and Taubinger, R. P., Trans. Faraday
Soc., 52, 1310 (1956).Cruikshank, A. J. B., Gainey, B. W. and Young, C. L., Trans. Faraday
Soc., 64, 337 (1968).Cruikshank, A. J. B., Windsor, M. L. and Young, C. L., Proc. R. Soc.,
Ser. A, 295, 271 (1966).Dantzler, E. M., Knobler, C. M. and Windsor, M. L., “Interaction Virial
Coefficients in Hydrocarbon Mixtures,” J. Phys. Chem., 72, 676(1968).
Das, T. R., Reed, Jr. C. O. and Eubank, P. T., “PVT [Pressure-VoluTemperature] Surface and Thermodynamic Properties of IsobutJ. Chem. Eng. Data, 18, 253 (1973).
Derr, E. L. and Deal, C. H., Inst. Chem. Eng. Symp. Ser., 32, 40(1969).
Desty, D. H., Goldup, A., Luckhurst, G. R. and Swanton, W. T., “GChromatography,” M. van Swaay, Ed., Butterworth, London, (1962).
Di Zio, S. F., Abbott, M. M., Zibello, D. and Van Ness, H. C., “SeconVirial Coefficients of Organic Vapors from Density Balance Meaurements,” Ind. Eng. Chem. Fund., 5, 569 (1966).
Dymond, J. H. and Smith, E. B., “The Virial Coefficients of Pure Gasand Mixtures - A Critical Compilation,” Clarendon Press, Oxfo(1980).
Dymond, J. H., Cholinski, J. A., Szafranski, A. and Wyrzykowska-Staiewicz, D., “Second Virial Coefficients for n-Alkanes; Recommedations and Predictions,” Fluid Phase Equilibria, 27, 1 (1986).
D’Avila, S. G., Kaul, B. K. and Prausnitz, J. M., “Solubilities of HeavHydrocarbons in Compressed Methane and Nitrogen,” J. Chem. Eng.Data, 21, 488 (1976).
Edwards, A. E. and Roseveare, W. E., J. Am. Chem. Soc., 64, 2816(1942).
Esper, G. J., Ph.D. Dissertation (Dtsch), Ruhr-Universität, Boch(1987).
Everett, D. H., Trans. Faraday Soc., 61, 1637 (1965).Everette, D. H., Gainey, B. W. and Young, C. L., Trans. Faraday Soc.,
64, 2667 (1968). Fredenslund, A., Jones, R. L. and Prausnitz, J. M., AIChE J., 21, 1086
(1975).Fuller, E. N., Schettler, P. D. and Giddings, J. C., Ind. Eng. Chem., 58,
18 (1966).Gainey, B. W. and Pecsok, R. L., “Nonelectrolytic Liquid Mixture Stu
ies by Medium Pressure Gas-Liquid Chromatography. Infinite Dition Activity Coefficients of C5-C8 Hydrocarbons in 1-N-Alkyl-benzenes,” J. Phys. Chem., 74, 2548 (1970).
Georgeton, G. K. and Teja, A. S., “A Group Contribution EquationState Based on the Simplified Perturbed Hard Chain Theory,” Ind.Eng. Chem. Res., 27, 657 (1988).
Giddings, J. G., Kao, J. T. F. and Kobayashi, R., J. Chem. Phys., 45, 578(1966).
Golubev, I. F., ”Viscosity of Gases and Gaseous Mixtures,” State Plishing House for Physical and Mathematical Literature, MoscoRussia (1959).
Golubev, I. F. and Petrov, V. A., Trudy Giap, 1, 7 (1953).Gorski, R. A. and Miller, J. G., J. Am. Chem. Soc., 75, 550 (1953).Gotoh, H., Manner, M., Sorensen, J. P. and Stewart, W. E., “Binary
fusion Coefficients of Low-Density Gases. I. Measurements Modified Loschmidt Method,” J. Chem. Eng. Data, 19, 169 (1974).
Gunn, R. D., M.S. Thesis, University of California, Berkley (1958Hamann, S. D., Lambert, J. A. and Thomas, R. B., Aust. J. Chem., 8,
149 (1955).Hicks, C. P. and Young, C. L., Trans. Faraday Soc., 64, 2675
(1968).Holste, J. C., Young, J. G., Eubank, P. T. and Hall, K. R., “Interact
Second Virial Coefficients and Binary Interaction Parameters for
September, 2002
An Extension of the Group Contribution Model for Thermodynamic and Transport Properties of Dilute Gases 861
nts
ond,
o-,
n-
r-
tsda,
.,
ass on
es
ss,
or-eir
riala-
s,”
d
CO2-C2H6 Systems between 250 and 300 K,” AIChE J., 28, 807(1982).
http://data-books.com/bussei_e/bs_index.htmlhttp://www.aist.go.jp/RIODB/db030/hy/estimate.htmlhttp://www.pirika.com/chem/TCPEE/TCPE.htmJaeschke, M., “Determination of the Interaction Second Virial Coef-
fients for the Carbon Dioxide - Ethane System from Refractive In-dex Measurements,” Int. J. Thermophys., 8, 81 (1987).
Jaeschke, M., “Groupe Europeen de Recherhes Gazieres (GERG),”TM2, Convenor (1988).
Jin, G., Walsh, J. M. and Donahue, M. D., “A Group-Contribution Cor-relation for Predicting Thermodynamic Properties with the Perturbed-Soft-Chain Theory,” Fluid Phase Equilibria, 31, 123 (1986).
Kaul, B. K. and Prausnitz, J. M., AIChE J., 24, 223 (1978).Kestin, J. and Leidenfrost, W., Physica, 25, 525 (1959). Kestin, J. and Yata., J., J. Chem. Phys., 49, 4780 (1968).Kihara, T., “Intermolecular Forces,” Wiley, New York (1978).Kim, N.H., Lee, T. H. and Choi, J. S., “Swelling Equilibria of Polymeric
Hydrogels Containing Poly(acrylamide-sodiumallylsulfonate-acrylicacid),” Korean J. Chem. Eng., 17, 534 (2000).
Lambert, J. D., Cotton, K. J., Pailthorpe, M. W., Robinson, A. M., Scriv-ens, J., Vale, W. R. F. and Young, R. M., Proc. R. Soc., Ser. A, 231,280 (1955).
Landolt-Bornstein, Physikalisch-Chemische Tabellen, Bd. 1: S. 146.Springer (1927).
Lee, J. W., Ph.D. Thesis, University of London (1976).Lee, R. C. and Edmister, W. C., AIChE J., 16, 1047 (1970).Letcher, T. M. and Marsicano, F., J. Chem. Thermodyn., 6, 501
(1974).Lotfi, A., “Experimentelle Bestimmung von Viriakoeffizientenin Gemis-
chen Methan+Ethan und Stickstoff+Kohlendioxid,” Diploma the-sis, Ruhr-Universität Bochum (1987).
Lucas, K., ”Phase Equilibria and Fluid Properties in the Chemical In-dustry,” Dechema, Frankfurt (1980).
Martin, M. L., Trengove, R. D., Harris, K. R. and Dunlop, P. J., “ExcessSecond Virial Coefficients for Some Dilute Binary Gas Mixtures,”Austr. J. Chem., 35, 1525 (1982).
Martin, M. L., Trengove, R. D., Harris, K. R. and Dunlop, P. J., “VirialCoefficients of Gases, Ethane+Methane,” Int. Data Ser., Sel. DataMixtures, Ser. A, 1, 57 (1987).
Mason, D. McA. and Eakin, B. E., “Compressibility Factor of FuelGases at 60oF. and 1 Atm,” J. Chem. Eng. Data, 6(4), 499 (1961).
Massoudi, R. and King, Jr. A.D., “Solubility of Alcohols in CompressedGases. Comparison of Vapor-Phase Interactions of Alcohols andHomomorphic Compounds with Various Gases. II. 1-Butanol, Di-ethyl Ether, and n-Pentane in Compressed Nitrogen, Argon, Meth-ane, Ethane, and Carbon Dioxide at 25 Deg.,” J. Phys. Chem., 77,2016 (1973).
McD. Cummings, G. A. and Ubbelohde, A. R., J. Am. Chem. Soc., 75,3751 (1953).
McD. Cummings, G. A. and Ubbelohde, A. R., J. Am. Chem. Soc., 77,2524 (1955).
McD. Cummings, G. A., McLaughlin, E. and Ubbelohde, A. R., J. Am.Chem. Soc., 77, 1141 (1955).
McElory, P. J. and Ababio, B. D., “Compression Factors and Virial Equa-tion of State Coefficients for the System Carbon Monoxide+Ethane,” J. Chem. Eng. Data, 39, 327 (1994).
McElroy, P. J. and Fang, J., ”Compression Factors and Virial Coefficieof (Ethane+Methane),” J. Chem. Thermodyn., 26, 617 (1994).
McElroy, P. J. and Moser, J., “Excess and Unlike Interaction SecVirial Coefficients of Mixtures of Carbon Monoxide with Propanen-Butane and 2-Methylpropane,” Fluid Phase Equilibria, 107, 229(1995).
McElroy, P. J., Lim, L. K. and Craig, A. R., “Excess Second Virial Cefficients for Binary Mixtures of Carbon Dioxide with MethaneEthane, and Propane,” J. Chem. Eng. Data, 35, 3124 (1990).
McElroy, P. J., “Excess Second Virial Coefficients of (Carbon Mooxide+Butane) and for (Carbon Monoxide+2 Methylpropane),”J.Chem. Thermodyn., 26, 663 (1994).
McMath, H. G. and Edmister, W. C., AIChE J., 15, 370 (1969).Mueller, W. H., Leland, T. W. and Kobayashi, R., A. I. Ch. E. Jl, 7, 267
(1961).Oh, S. K. and Campbell, S. W., “A Group Contribution Model for The
modynamic and Transport Properties of Dilute Gases,” Fluid PhaseEquilibria, 129, 69 (1997).
Oh, S.-K., “A Group Interaction Model for Second Virial Coefficienof Pure Gases and Mixtures,” M.S. Thesis, University of S. FloriTampa (1989).
Ostronov, M. G., Bol’shakov, P. E., Gel’perin, L. L. and Orlova, A. ARuss. J. phys. Chem., 41, 1171 (1967).
Pal, A. K. and Barua, A. K., J. Chem. Phys., 47, 216 (1967).Pecsok, R. L. and Windsor, M. L., Anal. Chem., 40, 1238 (1968).Pfefferle, Jr., W. C., Goff, J. A. and Miller, J. G., J. Chem. Phys., 23,
509 (1955).Prausnitz, J. M. and Benson, P. R., AIChE J., 5, 161 (1959).Ramesh, N. and Duda, J. L., “Diffusion in Polymers below the Gl
Transition Temperature: Comparison of Two Approaches BasedFree Volume Concepts,” Korean J. Chem. Eng., 17, 310 (2000).
Roe, D. R., Ph.D. thesis, University of London (1972).Scott, D. S. and Cox, K. E., Can. J. Chem. Eng., 38, 201 (1960).Sie, S. T., van Beersum, W. and Rijnders, G. W. A., Sep. Sci., 1, 459
(1966).Siebert, E. D. and Knobler, C. M., ”Second Virial Coefficients of Gas
Binary Normal Alkane Mixtures (C1 to C5),” Int. Data Ser. Sel. DataMixtures, Ser. A, 1, 16 (1983).
Stephan, K. and Lucas, K., ”Viscosity of Dense Fluids,” Plenum PreNew York (1979).
Strein, K., Lichtenthaler, R. N., Schramm, B. and Schafer, K., Ber. Bun-senges. Phys. Chem., 75, 1308 (1971).
Tarakad, R. R. and Danner, R. P., AIChE J., 23, 685 (1977).Trautz, M. and Baumann, P. B., Ann. Phys., 5, 733 (1929).Trautz, M. and Sorg, K., Ann Phys., 10, 81 (1931).Tsonopoulos, C. and Dymond, J. H., “Second Virial Coefficients of N
mal Alkanes, Linear 1-Alkanols (and Water), Alkyl Ethers, and ThMixtures,” Fluid Phase Equilibria, 133, 11 (1997).
Tsonopoulos, C., Dymond, J. H. and Szafranski, A. M., “Second ViCoefficients of Normal Alkanes, Linear 1-Alkanols and Their Binries,” Pure & Appl. Chem., 61(6), 1387 (1989).
Tsonopoulos, C., “Empirical Correlation of Second Virial CoefficientAIChE J., 20(2), 263 (1974).
Vargaftik, N. B., “Table of Thermodynamic Properties of Liquids anGases,” Wiley, New York (1975).
Waddingston, G., Smith, J. C., Scott, D. W. and Huffman, H. M., J. Am.Chem. Soc., 71, 3902 (1949).
Korean J. Chem. Eng.(Vol. 19, No. 5)
862 S.-K. Oh and C.-H. Sim
m-the
Walker, R. E. and Westenberg, A. A., J. Chem. Phys., 29, 1139(1958).
Wall, F. T. and Kidder, G. A., “Mutual Diffusion of Pairs of Gases,” J.Phys. Chem., 50, 235 (1946).
Weber, L. A., “Measurements of the Virial Coefficients and Equation ofState of the Carbon Dioxide+Ethane System in the SupercriticalRegion,” Int. J. Thermophys., 13, 1011 (1992).
Weissman, S., J. Chem. Phys., 40, 3397 (1974).Wilhelm, E. and Battino, R., “Binary Gaseous Diffusion Coefficients.
1. Methane and Carbon Tetrafluoride with n-Hexane, n-Heptane, n-Octane, and 2,2,4-Trimethylpentane at One-Atmosphere Pressureat 10-70. deg.,” J. Chem. Eng. Data, 17, 187 (1972).
Wilke, C. R. and Lee, C. Y., “Estimation of Diffusion Coefficients for
Gases and Vapors,” Ind. & Eng. Chem., 47, 1253 (1955).Wormald, C. J., Lewis, E. J. and Hutchings, D. J., J. Chem. Thermo-
dyn., 11, 1 (1979).Yeom, M. S., Chang, J. and Kim, H., “Development of the Semi-e
pirical Equation of State for Square-well Chain Fluid Based on Statistical Associating Fluid Theory (SAFT),” Korean J. Chem. Eng.,17, 52 (2000).
Young, C. L., Ph.D. Thesis, University of Bristol (1967).Young, C. L., Trans. Faraday Soc., 64, 1537 (1968).Zaalishvili, Sh.D., Zh. Fiz. Khim., 30, 189 (1956).Zandbergen, P. and Beenakker, J. J. M., Physica, Grav., 33, 343
(1967).
September, 2002