Effects of dilute aqueous NaCl solution on caffeine aggregation Effects of dilute aqueous NaCl...
11
Effects of dilute aqueous NaCl solution on caffeine aggregation Bhanita Sharma and Sandip Paul Citation: The Journal of Chemical Physics 139, 194504 (2013); doi: 10.1063/1.4830414 View online: http://dx.doi.org/10.1063/1.4830414 View Table of Contents: http://scitation.aip.org/content/aip/journal/jcp/139/19?ver=pdfcov Published by the AIP Publishing This article is copyrighted as indicated in the article. Reuse of AIP content is subject to the terms at: http://scitation.aip.org/termsconditions. Downloaded to IP: 14.139.196.4 On: Thu, 16 Jan 2014 05:26:48
Transcript of Effects of dilute aqueous NaCl solution on caffeine aggregation Effects of dilute aqueous NaCl...

Effects of dilute aqueous NaCl solution on caffeine aggregationBhanita Sharma and Sandip Paul Citation: The Journal of Chemical Physics 139, 194504 (2013); doi: 10.1063/1.4830414 View online: http://dx.doi.org/10.1063/1.4830414 View Table of Contents: http://scitation.aip.org/content/aip/journal/jcp/139/19?ver=pdfcov Published by the AIP Publishing
This article is copyrighted as indicated in the article. Reuse of AIP content is subject to the terms at: http://scitation.aip.org/termsconditions. Downloaded to IP:
14.139.196.4 On: Thu, 16 Jan 2014 05:26:48

THE JOURNAL OF CHEMICAL PHYSICS 139, 194504 (2013)
Effects of dilute aqueous NaCl solution on caffeine aggregationBhanita Sharma and Sandip Paula)
Department of Chemistry, Indian Institute of Technology, Guwahati 781039, Assam, India
(Received 22 July 2013; accepted 31 October 2013; published online 20 November 2013)
The effect of salt concentration on association properties of caffeine molecule was investigatedby employing molecular dynamics simulations in isothermal-isobaric ensemble of eight caffeinemolecules in pure water and three different salt (NaCl) concentrations, at 300 K temperature and1 atm pressure. The concentration of caffeine was taken almost at the solubility limit. With increas-ing salt concentration, we observe enhancement of first peak height and appearance of a second peakin the caffeine-caffeine distribution function. Furthermore, our calculated solvent accessible area val-ues and cluster structure analyses suggest formation of higher order caffeine cluster on addition ofsalt. The calculated hydrogen bond properties reveal that there is a modest decrease in the averagenumber of water-caffeine hydrogen bonds on addition of NaCl salt. Also observed are: (i) decreasein probability of salt contact ion pair as well as decrease in the solvent separated ion pair forma-tion with increasing salt concentration, (ii) a modest second shell collapse in the water structure, and(iii) dehydration of hydrophobic atomic sites of caffeine on addition of NaCl. © 2013 AIP PublishingLLC. [http://dx.doi.org/10.1063/1.4830414]
I. INTRODUCTION
Caffeine (Fig. 1) is a naturally occurring chemical stim-ulant having the formula of C8H10N4O2 and molar mass of194.19 g. It is an example of a planar, hetero-atomic bicyclic,aromatic ring compound that, although somewhat polar, ex-hibits limited aqueous solubility. Caffeine can be classified asan alkaloid1, 2 and is regularly consumed in sources such astea, coffee, chocolate, and beverages and included in manymedicines.3, 4 It is naturally produced by several plants, in-cluding coffee beans, guarana, cacao beans, and tea, etc. Itacts as a natural pesticide that paralyzes and kills certain in-sects feeding on the plants.5 It possesses purine ring systemin its backbone and is a biologically important compound. Ithas many effects on the body’s metabolism and is used as adrug for treating headaches, asthma, boosting mood, etc.
Solute molecules when dissolved in water can signifi-cantly affect the structuring of water molecules in aqueoussolutions.6 When a solute molecule is present in aqueous en-vironment, its functional groups must interact with the sur-rounding water, and its presence can impose a structuringpattern on the adjacent solvent molecules, which differs fromthat of pure bulk water.7, 8 These solutes may self-aggregate inaqueous medium depending on the interaction of these soluteswith water. Recent studies on interaction of caffeine moleculewith solvent water showed highly complex hydration patterncompared to that of a smaller hydrophobic molecule such asmethane. For small hydrophobic solutes, an adjacent watermolecule can straddle the solute to make hydrogen bonds toother water molecules, with neither of its protons or lone pairsdirectly pointing at the solute, which would involve the lossof a hydrogen bond.9 Therefore, the aggregation of such smallhydrophobic solutes is entropy driven due to the restriction
a)Electronic mail: [email protected]
of rotational freedom of these water molecules adjacent tothe solutes. However, in case of extended hydrophobic sur-face, water structural reorganization at the solute surface isrequired, as it becomes impossible for water molecules tostraddle the surface and still forms hydrogen bonds to otherwater molecules off to its side.6, 10 Therefore, to maximizethe total interaction, a water molecule prefers to sacrifice onepossible bonding interaction by pointing one hydrogen atomor lone pair directly at the non-hydrogen bonding surface, asthe resulting loss of one hydrogen bond is energetically favor-able than the loss of three hydrogen bonds that would resultif it adopted an orientation of waters as that of adjacent to amethane molecule.6, 11–13 Thus, when such larger hydropho-bic solutes aggregate in aqueous solution, these hydrophobi-cally structured water molecules are liberated, as the surfacearea accessible to water molecules decreases which results inregain of lost hydrogen bonds, and, therefore, aggregation isenthalpy driven. The aggregation of caffeine molecule in wa-ter is very interesting to study because of the simultaneouspresence of hydrophobic methyl (-CH3) groups and extendedflat hydrophobic faces, as well as three proton acceptor groups(O11, O13, N9). There is no proton donor group in the caf-feine molecule. Due to the close proximity of these differ-ent groups in the solute, structuring of solvent around oneatom contributes to the structuring around adjacent atoms aswell, and this results in highly anisotropic and very complexdistribution of water molecules around caffeine molecule.6
The presence of hydrophobic groups in the molecule lim-its its solubility in water and leads to association with likemolecules or complexation with other drug molecules. Infact, several experimental and theoretical studies were car-ried out on self and hetero-association of caffeine moleculein aqueous medium.14, 16–19 It is found in literature that caf-feine molecules self-aggregate in water above the concentra-tion of 0.1 M.20 To know how solute molecules influence in
0021-9606/2013/139(19)/194504/10/$30.00 © 2013 AIP Publishing LLC139, 194504-1
This article is copyrighted as indicated in the article. Reuse of AIP content is subject to the terms at: http://scitation.aip.org/termsconditions. Downloaded to IP:
14.139.196.4 On: Thu, 16 Jan 2014 05:26:48

194504-2 B. Sharma and S. Paul J. Chem. Phys. 139, 194504 (2013)
1N
2C3N
4C
5C
6C
9N
8C
7N
13O
11O
14CH3
8H
12CH3
10CH3
FIG. 1. Caffeine structure and atomic numbering of caffeine.
changing the structure of solvent water, it is important to un-derstand the properties of that solute in solution and its inter-action with itself and other cosolutes.
Again it is well known that hydrophobic interaction ismarkedly influenced by the presence of salt ions in water.21
Salt ions are naturally present in all biological systems and anessential component of living systems. In fact, the ionic envi-ronment in water is indispensable for making the ideal struc-ture or conformation of biological macromolecules.22 The ef-fect of salt ions on the self-assembly of biological moleculesis very significant. Depending on the nature and concentra-tion of the salt solution, either association or dissolution ofhydrophobic molecules in water may take place. There aresome experimental data available on the solubility of caf-feine in presence of urea,16, 23 guanidium chloride,23 KCl,23
sucrose,24 and alcohol.25 Recently some experimental studieson the effects of several cosolutes on the association prop-erties of caffeine have shown the change of self-associationconstant in presence of some salts of Hofmeister series, in-creasing from NaClO4 to NaSCN to NaCl to Na2SO4.26 Also,molecular level study on the influence of solvent and solu-tion ionic strength on the self and hetero-association proper-ties of caffeine and actinocin derivatives have been studied.18
However, there is no information regarding the effect of dif-ferent concentrations of salt on self-association properties ofcaffeine, change in the possibility of formation of hydrogenbond with solvent, and change in solubility limit of caffeineupon addition of salt. Motivated by the above considerations,we explore the effect of different concentrations of NaCl salton caffeine self-association.
In the present study, we have carried out a series ofmolecular dynamics (MD) simulations to understand the self-association behavior of caffeine in pure water and in differentconcentrations of NaCl salt in water. The goals of the presentstudy are: (i) to investigate the aggregate formation of caf-feine at different concentrations of salt solution, (ii) to pro-vide a molecular level description of the interactions betweencaffeine, water, and ions in solution, (iii) to study the struc-tural arrangement of caffeine molecule in aggregates, and (iv)to examine any change in the possibility of formation of hy-drogen bonds between hydration sites of caffeine and water atdifferent salt concentrations. The outline of the present paperis as follows. The models and simulation details are brieflydescribed in Sec. II, the results are discussed in Sec. III andwe summarize our conclusion in Sec. IV.
II. MODELS AND SIMULATION METHOD
We have carried out MD simulation of 8 caffeinemolecules in pure water as well as in aqueous NaCl solutionof varying concentration. Since the solubility limit of caffeinein pure water was reported to be 0.1 M,20 we have consideredall our systems near to its solubility limit. The systems consid-ered in this study are summarized in Table I. It is worth notingthat we have kept the total number of water molecules fixedto 4500 in all cases and Na+ and Cl− ions were added with-out replacing the water molecules. Further note that since ourgoal is to understand the aggregation of caffeine molecules onslight change of NaCl concentration, we have considered theconcentrations of NaCl in the dilute solution range.
In order to develop the partial charges of differentatomic sites, the caffeine molecule was first optimized withHF/6-31G* using Gaussian 03,27 and then fitting the atomiccharges using RESP (restrained electrostatic potential) mod-ule of AMBER 10.28 The rest of the parameters for caf-feine were generated using the General AMBER Force Field(GAFF) with the ANTECHAMBER module of AMBER10.The atomic partial charges developed for the present MD sim-ulation are given in Table II. Furthermore, in Table I, we havecompared the density of our caffeine-water system (S0) withthe available experimental and other simulation density valuesreported elsewhere.14, 29 We remark that although the agree-ment is little far from perfect, the experimental and simu-lation densities are in reasonable accord. Na+ and Cl− ionswere added using the Leap module of AMBER 10 moleculardynamics package. We have used the popular extended simplepoint-charge (SPC/E)30 model for water.
The MD simulations were carried out using the AMBER10 suite of programs in isothermal isobaric (NPT) ensembleat 300 K temperature and 1 atm pressure with a time step of2 fs. At the beginning of the simulation, caffeine moleculeswere randomly distributed in the cubic simulation box. Toobtain a reasonable initial structure, for each system, the ini-tial configurations (generated using the Packmol program31)were first energy minimized for 5000 steps with 2500 steps ofsteepest descent minimization followed by 2500 steps of con-jugate gradient method. Each system was then heated slowlyfrom 0 to 300 K over 20 ps in the canonical (NVT) ensem-ble. To remove the edge effects, periodic boundary conditionwas applied for all the simulations and Langevin dynamics
TABLE I. Ncaff, Nwat , and Nsalt represent the number of caffeine, the num-ber of water, and the number of NaCl molecules, respectively. Csalt, Ccaff, andρ represent the salt concentration, caffeine concentration, box length, and thedensity, respectively.
System Ncaff Nwat Nsalt Csalt (M) Ccaff (M) ρ (g cm−3) Box length (Å)
S0 8 4500 0 0 0.097 1.01 51.54(1.00196a)(0.9963b)
S1 8 4500 20 0.24 0.097 1.02 51.63S2 8 4500 50 0.60 0.096 1.03 51.75S3 8 4500 70 0.83 0.095 1.04 51.85
aAvailable experimental value for density taken from Ref. 29.bAvailable simulation value for density taken from Ref. 14.
This article is copyrighted as indicated in the article. Reuse of AIP content is subject to the terms at: http://scitation.aip.org/termsconditions. Downloaded to IP:
14.139.196.4 On: Thu, 16 Jan 2014 05:26:48

194504-3 B. Sharma and S. Paul J. Chem. Phys. 139, 194504 (2013)
TABLE II. Partial charges for different atomic sites of caffeine. e is theelementary charge.
Atom Charge (e) Atom Charge (e)
N1 0.028 C2 0.333N3 0.036 C4 0.222C5 − 0.019 C6 0.341N7 0.043 C8 0.163N9 − 0.617 C10 0.039O11 − 0.630 C12 − 0.013O13 − 0.631 C14 − 0.204H8 0.189 H (C10) 0.058H (C12) 0.067 H (C14) 0.117
method with a collision frequency of 1 ps−1 was used to con-trol the temperature. The Berendsen barostat32 was used tomaintain the pressure with a pressure relaxation time of 2 ps.Bonds involving hydrogen were constrained by applying theSHAKE algorithm and a cut off of 12.0 Å was applied for allnonbonding interactions. The long-range electrostatic inter-actions were treated using the particle mesh Ewald method.33
After 5 ns equilibration, the simulations were carried out foranother 15 ns production run in NPT ensemble. The resultsreported in this article are from these last 15 ns of simulationperiods.
III. RESULTS AND DISCUSSION
A. Radial distribution function and co-ordinationnumber analysis
To understand the solvation and possible association ofcaffeine molecules in different salt concentrations, we havestudied the molecular interaction between caffeine, water, andions (Na+ and Cl−). Radial distribution function (rdf) is an ef-fective way of describing the average structure of moleculesaround a central reference molecule. We have calculated rdfsof caffeine-caffeine and caffeine-water considering center ofmasses of caffeine and water. Further, to study the local struc-ture of salt solution, we have also calculated the ion-ion, ion-water and water-water rdfs and rdfs involving selected atomicsites of caffeine and different solution species. For furtheranalysis, first shell water coordination number around caf-feine is calculated using the relation
nαβ = 4πρβ
∫ r2
r1
r2gαβ(r)dr, (1)
where nαβ represents the number of atoms of type β surround-ing atom α in a shell extending from r1 to r2 and ρβ is thenumber density of β in the system. So, for the calculations offirst shell coordination number, the typical values of r1 andr2 are zero and the distance of first minimum in the corre-sponding radial distribution function, respectively. Note that,the standard errors reported in this article are calculated usingblock averages over 3 ns.
In Fig. 2, we have shown the rdf of caffeine-caffeine cen-ter of mass. The first peak and the first minimum of this distri-bution function appear at 3.7 Å and 6.4 Å , respectively. It isinteresting to note that though the concentrations of caffeine
0 2 4 6 8 10r(Å)
0
20
40
60
80
100
120
g(r)
FIG. 2. Radial distribution functions of caffeine around caffeine as calcu-lated from the center of mass of caffeine. Black, red, green, and blue colorsare for systems S0, S1, S2, and S3, respectively.
in all the four systems are very similar and are slightly belowthe solubility limit, the first peak height of g(r) increases withincreasing salt concentration indicating increasing interactionbetween caffeine molecules. Further, on addition of NaCl asecond peak also starts developing at 7.2 Å. In Fig. 3, wehave shown the change in co-ordination number of caffeinearound caffeine for first and second coordination shells of caf-feine. In the same figure, we have also included the expectedcaffeine coordination numbers if the only change with addedsalt came through the number density of caffeine in differ-ent systems. It can be seen immediately that the number ofcaffeine molecules in the first and second coordination shellsincreases with increasing salt concentrations. These findingssuggest a possible association of caffeine molecules withincreasing salt concentration. Further, if the association of
0.2
0.4
0.6
0.8
1
1.2
1.4
1.6
Coo
rdin
atio
n N
o.
First shellSecond shell
S0 S1 S2 S3
Systems
FIG. 3. Change in co-ordination number of caffeine around caffeine for firstand second coordination shell. Black and red colors are for up to first andsecond shell coordination numbers, respectively. Triangles represent the caf-feine coordination numbers if the only change with added salt came throughthe number density of caffeine.
This article is copyrighted as indicated in the article. Reuse of AIP content is subject to the terms at: http://scitation.aip.org/termsconditions. Downloaded to IP:
14.139.196.4 On: Thu, 16 Jan 2014 05:26:48

194504-4 B. Sharma and S. Paul J. Chem. Phys. 139, 194504 (2013)
0 2 4 6 8 10 12r(Å)
0
0.5
1
1.5
g(r)
FIG. 4. Radial distribution functions of water around the center of mass ofcaffeine. Black, red, green, and blue colors are for systems S0, S1, S2, andS3, respectively.
caffeine takes place it would be reflected in its hydration pat-tern. So, to understand the effect of NaCl concentration oncaffeine hydration we have computed the average structureof water around caffeine through rdf of water oxygen atomaround center of mass of caffeine (Fig. 4) in each system.The first peak height of this distribution function in all thefour systems is below the bulk limit which can be attributedto the exclusion of water from the vicinity of caffeine. Further,the peak height decreases with increasing NaCl concentrationindicating more exclusion of water molecules from caffeinewith increasing salt concentration.
Caffeine molecule contains different types of functionalgroups and they have different hydration patterns. Althoughsomewhat polar, caffeine molecule shows limited aqueoussolubility and is relatively hydrophobic due to its weakly hy-drating faces. It has been reported that both in pure waterand in presence of Na+ and Cl− ions, a caffeine moleculemakes hydrogen bonds with three water molecules.18 The hy-drophilic sites of caffeine are the two carbonyl oxygen atomsO11 and O13, as well as the ring atom N9, and they serveas hydrogen bond acceptors to water. Moreover, H8 protonmay also interact with water molecules due to its higher thannormal positive partial charges (see Table II). In Fig. 5, wehave shown the rdfs of water oxygen atom around each ofthese hydration sites in pure water as well as in differentsalt concentrations. In the same figure the rdf involving wa-ter oxygen atom and nonpolar C8 carbon (to which H8 is at-tached to) is also shown. The appearances of the first peakpositions of these rdfs (for O11, O13, and N9 in particular)suggest the existence of hydrogen bonding interactions be-tween caffeine and water. Further, the number of first shellwater molecules (i.e., hydration number) around differentatomic sites of caffeine calculated using Eq. (1) is shown inTable III. The hydration number values indicate presence oftwo water molecules in the first hydration shell of each sites ofO11 and O13 atoms. Though our calculated hydration numbervalues for these two atomic sites match well with the valuesreported earlier for caffeine in pure water, for N9 atom thehydration number reported here is slightly lower than that re-
0 2 4 6 8 10 12r(Å)
0
0.5
1
1.5
2
g(r)
0
0.5
1
1.5
2
g(r)
0 2 4 6 8 10 12r(Å)
0
0.5
1
1.5
2
g(r)
0 2 4 6 8 10 12r(Å)
(a)
(b) (c)
(d) (e)
FIG. 5. Radial distribution functions of water oxygen atom around selectiveatomic sites of caffeine. (a) O13-Ow , (b) O11-Ow , (c) N9-Ow , (d) C8-Ow ,and (e) H8-Ow . Black, red, green, and blue colors are for systems S0, S1, S2,and S3, respectively.
ported earlier.14 The small deviation in this value might bedue to the fact of different caffeine and water models consid-ered in our study. As can be seen from Table III, the hydrationnumber decreases for all atomic sites of caffeine including thehydrophilic carbonyl oxygens, but the effect is much morepronounced for C8 and H8 atoms. In this regard it is worthnoting that we have observed that on addition of salt, a peakat around 4 Å in the C8-C8 distribution function (not shown)started developing, which was originally absent in system S0.Further, the FT-IR (Fourier transform-infrared spectroscopy)study of caffeine-water binary solution reported that, com-pared to monomeric caffeine unit where complete hydrationof C=O groups of caffeine is possible, stacking of caffeinemolecule causes the partial hydration of its C=O groups.15
TABLE III. Hydration number around selected atomic sites of caffeine andaround Na+ and Cl− ions.
Atoms S0 S1 S2 S3
O11 2.06 (±0.01) 2.05 (±0.01) 2.02 (±0.01) 1.95 (±0.01)O13 1.98 (±0.01) 1.93 (±0.01) 1.93 (±0.01) 1.84 (±0.01)N9 1.35 (±0.01) 1.35 (±0.01) 1.33 (±0.01) 1.28 (±0.01)H8 2.51 (±0.01) 2.50 (±0.01) 2.44 (±0.02) 2.05 (±0.01)C8 7.65 (±0.04) 7.53 (±0.04) 7.24 (±0.04) 7.01 (±0.04)Na+ . . . 5.38 (±0.01) 5.01 (±0.02) 4.87 (±0.01)Cl− . . . 7.52 (±0.03) 7.44 (±0.03) 7.38 (±0.03)
This article is copyrighted as indicated in the article. Reuse of AIP content is subject to the terms at: http://scitation.aip.org/termsconditions. Downloaded to IP:
14.139.196.4 On: Thu, 16 Jan 2014 05:26:48
194504-5 B. Sharma and S. Paul J. Chem. Phys. 139, 194504 (2013)
0
0.5
1
1.5
2
0
0.5
1
1.5
2
g(r)
0 2 4 6 8 10 12r(Å)
0
0.5
1
1.5
2
(a)
(b)
(c)
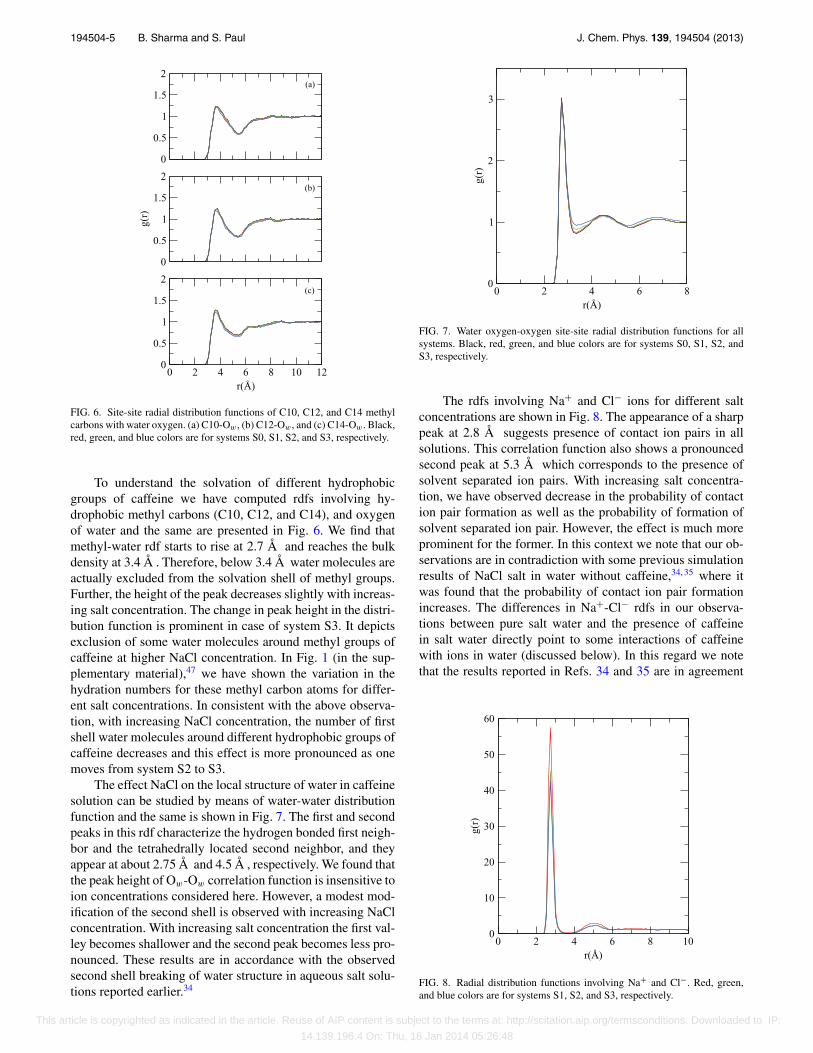
FIG. 6. Site-site radial distribution functions of C10, C12, and C14 methylcarbons with water oxygen. (a) C10-Ow , (b) C12-Ow , and (c) C14-Ow . Black,red, green, and blue colors are for systems S0, S1, S2, and S3, respectively.
To understand the solvation of different hydrophobicgroups of caffeine we have computed rdfs involving hy-drophobic methyl carbons (C10, C12, and C14), and oxygenof water and the same are presented in Fig. 6. We find thatmethyl-water rdf starts to rise at 2.7 Å and reaches the bulkdensity at 3.4 Å . Therefore, below 3.4 Å water molecules areactually excluded from the solvation shell of methyl groups.Further, the height of the peak decreases slightly with increas-ing salt concentration. The change in peak height in the distri-bution function is prominent in case of system S3. It depictsexclusion of some water molecules around methyl groups ofcaffeine at higher NaCl concentration. In Fig. 1 (in the sup-plementary material),47 we have shown the variation in thehydration numbers for these methyl carbon atoms for differ-ent salt concentrations. In consistent with the above observa-tion, with increasing NaCl concentration, the number of firstshell water molecules around different hydrophobic groups ofcaffeine decreases and this effect is more pronounced as onemoves from system S2 to S3.
The effect NaCl on the local structure of water in caffeinesolution can be studied by means of water-water distributionfunction and the same is shown in Fig. 7. The first and secondpeaks in this rdf characterize the hydrogen bonded first neigh-bor and the tetrahedrally located second neighbor, and theyappear at about 2.75 Å and 4.5 Å , respectively. We found thatthe peak height of Ow-Ow correlation function is insensitive toion concentrations considered here. However, a modest mod-ification of the second shell is observed with increasing NaClconcentration. With increasing salt concentration the first val-ley becomes shallower and the second peak becomes less pro-nounced. These results are in accordance with the observedsecond shell breaking of water structure in aqueous salt solu-tions reported earlier.34
0 2 4 6 8r(Å)
0
1
2
3
g(r)
FIG. 7. Water oxygen-oxygen site-site radial distribution functions for allsystems. Black, red, green, and blue colors are for systems S0, S1, S2, andS3, respectively.
The rdfs involving Na+ and Cl− ions for different saltconcentrations are shown in Fig. 8. The appearance of a sharppeak at 2.8 Å suggests presence of contact ion pairs in allsolutions. This correlation function also shows a pronouncedsecond peak at 5.3 Å which corresponds to the presence ofsolvent separated ion pairs. With increasing salt concentra-tion, we have observed decrease in the probability of contaction pair formation as well as the probability of formation ofsolvent separated ion pair. However, the effect is much moreprominent for the former. In this context we note that our ob-servations are in contradiction with some previous simulationresults of NaCl salt in water without caffeine,34, 35 where itwas found that the probability of contact ion pair formationincreases. The differences in Na+-Cl− rdfs in our observa-tions between pure salt water and the presence of caffeinein salt water directly point to some interactions of caffeinewith ions in water (discussed below). In this regard we notethat the results reported in Refs. 34 and 35 are in agreement
0 2 4 6 8 10r(Å)
0
10
20
30
40
50
60
g(r)
FIG. 8. Radial distribution functions involving Na+ and Cl−. Red, green,and blue colors are for systems S1, S2, and S3, respectively.
This article is copyrighted as indicated in the article. Reuse of AIP content is subject to the terms at: http://scitation.aip.org/termsconditions. Downloaded to IP:
14.139.196.4 On: Thu, 16 Jan 2014 05:26:48

194504-6 B. Sharma and S. Paul J. Chem. Phys. 139, 194504 (2013)
0
1
2
3
4
5
6
7g(
r)
0 2 4 6 8 10r(Å)
0
1
2
3
4
g(r)
0 2 4 6 8 10r(Å)
(a) (b)
(c) (d)
FIG. 9. Site-site radial distribution functions involving: (a) Na+-Ow , (b)Na+-Hw , (c) Cl−-Ow , and (d) Cl−-Hw , respectively. Red, green, and bluecolors are for systems S1, S2, and S3, respectively.
qualitatively with each other despite of the fact of differentmodels for water and salt used in those studies.
The ion-water pair correlation functions are presentedin Fig. 9. These include Na+-Ow, Na+-Hw, Cl−-Ow, andCl−-Hw rdfs for three different concentrations of NaCl.The corresponding hydration number values are included inTable III. With increasing ion concentration, since the proba-bility of contact ion pair formation decreases (as observed inNa+-Cl− distribution function) one would expect an increasein the solvent separated ion pair formation and thereby a risein the ion-water hydration number value. However, contraryto this, we observe a decrease in peak height in ion-water rdfsand hydration number value with increasing ion concentra-tion. The effect is more pronounced for Na+-Ow rdf. This isdue to the fact of strong interaction between Na+ and O11atomic sites of caffeine (discussed below). Further, the firstpeak of Na+-Hw distribution function appears farther awaythan the first maximum in the Na+-Ow distribution function.This suggests that the oxygen atoms of water molecules arepointing toward the Na+ ion and the water hydrogen atoms arefacing bulk water. The examinations of the positions of firstpeak appearances of Cl−-Ow and Cl−-Hw indicate that thewater hydrogen atom points toward the chloride ion, whereasthe oxygen atom of water molecule faces bulk water. More-over, the calculated number of water molecules around a chlo-ride ion decreases with increasing ion concentration. How-ever, this decrease in the Cl−-Ow is less pronounced whencompared with that of Na+-Ow.
To investigate the interaction of caffeine molecules withions, we have shown the rdfs between Na+ ions around twoelectronegative carbonyl oxygens O11 and O13, and Cl−
ions around more electropositive hydrogen H8 of caffeinemolecule (Fig. 10). The principal observation derived from
0
0.5
1
1.5
g(r)
0
0.5
1
1.5
2
2.5
g(r)
0 2 4 6 8 10 12 14r(Å)
0
0.5
1
1.5
g(r)
(a)
(b)
(c)
FIG. 10. Site-site radial distribution functions involving: (a) Na+-O13, (b)Na+-O11, and (c) Cl−-H8. Red, green, and blue colors are for systems S1,S2, and S3, respectively.
the rdfs between Na+ and carbonyl oxygens is that Na+ ionsexhibit an appreciable affinity for carbonyl oxygen O11 andas the concentration of salt increases, the interaction betweenNa+ and O11 increases, as demonstrated by stronger peakheight at higher concentrations. This leads to decrease in thecontact ion pair formation in presence of caffeine with in-creasing salt concentration. The first peak height of rdf of Na+
around O13 does not change much on increasing salt concen-tration, and it barely crosses unity suggesting weak interactionof Na+ ions with O13. The rdfs involving Cl− ions and H8 donot exhibit an appreciable amount of affinity of the former forthe later in caffeine as can be seen from the first peak heightwhich limits up to unity.
B. Atomic density analysis
The molecular orientation of liquid water around hy-drophobic solutes is governed by the optimization of hydro-gen bonding interactions. As already mentioned, the distri-bution of water molecules around caffeine is quite complexbecause of the complicated arrangement of hydrogen bondingfunctional groups in caffeine. We have carried out atomic den-sity analysis using the Visual Molecular Dynamics (VMD)program. In Fig. 11(a), we have shown the mass density mapof water oxygen atom with a cell side of 0.5 Å within 3.4 Åaround a caffeine monomer in the system S3. Contour den-sity is calculated for 5 ns trajectory, when a caffeine moleculeis remained as a monomer, and rest of the caffeines are tak-ing part in aggregation. The monomer is kept fixed at thecenter of the simulation box with respect to the center ofmass of the molecule. From this figure, it can be clearly seenthat water density around caffeine is highly anisotropic and
This article is copyrighted as indicated in the article. Reuse of AIP content is subject to the terms at: http://scitation.aip.org/termsconditions. Downloaded to IP:
14.139.196.4 On: Thu, 16 Jan 2014 05:26:48

194504-7 B. Sharma and S. Paul J. Chem. Phys. 139, 194504 (2013)
FIG. 11. Contours of solvent water density within 3.4 Å around caffeinemonomer ((a), left) and around caffeine molecules stacking together ((b),right) during simulation.
solvent molecules prefer some positions of solutes more thanthe other, such as the two carbonyl oxygen atoms, the ringnitrogen atoms and the extended non-hydrogen bonding pla-nar surfaces. There is a band of high solvent density wrap-ping around the two carbonyl oxygen atoms, as two watermolecules are hydrogen bonded to these atoms. Another bandof solvent density wraps around the ring nitrogen atoms andlocalizes over the hydrophobic faces. As discussed earlier,water molecules prefer to sacrifice one possible bonding inter-action by pointing one hydrogen atom or lone pair directly atthe non-hydrogen bonding surface, as the resulting loss of onehydrogen bond is energetically favorable than the loss of threehydrogen bonds that would result if it adopted an alternateorientation, such as, water molecules adjacent to a methanemolecule.6 Therefore, this kind of orientation is required tomaximize the total interaction. In addition to this, the hy-drophobic faces of caffeine are not a uniformly hydrophobicsurface, but instead, have hydrogen bonding functional groupsall around the periphery, and structuring of water moleculesaround these groups also contributes to the structuring re-quirements above and below the plane of the rings. A smallcloud of water density is also observed around H8 hydrogen.
Figure 11(b) represents the contours of solvent waterdensity within 3.4 Å around six caffeine molecules stackingtogether. When the hydrophobic faces of caffeine moleculespair up by stacking one above another, the water molecules,which were initially structured above and below the caffeinemonomer surface, are now liberated and recover their lost hy-drogen bonds. Experimental studies showed that such pair-ing is enthalpy driven.36, 37 From the figure it can be seen thatwater density is not symmetric around the stack, and watermolecules prefer to occupy the available hydrogen bondingsites around the periphery of caffeine molecules. Clouds ofwater density hydrating the hydrophobic faces above and be-low the stack can also be seen, because of the fact that wa-ter molecules present at these faces are free to interact withbulk water. The aggregation of caffeine molecules by suchstacking results in decrease in surface area accessible to wa-ter molecules.
1 2 3 4 5 6 7 8cluster size n
0
0.2
0.4
0.6
0.8
1
mn /
m1
Φ(S0)=0.84Φ(S1)=0.66Φ(S2)=0.62Φ(S3)=0.50Φ(Expt.)=0.62
FIG. 12. Probability distribution of clusters of different sizes with respect tomonomer for all systems. Osmotic coefficient values for different systems arerepresented by �. Black, red, green, and blue colors are for systems S0, S1,S2, and S3, respectively.
C. Cluster structure analysis
To discuss caffeine self association in more details, wehave carried out cluster structure analyses. We have definedclusters as an assembly of caffeine molecules where onecaffeine molecule is within 6.4 Å of neighboring caffeinemolecules in the cluster. Probability distribution of clustersof various sizes n, with respect to monomer, as calculated forall the systems are shown in Fig. 12. It is evident that, as theconcentration of NaCl increases, more and more higher orderclusters of caffeine are formed, and their probability with re-spect to monomer increases. Further, contrary to previouslyreported simulation results of caffeine-TIP4P water system,14
our cluster structure distribution for system S0 exhibits that,relative to monomer and dimer formation, the formation ofhigher order caffeine cluster is negligibly small. This discrep-ancy may be due to use of lower caffeine concentrations inour study (slightly below its solubility limit) as well as dif-ferent caffeine and water models used in our study. From thisdistribution, we further estimated the osmotic coefficient (�)values for different systems and the same are also shown inFig. 12. For system S0, the calculated value of � is 0.84as compared to the experimental value of 0.62 (measured at302.8 K and 0.1116 M caffeine concentration).36 Addition ofsalt causes formation of more and more higher order clustersand as a result, the � value decreases.
D. Solvent accessible surface area
The solvent accessible area (SASA) describes the areaover which contact between solute and solvent can occur. TheSASA of caffeine molecules in the simulations have beencomputed using the VMD program, which is based on thealgorithm of Shrake-Rupley38 which creates many points onthe surface of each (heavy) atom and determines whethereach point is occluded or exposed to solvent. The probe ra-dius of 1.4 Å has been used, which corresponds to the sizeof a water molecule. The distribution of SASA of caffeine
This article is copyrighted as indicated in the article. Reuse of AIP content is subject to the terms at: http://scitation.aip.org/termsconditions. Downloaded to IP:
14.139.196.4 On: Thu, 16 Jan 2014 05:26:48

194504-8 B. Sharma and S. Paul J. Chem. Phys. 139, 194504 (2013)
TABLE IV. Solvent accessible surface area per caffeine for differentsystems.
System SASA (Å2)
S0 297 (±2)S1 293 (±2)S2 287 (±3)S3 265 (±3)
molecules as a function of simulation time in all the systems isshown in Fig. 2 (in the supplementary material).47 We observethat there is certain association among caffeine molecules asthe simulation proceeds and association of caffeine occurs inhigher extent for system S3. The average value of surface areaaccessible to solvent is summarized in Table IV, and we cansee that the average SASA value decreases as NaCl concen-tration increases providing clear evidence of aggregation ofcaffeine on increasing salt concentration. The formation ofcaffeine aggregation in NaCl solution is further supported bythe snapshots of different systems taken at 5 ns interval (dis-cussed below).
From the visualization of different systems from initial tothe final step in VMD, it is noticed that in system S0, where nosalt was added, caffeine molecules were seen to be preferredto remain as monomer for most of the simulation time. It tookconsiderable amount of time for a dimer to form, which wasnot stable and broke into two monomeric units immediatelyafter its formation. As the simulation proceeds, the forma-tion and breaking of dimers continued in some interval, and atthe end of simulation the system contains one dimer and sixmonomers. On addition of salt, a significant difference hasbeen observed compared to system S0. We have observed aconsiderable aggregation (stacking) of caffeine molecules inthose systems. Initially, dimer is formed, which after stabiliza-tion gives rise to trimer and then tetramer is formed by cap-turing another monomeric unit. The progression of stackingcontinued in this fashion with many breaking events of largeraggregates to smaller one and again reformation of larger ag-gregates as the simulation proceeds. Finally, the stacks werestabilized and lasted uninterruptedly for nearly 1 ns. Thesnapshots of different systems in 5 ns intervals are shown inFig. 3 (in the supplementary material).47 From the visual ob-servation of snapshots, it can be seen that the formation oflarger aggregates occurs within a shorter time period in sys-tem S3, where concentration of NaCl is the highest among allthe systems.
E. Preferential interaction of caffeine
The Kirkwood-Buff theory39–44 provides a statisticalthermodynamic framework for evaluating the preferential in-teraction parameter, τ , from molecular distribution functionfor a solute (c for caffeine), in a solvent mixture of water (w)and cosolutes (s) via
τ csw = ρs(Gcs − Gcw), (2)
where Gcs and Gcw are Kirkwood-Buff G-factors, and ρs isthe number density of cosolvent.
Preferential interaction parameter of caffeine with likemolecules over water, τ c
cw, can be calculated by consideringa caffeine molecule as the solute, and it can be expressed as
τ ccw = ρc(Gcc − Gcw), (3)
where the Kirkwood-Buff integrals Gcc and Gcw can be ob-tained from the distribution function of caffeine around caf-feine (gcc(r)) and that of water around caffeine (gcw(r)), re-spectively, and ρc is the number density (N/V) of caffeine inthe system.45
For a grand canonical ensemble, Gij (for species i and j)is defined as
Gij = 4π
∫ ∞
0[gij (r) − 1]r2dr. (4)
For a closed system, the above equation can be written as
Gij ≈ 4π
∫ R
0[gij (r) − 1]r2dr, (5)
where R is the distance at which the integral approaches zero.A positive value of the preferential interaction parameter, τ c
cw,indicates more preference of caffeine to like molecules overwater.
In Fig. 13, we have shown the changes in the τ ccw value as
function of distance for different concentrations of salt solu-tion. For system S0, τ c
cw has slightly positive (non zero) valuesuggesting that caffeine does not show much greater prefer-ence to another caffeine molecule over water molecule. Thisis obviously expected as the concentration of caffeine is al-most at the solubility limit. Note that another computer sim-ulation study of caffeine-water system without salt has alsoreported positive value τ c
cw.16 However, when salt is addedin water, a relatively larger positive τ c
cw values are obtainedcompared to S0, and S3 shows the largest value for the pref-erential parameter, indicating a greater preference of caffeineto other caffeine molecules over water molecules. Note thatexperimental findings also reveal high positive value of Gcc
0 5 10 15r(Å)
-0.5
0
0.5
1
1.5
2
τc cw
FIG. 13. Preferential interaction parameter of caffeine for a caffeinemolecule over a water molecule (τ c
cw). Black, red, green, and blue colors arefor systems S0, S1, S2, and S3, respectively.
This article is copyrighted as indicated in the article. Reuse of AIP content is subject to the terms at: http://scitation.aip.org/termsconditions. Downloaded to IP:
14.139.196.4 On: Thu, 16 Jan 2014 05:26:48

194504-9 B. Sharma and S. Paul J. Chem. Phys. 139, 194504 (2013)
and negative value of Gcw for binary caffeine-water system.29
These findings suggest strong caffeine-caffeine interactionsand less hydration of caffeine molecules. Furthermore, ourcalculated potential of mean force (PMF) profiles of caffeine(not shown), estimated from caffeine-caffeine center of massdistribution functions, for different salt concentrations showa positive gradient that does not approach to zero at large-rdistances and acts as a corroborative evidence of caffeine as-sociation.
F. Hydrogen bond interaction
In aqueous solution, caffeine molecules can form hydro-gen bonds with water. It was already mentioned that a caffeinemolecule has three hydrogen bonding sites, and these are twocarbonyl oxygens O11 and O13 and a ring nitrogen atom N9.These atoms can only act as hydrogen acceptors. However, theH8 proton may also interact with water resembling to hydro-gen bonding due to its high partial charge, but the first peak ofH8-Ow distribution function shows much broader peak thanthat of a true hydrogen bond donor proton.14 Therefore, wehave carried out an analysis of average number of hydrogenbonds formed between water and above mentioned three hy-drogen acceptor sites of caffeine molecules. We have alsoestimated the number of water-water hydrogen bonds per wa-ter molecule, and the results are listed in Table V. Hydro-gen bonds are calculated based on the location of the firstminimum in the corresponding rdf as the cutoff distance be-tween donor (D) and acceptor (A), and the angle of H-D-Ais considered as 45◦. We have found that all the systems aredominated by water-water hydrogen bonds and they decreaseslightly with increasing salt concentrations. We, further, ob-served that the average number of water-caffeine (per caf-feine) hydrogen bond decreases only modestly on additionof salt. For example, the total number of hydrogen bondsformed by a caffeine molecule with water is 4.25 for sys-tem S0 and the same for system S3 is 4.07. Further insightinto caffeine-water hydrogen bonds reveals that the decreasein its value is dominated by the change in hydrogen bondsinvolving caffeine O13-water hydrogen atom. The loweringof C=O stretching frequency of caffeine in caffeine-watersystem (without salt) due to formation of stacking has alsobeen reported experimentally.15 In this context, we note thatthe formation of hydrogen bond between caffeine and waterdepends on the availability of hydrophilic groups of caffeinefor water molecules. The stacking between caffeine moleculesmay decrease the accessibility of caffeine hydrophilic groupsfor water molecules. Not only that, the structural arrange-
TABLE V. The number of water-water (per water) and water-caffeine (percaffeine) hydrogen bonds in different systems. w represents water and O11,O13, and N9 correspond to the different atomic sites of caffeine. The esti-mated standard error for all data is less than 0.002.
System HBw−w HBO11−w HO13−w HN9−w
S0 3.29 1.61 1.64 1.00S1 3.23 1.57 1.55 0.99S2 3.17 1.51 1.49 0.93S3 3.13 1.57 1.54 0.96
ment of stacks also affects hydrogen bond formation betweencaffeine and water. If polar and non-polar atomic groups ofcaffeine overlap in the stack, the possibility of formation ofhydrogen bonds with water decreases. On the other hand ifpolar groups are available for hydrogen bonding with wa-ter, the number of caffeine-water hydrogen bonds should notchange much.
IV. SUMMARY AND CONCLUSIONS
In this article, we have carried out classical moleculardynamics simulations to investigate caffeine aggregation inpresence of NaCl salt. We considered four different salt con-centrations. From caffeine-caffeine center of mass distribu-tion function we have found that, on addition of salt, the firstpeak height increases and a second peak at 7.2 Å startedto develop. Since, in aqueous solution, molecular associationor dissolution of solute molecules is reflected in its hydra-tion pattern, we probed the solvation of caffeine molecules bymeans of caffeine center of mass-water distribution function.We have observed that addition of NaCl causes the exclusionof water molecules from caffeine hydrophobic surface. On theother hand, the hydrophilic site showed only a slight changein the hydration number value.
We have also investigated the structural properties in-volving different solution species with variation of salt con-centration as these are intimately related to the solvation pat-tern of caffeine. Contrary to aqueous NaCl solution withoutcaffeine,34 we have found that probability of contact ion pairsas well as solvent separated ion pairs decrease with increas-ing ion concentration. We trace that this discrepancy is dueto interactions between caffeine and salt. Furthermore, withincreasing salt concentration, a modest modification in thesecond solvation shell is found in the oxygen-oxygen radialdistribution function of water molecules.
To examine the solvation of caffeine more closely wehave also calculated preferential interaction parameter. It isobserved that with increasing salt concentration, a caffeinemolecule prefers to interact with another caffeine moleculeover water molecules. This fact acts as a corroborative evi-dence of what we observed in the caffeine-caffeine distribu-tion function. Our cluster structure analyses and SASA calcu-lations have also revealed association of caffeine moleculesat higher NaCl concentration. In specific, the formation ofhigher order caffeine clusters is observed on addition of salt.The stacking arrangements among caffeine molecules can beseen from the structure visualization taken at 5 ns intervals. Inthis context we note that nuclear magnetic resonance (NMR)studies suggest that the self-association of caffeine in solu-tion occurs through stacking with many possible orientationsof stacks.46 Finally, in consistence with observed distributionfunctions involving hydrophilic atomic sites of caffeine andwater molecules, our hydrogen bond properties calculationshave also revealed a slight decrease in the caffeine-water av-erage number of hydrogen bonds on addition of salt.
1M. Melnik, J. Inorg. Nucl. Chem. 43, 3035 (1981).2S. A. Shaker, Y. Farina, S. Mahmmod, and M. Eskender, Australian J. BasicAppl. Sci. 3, 3337 (2009).
This article is copyrighted as indicated in the article. Reuse of AIP content is subject to the terms at: http://scitation.aip.org/termsconditions. Downloaded to IP:
14.139.196.4 On: Thu, 16 Jan 2014 05:26:48

194504-10 B. Sharma and S. Paul J. Chem. Phys. 139, 194504 (2013)
3H. Terada and Y. Sakabe, J. Chromatogr. 291, 453 (1984).4T. Kumazawa, H. Seno, X. P. Lee, A. Ishii, K. W. Suzuki, K. Sato, and O.Suzuki, Anal. Chim. Acta 387, 53 (1999).
5Y.-S. Kim and H. Sano, Phytochemistry 69, 882 (2008).6J. W. Brady, L. Tavagnacco, L. Ehrlich, M. Chen, U. Schnupf, M. E. Him-mel, M.-L. Saboungi, and A. Cesàro, Eur. Biophys. J. 41, 369 (2012).
7A. Geiger, P. Mausbach, J. Schnitker, R. L. Blumberg, and H. E. Stanley,J. Phys. Colloques 45, C7-13-C7-30 (1984).
8J. N. Israelachvili and H. Wennerström, Nature (London) 379, 219(1996).
9F. H. Stillinger, Science 209, 451 (1980).10R. Zangi and B. J. Berne, J. Phys. Chem. B 112, 8634 (2008).11D. Chandler, Nature (London) 437, 640 (2005).12C.-Y. Lee, J. A. McCammon, and P. J. Rossky, J. Chem. Phys. 80, 4448
(1984).13S. H. Lee and P. J. Rossky, J. Chem. Phys. 100, 3334 (1994).14L. Tavagnacco, U. Schnupf, P. E. Mason, M.-L. Saboungi, A. Cesàro, and
J. W. Brady, J. Phys. Chem. B 115, 10957 (2011).15M. Falk, M. Gil, and N. Iza, Can. J. Chem. 68, 1293 (1990).16R. Sanjeewa and S. Weerasinghe, J. Mol. Struct.: THEOCHEM 944, 116
(2010).17Y. Cui, Int. J. Pharm. 397, 36 (2010).18A. V. Shestopalova, Biophysics 51, 335 (2006).19L. Tavagnacco, O. Engström, U. Schnupf, M.-L. Saboungi, M. E. Himmel,
G. Widmalm, A. Cesàro, and J. W. Brady, J. Phys. Chem. B 116, 11701(2012).
20A. Cesàro and G. Starec, J. Phys. Chem. 84, 1345 (1980).21F. Hofmeister, Arch. Exp. Pathol. Pharmakol. 24, 247 (1888).22I. Jelesarov, E. Dürr, R. M. Thomas, and H. R. Bosshard, Biochemistry 37,
7539 (1998).23A. Cesàro, E. Russo, and D. Tessarotto, J. Solution Chem. 9, 221 (1980).24T. H. Lilley, H. Linsdell, and A. Maestre, J. Chem. Soc., Faraday Trans. 88,
2865 (1992).25J. H. Stern and E. Lowe, J. Chem. Eng. Data 23, 341 (1978).26A. Al-Maaieh and D. R. Flanagan, J. Pharm. Sci. 91, 1000 (2002).27M. J. Frisch, G. W. Trucks, H. B. Schlegel et al., GAUSSIAN 03, Revision
B.04, Gaussian, Inc., Pittsburgh, PA, 2003.
28D. A. Case, T. A. Darden, T. E. Cheatham, C. L. Simmerling, J. Wang, R. E.Duke, R. Luo, M. Crowley, R. C. Walker, W. Zhang, K. M. Merz, B. Wang,S. Hayik, A. Roitberg, G. Seabra, I. Kolossvary, K. F. Wong, F. Paesani, J.Vanicek, X. Wu, S. R. Brozell, T. Steinbrecher, H. Gohlke, L. Yang, L. C.Tan, J. Mongan, V. Hornak, G. Cui, D. H. Mathews, M. G. Seetin, C. Sagui,V. Babin, and P. A. Kollman, AMBER 10, 2008.
29M. Žółkiewski, J. Solution Chem. 16, 1025 (1987).30H. J. C. Berendsen, J. R. Grigera, and T. P. Straatsma, J. Phys. Chem. 91,
6269 (1987).31L. Martinez, R. Andrade, E. G. Birgin, and J. M. Martinez, J. Comput.
Chem. 30, 2157 (2009).32H. J. C. Berendsen, J. P. M. Postma, W. F. van Gunsteren, A. DiNola, and
J. R. Haak, J. Phys. Chem. 81, 3684 (1984).33M. P. Allen and D. J. Tildesley, Computer Simulation of Liquids (Oxford
University Press, 1987).34S. Chowdhuri and A. Chandra, J. Chem. Phys. 115, 3732 (2001).35A. P. Lyubartsev and A. Laaksonen, J. Phys. Chem. 100, 16410 (1996).36A. Cesàro, E. Russo, and V. Crescenzi, J. Phys. Chem. 80, 335 (1976).37P. R. Stoesser and S. J. Gill, J. Phys. Chem. 71, 564 (1967).38A. Shrake and J. A. Rupley, J. Mol. Biol. 79, 351 (1973).39J. G. Kirkwood and F. P. Buff, J. Chem. Phys. 19, 774 (1951).40E. Matteoli and G. A. Mansoori, Fluctuation Theory of Mixtures (Taylor
and Francis, New York, 1990).41A. Ben-Naim, Statistical Thermodynamics for Chemists and Biochemists
(Plenum Press, New York, 1992).42A. Ben-Naim, Molecular Theory of Solutions (Oxford University Press,
New York, 2006).43P. E. Smith, J. Phys. Chem. B 110, 2862 (2006).44P. E. Smith, Biophys. J. 91, 849 (2006).45R. Sanjeewa and S. Weerasinghe, Comput. Theor. Chem. 966, 140 (2011).46M. Falk, W. Chew, J. A. Walter, W. Kwiatkowski, K. D. Barclay, and G. A.
Klassen, Can. J. Chem. 76, 48 (1998).47See supplementary material at http://dx.doi.org/10.1063/1.4830414 for fig-
ures showing: (i) Change in hydration number around C10, C12, and C14hydrophobic atomic sites of caffeine, (ii) distribution of solvent accessiblesurface area (SASA) of caffeine in water as a function of simulation time,and (iii) snapshots of MD simulations of systems S0, S1, S2, S3.
This article is copyrighted as indicated in the article. Reuse of AIP content is subject to the terms at: http://scitation.aip.org/termsconditions. Downloaded to IP:
14.139.196.4 On: Thu, 16 Jan 2014 05:26:48