Thermochemical study of two anhydrous polymorphs of caffeine
8
Thermochemical study of two anhydrous polymorphs of caffeine Susana S. Pinto, Hermı ´nio P. Diogo * Centro de Quı ´mica Estrutural, Complexo Interdisciplinar, Instituto Superior Te ´ cnico, 1049-001 Lisboa, Portugal Received 14 February 2006; received in revised form 21 April 2006; accepted 26 April 2006 Available online 11 May 2006 Abstract The mean values of the standard massic energy of combustion of caffeine in phase I (or alpha) and in phase II (or beta) measured by static-bomb combustion calorimetry in oxygen, at T = 298.15 K, are D c u (C 8 H 10 O 2 N 4 , I)= (21823.27 ± 0.68) J g 1 and D c u (C 8 H 10 O 2 N 4 , II) = (21799.96 ± 1.08) J g 1 , respectively. The standard (p = 0.1 MPa) molar enthalpy of formation in condensed phase for each form was derived from the corresponding standard molar enthalpies of combustion as, D f H m ðC 8 H 10 O 2 N 4 ; cr; IÞ ¼ ð340:6 2:3Þ kJ mol 1 and D f H m ðC 8 H 10 O 2 N 4 ; cr; IIÞ ¼ ð345:1 2:3Þ kJ mol 1 . The difference between the standard enthalpy of formation of the two polymorphs in condensed phase was also evaluated by using reaction-solution calorimetry. The obtained result, 2.04 ± 0.25 kJ mol 1 , is in agreement, within the uncertainty, with the difference between the molar enthalpies of formation obtained from combustion experiments (4.5 ± 3.2) kJ mol 1 , which can be considered as an internal test for consistency of the results. A value for the standard enthalpy of formation of caffeine in the gaseous state was proposed: D f H m ðC 8 H 10 O 2 N 4 ; gÞ¼ ð229:7 6:1Þ kJ mol 1 , estimated from the values of the standard enthalpies of formation of both crystalline forms obtained in this work, and the data on standard enthalpies of sublimation collected from the literature. Ó 2006 Elsevier Ltd. All rights reserved. Keywords: Caffeine; Enthalpy of combustion; Enthalpy of formation; Differential scanning calorimetry; Solution calorimetry; Thermochemistry 1. Introduction Caffeine (3,7-dihydro-1,3,7-trimethyl-1H-purine-2,6- dione), chemical structure shown in figure 1, commonly designed as 1,3,7,trimethylxantine (CAS 58-08-2), is a com- ponent of coffee beans, tea leaves, and other plants includ- ing rubiacea and theacea [1]. Pharmacologically, caffeine belongs to a group of stim- ulants called xanthines and is listed as an active ingredient in some stimulants, cold remedies, and various pain killers. It is actually the most used psychoactive drug with an esti- mated average consumption of 250 mg/day per capita [2]. Caffeine is also extensively used as a food additive regu- lated by the Federal Food and Drug Administration (FDA) and European Community. The crystalline hydrate of caffeine is known to be non- stoichiometric in terms the number of water molecules coordinated [3]. This hydrate is converted to a b-anhydrous phase (sometimes referred as form II) under ambient tem- perature and atmospheric pressure conditions which, in turn, changes enantiotropically to a trigonal phase a-anhy- drous caffeine (form I) at 155 °C. Finally, an isotropic liquid can be obtained heating this phase at 237 °C (see fig- ure 2). Different polymorphs of a given substance often exhibit different physical properties like solubility, dissolution rate, crystal form, and bioavailability or therapeutic benefit. The incomplete characterisation of the polymorphic forms of organic compounds is probably at the origin of the fre- quent discrepancies that are observed in the reported ther- modynamic data obtained in different laboratories, namely 0021-9614/$ - see front matter Ó 2006 Elsevier Ltd. All rights reserved. doi:10.1016/j.jct.2006.04.008 * Corresponding author. Tel.: +351 21 841 9232; fax: +351 21 8464455/ 57. E-mail addresses: [email protected] (S.S. Pinto), hdiogo@ist. utl.pt (H.P. Diogo). www.elsevier.com/locate/jct J. Chem. Thermodynamics 38 (2006) 1515–1522
-
Upload
independent -
Category
Documents
-
view
2 -
download
0
Transcript of Thermochemical study of two anhydrous polymorphs of caffeine

www.elsevier.com/locate/jct
J. Chem. Thermodynamics 38 (2006) 1515–1522
Thermochemical study of two anhydrous polymorphs of caffeine
Susana S. Pinto, Hermınio P. Diogo *
Centro de Quımica Estrutural, Complexo Interdisciplinar, Instituto Superior Tecnico, 1049-001 Lisboa, Portugal
Received 14 February 2006; received in revised form 21 April 2006; accepted 26 April 2006Available online 11 May 2006
Abstract
The mean values of the standard massic energy of combustion of caffeine in phase I (or alpha) and in phase II (or beta) measured bystatic-bomb combustion calorimetry in oxygen, at T = 298.15 K, are Dcu
� (C8H10O2N4, I) = �(21823.27 ± 0.68) J Æ g�1 and Dcu�
(C8H10O2N4, II) = �(21799.96 ± 1.08) J Æ g�1, respectively.The standard (p� = 0.1 MPa) molar enthalpy of formation in condensed phase for each form was derived from the corresponding
standard molar enthalpies of combustion as, Df H �m ðC8H10O2N4; cr; IÞ ¼ �ð340:6� 2:3Þ kJ �mol�1 and Df H �m ðC8H10O2N4; cr; IIÞ¼ �ð345:1� 2:3Þ kJ �mol�1.
The difference between the standard enthalpy of formation of the two polymorphs in condensed phase was also evaluated by usingreaction-solution calorimetry. The obtained result, 2.04 ± 0.25 kJ Æ mol�1, is in agreement, within the uncertainty, with the differencebetween the molar enthalpies of formation obtained from combustion experiments (4.5 ± 3.2) kJ Æ mol�1, which can be considered asan internal test for consistency of the results.
A value for the standard enthalpy of formation of caffeine in the gaseous state was proposed: Df H �m ðC8H10O2N4; gÞ ¼�ð229:7� 6:1Þ kJ �mol�1, estimated from the values of the standard enthalpies of formation of both crystalline forms obtained in thiswork, and the data on standard enthalpies of sublimation collected from the literature.� 2006 Elsevier Ltd. All rights reserved.
Keywords: Caffeine; Enthalpy of combustion; Enthalpy of formation; Differential scanning calorimetry; Solution calorimetry; Thermochemistry
1. Introduction
Caffeine (3,7-dihydro-1,3,7-trimethyl-1H-purine-2,6-dione), chemical structure shown in figure 1, commonlydesigned as 1,3,7,trimethylxantine (CAS 58-08-2), is a com-ponent of coffee beans, tea leaves, and other plants includ-ing rubiacea and theacea [1].
Pharmacologically, caffeine belongs to a group of stim-ulants called xanthines and is listed as an active ingredientin some stimulants, cold remedies, and various pain killers.It is actually the most used psychoactive drug with an esti-mated average consumption of 250 mg/day per capita [2].Caffeine is also extensively used as a food additive regu-
0021-9614/$ - see front matter � 2006 Elsevier Ltd. All rights reserved.
doi:10.1016/j.jct.2006.04.008
* Corresponding author. Tel.: +351 21 841 9232; fax: +351 21 8464455/57.
E-mail addresses: [email protected] (S.S. Pinto), [email protected] (H.P. Diogo).
lated by the Federal Food and Drug Administration(FDA) and European Community.
The crystalline hydrate of caffeine is known to be non-stoichiometric in terms the number of water moleculescoordinated [3]. This hydrate is converted to a b-anhydrousphase (sometimes referred as form II) under ambient tem-perature and atmospheric pressure conditions which, inturn, changes enantiotropically to a trigonal phase a-anhy-drous caffeine (form I) at 155 �C. Finally, an isotropicliquid can be obtained heating this phase at 237 �C (see fig-ure 2).
Different polymorphs of a given substance often exhibitdifferent physical properties like solubility, dissolution rate,crystal form, and bioavailability or therapeutic benefit. Theincomplete characterisation of the polymorphic forms oforganic compounds is probably at the origin of the fre-quent discrepancies that are observed in the reported ther-modynamic data obtained in different laboratories, namely

phase II (or β) phase I (or α) Isotropic liquid
______________|__________________|___________________
155οC 237οC
FIGURE 2. Schematic phase diagram of caffeine.
N
NN
N
O
O
CH3
CH3
H3C
FIGURE 1. Caffeine molecule.
1516 S.S. Pinto, H.P. Diogo / J. Chem. Thermodynamics 38 (2006) 1515–1522
heats of formation, heats of solution, and heats of sublima-tion. According to Henck et al. it is presumed that morethan 50% of active ingredients of pharmaceutical productsshow at least two polymorphic forms [4]. It is thus veryimportant, particularly to the pharmaceutical industry, tobe able to achieve an unambiguous characterisation ofthe solid phases, namely because the bioavailability ofpolymorphic forms can be different, and since the ratioyield/energetic must be maximised on economic grounds.
The wide academic and industrial importance of the caf-feine molecule [5] contrasts with the lack of reliable exper-imental values for the standard enthalpy of combustionand standard enthalpy of formation for the two anhydrouspolymorphic forms. The present work is precisely a contri-bution to the thermodynamic characterisation of the purephases of anhydrous caffeine, using combustion calorime-try and solution calorimetry.
Nevertheless, as far as we known, the only two valuesfor the enthalpy of combustion of caffeine reported in theliterature in 1891 and 1893 (presumably for phase II) havemerely a historic significance [6,7]. The first paper, pub-lished by Stohmann and Langbein, does not indicate theorigin and the purity of the sample used and no calorimet-ric details were given. The second one is the average of onlytwo combustion measurements and the sample character-isation was only based on nitrogen determination. In addi-tion, no Washburn corrections were applied by the authorsto the above results.
2. Experimental
2.1. Sample purification
2.1.1. Form II
Commercially obtained caffeine (USP grade fromSigma) was recrystallised twice from distilled water, driedin vacuum (p � 1.5 Æ 10�3 Pa) for 24 h at 80 �C, and then
tempered at 110 �C, to avoid as much as possible the con-tamination with form I. A schlenck tube, under an inertatmosphere, was used to prevent the adsorption of anyresidual moisture, when the sample was cooled to ambienttemperature. Greisser refers that is improbable to obtaincrystallographic pure form II without adulteration with alow level of form I [8]. This fact leads Gavezzotti and co-workers to argue that up to now, the failure to obtain anordered crystal phase, for the lower temperature form ofthis molecule, is a consequence of its molecular features,namely the existence of an orientational disorder [9]. Onthe other hand, the structure of the high temperature form(I) was derived from X-ray powder diffraction measure-ments recorded at 278 K, and it is believed that could begreatly disordered [8,10,11].
2.1.2. Form I
Caffeine phase I was prepared by heating the phase IIabove the melting temperature (ca. 240 �C) inside aschlenck tube (under a nitrogen flush) to avoid sublima-tion, quenched to ca. 0 �C, by using a ethanol/N2 mixture,and then warmed to ambient temperature. The pellets forthe combustion experiments were made quickly and kept,under inert atmosphere, inside a refrigerator (5 �C) for amaximum period of 24 h. Due to its metastability, at roomtemperature, the process was repeated whenever necessary,for example, if a systematic tendency in the specific energyof combustion was observed on successive combustionruns. Although, Epple et al. [12] and Descamps and co-workers [10,13], based on time- and temperature-resolvedX-ray powder diffraction, and kinetic studies made byLehto and Laine [14] by using isothermal microcalorime-try, confirm that, at room temperature, the conversionform I! form II is very slow.
2.2. Apparatus
The elemental analysis was made with a Fisions Instru-ments EA1108 apparatus, with typical claimed accuracyerrors of ±0.3% for carbon and nitrogen and ±0.1% forhydrogen.
The FT-IR spectra were obtained in a Shimadzu, model8400S spectrophotometer calibrated with polystyrene film.
The differential scanning calorimetry (DSC) measure-ments were acquired with a temperature-modulated TAInstruments Inc. model 2920 MTDSC, in the conventionalmode. A helium purge rate 30 cm3/min was employed forall experiments. The samples were previously encapsulatedin seal aluminium pan and weighted (±10�7 g) on aMettler UMT2 ultra-micro balance. The baseline was cali-brated by scanning the temperature range of the experi-ments with an empty pan. The temperature calibrationwas performed acquiring the onset of the endothermicmelting peak of several calibration standards, at a heatingrate of 10 K Æ min�1: n-decane (Tm = 246.49 K), n-octade-cane (Tm = 301.39 K), hexatriacontane (Tm = 349.09 K),indium (Tm = 429.75 K), and tin (Tm = 505.08 K). The

-35
-30
-25
-20
-15
-10
-5
0
300 340 380 420 460 500
T/K
Hea
t F
low
-1.6
-1.4
-1.2
-1
-0.8
-0.6
-0.4
365 415 465
T/K
FIGURE 3. DSC scan of caffeine at a heating rate of 10 K/min. The insetshows the thermal event relative to phase transition (II! I).
S.S. Pinto, H.P. Diogo / J. Chem. Thermodynamics 38 (2006) 1515–1522 1517
enthalpy scale was also calibrated using indium (fusionenthalpy, Dl
crH�m ¼ 28:71 J � g�1) [15].
The 1H n.m.r. spectra were obtained in a Varian 300MHZ spectrometer.
The gas-chromatography/mass spectrometry (GC/MS)analysis was carried out on an Agilent 6890 gas chromato-graph joined to an Agilent 5973N mass detector.
X-ray diffraction measurements were made with a Phil-lips PW 1710-type angle dispersive powder diffractometer.The diffractograms were obtained with Ni-filtered Cu Ka-radiation (k = 0.15418 nm, voltage 40 kV, current 30 mA)over the range 5� 6 2h 6 32� with scan speed of 1� (2h/min) and step size 0.016� of 2h.
The combustion calorimetric experiments were achievedusing a micro-combustion calorimeter previously described[16]. The energy equivalent of the calorimeter and its stan-dard deviation, e0 = (1895.27 ± 0.33) J Æ K�1, were deter-mined from the combustion of benzoic acid (B.D.H.thermochemical standard) whose standard massic energyof combustion under the certificate conditions was�(26433 ± 4) J Æ g�1. n-Hexadecane (Aldrich, mass fraction0.99) was used as a combustion aid only for experiments onphase I. The analysis of the HNO3(aq), formed from tracesof atmospheric N2 initially present inside the bomb, wasmade with a Dionex 4000i ion chromatography apparatus[16b].
The reaction-solution calorimeter and the general oper-ating procedure used in the experiments have beendescribed in a previous publication [17]. The calorimeterconsisted basically of a transparent Dewar vessel closedby a lid, which supported a stirrer, a quartz crystal ther-mometer probe, a resistor for electrical calibration, andan ampoule breaking system. The assembled vessel wasimmersed in a thermostatic water bath whose temperaturewas controlled at 298 ± 10�3 K by a Tronac PTC-40 unit.In a typical experiment a thin walled glass ampoule (vol-ume ca. 2.5 ml) was weighed to ±10�5 g on a MettlerAT201 balance, filled with the sample using an apparatusto maintain the inert atmosphere [18] and sealed with atorch. The two resulting pieces (closed ampoule + part ofthe neck) were weighed and the mass of sample obtainedby subtracting the mass of the empty ampoule.
2.3. Sample characterisation
The results of elemental analysis (average of two inde-pendent runs) show acceptable agreement with theoreticalvalues for carbon, hydrogen, and nitrogen for bothsamples:
For C8H10O2N4 calculated: C, 49.48; H, 5.19; N 28.85.Found (phase I): C, 49.67; H, 5.28; N 28.85.Found (phase II): C, 49.68; H, 5.25; N 28.89.
The GC/MS of the purified caffeine, dissolved in dichlo-romethane, indicates a purity better than 99.9% and theMS of the peak shows a parent ion at m/z = 194. This
defragmentation pattern is in excellent accordance withthe NIST Data Base [19].
The melting peak of caffeine in phase I was characterisedby DSC, and it was found that the onset temperature isTon = 509.6 K and the temperature of the maximum isTmax = 510.2 K at a heating rate of 10 K/min (see figure3). The corresponding enthalpy of fusion was found to beDl
crH�m ðC8H10O2N4Þ ¼ 21:9 kJ �mol�1, which is in agree-
ment with the literature values which span in a range of3.4 kJ/mol, from 20.1 to 23.5 kJ/mol [11,20,21].
DSC was also used to characterise the conversionbetween polymorphs. Muller and Greisser [8] pointed outthat the purity of stable form II can be estimated basedon the experimental value obtained by DSC for theenthalpy of transition form II! form I. These authors cor-related the amount of phase I as an impurity present inphase II with the enthalpy of phase transition observedat ca. 155 �C in a DSC experiment [8] (figure 4). For a puresample of phase II a value of DHtrans (II! I) = 4.025± 0.006 kJ/mol can predicted. The DSC result for our sam-ple gives DHtrans (II! I) = 4.02 ± 0.03 kJ/mol (20.71 J/g)which indicates a phase purity better than 99.9%. The dif-fraction patterns obtained on our samples of phase I arevery close those published by Descamps and co-workers[11,13]. Furthermore, for phase II, a characteristic peak(2h = 28.4) is observed, which is absent in form I. ThisX-ray powder diffractogram of phase II is in accordanceto one reported by Laine et al. [22] and Descamps andco-workers [11]. The 1H n.m.r. spectra, in CDCl3 solution,obtained in a 300 MHz spectrometer, agrees very well withthat reported in reference [23]: 1H n.m.r. (CDCl3/TMS):d = 7.50 (m, CH, 1H), 4.01 (d, CH3, 3H), 3.55 (s, CH3,3H), 3.37 (s, CH3, 3H). Finally, the FT-IR spectra wereobtained for both phases of caffeine, and it was found thatall the individual vibrational bands reported by York et al.
[3] are detected in the spectrum of form II carried out in thepresent work.

5
25
45
65
85
105
0.5 1.5 2.5 3.5 4.5
Htrans (kJ/mol)
% o
f ph
ase
II
FIGURE 4. Relationship between the DHtrans (II! I) and the percentageof form II (data from Muller and Greisser [8]).
1518 S.S. Pinto, H.P. Diogo / J. Chem. Thermodynamics 38 (2006) 1515–1522
3. Results and discussion
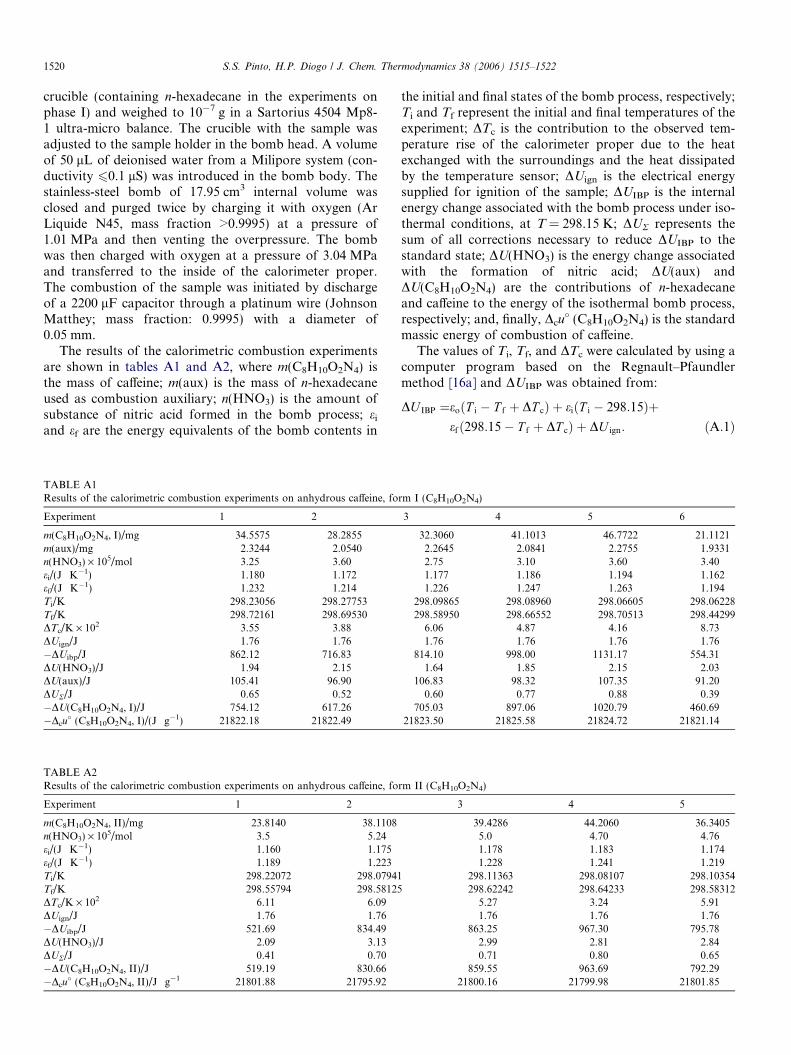
Appendix A presents the detail of the calorimetric pro-cedures and data treatment. Individual values of the stan-dard massic energy of combustion of anhydrous caffeineform I and form II are indicated in tables A1 and A2,and the mean values are:
Dcu� ðC8H10O2N4; IÞ ¼ �ð21823:27� 0:68Þ J � g�1
and
Dcu� ðC8H10O2N4; IIÞ ¼ �ð21799:96� 1:08Þ J � g�1;
where the uncertainty quoted represents the standard devi-ation of the mean. All presented molar quantities are basedon the 2001 standard atomic masses [24]. The Dcu
� valuesobtained in this work, and above indicated, refer to thereaction:
C8H10O2N4 ðcr; I or IIÞ þ 19=2 O2ðgÞ ¼8 CO2ðgÞ þ 5 H2OðlÞ þ 2 N2ðgÞ ð1Þ
and lead, respectively, to the molar values:
DcU �m ðC8H10O2N4; IÞ ¼ �ð4237:87� 1:98Þ kJ �mol�1;
DcH �m ðC8H10O2N4; IÞ ¼ �ð4236:63� 1:98Þ kJ �mol�1;
and to
DcU �m ðC8H10O2N4; IIÞ ¼ �ð4233:35� 2:00Þ kJ �mol�1;
DcH �m ðC8H10O2N4; IIÞ ¼ �ð4231:89� 2:00Þ kJ �mol�1;
both at T = 298.15 K. The symbols DcU �m and DcH �mdenote, respectively, the standard energy and the standardmolar enthalpy of combustion. As recommended, theuncertainties quoted represent twice the overall standarddeviation of the mean and include the contributions fromthe calibration with benzoic acid and from the energy ofcombustion of n-hexadecane in the case of phase I. Fromthe DcH �m ðC8H10O2N4; IÞ and DcH �m ðC8H10O2N4; IIÞvalues indicated above, together with DfH �m ðCO2; gÞ ¼�ð393:51� 0:13Þ kJ �mol�1 [25] and Df H �m ðH2O; lÞ ¼
�ð285:830� 0:040Þ kJ �mol�1 [25], the following values ofthe standard formation enthalpies at 298.15 K werederived:
DfH �m ðC8H10O2N4; cr; IÞ ¼ �ð340:6� 2:3Þ kJ �mol�1
and
DfH �m ðC8H10O2N4; cr; IIÞ ¼ �ð345:1� 2:3Þ kJ �mol�1:
From these standard enthalpies of formation at298.15 K of the anhydrous phases of caffeine we concludethat the enthalpy of reaction associated to the transforma-tion depicted in the following equation:
C8H10O2N4 ðcr; IIÞ ¼ C8H10O2N4 ðcr; IÞ ð2Þat the same temperature is DrH
0 = (4.5 ± 3.2) kJ Æ mol�1.Let us note that this value of DrH
0 agrees, within theuncertainty interval, with that obtained by DSC(4.02 ± 0.03 kJ Æ mol�1) at the transition temperature(155 �C = 388.15 K). In order to check the internal consis-tency of this result, we chose a different estimation method,based on the measurement of the dissolution enthalpies ofboth phases of anhydrous caffeine in the same solvent. Wethus measured the enthalpy associated with the dissolutionprocess of each phase of caffeine (200–500 mg) in 125 ml ofa mixture of ethanol/chloroform (60:40), where this partic-ular solvent mixture was chosen since the dissolution pro-cess was found to be reasonably fast. Tables B1 and B2show the results of five and six independent runs carriedout on phase I and phase II, respectively. The values ofthe dissolution enthalpies are DsolH �m ¼ ð11:89� 0:20Þ kJ�mol�1 for phase I and (13.93 ± 0.15) kJ Æ mol�1 for phaseII. Given that the final state of the dissolution of eachpolymorph in the solvent mixture is identical, the differencebetween those values of the dissolution enthalpy,2.04 ± 0.25 kJ Æ mol�1, can be identified with the enthalpyof reaction (2). It is to be noted that this value is insidethe confidence interval of the enthalpy of the same reactioncalculated as the difference of the formation enthalpies ofthe crystalline phases (4.5 ± 3.2 kJ Æ mol�1), which tells infavour of a good internal consistency of the thermody-namic data obtained in the present work. Due to itsdestructive character and time consuming the combustioncalorimetry is not a first choice technique to determinethe expected small difference between the standard enthal-pies of formation of polymorphs. However, this techniqueoffers an interesting way to validate the values supplied byother thermal techniques.
Several values of the enthalpy of sublimation of the twoanhydrous phases of caffeine, at different temperatures, arereported in the literature [26]. The most recent values werereported by Greisser et al. [27]: Dg
crH�m ðC8H10O2N4; IÞ
¼ 104:8� 0:2 kJ �mol�1 at T = 439 K and DgcrH
�m ðC8H10
O2N4; IIÞ ¼ 113:6� 0:2 kJ �mol�1 at T = 369 K, wherethe uncertainties denote the standard deviation of themean. The enthalpy of sublimation at 298.15 K for phaseI and phase II of caffeine can be calculated from thereported values at a different T by using [28]:

S.S. Pinto, H.P. Diogo / J. Chem. Thermodynamics 38 (2006) 1515–1522 1519
DgcrH
�m ð298:15 KÞ ¼ Dg
crH�m ðT Þ þ Dg
crC�p;m ð298:15� T Þ;
ð3Þwhere Dg
crC�p;m represents the difference between the molar
heat capacity of gaseous and crystalline caffeine for eachphase. Since no experimental values of Dg
crC�p;m for the
two anhydrous forms of caffeine are presently available inthe literature, we decided to estimate those values on thebasis of a prediction method proposed by Chickos et al.
[29]. This method uses an empirical equation (see equation(4)) that was derived from a huge set of experimental valuesrelative to a large number of organic molecules:
DgcrC�p;m=ðJ �K�1 �mol�1Þ ¼ �0:75� 0:15 C�p;m ðcrÞ; ð4Þ
where C�p;m ðcrÞ is the molar heat capacity, at T = 298.15 K,of the crystalline phase. The published C�p;m values of thecrystalline phases of anhydrous caffeine [10,20] refer totemperatures different from 298.15 K, so that the valuesat this temperature were obtained by fitting and extrapolat-ing the reported values. From the obtained values:
C�p;m ðC8H10O2N4; cr; IÞ ¼ 267:2 J �K�1 �mol�1 at 298:15 K
and
C�p;m ðC8H10O2N4; cr; IIÞ ¼ 173:4 J �K�1 �mol�1 at 298:15 K
we calculated, using equation (4), DgcrC�p;m ðC8H10
O2N4; cr; IÞ ¼ �ð40:8� 33:0Þ J �K�1 �mol�1 for phase Iand Dg
crC�p;m ðC8H10O2N4; cr; IIÞ ¼ �ð26:8� 33:0Þ J �K�1�
mol�1 for phase II, both at T = 298.15 K. The uncertaintyof ±33.0 J Æ K�1 Æ mol�1 quoted above was obtained con-sidering the standard deviation of the empirical coefficientsof equation (4) [29]. Finally, introducing these values inequation (3) leads to:
DgcrH
�m ðC8H10O2 N4; IÞ ¼ 110:5� 4:7 kJ �mol�1 at 298:15 K;
and
DgcrH
�m ðC8H10O2N4; IIÞ ¼ 115:52:3 kJ �mol�1 at 298:15 K:
It should stressed that Greisser et al. [27] reported thevalues of 115 kJ Æ mol�1 and 119 kJ Æ mol�1 for the stan-dard enthalpy of sublimation at T = 298.15 K for phase Iand phase II, respectively, without indication of the uncer-tainty associated.
Finally, the results obtained in this work for the stan-dard enthalpy of formation in condensed phase for eachpolymorph of caffeine, together with the values of the stan-dard enthalpy of sublimation ðDg
crH�mÞ, allow the determi-
nation of the standard enthalpy of formation of caffeinein the gaseous phase, DfH �m ðgÞ. From the values relativeto phase I we obtained DfH �m ðC8H10O2N4; gÞ ¼ �ð230:1�5:2Þ kJ �mol�1, while the value DfH �m ðC8H10O2N4; gÞ ¼�ð229:6� 3:3Þ kJ �mol�1 was obtained using the thermo-dynamic properties of phase II. The very good agreementbetween these values is again another evidence for theinternal consistency of the results presented in this work.
We suggest to consider the average between those valuesas the best value of the standard enthalpy of formationof caffeine in gaseous state: DfH �m ðC8H10O2N4; gÞ ¼�ð229:7� 6:1Þ kJ �mol�1.
4. Concluding remarks
In this work we have prepared and characterised by ele-mental analysis, X-ray powder diffraction, DSC, GC-MS,and FT-IR two phases of anhydrous caffeine (I or a, andII or b). By using static-bomb combustion calorimetry inoxygen the standard massic energies of combustion andthe standard enthalpies of combustion were determined.From these values, the corresponding standard molarenthalpies of formation were derived for both condensedphases. Combining these data with literature values for thestandard enthalpies of sublimation allowed the estimationof the standard enthalpy of formation in the gaseous phase.
Different approaches were used to test the internal consis-tency of the results. The first one used reaction-solution cal-orimetry for determining of enthalpy of solution of eachphase of caffeine in a mixture of ethanol/chloroform(60:40). From these measurements it was found that the dif-ference between the enthalpies of solution of the two crystal-line polymorphs at room temperature is (2.04 ± 0.25)kJ Æ mol�1 which is comparable to (4.02 ± 0.03 kJ Æ mol�1)obtained by DSC at 155 �C (328.15 K), and to (4.5 ± 3.2)kJ Æ mol�1 obtained by combustion calorimetry at 298.15K. This agreement within the uncertainty interval, obtainedby three independent calorimetric techniques, is an indica-tion of the reliability of the enthalpies of formation obtainedfor the two polymorphs in condensed phase.
The values of the standard enthalpies of formation, incondensed phase, obtained in this work, together the corre-sponding standard enthalpies of sublimation, allowed thesuggestion of a value for the standard enthalpy of formationof caffeine in the gaseous state: Df H �m ðC8H10O2N4; gÞ¼ �ð229:7� 6:1Þ kJ �mol�1. This result is relevant, forexample, for computational energetic screening studies ondrug discovery development [30]. Finally, it should bestressed that an accurate determination of enthalpies of com-bustion and formation of a solid demands the knowledge ofthe purity of phase of the used material.
Acknowledgements
The authors are indebted for Prof. Moura Ramos forvery useful discussions. A grant (SFRH/BD/12330/2003)from Fundacao para a Ciencia e a Tecnologia is gratefullyacknowledged by S.S. Pinto.
Appendix A. Details on the calorimetric combustion
experimental procedures and data treatment
In a typical calorimetric experiment, a pellet of caf-feine with a diameter of ca. 4 mm was placed in a platinum
1520 S.S. Pinto, H.P. Diogo / J. Chem. Thermodynamics 38 (2006) 1515–1522
crucible (containing n-hexadecane in the experiments onphase I) and weighed to 10�7 g in a Sartorius 4504 Mp8-1 ultra-micro balance. The crucible with the sample wasadjusted to the sample holder in the bomb head. A volumeof 50 lL of deionised water from a Milipore system (con-ductivity 60.1 lS) was introduced in the bomb body. Thestainless-steel bomb of 17.95 cm3 internal volume wasclosed and purged twice by charging it with oxygen (ArLiquide N45, mass fraction >0.9995) at a pressure of1.01 MPa and then venting the overpressure. The bombwas then charged with oxygen at a pressure of 3.04 MPaand transferred to the inside of the calorimeter proper.The combustion of the sample was initiated by dischargeof a 2200 lF capacitor through a platinum wire (JohnsonMatthey; mass fraction: 0.9995) with a diameter of0.05 mm.
The results of the calorimetric combustion experimentsare shown in tables A1 and A2, where m(C8H10O2N4) isthe mass of caffeine; m(aux) is the mass of n-hexadecaneused as combustion auxiliary; n(HNO3) is the amount ofsubstance of nitric acid formed in the bomb process; ei
and ef are the energy equivalents of the bomb contents in
TABLE A1Results of the calorimetric combustion experiments on anhydrous caffeine, fo
Experiment 1 2
m(C8H10O2N4, I)/mg 34.5575 28.2855m(aux)/mg 2.3244 2.0540n(HNO3) · 105/mol 3.25 3.60ei/(J Æ K�1) 1.180 1.172ef/(J Æ K�1) 1.232 1.214Ti/K 298.23056 298.27753Tf/K 298.72161 298.69530DTc/K · 102 3.55 3.88DUign/J 1.76 1.76�DUibp/J 862.12 716.83DU(HNO3)/J 1.94 2.15DU(aux)/J 105.41 96.90DUR/J 0.65 0.52�DU(C8H10O2N4, I)/J 754.12 617.26�Dcu
� (C8H10O2N4, I)/(J Æ g�1) 21822.18 21822.49
TABLE A2Results of the calorimetric combustion experiments on anhydrous caffeine, fo
Experiment 1 2
m(C8H10O2N4, II)/mg 23.8140 38.1108n(HNO3) · 105/mol 3.5 5.24ei/(J Æ K�1) 1.160 1.175ef/(J Æ K�1) 1.189 1.223Ti/K 298.22072 298.07941Tf/K 298.55794 298.58125DTc/K · 102 6.11 6.09DUign/J 1.76 1.76�DUibp/J 521.69 834.49DU(HNO3)/J 2.09 3.13DUR/J 0.41 0.70�DU(C8H10O2N4, II)/J 519.19 830.66�Dcu
� (C8H10O2N4, II)/J Æ g�1 21801.88 21795.92
the initial and final states of the bomb process, respectively;Ti and Tf represent the initial and final temperatures of theexperiment; DTc is the contribution to the observed tem-perature rise of the calorimeter proper due to the heatexchanged with the surroundings and the heat dissipatedby the temperature sensor; DUign is the electrical energysupplied for ignition of the sample; DUIBP is the internalenergy change associated with the bomb process under iso-thermal conditions, at T = 298.15 K; DUR represents thesum of all corrections necessary to reduce DUIBP to thestandard state; DU(HNO3) is the energy change associatedwith the formation of nitric acid; DU(aux) andDU(C8H10O2N4) are the contributions of n-hexadecaneand caffeine to the energy of the isothermal bomb process,respectively; and, finally, Dcu
� (C8H10O2N4) is the standardmassic energy of combustion of caffeine.
The values of Ti, Tf, and DTc were calculated by using acomputer program based on the Regnault–Pfaundlermethod [16a] and DUIBP was obtained from:
DU IBP ¼eoðT i � T f þ DT cÞ þ eiðT i � 298:15Þþefð298:15� T f þ DT cÞ þ DU ign: ðA:1Þ
rm I (C8H10O2N4)
3 4 5 6
32.3060 41.1013 46.7722 21.11212.2645 2.0841 2.2755 1.93312.75 3.10 3.60 3.401.177 1.186 1.194 1.1621.226 1.247 1.263 1.194
298.09865 298.08960 298.06605 298.06228298.58950 298.66552 298.70513 298.44299
6.06 4.87 4.16 8.731.76 1.76 1.76 1.76
814.10 998.00 1131.17 554.311.64 1.85 2.15 2.03
106.83 98.32 107.35 91.200.60 0.77 0.88 0.39
705.03 897.06 1020.79 460.6921823.50 21825.58 21824.72 21821.14
rm II (C8H10O2N4)
3 4 5
39.4286 44.2060 36.34055.0 4.70 4.761.178 1.183 1.1741.228 1.241 1.219
298.11363 298.08107 298.10354298.62242 298.64233 298.58312
5.27 3.24 5.911.76 1.76 1.76
863.25 967.30 795.782.99 2.81 2.840.71 0.80 0.65
859.55 963.69 792.2921800.16 21799.98 21801.85

TABLE B1Results of the reaction-solution calorimetric experiments relative to solution of caffeine phase I in a mixture of ethanol/chloroform (60:40)
m(C8H10O2N4)/mg n · 103/mol e/(J Æ K�1) DTad/K DsolH�m=ðkJ �mol�1Þ360.87 1.858 370.19 �0.0562 11.202389.81 2.007 349.48 �0.0714 12.435424.42 2.186 327.03 �0.0812 12.149498.49 2.567 339.52 �0.0913 12.076470.48 2.423 327.76 �0.0877 11.870ÆDsolHm/(kJ Æ mol�1)æ = (11.89 ± 0.20) kJ Æ mol�1
TABLE B2Results of the reaction-solution calorimetric experiments relative to solution of caffeine phase II in a mixture of ethanol/chloroform (60:40)
m(C8H10O2N4)/mg n · 103/mol e/JK�1 DTad/K DsolH�m=ðkJ �mol�1Þ235.90 1.211 337.12 �0.0517 14.358327.65 1.687 316.93 �0.070 13.174190.37 0.980 334.73 �0.0422 14.420185.88 0.957 322.34 �0.0408 13.752287.10 1.478 327.25 �0.0634 14.030223.89 1.153 334.61 �0.0462 13.399hDsolH�m=ðkJ �mol�1Þi ¼ ð13:93� 0:15Þ kJ �mol�1
S.S. Pinto, H.P. Diogo / J. Chem. Thermodynamics 38 (2006) 1515–1522 1521
The standard state corrections, DUR, were derived as rec-ommended in the literature [31], by using the followingstandard massic heat capacity ðc�pÞ, density (q) and (ou/op)T data, at T = 298.15 K:
Compound
c�p=ðJ �K�1 � g�1Þq/(g Æ cm�3)
�(ou/op)T/(J Æ MPa�1 Æ g�1)
C8H10O2N4
(Phase I)1.376 [20](Phase I)1.452 [13]
0.1 [32]b
(Phase II)1.364 [10,20]a
(Phase II)1.446 [10]
n-Hexadecane
2.215 [33] 0.773 [33] 0.347 [34] a Average value calculated from the data indicated in references [10,20].b In the absence of experimental value for �(ou/op)T the data for benzoicacid were used.Appendix B. Details on the calorimetric solution-reaction
experiments
The results of solution-reaction calorimetric experimentsare given in Tables B1 and B2, where m(C8H10O2N4) is themass of caffeine used in each individual experiment, n is thecorrespondent number of moles, e represents the energyequivalent of the calorimetric system containing 125 mlof the mixture of ethanol/chloroform (60:40), DTad is theadiabatic temperature rise, and DsolH �m represents the asso-ciated enthalpy of solution. The last row in each table con-tains the mean value of DsolH �m, where the uncertaintyindicated denotes the standard deviation of the mean.For comparison purposes Cesaro and co-workers mea-sured a value of 14.23 ± 0.42 kJ/mol for enthalpy of solu-tion of caffeine phase II in pure water using a LKBmicrocalorimeter [35].
References
[1] I.W. Southon, J. Bukingham, Dictionary of Alkaloids, Chapman &Hall, London, 1989.
[2] S.A. Narod, S. Desanjose, C. Victoria, Am. J. Obstet. Gynecol. 164(1991) 1109–1114.
[3] H.G.M. Edwards, E. Lawson, M. Matas, L. Shields, P. York, J.Chem. Soc., Perkin Trans. 2 (1997) 1985–1990.
[4] J.-O. Henck, U.J. Griesser, A. Burger, Pharm. Ind. 59 (1997) 165–169.
[5] (a) see for example M.U. Eteng, E.U. Eyong, E.O. Akpanyung,M.A. Agiang, C.Y. Aremu, Plant Foods Hum. Nutri. 51 (1997) 231–243;(b) Z. Tieges, K.R. Ridderinkholf, J. Snel, A. Kok, Cog. Brain Res.21 (2004) 87–93;(c) J.J. Moura-Ramos, N.T. Correia, H.P. Diogo, M. Descamps, J.Phys. Chem. B 110 (2006) 8268–8273;(d) Kirk-Othmer, Encyclopedia of Chemical Technology, vol. 3,Interscience 911–917.
[6] F. Stohmann, H. Langbein, J. Prakt. Chem. 2 44 (1891) 336–399.[7] M.C. Matigon, Ann. Chim. (Paris) 28 (1893) 289–394.[8] P.R. Muller, U.J. Greisser, Poster abstract, phandTA7, Presented at
the 7th International Conference/Workshop on Pharmacy andApplied Physical Chemistry, Set. 07-10, Innsbruck, Austria, 2003.
[9] L. Carlucci, A. Gavezzotti, Chem. Eur. J. 11 (2005) 271–279.[10] A. Cesaro, G. Starec, J. Phys. Chem. 84 (1980) 1345–1346.[11] M. Descamps, N.T. Correia, P. Derollez, F. Danede, F. Capet, J.
Phys. Chem. B 109 (2005) 16092–16098.[12] M. Epple, H.K. Cammenga, S.M. Sarge, R. Diedrich, V. Balek,
Thermochim. Acta 250 (1995) 29–39.[13] P. Derollez, N.T. Correia, F. Danede, F. Capet, F. Affrouad, J.
Lefevre, M. Descamps, Acta Cryst. B 61 (2005) 329–334.[14] V.-P. Lehto, E. Laine, Thermochim. Acta 317 (1998) 47–58.[15] C. Alvarez, J.J. Moura Ramos, Phys. Chem. Chem. Phys. 2 (2000)
4743–4747.[16] (a) H.P. Diogo, M.E. Minas da Piedade, J. Chem. Thermodyn. 27
(1995) 197–206;(b) R.C. Santos, H.P. Diogo, M.E. Minas da Piedade, J. Chem.Thermodyn. 31 (1999) 1417–1427.
[17] H.P. Diogo, M.E. Minas da Piedade, J.A. Martinho Simoes, C.Teixeira, J. Organomet. Chem. 632 (2001) 188–196.

1522 S.S. Pinto, H.P. Diogo / J. Chem. Thermodynamics 38 (2006) 1515–1522
[18] M.E. Minas da Piedade, A.R. Dias, J.A. Martinho Simoes, J. Chem.Edu. 68 (1991) 261.
[19] W.G. Mallard, P.J. Linstrom (Eds.), NIST Chemistry WebBook,NIST Standard Reference Database Number 69, National Institute ofStandards and Technology, Gaithersburg. 2005. Available from:<http://webbook.nist.gov/chemistry>.
[20] H. Bothe, H.K. Cammenga, J. Therm. Anal. Calorimet. 16 (1979)267–275.
[21] D.I. Weinstein, A.J. Leffler, J.A. Currie, Mol. Cryst. Liq. Cryst. 104(1984) 95–109.
[22] (a) J. Pirttimaki, E. Laine, Eur. J. Pharm. Sci. 1 (1994) 203–208;(b) J. Pirttimaki, E. Laine, J. Kotolainen, P. Paronen, Int. J. Pharm.95 (1995) 93–99.
[23] J. Sitkowski, L. Stefaniak, L. Nicol, M.L. Martin, G.A. Webb,Spectrochim. Acta A 51 (1995) 839–841.
[24] IUPAC Commission on Atomic Weights and Isotopic Abundances,Available from: <http://www.chem.qmul.ac.uk/IUPAC/AtWt/>.
[25] J.D. Cox, D.D. Wagman, V.A. Medvedev, CODATA Key Values forThermodynamics, Hemisphere, New York, 1989.
[26] J.S. Chickos, W.A. Acree, J. Phys. Chem. Ref. Data 31 (1976) 537–698.[27] U.J. Griesser, M. Szelagiewicz, U.Ch. Hofmeier, C. Pitt, S. Cianfe-
rani, J. Therm. Anal. Calorimet. 57 (1999) 45–60.[28] J.D. Cox, G. Pilcher, Thermochemistry of Organic and Organome-
tallic Compounds, Academic Press, London and New York, 1970.[29] J.S. Chickos, S. Hosseini, D.G. Hesse, J.F. Liebman, Struct. Chem. 4
(1993) 271–278.[30] J.L. Lewin, C.J. Cramer, Mol. Pharm. 1 (2004) 128–135.[31] W.N. Hubbard, D.W. Scott, G. Waddington, in: F.D. Rossini (Ed.),
Experimental Thermochemistry, vol. 1, Interscience, New York, 1956,Chapter 5.
[32] R.S. Jessup, J. Res. Nat. Bur. Stand. 36 (1946) 421–423.[33] D.R. Lide (Ed.), Handbook of Chemistry and Physics, 85th ed., CRC
Press, Boca Raton, 2004.[34] N.B. Vargaftik, Tables on the Thermophysical Properties of Liquids
and Gases, second ed., Wiley, New York, 1975.[35] A. Cesaro, E. Russo, V. Crescenzi, J. Phys. Chem. 80 (1976) 335–339.
JCT 06-34