
CO 2 splitting in an aerosol flow reactor via the two-step Zn/ZnO solar thermochemical cycle
10
Author's personal copy CO 2 splitting in an aerosol flow reactor via the two-step Zn/ZnO solar thermochemical cycle Peter G. Loutzenhiser a , M. Elena Ga ´ lvez b , Illias Hischier b , Aron Graf b , Aldo Steinfeld a,b, a Solar Technology Laboratory, Paul Scherrer Institute, 5232 Villigen PSI, Switzerland b Department of Mechanical and Process Engineering, ETH Zurich, 8092 Zurich, Switzerland article info Article history: Received 18 April 2009 Received in revised form 11 October 2009 Accepted 19 November 2009 Available online 4 December 2009 Keywords: CO 2 Zn ZnO CO Nanoparticles Aerosol Reactor Thermochemical cycle Solar Energy Renewable CO 2 reduction CO 2 splitting Solar fuels abstract Using concentrated solar energy as the source of high-temperature process heat, a two-step CO 2 splitting thermochemical cycle based on Zn/ZnO redox reactions is applied to produce renewable fuels. The solar thermochemical cycle consists of (1) the solar endothermic dissociation of ZnO to Zn and O 2 ; (2) the non-solar exothermic reduction of CO 2 with Zn to CO and ZnO; the latter is recycled to the 1st solar step. The second step of the cycle is experimentally investigated in a hot-wall quartz aerosol flow reactor, designed for quenching of Zn(g), formation of Zn nanoparticles, and in-situ oxidation with CO 2 . The effects of varying the reactants stoichiometry, reaction temperatures, and inlet flow temperatures for radial and annular flows were investigated. Chemical conversions of Zn to ZnO of up to 88% were obtained for a residence time of 3 s. For all of the experiments, the reactions primarily occurred heterogeneously on the reaction zone surfaces, outside the aerosol jet flow. & 2009 Elsevier Ltd. All rights reserved. 1. Introduction In a previous work (Ga ´ lvez et al., 2008), a two-step solar- driven thermochemical chemical cycle was proposed to convert captured CO 2 into separate streams of CO and O 2 using Zn/ZnO redox reactions. The resulting CO can be used as a combustion fuel or further processed via water-gas shift and/or Fischer– Tropsch synthesis to produce liquid fuels for transportation. These fuels are carbon-neutral provided the resulting CO 2 from their combustion is then recaptured from flue gases or atmospheric air. The first step of the cycle is the high-temperature endothermic dissociation of ZnO using concentrated solar energy for process heat, formulated as ZnO-Zn þ 1 2 O 2 ð1Þ and experimentally demonstrated at 2000 K with a 10 kW solar reactor prototype (Schunk et al., 2008; Schunk and Steinfeld, 2009). Rapid quenching of the products was required to avoid product recombination (Gst ¨ ohl et al., 2008). In the second non- solar step, Zn is reacted with CO 2 to produce CO in a low temperature exothermic reaction, formulated as Zn þCO 2 -ZnO þ CO ð2Þ and experimentally demonstrated in a thermogravimeter (Lout- zenhiser et al., 2009) and in the imperial smelting process (Cox and Fray, 2000a, 2000b). The resulting ZnO is in turn recycled to the first step to close the material cycle. The net reaction is CO 2 ¼ CO þ 1 2 O 2 , with products formed in different steps, thereby eliminating the need for their high-temperature separation. A second-law thermodynamic analysis indicates a maximum solar- to-chemical energy conversion efficiency of 39% for a solar concentration ratio of 5000 suns (Ga ´ lvez et al., 2008). The decomposition of CO 2 with ferrites has also been extensively investigated experimentally (Ehrensberger et al., 1997; Farghali et al., 2007; Kato et al., 1994; Khedr et al., 2007; Khedr and Farghali, 2005; Ma et al., 2007a, 2007b; Tamaura and Tabata, 1990; Yamasue et al., 2007; Zhang et al., 2000, 1999, 1996). ARTICLE IN PRESS Contents lists available at ScienceDirect journal homepage: www.elsevier.com/locate/ces Chemical Engineering Science 0009-2509/$ - see front matter & 2009 Elsevier Ltd. All rights reserved. doi:10.1016/j.ces.2009.11.025 Corresponding author at: Department of Mechanical and Process Engineering, ETH Zurich, 8092 Zurich, Switzerland. E-mail address: [email protected] (A. Steinfeld). Chemical Engineering Science 65 (2010) 1855–1864
Transcript of CO 2 splitting in an aerosol flow reactor via the two-step Zn/ZnO solar thermochemical cycle
Author's personal copy
CO2 splitting in an aerosol flow reactor via the two-step Zn/ZnO solarthermochemical cycle
Peter G. Loutzenhiser a, M. Elena Galvez b, Illias Hischier b, Aron Graf b, Aldo Steinfeld a,b,�
a Solar Technology Laboratory, Paul Scherrer Institute, 5232 Villigen PSI, Switzerlandb Department of Mechanical and Process Engineering, ETH Zurich, 8092 Zurich, Switzerland
a r t i c l e i n f o
Article history:
Received 18 April 2009
Received in revised form
11 October 2009
Accepted 19 November 2009Available online 4 December 2009
Keywords:
CO2
Zn
ZnO
CO
Nanoparticles
Aerosol
Reactor
Thermochemical cycle
Solar
Energy
Renewable
CO2 reduction
CO2 splitting
Solar fuels
a b s t r a c t
Using concentrated solar energy as the source of high-temperature process heat, a two-step CO2
splitting thermochemical cycle based on Zn/ZnO redox reactions is applied to produce renewable fuels.
The solar thermochemical cycle consists of (1) the solar endothermic dissociation of ZnO to Zn and O2;
(2) the non-solar exothermic reduction of CO2 with Zn to CO and ZnO; the latter is recycled to the 1st
solar step. The second step of the cycle is experimentally investigated in a hot-wall quartz aerosol flow
reactor, designed for quenching of Zn(g), formation of Zn nanoparticles, and in-situ oxidation with CO2.
The effects of varying the reactants stoichiometry, reaction temperatures, and inlet flow temperatures
for radial and annular flows were investigated. Chemical conversions of Zn to ZnO of up to 88% were
obtained for a residence time of 3 s. For all of the experiments, the reactions primarily occurred
heterogeneously on the reaction zone surfaces, outside the aerosol jet flow.
& 2009 Elsevier Ltd. All rights reserved.
1. Introduction
In a previous work (Galvez et al., 2008), a two-step solar-driven thermochemical chemical cycle was proposed to convertcaptured CO2 into separate streams of CO and O2 using Zn/ZnOredox reactions. The resulting CO can be used as a combustionfuel or further processed via water-gas shift and/or Fischer–Tropsch synthesis to produce liquid fuels for transportation. Thesefuels are carbon-neutral provided the resulting CO2 from theircombustion is then recaptured from flue gases or atmospheric air.The first step of the cycle is the high-temperature endothermicdissociation of ZnO using concentrated solar energy for processheat, formulated as
ZnO-Znþ12O2 ð1Þ
and experimentally demonstrated at �2000 K with a 10 kW solarreactor prototype (Schunk et al., 2008; Schunk and Steinfeld,
2009). Rapid quenching of the products was required to avoidproduct recombination (Gstohl et al., 2008). In the second non-solar step, Zn is reacted with CO2 to produce CO in a lowtemperature exothermic reaction, formulated as
ZnþCO2-ZnOþCO ð2Þ
and experimentally demonstrated in a thermogravimeter (Lout-zenhiser et al., 2009) and in the imperial smelting process (Coxand Fray, 2000a, 2000b). The resulting ZnO is in turn recycled tothe first step to close the material cycle. The net reaction isCO2 ¼ COþ1
2O2, with products formed in different steps, therebyeliminating the need for their high-temperature separation. Asecond-law thermodynamic analysis indicates a maximum solar-to-chemical energy conversion efficiency of 39% for a solarconcentration ratio of 5000 suns (Galvez et al., 2008). Thedecomposition of CO2 with ferrites has also been extensivelyinvestigated experimentally (Ehrensberger et al., 1997; Farghaliet al., 2007; Kato et al., 1994; Khedr et al., 2007; Khedr andFarghali, 2005; Ma et al., 2007a, 2007b; Tamaura and Tabata,1990; Yamasue et al., 2007; Zhang et al., 2000, 1999, 1996).
ARTICLE IN PRESS
Contents lists available at ScienceDirect
journal homepage: www.elsevier.com/locate/ces
Chemical Engineering Science
0009-2509/$ - see front matter & 2009 Elsevier Ltd. All rights reserved.
doi:10.1016/j.ces.2009.11.025
� Corresponding author at: Department of Mechanical and Process Engineering,
ETH Zurich, 8092 Zurich, Switzerland.
E-mail address: [email protected] (A. Steinfeld).
Chemical Engineering Science 65 (2010) 1855–1864
Author's personal copyARTICLE IN PRESS
Similar work for the second step has been performed for theH2O-splitting cycle, which provided the foundation for this work(Steinfeld, 2002; Perkins and Weimer, 2004). Laboratory studieswere performed with steam bubbling through molten zinc in thetemperature range 723–773 K (Berman and Epstein, 2000), butthe continuous removal of ZnO(s) may pose process complica-tions. An alternative approach considered the reaction of Zn(g)with H2–H2O(g) mixtures in a continuous flow at 773–1173 K(Clarke and Fray, 1979), but oxidation occurred heterogeneouslyon the silica reactor walls by chemical vapor deposition, makingefficient recovery of ZnO difficult. The reaction kinetics wasfurther inhibited by the creation of a ZnO layer around unreactedZn particles. Thermogravimetric-based kinetic analyses of mm-sized Zn particles exposed to a CO2 flow indicated an initial fastinterface-controlled regime followed by a slow diffusion-con-trolled regime, limited by the ions mobility through the oxideshells (Loutzenhiser et al., 2009). Other metal oxide redox systemsare also being examined for splitting simultaneously CO2 and H2O(Allendorf et al., 2009; Chueh and Haile, 2009).
The use of Zn nanoparticles offers some intriguing advantages.Their large surface-to-volume ratios can lead to high conversionsand their high specific surfaces augment the reaction kinetics andheat/mass transfer. They can be produced by rapidly quenchingZn vapor flows below their saturation point. Aerosol flow reactorsfor the formation of Zn nanoparticles and their subsequenthydrolysis have yielded conversions of up to 90% (Weiss et al.,2005; Wegner et al., 2005; Ernst et al., 2006). Quench rates of2–6�104 K/s resulted in conversions of up to 95% with lowparticle yields in the filter but significant depositions on the wallsand subsequent reaction (Melchior et al., 2009). Conversions inthe range 87–96% were obtained in a similar setup at 1023 and1073 K and with residence times varying from 1.7 to 2.1 s (AbuHamed et al., 2008). The influence of pre-heated steam in the
range 473–823 K was also examined in batch experiments atatmospheric pressure, yielding conversions from 24% to 81%(Vishnevetsky and Epstein, 2007). Zn particles with an averagesize of 158 nm were reacted with steam in an aerosol flow tubereactor to yield 24% conversion at 813 K with a residence time of0.6 s (Funke et al., 2008).
A similar approach was used in this study to reduce CO2 to COwith Zn. A hot-wall vertical aerosol flow reactor was used toproduce Zn nano and submicron-sized particles that weresubsequently reacted in situ with CO2. This study examines ifhigher reaction extents of Zn to ZnO are possible in an aerosolflow with short residence times and if the reaction mechanismsare similar to those observed with aerosol reactors for H2O-splitting.
2. Experimental setup
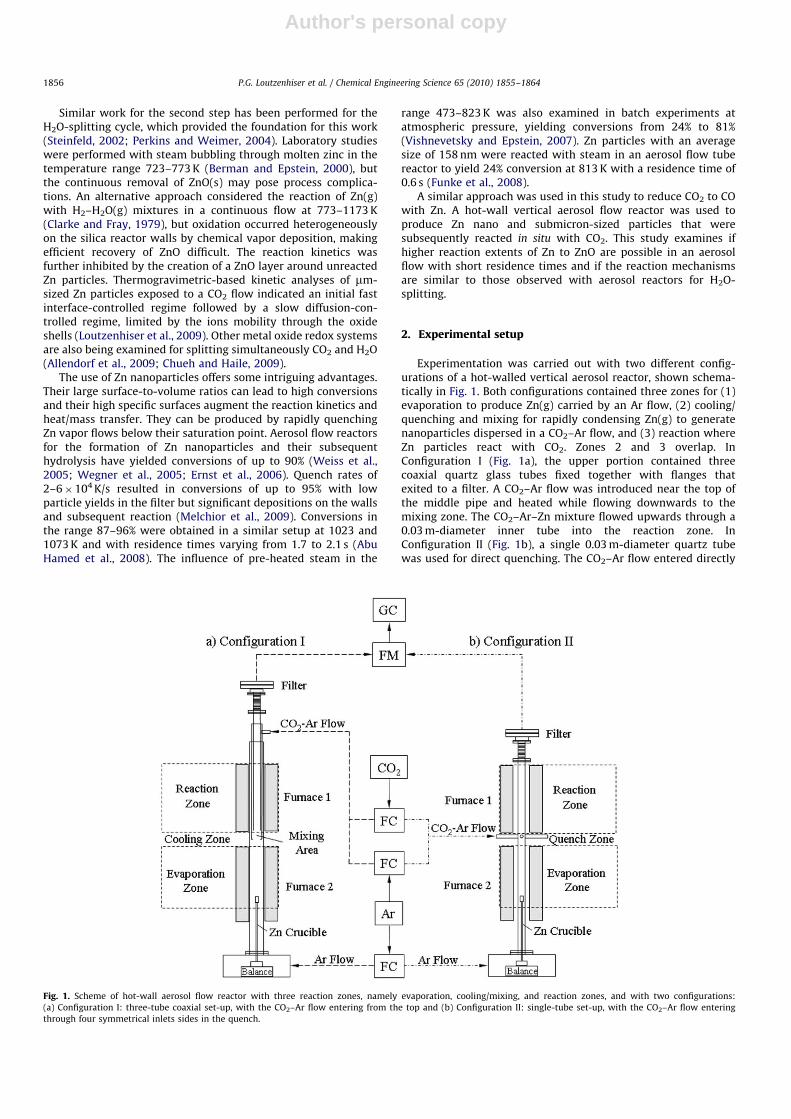
Experimentation was carried out with two different config-urations of a hot-walled vertical aerosol reactor, shown schema-tically in Fig. 1. Both configurations contained three zones for (1)evaporation to produce Zn(g) carried by an Ar flow, (2) cooling/quenching and mixing for rapidly condensing Zn(g) to generatenanoparticles dispersed in a CO2–Ar flow, and (3) reaction whereZn particles react with CO2. Zones 2 and 3 overlap. InConfiguration I (Fig. 1a), the upper portion contained threecoaxial quartz glass tubes fixed together with flanges thatexited to a filter. A CO2–Ar flow was introduced near the top ofthe middle pipe and heated while flowing downwards to themixing zone. The CO2–Ar–Zn mixture flowed upwards through a0.03 m-diameter inner tube into the reaction zone. InConfiguration II (Fig. 1b), a single 0.03 m-diameter quartz tubewas used for direct quenching. The CO2–Ar flow entered directly
Fig. 1. Scheme of hot-wall aerosol flow reactor with three reaction zones, namely evaporation, cooling/mixing, and reaction zones, and with two configurations:
(a) Configuration I: three-tube coaxial set-up, with the CO2–Ar flow entering from the top and (b) Configuration II: single-tube set-up, with the CO2–Ar flow entering
through four symmetrical inlets sides in the quench.
P.G. Loutzenhiser et al. / Chemical Engineering Science 65 (2010) 1855–18641856
Author's personal copyARTICLE IN PRESS
into the quench zone through four equally spaced symmetricalinlets normal to the Zn–Ar flow. A heating band was wrappedaround the exposed tubes in the quench zone, and a thermostatconnected to a K-type thermocouple situated in the CO2–Ar flowinlet, was used to regulate the temperature and quench rate.
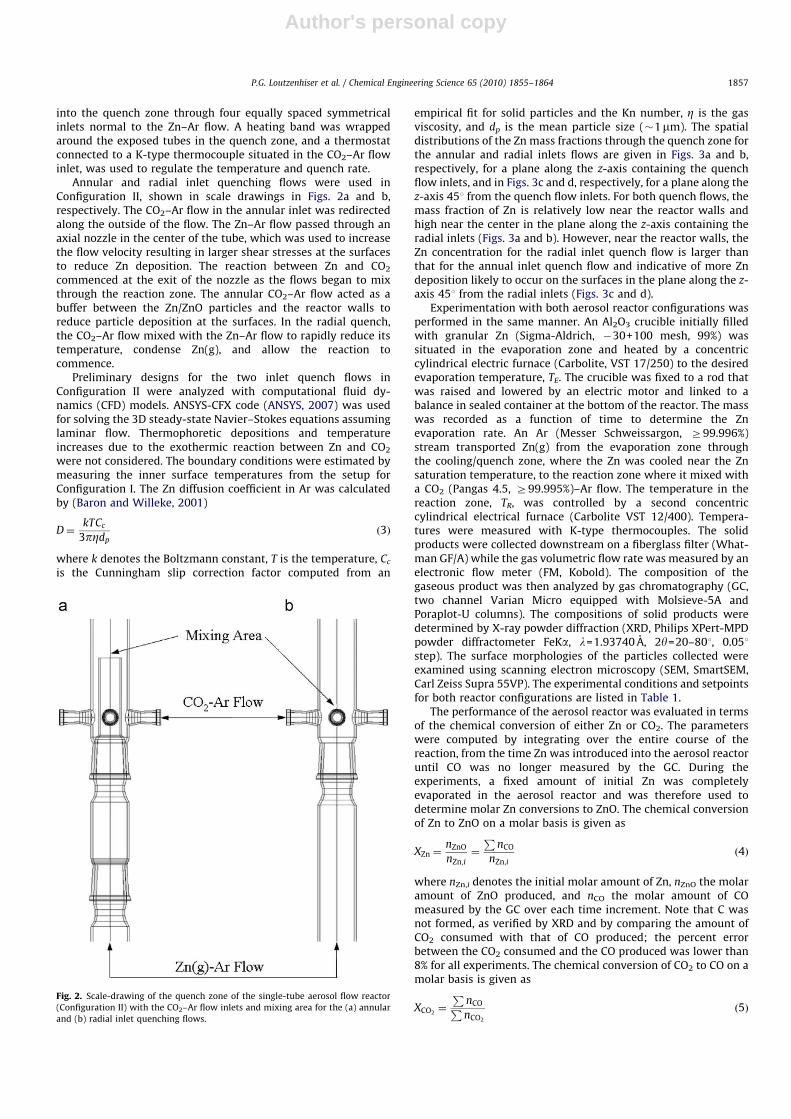
Annular and radial inlet quenching flows were used inConfiguration II, shown in scale drawings in Figs. 2a and b,respectively. The CO2–Ar flow in the annular inlet was redirectedalong the outside of the flow. The Zn–Ar flow passed through anaxial nozzle in the center of the tube, which was used to increasethe flow velocity resulting in larger shear stresses at the surfacesto reduce Zn deposition. The reaction between Zn and CO2
commenced at the exit of the nozzle as the flows began to mixthrough the reaction zone. The annular CO2–Ar flow acted as abuffer between the Zn/ZnO particles and the reactor walls toreduce particle deposition at the surfaces. In the radial quench,the CO2–Ar flow mixed with the Zn–Ar flow to rapidly reduce itstemperature, condense Zn(g), and allow the reaction tocommence.
Preliminary designs for the two inlet quench flows inConfiguration II were analyzed with computational fluid dy-namics (CFD) models. ANSYS-CFX code (ANSYS, 2007) was usedfor solving the 3D steady-state Navier–Stokes equations assuminglaminar flow. Thermophoretic depositions and temperatureincreases due to the exothermic reaction between Zn and CO2
were not considered. The boundary conditions were estimated bymeasuring the inner surface temperatures from the setup forConfiguration I. The Zn diffusion coefficient in Ar was calculatedby (Baron and Willeke, 2001)
D¼kTCc
3pZdpð3Þ
where k denotes the Boltzmann constant, T is the temperature, Cc
is the Cunningham slip correction factor computed from an
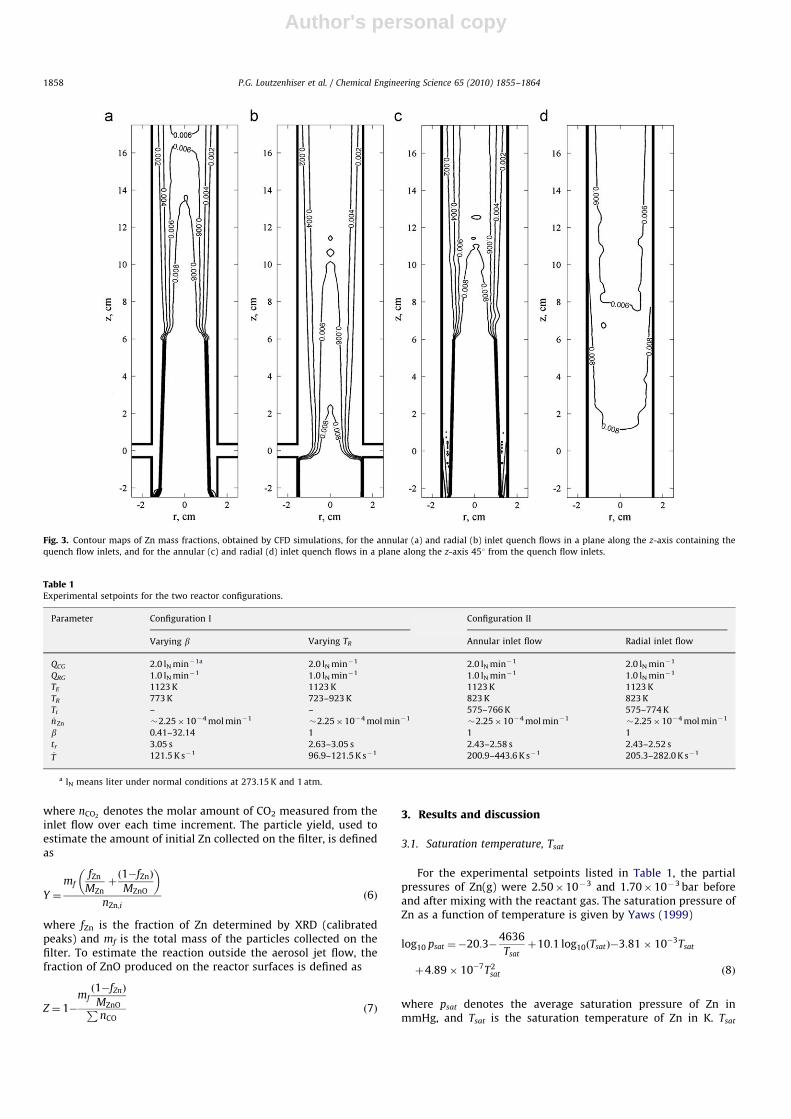
empirical fit for solid particles and the Kn number, Z is the gasviscosity, and dp is the mean particle size (�1mm). The spatialdistributions of the Zn mass fractions through the quench zone forthe annular and radial inlets flows are given in Figs. 3a and b,respectively, for a plane along the z-axis containing the quenchflow inlets, and in Figs. 3c and d, respectively, for a plane along thez-axis 451 from the quench flow inlets. For both quench flows, themass fraction of Zn is relatively low near the reactor walls andhigh near the center in the plane along the z-axis containing theradial inlets (Figs. 3a and b). However, near the reactor walls, theZn concentration for the radial inlet quench flow is larger thanthat for the annual inlet quench flow and indicative of more Zndeposition likely to occur on the surfaces in the plane along the z-axis 451 from the radial inlets (Figs. 3c and d).
Experimentation with both aerosol reactor configurations wasperformed in the same manner. An Al2O3 crucible initially filledwith granular Zn (Sigma-Aldrich, �30+100 mesh, 99%) wassituated in the evaporation zone and heated by a concentriccylindrical electric furnace (Carbolite, VST 17/250) to the desiredevaporation temperature, TE. The crucible was fixed to a rod thatwas raised and lowered by an electric motor and linked to abalance in sealed container at the bottom of the reactor. The masswas recorded as a function of time to determine the Znevaporation rate. An Ar (Messer Schweissargon, Z99.996%)stream transported Zn(g) from the evaporation zone throughthe cooling/quench zone, where the Zn was cooled near the Znsaturation temperature, to the reaction zone where it mixed witha CO2 (Pangas 4.5, Z99.995%)–Ar flow. The temperature in thereaction zone, TR, was controlled by a second concentriccylindrical electrical furnace (Carbolite VST 12/400). Tempera-tures were measured with K-type thermocouples. The solidproducts were collected downstream on a fiberglass filter (What-man GF/A) while the gas volumetric flow rate was measured by anelectronic flow meter (FM, Kobold). The composition of thegaseous product was then analyzed by gas chromatography (GC,two channel Varian Micro equipped with Molsieve-5A andPoraplot-U columns). The compositions of solid products weredetermined by X-ray powder diffraction (XRD, Philips XPert-MPDpowder diffractometer FeKa, l=1.93740 A, 2y=20–801, 0.051step). The surface morphologies of the particles collected wereexamined using scanning electron microscopy (SEM, SmartSEM,Carl Zeiss Supra 55VP). The experimental conditions and setpointsfor both reactor configurations are listed in Table 1.
The performance of the aerosol reactor was evaluated in termsof the chemical conversion of either Zn or CO2. The parameterswere computed by integrating over the entire course of thereaction, from the time Zn was introduced into the aerosol reactoruntil CO was no longer measured by the GC. During theexperiments, a fixed amount of initial Zn was completelyevaporated in the aerosol reactor and was therefore used todetermine molar Zn conversions to ZnO. The chemical conversionof Zn to ZnO on a molar basis is given as
XZn ¼nZnO
nZn;i¼
PnCO
nZn;ið4Þ
where nZn,i denotes the initial molar amount of Zn, nZnO the molaramount of ZnO produced, and nCO the molar amount of COmeasured by the GC over each time increment. Note that C wasnot formed, as verified by XRD and by comparing the amount ofCO2 consumed with that of CO produced; the percent errorbetween the CO2 consumed and the CO produced was lower than8% for all experiments. The chemical conversion of CO2 to CO on amolar basis is given as
XCO2¼
PnCOPnCO2
ð5ÞFig. 2. Scale-drawing of the quench zone of the single-tube aerosol flow reactor
(Configuration II) with the CO2–Ar flow inlets and mixing area for the (a) annular
and (b) radial inlet quenching flows.
P.G. Loutzenhiser et al. / Chemical Engineering Science 65 (2010) 1855–1864 1857
Author's personal copyARTICLE IN PRESS
where nCO2denotes the molar amount of CO2 measured from the
inlet flow over each time increment. The particle yield, used toestimate the amount of initial Zn collected on the filter, is definedas
Y ¼
mffZn
MZnþð1�fZnÞ
MZnO
� �
nZn;ið6Þ
where fZn is the fraction of Zn determined by XRD (calibratedpeaks) and mf is the total mass of the particles collected on thefilter. To estimate the reaction outside the aerosol jet flow, thefraction of ZnO produced on the reactor surfaces is defined as
Z ¼ 1�mfð1�fZnÞ
MZnOPnCO
ð7Þ
3. Results and discussion
3.1. Saturation temperature, Tsat
For the experimental setpoints listed in Table 1, the partialpressures of Zn(g) were 2.50�10�3 and 1.70�10�3 bar beforeand after mixing with the reactant gas. The saturation pressure ofZn as a function of temperature is given by Yaws (1999)
log10 psat ¼�20:3�4636
Tsatþ10:1 log10ðTsatÞ�3:81� 10�3Tsat
þ4:89� 10�7T2sat ð8Þ
where psat denotes the average saturation pressure of Zn inmmHg, and Tsat is the saturation temperature of Zn in K. Tsat
Fig. 3. Contour maps of Zn mass fractions, obtained by CFD simulations, for the annular (a) and radial (b) inlet quench flows in a plane along the z-axis containing the
quench flow inlets, and for the annular (c) and radial (d) inlet quench flows in a plane along the z-axis 451 from the quench flow inlets.
Table 1Experimental setpoints for the two reactor configurations.
Parameter Configuration I Configuration II
Varying b Varying TR Annular inlet flow Radial inlet flow
QCG 2.0 lN min�1a 2.0 lN min�1 2.0 lN min�1 2.0 lN min�1
QRG 1.0 lN min�1 1.0 lN min�1 1.0 lN min�1 1.0 lN min�1
TE 1123 K 1123 K 1123 K 1123 K
TR 773 K 723–923 K 823 K 823 K
Ti – – 575–766 K 575–774 K_nZn �2.25�10�4 mol min�1
�2.25�10�4 mol min�1�2.25�10�4 mol min�1
�2.25�10�4 mol min�1
b 0.41–32.14 1 1 1
tr 3.05 s 2.63–3.05 s 2.43–2.58 s 2.43–2.52 s_T 121.5 K s�1 96.9–121.5 K s�1 200.9–443.6 K s�1 205.3–282.0 K s�1
a lN means liter under normal conditions at 273.15 K and 1 atm.
P.G. Loutzenhiser et al. / Chemical Engineering Science 65 (2010) 1855–18641858
Author's personal copyARTICLE IN PRESS
before and after mixing was computed iteratively as 788 and771 K, respectively.
3.2. Centerline temperature, Tc
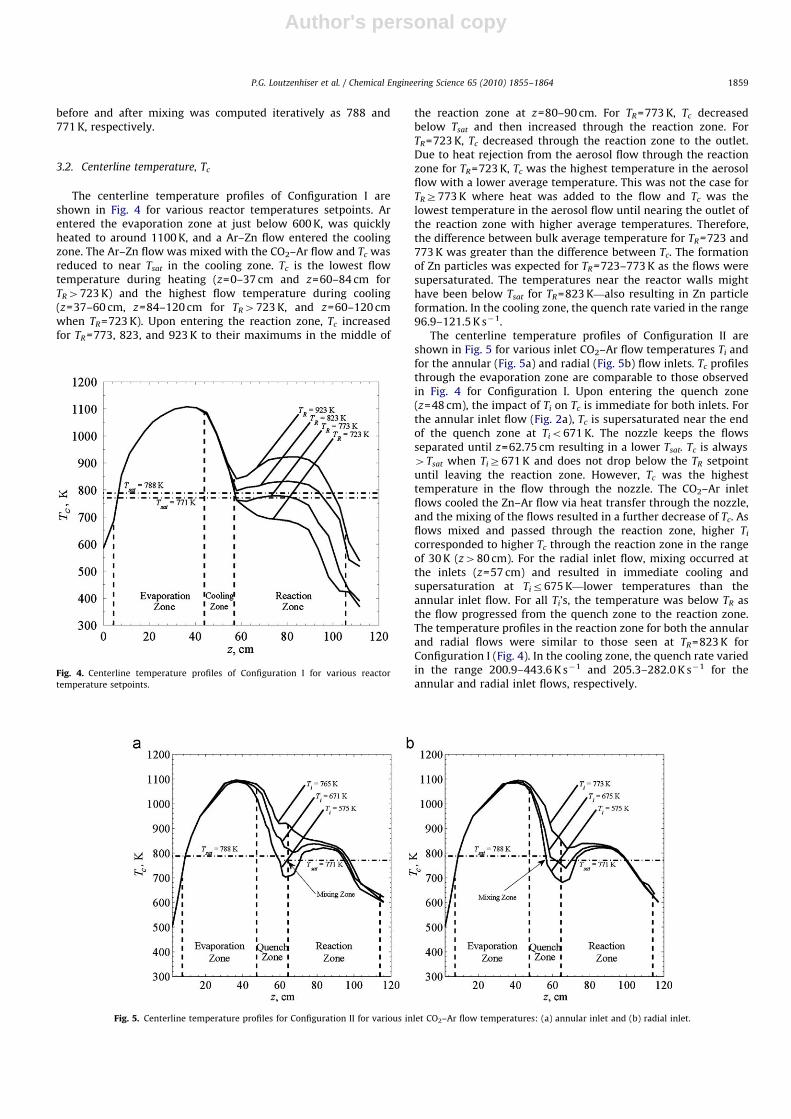
The centerline temperature profiles of Configuration I areshown in Fig. 4 for various reactor temperatures setpoints. Arentered the evaporation zone at just below 600 K, was quicklyheated to around 1100 K, and a Ar–Zn flow entered the coolingzone. The Ar–Zn flow was mixed with the CO2–Ar flow and Tc wasreduced to near Tsat in the cooling zone. Tc is the lowest flowtemperature during heating (z=0–37 cm and z=60–84 cm forTR4723 K) and the highest flow temperature during cooling(z=37–60 cm, z=84–120 cm for TR4723 K, and z=60–120 cmwhen TR=723 K). Upon entering the reaction zone, Tc increasedfor TR=773, 823, and 923 K to their maximums in the middle of
the reaction zone at z=80–90 cm. For TR=773 K, Tc decreasedbelow Tsat and then increased through the reaction zone. ForTR=723 K, Tc decreased through the reaction zone to the outlet.Due to heat rejection from the aerosol flow through the reactionzone for TR=723 K, Tc was the highest temperature in the aerosolflow with a lower average temperature. This was not the case forTRZ773 K where heat was added to the flow and Tc was thelowest temperature in the aerosol flow until nearing the outlet ofthe reaction zone with higher average temperatures. Therefore,the difference between bulk average temperature for TR=723 and773 K was greater than the difference between Tc. The formationof Zn particles was expected for TR=723–773 K as the flows weresupersaturated. The temperatures near the reactor walls mighthave been below Tsat for TR=823 K—also resulting in Zn particleformation. In the cooling zone, the quench rate varied in the range96.9–121.5 K s�1.
The centerline temperature profiles of Configuration II areshown in Fig. 5 for various inlet CO2–Ar flow temperatures Ti andfor the annular (Fig. 5a) and radial (Fig. 5b) flow inlets. Tc profilesthrough the evaporation zone are comparable to those observedin Fig. 4 for Configuration I. Upon entering the quench zone(z=48 cm), the impact of Ti on Tc is immediate for both inlets. Forthe annular inlet flow (Fig. 2a), Tc is supersaturated near the endof the quench zone at Tio671 K. The nozzle keeps the flowsseparated until z=62.75 cm resulting in a lower Tsat. Tc is always4Tsat when TiZ671 K and does not drop below the TR setpointuntil leaving the reaction zone. However, Tc was the highesttemperature in the flow through the nozzle. The CO2–Ar inletflows cooled the Zn–Ar flow via heat transfer through the nozzle,and the mixing of the flows resulted in a further decrease of Tc. Asflows mixed and passed through the reaction zone, higher Ti
corresponded to higher Tc through the reaction zone in the rangeof 30 K (z480 cm). For the radial inlet flow, mixing occurred atthe inlets (z=57 cm) and resulted in immediate cooling andsupersaturation at Tir675 K—lower temperatures than theannular inlet flow. For all Ti’s, the temperature was below TR asthe flow progressed from the quench zone to the reaction zone.The temperature profiles in the reaction zone for both the annularand radial flows were similar to those seen at TR=823 K forConfiguration I (Fig. 4). In the cooling zone, the quench rate variedin the range 200.9–443.6 K s�1 and 205.3–282.0 K s�1 for theannular and radial inlet flows, respectively.
Fig. 4. Centerline temperature profiles of Configuration I for various reactor
temperature setpoints.
Fig. 5. Centerline temperature profiles for Configuration II for various inlet CO2–Ar flow temperatures: (a) annular inlet and (b) radial inlet.
P.G. Loutzenhiser et al. / Chemical Engineering Science 65 (2010) 1855–1864 1859

Author's personal copyARTICLE IN PRESS
3.3. Zn evaporation and CO production
For each experiment, the Zn evaporation and CO productionrates were calculated based on mass balance, GC, andvolumetric flow measurements as functions of time for givenaverage reactant CO2:Zn molar flow ratios (b). The CO produc-tions rates were compared with the CO2 consumption rate toverify the mass balance. Prior to experiments, steady-stateconditions for gas flows and temperatures were reached and airwas purged from the system by Ar flows. CO2 was introduced
into the aerosol reactor, and, when the CO2 concentrationswere constant, the Zn crucible was raised into the evaporationzone. Fig. 6 shows representative results for an experimentwith b�1 and TR =823 K. Over the course of the experiment, theinstantaneous reactant CO2:Zn molar flow ratio changed from0.78 to 1.18, which was typical for all experiments. Znevaporation commenced 10 min into the experiment whenthe crucible was raised into the evaporation zone. COwas immediately produced while CO2 was consumed. The Znevaporation rate was higher at the beginning of the experi-ment with more Zn in the crucible and decreased by nearly2.0�10�4 mol/min over the 30 min required for complete Znevaporation. CO was still generated for 20 min after theZn completely evaporated due to surface reactions with solidZn deposited on the tube walls throughout the reaction zone.
3.4. Configuration I
The influences of b and TR were examined. Fig. 7 shows theresulting XZn, XCO2
, Y, and Z as a function of b in the range0.41–32.14 and at TR =773 K. XZn increased with higher b andreached its maximum of 88% at b=32.4. XCO2
was higher withlower b and reached its maximum of 52% at b=0.4, whichcorresponded to the lowest b considered. The intersection ofXZn and XCO2
at 39% occurred near b=1 and represents the mostefficient use of both reactants. Z for the entire suite ofexperimental runs was always near 100%, indicating that thereaction primarily occurred outside the aerosol jet flow;however, small amounts of ZnO were collected in the filterwhen b=1.06.
Fig. 8 shows XZn, Y, and Z as a function TR in the range 723–923 K with b=1. The maximum XZn=52% occurred at TR=823 K,which also corresponded to the lowest Y, indicating the reactionoccurred heterogeneously primarily on the reactor surfacesoutside of the aerosol jet flow. According to Fig. 4 whenTR4823 K, Tc was 4Tsat. Thus, bulk temperatures were near Tsat
in the cooling zone, and 4Tsat as the flow was heated near the
Fig. 7. The chemical conversion of Zn (XZn, squares) and of CO2 (XCO2, circles),
particle yield (Y, triangles), and ZnO production outside the filter (Z, diamonds)
versus the reactant molar flow ratio of CO2:Zn, b, at TR=773 K. Experimental runs
were performed with the Configuration I aerosol reactor.
Fig. 8. The chemical conversion of Zn, (XZn, squares), particle yield (Y, triangles),
and ZnO production outside the filter (Z, diamonds) versus reaction temperature,
TR, with CO2:Zn molar flow ratio b=1. Experimental runs were performed with the
Configuration I aerosol reactor.
Fig. 6. Molar flows of Zn (solid), CO (dashed), and CO2 (dotted) versus time for a
representative experimental run at TR=823 K and CO2:Zn molar flow ratio b=1 for
Configuration I.
P.G. Loutzenhiser et al. / Chemical Engineering Science 65 (2010) 1855–18641860
Author's personal copyARTICLE IN PRESS
exit of the quench zone. Therefore, more gaseous Zn remained inthe aerosol jet flow through the cooling zone, which resulted inhigher Y coupled with much lower XZn and XCO2
. When Zncondensed in the aerosol jet flow prior to reaching the coolingzone (Fig. 4 for TRo823 K), temperatures were not high enoughand/or tr was not long enough to drive the reaction to completion.This resulted in lower XZn and XCO2
coupled with lower Z andhigher Y-indicating that at least a partial reaction occurred in theaerosol jet flow and/or ZnO formed on the reactor walls, broke off,and was transported to the filter in the aerosol jet flow. For higherconversions, tr could be increased by reducing the flow rates orlengthening the reaction zone.
3.5. Configuration II
TR was set to 823 K based on the results with Configuration I.While the temperature profiles and velocities through thereaction zone were similar, difference in sizes and distributionmay result in slightly better results and at different TR. b wasfixed at near 1 to maximize the use of both reactants. Theresults from a suite of experiments with an annular inlet flow atTi =575–766 K are given in Fig. 9. The maximum XZn =45.0%occurred at Ti =669.7 K. From Fig. 5a, this corresponded to Tc
near Tsat. At lower Ti, large amounts of Zn condensed andremained unreacted in the nozzles, which resulted in lower XZn
and Y. In contrast, at higher Ti, negligible Zn depositions wereseen in the nozzle and more particles were collected in thefilter, Y, which also corresponded to an increased amount ofZn(g) that remained unreacted through the reaction zone. Thereaction occurred outside the aerosol jet due to heterogeneousnucleation as indicated by high Z, despite a flow designed toreduce Zn concentrations near the walls. Zn depositions werefound at inlet and outlet of the reaction zone and presumablyresult from thermophoresis due temperature gradientsassociated with cooling and Zn diffusion towards the outersurfaces of the reactor.
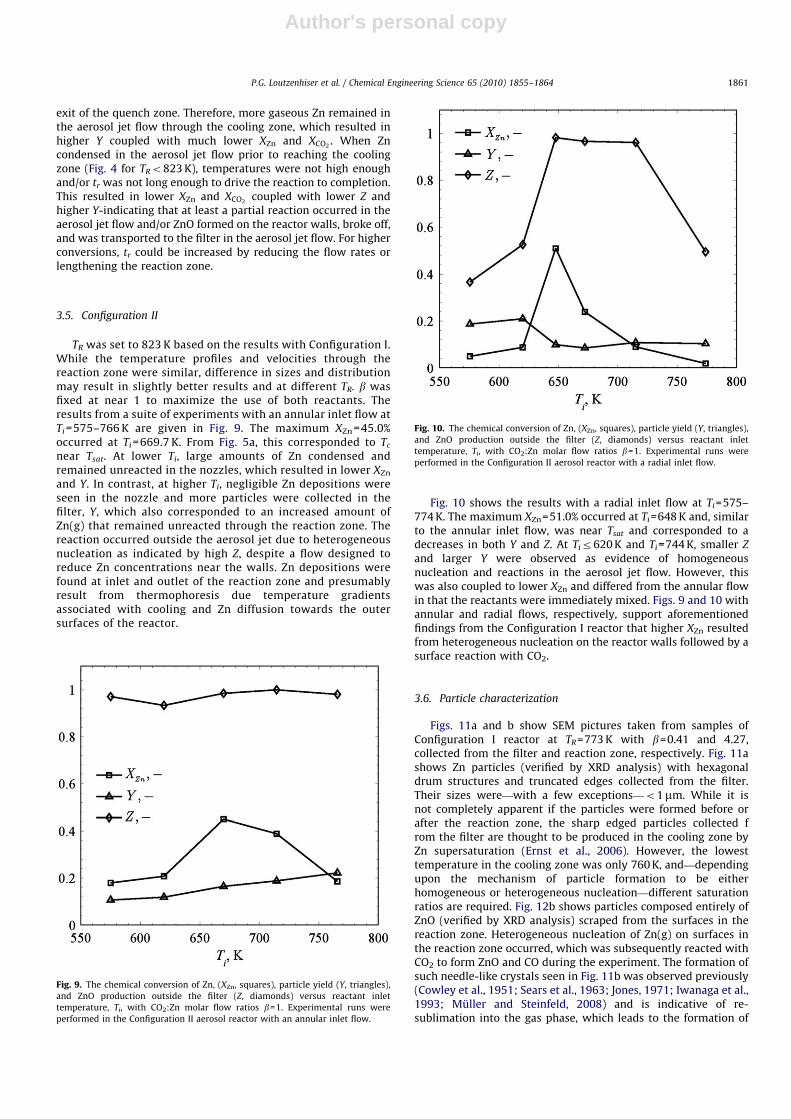
Fig. 10 shows the results with a radial inlet flow at Ti=575–774 K. The maximum XZn=51.0% occurred at Ti=648 K and, similarto the annular inlet flow, was near Tsat and corresponded to adecreases in both Y and Z. At Tir620 K and Ti=744 K, smaller Z
and larger Y were observed as evidence of homogeneousnucleation and reactions in the aerosol jet flow. However, thiswas also coupled to lower XZn and differed from the annular flowin that the reactants were immediately mixed. Figs. 9 and 10 withannular and radial flows, respectively, support aforementionedfindings from the Configuration I reactor that higher XZn resultedfrom heterogeneous nucleation on the reactor walls followed by asurface reaction with CO2.
3.6. Particle characterization
Figs. 11a and b show SEM pictures taken from samples ofConfiguration I reactor at TR=773 K with b=0.41 and 4.27,collected from the filter and reaction zone, respectively. Fig. 11ashows Zn particles (verified by XRD analysis) with hexagonaldrum structures and truncated edges collected from the filter.Their sizes were—with a few exceptions—o1mm. While it isnot completely apparent if the particles were formed before orafter the reaction zone, the sharp edged particles collected from the filter are thought to be produced in the cooling zone byZn supersaturation (Ernst et al., 2006). However, the lowesttemperature in the cooling zone was only 760 K, and—dependingupon the mechanism of particle formation to be eitherhomogeneous or heterogeneous nucleation—different saturationratios are required. Fig. 12b shows particles composed entirely ofZnO (verified by XRD analysis) scraped from the surfaces in thereaction zone. Heterogeneous nucleation of Zn(g) on surfaces inthe reaction zone occurred, which was subsequently reacted withCO2 to form ZnO and CO during the experiment. The formation ofsuch needle-like crystals seen in Fig. 11b was observed previously(Cowley et al., 1951; Sears et al., 1963; Jones, 1971; Iwanaga et al.,1993; Muller and Steinfeld, 2008) and is indicative of re-sublimation into the gas phase, which leads to the formation of
Fig. 9. The chemical conversion of Zn, (XZn, squares), particle yield (Y, triangles),
and ZnO production outside the filter (Z, diamonds) versus reactant inlet
temperature, Ti, with CO2:Zn molar flow ratios b=1. Experimental runs were
performed in the Configuration II aerosol reactor with an annular inlet flow.
Fig. 10. The chemical conversion of Zn, (XZn, squares), particle yield (Y, triangles),
and ZnO production outside the filter (Z, diamonds) versus reactant inlet
temperature, Ti, with CO2:Zn molar flow ratios b=1. Experimental runs were
performed in the Configuration II aerosol reactor with a radial inlet flow.
P.G. Loutzenhiser et al. / Chemical Engineering Science 65 (2010) 1855–1864 1861

Author's personal copyARTICLE IN PRESS
non-uniform oxide layers with interstices where CO2 and Zn(g)can diffuse.
SEM analyses were also performed for samples collected fromthe filter for the Configuration II reactor. There were very fewdifferences between particles collected for the two inlet flowsshown in Figs. 12a–c. Higher velocities corresponded to largertemperature flow gradients through the quench zone wheremixing occurred, resulting in larger amounts of Zn(g) through thereaction zone. All of the SEM pictures contain nanofilamentstructures, presumably as a result of Zn nucleation near the end ofthe reaction zone. However, Zn particles were formed in thequench zone by homogeneous nucleation in the aerosol flow.Fig. 12a shows numerous hexagonal drum structures andtruncated edges of o1mm buried in Zn filaments for the annularinlet flows. Zn particles similar to those in the Configuration Ireactor were isolated from the Zn nanofilaments and are shownin Fig. 12b also for the annular inlet flow. Fig. 12c shows particlescollected in the filter from the radial flow. Nearly all of theparticles were o1mm with no evidence of clearly defined ZnOstructures.
4. Summary and conclusions
The chemical reduction of CO2 to CO with Zn nanoparticles wasstudied in a hot-wall vertical aerosol flow reactor, in which Zn wasevaporated and subsequently quenched near the Zn saturationtemperature to create nanoparticles for in-situ reaction with CO2.Two reactor configurations were examined: (I) three-tube coaxial
set-up, with the CO2–Ar flow entering from the top, and (II) asingle-tube set-up, with the CO2–Ar flow entering through foursymmetrical inlets sides in the quench. The chemical conversionsof Zn and CO2, particle yields, and fraction of ZnO producedoutside aerosol jet flow were determined to quantify the overallperformance. For Configuration I, the influences of both the CO2:Znmolar flow ratio and the reaction temperature were investigated.For a suite of experiments with reactant molar flow ratios from0.41 to 32.4 and a reaction temperature of 773 K, the optimalchemical conversion of Zn and CO2 of 39% occurred near a reactant
Fig. 11. SEM pictures of Zn/ZnO particles collected from: (a) the filter for b=0.41
and (XRD: 100% Zn) and (b) the reaction zone for b=4.27 (XRD: 100% ZnO) and
TR=773 K. Experimental runs were performed with the Configuration I aerosol
reactor.
Fig. 12. SEM pictures of Zn/ZnO particles collected from filter with inlet
temperatures of (a) annular inlet flow and Ti=620 K; (b) annular inlet flow and
Ti=670 K and (c) radial inlet flow and Ti=715 K. Experimental runs were performed
with the Configuration II aerosol reactor.
P.G. Loutzenhiser et al. / Chemical Engineering Science 65 (2010) 1855–18641862

Author's personal copyARTICLE IN PRESS
molar flow ratio of unity, representing to most efficient use ofboth reactants; however, Zn conversion increased while CO2
conversion decreased with increasing reactant molar flow ratios.The reaction temperature was then varied from 723 to 923 K, andthe reactant molar flow ratio was fixed near unity. The maximumchemical conversion of Zn was 52%, and occurred at a reactiontemperature of 823 K. For Configuration II, annular and radial inletflows were used to regulate the quench. The quench rate varied byadjusting inlet temperatures from 573 to 773 K at a constantvolumetric flow rate. The maximum chemical conversion of Zn forthe annular and radial inlet flows was 45% and 51%, respectively,and corresponded to centerline temperatures in quench zone nearthe Zn saturation temperature. Although the quench zone wasdesigned to reduce Zn depositions, no significant differences werediscovered. The assumptions in the CFD models, especiallyconcerning thermophoretic depositions, appear to oversimplifythe problem.
For all experiments, higher chemical conversions coincidedwith lower particle yields and ZnO production in the aerosolflow. Therefore, for this aerosol reactor design, the primaryreaction resulted from heterogeneous nucleation of Zn on thesurfaces in the reaction zone followed by a subsequent reactionwith the CO2. Higher conversions in the aerosol flow may bepossible with longer residence times and lower saturationtemperatures. While the aerosol flow reactor offers insight intoin-situ reactions of nano and submicron-sized Zn particles andCO2, the energy penalty to evaporate Zn and rapidly cool orquench the flow below saturation point makes such a reactorprohibitive for efficient energy conversion. However, this studyis useful for identifying optimum temperatures and the scale ofZn particles necessary for such applications. The Zn particlesproduced in this study are comparable in size to those producedby solar ZnO dissociation (Gstohl et al., 2008). Therefore, it ispossible to design an aerosol flow reactor where the Znparticles obtained from the 1st solar step are dispersed in aCO2 flow and transported through a tubular reactor for an in-
situ reaction with CO2 at an optimum temperature and O2:Znmolar flow ratio.
Notation
Cc Cunningham slip correction factor, dimensionlessdp Zn particle diameter, mD solid–gas diffusion coefficient of Zn in Ar, m2/sfZn mass fraction of Zn determined by XRD, dimensionlessk Boltzmann constant, 1.38�10�23 N m/Kmf mass of Zn/ZnO on the filter, gM molecular weight, g mol�1
n molar amount, molni initial molar amount, mol_n molar flow rate, mol min�1
psat saturation pressure, mmHgQCG volumetric flow rate of carrier gas, lN min�1
QRG volumetric flow rate of reactant gas, lN min�1
t time of experiment, mintr residence time in the reaction zone, s_T quench rate, K s�1
T temperature, KTc centerline temperature, KTE evaporation zone temperature (setpoint), KTi inlet CO2–Ar flow temperature, KTR reaction zone temperature (setpoint), KTsat saturation temperature, KXCO2
chemical conversion of CO2 to CO, dimensionless
XZn chemical conversion of Zn to ZnO, dimensionless
Y particle yield in the filter, dimensionlessz vertical reactor distance, cmZ fraction of ZnO produced outside aerosol flow,
dimensionless
Greek letters
b reactant CO2:Zn molar flow ratio, dimensionless
Z gas viscosity, N s/m2
Acknowledgments
This work has been financially supported by the BaugartenFoundation and the Swiss Federal Office of Energy. We acknowl-edge the assistance of Alwin Frei in performing the XRD and SEManalyses.
References
Abu Hamed, T., Davidson, J.H., Stolzenburg, M., 2008. Hydrolysis of evaporatedZn in a hot wall flow reaction. Journal of Solar Energy Engineering 130,041010-1-7.
Allendorf, M.D., McDaniel, A.H., Scheffe, J., Weimer, A.W., 2009. Phase equilibriummodeling of CO2 and H2O splitting by ferrites. In: Proceedings of SolarPACES2009, Berlin, Germany, 15–18 September 2009.
ANSYS-CFX 11.0, 2007, /http://www.ansys.comS.Baron, P.A., Willeke, K., 2001. Aerosol Measurements: Principles, Techniques, and
Applications, second ed. Wiley-Interscience, New York.Berman, A., Epstein, M., 2000. The kinetics of hydrogen production in the oxidation
of liquid zinc with water vapor. International Journal of Hydrogen Energy 20,957–967.
Chueh, W.C., Haile, S.M., 2009. Ceria as a thermochemical reaction medium forselectively generating syngas or methane from H2O and CO2. ChemSusChem 2,735–739.
Clarke, J.A., Fray, D.J., 1979. Oxidation of zinc vapor by hydrogen–water vapor mixtures.Transactions of the Institute of Mining and Metallurgy C 88, C161–C166.
Cowley, J.M., Rees, A.L.G., Spink, J.A., 1951. The morphology of zinc oxide smokeparticles. Journal of Physical Society London B 64, 638–644.
Cox, A., Fray, D.J., 2000a. Zinc reoxidation in the shaft of a zinc–lead imperialsmelting furnace—1: zinc–carbon–oxygen system with deposition initiated ona quartz substrate and subsequent propagation on zinc oxide. Transactions ofthe Institution of Mining and Metallurgy (Section C: Mineral Processing andExtractive Metallurgy) 109, C97–C104.
Cox, A., Fray, D.J., 2000b. Zinc reoxidation in the shaft of a zinc–lead imperialsmelting furnace—2: zinc–carbon–oxygen system in combination with sinterand coke substrates. Transactions of the Institution of Mining and Metallurgy(Section C: Mineral Processing and Extractive Metallurgy) 109, C105–C111.
Ehrensberger, K., Palumbo, R., Larson, C., Steinfeld, A., 1997. Production of carbonfrom carbon dioxide with iron oxides and high-temperature solar energy.Industrial & Engineering Chemistry Research 36, 645–648.
Ernst, F.O., Tricoli, A., Pratsinis, S.E., Steinfeld, A., 2006. Co-synthesis of H2 and ZnOby in-situ zinc aerosol formation and hydrolysis. A.I.Ch.E. 52, 3297–3303.
Farghali, A.A., Khedr, M.H., Abdelkhalek, A., 2007. Catalytic decomposition ofcarbondioxide over freshly reduced activated CuFe2O4 nano-crystals. Journalof Materials Processing Technology 181, 81–87.
Funke, H.H., Diaz, H., Liang, X., Carney, C.S., Weimer, A.W., Li, P., 2008. Hydrogengeneration by hydrolysis of Zn powder aerosol. International Journal ofHydrogen Energy 33, 1027–1134.
Galvez, M.E., Loutzenhiser, P.G., Hischier, I., Steinfeld, A., 2008. CO2 Splitting viatwo-step solar thermochemical cycles with Zn/ZnO and FeO/Fe3O4 redoxreactions—thermodynamic analysis. Energy & Fuels 22, 3544–3550.
Gstohl, D., Brambilla, A., Schunk, L., Steinfeld, A., 2008. A quenching apparatus forthe gaseous products of the solar thermal dissociation of ZnO. Journal ofMaterial Sciences 43, 4729–4736.
Iwanaga, H., Fujii, M., Takeuchi, S., 1993. Growth model of tetrapod zinc oxideparticles. Journal of Crystal Growth 134, 275–280.
Jones, K.A., 1971. A mechanism for the formation of dislocations in ZnO singlecrystals. Journal of Crystal Growth 8 (1), 63–68.
Kato, H., Kodama, M., Tsuji, M., Tamaura, Y., 1994. Decomposition of carbondioxide to carbon by hydrogen-reduced Ni(II)-bearing ferrite. Journal ofMaterial Science 29, 5689–5692.
Khedr, M.H., Bahgat, M., Nasr, M.I., Sedeek, E.K., 2007. CO2 decomposition overfreshly reduced nanocrystalline Fe2O3. Colloids and Surfaces A: Physicochem-ical and Engineering Aspects 302, 517–524.
Khedr, M.H., Farghali, A.A., 2005. Microstructure, kinetics and mechanisms of CO2
catalytic decomposition over freshly reduced nano-crystallite CuFe2O4 at 400–600 1C. Applied Catalysis B: Environmental 61, 219–226.
P.G. Loutzenhiser et al. / Chemical Engineering Science 65 (2010) 1855–1864 1863

Author's personal copyARTICLE IN PRESS
Loutzenhiser, P.G., Galvez, M.E., Hischier, I., Stamatiou, A., Frei, A., Steinfeld, A.,2009. CO2 splitting via two-step solar thermochemical cycles with Zn/ZnO andFeO/Fe3O4 redox reactions II: kinetic analysis. Energy & Fuels 23, 2832–2839.
Ma, L.Y., Chen, L.S., Chen, S.Y., 2007a. Study of the CO2 decomposition over dopedNi-ferrites. Journal of Physics and Chemistry of Solids 68, 1330–1335.
Ma, L.Y., Chen, L.S., Chen, S.Y., 2007b. Study on the cycle decomposition of CO2 overNiCr0.08Fe1.92O4 and the microstructure of products. Material ChemistryPhysics 105, 122–126.
Melchior, T., Piatkowski, N., Steinfeld, A., 2009. H2 production by steam-quenchingof Zn vapor in a hot-wall aerosol flow reactor. Chemical Engineering Science64, 1095–1101.
Muller, R., Steinfeld, A., 2008. H2O-splitting thermochemical cycle based on ZnO/Zn-redox: quenching the effluents from the ZnO dissociation. ChemicalEngineering Science 63, 217–227.
Perkins, C., Weimer, A.W., 2004. Likely near-term solar-thermal water splittingtechnologies. International Journal of Hydrogen Energy 29, 1587–1599.
Schunk, L., Haeberling, P., Wepf, S., Wuillemin, D., Meier, A., Steinfeld, A., 2008. Areceiver-reactor for the solar thermal dissociation of Zinc Oxide. ASME Journalof Solar Energy Engineering 130, 021009.
Schunk, L., Steinfeld, A., 2009. Kinetics of the thermal dissociation of ZnO exposedto concentrated solar irradiation using a solar-driven thermogravimeter in the1800–2100 K range. AIChE Journal 55, 1497–1504.
Sears, G.W., Powell, R., Donn, B., 1963. Structure of zinc oxide nuclei. Journal ofChemical Physics 39, 2248–2251.
Steinfeld, A., 2002. Solar hydrogen production via a two-step water-splittingthermochemical cycle based on Zn/ZnO redox reactions. International Journalof Hydrogen Energy 27, 611–619.
Tamaura, Y., Tabata, M., 1990. Complete reduction of carbon dioxide to carbonusing cation-excess magnetite. Nature 346, 255–256.
Vishnevetsky, I., Epstein, M., 2007. Production of hydrogen from solar zinc insteam atmosphere. International Journal of Hydrogen Energy 32, 2791–2802.
Weiss, R.J., Wegener, K., Pratisinis, S.E., Steinfeld, A., 2005. H2 production by Znhydrolysis in a hot-wall aerosol reactor. A.I.Ch.E. 51, 1966–1970.
Wegner, K., Ly, H., Weiss, R., Pratisinis, S.E., Steinfeld, A., 2005. In situ formationand hydrolysis of Zn nanoparticles for H2 production by the 2-step ZnO/Znwater-splitting thermochemical cycle. International Journal of HydrogenEnergy 31, 55–61.
Yamasue, E., Yamaguchi, H., Nakaoku, H., Okumura, H., Ischihara, K.N., 2007.Carbon dioxide reduction into carbon by mechanically milled wustite. Journalof Material Science 42, 5196–5202.
Yaws, C.L., 1999. Chemical Properties Handbook. McGraw-Hill, New York, NY.Zhang, C.L., Li, S., Wang, L.J., Wu, T.H., Peng, S.Y., 2000. Studies on the
decomposition of carbon dioxide into carbon with oxygen-deficient magnetiteI. Preparation, characterization of magnetite, and its activity of decomposingcarbon dioxide. Materials Chemistry and Physics 62, 44–51.
Zhang, C.L., Li, S., Wu, T.H., Peng, S.Y., 1999. Reduction of carbon dioxide intocarbon by the active wustite and the mechanism of the reaction. MaterialsChemistry and Physics 58, 139–145.
Zhang, C.L., Liu, Z.Q., Wu, T.H., Yang, H.M., Jiang, Y.Z., Peng, S.Y., 1996. Completereduction of carbon dioxide to carbon and indirect conversion to O2 usingcation-excess magnetite. Materials Chemistry and Physics 44, 194–198.
P.G. Loutzenhiser et al. / Chemical Engineering Science 65 (2010) 1855–18641864