
Identification of copper phthalocyanine blue polymorphs in unaged and aged paint systems by means of...
7
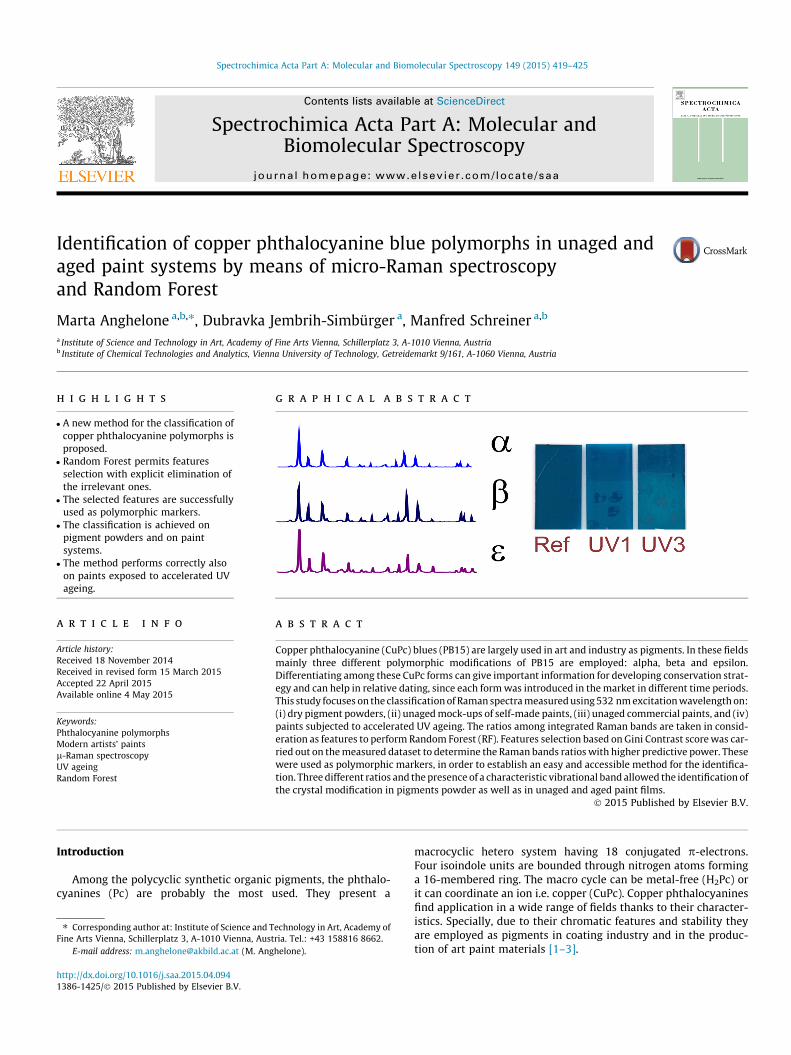
Identification of copper phthalocyanine blue polymorphs in unaged and aged paint systems by means of micro-Raman spectroscopy and Random Forest Marta Anghelone a,b,⇑ , Dubravka Jembrih-Simbürger a , Manfred Schreiner a,b a Institute of Science and Technology in Art, Academy of Fine Arts Vienna, Schillerplatz 3, A-1010 Vienna, Austria b Institute of Chemical Technologies and Analytics, Vienna University of Technology, Getreidemarkt 9/161, A-1060 Vienna, Austria highlights A new method for the classification of copper phthalocyanine polymorphs is proposed. Random Forest permits features selection with explicit elimination of the irrelevant ones. The selected features are successfully used as polymorphic markers. The classification is achieved on pigment powders and on paint systems. The method performs correctly also on paints exposed to accelerated UV ageing. graphical abstract article info Article history: Received 18 November 2014 Received in revised form 15 March 2015 Accepted 22 April 2015 Available online 4 May 2015 Keywords: Phthalocyanine polymorphs Modern artists’ paints l-Raman spectroscopy UV ageing Random Forest abstract Copper phthalocyanine (CuPc) blues (PB15) are largely used in art and industry as pigments. In these fields mainly three different polymorphic modifications of PB15 are employed: alpha, beta and epsilon. Differentiating among these CuPc forms can give important information for developing conservation strat- egy and can help in relative dating, since each form was introduced in the market in different time periods. This study focuses on the classification of Raman spectra measured using 532 nm excitation wavelength on: (i) dry pigment powders, (ii) unaged mock-ups of self-made paints, (iii) unaged commercial paints, and (iv) paints subjected to accelerated UV ageing. The ratios among integrated Raman bands are taken in consid- eration as features to perform Random Forest (RF). Features selection based on Gini Contrast score was car- ried out on the measured dataset to determine the Raman bands ratios with higher predictive power. These were used as polymorphic markers, in order to establish an easy and accessible method for the identifica- tion. Three different ratios and the presence of a characteristic vibrational band allowed the identification of the crystal modification in pigments powder as well as in unaged and aged paint films. Ó 2015 Published by Elsevier B.V. Introduction Among the polycyclic synthetic organic pigments, the phthalo- cyanines (Pc) are probably the most used. They present a macrocyclic hetero system having 18 conjugated p-electrons. Four isoindole units are bounded through nitrogen atoms forming a 16-membered ring. The macro cycle can be metal-free (H 2 Pc) or it can coordinate an ion i.e. copper (CuPc). Copper phthalocyanines find application in a wide range of fields thanks to their character- istics. Specially, due to their chromatic features and stability they are employed as pigments in coating industry and in the produc- tion of art paint materials [1–3]. http://dx.doi.org/10.1016/j.saa.2015.04.094 1386-1425/Ó 2015 Published by Elsevier B.V. ⇑ Corresponding author at: Institute of Science and Technology in Art, Academy of Fine Arts Vienna, Schillerplatz 3, A-1010 Vienna, Austria. Tel.: +43 158816 8662. E-mail address: [email protected] (M. Anghelone). Spectrochimica Acta Part A: Molecular and Biomolecular Spectroscopy 149 (2015) 419–425 Contents lists available at ScienceDirect Spectrochimica Acta Part A: Molecular and Biomolecular Spectroscopy journal homepage: www.elsevier.com/locate/saa
Transcript of Identification of copper phthalocyanine blue polymorphs in unaged and aged paint systems by means of...
Spectrochimica Acta Part A: Molecular and Biomolecular Spectroscopy 149 (2015) 419–425
Contents lists available at ScienceDirect
Spectrochimica Acta Part A: Molecular andBiomolecular Spectroscopy
journal homepage: www.elsevier .com/locate /saa
Identification of copper phthalocyanine blue polymorphs in unaged andaged paint systems by means of micro-Raman spectroscopyand Random Forest
http://dx.doi.org/10.1016/j.saa.2015.04.0941386-1425/� 2015 Published by Elsevier B.V.
⇑ Corresponding author at: Institute of Science and Technology in Art, Academy ofFine Arts Vienna, Schillerplatz 3, A-1010 Vienna, Austria. Tel.: +43 158816 8662.
E-mail address: [email protected] (M. Anghelone).
Marta Anghelone a,b,⇑, Dubravka Jembrih-Simbürger a, Manfred Schreiner a,b
a Institute of Science and Technology in Art, Academy of Fine Arts Vienna, Schillerplatz 3, A-1010 Vienna, Austriab Institute of Chemical Technologies and Analytics, Vienna University of Technology, Getreidemarkt 9/161, A-1060 Vienna, Austria
h i g h l i g h t s
� A new method for the classification ofcopper phthalocyanine polymorphs isproposed.� Random Forest permits features
selection with explicit elimination ofthe irrelevant ones.� The selected features are successfully
used as polymorphic markers.� The classification is achieved on
pigment powders and on paintsystems.� The method performs correctly also
on paints exposed to accelerated UVageing.
g r a p h i c a l a b s t r a c t
a r t i c l e i n f o
Article history:Received 18 November 2014Received in revised form 15 March 2015Accepted 22 April 2015Available online 4 May 2015
Keywords:Phthalocyanine polymorphsModern artists’ paintsl-Raman spectroscopyUV ageingRandom Forest
a b s t r a c t
Copper phthalocyanine (CuPc) blues (PB15) are largely used in art and industry as pigments. In these fieldsmainly three different polymorphic modifications of PB15 are employed: alpha, beta and epsilon.Differentiating among these CuPc forms can give important information for developing conservation strat-egy and can help in relative dating, since each form was introduced in the market in different time periods.This study focuses on the classification of Raman spectra measured using 532 nm excitation wavelength on:(i) dry pigment powders, (ii) unaged mock-ups of self-made paints, (iii) unaged commercial paints, and (iv)paints subjected to accelerated UV ageing. The ratios among integrated Raman bands are taken in consid-eration as features to perform Random Forest (RF). Features selection based on Gini Contrast score was car-ried out on the measured dataset to determine the Raman bands ratios with higher predictive power. Thesewere used as polymorphic markers, in order to establish an easy and accessible method for the identifica-tion. Three different ratios and the presence of a characteristic vibrational band allowed the identification ofthe crystal modification in pigments powder as well as in unaged and aged paint films.
� 2015 Published by Elsevier B.V.
Introduction macrocyclic hetero system having 18 conjugated p-electrons.
Among the polycyclic synthetic organic pigments, the phthalo-cyanines (Pc) are probably the most used. They present a
Four isoindole units are bounded through nitrogen atoms forminga 16-membered ring. The macro cycle can be metal-free (H2Pc) orit can coordinate an ion i.e. copper (CuPc). Copper phthalocyaninesfind application in a wide range of fields thanks to their character-istics. Specially, due to their chromatic features and stability theyare employed as pigments in coating industry and in the produc-tion of art paint materials [1–3].
420 M. Anghelone et al. / Spectrochimica Acta Part A: Molecular and Biomolecular Spectroscopy 149 (2015) 419–425
Depending on the content of chlorine (Cl) and bromine (Br),substituents that can be present in the benzene ring, part of theisoindole units, phthalocyanine show blue or green shades. In par-ticular, the blue CuPc pigments have none up to 1 atom of chlorineand they go under the name of Pigment Blue 15 (PB 15) in the ColorIndex [4]. In addition, also metal free phthalocyanine (H2Pc) areused as pigments and they are listed as PB16 in the Color Index.
Due to their high coloring strength they are used in smallamounts in commercial paint tubes mixed with different classesof binding media as well as with fillers and other pigments(organic and inorganic) in order to obtain different hues.
Polymorphs of CuPc having different characteristic chemicalstability, hue, and features, were synthesized and introduced onthe market in different times, from 1930s to 1960s. Especially inthe art field three different crystal modifications can be mainlyfound more often: alpha (a), beta (b), epsilon (e).
Around the 1930s a a form (PB15:0) was used, but this had ten-dency to change the crystal modification to the b and to flocculate.Thus, stabilizing procedures as partial chlorination of the mole-cules were applied in order to obtain a stabilized form (PB15:1).Later on, at the beginning of the 1950s, the beta form was synthe-sized and used as pigment, namely PB15:3 and PB15:4. Both, alphaand beta forms are monoclinic, and the metastable alpha formmight by heat recrystallize in beta form. Finally, in 1962 the epsi-lon polymorph, PB15:6, having a reddish shade of blue, was com-mercialized [5,6]. Thus, distinguishing among these three groupsof blue CuPc pigments can be of interest not only for conservationreasons, but also it could be useful for relative dating.
So far several analytical techniques were employed for this pur-pose, such as XRD (X-ray Diffraction), FTIR Fourier TransformInfrared spectroscopy) and Raman spectroscopy [6–8].
As CuPc is a good Raman scatterer, quality spectra can beobtained by using different lasers excitation wavelengths, andthe presence of the pigment is very easily detectable [9]. Less clearis the identification of the different polymorphs using this tech-nique. Several studies were carried out in this direction, some ofthem specifically on copper phthalocyanine blue pigments usedin art and conservation. So far, no studies tried to deal with theclassification of CuPc blue pigments on artificially aged samples.In the field of science applied for the conservation of cultural her-itage, usually art objects subjected to natural ageing are investi-gated, thus, evaluating the capability of classification methods onsamples aged under controlled accelerated conditions can be ofutmost importance.
In the Raman spectra of phthalocyanines the main features aredue to vibrations of the macrocycle (till 1000 cm�1), of isoindolemoieties and pyrrole groups (between 1200 and 1600 cm�1), andof C–H bending and metal-nitrogen [10,11].
According to Scherrer [12], absence/presence, position and rel-ative ratio between characteristic bands of the macrocycle vibra-tions (746/679) and pyrrole groups stretching (1520–1530 cm�1)can be considered as polymorphic markers, using an excitationwavelength of 785 nm. On the other hand, Tackley [9], using a514 nm laser, states that no valuable polymorphic markers are pre-sent in Raman spectra. Fremout [13] agrees on the criterion of ratioamong bands for distinguishing alpha and beta form found byScherrer using the same laser. In relation to Shaibat et al. [14] usinga 632.8 nm laser the polymorphic markers are identified in Ramanbands shifts. By applying Principal Component Analysis (PCA) onRaman spectra of synthetic organic pigments Vandenabeele et al.[15] could not distinguish between different copper phthalocya-nine. Finally, the work of Defeyt et al. [16] takes in considerationseveral Raman bands intensity ratios on dry pigment powdersand on commercial paints, and performing Linear DiscriminantAnalysis (LDA) [17] succeeds in distinguishing most of the samples,in this case analyzed with 785 nm excitation wavelength.
Trentelmann [18] and Smith [19] discuss how the excitationwavelength plays an important role in the results, analyzing bothbinding media/pigment systems or pigments itself. Specifically,phthalocyanines in solid state absorb throughout the whole visibleregion of the electronic spectrum presenting broadened and over-lapping absorption bands (Q band at 650 nm, and B band at350 nm). Thus, as mentioned by Tackley, using visible excitationwavelength gives resonance and pre-resonance enhancement.[9]Moreover, as Jennings et al. [20] describe, in the infrared and nearIR region, due to the lower scattering intensity, residual fluores-cence might lead to disturbed spectra with only few effects ofpre-resonance. On the other hand, by using visible lasers, reso-nance Raman scattering is excited and absolute intensities of thebands are greater [19]. A 632.8 nm laser shows resonance espe-cially for bands at lower wavenumbers; however, fluorescence ispresent but not affecting the Raman signals. The use of 514 nmexcitation, leads to absence of fluorescence and to usefulpre-resonance effect [9,10,18].
Bovill [21] recalls that self-absorption can influence the scatter-ing efficiency, also for this reason ratios among Raman bands couldbe taken in consideration as polymorphic feature. Furthermore,band shifts are dependent on measuring conditions as on the laserpower [22,23,13], especially in the low wavenumbers region,which is due to the interaction between inter and intramolecularvibrations [24]. Scherrer describes yet the reversible shifting ofthe Raman bands depending on the laser power, and the influenceof this parameter on the Raman bands characteristics [23].
The aim of this work is to find an easy and accessible method todistinguish among CuPc polymorphs, in particular using 532 nmlaser, giving pre-resonant and resonant effects as well as goodsignal-to-noise ratio in the Raman spectra. Ratio between Ramanbands of interest is considered as parameter for polymorphs iden-tification. For this purpose, a, b, and e CuPc pigment powders wereanalyzed by means of micro-Raman spectroscopy. The main 17Raman bands of the spectrum were integrated, and the 136 possi-ble ratios among them were used for features selection by meansof the Gini Contrast scores obtained by performing RandomForest. Thus, the Raman bands ratios that better characterize thepolymorphs were selected. The data collected from the pigmentpowders were used as training set, and the features (band ratios)found with this method were tested on the spectra acquired onpaint mock-ups. The mock-ups consisted of 39 self-made or com-mercial paints, which were measured after drying (13 samples)and after accelerated UV ageing for one month (13 samples) andthree months (13 samples). The accelerated UV ageing was per-formed using a wavelengths range typical for outdoor conditions(including UV-A and UV-B). This work is part of a wider project(see Acknowledgement) in which UV light stability of syntheticorganic pigments (SOPs), such as Pc, and modern binding mediaare investigated. The project focuses on the study of modern streetart and art objects conceived for outdoor spaces, e.g. graffiti, poly-chrome sculptures etc.
The combination of UV radiation and oxygen can causephoto-oxidative degradation of organic materials. The penetrationdepth of the degradation process depends on the oxygen diffu-sion into the paint layer, as well as on the absorption of the radi-ation. In turn, the absorption is influenced not only by thewavelength of the incident radiation, but also by the characteris-tics of the material itself. For example the content of pigmentand its chemical structure in an organic film are conditioningparameters. Thus, the photo-oxidative process can be consideredas a surface phenomenon, occurring mainly in the uppermost 5–10 lm [25] of the painted film. Therefore, carrying out Ramananalysis on the surface of UV aged paint mock-ups means to con-sider material affected by photo-oxidative degradation (ifpresent).

Table 1List of dry pigment powders of CuPc blue analyzed in this work and relative supplier.The pigments supplied by Sochim Pigmenti, PB15:0 and PB15:3 were manufacturedby City Cat pigments (India) while PB15:1 and PB15:4 by Prima Chemicals (India).
C.I. name Supplier Crystal modification
PB15:0 Sochim Pigmenti, Italy aPB15:1 Kremer Pigmente, Germany aPB15:1 Sochim Pigmenti, Italy aPB15:3 Kremer Pigmente, Germany bPB15:3 Sochim Pigmenti, Italy bPB15:4 Sochim Pigmenti, Italy bPB15:6 Kremer Pigmente, Germany ePB15:6 Schmincke, Germany e
Table 2List of mock-ups prepared by casting self-made or commercial paints on glass slides.BM/P is binding media (BM)/pigment (P) ratio used for the self-made paintpreparation.
PigmentC.I. namea
Binding media/supplier BM/P
Self-madepaint
PB15:1 Plextol D498 (nBA/MMA)/Kremer(Germany)
16:1PB15:3 16:1PB15:6 10:1PB15:1 Alkyd resin Medium 4/Lukas (Germany) 4:1PB15:3 4:1PB15:6 4:1PB15:1 Linseed stand oil/Kremer (Germany) 3:1PB15:3 3:1PB15:6 3:1
Commercialpaint
PB15 Griffin Alkyd/Winsor & Newton (U.K.) –PB15:1 Artist’s acrylic/Winsor & Newton (U.K.) –PB15:3 Akademie Acrylcolor/Schmincke
(Germany)–
PB15:6 Acryl Pastos/Lukas (Germany) –
a The pigments used for the self-made paints are provided by Kremer Pigmente(Germany), the C.I. name of commercial products are as declared by the suppliers ofthe paint tubes.
M. Anghelone et al. / Spectrochimica Acta Part A: Molecular and Biomolecular Spectroscopy 149 (2015) 419–425 421
Material and methods
Materials
Analyses were carried out on 8 different dry pigment powdersof blue copper phthalocyanine provided by different suppliersand having different polymorphic modification, as reported inTable 1.
Out of this, three of the dry pigments, in particular PB15:1,PB15:3, and PB15:6 supplied by Kremer Pigmente (Germany) wereused to make self-made paints for preparing mock-ups. The pig-ment powder was mixed with acrylic binder (Plextol D498,Kremer Pigmente, Germany), alkyd resin (Alkyd resin Medium 4,Lukas, Germany) and linseed stand oil (Kremer Pigmente,Germany), see Table 2. Different ratios of binding media/pigmentwere used to get a proper paste consistence of the paint. In orderto obtain simple two-component systems, no further additiveswere put into the mixtures. The so-prepared paints were castedon glass slides, applying layers of 150 lm thickness (wet), driedat room conditions, depending on the curing time, for one week(acrylic and alkyd paint) [24] and three months (stand oil)[26–29]. Additionally, the mock-ups were UV aged for one andthree months. A total of 27 two-component mock-ups (9 unaged,9 aged for one month and 9 aged for three months) were reached.The same procedure was followed for preparing 12 mock-ups outof commercial paints (4 unaged, 4 aged for one month and 4 forthree months) which, according to their labels, are containing cop-per phthalocyanine blue a, b, and e forms. The materials used forthe mock-ups preparation and their details are listed in Table 2.
Accelerated UV ageing
The ageing was performed in a UV chamber Xenon ArcSimulator (Dr. Hönle, Germany) with a continuous illuminationof ca. 910 W/m2 with radiation between 295 and 4000 nm temper-ature was around 50 �C and no relative humidity control was pos-sible. The range is typical for outdoor conditions, especiallyincluding wavelengths of the UV-B region, which has higher energyand thus, causing more easily degradation processes in organicmaterials. The use of such range can help to gain important infor-mation on the photo-degradation processes occurring on modernstreet art artworks conceived for outdoor space, such as graffiti,polychrome sculptures etc. Paint mock-ups were aged for one(UV1) or three months (UV3). The selection of the exposure timeswas supported by Pyrolysis–Gas Chromatography/MassSpectrometry (Py–GC/MS) analyses performed periodically on themock-ups, which is not topic of this paper.
Instrument and spectra acquisition
Analyses were performed with a confocal micro-Raman systemLabRAM ARAMIS (Horiba Jobin Yvon), equipped with three differ-ent laser sources: 532 nm (Nd:YAG), 632.8 nm (HeNe), and785 nm (Diode). The spectrometer is provided with 3 Edge filtersfor the rejection of the lasers excitation lines; the confocal micro-scope (Olympus, BXFM) is coupled to a 460 mm focal length spec-trograph equipped with 4 different gratings (300, 600, 1200,1800 g/mm). The Raman signal is detected by CCD detector(1024 � 256, Peltier cooled �70 �C) in backscattered configuration.Wavenumber calibration was performed using Silicon m1 line at520.7 cm�1. All three excitation wavelengths were tested on thesamples, using 50� LWD objective, ca. 1 mW power at the sample,a 600 g/mm grating for visible lasers and 1200 g/mm for NIR laser.
Comparing the quality of the spectra obtained and the literature[9,10,19,20], it was decided to proceed the work using the 532 nmlaser, presenting excellent signal-to-noise ratio and its advantagesdue to pre-resonant and resonant effects of CuPc’s.
On each dried pigment powder and on each mock-up of com-mercial paint, 3 measurements were performed on random spots.Since the self-made paint resulted to be less homogeneous, up to5 spots of measurements were selected on each self-made paintmock-up (unaged, UV1, UV3). The selected parameters were as fol-low: laser 532 nm, grating 600 g/mm, 50� LWD objective allowinga 0.87 lm laser spot at the sample. The laser power was around1 mW, measuring time was chosen to be 40 s with 3 accumulationsfor the more homogeneous mock-ups (pigment powders and com-mercial paints) and 80 s with 5 accumulations for the self-madepaints, depending on the intensity of the Raman scatteringachieved. The acquisition range was 150–3500 cm�1 in order toinclude the CH stretching bands, eventually related to the presenceof binders. Nevertheless, the spectra did not show any relevantspectral contribution from the binding media or from fillers (inthe case of commercial products), but only bands correspondingto CuPc vibrations were present in the spectra. Finally, spectraacquired on acrylic and oil containing mock-ups aged for threemonths showed a slight increase of fluorescence compared to theunaged ones, probably due to the contribution of degraded bindingmedia. All spectra were finally baseline corrected with rubberbandcorrection mode (OPUS software, version 6.5).
Integration of the 17 main Raman bands was performed consid-ering the area between the band, the abscissa and the shifts limits,which were defined manually, depending on the position of theband minima (OPUS software, version 6.5). The so-calculated val-ues of the area under the Raman bands (A) were further used toperform Random Forest and features selection based on GiniContrast scores (MatLab software, version 2010a).
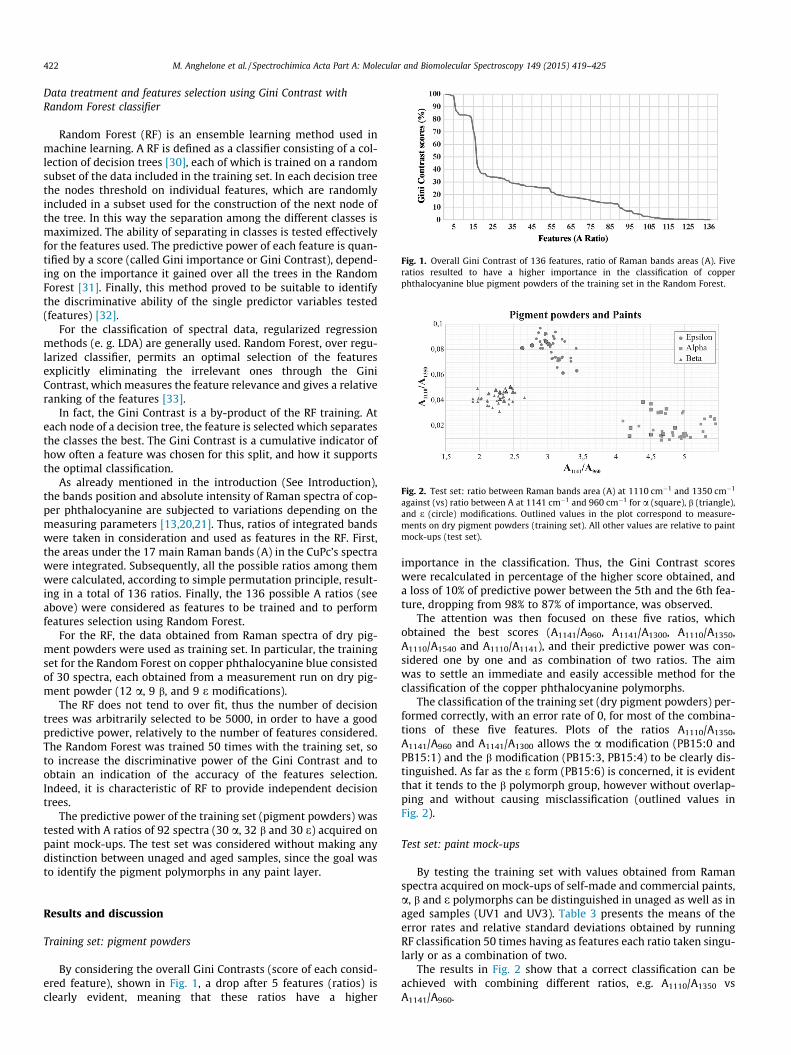
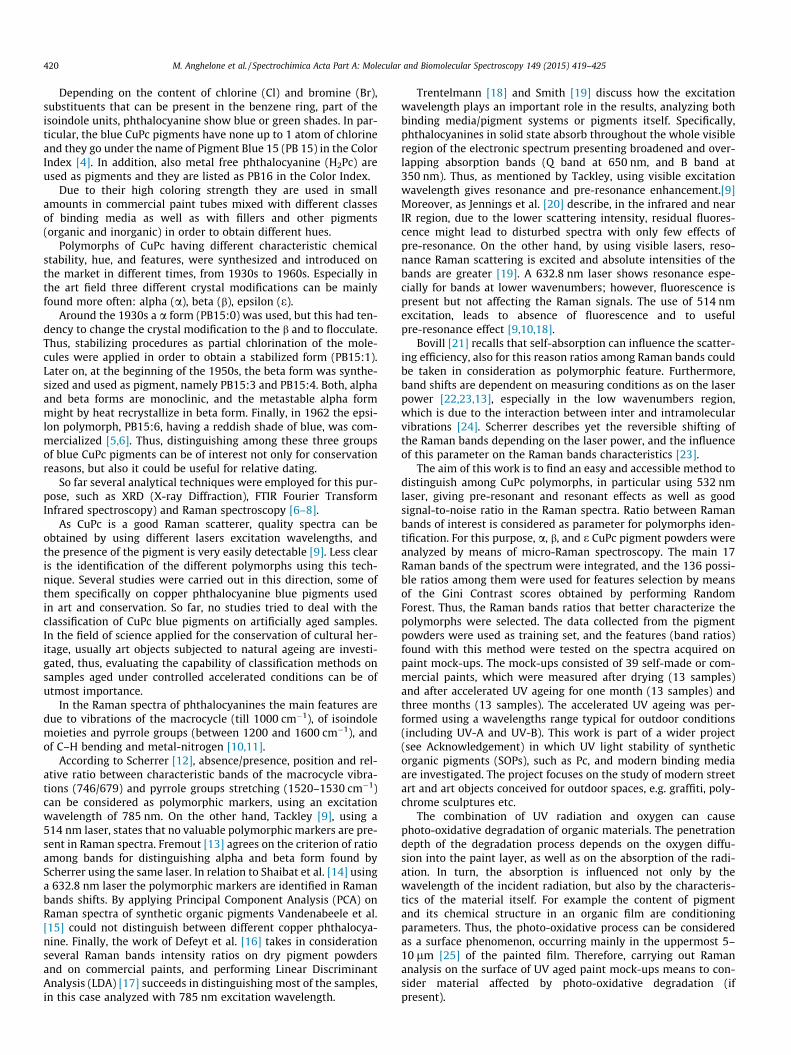
Fig. 1. Overall Gini Contrast of 136 features, ratio of Raman bands areas (A). Fiveratios resulted to have a higher importance in the classification of copperphthalocyanine blue pigment powders of the training set in the Random Forest.
Fig. 2. Test set: ratio between Raman bands area (A) at 1110 cm�1 and 1350 cm�1
against (vs) ratio between A at 1141 cm�1 and 960 cm�1 for a (square), b (triangle),and e (circle) modifications. Outlined values in the plot correspond to measure-ments on dry pigment powders (training set). All other values are relative to paintmock-ups (test set).
422 M. Anghelone et al. / Spectrochimica Acta Part A: Molecular and Biomolecular Spectroscopy 149 (2015) 419–425
Data treatment and features selection using Gini Contrast withRandom Forest classifier
Random Forest (RF) is an ensemble learning method used inmachine learning. A RF is defined as a classifier consisting of a col-lection of decision trees [30], each of which is trained on a randomsubset of the data included in the training set. In each decision treethe nodes threshold on individual features, which are randomlyincluded in a subset used for the construction of the next node ofthe tree. In this way the separation among the different classes ismaximized. The ability of separating in classes is tested effectivelyfor the features used. The predictive power of each feature is quan-tified by a score (called Gini importance or Gini Contrast), depend-ing on the importance it gained over all the trees in the RandomForest [31]. Finally, this method proved to be suitable to identifythe discriminative ability of the single predictor variables tested(features) [32].
For the classification of spectral data, regularized regressionmethods (e. g. LDA) are generally used. Random Forest, over regu-larized classifier, permits an optimal selection of the featuresexplicitly eliminating the irrelevant ones through the GiniContrast, which measures the feature relevance and gives a relativeranking of the features [33].
In fact, the Gini Contrast is a by-product of the RF training. Ateach node of a decision tree, the feature is selected which separatesthe classes the best. The Gini Contrast is a cumulative indicator ofhow often a feature was chosen for this split, and how it supportsthe optimal classification.
As already mentioned in the introduction (See Introduction),the bands position and absolute intensity of Raman spectra of cop-per phthalocyanine are subjected to variations depending on themeasuring parameters [13,20,21]. Thus, ratios of integrated bandswere taken in consideration and used as features in the RF. First,the areas under the 17 main Raman bands (A) in the CuPc’s spectrawere integrated. Subsequently, all the possible ratios among themwere calculated, according to simple permutation principle, result-ing in a total of 136 ratios. Finally, the 136 possible A ratios (seeabove) were considered as features to be trained and to performfeatures selection using Random Forest.
For the RF, the data obtained from Raman spectra of dry pig-ment powders were used as training set. In particular, the trainingset for the Random Forest on copper phthalocyanine blue consistedof 30 spectra, each obtained from a measurement run on dry pig-ment powder (12 a, 9 b, and 9 e modifications).
The RF does not tend to over fit, thus the number of decisiontrees was arbitrarily selected to be 5000, in order to have a goodpredictive power, relatively to the number of features considered.The Random Forest was trained 50 times with the training set, soto increase the discriminative power of the Gini Contrast and toobtain an indication of the accuracy of the features selection.Indeed, it is characteristic of RF to provide independent decisiontrees.
The predictive power of the training set (pigment powders) wastested with A ratios of 92 spectra (30 a, 32 b and 30 e) acquired onpaint mock-ups. The test set was considered without making anydistinction between unaged and aged samples, since the goal wasto identify the pigment polymorphs in any paint layer.
Results and discussion
Training set: pigment powders
By considering the overall Gini Contrasts (score of each consid-ered feature), shown in Fig. 1, a drop after 5 features (ratios) isclearly evident, meaning that these ratios have a higher
importance in the classification. Thus, the Gini Contrast scoreswere recalculated in percentage of the higher score obtained, anda loss of 10% of predictive power between the 5th and the 6th fea-ture, dropping from 98% to 87% of importance, was observed.
The attention was then focused on these five ratios, whichobtained the best scores (A1141/A960, A1141/A1300, A1110/A1350,A1110/A1540 and A1110/A1141), and their predictive power was con-sidered one by one and as combination of two ratios. The aimwas to settle an immediate and easily accessible method for theclassification of the copper phthalocyanine polymorphs.
The classification of the training set (dry pigment powders) per-formed correctly, with an error rate of 0, for most of the combina-tions of these five features. Plots of the ratios A1110/A1350,A1141/A960 and A1141/A1300 allows the a modification (PB15:0 andPB15:1) and the b modification (PB15:3, PB15:4) to be clearly dis-tinguished. As far as the e form (PB15:6) is concerned, it is evidentthat it tends to the b polymorph group, however without overlap-ping and without causing misclassification (outlined values inFig. 2).
Test set: paint mock-ups
By testing the training set with values obtained from Ramanspectra acquired on mock-ups of self-made and commercial paints,a, b and e polymorphs can be distinguished in unaged as well as inaged samples (UV1 and UV3). Table 3 presents the means of theerror rates and relative standard deviations obtained by runningRF classification 50 times having as features each ratio taken singu-larly or as a combination of two.
The results in Fig. 2 show that a correct classification can beachieved with combining different ratios, e.g. A1110/A1350 vsA1141/A960.
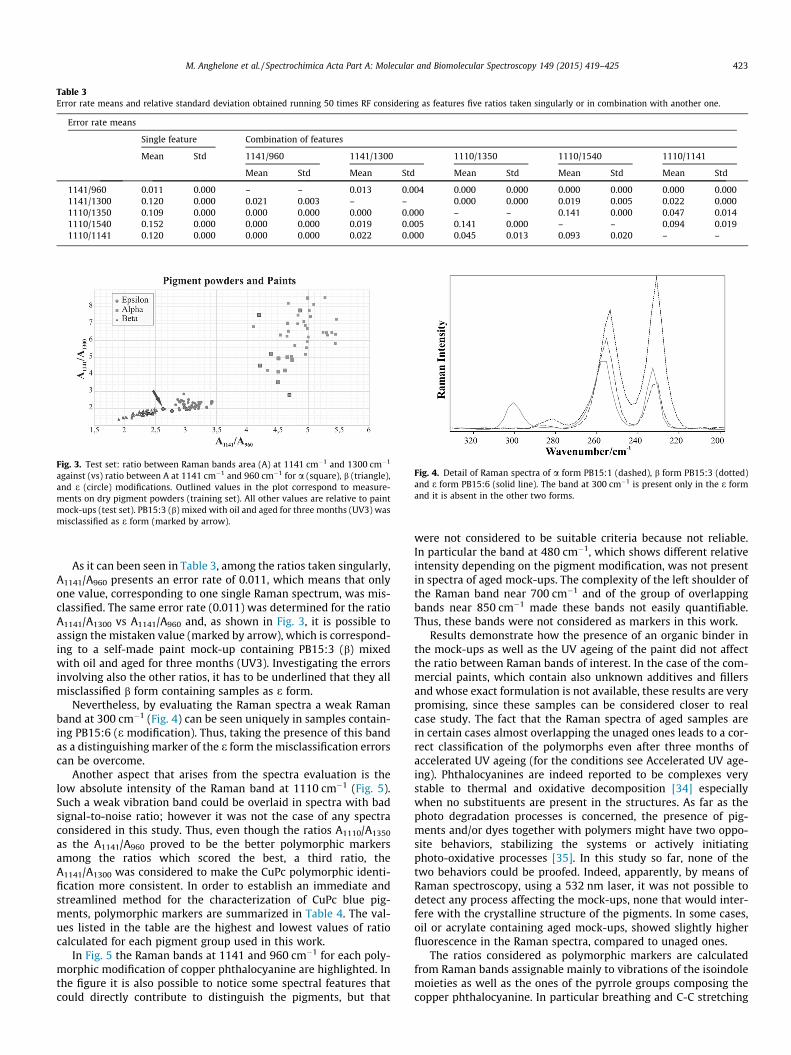
Table 3Error rate means and relative standard deviation obtained running 50 times RF considering as features five ratios taken singularly or in combination with another one.
Error rate means
Single feature Combination of features
Mean Std 1141/960 1141/1300 1110/1350 1110/1540 1110/1141
Mean Std Mean Std Mean Std Mean Std Mean Std
1141/960 0.011 0.000 – – 0.013 0.004 0.000 0.000 0.000 0.000 0.000 0.0001141/1300 0.120 0.000 0.021 0.003 – – 0.000 0.000 0.019 0.005 0.022 0.0001110/1350 0.109 0.000 0.000 0.000 0.000 0.000 – – 0.141 0.000 0.047 0.0141110/1540 0.152 0.000 0.000 0.000 0.019 0.005 0.141 0.000 – – 0.094 0.0191110/1141 0.120 0.000 0.000 0.000 0.022 0.000 0.045 0.013 0.093 0.020 – –
Fig. 3. Test set: ratio between Raman bands area (A) at 1141 cm�1 and 1300 cm�1
against (vs) ratio between A at 1141 cm�1 and 960 cm�1 for a (square), b (triangle),and e (circle) modifications. Outlined values in the plot correspond to measure-ments on dry pigment powders (training set). All other values are relative to paintmock-ups (test set). PB15:3 (b) mixed with oil and aged for three months (UV3) wasmisclassified as e form (marked by arrow).
Fig. 4. Detail of Raman spectra of a form PB15:1 (dashed), b form PB15:3 (dotted)and e form PB15:6 (solid line). The band at 300 cm�1 is present only in the e formand it is absent in the other two forms.
M. Anghelone et al. / Spectrochimica Acta Part A: Molecular and Biomolecular Spectroscopy 149 (2015) 419–425 423
As it can been seen in Table 3, among the ratios taken singularly,A1141/A960 presents an error rate of 0.011, which means that onlyone value, corresponding to one single Raman spectrum, was mis-classified. The same error rate (0.011) was determined for the ratioA1141/A1300 vs A1141/A960 and, as shown in Fig. 3, it is possible toassign the mistaken value (marked by arrow), which is correspond-ing to a self-made paint mock-up containing PB15:3 (b) mixedwith oil and aged for three months (UV3). Investigating the errorsinvolving also the other ratios, it has to be underlined that they allmisclassified b form containing samples as e form.
Nevertheless, by evaluating the Raman spectra a weak Ramanband at 300 cm�1 (Fig. 4) can be seen uniquely in samples contain-ing PB15:6 (e modification). Thus, taking the presence of this bandas a distinguishing marker of the e form the misclassification errorscan be overcome.
Another aspect that arises from the spectra evaluation is thelow absolute intensity of the Raman band at 1110 cm�1 (Fig. 5).Such a weak vibration band could be overlaid in spectra with badsignal-to-noise ratio; however it was not the case of any spectraconsidered in this study. Thus, even though the ratios A1110/A1350
as the A1141/A960 proved to be the better polymorphic markersamong the ratios which scored the best, a third ratio, theA1141/A1300 was considered to make the CuPc polymorphic identi-fication more consistent. In order to establish an immediate andstreamlined method for the characterization of CuPc blue pig-ments, polymorphic markers are summarized in Table 4. The val-ues listed in the table are the highest and lowest values of ratiocalculated for each pigment group used in this work.
In Fig. 5 the Raman bands at 1141 and 960 cm�1 for each poly-morphic modification of copper phthalocyanine are highlighted. Inthe figure it is also possible to notice some spectral features thatcould directly contribute to distinguish the pigments, but that
were not considered to be suitable criteria because not reliable.In particular the band at 480 cm�1, which shows different relativeintensity depending on the pigment modification, was not presentin spectra of aged mock-ups. The complexity of the left shoulder ofthe Raman band near 700 cm�1 and of the group of overlappingbands near 850 cm�1 made these bands not easily quantifiable.Thus, these bands were not considered as markers in this work.
Results demonstrate how the presence of an organic binder inthe mock-ups as well as the UV ageing of the paint did not affectthe ratio between Raman bands of interest. In the case of the com-mercial paints, which contain also unknown additives and fillersand whose exact formulation is not available, these results are verypromising, since these samples can be considered closer to realcase study. The fact that the Raman spectra of aged samples arein certain cases almost overlapping the unaged ones leads to a cor-rect classification of the polymorphs even after three months ofaccelerated UV ageing (for the conditions see Accelerated UV age-ing). Phthalocyanines are indeed reported to be complexes verystable to thermal and oxidative decomposition [34] especiallywhen no substituents are present in the structures. As far as thephoto degradation processes is concerned, the presence of pig-ments and/or dyes together with polymers might have two oppo-site behaviors, stabilizing the systems or actively initiatingphoto-oxidative processes [35]. In this study so far, none of thetwo behaviors could be proofed. Indeed, apparently, by means ofRaman spectroscopy, using a 532 nm laser, it was not possible todetect any process affecting the mock-ups, none that would inter-fere with the crystalline structure of the pigments. In some cases,oil or acrylate containing aged mock-ups, showed slightly higherfluorescence in the Raman spectra, compared to unaged ones.
The ratios considered as polymorphic markers are calculatedfrom Raman bands assignable mainly to vibrations of the isoindolemoieties as well as the ones of the pyrrole groups composing thecopper phthalocyanine. In particular breathing and C-C stretching
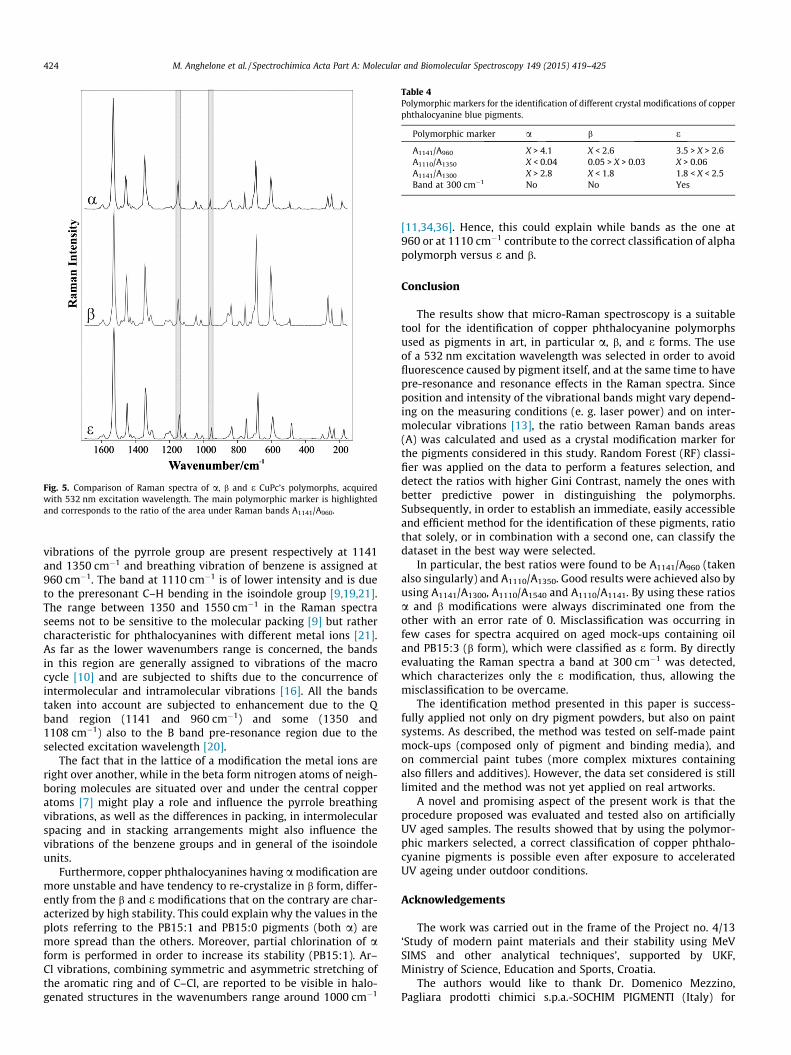
Fig. 5. Comparison of Raman spectra of a, b and e CuPc’s polymorphs, acquiredwith 532 nm excitation wavelength. The main polymorphic marker is highlightedand corresponds to the ratio of the area under Raman bands A1141/A960.
Table 4Polymorphic markers for the identification of different crystal modifications of copperphthalocyanine blue pigments.
Polymorphic marker a b e
A1141/A960 X > 4.1 X < 2.6 3.5 > X > 2.6A1110/A1350 X < 0.04 0.05 > X > 0.03 X > 0.06A1141/A1300 X > 2.8 X < 1.8 1.8 < X < 2.5Band at 300 cm�1 No No Yes
424 M. Anghelone et al. / Spectrochimica Acta Part A: Molecular and Biomolecular Spectroscopy 149 (2015) 419–425
vibrations of the pyrrole group are present respectively at 1141and 1350 cm�1 and breathing vibration of benzene is assigned at960 cm�1. The band at 1110 cm�1 is of lower intensity and is dueto the preresonant C–H bending in the isoindole group [9,19,21].The range between 1350 and 1550 cm�1 in the Raman spectraseems not to be sensitive to the molecular packing [9] but rathercharacteristic for phthalocyanines with different metal ions [21].As far as the lower wavenumbers range is concerned, the bandsin this region are generally assigned to vibrations of the macrocycle [10] and are subjected to shifts due to the concurrence ofintermolecular and intramolecular vibrations [16]. All the bandstaken into account are subjected to enhancement due to the Qband region (1141 and 960 cm�1) and some (1350 and1108 cm�1) also to the B band pre-resonance region due to theselected excitation wavelength [20].
The fact that in the lattice of a modification the metal ions areright over another, while in the beta form nitrogen atoms of neigh-boring molecules are situated over and under the central copperatoms [7] might play a role and influence the pyrrole breathingvibrations, as well as the differences in packing, in intermolecularspacing and in stacking arrangements might also influence thevibrations of the benzene groups and in general of the isoindoleunits.
Furthermore, copper phthalocyanines having a modification aremore unstable and have tendency to re-crystalize in b form, differ-ently from the b and e modifications that on the contrary are char-acterized by high stability. This could explain why the values in theplots referring to the PB15:1 and PB15:0 pigments (both a) aremore spread than the others. Moreover, partial chlorination of aform is performed in order to increase its stability (PB15:1). Ar–Cl vibrations, combining symmetric and asymmetric stretching ofthe aromatic ring and of C–Cl, are reported to be visible in halo-genated structures in the wavenumbers range around 1000 cm�1
[11,34,36]. Hence, this could explain while bands as the one at960 or at 1110 cm�1 contribute to the correct classification of alphapolymorph versus e and b.
Conclusion
The results show that micro-Raman spectroscopy is a suitabletool for the identification of copper phthalocyanine polymorphsused as pigments in art, in particular a, b, and e forms. The useof a 532 nm excitation wavelength was selected in order to avoidfluorescence caused by pigment itself, and at the same time to havepre-resonance and resonance effects in the Raman spectra. Sinceposition and intensity of the vibrational bands might vary depend-ing on the measuring conditions (e. g. laser power) and on inter-molecular vibrations [13], the ratio between Raman bands areas(A) was calculated and used as a crystal modification marker forthe pigments considered in this study. Random Forest (RF) classi-fier was applied on the data to perform a features selection, anddetect the ratios with higher Gini Contrast, namely the ones withbetter predictive power in distinguishing the polymorphs.Subsequently, in order to establish an immediate, easily accessibleand efficient method for the identification of these pigments, ratiothat solely, or in combination with a second one, can classify thedataset in the best way were selected.
In particular, the best ratios were found to be A1141/A960 (takenalso singularly) and A1110/A1350. Good results were achieved also byusing A1141/A1300, A1110/A1540 and A1110/A1141. By using these ratiosa and b modifications were always discriminated one from theother with an error rate of 0. Misclassification was occurring infew cases for spectra acquired on aged mock-ups containing oiland PB15:3 (b form), which were classified as e form. By directlyevaluating the Raman spectra a band at 300 cm�1 was detected,which characterizes only the e modification, thus, allowing themisclassification to be overcame.
The identification method presented in this paper is success-fully applied not only on dry pigment powders, but also on paintsystems. As described, the method was tested on self-made paintmock-ups (composed only of pigment and binding media), andon commercial paint tubes (more complex mixtures containingalso fillers and additives). However, the data set considered is stilllimited and the method was not yet applied on real artworks.
A novel and promising aspect of the present work is that theprocedure proposed was evaluated and tested also on artificiallyUV aged samples. The results showed that by using the polymor-phic markers selected, a correct classification of copper phthalo-cyanine pigments is possible even after exposure to acceleratedUV ageing under outdoor conditions.
Acknowledgements
The work was carried out in the frame of the Project no. 4/13‘Study of modern paint materials and their stability using MeVSIMS and other analytical techniques’, supported by UKF,Ministry of Science, Education and Sports, Croatia.
The authors would like to thank Dr. Domenico Mezzino,Pagliara prodotti chimici s.p.a.-SOCHIM PIGMENTI (Italy) for

M. Anghelone et al. / Spectrochimica Acta Part A: Molecular and Biomolecular Spectroscopy 149 (2015) 419–425 425
providing part of the pigment powders used in this work, and Dipl.Ing. Dipl. Ing. Dr. Michael Melcher and Dipl. Ing. Karl-HeinzNenning for the constructive conversations about statistical evalu-ation of data.
References
[1] S. Lomax, T. Learner, J. Am. Inst. Conserv. 45 (2) (2006) 107–125.[2] W. Herbst, K. Hunger, Industrial Organic Pigments: Production, Properties,
Applications, 3rd ed., Wiley-VCH, Weinheim, 2004.[3] F.H. Moser, L.T. Arthur, Phthalocyanine Compounds, Reinhold, New York, 1963.[4] Society of Dyers and Colourists and the American association of Textile
Chemists and Colourists, Colour Index Dyes and Pigments, Vol. 3 (3rd ed.),Bradford, 1971.
[5] N.B. McKeown, Phthalocyanine Materials: Synthesis, Structure and Function,Cambridge University Press, Cambridge, 1998.
[6] C. Defeyt, Copper-phthalocyanine blue pigments in conservation, PhD thesis,University of Liege, Liege, 2013.
[7] B.N. Achar, K.S. Lokesh, J. Solid State Chem. 177 (2004) 1987–1993.[8] B.I. Knudsen, Acta Chem. Scand. 20 (1966) 1344–1350.[9] D.R. Tackley, G. Dent, W.E. Smith, Phys. Chem. Chem. Phys. 3 (2001) 1419–
1426.[10] C. Jennings, R. Aroca, J. Raman Spectrosc. 15 (1) (1984) 34–37.[11] K. Lutzenberger, Künstlerfarben im Wandel-Synthetische organische Pigmente
des 20. Jahrhunderts und Möglichkeiten ihrer zerstörungsarmen, analytischenIdentifizierung, PhD thesis, University of Berlin, Berlin, 2009.
[12] N.C. Scherrer, S. Zumbuehl, F. Delavy, A. Fritsch, R. Kuehnen, Spectrochim. Acta,Part A 73 (2009) 505–524.
[13] W. Fremout, S. Saverwyns, J. Raman Spectrosc. 43 (2012) 1536–1544.[14] M.A. Shaibat, L.B. Casabianca, D.Y. Siberio-Pérez, A. Metzger, Y. Ishii, J. Phys.
Chem. B 114 (2010) 4400–4406.[15] P. Vandenabeele, A. Hardy, H.G.M. Edwards, L. Moens, Appl. Spectrosc. 55 (5)
(2001) 525–533.[16] C. Defeyt, P. Vandenabeele, B. Gilbert, J. Van Pevenage, R. Cloots, D. Strivay, J.
Raman Spectrosc. 43 (11) (2012) 1772–1780.
[17] C. Defeyt, J. Van Pevenage, L. Moens, D. Strivay, P. Vandenabeele, Spectrochim.Acta, Part A 115 (2013) 636–640.
[18] K. Trentelman, C. Havlik, in: M. Picollo (Ed.), Proceedings of the 6th Infraredand Raman Users Group Conference (IRUG6), Il Prato, Florence, 2004, pp. 94–100.
[19] E. Smith, G. Dent, Modern Raman Spectroscopy: A Practical Approach, JohnWiley & Sons Ltd, Manchester, 2006.
[20] C.A. Jennings, R. Aroca, G.J. Kovacs, C. Hsiao, J. Raman Spectrosc. 27 (1996)867–872.
[21] A.J. Bovill, A.A. McConnell, J.A. Nimmo, W.E. Smith, J. Phys. Chem. 90 (1986)569–575.
[22] D.N. Bratashov, A. Masic, A.M. Yashchenok, M.F. Bedard, O.A. Inozemtseva, D.A.Gorin, T. Basova, T.K. Sievers, G.B. Sukhorukov, M. Winterhalter, H. Möhwald,A.G. Skirtach, J. Raman Spectrosc. 42 (2011) 1901–1907.
[23] N.C. Scherrer, in: Book of abstracts of the 6th International Congress on theApplication of Raman Spectroscopy in Art and Archaeology (RAA2011), Parma,2011, pp. 203–204.
[24] T.V. Basova, V.G. Kiselev, B. Schuster, H. Peisert, T. Chassé, J. Raman Spectrosc.40 (2009) 2080–2087.
[25] R.L. Feller, Accelerated Aging: Photochemical and Thermal Aspects, The J. PaulGetty Trust, Los Angeles, 1994.
[26] M. Golden, J. Hayes, B. Gavett, Just Paint 3 (1996) 1–5.[27] R. van Gorkum, E. Bouwman, Coord. Chem. Rev. 249 (2005) 1709–1728.[28] M. Lazzari, O. Chiantore, Polym. Degrad. Stab. 65 (1999) 303–313.[29] R. Ploeger, D. Scalarone, O. Chiantore, J. Cult. Herit. 9 (2008) 412–419.[30] L. Breiman, Random Forests, Mach. Learn. 45 (1) (2001) 5–32.[31] G. Langs, B.H. Menze, D. Lashkari, P. Golland, NeuroImage 56 (2) (2011) 497–
507.[32] K.J. Archer, R.V. Kimes, Comput. Stat. Data Anal. 52 (2008) 2249–2260.[33] B.H. Menze, B.M. Kelm, R. Masuch, U. Himmelreich, P. Bachert, W. Petrich, F.A.
Hamprecht, BMC Bioinformatics 10 (2009) 213.[34] S.F. Pop, R.M. Ion, M.C. Corobea, V. Raditoiu, Optoelectron. Adv. Mater. 13 (7)
(2011) 906–911.[35] C. Saron, F. Zulli, M. Giordano, M.I. Felisberti, Polym. Degrad. Stab. 91 (2006)
3301–3311.[36] G. Socrates, Infrared and Raman Characteristic Group Frequencies: Tables and
Charts, John Wiley & Sons Ltd, Manchester, 2000.


![Paint & Coating additives Broucher[1] - K-tech (india) Limited](https://static.fdokumen.com/doc/165x107/6334c8fdd2b7284203079d85/paint-coating-additives-broucher1-k-tech-india-limited.jpg)


