International Technology Roadmap for Semiconductors 2002 ...
Upload
independentCategory
view
3download
0
Volume 10 | Number 8 | 7 August 2008 | Pages 923–1092
HIGHLIGHTBrillante et al.Probing polymorphs of organic semiconductors by lattice phonon Raman microscopy
HOT ARTICLEZheng et al.An unusual metal–organic framework showing both rotaxane- and cantenane-like motifs
www.rsc.org/crystengcomm
CrystEngComm

HIGHLIGHT www.rsc.org/crystengcomm | CrystEngComm
Probing polymorphs of organic semiconductorsby lattice phonon Raman microscopyAldo Brillante,*a Ivano Bilotti,a Raffaele Guido Della Valle,a Elisabetta Venutia and Alberto Girlandob
DOI: 10.1039/b804317e
Using micro-Raman techniques to investigate crystal polymorphism is an efficient method,capable of monitoring physical modifications and phase inhomogeneities in crystal domainsat the micrometre scale. In the presence of polymorphism, phase mixing is a commonoccurrence which becomes a crucial issue in structured organic materials tailored forapplications in molecular electronics and photonics. A good phase homogeneity is, in fact,required for optimal and reproducible device performance. We tackle the problem ofpolymorphism in organic semiconductors by combining experimental and theoreticalmethods. Experimentally we have found that different crystalline polymorphs may beconveniently investigated using their Raman spectra in the region of the lattice phonons,whose frequencies probe intermolecular interactions and are very sensitive to differences inmolecular packing. We propose lattice phonon confocal micro-Raman mapping as a fast andreliable diagnostic tool for in-situ characterization of the phase purity. The theoreticalapproach aims to predict crystal structures and possible coexistence of polymorphs by rankingthem in energy and proving that the deepest calculated minima actually correspond to theexperimental X-ray diffraction structures of bulk crystals. This combined spectroscopic andtheoretical approach to the dynamical properties of a crystal lattice provides a unique body ofinformation on crystal structure recognition of molecular crystals.
Introduction
Polymorphism occurs when the same
chemical compound exhibits two or more
Aldo Brillante
Aldo Brillant
University of
D. P. Craig
appointed in
(San Jose) a
project. He w
University of
Stuttgart. He
at the Univer
many aspects
thin films and
elementary e
plasmons and
and spectros
polymorphism in organics and its applicati
electronics. He is author of 125 scientific articl
aDipartimento di Chimica Fisica e Inorganicaand INSTM-UdR Bologna, University ofBologna, Viale Risorgimento 4, Bologna,I-40136, Italy; Fax: +39-051-2093690; Tel:+39-051-2093714bDipartimento di Chimica GIAF and INSTM-UdR Parma, University of Parma, Parma,I-43100, Italy
This journal is ª The Royal Society of Chemistry
crystalline modifications1,2 and is quite
common in organic molecular materials
where molecules are held together by
non-directional, weak Van der Waals
forces. The increasing interest of material
engineering in the development of new
electronic devices based on organic semi-
conductors3–5 has raised attention to this
subject for organic materials.
Organic semiconductors, such as
acenes, oligothiophenes and rubrene have
the potential to challenge silicon based
e graduated in Industrial Chemistry at the
Bologna. Former postgraduate student of
(Australian National University), he was
the mid 70s by IBM Research Laboratories
s Postdoctoral Fellow in a surface science
as involved in many research projects at the
Dusseldorf and the Max-Planck-Institut
is presently Professor of Chemical Physics
sity of Bologna. His research activity spans
of spectroscopy of molecular crystals and
has been mostly dedicated to the study of
xcitations in solids (excitons, phonons,
polaritons) and to high pressure chemistry
copy. He is currently studying crystal
ons to molecular materials for organic
es on international journals.
2008
semiconductors with the goal of making
devices that, although not efficient as
those silicon-based, are cheap and offer
the advantage of flexibility and large area
integration.6–8 Whereas only extremely
high chemical purity is required for
silicon, also good phase homogeneity is
necessary for organics. The control of the
polymorphism has therefore become
a crucial issue in structured organic
materials tailored for applications in
molecular electronics and photonics such
as field-effect transistors, light emitting
diodes, photovoltaics, etc.3,9 Indeed, even
though the system is otherwise chemically
pure, polymorphism may easily yield
phase mixing, and thus constitute an
intrinsic source of disorder with detri-
mental effects on charge transport and
other key properties.6,10 Although less
considered than chemical contamination,
phase inhomogeneities may be wide-
spread, because the intrinsic molecular
properties of the organic semiconductors
seem to facilitate the occurrence of
different polymorphs. The ideal organic
semiconductor is, in fact, characterized by
high p conjugation and by extended
transfer integrals, which are both required
to lead from isolated molecules towards
CrystEngComm, 2008, 10, 937–946 | 937

molecular wires or planes. These
requirements favor electronic delocaliza-
tion and are encountered with quasi-
planar structures, presence of functional
groups and large molecules. Large and
flexible molecules, kept together by weak
non-directional forces, are expected to
exhibit many alternative packing
arrangements, with small differences in
structure and energy, leading to poly-
morphism. Even these small differences
may affect the narrow band structure of
organic semiconductors, as well as other
important physical properties, such as
electron–phonon coupling.
Chemical purity and phase homoge-
neity (i.e., physical purity) are then both
required for optimal and reproducible
device performance, effectively ensuring
that the performance parameters are due
to the intrinsic properties of the material.
In this paper we show how poly-
morphism can be successfully recognized
by using Raman spectroscopy in the
region of lattice phonons, which represent
the fingerprint of the individual crystal
lattice. Distinctive spectral patterns
consistent with the different X-ray
diffraction (XRD) data are readily
obtained. Furthermore, the possibility of
interfacing optical microscopy to Raman
spectroscopy permits a careful discrimi-
nation among different polymorphs of an
organic molecular crystal. This yields
important information on phase homo-
geneity in crystal domains whose size is
less than 1 mm.
Finally, an account on theoretical
polymorphs and crystal structure predic-
tion is given, showing that the deepest
calculated minima actually correspond to
the experimental XRD structures of bulk
crystals. This combined spectroscopic
and theoretical approach to the dyna-
mical properties of a crystal lattice
provides a unique body of information on
crystal structure recognition of molecular
crystals.
Raman spectroscopy and crystalstructure
It is well established that Raman
spectroscopy is a valuable tool for non
invasive, in situ recognition of molecular
identity and conformation. However,
when polymorphism occurs in molecular
crystals, the chemical identity in the
different crystal phases implies very
938 | CrystEngComm, 2008, 10, 937–946
similar or identical spectra for the intra-
molecular vibrational modes of different
polymorphs. One should then focus one’s
attention on intermolecular modes, i.e.,
collective translational or rotational
motions of the molecules in the unit cell.
These modes produce dynamical defor-
mations of the crystal lattice called lattice
vibrations or lattice phonons, whose
frequencies, involving Raman shifts in the
range �10–150 cm�1, probe the inter-
molecular interactions and are hence very
sensitive to different molecular packing.
Because each crystal structure has its own
dynamics, in organic molecular crystals
lattice phonons are the fingerprints of the
individual crystal structure.
A typical example of the application of
Raman spectroscopy to polymorphism is
reported in Fig. 1 for pentacene,11,12
tetracene,13 a-quaterthiophene (T4)14 and
a-sexithiophene (T6).15 These materials
are, among the organic semiconductors,
those showing some of the highest charge
mobilities. They all show polymorphism.
The two polymorphs of T4 and T6 are
labelled LT (low temperature) and HT
(high temperature), according to the
substrate temperature during vapour
deposition under high vacuum. To unify
the different nomenclature found in the
literature we have adopted the same
labelling also for the two phases of pen-
tacene12 and tetracene. The occurrence of
two genuine polymorphs has been
assessed by the identical spectra in the
intramolecular region (molecular
vibrations) which confirm the molecular
identity in both crystal phases.
The relationship between each lattice
phonon pattern (lattice dynamics) and its
corresponding XRD pattern (lattice
structure) makes Raman spectroscopy
a powerful tool for complementing
information on distinct crystal structures.
The case of pentacene is exemplary: for
a long time the HT structure was assumed
to be a spurious structural result, until
eventually reproduced in the laboratory.12
Earlier calculations16 and Raman
spectra11 had anticipated this finding
independently of diffraction experiments.
Both pentacene polymorphs are found
stable at ambient p,T, though, by
applying pressure, the HT phase trans-
forms irreversibly to the denser LT phase
at room temperature.17 The case of
tetracene is a classic one. Two different
phases have been obtained, depending on
This journ
sample preparation and history. The HT
polymorph is the most frequently grown
phase, stable at ambient conditions.
Application of pressure above 1 GPa
yields the LT polymorph, which is also
obtained by cooling below 140 K. Due to
the large hysteresis of the temperature-
induced phase transition, the LT poly-
morph can be maintained at ambient
conditions.13 The spectra shown in the
lower part of Fig. 1 confirm the expecta-
tions of polymorphism in oligothiophenes
with an even number of thiophene
subunits.18 As long as the vibrational
studies of T4 and T6 crystals were limited
to the detection of the intramolecular
modes, there was no hope of spectro-
scopically discriminating between poly-
morphs. A lattice phonon spectrum
would instead be a fast, reliable and non
destructive tool for probing phase
assignment. The LT polymorph is
normally assumed to be the more stable at
ambient p,T and, as a consequence, the
only one present in organic semi-
conductor devices. Therefore a possible
phase coexistence can go undetected.
Finally, from the analysis of polarized
spectra and vibrational selection rules
additional information on mode
symmetry, number of molecules per unit
cell and crystal anisotropy can be
obtained.19
Scaling down in size: confocalRaman microscopy and phasemixing
Interfacing an optical microscope to the
Raman spectrometer and making the
microscope confocal permits the scaling
down in size of the crystal region under
investigation. Raman scattering is trans-
mitted to the spectrometer only from the
restricted sampling volume determined by
the focused region of the laser beam,
enabling fine tuning of XYZ discrimina-
tion. Spatial resolution down to 1 mm and
less can be easily achieved, opening the
way to new opportunities in materials
science.20 The analysis of the molecular
homogeneity (chemical impurities) and of
the physical purity (phase homogeneity) is
mostly facilitated. The latter point is
directly related to crystal phase identifi-
cation. In fact, as an intriguing conse-
quence of the small energy difference
between different polymorphs of organic
al is ª The Royal Society of Chemistry 2008

Fig. 1 Lattice phonon Raman spectra of the two polymorphic forms of pentacene, tetracene, a-sexithiophene and a-quaterthiophene and their
corresponding crystal structures.
Fig. 2 A typical example of phase mixing in crystalline pentacene and T6. Red and blue profiles
refer to HT and LT physically pure polymorphs, respectively. Green traces show more complex
profiles of sample regions where phase mixing occurs. The dotted vertical lines help in assigning
some spectral features to either polymorph.
molecular materials, different crystal
phases can coexist as different domains in
the same crystallite, originating a phase
mixing which ultimately affects the
physical purity of the sample.21
The problem of phase mixing is well
known in thin films,22,23 and is one of the
reasons of the difficulties in obtaining
reliable structural characterization. We
aim to show that this problem is relevant
also for single crystals and a typical
example is shown in Fig. 2. Once the
spectral profiles of the single polymorphs
are identified by lattice phonon Raman
spectroscopy, they are used as reference
spectra and it is easy to monitor physical
impurities in which domains of one
polymorph are embedded inside the
other. The related examples are shown in
Fig. 2 for crystalline samples of pentacene
This journal is ª The Royal Society of Chemistry 2008 CrystEngComm, 2008, 10, 937–946 | 939

and T6, where the coexistence of phases
appears as an overlap of distinctive
phonon bands of either polymorph in the
same crystal grain (green traces), as
indicated by the vertical bars with refer-
ence to the pure polymorph spectra.
Phase mixing, or physical inhomo-
geneities, is indeed observed in most cases
where polymorphism occurs,11,13,24
demonstrating the general validity and
the sensitivity of this technique for
detecting the presence of domains of
either structure at the mm scale.
We do stress here that it would be
impossible to identify these physical
inhomogeneities without a careful
previous analysis of the spectral contours
of the pure phases. On the other hand,
phase mixing may go undetected in single
crystal diffractometric methods, which
ordinarily may be less efficient in
discriminating phase mixtures at the mm
scale, in particular when similar struc-
tures are involved.
A method to control phasehomogeneity and phase mixing:lattice phonon Raman mapping
It is of great importance to find a suitable
method for checking phase homogeneity
in each crystal domain by obtaining
a visual display of chemical and physical
Fig. 3
940 | CrystEngComm, 2008, 10, 937–946
purity. We have shown that this task can
be nicely fulfilled by confocal Raman
mapping (CRM) in the region of lattice
phonons (10–150 cm�1), outlining
a further application of confocality to
micro-spectrometry techniques. By scan-
ning the surface, typically a few tens of mm
wide, with steps as close as 1 mm, one can
obtain a series of Raman spectra which
can be collected, point by point, in a false-
colour map to be compared to the optical
image of the original sample,21,24 as
schematically shown in Fig. 3. This will
yield crucial information on the topo-
graphy of each crystal whose phase
homogeneity needs to be checked. The
spatial resolution is given by the laser spot
area and is ranging from 0.88 to 1.05 mm,
depending on the numerical aperture of
the microscope objective and on the
wavelength of the laser line.
The actual recipe of the lattice phonon
CRM technique can be summarized in
four steps:
1. Assign spectra to structures
2. Scan selected crystal regions
3. Identify phase mixing
4. Map structural homogeneity
The first step requires a careful micro-
Raman investigation of a large number of
crystalline samples grown in as many
conditions as possible, to search for all
possible polymorphs. This will yield
Sketch of a confocal Raman mapping experimen
This journ
a series of ‘‘reference spectra’’, each
corresponding to a distinct polymorph.
This also enables one to select suitable
wavenumber windows typical of each
crystal phase. The second step concerns
the choice of the specimen regions to be
investigated, planning a number of point
spectra sufficient to reconstruct spectro-
scopically the sample with a good spatial
resolution. In the following step the
identification of phase mixing is achieved
by comparing complex spectral profiles
with the reference spectra of the pure
polymorphs. The final step eventually
yields the phase Raman mapping of the
selected crystal domain, which is obtained
by monitoring the spectral windows
where either one or the other polymorph
shows phonon bands. The relative
amount of one phase with respect to the
other can therefore be quantitatively
represented by the intensity ratio of
selected bands and at once converted,
with a suitable software, in a conventional
palette of colours. For instance, when
both HT and LT forms are present, one
can represent the intensity ratio HT/LT
by adopting a blue–green colour for the
LT phase, while the red–yellow shades
correspond to an increasing amount
of a HT phase. A deconvolution of the
phonon bands with background
suppression will assure a reliable
t.
al is ª The Royal Society of Chemistry 2008

representation of the data. The spread of
colours indicates the extent of the phase
mixing between the two polymorphs
analyzed in the chosen crystal domain.
Phase purity obviously is obtained when
the overall colour remains virtually
homogeneous throughout the whole
surface scanned. Phase mixing is instead
represented by a different extent of one
phase inside the other and produces
marked differences in the colour conven-
tionally chosen as reference of either
polymorph. Examples of lattice phonon
CRM are given in Fig. 4 and 5 for
pentacene and T6, respectively. A variety
of situations is observed in pentacene
which shows a different extent of phase
mixing in three selected crystals whose
optical images are otherwise homoge-
neous. Pentacene was the very first
Fig. 4 Optical (left) and Raman (right) images o
the optical image of the crystal. In the Raman map
scale is selected each time to emphasize the phase m
GmbH & Co. KGaA.
This journal is ª The Royal Society of Chemistry
example of an organic material mapped
with this technique.21 In the case of T6 the
sample in the lowest part of the figure is an
exemplary case of phase purity, showing
a full homogeneous colour, in spite of
a large expansion of the conventional
colour scale. Phase mixing is instead
represented by a different extent of one
phase inside the other and produces
differences in the colour maps, as shown
for the other two specimens (top and
middle sets of Fig. 5).
As expected, the contours of the optical
images are nicely reproduced in the
corresponding Raman maps, yielding
direct information on which the crystal
phase is present and in what extent.
Furthermore, the comparison between
the optical images and the Raman maps
shows clearly that no relationship exists
f selected pentacene crystals. Raman mapping refe
s the colour drifts from blue (full H phase) to green/
ixing in the crystal grain. Reproduced with permiss
2008
between morphology and crystal phase:
structural information and phase mixing
can be efficiently monitored only by
Ramanmaps. It is then crucial to perform
a spectroscopic test in order to verify the
phase purity in all crystals treated, espe-
cially for those cases in which crystal
morphology cannot assist phase recogni-
tion. It is thus conclusively shown that
lattice phonon CRM is a very efficient
tool for identifying polymorphs and their
mixing in the same crystallite on the
micrometre scale.
Getting deep inside the crystal
An additional feature related to the
confocality of the micro-Raman tech-
nique concerns the possibility to probe the
phase homogeneity of crystal domains at
rs to the area XY (mm2) drawn as a box over
red (increasing amount of C phase). The colour
ion from ref. 21. Copyright Wiley-VCH Verlag
CrystEngComm, 2008, 10, 937–946 | 941

Fig. 5 Optical images (left) and Raman maps (right) of T6 crystalline samples exhibiting phase inhomogeneity. Raman mapping refers to the area XY
(mm2) drawn as a box over the optical picture of the crystal. In the Raman maps the colour drifts from blue–green (LT phase) to red–yellow (increasing
amount ofHTphase). The colour scale is selected each time to emphasize the phasemixing in each crystal grain. Reproducedwith permission from ref. 24.
Copyright Wiley-VCH Verlag GmbH & Co. KGaA.
different sample depths.21,24 This is illus-
trated in Fig. 6, where lattice phonon
Raman spectra, taken on the very same
spot in a given crystal domain, show
a variation of the relative amount of
either polymorph on penetrating inside
the bulk. This is achieved by probing the
sample surface at different penetration
depths by focusing the laser light with
microscope objectives having different
numerical apertures. Typical values of the
theoretical penetration depths vary from
7.5 mm (100�) to 25 mm (50�) up to
a depth of about 450 mm (10�).
942 | CrystEngComm, 2008, 10, 937–946
On getting into the bulk different
amount of phase mixing is found with an
increase of the fraction of the LT poly-
morph, as indicated by the vertical lines
that monitor both phases with their
reference phonon. It is then important to
remark that phase inhomogeneity is not
confined to the first layers of the crystal
surface, but it propagates into the bulk.
The possibility of a three dimensional
investigation of single crystal homo-
geneity is thus an additional appealing
feature of this technique applied to
heterogeneous solid phases.
This journ
Polymorphism and molecularelectronics
The reliability of the CRM method
enables us to extend its application from
bulk crystals to thin films on techno-
logically relevant surfaces and,
eventually, to organic electronics
devices.24 As previously mentioned, the
problem of polymorphism here is related
to the boundaries between crystal
domains belonging to different crystal
phases. They become physical traps,
effectively decreasing the mobility of the
al is ª The Royal Society of Chemistry 2008

Fig. 6 An example of Raman phonon spectra
of T6 taken with different microscope
objectives, as labelled. The penetration depth
increases from the bottom to the top spectra (in
black) of the figure. For better reference,
HT and LT lattice phonon spectra are also
reported.
Fig. 7 Ramanmap (bottompicture) and optical image of aH4T6-based FET. The area selected for
the Raman mapping corresponds to the entire area of the device reproduced in the figure (top left).
Phase identification is readily done by assigning the patches of colours to either polymorph as
represented in the corresponding Raman spectra, also reported (top right).
semiconducting layer with detrimental
effects on device performance.6,10 For
instance, thin films are usually grown in
out-of-equilibrium conditions25 and, in
the growth by high vacuum sublimation,
the time scales of the process do not allow
molecules to reach a crystal state with
a long range order, even when molecu-
larly ordered domains are formed.26 This
often implies coexistence of different
structures, some of which correspond to
those of the bulk crystal.22,23,26 A related
example has recently been reported on the
application of Raman micro-spectro-
scopy to T6 thin films deposited on
different substrates with thickness
ranging from 5 to 40 nm. By comparison
with the reference spectra of the bulk, the
polymorph formed on each substrate
could be identified.24An important follow
up of the experiments on thin films is the
application of CRM to T6 grown on
micro-fabricated patterns as prototypes
of organic field effect transistors
(OFET’s).24
To establish a correlation between
structure and properties of thin films, the
knowledge of phases and their spatial
distribution would be useful, in order to
control the transport phenomena. The
example reported in Fig. 7 refers to CRM
of the organic semiconductor tetrahexyl-
This journal is ª The Royal Society of Chemistry
sexithiophene (H4 T6) dispersed in a self-
organized polystyrene (PS) latex bead
matrix.27 The H4 T6/PS composite has
then been used to form the transport layer
of a FET device. CRM has been applied
to FET transistors in order to establish
a relationship between crystal structure
inside the FET channel and device
behavior. The two known polymorphs of
H4 T6 (Y and R in the figure) quite
commonly coexist in different crystal
grains or thin films of deposited material.
Fig. 7 shows that their spatial distribution
can be easily monitored in selected areas
of the transistor channels. The relative
amount of the two polymorphs for
a series of devices was related to the
transistor efficiency.27 This procedure can
be widely extended as a quality test
for a number of electronic devices based
on active layers of different organic
materials.
Theoretical polymorphs: arecrystal polymorphs predictable?
The experimental investigations are
supported and, in some cases driven, by
calculations performed to identify or
predict crystalline polymorphs. To
2008
theoretically identify the possible poly-
morphs of a given compound, one starts
either from all known experimental
structures or from a large number of
generated structures and, by steepest
descent, seeks the local minima of its
many-particle potential energy hyper-
surface. These minima correspond to the
possible configurations of mechanical
equilibrium and thus constitute the
‘‘natural’’ or ‘‘inherent’’ structures that
the system can exhibit. The concept of
‘‘inherent structure’’, originally deve-
loped28 to describe liquid and glassy
states, provides a powerful theoretical
device to identify all distinct stable phases
of a crystalline compound.
In our standard computational
strategy, we start with the choice of
a potential model suitable to describe the
intermolecular interactions which char-
acterize the crystal. Then we identify the
inherent structures of all known X-ray
structures, by varying unit cell axes,
angles, and molecular positions and
orientations till a minimum of energy is
found. The comparison between the
inherent structures can now be used to
unambiguously diagnose the identity of
the corresponding crystal phases, since it
CrystEngComm, 2008, 10, 937–946 | 943
eliminates the ‘‘noise’’ due both to the
thermal expansion (so that data collected
at different temperatures can be effec-
tively compared) and to the experimental
uncertainty in the lattice parameters. In
addition, we compute lattice phonon
frequencies for the inherent structures by
lattice dynamics methods. These provide
a further powerful means of investigation,
as they can be directly related to the
experimental Raman spectra.
As mentioned in a previous section, the
first successful application of this
strategy16,29 dealt with the case of the ‘‘lost
and found’’ polymorph of pentacene.12
Inherent structure calculations16,29 clearly
showed that while all recent experimental
structures30–32 converged to the same
energy minimum, and therefore they all
belonged to the same phase (the LT
phase), the oldest structure33,34 instead
converged to a different minimum, and
necessarily had to be attributed to
another phase (the HT phase). The
unexpected theoretical support for the
stability of the two forms, along with
the prediction of significant differences
between their lattice phonons spectra, led
to extensive experimental search and
Raman experiments which finally
confirmed the existence of two distinct
phases.11,17 The published lattice para-
meters of both forms were then checked
and finally reproduced in powder17 and
single-crystal X-ray diffractions
measurements.12
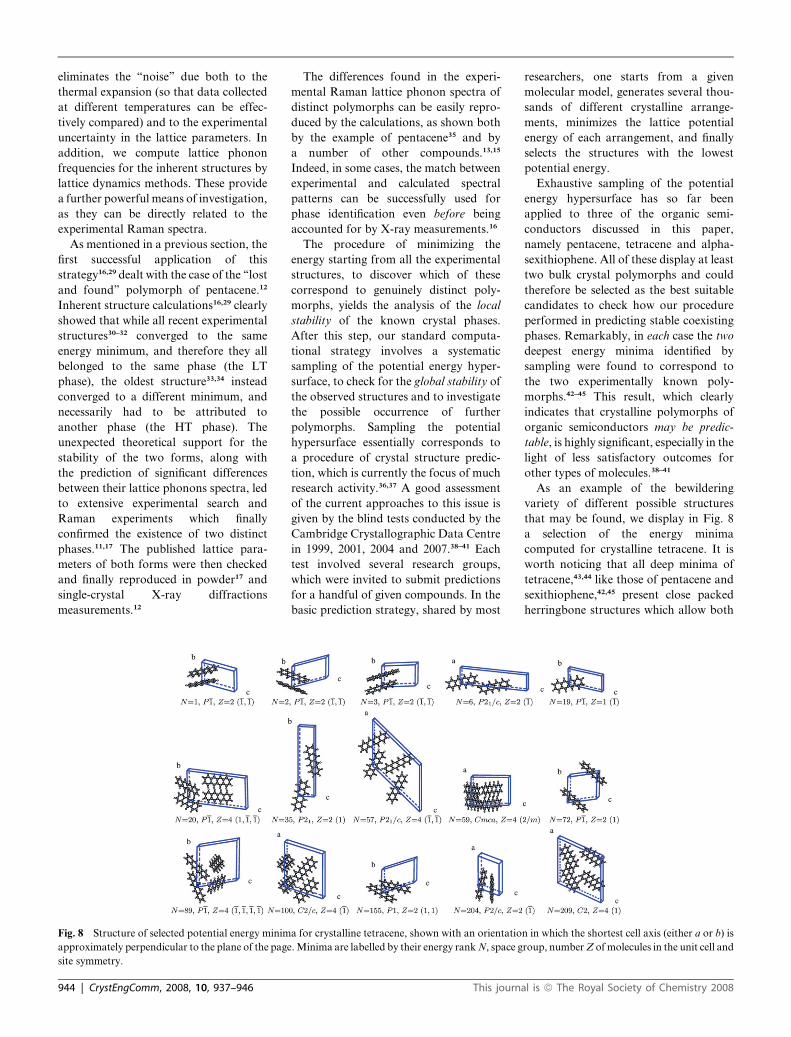
Fig. 8 Structure of selected potential energy minim
approximately perpendicular to the plane of the page
site symmetry.
944 | CrystEngComm, 2008, 10, 937–946
The differences found in the experi-
mental Raman lattice phonon spectra of
distinct polymorphs can be easily repro-
duced by the calculations, as shown both
by the example of pentacene35 and by
a number of other compounds.13,15
Indeed, in some cases, the match between
experimental and calculated spectral
patterns can be successfully used for
phase identification even before being
accounted for by X-ray measurements.16
The procedure of minimizing the
energy starting from all the experimental
structures, to discover which of these
correspond to genuinely distinct poly-
morphs, yields the analysis of the local
stability of the known crystal phases.
After this step, our standard computa-
tional strategy involves a systematic
sampling of the potential energy hyper-
surface, to check for the global stability of
the observed structures and to investigate
the possible occurrence of further
polymorphs. Sampling the potential
hypersurface essentially corresponds to
a procedure of crystal structure predic-
tion, which is currently the focus of much
research activity.36,37 A good assessment
of the current approaches to this issue is
given by the blind tests conducted by the
Cambridge Crystallographic Data Centre
in 1999, 2001, 2004 and 2007.38–41 Each
test involved several research groups,
which were invited to submit predictions
for a handful of given compounds. In the
basic prediction strategy, shared by most
a for crystalline tetracene, shown with an orientatio
.Minima are labelled by their energy rank N, space g
This journ
researchers, one starts from a given
molecular model, generates several thou-
sands of different crystalline arrange-
ments, minimizes the lattice potential
energy of each arrangement, and finally
selects the structures with the lowest
potential energy.
Exhaustive sampling of the potential
energy hypersurface has so far been
applied to three of the organic semi-
conductors discussed in this paper,
namely pentacene, tetracene and alpha-
sexithiophene. All of these display at least
two bulk crystal polymorphs and could
therefore be selected as the best suitable
candidates to check how our procedure
performed in predicting stable coexisting
phases. Remarkably, in each case the two
deepest energy minima identified by
sampling were found to correspond to
the two experimentally known poly-
morphs.42–45 This result, which clearly
indicates that crystalline polymorphs of
organic semiconductors may be predic-
table, is highly significant, especially in the
light of less satisfactory outcomes for
other types of molecules.38–41
As an example of the bewildering
variety of different possible structures
that may be found, we display in Fig. 8
a selection of the energy minima
computed for crystalline tetracene. It is
worth noticing that all deep minima of
tetracene,43,44 like those of pentacene and
sexithiophene,42,45 present close packed
herringbone structures which allow both
n in which the shortest cell axis (either a or b) is
roup, number Z ofmolecules in the unit cell and
al is ª The Royal Society of Chemistry 2008

for an optimal packing and for a signifi-
cant overlap between the p orbitals of
neighbouring molecules. This character-
istic molecular arrangement may
contribute to the excellent charge trans-
port properties of both oligoacenes and
oligothiophenes.3
The agreement between the predicted
structures and the X-ray data is excellent
for all semiconductors studied so far,
especially once the effects of temperature
T and pressure p are accounted for. This
can be achieved by minimizing the crystal
Gibbs energy G(p,T) at given p,T condi-
tions with quasi harmonic lattice
dynamics (QHLD) methods.46 Thus,
QHLDmethods are capable, in principle,
of predicting not only the relative
thermodynamic stability of the various
polymorphs but also solid–solid phase
transitions in organic molecular crystals,
providing a useful aid for the definition of
the phase diagram of the compound.
Quite interestingly, both for oligoacenes
and oligothiophenes, phase transitions
cannot be reproduced by calculations,
although distinct polymorphs are char-
acterized by very small computed Gibbs
energy differences (DG � kBT)
throughout the range of their mechanical
stability. Far from being an unsatisfac-
tory result, this confirms the finding that
polymorphs can often be obtained under
very similar experimental conditions and
may coexist at ambient conditions.
Kinetic and entropic factors, besides the
packing energy, indeed play important
roles in crystallization.
Conclusions
Polymorphism is widespread in organic
semiconductors, quite often yielding
phase mixing. The careful phase control
of polymorphic materials is of paramount
importance whenever phase purity is
a strict requirement in sample prepara-
tion, as, for instance, in organic electronic
devices whose carrier mobility, being
dependent on the purity and the method
of preparation of the material, will ulti-
mately depend strongly on their crystal
structure.47 Phase homogeneity cannot be
taken for granted, even for well formed
single crystals. Different polymorphs can
coexist down to the mm scale and physical
inhomogeneities occur at surfaces and in
the bulk. Experimentally we have found
that different crystalline polymorphs may
This journal is ª The Royal Society of Chemistry
be conveniently probed by their Raman
spectra in the region of the lattice
phonons (usually below 150 cm�1), whose
frequencies probe the intermolecular
interactions and turn out to be very
sensitive to differences in molecular
packing. The method illustrated here,
lattice phonon confocal Raman mapping,
is a powerful technique to probe the
crystal structure of organic materials,
being fast, reliable and capable tomonitor
in situ physical modifications and phase
inhomogeneities in crystal domains on the
micrometre scale. Comparison of optical
images and Raman maps conclusively
shows that no relationship exists between
morphology and crystal phase: structural
information can be drawn only from
Raman images. It is then crucial to
perform a spectroscopic test in order to
verify the phase purity in all crystals
treated, especially for those cases in which
crystal morphology cannot assist phase
recognition.
From a theoretical point of view we
have shown that successful a priori
prediction of polymorphism in organic
semiconductors may be feasible. We have
computed the possible crystal structures
of mechanical equilibrium, either by
starting from all known X-ray structures
or by generating thousands of random
structures to sample the overall distribu-
tion of potential energy minima. The
cases studied, pentacene, tetracene and
a-sexithiophene42–45 show that the deepest
minima calculated indeed correspond to
the experimental XRD structures of bulk
crystals.
In conclusion, the problem of
polymorphism in the preparation and
characterization of new materials should
benefit from this technique as a sound
method capable of controlling both
crystal structure and molecular recogni-
tion in single crystals, thin films and in
electronic devices.
Acknowledgements
This work was in part supported by EU
Integrated Project NAIMO, project No
NMP4-CT-2004–500355. The support of
INSTM is gratefully acknowledged. We
thank drMassimo Placidi, Horiba JY, for
skillful technical advice and Drs Chiara
Dionigi and Fabio Biscarini, ISMN-CNR
Bologna, for the sample represented in
Fig. 7.
2008
References
1 J. Bernstein, Polymorphism in MolecularCrystals, Oxford University Press, Oxford,2002.
2 W. C. McCrone, Polymorphism in Physicsand Chemistry of the Organic Solid State,vol. 2, ed. D. Fox, M. M. Labes and A.Weissberger, Wiley Interscience, NewYork, 1965, pp. 725–767.
3 F. Garnier, Acc. Chem. Res., 1999, 32, 209–215.
4 C. D. Dimitrakopoulos and D. J. Mascaro,IBM J. Res. Dev., 2001, 45, 11–27.
5 G. Horowitz, J. Mater. Res., 2004, 19,1946–1962.
6 C. D. Dimitrakopoulos andP. R. L. Malenfant, Adv. Mater., 2002, 14,99–117.
7 M. Bendikov, F. Wudl andD. F. Perepichka, Chem. Rev., 2004, 104,4891–4945.
8 L.-L. Chua, J. Zaumseil, J.-F. Chang,E. C.-W. Ou, P. K.-H. Ho, H. Sirringhausand R. H. Friend, Nature, 2005, 434, 194–199.
9 A. L. Briseno, S. C. B. Mannsfeld,M. M. Ling, S. Liu, R. J. Tseng, C. Reese,M. E. Roberts, Y. Yang, F. Wudl andZ. Bao, Nature, 2006, 444, 913–917.
10 N. Karl, Synth. Met., 2003, 133, 649–657.11 A. Brillante, R. G. Della Valle, L. Farina,
A. Girlando, M. Masino and E. Venuti,Chem. Phys. Lett., 2002, 357, 32–36.
12 T. Siegrist, C. Besnard, S. Haas, M. Schiltz,P. Pattison, D. Chernyshov, B. Batlogg andC. Kloc, Adv. Mater., 2007, 19, 2079–2082.
13 E. Venuti, R. G. Della Valle, L. Farina,A. Brillante, M. Masino and A. Girlando,Phys. Rev. B: Condens. Matter Mater.Phys., 2004, 70, 1041061–1041068.
14 P. Ranzieri, A. Girlando, S. Tavazzi,M. Campione, L. Raimondo, I. Bilotti,A. Brillante, R. G. Della Valle, E. Venuti,to be published.
15 A. Brillante, I. Bilotti, F. Biscarini,R. G. Della Valle and E. Venuti, Chem.Phys., 2006, 328, 125–131.
16 E. Venuti, R. G. Della Valle, A. Brillante,M. Masino and A. Girlando, J. Am.Chem. Soc., 2002, 124, 2128–2129.
17 L. Farina, K. Syassen, A. Brillante,R. G. Della Valle, E. Venuti andM. Amboage, Chem. Phys. Lett., 2003,375, 490–494.
18 L. Antolini, G. Horowitz, F. Kouki andF. Garnier, Adv. Mater., 1998, 10, 382–385.
19 G. Turrel, Infrared and Raman Spectra ofCrystals, Academic Press, London 1972.
20 Handbook of Raman Spectroscopy, ed. I. R.Lewis and H. G. M. Edwards, MarcelDekker, Inc, 2002.
21 A. Brillante, I. Bilotti, R. G. Della Valle,E. Venuti, M. Masino and A. Girlando,Adv. Mater., 2005, 17, 2549–2553.
22 C. C. Mattheus, G. A. de Wijs, R. A. deGroot and T. T. M. Palstra, J. Am. Chem.Soc., 2003, 125, 6323–6330.
23 C. C. Mattheus, A. B. Dros, J. Baas,G. T. Oostergetel, A. Meetsma, J. L. deBoer and T. T. M. Palstra, Synth. Met.,2003, 138, 475.
24 A. Brillante, I. Bilotti, C. Albonetti,J.-F. Moulin, P. Stoliar, F. Biscarini and
CrystEngComm, 2008, 10, 937–946 | 945

D. M. de Leeuw, Adv. Funct. Mater., 2007,17, 3119–3127.
25 F. Biscarini, P. Samorı, O. Greco andR. Zamboni, Phys. Rev. Lett., 1997, 78,2389–2392.
26 J.-F. Moulin, F. Dinelli, M. Massi,C. Albonetti, R. Kshirsagar andF. Biscarini, Nucl. Instrum. Methods Phys.Res., Sect. B, 2006, 246, 122.
27 C. Dionigi, P. Stoliar, W. Porzio, S. Destri,M. Cavallini, I. Bilotti, A. Brillante andF. Biscarini, Langmuir, 2007, 23, 2030.
28 F. H. Stillinger and T. A.Weber, Phys. Rev.A: At., Mol., Opt. Phys., 1982, 25, 978–989.
29 M.Masino, A. Girlando, R. G. Della Valle,E. Venuti, L. Farina and A. Brillante,Mater. Res. Soc. Symp. Proc., 2002, 725,149–154.
30 D. Holmes, S. Kumaraswamy,A. J. Matzger and K. P. Vollhardt,Chem.–Eur. J., 1999, 5, 3399–3412.
31 T. Siegrist, C. Kloc, J. H. Schon,B. Batlogg, R. C. Haddon, S. Berg andG. A. Thomas, Angew. Chem., Int. Ed.,2001, 40, 1732–1736.
32 C. C. Mattheus, A. B. Dros, J. Baas,A. Meetsma, J. L. de Boer andT. T. M. Palstra, Acta Crystallogr., Sect.C: Cryst. Struct. Commun., 2001, 57, 939–941.
33 R. B. Campbell, J. M. Roberston andJ. Trotter, Acta Crystallogr., 1961, 14, 705.
34 R. B. Campbell, J. M. Roberston andJ. Trotter, Acta Crystallogr., 1962, 15, 289.
35 R. G. Della Valle, E. Venuti, A. Brillanteand A. Girlando, J. Chem. Phys., 2003,118, 807–815.
946 | CrystEngComm, 2008, 10, 937–946
36 T. Beyer, T. Lewis and S. L. Price,CrystEngComm, 2001, 44, 1–35.
37 S. L. Price and L. S. Price, ‘‘IntermolecularForces and Clusters I’’, Struct. Bonding2005, 115, 81–123, (Springer-Verlag,Berlin & Heidelberg).
38 J. P. M. Lommerse, W. D. S. Motherwell,H. L. Ammon, J. D. Dunitz,A. Gavezzotti, D. W. M. Hofmann,F. J. J. Leusen, W. T. M. Mooij,S. L. Price, B. Schweizer, M. U. Schmidt,B. P. van Eijck, P. Verwer andD. E. Williams, Acta Crystallogr., Sect. B:Struct. Sci., 2000, 56, 697–714.
39 W. D. S. Motherwell, H. L. Ammon,J. D. Dunitz, A. Dzyabchenko, P. Erk,A. Gavezzotti, D. W. M. Hofmann,F. J. J. Leusen, J. P. M. Lommerse,W. T. M. Mooij, S. L. Price, H. Scheraga,B. Schweizer, M. U. Schmidt, B. P. vanEijck, P. Verwer and D. E. Williams, ActaCrystallogr., Sect. B: Struct. Sci., 2002, 58,647–661.
40 G. M. Day, W. D. S. Motherwell,H. Ammon, S. X. M. Boerrigter,R. G. Della Valle, E. Venuti,A. Dzyabchenko, J. Dunitz, B. Schweizer,B. P. van Eijck, P. Erk, J. C. Facelli,V. E. Bazterra, M. B. Ferraro,D. W. M. Hofmann, F. J. J. Leusen,C. Liang, C. C. Pantelides,P. G. Karamertzanis, S. L. Price,T. C. Lewis, H. Nowell, A. Torrisi,H. A. Scheraga, Y. A. Arnautova,M. U. Schmidt and P. Verwer, ActaCrystallogr., Sect. B: Struct. Sci., 2005, 61,511–527.
This journ
41 G. M. Day, T. G. Cooper, A. J. Cruz
Cabeza, K. E. Hejczyk, H. L. Ammon,
S. X. M. Boerrigter, J. Tan, R. G. Della
Valle, E. Venuti, J. Jose, S. R. Gadre,
G. R. Desiraju, T. S. Thakur, B. P. van
Eijck, J. C. Facelli, V. E. Bazterra,
M. B. Ferraro, D. W. M. Hofmann,
M. Neumann, F. J. J. Leusen,
J. Kendrick, S. L. Price, A. J. Misquitta,
P. G. Karamertzanis, G. W. A. Welch,
H. A. Scheraga, Y. A. Arnautova,
M. U. Schmidt, J. van de Streek, A. Wolf
and B. Schweizer, Acta Crystallogr., Sect.
B, 2008, to be published.42 R. G. Della Valle, E. Venuti, A. Brillante
and A. Girlando, J. Chem. Phys., 2003,
118, 807–815.43 R. G. Della Valle, E. Venuti, A. Brillante
and A. Girlando, J. Phys. Chem. A, 2006,
110, 10858–10862.44 R. G. Della Valle, E. Venuti, A. Brillante
and A. Girlando, J. Phys. Chem. A, 2008,
112, 1085–1089.45 R. G. Della Valle, E. Venuti, A. Brillante
and A. Girlando, J. Phys. Chem. A, 2008,
in press.46 R. G. Della Valle, E. Venuti and
A. Brillante, Chem. Phys., 1996, 202, 231–
241.47 F. Garnier, A. Yassar, R. Hajlaoui,
G. Horowitz, F. Deloffre, B. Servet,
S. Ries and P. Alnot, J. Am. Chem. Soc.,
1993, 115, 8716–8721.
al is ª The Royal Society of Chemistry 2008
Copyright © 2022 FDOKUMEN