Coffee: The world's favourite cuppa' caffeine - Khazanah ...
Upload
khangminh22Category
view
1download
0
Jacle Trisch man (Aug 6, 2020 14:29 PDT) 08/06/2020
SIGNATURE DATE
08/07/2020
SIGNATURE DATE
08/07/2020
SIGNATURE DATE
CALIFORNIA ST ATE UNIVERSITY SAN MARCOS
THESIS SIGNATURE PAGE
THESIS SUB:MITTED IN PARTIAL FULFILUvlENT
OF THE REQUIRE:tv:IENTS FOR THE DEGREE
MASTER OF SCIENCE
IN
CHEMISTRY
THESIS TITLE: Analysis of Caffeine and Theo bromine in Cocoa and Beer; LCMS Method Development for Undergraduate Lab Curriculum
AUTHOR: Robyn Johanna Araiza
DATE OF SUCCESSFUL DEFENSE :May 12, 2020
THE THESIS HAS BEEN ACCEPTED BY THE THESIS Co:tvIMITTEE IN
PARTIAL FULFILL:tv:IENT OF THE REQUIREMENTS FOR THE DEGREE OF
MASTER OF SCIENCE IN CHEMISTRY.
Dr Jacqueline Irischman
THESIS CO:Mlv1ITTEE CHAIR
Dr Robert lafe
THESIS Co:tvIMITTEE ME:tvffiER
Dr Ann Dickinson
THESIS CO:Mlv1ITTEE CHAIR

Araiza
Page 1 of 92
Robyn Johanna Araiza
Master’s Thesis:
Analysis of Caffeine and Theobromine in
Cocoa and Beer; LCMS Method Development
for Undergraduate Lab Curriculum
Dr. Jacqueline Trischman, Ph.D.
Thesis advisor & research supervisor
Dr. Robert Iafe, Ph.D.
Thesis committee member
Dr. Ann Dickinson, Ph.D.
Thesis committee member

Araiza
Page 2 of 92
Table of Contents
Table of Contents ........................................................................................................ 2
Chapter 1: The Project ................................................................................................. 3
Abstract .................................................................................................................... 3
Introduction .............................................................................................................. 4
The Compounds ..................................................................................................... 12
Lab Curriculum ....................................................................................................... 17
Methods ................................................................................................................. 22
Results and Discussion .......................................................................................... 26
References ............................................................................................................. 43
Chapter 2: Student Lab Protocol................................................................................ 49
Background ............................................................................................................ 49
Procedure .............................................................................................................. 51
Post Lab Questions: ............................................................................................... 56
Chapter 3: Instrument Operation Procedure .............................................................. 58
Data Acquisition ..................................................................................................... 58
How to set up Worklist ........................................................................................... 59
Qualitative Analysis ................................................................................................ 60
Quantitative Analysis .............................................................................................. 61
Chapter 4: Visual Instrument Operation Guide .......................................................... 63
Section 1: Data Acquisition .................................................................................... 65
Section 2: How to set up Worklist ........................................................................... 71
Section 3: Qualitative Analysis ............................................................................... 76
Section 4: Quantitative Analysis ............................................................................. 81

Araiza
Page 3 of 92
Chapter 1: The Project
Abstract
Most modern research labs utilize liquid chromatography-tandem mass
spectrometry, or LC-MS/MS, to analyze mixtures in both qualitative and quantitative
capacities. This makes it imperative to teach students how to operate and understand
these instruments even at an undergraduate level. The final goal of this project was to
develop a method to use in an academic setting to demonstrate the versatility of LC-
MS/MS. The protocol takes advantage of the low detection limit when needed, while
using less sensitive methods with samples containing higher amounts of analytes. There
are multiple methods used to run samples including Scan for broad range data at high
concentrations and multiple reaction monitoring (MRM) for highly specific low
concentration analysis. The dynamic range of the instrument was shown from 1 pg/mL
to 1 mg/mL when run in the various available modes. The two compounds utilized in this
study to demonstrate the unique abilities of this instrument are caffeine and theobromine.
These are most commonly known as the stimulants in coffee and cocoa respectively.
These natural products are ideal for exhibiting the power of this instrument because they
are homologous compounds that differ by a single methyl group and have very similar
polarity and spectroscopic characteristics. This makes it difficult to achieve rapid baseline
separation using many instruments commonly found in a chemistry laboratory, but they
can be individually integrated even without baseline separation using the MRM method.
The high matrix nature of the food samples was overcome with the specificity of the
method without extensive sample preparation. A rinse method that cycled between high

Araiza
Page 4 of 92
and low organic mobile phase was shown to effectively elute residual compounds from
the column. A lab protocol and instrumental instruction set were established for the
Agilent 6410 triple quad system.
Introduction
larger molecule is slower to respond to
directional changes, while a smaller molecule responds more quickly. This technique
developed into the

Araiza
Page 5 of 92
The manner in which a sample is introduced to the MS can have great impact
on resulting data as well as what type of samples are able to be analyzed, ranging from
small molecules that are easy to volatilize to complex biological samples. Samples can
be directly introduced to a mass spectrometer using methods such as direct-infusion
mass spectrometry (DIMS) but chromatographic methods are more frequently utilized.
DIMS methods have the advantage of minimal sample preparation resulting in overall
reduced analysis time per sample3 and high reproducibility.4 The major downfall is all
compounds present in the sample go into the mass analyzer simultaneously making it
hard to identify spectra for individual compounds if the sample is not pure.5 Because
purity is of such paramount importance, scientists commonly use chromatographic
methods to introduce the sample in order to prevent signal overlap. Gas chromatography
(GC) is frequently used in combination with MS but high performance liquid
chromatography (HPLC) is proving to be a much more versatile way to introduce a
sample. GC-MS is a commonly used technique as it requires less maintenance and has
a lower overall cost but is only useful for compounds that can be easily volatilized. LC-
MS has fewer limitations allowing for separation of complex mixtures ranging from small
molecules to proteins. For liquid chromatography the compounds need only be soluble
in the mobile phase and small enough to pass through the column in order to be analyzed.

Araiza
Page 6 of 92
Chromatographic methods don’t necessarily prevent signal overlap as
A standard mass spectrometer, or a single quadrupole, can be used to identify the
mass of compounds but is not as sensitive nor as definitive as a tandem mass
spectrometer which utilizes two mass quadrupoles or other filters in series. A single
quadrupole can often produce data containing either the molecular ion or a fragmentation
pattern as fragments occur at the expense of the molecular ion. Tandem mass
spectrometry is powerful because the compounds can be clearly identified not only using
a clear molecular weight, but also through identification of a unique fragmentation
pattern. Tandem methods allow for qualitative analysis of over 230 compounds in a
single injection in less than five minutes.6 The use of a collision cell and an additional
mass filter, known as a triple quad or QQQ when the collision cell is also a quadrupole,
allows for the MRM technique as shown in Figure 1. In the first quadrupole, ions are
isolated by molecular weight. The collision cell, Q2, traps selected ions and fragments
them with an inert gas. The third Q is another mass filter, sorting the fragments by
mass. This three-step process allows for incredibly low detection limits by actively
eliminating extra ions, thus decreasing noise significantly. A triple quad can also be used
to isolate all compounds of a single mass in SIM mode, see Figure 2, resulting in very

Araiza
Page 7 of 92
Figure 1. Representation of a triple quad run in MRM mode. In Q1 ions are isolated by molecular weight. The collision cell, Q2, traps those ions and fragments them with an inert gas. Q3 sorts the fragments by mass and limits detection to fragment of interest.
Figure 2. Representation of a triple quad run in SIM mode. In the first quadrupole, ions are isolated by molecular weight. The collision cell, Q2, traps those ions and fragments them with an inert gas. The third quadrupole sorts the fragments by mass.
Araiza
Page 8 of 92
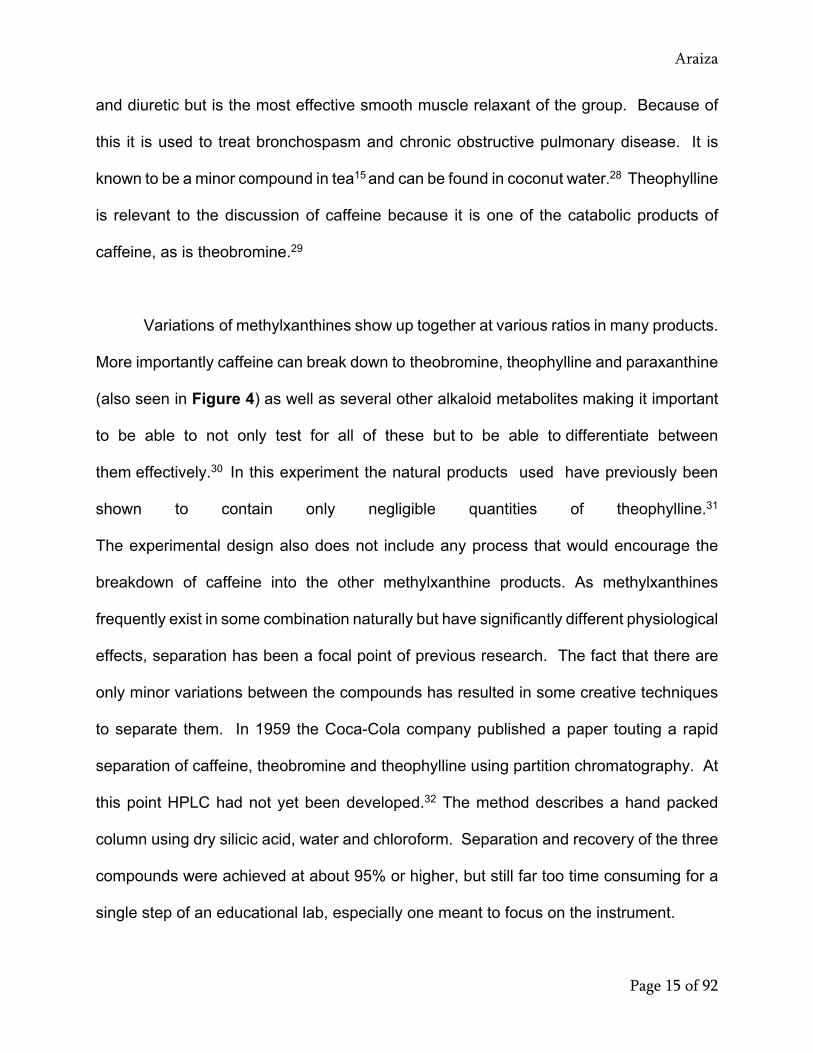
A comparison of the three LC-
MS methods, Scan, SIM, and MRM can be seen in Figure 3. This shows analyses of an
identical sample mixture of theobromine and caffeine. The top row in Scan mode shows
only noise without any discernable signal from the compounds of interest. The middle
row in SIM mode shows clear peaks for compounds with the molecular weight selected
or fragments with that molecular weight. Several peaks can be seen as well as a small
amount of baseline noise. The bottom row, in MRM mode, shows a single peak for each
spectrum corresponding to the total mass and fragment mass selected. There is no
perceptible noise in this last mode.

Araiza
Page 9 of 92
Figure 3 All runs were performed on the same sample mixture of caffeine and theobromine at 0.25 ppm, while only changing the acquisition method showing the decreased noise moving from Scan for (a) theobromine and (b) caffeine, to SIM for (c) theobromine and (d) caffeine, to MRM for (e) theobromine and (f) caffeine.

Araiza
Page 10 of 92
One of the key steps in mass spectrometry is ionization of the sample. Ion sources
are generally categorized as hard or soft sources. Hard sources result in the sample
being fragmented while a soft source typically results in the compound remaining largely
intact. While the fragmentation pattern gives clues on the structure of the compounds

Araiza
Page 11 of 92
present, the full molecular ion may not always be observed when using a hard ionization
source. The instrument used for this project features a soft ionization method
with fragmentation achieved and controlled in the ion trap. The ionization mode for this
instrument is electro spray ionization (ESI) which allows for the vaporization of samples
with minimal destruction. The liquid sample is passed through a small capillary with a
strong electric current into a vacuum chamber resulting in introduction as a
cation.13 This ion is then propelled into the quadrupole series. This technique gives
a pseudomolecular ion at [M+H]+, meaning the mass that appears on the spectrum
is actually one mass unit higher than the true molecular mass. ESI is very versatile and
can ionize small molecules, those with molecular weights below 2000, as well as large
molecules such as a protein. This ionization technique helped guide the field of
proteomics resulting in John B. Fenn being part of the 2002 group to win the Nobel Prize.14

Araiza
Page 12 of 92
The Compounds
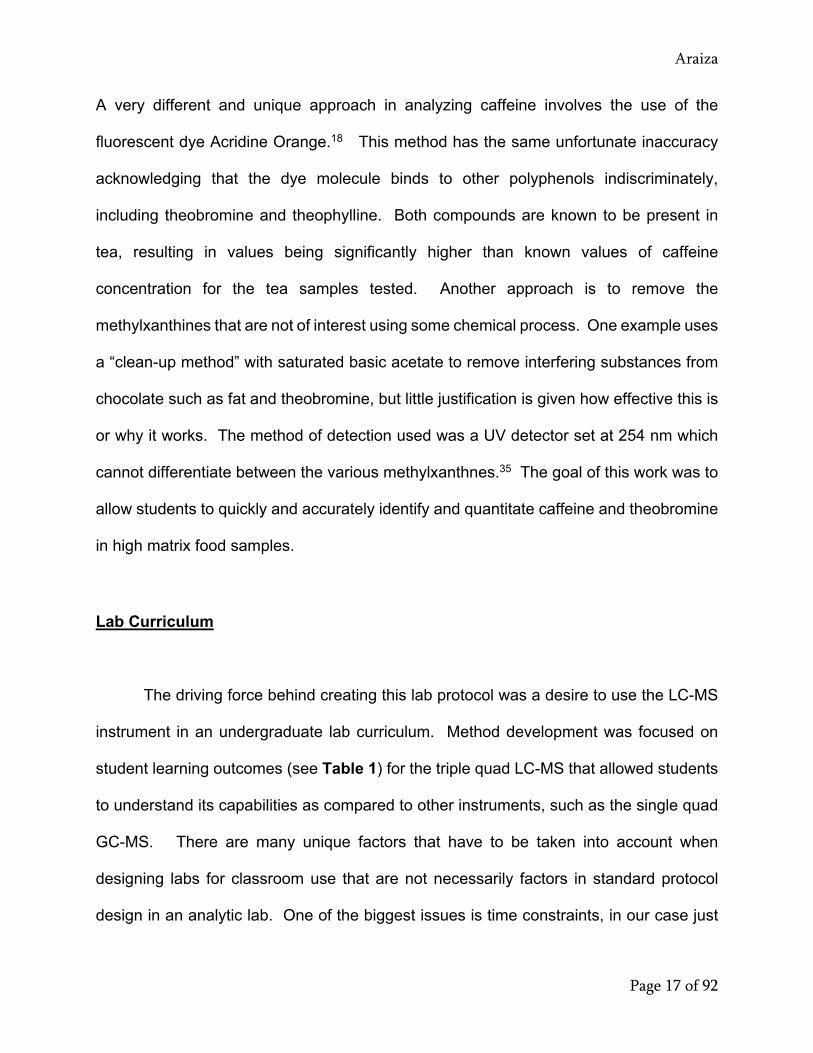
Figure 1. Structures of methylxanthines
This project involves quantification of caffeine and theobromine in cocoa and
chocolate containing samples as well as beer brewed with cocoa or coffee. These purine
alkaloids seen in Figure 4 are part of a very important group of
natural products today known as methylxanthines (skeleton shown in Figure
5). Methylxanthines are the most widely distributed alkaloid, being produced in almost
100 species of plants.15 These compounds can be found in the leaves, stems and
seeds.16 The medicinal uses of these compounds have been known for centuries and
are still relevant today. Cocoa has been reported for its medicinal properties since the
Aztec and Mayan civilizations, while the use of tea for health benefits dates back to the
Ming Dynasty. 15

Araiza
Page 13 of 92
Figure 5. Purine ring that is the base of caffeine
and theobromine
The most well-known compound of this group is caffeine (1,3,7-trimethylxanthine,
Figure 4), a widely used and accepted central nervous system stimulant. It works as a
stimulant by inhibiting adenosine receptors.17 Caffeine is used medicinally to enhance
the effectiveness of analgesics such as acetaminophen in products like Excedrin. It is a
weak diuretic which is why coffee is not an efficient means for hydration. There is a risk
associated with this stimulant in larger doses, including cardiac arrest. Caffeine is
considered to be harmless for adults with a maximum consumption of 100 mg/day,18
although more recent study have this value as high as 600 mg/day.19 The toxic dose is
generally considered around 10-14 grams for healthy individuals but this can vary
drastically from one person to the next.20 Caffeine is most abundant in coffee and tea,
but in recent years has been used in energy drinks as guarana (formerly referred to
as guaranin). Growing popularity of caffeine containing products has raised the level of
awareness related to the health risks associated with this stimulant. This is especially
true among teenagers with the growing popularity of energy drinks in recent years. In
general, these cold drinks are consumed at a much faster rate than hot coffee beverages.
The major concern, however, is the combination of these energy drinks and
alcohol increasing the rate of alcohol related injuries.21 A contributing factor for the higher

Araiza
Page 14 of 92
risk related to energy drinks apart from alcohol is the effect of other ingredients on the
rate of metabolism of caffeine. The issue is thus more complex than just the quantity of
stimulant consumed.22 In the late 1990s the National Institute of Standards and
Technology pushed for accurate labeling of a wide range of compounds found in foods,
caffeine among them.23 The newest industry that currently has very little government
oversite is vape products or e-cigarettes. Manufacturers have started to introduce
energizing vape liquids that contain caffeine, although there have not been extensive
studies on the safety of inhaled caffeine.24 Previous studies of inhaled caffeine have
focused on the combined effect of caffeine with heroin as it is used eutectically to
decrease the melting point of heroin to make it easier to vaporize.25
Theobromine (3,7-dimethylxanthine, Figure 4), is found in the greatest abundance in
cocoa imparting much of the bitter flavor in chocolate. The name is derived from
the Latin origin Theobroma cacao meaning “Food of the Gods. The compound does not
actually contain bromine. Theobromine is a diuretic, a cardiac stimulant, and smooth
muscle relaxant that was once used in commercial medication.15 Studies have shown
that theobromine increases lipid and glucose metabolism contributing to increased weight
loss.26 Unreasonably large amounts of chocolate would need to be consumed by a
person for it to be toxic, but this is the compound that makes chocolate lethal for dogs
due to both size of the animal and a much longer half-life in their metabolisms.27
Theophylline (1,3-dimethylxanthine), seen in Figure 4, is the compound within this
set that is most clearly defined for medicinal use. This compound is also a weak stimulant
Araiza
Page 15 of 92
and diuretic but is the most effective smooth muscle relaxant of the group. Because of
this it is used to treat bronchospasm and chronic obstructive pulmonary disease. It is
known to be a minor compound in tea15 and can be found in coconut water.28 Theophylline
is relevant to the discussion of caffeine because it is one of the catabolic products of
caffeine, as is theobromine.29
Variations of methylxanthines show up together at various ratios in many products.
More importantly caffeine can break down to theobromine, theophylline and paraxanthine
(also seen in Figure 4) as well as several other alkaloid metabolites making it important
to be able to not only test for all of these but to be able to differentiate between
them effectively.30 In this experiment the natural products used have previously been
shown to contain only negligible quantities of theophylline.31
The experimental design also does not include any process that would encourage the
breakdown of caffeine into the other methylxanthine products. As methylxanthines
frequently exist in some combination naturally but have significantly different physiological
effects, separation has been a focal point of previous research. The fact that there are
only minor variations between the compounds has resulted in some creative techniques
to separate them. In 1959 the Coca-Cola company published a paper touting a rapid
separation of caffeine, theobromine and theophylline using partition chromatography. At
this point HPLC had not yet been developed.32 The method describes a hand packed
column using dry silicic acid, water and chloroform. Separation and recovery of the three
compounds were achieved at about 95% or higher, but still far too time consuming for a
single step of an educational lab, especially one meant to focus on the instrument.

Araiza
Page 16 of 92
Longer methods with 30-minute run times can achieve usable baseline separation
with HPLC.31 However, runs of 30 minutes and requiring establishment of a standard
curve make it difficult to complete activity within a single class period. These HPLC
methods in the literature also still rely solely on retention times of known compounds. Any
shift of retention times, or other compound present in a high matrix solution that could be
co-eluting can alter quantitation significantly.
Another reported method of successfully separating three of the methylxanthines,
caffeine, theobromine and theophylline is using automated high performance thin layer
chromatography (HPTLC).33 Once the compounds are separated a UV detector is used
to read the intensity of the spots on the plate. The analysis again relies only on
comparison to a known sample’s retention factor and does not differentiate between the
different compounds. An interesting aspect of this method is although a separation takes
50 minutes, up to 21 samples can be analyzed simultaneously.
Other techniques frequently report all methylxanthines as caffeine resulting in the
misperception that chocolate has high levels of caffeine when there is more theobromine
present and only a small amount of caffeine. And there is no shortage of interest among
well-known food conglomerates. In addition to Coca-Cola, another global corporation that
had reasons for working with these compounds is Hershey Foods, as seen in a publication
from 1980.34 The purpose of the paper was to address the issue of combining the amount
of caffeine and theobromine resulting in frequent overstated values of one or the other.
Araiza
Page 17 of 92
A very different and unique approach in analyzing caffeine involves the use of the
fluorescent dye Acridine Orange.18 This method has the same unfortunate inaccuracy
acknowledging that the dye molecule binds to other polyphenols indiscriminately,
including theobromine and theophylline. Both compounds are known to be present in
tea, resulting in values being significantly higher than known values of caffeine
concentration for the tea samples tested. Another approach is to remove the
methylxanthines that are not of interest using some chemical process. One example uses
a “clean-up method” with saturated basic acetate to remove interfering substances from
chocolate such as fat and theobromine, but little justification is given how effective this is
or why it works. The method of detection used was a UV detector set at 254 nm which
cannot differentiate between the various methylxanthnes.35 The goal of this work was to
allow students to quickly and accurately identify and quantitate caffeine and theobromine
in high matrix food samples.
Lab Curriculum
The driving force behind creating this lab protocol was a desire to use the LC-MS
instrument in an undergraduate lab curriculum. Method development was focused on
student learning outcomes (see Table 1) for the triple quad LC-MS that allowed students
to understand its capabilities as compared to other instruments, such as the single quad
GC-MS. There are many unique factors that have to be taken into account when
designing labs for classroom use that are not necessarily factors in standard protocol
design in an analytic lab. One of the biggest issues is time constraints, in our case just

Araiza
Page 18 of 92
under three hours. This timeframe must be reasonably achievable by average upper
division undergraduate chemistry or biochemistry students and include sample
preparation as well as data collection if the samples are not stable between class
sessions. Writing of the lab manual can be challenging as you need all students to do
things correctly while asking them to draw on some material from lecture or background
reading. See Chapter 2 for student lab manual. For most students this is the first
introduction to this instrument so instructions for running the instrument must be very
clear, easy to follow, and reinforcing of the terminology seen in class. Students were
given a set of written instructions on how to use the instrument as well as a visual guide
identifying where to find things within the software program, see Chapter 3, and Chapter
4, allowing them to work independently with no other introduction to the instrument.
Table 1. Student learning outcomes for LC-MS lab
Student Learning Outcomes LC-MS Lab Perform the basic steps in operating the LC-MS following the student protocol. Identify the components of the LC-MS instrument.
Prepare samples for generation of a standard curve.
Run and analyze the fit of a standard curve using Single Quad, SIM, and MRM methods.
Run samples that have concentrations that fall above the linear region of the curve in the MRM
method and samples with concentrations too low to be analyzed using the single quad
methods.
Describe the advantages and disadvantages of using Single Quad, SIM, and MRM techniques
for the determination of analyte concentrations.

Araiza
Page 19 of 92
There are several great methods for undergraduate labs that have some
similarities to this project in the Journal of Chemical Education. The first by Stitzel and
Sours36 utilizes HPLC to determine the source of single-origin chocolates using
chemometrics. The samples were analyzed using UV detection at 274 nm and 300 nm.
Calibration curves where created using caffeine and theobromine standards along with a
constant internal standard of 7-(β-hydroxyethyl)theophylline for quantitative work. Three
other unidentified peaks were also noted, labeled as X1-X3, for the qualitative portion of
this experiment. One of the major downfalls of using UV detection is the peaks remain
unidentified structurally and are only assumed to be consistent based on retention times.
Problems with variability in caffeine concentrations caused the authors to suspect co-
elution of a peak with caffeine as well. Performing this lab on a LC-MS/MS, the
compounds labeled as X1-X3 for the chemometric analysis could be investigated further
in addition to the caffeine quantitation. With an extra class period this would be
fascinating to run on our instrument to determine what exactly the three to four unknown
peaks are. This could even be done as a dry-lab portion of the experiment. The other
drawback of this experiment is a time-consuming sample preparation needed to eliminate
interference from the solution matrix with the UV detector.
An article authored by Betts and Palkendo describes a similar type of experiment
introducing MRM with LC-MS/MS for an instrumental course.37 However, the analysis is
performed using caffeine, acetaminophen, and acetylsalicylic acid. These compounds
can be separated and quantified at the levels in the experiment using several other
commonly taught methods.38 In fact, we perform the same separation and quantification

Araiza
Page 20 of 92
using HPLC with UV detection. Though the authors explain the power of the LC-MS/MS
to the students within the experiment, it is demonstrated much more clearly using the two
compounds in this project, since they cannot be separated easily using the other
laboratory methods learned in the class thus far. In addition, their relative and absolute
concentrations are being determined at levels that are not possible with the techniques
they will have used thus far in the class.
Although these educational labs all have merit, when writing curriculum for an
instrumentation lab my focus is how to best explain the full capabilities and versatility of
the instrument. Using two compounds that are so similar really emphasizes the idea that
baseline separation is not required using MS/MS technique to do quantitative analysis.
Making calibration curves at concentrations below the µg/mL level also makes clear the
sensitivity of the instrument, while running at the mg/mL concentration for the qualitative
portion emphasizes the dynamic range. By doing a single filtration for sample preparation
this experiment also emphasizes specificity even in high matrix samples.
The development of this procedure was to quantify the amounts of caffeine and
theobromine levels in beers brewed with coffee or cocoa. Rip Current Brewing Java
Storm Coffee Imperial Porter was used during the method development phase for this
purpose. Many of the capabilities of the instrument where demonstrated by the
procedure that this experiment was then adapted to classroom use by substituting cocoa
samples for the beer. The combination of the two compounds of interest cannot be easily
analyzed using traditional HPLC because of chromatographic and UV overlap as well as
Araiza
Page 21 of 92
high matrix interference which requires extensive sample preparation to overcome. The
LC-MS/MS method on the other hand does not necessitate baseline
separation to quantify the concentrations of the individual compounds and can be
performed with rapid sample preparation. Using the MRM method, the portion on the
peak each compound is responsible for can be analyzed and integrated for
quantification. Although a significant amount of work for students could be decreased if
the standard solutions were pre-made by the instructional staff, mastery of serial dilutions
is an essential lab technique that cannot be reinforced enough. Also having students
start with a pure product and do the necessary dilutions to reach concentrations below 1
ppm makes it clear just how dilute these samples are. However, this is an area where
the lab can be shortened if desired. Beer samples were filtered and directly injected,
while cocoa samples were dissolved and diluted prior to being filtered and injected.
This experiment will be performed by undergraduate students at the end of the
instrumental analysis course typically taken during the final year. The next major task will
be assessing student learning of the unique capabilities of the LC-MS instrument and
determining if the instructions are clear enough to have students
achieve reproducible results. To assess the knowledge gained by students objectively a
survey style questionnaire will be used to gauge student understanding of related topics
and their confidence in those answers both before and after doing this lab. One set of
students completed the experiment and minor adjustments were made to the instructions
to better clarify points of confusion. Another aspect that was difficult was weighing out
such small quantities of the standards accurately with such small quantities of the caffeine

Araiza
Page 22 of 92
and theobromine to make the standards. The overall volume of the initial standard stock
solutions will have to be increased as the limit of solubility is close to our current value.
The original value was chosen as the cost of mass spec grade acetonitrile is high. Once
another full class of students have completed this activity the accuracy and precision of
the data will be analyzed to determine if student instructions need to be modified
further.
Methods
The analyses were performed on an Agilent Technologies 6410 Triple Quad
LC/MS, using an Agilent Technologies 1260 Infinity LC. The instrument uses a nitrogen
generator NM32LA from Peak Scientific. All samples were run using an Agilent C-18
column, 50 mm x 2.1 mm with 1.8 μm particle size. Three methods were developed for
this analysis Scan, SIM and MRM. All used the same final pump setting featuring a
sawtooth method, shown in Table 2, and had data collected from 0.1-6 minutes. A flow
rate of 0.3 mL/min was maintained throughout. An injection volume of 3.0 μL was
performed with an Agilent 1260 ALS auto-injector. For the MS, electrospray ionization
source was run on positive ion mode. Mass spectral data were collected with a
0.1 amu step size. The fragmentor was set to 135 volts, with the cell accelerator at 4
volts. For both the SIM and MRM methods the collision energy was 10%.

Araiza
Page 23 of 92
Table 2. Final pump gradient for all methods at 0.3 mL/min; A = water with 0.1% formic acid, B = ACN with 0.1% formic acid
The precursor ions were set at 181 m/z for theobromine, and 195
m/z for caffeine on the SIM mode. The pseudomolecular ion for both of these
compounds has been shown to be protonated at the position 9 nitrogen. Protonated
compounds seen in Figure 6 are a result of the interaction with the acid in the mobile
phase.
Figure 6. Protonated compounds resulting from interaction with acid in the mobile phase
Time (min) % A % B
0 95 5
1 95 5
3 5 95
4 95 5
5 5 95
6 95 5

Araiza
Page 24 of 92
While the transitions for the MRM were set at 181 138.1 m/z for theobromine and
195 138.1 m/z for caffeine. This primary fragmentation pattern is the result of a retro-
Diels Alder rearrangement corresponding to the loss of methyl isocyanate for caffeine
(Figure 7). The same fragmentation loss pattern occurs for theobromine to form
isocyanic acid, generating the same 138.1 m/z fragment.39
Figure 7. Retro-Diels Alder rearrangement resulting in fragment of 138 amu. R= CH3 for caffeine; R= H for theobromine
Reagents used include Fischer Optima LC/MS grade ACN with 0.1% formic
acid, and H2O with 0.1% formic acid. Diluent used for solutions was originally 95% H2O
with 0.1% formic acid, 5% ACN with 0.1% formic acid, but was increased to 10% ACN
to help with theobromine solubility. Acidified solvents are preferred for HPLC work as it
typically causes all of the compounds to be protonated resulting in a single sharp peak.
Without the acid present the peak can either become broad or even split between the
protonated and deprotonated species. This also has a secondary benefit of increasing
the extent of ionization of the compounds of the ESI source.

Araiza
Page 25 of 92
The final series of runs began with stock solutions of 8.5 mg caffeine diluted to
10.00 mL, and 3.3 mg theobromine diluted to 10.00 mL in volumetric flask. To make the
maximum concentration standard, 12 μL of caffeine stock and 30 μL of theobromine
stock were diluted in the same volumetric flask to 10.00 mL. The resulting concentration
of diluted stock was 1.02 ppm caffeine and 0.99 ppm theobromine. This diluted stock
solution was used to make the final standards. Caffeine was purchased
from Aldrich Chemical Company, and theobromine was purchased from Tokyo Chemical
Industry Co. Caffeine is readily soluble in water up to 0.11 M, while theobromine has very
low solubility in water listed at 1.8 mM. All samples were mixed with a Vortex mixer, but
theobromine samples required 5 minutes in a sonicator bath to dissolve completely. As
shown later, samples should be prepared the day of the analysis as accuracy decreases
over time especially if left at room temperature.
The single beer sample used thus far was Rip Current Brewing Java Storm Coffee
Imperial Porter. Cocoa samples were Hershey’s Cocoa Natural
Unsweetened, Almendra Blanca, El Carmen and Asochivite from Goodnow Farms,
Baking Cocoa, Drinking Chocolate from Equal Exchange and Nutella. All cocoa sample
were prepared by adding approximately 50 mg into 5.0 mL of water, warmed in a water
bath to dissolve and increase the solubility of methylxanthines.40 Nutella spread was
prepared by doing a liquid-liquid extraction with 0.1 g of the sample, 5.00 mL of each
Fischer HPLC grade isooctane and Fischer LCMS grade methanol. Bottom layer of
methanol was used for injection after diluting. The isooctane extraction ensured the C-
18 column would not be adversely affected. All food samples filtered using

Araiza
Page 26 of 92
0.45 μm PTFE eXtreme filter vial from Thomson Instrument Company. The low detection
limit that this instrument is capable of is necessary for this method as only a small amount
of coffee or chocolate is used in brewing beers. When testing undiluted
beer samples, the compounds of interest are typically below the 1 ppm level, while
samples such as brewed coffee or pure cocoa need to be diluted significantly.
Results and Discussion
Method development
The mass spectra from the SIM method of the individual standards seen in Figure
8 showing the expected values for both compounds, theobromine at 181 m/z and caffeine
at 195 m/z.
Figure 8. Mass spectrum at 10% collision energy for (a) theobromine showing a mass peak at 181.1 m/z and (b) caffeine with a peak at 195.1 m/z. Both have the same stable fragment at 138.1 m/z
Araiza
Page 27 of 92
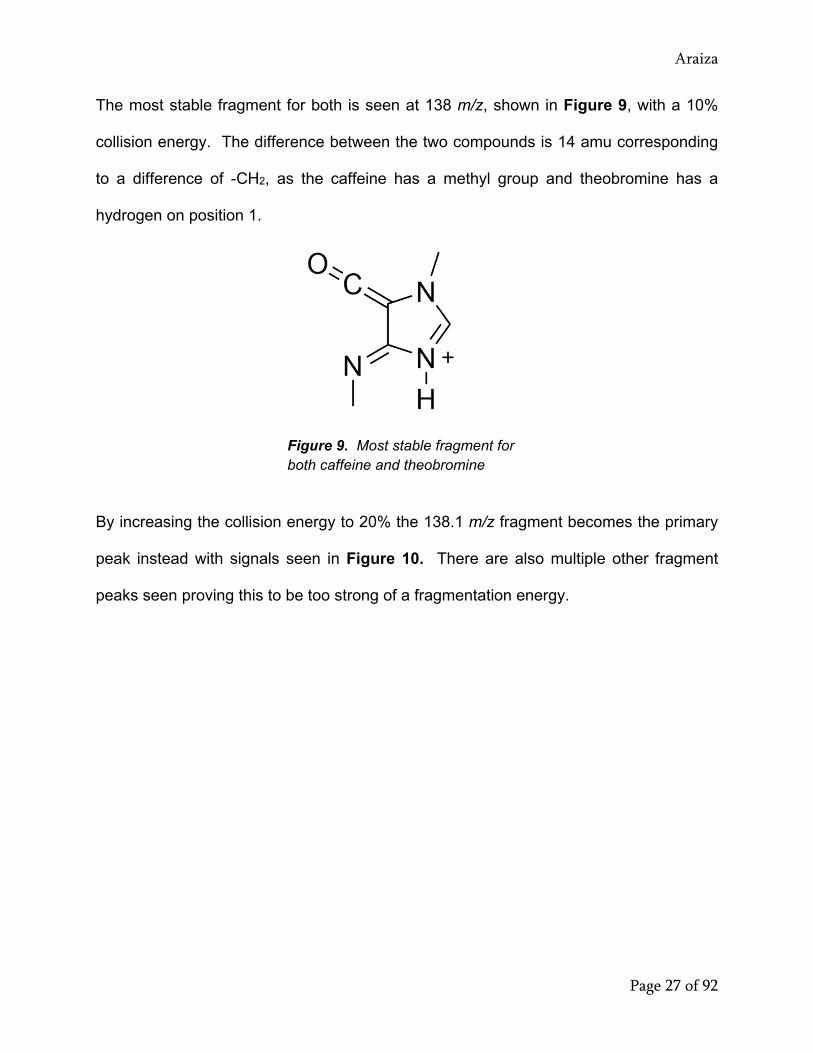
The most stable fragment for both is seen at 138 m/z, shown in Figure 9, with a 10%
collision energy. The difference between the two compounds is 14 amu corresponding
to a difference of -CH2, as the caffeine has a methyl group and theobromine has a
hydrogen on position 1.
Figure 9. Most stable fragment for both caffeine and theobromine
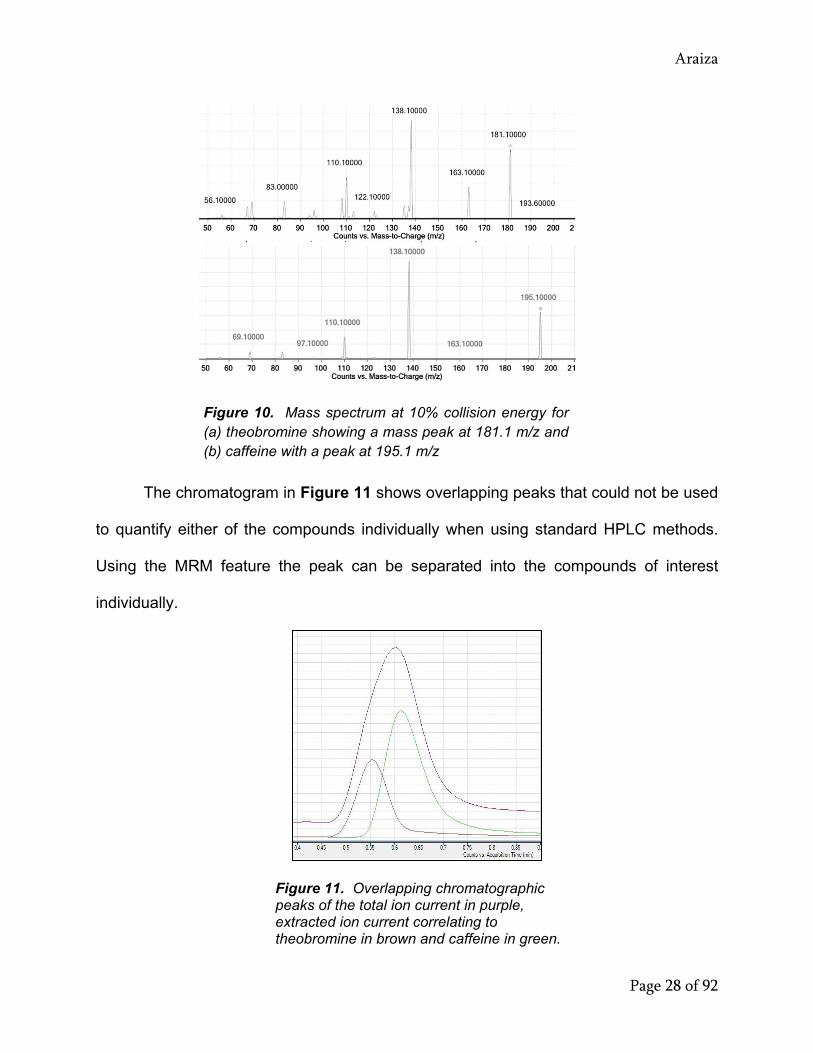
By increasing the collision energy to 20% the 138.1 m/z fragment becomes the primary
peak instead with signals seen in Figure 10. There are also multiple other fragment
peaks seen proving this to be too strong of a fragmentation energy.
Araiza
Page 28 of 92
Figure 10. Mass spectrum at 10% collision energy for (a) theobromine showing a mass peak at 181.1 m/z and (b) caffeine with a peak at 195.1 m/z
The chromatogram in Figure 11 shows overlapping peaks that could not be used
to quantify either of the compounds individually when using standard HPLC methods.
Using the MRM feature the peak can be separated into the compounds of interest
individually.
Figure 11. Overlapping chromatographic peaks of the total ion current in purple, extracted ion current correlating to theobromine in brown and caffeine in green.
Araiza
Page 29 of 92
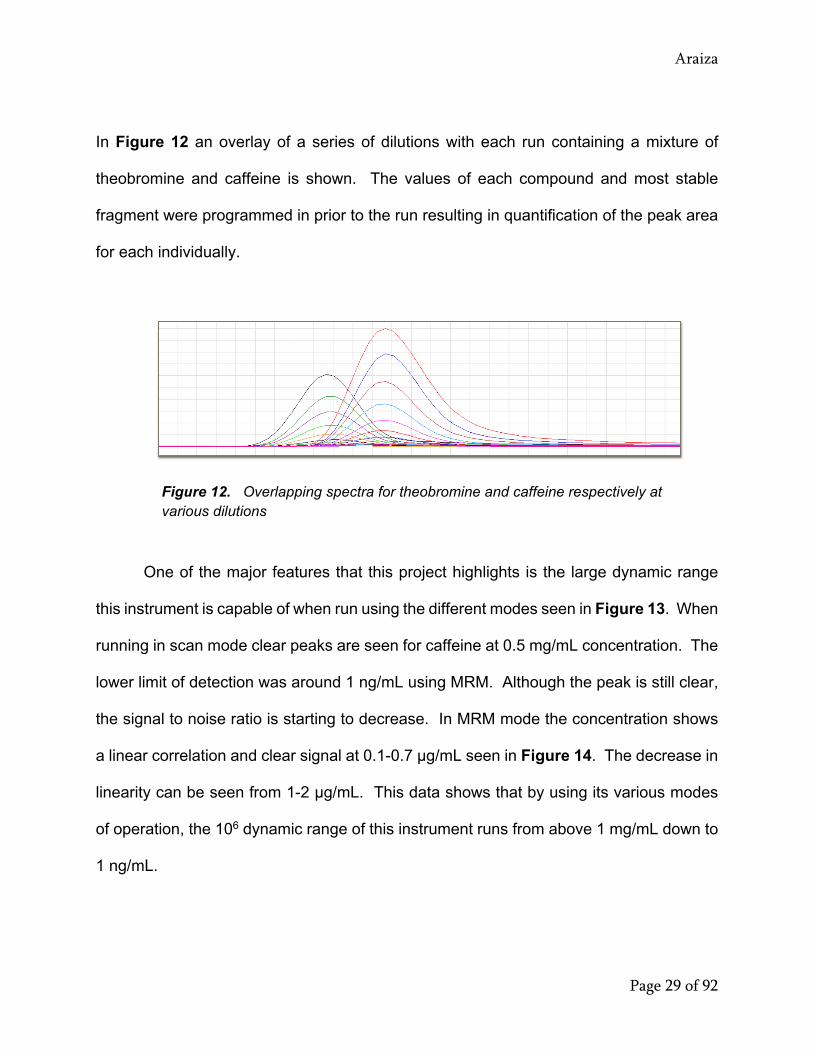
In Figure 12 an overlay of a series of dilutions with each run containing a mixture of
theobromine and caffeine is shown. The values of each compound and most stable
fragment were programmed in prior to the run resulting in quantification of the peak area
for each individually.
Figure 12. Overlapping spectra for theobromine and caffeine respectively at various dilutions
One of the major features that this project highlights is the large dynamic range
this instrument is capable of when run using the different modes seen in Figure 13. When
running in scan mode clear peaks are seen for caffeine at 0.5 mg/mL concentration. The
lower limit of detection was around 1 ng/mL using MRM. Although the peak is still clear,
the signal to noise ratio is starting to decrease. In MRM mode the concentration shows
a linear correlation and clear signal at 0.1-0.7 µg/mL seen in Figure 14. The decrease in
linearity can be seen from 1-2 µg/mL. This data shows that by using its various modes
of operation, the 106 dynamic range of this instrument runs from above 1 mg/mL down to
1 ng/mL.

Araiza
Page 30 of 92
Figure 13. Clear peak for caffeine at different concentrations (a) 0.5 mg/mL in Scan showing upper level of detection, and (b) at 1.2 ng/mL in MRM showing lower detection limit.
Figure 14. Calibration curves showing linearity from 0.1-0.7 µg/mL for both (a) theobromine and (b) caffeine, while the linearity drops at 1 and 2 µg/mL for both (c) theobromine and (d) caffeine.

Araiza
Page 31 of 92
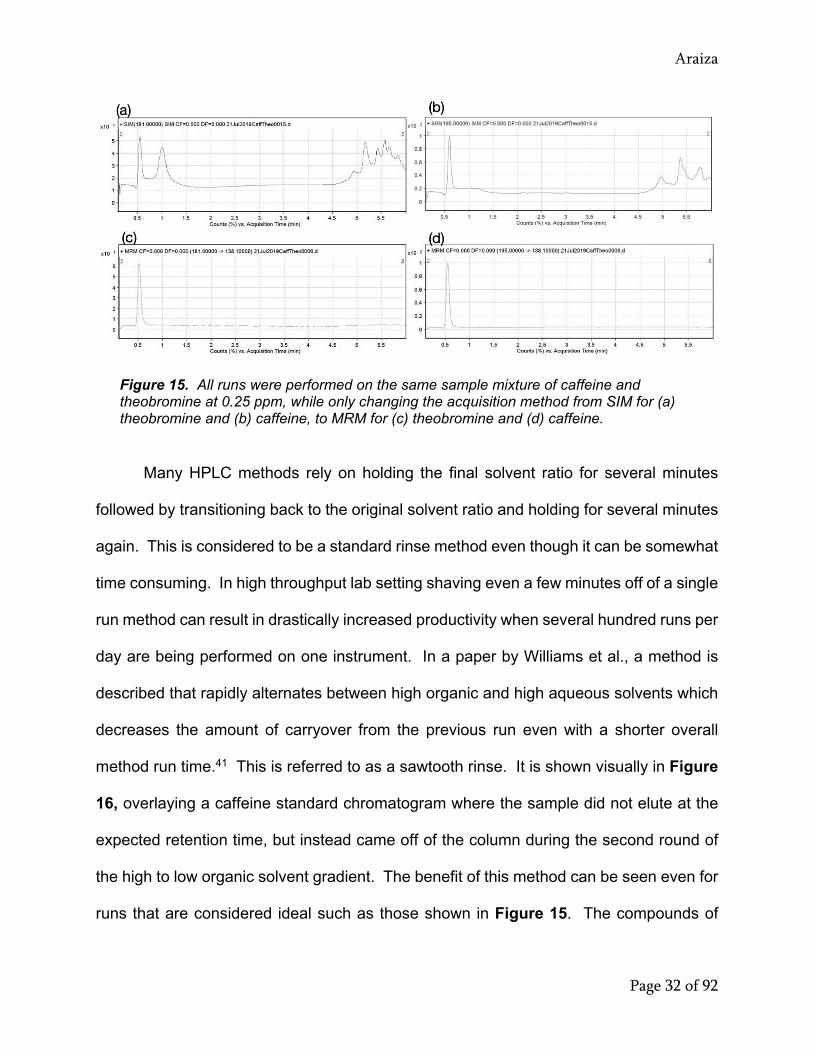
The set of data, Figure 8, shown in the introduction that compares the same
sample mixture run using the various methods also shows two other important points.
The difference between SIM and MRM in terms of specificity of a compound can be seen
clearly in both sets. In the Figure 15 chromatograms, (a) shows a clear peak at
approximately 0.5 minute as well as a peak at 1 minute, while for chromatogram (c) there
is only a signal peak at approximately 0.5 minute. In SIM mode (a) the signal is showing
not only for theobromine but all compounds that have a molecular weight or even a
fragment at 181 m/z, while the MRM mode (c) is specifically showing results for the
combined signal of 181 molecular weight with the primary fragment at 138. For both
chromatograms (a) theobromine and (b) caffeine in SIM mode, a cluster of peaks can be
seen from 4.5-6 minutes. These are not present in the corresponding chromatograms (c)
and (d) in MRM mode. These later peaks likely correlate to other methylxanthines beyond
theobromine and caffeine that either have molecular weights or fragments with molecular
weights of 181 or 195 amu respectively. This is because the specific transition
corresponding to the compounds of interest along with the specific fragmentation pattern
is not detected. The timing of these peaks’ correlates to the rinse cycle of the solvent
gradient.
Araiza
Page 32 of 92
Figure 15. All runs were performed on the same sample mixture of caffeine and theobromine at 0.25 ppm, while only changing the acquisition method from SIM for (a) theobromine and (b) caffeine, to MRM for (c) theobromine and (d) caffeine.
Many HPLC methods rely on holding the final solvent ratio for several minutes
followed by transitioning back to the original solvent ratio and holding for several minutes
again. This is considered to be a standard rinse method even though it can be somewhat
time consuming. In high throughput lab setting shaving even a few minutes off of a single
run method can result in drastically increased productivity when several hundred runs per
day are being performed on one instrument. In a paper by Williams et al., a method is
described that rapidly alternates between high organic and high aqueous solvents which
decreases the amount of carryover from the previous run even with a shorter overall
method run time.41 This is referred to as a sawtooth rinse. It is shown visually in Figure
16, overlaying a caffeine standard chromatogram where the sample did not elute at the
expected retention time, but instead came off of the column during the second round of
the high to low organic solvent gradient. The benefit of this method can be seen even for
runs that are considered ideal such as those shown in Figure 15. The compounds of

Araiza
Page 33 of 92
interest, caffeine and theobromine, both have retention times in agreement with previous
runs, but additional compounds that are not those of interest can be observed after the
4.5-minute mark.
Figure 16. Solvent gradient overlaid with caffeine analysis. Blue line represents acidified water, red line represents acidified acetonitrile. Caffeine peak eluting after second gradient cycle.
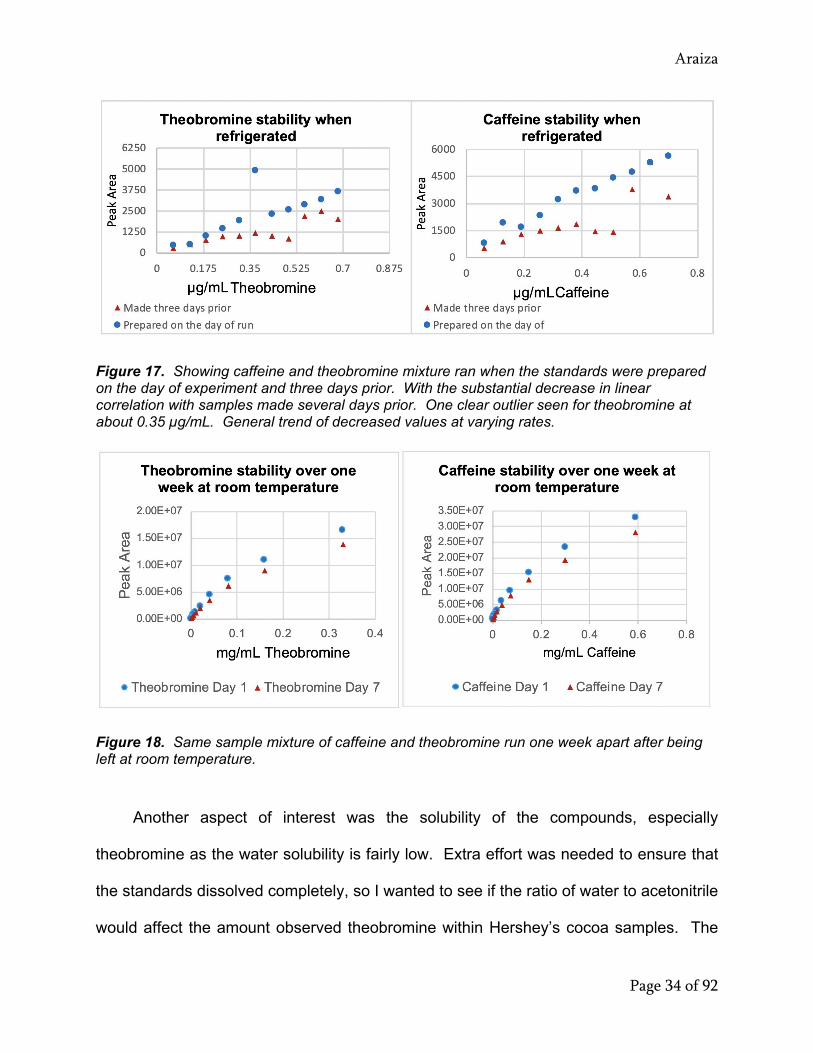
Samples made three days ahead and left in at approximately 4°C had significant
decreases in linear correlation values in comparison to dilutions tested on the day they
were prepared as seen in Figure 17. I was unsure if this variability was just a result of
the cold temperature during the storage as theobromine is not very soluble in water. A
mixture that was prepared and left at room temperature was tested and still showed a
decrease in linearity but without such great variability seen in Figure 18.
Araiza
Page 34 of 92
Figure 17. Showing caffeine and theobromine mixture ran when the standards were prepared on the day of experiment and three days prior. With the substantial decrease in linear correlation with samples made several days prior. One clear outlier seen for theobromine at about 0.35 µg/mL. General trend of decreased values at varying rates.
Figure 18. Same sample mixture of caffeine and theobromine run one week apart after being left at room temperature.
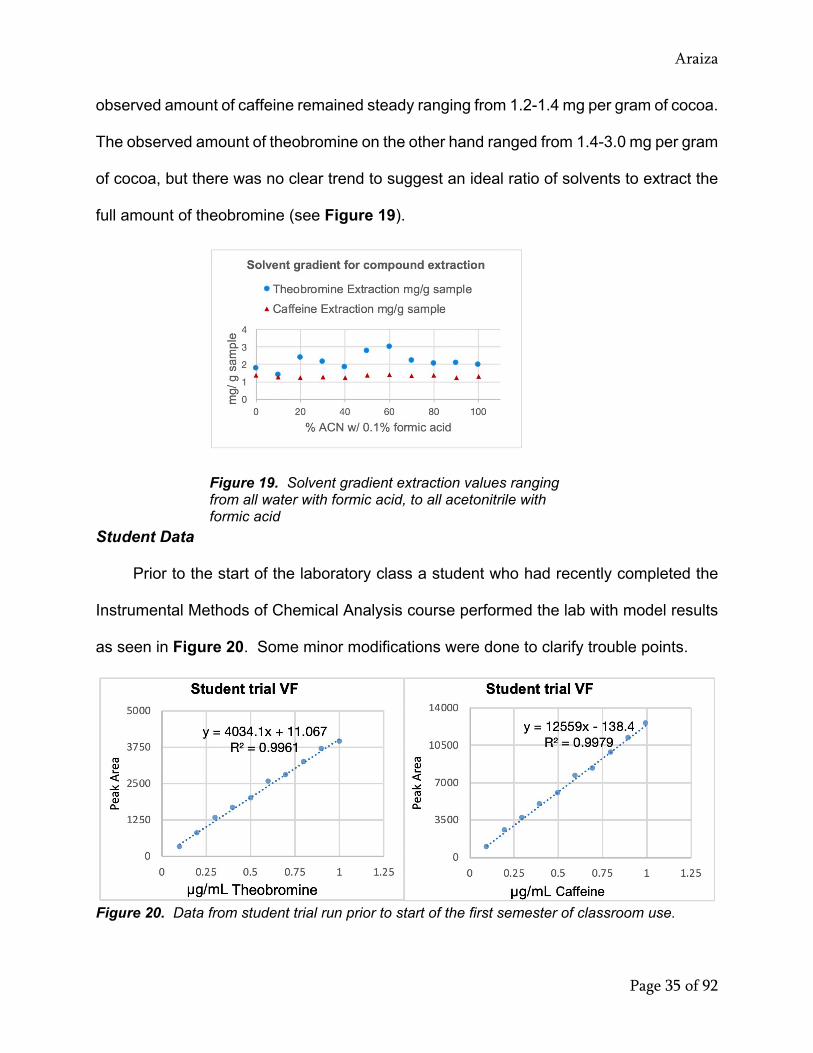
Another aspect of interest was the solubility of the compounds, especially
theobromine as the water solubility is fairly low. Extra effort was needed to ensure that
the standards dissolved completely, so I wanted to see if the ratio of water to acetonitrile
would affect the amount observed theobromine within Hershey’s cocoa samples. The
Araiza
Page 35 of 92
observed amount of caffeine remained steady ranging from 1.2-1.4 mg per gram of cocoa.
The observed amount of theobromine on the other hand ranged from 1.4-3.0 mg per gram
of cocoa, but there was no clear trend to suggest an ideal ratio of solvents to extract the
full amount of theobromine (see Figure 19).
Figure 19. Solvent gradient extraction values ranging from all water with formic acid, to all acetonitrile with formic acid
Student Data Prior to the start of the laboratory class a student who had recently completed the
Instrumental Methods of Chemical Analysis course performed the lab with model results
as seen in Figure 20. Some minor modifications were done to clarify trouble points.
Figure 20. Data from student trial run prior to start of the first semester of classroom use.

Araiza
Page 36 of 92
The experiment was successfully introduced to the first full class of students, and a
sampling of student data is shown in Figure 21. Calibration curves had high correlation,
but most groups had clear outliers that were excluded from the data sets.
Figure 21. Sample of student data from first semester of instructional use showing strong linear
correlation of calibration curves

Araiza
Page 37 of 92
There was also a large variability in the observed amount of the target compounds. This
could be due to the ratio of solvents used or possibly that the samples were refrigerated
after being prepared as students did not have sufficient time to prepare samples
themselves. For the next semester cocoa samples will be warmed in a water bath and
sonicated prior to use. Other adjustments made to the protocol after one semester of
student use will be only prepare and analyze four dilutions, but each will be run in
triplicates to address outliers more systematically.
Data Analysis Column failing has been shown to result in decreasing precision of low quantitative
levels. Trying to assess this variation, I ran single samples for four calibration points in
triplicate. The results are seen in Figure 22. This resulted in coefficient of variance
ranging from 0.2 up to 0.8 for the data sets. Once a new column is obtained this can be
looked into further.
Figure 22. Multiple runs performed on same sample vials of four dilution mixtures of theobromine and caffeine showing very poor precision.
Another issue that was identified after these experiments were performed was mixing of
acidic and basic mobile phases by another lab using the instrument. This can result on
salt accumulation on the column which can also affect precision.

Araiza
Page 38 of 92
The cocoa samples used from Goodnow Farms were ideal for method
development because they are single-origin chocolates, meaning all the cocoa beans
used are from a specific known region. The observed amounts of theobromine and
caffeine for the cocoa containing samples can be seen in Table 3. These cocoas are
from central America which typically average a 5 to 1 ratio of theobromine to caffeine.33
Nutella sources its cocoa from western Africa which typically has a higher ratio of
theobromine closer to 10 to 1, which is once again in agreement with what was found.
The only cocoa sample that is not falling in line with what is expected is Hershey’s cocoa
powder which is also sourced from western Africa. The value given in the table is an
average for the solvent ratio experiment which range from 1.1 to 2.1. These values fall
significantly below the expected ratios of the primary methylxanthines. The beer sample
used for method development, Java Storm, was determined to have about 0.2 mg
caffeine per 12 oz can. This value was in agreement with the volume and type of coffee
that the brewer used in the batch. This amount is significantly below what is suggested
to be noted on the food label. There was no detectable theobromine, which is reasonable
as the beer did not contain any cocoa.
Table 3. Calculated amounts of theobromine and caffeine in cocoa samples. For the Hershey’s sample average values from extraction experiment are shown
Caffeine mg/g sample
Theobromine mg/g sample
Ratio Theo.; Caff.
Goodnow Farms: Almendra Blanca 9.09 55.6 6.12
Goodnow Farms: El Carmen 22.5 81.5 3.62
Goodnow Farms: Asochivite 14.8 86.7 5.86
Nutella 10.5 97.2 9.26
Hershey’s unsweetened cocoa powder* 1.32 2.15 1.63

Araiza
Page 39 of 92
The high matrix nature of the food samples used was an intentional choice to
demonstrate the specificity of the method. The samples were diluted but no extractions
or other intensive preparations were performed. The aim is to link this idea to a broader
sense of the types of samples that could be used such as biological samples. Using MRM
to do the quantification excludes everything except the two compounds of interest. In
scan mode every compound remaining after filtration is detected and can be viewed in
two different modes, total ion current (TIC) or base peak current (BPC). The TIC view as
the name implies shows the sum of all of the ions indiscriminately, while the BPC view
limits the peak to the most intense compound signal at that time point. This results in
clear peaks correlating to single compounds but loses sight of the big picture. Many
people prefer the BPC view as it tends to appear less cluttered. Examples of this can be
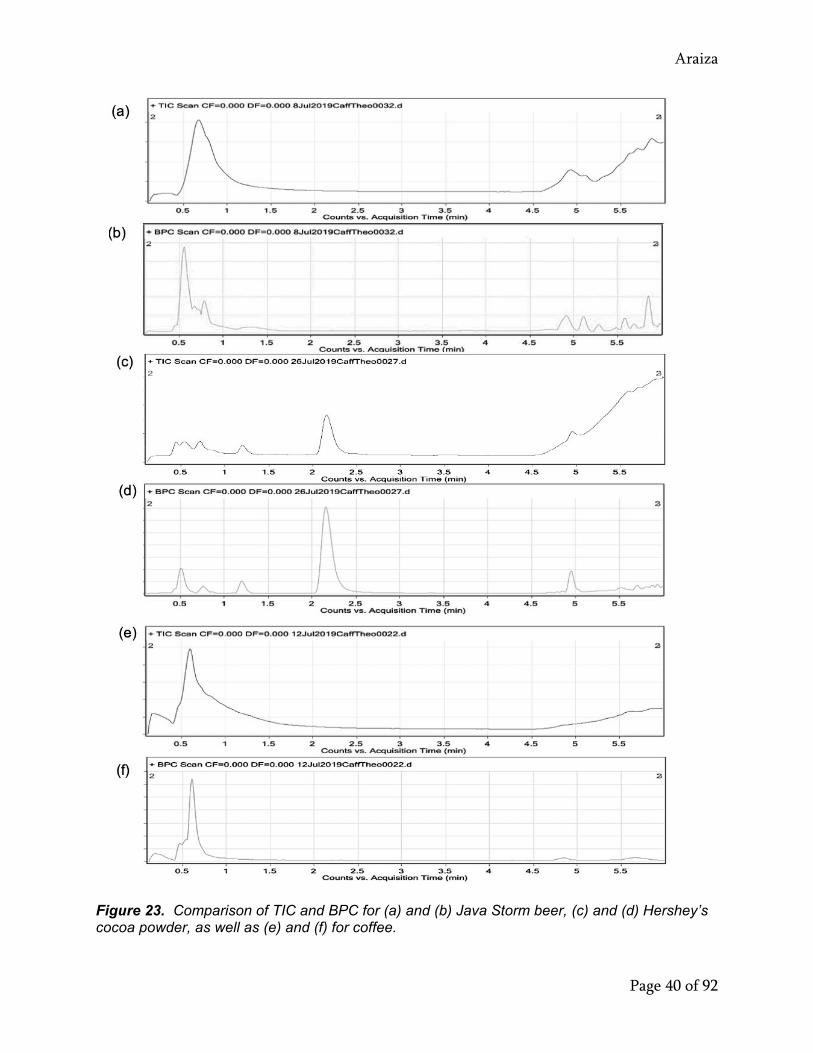
seen in Figure 23 with both TIC and BPC views of three of the food samples tested. One
thing to keep in mind when looking at all of these spectra is the rinse cycle from 4 to 6
minutes. The top set is of Java Storm beer with the strongest peak seen just after 0.5
minutes correlating to caffeine. During the rinse cycle six distinct peaks are seen in the
BPC view while these blend to one smaller broad peak and one mid-sized broad peak.
Spectra c and d correspond to the Hershey’s cocoa sample. Here the theobromine peak
has shifted between the 2- and 2.5-minute mark, while the caffeine still elutes at the
expected 0.5 minute. The thing to notice here is the distinct difference in what is seen
during the rinse cycle. The BPC has one small peak at about 5-minutes and a few very
small peaks just before the end making it seem like very little is coming off of the column
during the rinse cycle. In contrast the TIC of this run shows a very large peak starting at
Araiza
Page 40 of 92
Figure 23. Comparison of TIC and BPC for (a) and (b) Java Storm beer, (c) and (d) Hershey’s cocoa powder, as well as (e) and (f) for coffee.

Araiza
Page 41 of 92
4.5-minutes spanning to the end of the observed run indicating compounds with many
different molecular weights are eluting in high quantities. The last set, e and f, are for a
regular brewed coffee (Kirkland Signature Breakfast Blend) which is by comparison a
fairly low matrix sample. A strong peak for caffeine is seen at 0.5-minutes with little else
showing up on either view.
A last reminder to anyone doing instrumentation work is to run a blank of the solvent
which should always the first step in a protocol. The very first run when starting this
experiment resulted in a spectrum that was riddled with contaminants from about 5
minutes through the end at 9 minutes seen is Figure 24. The mobile phases were
changed, and the system was thoroughly rinsed in methanol. This eliminated these peaks
but had a blank not been run these contaminants would have affected all the runs.
Figure 24. Initial run of trial with many contaminants from 5 through 9 minutes Conclusion The first goal of this project was to develop an efficient method to analyze low
levels of caffeine and theobromine in beer samples. The resulting method was six

Araiza
Page 42 of 92
minutes long, with a single filtration of the sample and detection of analyte concentration
bellow µg/mL levels. Caffeine and theobromine proved to be ideal compounds to
demonstrate the low detection limit and dynamic range capabilities of the LC-MS/MS
system, allowing concentration determination even without significant spectroscopic
differences or chromatographic separation. This is in contrast to other common
techniques used in the instrumental lab, such as LC-UV and GC-MS. Methylxanthines
are difficult enough to separate that many methods mistakenly quantitate them together,
but the specificity of the QQQ allows independent integration of each compound even
without total separation. This led to the adaptation of the method for use in the
instrumental analysis classroom setting. Cocoa is an approachable natural product that
piques the interest of students and gives insight into real world samples in a manner that
is safe for a classroom setting. Cocoa has been well studied but the purpose of this
project was to showcase the versatility of an instrument that is becoming ubiquitous in
modern research settings. The curricular components that were developed establish
groundwork to demonstrate the unique features of the LC-MS/MS, such as the broad
dynamic range and specificity without reliance on spectroscopic differences. The method
can also be used to reinforce fundamentals such as dilutions and acid-base chemistry.
Multiple methods of data acquisition are introduced along with varied data analysis
perspectives along with a universal rinse method that can help reduce carry over on any
HPLC system. Once classes are able to use the instrument in person once again, the
proposed student learning outcomes can be assessed.
Araiza
Page 43 of 92
References
1) Aston, R. W. A Positive Ray Spectrograph. Phil. Mag. 1919, 38 (PI. IX.), 707–714.
2) Fenn, J. B.; Mann, M.; Meng, C. K.; Wong, S. F.; Whitehouse, C. M. Electrospray
Ionization for Mass Spectrometry of Large Biomolecules. Science 1989, 246
(4926), 64–71.
3) Draper, J.; Lloyd, A.; Goodacre, R.; Beckmann, M. Flow Infusion Electrospray
Ionization Mass Spectrometry for High Throughput, Non-Targeted Metabolite
Fingerprinting : A Review. Metabolomics 2012, 9, 4–29.
4) Han, J.; Danell, R. M.; Patel, J. R.; Gumerov, D. R.; Scarlett, C. O.; Speir, J. P.;
Parker, C. E.; Rusyn, I.; Zeisel, S.; Borchers, C. H. Towards High-Throughput
Metabolomics Using Ultrahigh-Field Fourier Transform Ion Cyclotron Resonance
Mass Spectrometry. Metabolomics 2008, 4, 128–140.
5) Giavalisco, P., Köhl, K., Hummel, J., Seiwert, B. & Willmitzer, L. 13C isotope-
labeled metabolomes allowing for improved compound annotation and relative
quantification in liquid chromatography-mass spectrometry-based metabolomic
research. Anal. Chem. 2009, 81, 6546–6551.
6) Gergov, M.; Ojanperä, I.; Vuori, E.; Simultaneous screening for 238 drugs in blood
by liquid chromatography–ionspray tandem mass spectrometry with multiple-
reaction monitoring. Journal of Chromatography B 2003, 795 , 41–53.
7) Chen, F.; Hu, Z.-Y.; Parker, R. B.; Laizure, S. C. ; Measurement of caffeine and its
three primary metabolites in human plasma by HPLC-ESI-MS/MS and clinical
application. Biomed. Chromatogr. 2017, 31 (6), UNSP e3900.

Araiza
Page 44 of 92
8) Ptolemy, A. S.; Tzioumis, E.; Thomke, A.; Rifai, S.; Kellogg, M.; Quantification of
theobromine and caffeine in saliva, plasma and urine via liquid chromatography–
tandem mass spectrometry: A single analytical protocol applicable to cocoa
intervention studies. J. of Chromatogr. B. 2010, 878 , 409–416.
9) Stock, N. L.; Martin, J. W.; Ye, Y.; Mabury, S. A.:Hands-On Electrospray
Ionization-Mass Spectrometry for Upper-Level Undergraduate and Graduate
Students. J. Chem. Educ. 2007, 84 (2), 310
11) Skoog, Douglas. Principles of Instrumental Analysis 5th edition. Brooks Cole 1997
12) Pura Naik, J.; Improved High-Performance Liquid Chromatography Method to
Determine Theobromine and Caffeine in Cocoa and Cocoa Products. J. Agric.
Food Chem. 2001, 49 (8), 3579–3583
13) Yamashita, M., Fenn, J.B.; Electrospray Ion Source. Another Variation on the
Free-Jet Theme. J. Phys. Chem. 1984, 88, 4451-4459
14) Walther, T. C.; Mann, M. Mass Spectrometry–Based Proteomics in Cell Biology.
J Cell Biol 2010, 190, 491–500.
15) München, F. B. H.; Beavo, J. A.; Busch, A.; Ganten, D.; Karlsson, J.-A.; Michel,
M. C.; Page, C. P.; Rosenthal, W. Methylxanthines, Handb. Exp. Pharmacol. 2011,
200

Araiza
Page 45 of 92
16) Latosinska,J. N.; Latosinska, M.; Olejniczak; G. A.; Topology of the Interactions
Pattern in Pharmaceutically Relevant Polymorphs of Methylxanthines (Caffeine,
Theobromine, and Theophiline), Combined Experimental (1H–14N Nuclear
Quadrupole Double Resonance) and Computational (DFT and Hirshfeld-Based)
Study. J. Chem. Inf. Model 2014, 54, 2570–2584.
17) Mattila, M. J.; Interactions of Benzodiazepines on Psychomotor Skills. Br J Clin
Pharmacol 1984, 18 (Suppl 1), 21S-26S.
18) Ghosh, A. K.; Ghosh, C.; Gupta, A.; A Simple Approach to Detect Caffeine in Tea
Beverages. J. Agric. Food Chem. 2013, 61, 3814–3820
19) Tran, N. L.; Barraj, L. M.; Bi, X.; Jack, M. M. Trends and Patterns of Caffeine
Consumption among US Teenagers and Young Adults, NHANES 2003–
2012. Food Chem. Toxicol. 2016, 94, 227–242.
20) Evans, J.; Richards, J. R.; Battisti, A. S. Caffeine.
In StatPearls; StatPearls Publishing: Treasure Island (FL), 2019.
21) Reissig, C. J.; Strain, E. C.; Griffiths, R. R. Caffeinated Energy Drinks—A Growing
Problem. Drug and Alcohol Dependence 2009, 99 (1–3), 1–10.
22) Choi, E. J.; Bae, S. H.; Park, J. B.; Kwon, M. J.; Jang, S. M.; Zheng, Y. F.; Lee, Y.
S.; Lee, S.-J.; Bae, S. K. Simultaneous Quantification of Caffeine and Its Three
Primary Metabolites in Rat Plasma by Liquid Chromatography–Tandem Mass
Spectrometry. Food Chem. 2013, 141 (3), 2735–2742.
23) Thomas, J. B.; Yen, J. H.; Schantz, M. M.; Porter, B. J.; Sharpless, K. E.
Determination of Caffeine, Theobromine, and Theophylline in Standard Reference

Araiza
Page 46 of 92
Material 2384, Baking Chocolate, Using Reversed-Phase Liquid
Chromatography. J. Agric. Food Chem. 2004, 52, 3259–3263.
24) Lisko, J. G.; Lee, G. E.; Kimbrell, J. B.; Rybak, M. E.; Valentin-Blasini, L.; Watson,
C. H.; Caffeine Concentrations in Coffee, Tea, Chocolate, and Energy Drink
Flavored E-Liquids. Nicotine Tob Res 2017, 19, 484–492.
25) Zandvliet, A. S.; Huitema, A. D. R.; Jonge, M. E. D.; Hoed, R. D.; Sparidans, R.
W.; Hendriks, V. M.; Brink, W. V. D.; Ree, J. M. V.; Beijnen, J. H. Population
Pharmacokinetics of Caffeine and Its Metabolites Theobromine, Paraxanthine and
Theophylline after Inhalation in Combination with Diacetylmorphine. Basic Clin.
Pharmac. 2005, 96, 71–79.
26) Camps-Bossacoma, M.; Garcia-Aloy, M.; Salana-Ruiz, S.; Cambras, T.;
Gonzalez-Domingues, R.; Franch, A.; Perez-Cano, F.J.; Andres-Lacueva, C.;
Castell, M. Role of Theobromine in Cocoa’s Metabolic Properties in Healthy Rats.
J. Agric. Food Chem. 2019, 67, 3605– 3614
27) Finlay, F.; Guiton, S. Chocolate Poisoning. BMJ 2005, 331, 633.
28) Bispo, M. S.; Veloso, M. C. C.; Pinheiro, H. L. C.; De Oliveira, R. F. S.; Reis, J. O.
N.; De Andrade, J. B. Simultaneous Determination of Caffeine, Theobromine, and
Theophylline by High-Performance Liquid Chromatography. J. Chromatogr. Sci.
2002, 40, 45–48.
29) Ashihara, H.; Crozier, A.; Biosynthesis and Catabolism of Caffeine in Low-
Caffeine-Containing Species of Coffea. J. Agric. Food Chem. 1999, 47, 3425–
3431.

Araiza
Page 47 of 92
30) Ptolemy, A. S.; Tzioumis, E.; Thomke, A.; Rafai, S.; Kellogg, M. Quantification of
theobromine and caffeine in saliva, plasma and urine via liquid chromatography–
tandem mass spectrometry: A single analytical protocol applicable to cocoa
intervention studies. J. Chromotogr. B 2010, 878, 409-416
31) Tokusoglu, Ö.; Ünal, K. Optimized Method for Simultaneous Determination of
Catechin, Gallic Acid, and Methylxanthine Compounds in Chocolate Using RP-
HPLC. European Food Research and Technology 2002, 215, 340–346.
32) Shingler, A. J.; Carlton, J. K.; Method for Separation and Determination of
Theophyllin, Theobromine, and Caffeine. Anal. Chem. 1959, 31, 1679–1680.
33) Oellig, C.; Schunck, J.; Schwack, W.;Determination of caffeine, theobromine and
theophylline in Mate beer and Mate soft drinks by high-performance thin-layer
chromatography. J. Chromatogr. A 2018, 1533, 208–212.
34) Zoumas, B. L.; Kreiser, W. R.; Martin, R. Theobromine and Caffeine Content of
Chocolate Products. Journal of Food Science 1980, 45, 314–316.
35) Rojo De Camargo, M. C.; Toledo, M. C. F.; HPLC determination of caffeine in tea,
chocolate products and carbonated beverages. J Sci Food Agric 1999, 79, 1861-
1864
36) Stitzel, S. E.; Sours, R. E.; High-Performance Liquid Chromatography Analysis of
Single-Origin Chocolates for Methylxanthine Composition and Provenance
Determination. J. Chem. Educ. 2013, 90, 1227–1230.
37) Betts, T. A.; Palkendo, J. A.; Teaching Undergraduates LC–MS/MS Theory and
Operation via Multiple Reaction Monitoring (MRM) Method Development. J Chem
Ed 2018, 95, 1035–1039.

Araiza
Page 48 of 92
38) Fenk, C. J.; Hickman, N. M.; Fincke, M. A.; Motry, D. H.; Lavine, B. Identification
and Quantitative Analysis of Acetaminophen, Acetylsalicylic Acid, and Caffeine in
Commercial Analgesic Tablets by LC−MS. J. Chem. Educ. 2010, 87, 838–841.
39) Bianco, G.; Abate, S.; Labella, C.; Cataldi, T. R. I. Identification and fragmentation
pathways of caffeine metabolites in urine samples via liquid chromatography with
positive electrospray ionization coupled to a hybrid quadrupole linear ion trap
(LTQ) and Fourier transform ion cyclotron resonance mass spectrometry and
tandem mass spectrometry. Rapid Commun. Mass Spectrom. 2009, 23, 1065-
1074.
40) Zhong, J.; Tang, N.; Asadzadeh, B.; Yan, W. Measurement and Correlation of
Solubility of Theobromine, Theophylline, and Caffeine in Water and Organic
Solvents at Various Temperatures. J. Chem. Eng. Data 2017, 62, 2570–2577.
41) Williams, J. S.; Donahue, S. H.; Gao, H.; Brummel, C. L.; Universal LC-MS Method
for Minimized Carryover in a Discovery Bioanalytical Setting. Bioanalysis. 2012, 4,
1025–1037.
Araiza
Page 49 of 92
Chapter 2: Student Lab Protocol
Chem 416: LC-MS/MS Caffeine and Theobromine
Background
Many modern research labs utilize liquid chromatography-tandem mass
spectrometry, or LC-MS/MS, to analyze mixtures in both qualitative and quantitative
capacities. Traditional HPLC work relies on the use of a known compound being
injected then retention times are referenced. Tandem mass spectrometry is so
powerful because the compounds can be clearly identified not only using the molecular
weight, but also identifying the unique fragmentation pattern. This technique is called
Multiple Reaction Monitoring (MRM). In the first quadrupole, ions are isolated by
molecular weight. The collision cell, Q2, traps those ions and fragments them with an
inert gas. The third quadrupole sorts the fragments by mass. This three-step process
allows for incredibly low detection limits by actively eliminating noise. The ionization
mode for this instrument is Electro Spray Ionization (ESI). This adds an H+ to the
compound resulting in a pseudo-molecular ion that shows a mass one m/z higher than
the molecular weight for each H+ that is added.

Araiza
Page 50 of 92
In this lab you will be looking at two compounds, caffeine and theobromine.
Both are stimulants commonly found in foods; coffee and chocolate primarily. You will
use the instrument in two ways, first as a single quad running in scan mode which will
qualitatively show what compounds are present. This is similar to work you have done
on the GC-MS using a single quadrupole. Then, you will use the MRM mode to
quantify the amount of these two compounds in a drink sample.

Araiza
Page 51 of 92
The MRM method is set up with the ions of interest as well as
the fragments. This information is obtained by doing a Selective
Ion Mode (SIM) run. The following scans are SIM runs with 10%
collision energy. As you can see the molecular ion is one mass
unit higher than the mass of the compound. Both of
these compounds have the same ion fragment. This isn’t
surprising considering how similar the structures are that the
most stable fragment is identical.
Procedure
Solvents: A = Water w/ 0.1% Formic Acid and B = ACN w/ 0.1% Formic Acid
1. Prepare 80 mL of diluent with LCMS grade solvents at a concentration of 50:50
mass spec grade Water w/ 0.1% Formic Acid and ACN w/ 0.1% Formic Acid by
volume. This solution will be used for all dilutions in this experiment.
2. Add approximately 0.5 mL of diluent to an empty LC vial to run prior to the other
samples to ensure there are no contaminants. Follow instrument instructions to on
pumps and source. Create a folder for your group within the specific class folder.
Make sure you record file names and pathway so you can get to the data again
later. If the chromatogram looks clean proceed to next step. If peaks appear, alert
your instructor and proceed accordingly.
Most stable fragment for both caffeine and theobromine

Araiza
Page 52 of 92
3. Prepare approximately 0.5 mg/mL solutions of caffeine and theobromine in a 25.
00 mL volumetric flask separately. Ensure both are completely dissolved before
moving on. Samples will need to be sonicated, especially theobromine, and both
should be mixed using Vortex mixer.
Table 1: Stock Solutions
Exact mass (g) in 25.00 mL Concentration ppm
Caffeine
Theobromine

Araiza
Page 53 of 92
4. Add 0.5 mL of each 0.5 mg/mL stock solution to the same LC vial for the
qualitative analysis of the mixture.
5. Quantitative work for this instrument can be performed at much lower
concentrations. Prepare a diluted stock containing both caffeine and
theobromine at approximately 1 ppm each in a 10.00 mL volumetric flask.
Using micropipettes prepare 4 standard solutions with final concentrations at
approximately 0.1, 0.3, 0.5 and 0.7 ppm directly in the LC vials with a final
volume of 1 mL.
Table 2: Standard Solutions for Calibration Curve
Diluted Stock Total Volume 10.00 mL
Volume stock solution added Concentration ppm
Caffeine
Theobromine
Standard* Volume diluted stock Volume diluent Caffeine ppm Theobromine
ppm A
B
C
D
*total volume = 1 mL
6. Prepare your two assigned unknown samples by transferring about 1 mL of each
solution into LC vials equipped with an internal filter. Unknown samples will be
prepared in advance of the experiment with the dilution factors provided. Pipette

Araiza
Page 54 of 92
each unknown sample into a filter vial up to the “fill” line. Press the filter cap down
slowly until the filter touches the bottom of the vial.
7. You should have prepared a total of seven LC vials containing a 50:50 mixture
sample at high concentration; 4 standard solutions (0.1 – 0.7 ppm); and 2 unknown
solutions. Place each of these vials into sample positions 1 – 7 inside the LCMS.
8. On the instrument, set up a worklist for all of your samples, making sure to select
the folder you created earlier with the date under the correct 416 data path for your
class. Use the 416CaffeineScan and 416CaffeineMRM methods as appropriate.
The first sample is the theobromine and caffeine mixture at 0.25 mg/mL. You should
use the 416CaffeineScan method for analyzing this sample. Run the
theobromine and caffeine mixture twice. Mark the first mixture sample as a “pre-
run”. Ignore this pre-run data when analyzing the data set later. The scan mode will
identify the two compounds of interest as well as the mass
of each compound and the most stable fragment.
9. Use the 416CaffeineMRM method for your remaining 4 standard solutions and 2
unknown solutions, with each run three time. You will inject from the same vial
multiple time, do not prepare three vials of the same concentrations. These samples
are significantly less concentrated and require the MRM mode to quantify the
amounts of caffeine and theobromine present.
Araiza
Page 55 of 92
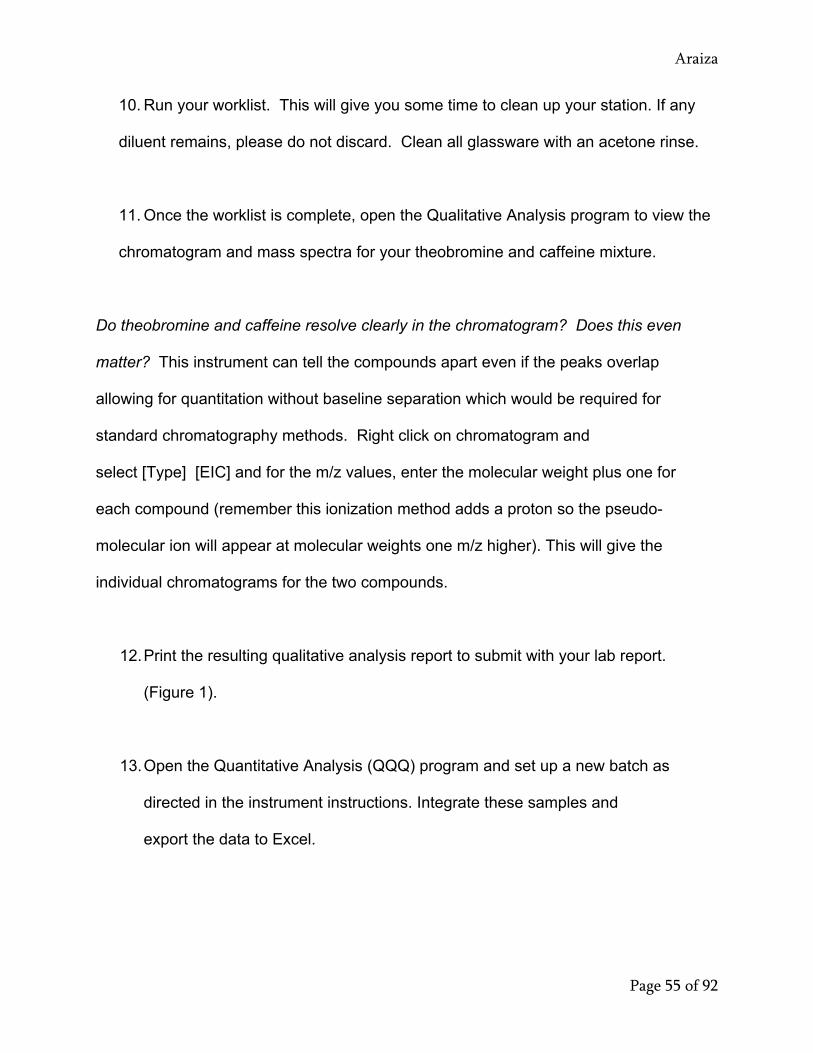
10. Run your worklist. This will give you some time to clean up your station. If any
diluent remains, please do not discard. Clean all glassware with an acetone rinse.
11. Once the worklist is complete, open the Qualitative Analysis program to view the
chromatogram and mass spectra for your theobromine and caffeine mixture.
Do theobromine and caffeine resolve clearly in the chromatogram? Does this even
matter? This instrument can tell the compounds apart even if the peaks overlap
allowing for quantitation without baseline separation which would be required for
standard chromatography methods. Right click on chromatogram and
select [Type] [EIC] and for the m/z values, enter the molecular weight plus one for
each compound (remember this ionization method adds a proton so the pseudo-
molecular ion will appear at molecular weights one m/z higher). This will give the
individual chromatograms for the two compounds.
12. Print the resulting qualitative analysis report to submit with your lab report.
(Figure 1).
13. Open the Quantitative Analysis (QQQ) program and set up a new batch as
directed in the instrument instructions. Integrate these samples and
export the data to Excel.

Araiza
Page 56 of 92
14. Using Excel add columns for concentrations of both Caffeine and Theobromine.
Plot two calibration curves graphing Area versus Concentration. Add the linear
trend line and display the equation of the line and the R2 value. Print and submit
graphs (including numerical data) with the final lab report (Figures 2 and
3). Report standard deviation for each of the standards three runs.
15. Using the equation of the line, calculate and report the concentration of
theobromine and caffeine in your unknown sample.
16. With the information on the unknown label calculate the amount of theobromine
and caffeine in each gram of chocolate sample.
Please sign out of logbook. If you are the last group to use the LCMS for the
day, then make sure you turn off the pumps and put the instrument on Standby
mode before leaving.
Post Lab Questions:
1. What is meant by normal phase and reverse phase chromatography? Which
type are you using in this experiment?
2. Separation by liquid chromatography is based primarily on the polarity of
compounds. Take another look at the theobromine and caffeine structures, could
you reasonably get baseline separation of these two peaks? If yes, suggest an
experiment modification to make this happen.

Araiza
Page 57 of 92
3. What is the concentration of theobromine and caffeine in the 50:50 mixture you
prepared for the single quad analysis (qualitative scan mode)? How does this
concentration compare to samples used in the triple
quad analysis (quantitative MRM mode)?
4. Why is the molecular ion one mass unit higher when using this instrument in
comparison to the GCMS used semester?
5. The other common methylxanthine is theophylline which has the same molecular
weight as theobromine. How would you be able to differentiate these two
compounds using the methods learned in this lab?
Bonus: The last methylxanthine is paraxanthine, could this be easily
differentiated from theobromine and theophylline? Explain why or why not.

Araiza
Page 58 of 92
Chapter 3: Instrument Operation Procedure
Agilent 6410 LC-MS/MS Student User Guide
Data Acquisition
1) Log into book
2) Log into computer
3) Open [Data Acquisition]
4) Under “Method Editor” window click [open method] *open folder icon
5) Load the 416CaffeineScan (or whatever method needed)
6) Click on green dot in “Quat. Pump” window to start pumps
7) Let run for at least 10 minutes prior to any sample injection
8) Click on the green dot for “MWD” to warm up detector lamps
9) Click on [Sample Run] tab at the very bottom of the window
10) Fill in sample information
a) Name
b) Vial position
c) Comment (this will print and be saved with the file, so solvent information or any
other notes that may come in handy in the future)
d) File name
i) Should always start with the date in the format [XXMon2019] ie day, 3
letter month, year
ii) Followed by your initials
e) Then sample information or data set name

Araiza
Page 59 of 92
11) Just above this is a box that can be check “Auto Increment”. If it is checked the
program will automatically give a 4-digit value at the end of your file name and
increase by one with each run. If your file ends with a number this box being
checked will increase this number by one
12) Sample ID (is usually the same as sample name unless you are running duplicates
then assign numbers/letters)
13) Operator Name (your last name)
14) Select path {Data} {416} {year} {class section}
15) Click the [Start Sample Run] **play icon
16) When run is complete a pop-up window will appear indicating “Run complete”
17) Click [View Data] next to file name
18) OR open Qualitative Analysis program from desktop and load data file
19) When run(s) is/are complete, turn pumps off by clicking the red button in the pump
control window at the top of the screen. Then exit out of the Data Acquisition
program. A popup will appear asking if you want to put instrument on Standby
mode, select “yes”
How to set up Worklist
1) Select “Worklist” tab at bottom of screen
2) Type in Name of first sample (use your initials to identify set “XX Mix A”)
3) Sample position (autosampler tray has numbers at the front to identify first slot in
that row)
4) Method [416CaffeineMRM.m]

Araiza
Page 60 of 92
5) Data file; click the suspension point (…)
6) Under the 416_Caffeine folder create new folder with today’s date with the following
format [15Jun2019]
7) Select this folder
8) Then type name of sample set starting with your initials [XX15Jun2019_0001]
9) Right click on line one
10) Click “Add sample” in the new popup menu
11) Change the sample name
12) Change the Sample position number
13) The Data File should automatically increase by one as the samples are added
14) Once all samples have been added select the “play” triangle
15) Additional samples can be added to worklist once it had started if needed
Qualitative Analysis
1) Open Qualitative Analysis program from desktop
2) Load data file
3) Right click on Chromatogram
4) Select [Extract Chromatogram]
5) Under “Type” select
a) [TIC] to see full view of chromatogram collected
b) [BPC] is looking at strongest compound’s peaks in sample
c) [EIC] if using scan method and known compound(s) is/are being looked for
i) For “m/z values” type in mass(s) of compounds

Araiza
Page 61 of 92
d) [MRM] if MRM method was used or [SIM] if SIM method was used
i) If using MRM or SIM select these as “Type” m/z values will automatically load
from run method
6) Check box’s for desired chromatograms in “Data Navigator” window so only
chromatograms of interest are showing
7) To print:
a) [File]
b) [Print]
c) [Analysis Report]
d) [OK]
e) PDF version will pop up,
i) click on printer icon to print
ii) save file as PDF on a removable drive
Quantitative Analysis
1) Open Qualitative Analysis program from desktop
2) Select [New Batch] under [File]
3) Give batch a name (typically the data set name works XX15Jun2019)
4) [Open]
5) A new screen will pop-up, select [Browse to Copy Samples]
6) Select all samples that are part of this Data set (MRM and SIM will be analyzed
separately)
7) [Open]

Araiza
Page 62 of 92
8) Highlight correct samples
9) [OK]
10) Click on the first line of the Sample table so that it is highlighted
11) Select [Method]
12) [Open]
13) [Open Method from Existing file]
14) [416Caffeine.m]
15) [Open]
16) Chromatogram will appear from selected sample
17) Double click on peak to show mass spec data
18) Click on spectra so that the blue arrow is at the top of the peak of interest
19) Right click and select [New Compound]
20) In the upper section a new line will appear with this mass value and the retention
time of the original peak chosen. Fill in the name of the compound
21) Do this until you have identified all known compounds present in sample
22) In the left column select the red [Exit] under “Save / Exit”
23) Make sure “Integrate” is selected and click [Yes]
24) [File]
25) [Export table] to Excel
26) Finish analyzing data using Excel

Araiza
Page 63 of 92
Chapter 4: Visual Instrument Operation Guide
By Robyn Araiza, Nicholas Klein & Quynh Nguyen Wong
Agilent 6410 LC-MS/MS Student User Guide

Araiza
Page 64 of 92
SIGN EQUIPMENT LOGBOOK Log into the computer with Username: Password:

Araiza
Page 65 of 92
Section 1: Data Acquisition
Double click to open [Data Acquisition]

Araiza
Page 66 of 92
Click [Open Method] to load your method
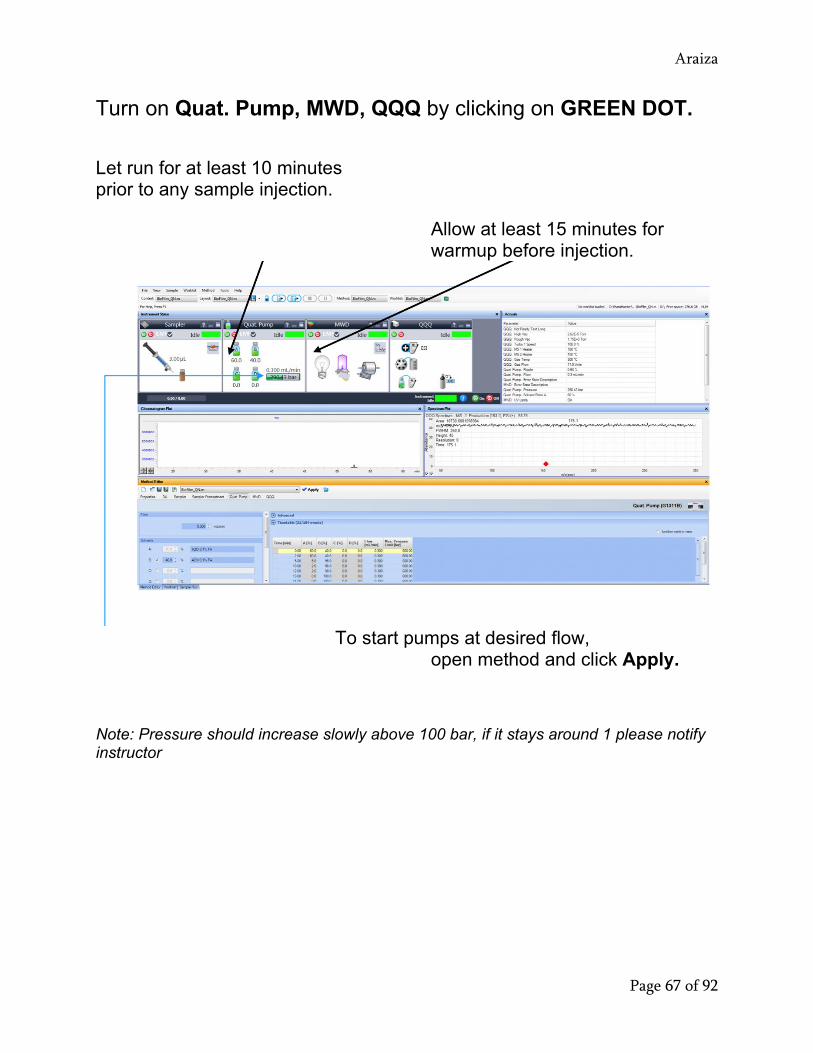
Araiza
Page 67 of 92
Turn on Quat. Pump, MWD, QQQ by clicking on GREEN DOT. Let run for at least 10 minutes prior to any sample injection.
Allow at least 15 minutes for warmup before injection.
To start pumps at desired flow, open method and click Apply.
Note: Pressure should increase slowly above 100 bar, if it stays around 1 please notify instructor

Araiza
Page 68 of 92
Select [Sample Run]

Araiza
Page 69 of 92
Fill in sample information Name Vial position Comment (This will print and be saved
with the file, so solvent information or any other notes that may come in handy in the future).
Sample ID (the same as sample name unless you are running duplicates then assign numbers/letters). Operator Name (your last name).
Choose where to store your data. For Chem 416 lab, select path D:\MassHunter\Data\416_Caffeine\416DayTerm
Give your Data File a name The “Auto Increment” box can be checked. If it is checked, the program will
automatically give a 4-digit value at the end of your file name and increase by one with each run.
If your file name ends with a number, do not check this box.
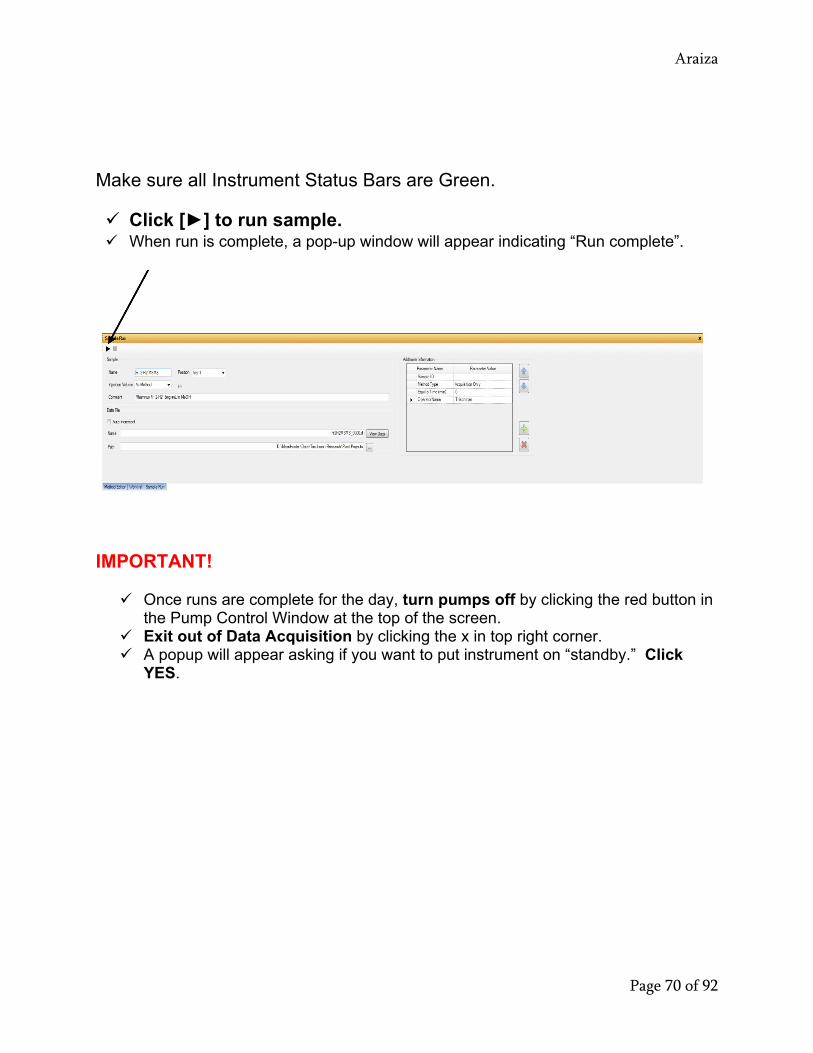
Araiza
Page 70 of 92
Make sure all Instrument Status Bars are Green. Click [►] to run sample. When run is complete, a pop-up window will appear indicating “Run complete”.
IMPORTANT! Once runs are complete for the day, turn pumps off by clicking the red button in
the Pump Control Window at the top of the screen. Exit out of Data Acquisition by clicking the x in top right corner. A popup will appear asking if you want to put instrument on “standby.” Click
YES.

Araiza
Page 71 of 92
Section 2: How to set up Worklist
Select [Worklist]

Araiza
Page 72 of 92
Fill in the information Sample name (use your initials to identify set “XX Mix A”) Sample position (Vial 1 or where you positioned your first sample) Method (416CaffeineMRM.m) Data File (click the suspension point “…”)

Araiza
Page 73 of 92
Under the 416_Caffeine folder select sub folder for your class section, create
new folder with today’s date with the following format 15Jun2019 Select this folder Then type name of sample set starting with your initials XX15Jun2019_000

Araiza
Page 74 of 92
Right click on line one Click “Add Sample” in the new popup menu

Araiza
Page 75 of 92
Change the sample name Change the sample position number The Data file should automatically increase by one as the samples are added
Once all samples have been added, Click [►] to start worklist run. Additional samples can be added to worklist once it has started if needed.

Araiza
Page 76 of 92
Section 3: Qualitative Analysis
Double click to open [Qualitative Analysis]
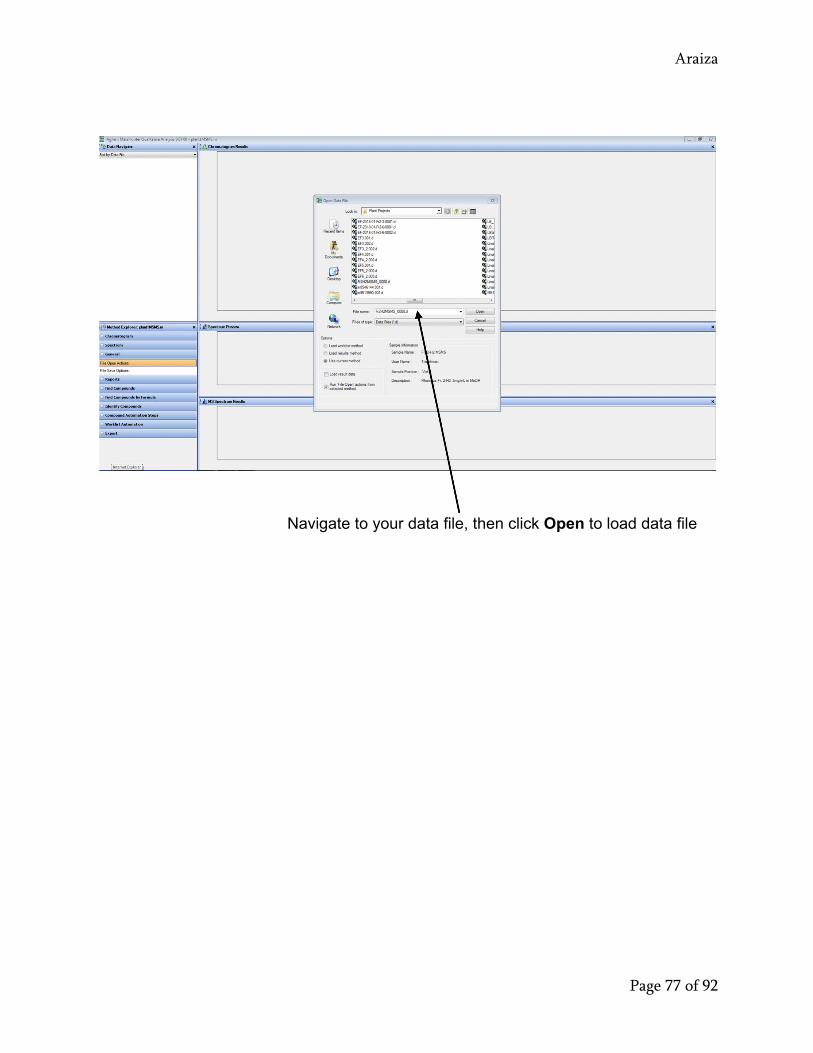
Araiza
Page 77 of 92
Navigate to your data file, then click Open to load data file

Araiza
Page 78 of 92
Right click on Chromatogram, and then select [Extract Chromatogram]
For m/z values, type in mass(s) of compounds. If using MRM or SIM select either MRM or SIM as “Type” and m/z values will load from method automatically.
Under “Type”, select [TIC] = Total Ion Current full chromatogram [BPC] = Base Peak Current shows strongest compound peaks present [EIC] = Extract Ion Current if looking for a specific m/z. [MRM] = Multiple Reaction Monitoring Can only be used if this was the type of
method run [SIM] = Selected Ion Monitoring Can only be used if this was the type of method
run

Araiza
Page 79 of 92
Uncheck box next to TIC in Data Navigator so only chromatograms of interest are showing.
To print, click File Print Analysis Report OK PDF version will pop up. Click on Printer icon.
Click [X] to close Data File. [Save] box will pop up

Araiza
Page 80 of 92
When asked if you want to save the results, click No

Araiza
Page 81 of 92
Section 4: Quantitative Analysis
Double click to open
[Quantitative Analysis]

Araiza
Page 82 of 92
Click File New Batch The New Batch dialog box will be opened.

Araiza
Page 83 of 92
Give Batch File a name (typically the data set name works XX15Jun2019)
Click [Open] A new screen will pop up. Select [Browse to copy samples].

Araiza
Page 84 of 92
Select all samples that are part of this Data set (MRM and SIM will be analyzed separately)
Click [Open]

Araiza
Page 85 of 92
Click [Select All] to select all samples, and then
click [OK] to add them to the batch.

Araiza
Page 86 of 92
Click on the line of the Sample table with the highest concentration, so that it is highlighted.

Araiza
Page 87 of 92
From the menu at the top select Method Open Open Method from Existing File
Chromatogram will appear from selected

Araiza
Page 88 of 92
Double left click at the middle of the peak to show the mass spectra of the first compound. (195.1)

Araiza
Page 89 of 92
Click on spectra so that the blue arrow is at the top of the peak of interest
Then right click and select [New Compound]
In the upper section a new line will appear with this mass value and the retention time of the original peak chosen. Fill in the name of the compound.

Araiza
Page 90 of 92
Double left click at the left of the peak and repeat step a to c above to identify the other compound in sample. (181.1)

Araiza
Page 91 of 92
In the left column select the red [Exit] under “Save / Exit”
“Apply Method” box will pop up Make sure “Integrate” is selected and
click [Yes]

Araiza
Page 92 of 92
If the retention time and area values are not visible, click and drag the column border to the right to increase column width
Red boxes indicate outliers
From the top menu select [File] [Export] [Export Table] this will open a window and prompt to save as an Excel file. Save to a removable drive as this computer is not connected to the internet. Finish doing analysis using Excel
Copyright © 2022 FDOKUMEN