Malaysian Cocoa Journal 2019, Vol. 11
249
Malaysian Cocoa Journal 2019, Vol. 11 i
-
Upload
khangminh22 -
Category
Documents
-
view
1 -
download
0
Transcript of Malaysian Cocoa Journal 2019, Vol. 11

Malaysian Cocoa Journal 2019, Vol. 11
i

Malaysian Cocoa Journal 2019, Vol. 11
i
MALAYSIAN COCOA JOURNAL -------------------------
ADVISER
Datuk Norhaini Udin
VICE ADVISER Dr. Ahmad Kamil Hj. Mohd. Jaaffar
Editor
Dr. Rosmin Kasran
Secretary Dr. Tan Chia Lock
Editorial Committee
Harnie Harun Suzannah Sharif
Dr. Douglas Furtek Dr. Fisal Ahmad Dr. Hii Ching Lik Dr. RozitaOsman
Dr. Samuel Yap Kian Chee Dr. Zainal Baharum
Mohamed Yusof Ishak Winoryantie Sulaiman
Published by
MALAYSIAN COCOA BOARD
5-7th Floor, Wisma SEDCO Lorong Plaza Wawasan, Off Coastal Highway
88999 Kota Kinabalu, Sabah, Malaysia
©All rights reserved. No part of this publication may be reproduced in any form or
by any means without permission in writing from Malaysian Cocoa Board

Malaysian Cocoa Journal 2019, Vol. 11
ii
CONTENTS
TRANSFER OF TECHNOLOGY
COCOA SMALLHOLDERS SATISFACTION ON EXTENSION SERVICES PROVIDED BY MALAYSIAN COCOA BOARD AT SERIAN, SARAWAK Winoryantie, S. and Thalany, K.
1
MARKETING
FEASIBILITY STUDY FOR THE PRODUCTION AND COMMERCIALIZATION OF “MAGNIFICENT CHOCS” Ahmad Kamil, M.J. and Farniza Shareen, J.
9
BIOLOGY
FLUORESCENCE SENSING DURING CACAO POD DEVELOPMENT: SOME PRELIMINARY RESULTS Tee, Y.K.., Balasundram, S. K., Ding, P. and Husni, M.H.A.
16
THE EFFECTIVENESS OF SYSTEMIC FUNGICIDES IN CONTROLLING VASCULAR STREAK DIEBACK (VSD) ON MATURE COCOA TREE Suhaida, S., Shari Fuddin, S., Alias, A., Roselee, O. and Ali, K.
23
EFFECT OF STORAGE TEMPERATURE ON VIABILITY AND VIRULENCE OF Beauveria bassianna CONIDIOSPORES Shari Fuddin, S. and Stephen, M.
27
FOGGING TECHNIQUE: WITH DIFFERENT RATES OF INSECTICIDE INFLUENCED THE EGGS AND ADULT OF Conopomorpha cramerella. Saripah, B.
29
EFFECT OF BIOENHANCER ON GROWTH PERFORMANCE OF COCOA (Theobroma cacao L.) SEEDLINGS. Nurfadzilah, M., Halimi, M.S., Fisal, A. and Tan, G.H.
38
EVALUATION AND ASSESSMENT OF COMMERCIAL COCOA CLONES AT COCOA RESEARCH AND DEVELOPMENT CENTER BAGAN DATUK, PERAK. Nuraziawati, M.Y., Haya, R., Aizat, J. and Zailani, M.J.
42
PRELIMINARY ASSESSMENT: DETERMINATION OF MAJOR FERTILISER ELEMENTS DISTRIBUTION ON COCOA (Theobroma cacao L.) TREE FOR OPTIMUM FERTILISER ABSORPTION. Nurafiza, A., Tee, Y.K. and Isa, I.
47
EVALUATION OF CPB SEX PHEROMONE LONGEVITY IN THE COCOA FIELD. Navies, M., Mohd Shakri, A., Muliadi, T., Saripah, B. and Zhang, A.
51
COMPOSITION OF WEEDS IN DIFFERENT COCOA AREA – RELATED TO CLIMATE CHANGE AND ORGANIC COCOA AREA. Meriam, M.Y.
55
APPLICATION CHARRED PADDY HUSK ON COCOA SOIL Helmi, S., Nurfadzilah, M. and Fisal,A.
60

Malaysian Cocoa Journal 2019, Vol. 11
iii
FACTORS AFFECTING COCOA POD VALUE AND COCOA BEAN CONVERSION RATE Rozita, O., Saiful Mujahid, A.R. and Sharih, S.
63
EFFECT OF ORGANIC MATERIALS AND APPLICATION FREQUENCY ON COCOA (Theobroma cacao L.) CROP PRODUCTION AND SOIL FERTILITY Boney M., Mohd Dandan M. A. and Azwan, A.
67
PRELIMINARY EVALUATION OF NEW LOCAL VERIFICATION TRIAL AT FARMER’S FIELD SERIAN, SARAWAK Aizat, J., Nuraziawati, M.Y., Haya, R. and Abdul Rahman, R.
76
BIOTECHNOLOGY
COLONIZATION OF ENDOPHYTIC Bacillus subtilis strain LKM-BL IN COCOA SEEDLINGS. Ishak, Z. , Ernie Eileen, R.R. and Wan Syaidatul, A.
79
CONSTRUCTION, CLONING AND EXPRESSION OF SYNTHETIC GENES ENCODING ARTIFICIAL TRANSCRIPTION FACTORS OF THEOBROMA CACAO LEC2 Rahman M. Z. A., Jainuddin, H. and Kasran, R.
85
EFFECT OF HIGH ANTIOXIDANT DARK CHOCOLATE ON PLASMA GLUCOSE AND CHOLESTEROL LEVEL IN DIABETIC RATS Rosmawati, M.S., Siti Azriena, A., Muhamad Zulkhairi, M.A. and Kasran, R.
89
REVALIDATION OF IDENTIFIED SNP MARKERS BY MICROARRAY EXPRESSION AND DEVELOPMENT OF SNPS FIELD VALIDATION WITH MULTIPLEX PCR Roslina, M.S., Nuraziawati M.Y, Aizat, J, Ahmad Kamil, M.J, Navies, M., Alias, A., Kasran, R. and Neoh, J
94
SCREENING AND IDENTIFICATION OF SPECIAL COCOA FLAVOR COMPOUND IN FRESH COCOA BEANS USING RAPID AND FAST MICROANALYSIS TECHNIQUES FOR MALAYSIAN RENAISSANCE COCOA Mohd Zaini, N.
101
METATRANSCRIPTOMIC SEQUENCING AND ANALYSIS OF CACAO RHIZOSPHERE. Norasekin, T., Lee, P-C and Kasran, R.
108
EVALUATION OF THE GENETIC DIVERSITY AND RELATIONSHIP OF CLASS II MALAYSIAN COMMERCIAL COCOA CLONES USING MICROSATELLITE MARKERS. Lea, J. and Nuraziawati, M.Y.
116
FORMULATION AND EVALUATION OF COCOA ANTIBACTERIAL NIGHT CREAM FROM COCOA SHELL EXTRACT OF Theobroma cacao FOR SKINCARE Zainal, B., Nurul Amirrah, R., Rasma Suzielawanis, I., Azila, A. K. and Nur Azilah, A.
127
USE OF RNAi TECHNOLOGY TO CONTROL COCOA POD BORER, AN AGRICULTURAL IMPORTANT PEST IN SOUTHEAST ASIA. Tan, C.L., Mohd. Firdaus, A., Masooq, M., Fosu-Nyarko, J. and Jones, G.K.M
136

Malaysian Cocoa Journal 2019, Vol. 11
iv
CHEMISTRY- PROCESSING AND PRODUCT DEVELOPMENT OCHRATOXIN A AND AFLATOXIN REFERENCE MATERIAL FOR COCOA BEANS-PRELIMINARY STUDY Suzannah, S., Badrul, H.Z. and Aznie, A.A.
145
PRELIMINARY STUDY ON VACUUM ROASTING AND EFFECTS TO THE MALAYSIAN COCOA FLAVOUR CHARACTERISTICS Rahmat, M., Wan Aida, W.M. and Noor Farizah, D.
154
COMPARISON BETWEEN INFRARED AND MICROWAVE MICRONIZING OF WET FERMENTED COCOA BEANS Hidayatullah, H.
160
SENSORY AND CHEMICAL PROFILES OF SUGAR FREE PLAIN CHOCOLATE WITH FISH OIL INCORPORATED WITH MACA AND GINKGO BILOBA EXTRACTS. Hassan, M.R. and Johari, K.
169
PROXIMATE ANALYSIS OF COCOA POD HUSK FROM DIFFERENT CLONE IN MALAYSIA Hannim, H. H.
175
COSMETIC WAX PRODUCTION BY LIPASE TRANSESTERIFICATION BETWEEN COCOA BUTTER FREE FATTY ACIDS AND PALMITYL ALCOHOL Samuel, Y.K.C.
180
COCOA FACE MASK COSMETIC: RESPONSE SURFACE METHODOLOGY APPLIED TO THE FORMULATION DESIGN. Wahab, N.A. and Halim, A.N.A
187
CHARACTERIZATION ON THE COLOUR OF THE DRIED COCOA BEANS FROM DIFFERENT FERMENTATION DURATION USING A SHALLOW BOX Khairul Bariah, S., Fadzillah, A. and Husin, S.
194
ANTI-WRINKLES GEL CONTAINING COCOA POD EXTRACT: EFFECT OF COCOA POD EXTRACT ON FIBROBLAST CELL VIABILITY AND MMP-1 GENE EXPRESSION Azila, A.K., Nur Azilah, A., Azrina, A., Roslina, M.S. and David, A.
202
PHOSPHINE AND ETHYL FORMATE AS FUMIGANTS FOR CONTROLLING STORAGE COCOA PESTS Asimah, H. and Albert, L.S.C.
216
CHARACTERIZATION AND SENSORY ACCEPTABILITY OF RED PITAYA (Hylocereus polyrhizus) COCOA BUTTER-BASED ICE CREAM Chin, H.H. and Nor Haslita, I.
223
COMPREHENSIVE STRATEGY FOR VOLATILE AND NON-VOLATILE PESTICIDE RESIDUE ANALYSIS IN COCOA BEANS AND COCOA PRODUCTS THROUGH MULTI MASS SPECTROMETRIC METHODS Badrul Hisyam, Z. and Salsazali, S.
228
ARTIFICIAL NEURAL NETWORK (ANN) AND RESPONSE SURFACE METHODOLOGY (RSM) BASED MODELLING FOR OPTIMIZATION OF POLYPHENOLS EXTRACTION CONDITION FROM COCOA SHELL Arief Huzaimi, M.Y., Siti Salwa, A.G., Uswatun Hasanah, Z. , Mohd Izuan, E.H.
236

Malaysian Cocoa Journal 2019, Vol. 11
1
COCOA SMALLHOLDERS SATISFACTION ON EXTENSION SERVICES PROVIDED BY MALAYSIAN COCOA BOARD AT SERIAN, SARAWAK
Winoryantie, S.1 and Thalany, K.2
1Malaysian Cocoa Board, Cocoa Research & Development Centre Kota Samarahan, Lot 248, Block 14, Daerah Muara Tuang, Bahagian Samarahan, Locked Bag 3131, 93450, Kuching, Sarawak
2Faculty of Administrative Science and Policy Studies, Universiti Teknologi MARA, Kota Samarahan Email: [email protected]
Malaysian Cocoa J. 11: 1-8 (2019)
ABSTRACT - Sustainability in the cocoa industry is a major need in due to decreasing trend in cultivation and production. Previous study shows that the sustainability and loyalty from the customer usually have a strong relationship with their satisfaction on the services or product provided by the organizations. Therefore, this study is to carry out the satisfaction level of cocoa smallholders on extension services provided by Malaysian Cocoa Board (MCB). The surveys were conducted on 250 cocoa smallholders in Serian. The findings revealed that there are five factors influenced the satisfaction level on extension services namely, participation, communication and motivation, community development, government aid and adoption technology. The most factors that contribute to the cocoa smallholders’
satisfaction on extension services is government aid. Key words: Satisfaction, extension services INTRODUCTION Customer need, loyalty - Zaidi (2000) mentioned that, we can gain the sustainability the loyalty and retain them by sustaining the customer satisfaction. Nawaz, Khan and Shaukat (2011) mentioned that according to Anderson and Jacobsen (2000) that customer loyalty is the result of the performance of an organization creating a benefit for customers that create their satisfaction. So that, they will maintain and increasingly repeat business with the organization. According to Luarn and Lin (n.d), “trust, customer satisfaction, perceived value,
and commitment is separate constructs that combine to determine the loyalty, with commitment exerting a stronger influence than trust, customer satisfaction, and perceived value. Customer satisfaction and perceived value were also indirectly related to loyalty through commitment.”. This also proven and supported
by Oliver (1997) which is satisfaction is really meaningful if the customer will loyal to the product and services and can with the satisfaction and loyalty to commitment behaviour. This is because a true customer or a genuine, loyal customer is when they’re still
stuck together with the organization to support them without any incentives.
The purpose of this study is to examine the factors that contribute to satisfaction level and to examine the satisfaction level of cocoa smallholders on extension services provided by Malaysian Cocoa Board. Therefore, this study is significant to individuals, organizations, smallholders and policy makers. The finding in this study can be used as a guideline for further planning. Cocoa Scenario in Sarawak - In Sarawak, MCB started the Cocoa Rehabilitation Program in in 1997 after the Department of Agriculture, Sarawak stopped providing assistance under the Cocoa Subsidy Scheme (CSS). Malaysian Cocoa Board (MCB) does take care of cocoa plantations in Sarawak since 1989. In early 1980's Sarawak has 8,429 hectares with the number of production were 1,464 tonnes. The highest cocoa cultivation is at 1990 which is 73,742 hectares with the number of production were 21,200 tonnes. In late 1990's the trend of cocoa cultivation in Sarawak is decreased. At 2007, during the 9th Malaysian Plan, cocoa cultivation in Sarawak started to increase but then suddenly drop again in 2012 with the number of 4,816 hectares. Satisfaction - There were many researches doing on satisfaction with different definitions. According to Cochran (2003), he mentioned that

Malaysian Cocoa Journal 2019, Vol. 11
2
customer satisfaction is a measure to know either the products or services provided by an organization really achieve and fulfil the customers’ needs. Due to Ove and Albinson (2004), satisfaction can refer to customer attitude or behaviour towards a service provider on what the customers expect and what they actually receive, regarding the fulfilment of any desire, need or goal. Ove and Albinson (2004) also found in their study that there are three different perspectives regarding satisfaction. The first finding is a customer was satisfied with the great and good attitude and relationship while dealing. The second finding is they confirmed that retention does have the relationship with the satisfaction. This is because there are connections between satisfaction and retention when it is turned out to pertain to the experiences of relationship and confidence, and frequent contact accompanied by open dialogue. The last finding is when the informants experienced and expressed the concepts of satisfaction and retention using many different mental models. So that, they will understand well and perform well in order to gain the customer satisfaction that can contribute to the organization profit. Extension Services - According to Hanisah (2004), she also referred to Maunder (1973) mentioned that the extension is “A service or
system that assist or help from people through educational processes in improving farming methods and techniques, increasing production, efficiency and income, bettering their levels of living and lifting the social and educational standard of rural life. In this study, we will conduct research on extension services based on these four big components of agriculture extension. Participation in Project Management - The need to involve the beneficiaries (end users) of improved farming practices in the planning, implementation, evaluation and the analysis of such project cannot be overemphasized. All of the six items scores factor value range from 0.605 to 0.808. Whereas, the commonalities values range from 0.475 to 0.689, which indicate that six statements have to be accepted as a dominant factor contributed satisfaction level on extension services provided by MCB.
Communication and motivation - Ningkan (2008), mentioned that customer satisfaction might lead to customer loyalty due to various factors such as good quality of the product, good customer relations, value for money and incentives of various forms. The four items have to be accepted as the second factor that contributed to satisfaction level among the smallholders. The detail statistic shows that the factor values for four items were range from 0.615 to 0.827 with the communalities values range from 0.251 to 0.533. Skill & Knowledge/Community Development – Idris (2002), found that personnel skill contributes to the satisfaction. Razali (2002) also agreed that they need further training with me, planting their daily activities to sharpen their skills. Training have a relationship with performance and productivity. The three items recorded loading factor values range between 0.763 to 0.813 with communalities from 0.232 to 0.548. Fourth factor is Government Aid element with all three items recorded loading factor values range between 0.765 to 0.818 with communalities from 0.388 to 0.716. Adoption technology The three item that supports Adoption Technology factor recorded loading values range from 0.643 to 0.878 with 0.357 to 0.431. METHODOLOGY Sample - The selected study area for this research is newly promoted Serian Division. The unit analysis for this study is a smallholder that registered with MCB current development programme whom received extension services from MCB in 2014. Therefore, the number of smallholders that received extension services from MCB in 2014 was 519 hectares and 519 active smallholders. The selected sampling procedure is by cluster sampling, where selected groups are chosen and all members of the selected groups have similar characteristics (Parmjit Singh et al., 2006). In this study, the random clustered sampling area based on some demographic pattern and locations of the respondents. Table 1 shows the number of smallholders according their cluster.

Malaysian Cocoa Journal 2019, Vol. 11
3
Table 1. Study population & sample size Cluster Population By Zone
No of Small holders
Percent (%)
Sample size
95% CL 99%CL
Serian-Bunan Road
241 46.4 83 103
Serian-Kedup Road
33 6.4 11 14
Serian-Kuching Road
17 3.3 6 7
Serian-Sri Aman Road
10 1.9 3 4
Serian-Tebedu Road
218 42.0 75 93
Total 519 100.0 179 221
The population of the study is 519 smallholders. With the advantage in technology, the sample size could also be determined using computer software namely Raosoft Sample Size Calculator. Based on the 95% confidence level, the sample size recommended in this study is at 221 respondents. Higher confidence level requires a larger sample size. An alternative option for sampling size is at 90% confidence level with the recommended sampling size of 179 persons as shown in Table 2. The study is said to be more reliable with maximum confidence level. Therefore, with a confidence level of 95%, the sample size of 221 is acceptable. The table below based on Raosoft Calculator shows the above calculation:
Table 2. Determining sample size using sample
size calculator Confidence level
Population Sampling Size
At 95 % 519 221 At 90 % 519 179 Source: http://www.raosoft.com/samplesize.html
In this study, out of 250 sets of questionnaires were distributed and 187 respondents responded and returned the questionnaire Therefore, the high respondent rate is 101.76% This is because the effort made by the extension agent and the Ketua Kelompok gathering the respondents. Instrument - The research instrument for this study is structured questionnaire. The questionnaire is in English and Bahasa Melayu. The structured questionnaires were divided into
seven sections as shown in Table 3. The instrument was adopted and adapted from Othman (1980).
Table 3. Questionnaire construct
Section Description A Demographic Background B Participation C Communication and motivation D Skill & Knowledge E Government Aid F Adoption Technology G Satisfaction Level In Section A, it consists of information regarding the respondent’s demographic
characteristics such as age, educational background and experiences as cocoa smallholders. In Section B, it contains independent variables relating to individual or family members' participation. Whereas Communication and motivation within smallholders and MCB is in Section C, Section D consists skills and knowledge and Government Aid and Adoption Technology is in Section E and F, respectively. An overall perception or satisfaction level of extension services provided by MCB is listed in Section G. A five point Likert scale was suggested For Section B to G because it allows accurate assessment of opinions, which are often conceptualized in terms of gradation. This scale is commonly used to measure responses and allows the respondents to express the degree of their opinion (Evans & Lindsay, 2002). Respondents were required to respond to the statements by using a five point Likert scale ranged from 1 (stronglee disagree) to 5 (strongly agree). Data Analysis - Demographic data were analysed used descriptive analysis. The construct validity of the instrument (19 items) was established using factor analysis. The results of the factor analysis produced 5 factors that have the loading numbers >0.6. Roziah (2012) mentioned that Hair et al., 2000) mentioned that factor loadings of 0.5 and above were considered practically significant. The Kaiser-Meyer-Olkin (KMO) measure of sampling adequacy tests whether the partial correlations among variables are small. Bartlett's test of sphericity tests whether the correlation matrix is an identity matrix, which would indicate that the factor model is inappropriate. All the variables
Malaysian Cocoa Journal 2019, Vol. 11
4
exceeded the acceptable standard of KMO value of 0.6, with a range from 0.655 to 0.758, in addition to the significant in Bartlett’s test of
sphericity with p value = 0.000 (p<0.005) at the 100 percent confidence level. All variables had cumulative percentage for eigenvalues, with the maximum value is 74.63 and the minimum value is 59.77. All five new factors exceeded the acceptable standard of reliability analysis of 0.60 more than acceptable value, Coakes & Steed, (2002). Overall value for Cronbach’s Alfa is
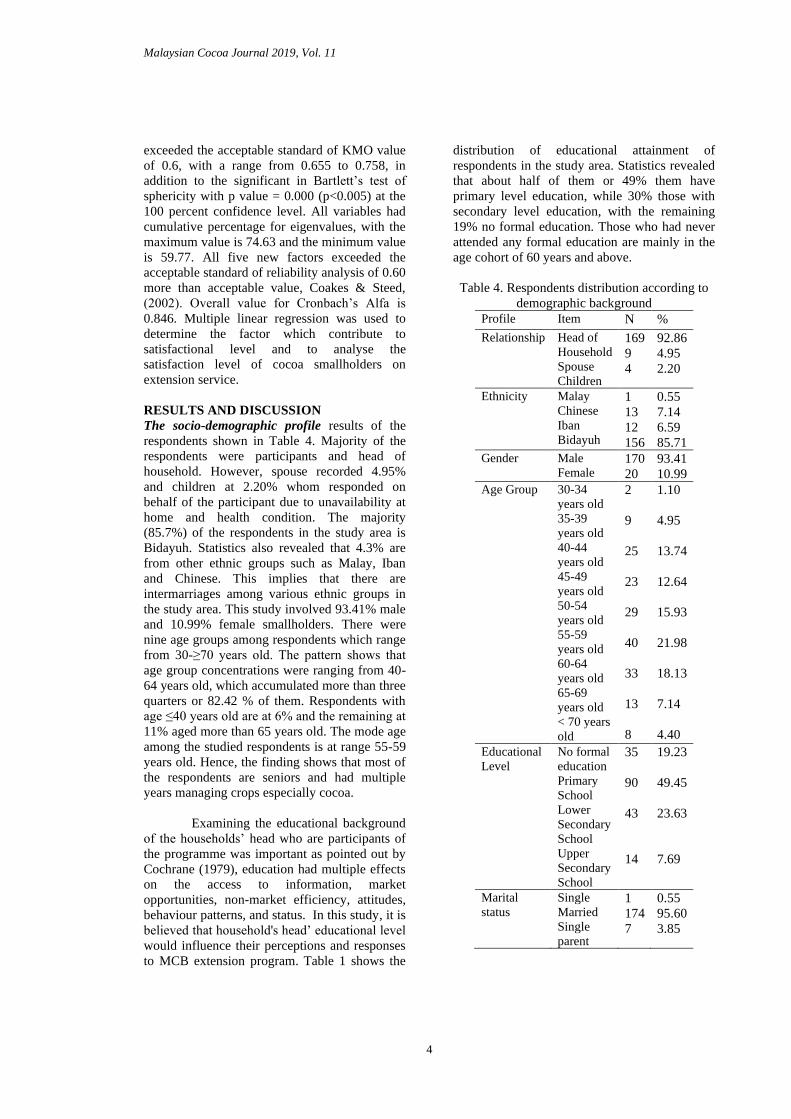
0.846. Multiple linear regression was used to determine the factor which contribute to satisfactional level and to analyse the satisfaction level of cocoa smallholders on extension service. RESULTS AND DISCUSSION The socio-demographic profile results of the respondents shown in Table 4. Majority of the respondents were participants and head of household. However, spouse recorded 4.95% and children at 2.20% whom responded on behalf of the participant due to unavailability at home and health condition. The majority (85.7%) of the respondents in the study area is Bidayuh. Statistics also revealed that 4.3% are from other ethnic groups such as Malay, Iban and Chinese. This implies that there are intermarriages among various ethnic groups in the study area. This study involved 93.41% male and 10.99% female smallholders. There were nine age groups among respondents which range from 30-≥70 years old. The pattern shows that
age group concentrations were ranging from 40-64 years old, which accumulated more than three quarters or 82.42 % of them. Respondents with age ≤40 years old are at 6% and the remaining at
11% aged more than 65 years old. The mode age among the studied respondents is at range 55-59 years old. Hence, the finding shows that most of the respondents are seniors and had multiple years managing crops especially cocoa. Examining the educational background of the households’ head who are participants of the programme was important as pointed out by Cochrane (1979), education had multiple effects on the access to information, market opportunities, non-market efficiency, attitudes, behaviour patterns, and status. In this study, it is believed that household's head’ educational level
would influence their perceptions and responses to MCB extension program. Table 1 shows the
distribution of educational attainment of respondents in the study area. Statistics revealed that about half of them or 49% them have primary level education, while 30% those with secondary level education, with the remaining 19% no formal education. Those who had never attended any formal education are mainly in the age cohort of 60 years and above. Table 4. Respondents distribution according to
demographic background Profile Item N % Relationship Head of
Household Spouse Children
169 9 4
92.86 4.95 2.20
Ethnicity Malay Chinese Iban Bidayuh
1 13 12 156
0.55 7.14 6.59 85.71
Gender Male Female
170 20
93.41 10.99
Age Group 30-34 years old 35-39 years old 40-44 years old 45-49 years old 50-54 years old 55-59 years old 60-64 years old 65-69 years old < 70 years old
2 9 25 23 29 40 33 13 8
1.10 4.95 13.74 12.64 15.93 21.98 18.13 7.14 4.40
Educational Level
No formal education Primary School Lower Secondary School Upper Secondary School
35 90 43 14
19.23 49.45 23.63 7.69
Marital status
Single Married Single parent
1 174 7
0.55 95.60 3.85

Malaysian Cocoa Journal 2019, Vol. 11
5
The study also revealed that about 90.66% of the respondents were farmers followed by 5.45% as general workers. The remaining engaged with public sector, private sector and self-employed. Distribution of respondents’ incomes by
interval shows in Figure 1. From the data it is observed that all of the respondents’ interviewed
received income. Slightly about half of them (51.65%) were earning less than RM501 to RM920 per month, followed by 33% in the income category of RM500, with an average monthly income at RM743.07. Overall, respondents’ income was thus concentrated in
the region of RM900 and below, and this was reported by almost 84% of them.
Figure 1. Respondents’ distribution according to
respondents and households Income
Almost similar pattern distribution of total average monthly household income by category. The statistics revealed that 42.3% of households earned income between RM 500 to RM920 per month, followed by RM 921 to RM 1, 200.00 (18.7%) and less than RM 500.00 at 16.48%. The mean income for sample households was at RM 1,053.18 per month. From the discussion, they revealed that their main sources of cash income were from wages and salary as mentioned earlier. Agriculture product such as rubber and cocoa also contributed to the income earned, however not at a consistent level. The frequencies were inconsistent due to the fluctuation of global price affected the smallholders especially for cocoa, rubber and pepper. For instant, most of the
farmers enjoyed tapping rubber when the price was peaking at RM 7.00 per/kg. With an average size of rubber farm at 3.00 acres and production at 10.00 kg/day, their average income earned was about RM 50.00 to RM 70.00 per day. This study also attempts to explore the incidence of poverty in the study area by comparing household income with poverty line income. Based on the study findings, there were 42.3% of the households considered as poor and 16.48% as hard core poor. However, for this study income only estimated cash income taking into consideration. Figure 2 shows the proportion of non-poor, poor and hard core poor in the study area. The overall statistics revealed that 41.21% of the households in the study area were not poor.
Figure 2. Respondents’ percentage according to
poverty level In the study area, about a third or 35% of the participants have joined since 9th Malaysian Plan followed by 57.6% planting in 10th Malaysian Plan as shown in Table 5. Interestingly, eight respondents (4.13%) of the respondents joined more than one cocoa development programme. All the registered cocoa smallholders are required to attend training organized by MCB and other agencies. Table 6 shows that the majority of the participants or more than 80% of them have been attended various programmes of training arranged by MCB.

Malaysian Cocoa Journal 2019, Vol. 11
6
Table 5. Respondents’ cocoa programmes
Programme Frequency Percent
RMK 7 2 1.1
RMK 8 3 1.6
RMK 9 64 35.2
RMK10 105 57.6
RMK 7, RMK 8, RMK 9,
TB15 3 1.6
RMK 7, RMK 8, RMK 9, 5 2.7
Total 182 100.0
Table 6. Type of training Type of Technology Training
Attended
N % Planting 167 91.76 Fertilizing 160 87.91 Lining 162 89.01 Harvesting 158 86.81 Pest Control 157 86.26 Weed Control 158 86.81 Fungi Control 155 85.16 Cloning 159 87.36 Processing 155 85.16 Quality Control 156 85.71 Shade Trees Management 156 85.71 Table 7 shows the result of the linear regression, giving the R2 of 0.705 (p>0.5) which bring the meaning of 70.5% of the dependent variables was explained by the independent variables. It also means that 70.5% of overall cocoa smallholders’ satisfactions on MCB
extension services are covered. In addition, the result also showing that the main factors, namely project management (t=11. 184, p=0. 000)), communication and motivation (t=2.465, p=0.0015), government Aids (t=3.177, p=0.002) and Adoption Technology (t=6.371, p=0.000) contribute to cocoa smallholders satisfaction on MCB extension services. This is because the t value is fill the Rules of Thumb which is (t >1.96 or t>2.0) is considered as significant. The benchmark of significant is below 0.05 (p<0.05). All of these four factors show the positive relationship since all the ß value is positive.
Table 7. Result of multiple linear regression model on satisfaction level of cocoa smallholders on extension service
Model B t Sig I (Constant) 12.914 3.962 0.000 Project Management
0.567 11.184 0.000
Ability to Communicate and Motivate
0.130 2.465 0.015
Community Development
0.030 0.585 0.559
Governments’ Aid 0.169 3.177 0.002 Adoption of Technology
0.318 6.371 0.000
Relationship Status -0.090 -1.761 0.080 Ethnicity 0.023 0.507 0.613 Gender 0.075 1.501 0.135 Age 0.007 0.125 0.900 Educational level 0.041 0.695 0.488 Marriage Status -0.009 -0.207 0.836 Occupation -0.020 -0.379 0.705 Cocoa Income -0.034 -0.462 0.645 HH Income 0.073 -0.945 0.346 Poverty Line Index 0.009 0.152 0.879 R2 0.705 On the other hand, the remaining demographic characteristics such as relationship (ß= - 0.090), marriage status (ß= 0.009), occupation (ß= -0.020) and income (ß= -0.034) giving a negative relationship since the ß is negative. The result of linear regression model is computed as below: Satisfaction = a + ß1PM +ß2CM + ß3CD + ß4GA + ß5AT– ß6R+ ß7E + ß8G + ß9A + ß10Ed – ß11MS– ß12O – ß13CI + ß14HI + ß15PLI + e Satisfaction = 12.914 + 0.567 PM +0.130 CM + 0.030 ß3CD + 0.169 GA + 0.318 AT – 0.090 R + 0.023 E + 0.075 G + 0.007 A + 0.041 Ed – 0.009 MS – 0.020 O – 0.034 CI + 0.073 HI + 0.009 PLI + e
CONCLUSION, DISCUSSION AND IMPLICATIONS As a conclusion of multiple linear regression model result, it shows that participation in project management factor gives the highest levels that contribute to cocoa smallholders’

Malaysian Cocoa Journal 2019, Vol. 11
7
satisfaction on MCB extension services. This result also supported the result, finding in Research Objective 2 which is participation in project management contributing the highest loading value. The second highest level factors that also contribute to the cocoa smallholders’
satisfaction are adoption technology follows by government aid and communication and motivation. What we can conclude here is how an effective Project Management can contribute to the cocoa smallholders’ satisfaction on
extension services provided by MCB. By the satisfaction, the cocoa smallholders will retain in the cocoa industry. According to the PMBOK (2013), effectiveness of project management only can be achieved by an effective leadership. PMBOK (2013) also highlights that leadership is a skill and an ability to get a group of people to work together to achieve the target. In other words, a leadership is a skill to persuade people to do the job done. By having an efficient leader, one of the big criteria is how a leadership plays a role to complete he himself with skill and knowledge. So that he’s capable to transfer the technology
and convince all the group members to adopt the technology and fully use all the government aid. All of these can be implemented by a good communication skill and motivation approaches. Therefore, leadership and project management are the main two things that have to work together, which is leadership skills must be used and adopted during the project lifecycle. The project lifecycle, including initiating, planning, implementing, monitoring and evaluating all the scopes in the project such as financial, human resources, tools, activity, data and reporting. While the demographic factors such as relationship, marriage status, occupation and income does not give any significant influence on cocoa smallholders’ satisfaction towards
MCB extension services. For instance, there is no significant difference between marital statuses with perception on the satisfaction level with extension services impart by MCB. The majority of their feedbacks are skewed toward positive or high satisfaction level. LIMITATION OF THE STUDY They’re some limitation that was aware during
this study that might be affecting the results.
This is because the study was based on sample taken from only one Division even though it’s
consider as the largest number of cocoa smallholders in Sarawak which means the result can be generalised for Sarawak scenario. Besides that, the accuracy of the data is basically depends on the respondent honesty in revealing their true experiences with MCB. ACKNOWLEDGEMENT A highly gratitude to Malaysian Cocoa Board for the opportunity to submit this paper and data collection sources, Dr. Thalany binti Haji Kamri and Dr. Haji Saudi bin Tuan Haji Nurani from Universiti Teknologi MARA, Cawangan Sarawak for the guidance and special thanks to Gorong, Felani and all the respondents who involved in collecting data during their weekend.
REFERENCES PMBOK (2013). A Guide to the Project
Management Body of Knowledge (PMBOK® Guide) – Fifth Edition. ©2013 Project Management Institute.
Cochran, C. (2003). “Customer Satisfaction:
Tools, Techniques, and Formulas for Success”. USA: Patton Press.
Idris, H. (2002), “A Study On Customers’
Satisfaction Of Government Sector Toward Product Offered By Percetakan Nasional Malaysia Berhad In Kuching”
Luarn, A. and Lin, H.H (n.d), “A Customer
Loyalty Model for E-Service Context”, Department of Business Administration National Taiwan University of Science and Technology.
Nawaz, K. and Shaukat (2011). Impact of
Customer Satisfaction on Customer Loyalty and Intentions to Switch: Evidence from Banking Sector of Pakistan, International Journal of Business and Social Science, 2(16): September 2011.
Ningkan, D.I. (2008). Customer Satisfaction On
Mayang Tea. Malaysian Cocoa Board.

Malaysian Cocoa Journal 2019, Vol. 11
8
Oliver, R.L. (1997). Satisfaction: A Behavioral
Perspective on the Consumer. New York: McGraw Hill.
Ove, C.H. and Albisson, M. (2014). Customer
satisfaction and retention: The experience of individual employees. Managing Service Quality, 14(14):
Razali, J. (2002). Identifying training needs for
the employees and it’s relationship with the overall business performances. A case study of Captain Rosley Enterprise Sdn Bhd”.

Malaysian Cocoa Journal 2019, Vol. 11
9
FEASIBILITY STUDY FOR THE PRODUCTION AND COMMERCIALIZATION OF “MAGNIFICENT CHOCS”
Ahmad Kamil M.J.1 and Farniza Shareen J.2
1Directorate, Malaysian Cocoa Board, 5-7th Floor, Wisma SEDCO, Lorong Plaza Wawasan, Off Coastal Highway, Locked Bag 211, 88999 Kota Kinabalu, Sabah
2Division of Market Development and Economy, Malaysian Cocoa Board, 5-7th Floor, Wisma SEDCO, Lorong Plaza Wawasan, Off Coastal Highway, Locked Bag 211, 88999 Kota Kinabalu, Sabah
Corresponding authors: [email protected] and [email protected]
Malaysian Cocoa J. 11: 9-15 (2019) ABSTRACT - This study aim to examine the potential of producing and commercializing “Magnificent
ChocS” produce by the Kota Samarahan Pilot Plant. Chocolate pilot plant in Kota Samarahan Cocoa Research and Development Centre started its first production in June 2013 with initial capital of RM50,000 for the purchased of raw materials and equipments. In 2018, there was a plan to re-branding and commercialize the Kota Samarahan’s chocolate products with the name of “Magnificent ChocS”. The
corporate finance indicator such as Net Present Value, Profitability Index, Internal Rate of Return and Payback period were analyse in this study which show that the production and commercialization of “Magnificent ChocS” by Kota Samarahan pilot plant is feasible. However, many aspects need to be reviewed in order for sustainable and profitable operation of Kota Samarahan pilot plant. The sale price of Kota Samarahan pilot plant’s chocolate products should be revised to at least 30% of profit margin.
The production cost need to be further reduced to achieve comfortable remuneration to Malaysian Cocoa Board. Brand awareness of “Magnificent ChocS” need to be established in the market. Brand awareness
is important because it helps the product to stand out above their competition. Marketing and promotional activities need to be intensified in order to establish a strong foundation of consumer for “Magnificent
ChocS”. Key words: Feasibility study, corporate finance, chocolate
INTRODUCTION Chocolate pilot plant in Kota Samarahan Cocoa Research and Development Centre started its first production in June 2013. Initial capital of RM50,000 was injected for the purpose of purchasing raw materials and equipments. The Kota Samarahan Pilot Plant produces chocolate block and chocolate praline. REVIEW OF CURRENT PERFORMANCE
Kota Samarahan pilot plants first produced 2,732 kg of chocolate in 2013. However, since then the production and sale of chocolate from the pilot plant was inconsistent. In 2013, the pilot plant produced chocolate of 2,732 kg and the sale was only 1,640 kg. In 2014, chocolate production
was 5,743 kg and the sale was only 2,618 kg, the gap between the production and sale in this year was around 46%. While in 2015, due to over-production of chocolate from last year, the Kota Samarahan pilot plants reduce current production to only 973 kg only. However, the sales remain stagnant around 2,635 kg. In 2016, chocolate sale and production increased to 3,190 kg and 3,033 kg respectively. However in 2017, both sale and production of chocolate declined by 104% and 52% to 1,563 kg and 2,000 kg respectively. In the first five years of Kota Samarahan pilot plant operation, its produce a total of 14,445 kg of chocolate, the sale made from this pilot plant was 11,647 kg, which show a surplus of production by 2,798 kg of chocolate. Figure 1 depicted the trend of sale and production of chocolates in Kota Samarahan pilot plant.

Malaysian Cocoa Journal 2019, Vol. 11
10
Figure 1. Kota Samarahan pilot plant’s sale and production of chocolates
Table 1 show the variable cost, sale price, profit and margin for chocolate block and praline produced by the Kota Samarahan pilot plant. The margin referred to the difference between the cost to make a product and the sale price or revenue. For the production of chocolate block, the highest margin was 31% for milk compound and 23% margin for milk and dark couverture. For the praline division, two products indicate a negative margin or in a loss
position which are almond and tebaloi milk compound. The variable cost is higher than the sale price by RM6.03 for almond milk compound and by RM3.23 for tebaloi milk compound, and this does not include the fixed cost. For praline couverture chocolates indicate a positive margin by 33% for plain couverture (the highest margin), 11% for tebaloi praline and 4% for almond praline.
Table 1. Variable cost, sale price, profit and margin for Kota Samarahan pilot plant’s products
Products Variable Cost (RM/kg)
Sale Price (RM/kg)
Profit (RM/kg)
Margin
Blo
ck Milk Compound 11.12 16 4.88 31%
Milk Couverture 19.24 25 5.76 23%
Dark Couverture 19.31 25 5.69 23%
Pra
line
Milk Compound (Almond) 36.03 30 -6.03 -20%
Milk Compound 22.43 30 7.57 25%
Milk Compound (Tebaloi) 35.23 32 -3.23 -10%
Couverture (Almond) 48.03 50 1.97 4%
Couverture 33.63 50 16.37 33%
Couverture (Tebaloi) 46.43 52 5.57 11%
RECOMMENDATION
Kota Samarahan pilot plant starts its operation in June 2013. However, the production and sale for Kota Samarahan’s chocolate products was not
consistent. In 2019, there was a plan to re-branding and commercialize the Kota Samarahan’s chocolate products with the name
of “Magnificent ChocS”. However, many aspects
need to be reviewed in order for sustainable and
Surplus of production by 46%

Malaysian Cocoa Journal 2019, Vol. 11
11
profitable operation of Kota Samarahan pilot plant. Price Based on the figures and tables show above, it is advisable to review the current sale price of chocolate products produce by the Kota Samarahan’s pilot plant as it is not cost effective.
There are two products with negative margin which are the compound praline with almond
and compound praline with tebaloi. The new price schedule was shown in Table 2. For the chocolate block segment, we aim for at least 30% of profit margin, the milk compound new price would be RM17.60, milk couverture is RM27.50 and dark couverture is RM27.50. The recommended new price for chocolate block is competitive, since the retail price for compound chocolate block around RM18 to RM22 in the market.
Table 2. New price recommendation and profit margin for Kota Samarahan’s products
Products Sale price
(RM/kg)
New recommended
Sale Price (RM/kg)
Variable cost
(RM/kg)
Profit (RM/kg)
Margin
Blo
ck Milk Compound 16.00 17.60 11.12 6.48 37%
Milk Couverture 25.00 27.50 19.24 8.26 30%
Dark Couverture 25.00 27.50 19.31 8.19 30%
Pra
line
Milk Compound (Almond) 30.00 52.00 36.03 15.97 31%
Milk Compound 30.00 33.00 22.43 10.57 32%
Milk Compound (Tebaloi) 32.00 50.00 35.23 14.77 30%
Couverture (Almond) 50.00 70.00 48.03 21.97 31%
Couverture 50.00 55.00 33.63 21.37 39%
Couverture (Tebaloi) 52.00 68.00 46.43 21.57 32%
Mini Bar 60.00 60.00 31.40 28.60 48%
For the praline section, the price for compound almond and compound Tebaloi will increase by 73% and 56% to RM52 and RM50 respectively. The current sale price is below cost; hence it is advisable to increase the sale price. For couverture almond and Tebaloi, the new recommended price will increase by 40% to RM70 for couverture almond and increase by 31% to RM68 for couverture Tebaloi. The gross profit margins for these two products will increase to 31% and 32% respectively.
Break-Even Point Table 3 shows the break-even point for the Kota Samarahan’s pilot plant with new recommended
price. The break-even point can be defined as a point where total cost and total sales are equal. Break-even point can be describes as a point where there is no net profit or loss. With the new recommended price, the break-even point for Kota Samarahan’s pilot plant is 3,375 kg with
total sales of RM88,395. In order for Kota Samarahan’s pilot plant to make positive profit, they need to sale more than 3,375 kg of chocolate and hit sale of more than RM88,395.

Malaysian Cocoa Journal 2019, Vol. 11
12
Table 3. Break-Even point for Kota Samarahan Pilot Plant
Category Share in Sales (%)
Price (RM)
Variable Cost
(RM/kg)
Fixed Cost (RM)
Break-Even
Point (kg)
Break-Even Point (RM)
Blo
ck Compound Milk 40 17.60 11.12 12,000 1,852 32,593
Couverture Milk 15 27.50 19.24 4,500 545 14,982
Couverture Dark 6 27.50 19.31 1,800 220 6,044
Pra
line
Compound Milk (Almond)
11 52.00 36.03 3,300 207 10,745
Compound Milk 12 33.00 22.43 3,600 341 11,239 Compound Milk
(Tebaloi) 1 50.00 35.23 300 20 1,016
Couverture (Almond) 4 70.00 48.03 1,200 55 3,823 Couverture 5 55.00 33.63 1,500 70 3,861
Couverture (Tebaloi) 1 68.00 46.43 300 14 946 Mini Bar 5 60.00 31.40 1,500 52 3,147
TOTAL/ WEIGHTED AVERAGE
100 46.06 30.29 30,000 3,375 88,395
Capacity Utilization Kota Samarahan pilot plant has two units of conche machines with total capacity of 28,500 kg of chocolate block per year or equal to 2,375 kg monthly. However, based on current
performance the Kota Samarahan pilot plant only utilize average 9% from its current total capacity for the first five years of operation (Figure 2).
Figure 2. Utilization of Kota Samarahan pilot plant
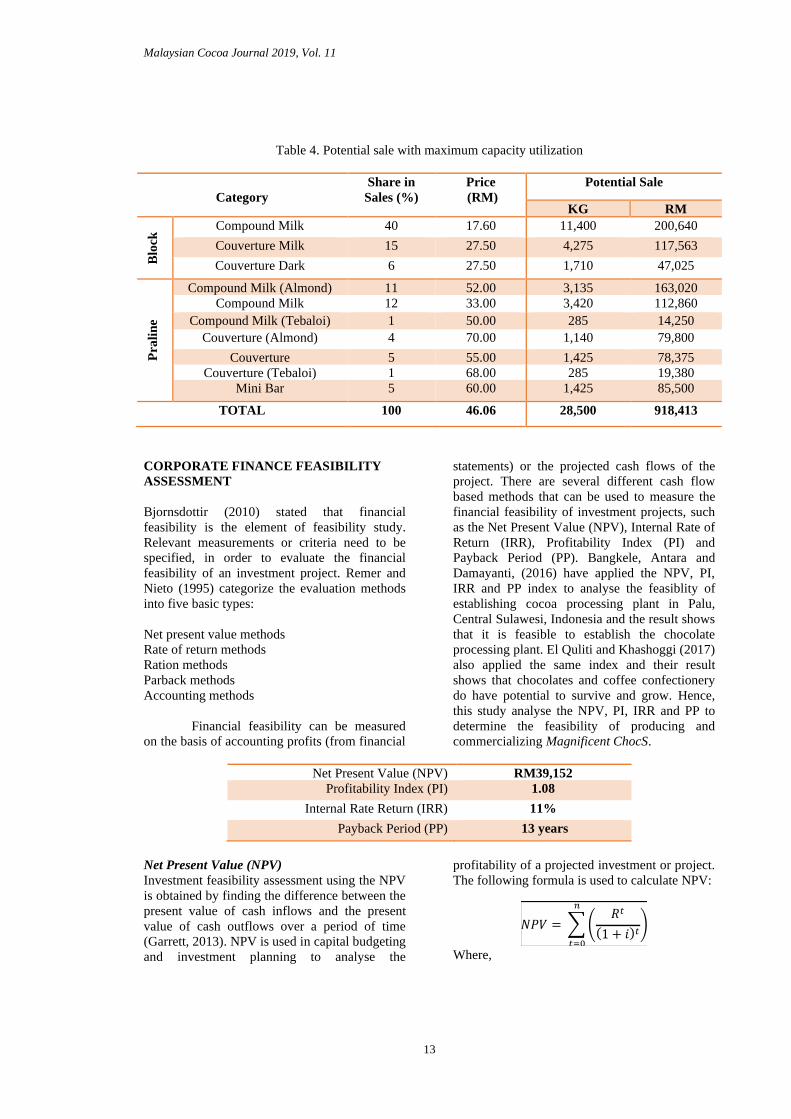
Table 4 shows the potential sale for Kota Samarahan pilot plant with maximum capacity utilization. If the Kota Samarahan pilot
plant able to produce 28,500 kilogram of chocolate, the potential gross profit for Kota Samarahan pilot plant is RM918,413.
9% 19% 11% 8% 6%
Malaysian Cocoa Journal 2019, Vol. 11
13
Table 4. Potential sale with maximum capacity utilization
Category
Share in Sales (%)
Price (RM)
Potential Sale
KG RM
Blo
ck Compound Milk 40 17.60 11,400 200,640
Couverture Milk 15 27.50 4,275 117,563
Couverture Dark 6 27.50 1,710 47,025
Pra
line
Compound Milk (Almond) 11 52.00 3,135 163,020 Compound Milk 12 33.00 3,420 112,860
Compound Milk (Tebaloi) 1 50.00 285 14,250 Couverture (Almond) 4 70.00 1,140 79,800
Couverture 5 55.00 1,425 78,375 Couverture (Tebaloi) 1 68.00 285 19,380
Mini Bar 5 60.00 1,425 85,500
TOTAL 100 46.06 28,500 918,413
CORPORATE FINANCE FEASIBILITY ASSESSMENT Bjornsdottir (2010) stated that financial feasibility is the element of feasibility study. Relevant measurements or criteria need to be specified, in order to evaluate the financial feasibility of an investment project. Remer and Nieto (1995) categorize the evaluation methods into five basic types: Net present value methods Rate of return methods Ration methods Parback methods Accounting methods Financial feasibility can be measured on the basis of accounting profits (from financial
statements) or the projected cash flows of the project. There are several different cash flow based methods that can be used to measure the financial feasibility of investment projects, such as the Net Present Value (NPV), Internal Rate of Return (IRR), Profitability Index (PI) and Payback Period (PP). Bangkele, Antara and Damayanti, (2016) have applied the NPV, PI, IRR and PP index to analyse the feasiblity of establishing cocoa processing plant in Palu, Central Sulawesi, Indonesia and the result shows that it is feasible to establish the chocolate processing plant. El Quliti and Khashoggi (2017) also applied the same index and their result shows that chocolates and coffee confectionery do have potential to survive and grow. Hence, this study analyse the NPV, PI, IRR and PP to determine the feasibility of producing and commercializing Magnificent ChocS.
Net Present Value (NPV) RM39,152
Profitability Index (PI) 1.08
Internal Rate Return (IRR) 11%
Payback Period (PP) 13 years
Net Present Value (NPV) Investment feasibility assessment using the NPV is obtained by finding the difference between the present value of cash inflows and the present value of cash outflows over a period of time (Garrett, 2013). NPV is used in capital budgeting and investment planning to analyse the
profitability of a projected investment or project. The following formula is used to calculate NPV:
Where,

Malaysian Cocoa Journal 2019, Vol. 11
14
= net cash inflow – outflows during a single period t = discount rate of return that could be earned in
alternative investments = number of time periods
A positive net present value indicates that the projected earnings generated by a project or investment exceed the anticipated costs. The NPV for Kota Samarahan pilot plant is positive with value of RM39,152, which dictates that the investment should be continued. Profitability Index (PI) The profitability index is an index that attempts to identify the relationship between the costs and benefits of a proposed project through the use of a ratio calculated as:
A profitability index of 1.0 is logically the lowest acceptable measure on the index, as any value lower than 1.0 would indicate that the project’s is not profitable. The profitability index
for Kota Samarahan pilot plant is 1.08 which indicates that the project’s present value is more
than the initial investment. Internal Rate of Return (IRR) Internal rate of return (IRR) is a tool to measure the internal rate of return of the results of the company. If the IRR is greater than the value of lending, the business establishment will be declared as decent, but on the contrary, if the value IRR is less than the amount of credit interest, the business activities will be declared as unfit. Based on the results of the calculation of the IRR found that the results obtained are greater than the benefits required 11% > 10%, then the project establishment of Kota Samarahan pilot plant is feasible. Payback Period (PP) The payback period is an engineering assessment of the length of time of the return on investment of a project venture. The shorter the time from a payback period it will be smaller the investment risk faced by the investors, it will further attract the investors to invest in a project. Based on calculations obtained from the payback period (PP) 13 years are required for all funds
invested in the project to be readmitted, hereinafter all of the net cash flow received after 13 years will be a net gain for Malaysian Cocoa Board. CONCLUSIONS
This study has shown that the production and commercialization of “Magnificent ChocS” is feasible. However, many aspects need to be improved especially in the costing and marketing aspect. The production cost need to be further reduced to achieve comfortable remuneration to Malaysian Cocoa Board. Brand awareness of “Magnificent ChocS” need to be
established in the market. Brand awareness is important because it helps the product to stand out above their competition. Marketing and promotional activities need to be intensified in order to establish a strong foundation of consumer for “Magnificent ChocS”. ACKNOWLEDGEMENT
The authors would like to thanks YBhg. Datin Norhaini Udin, The Director-General, Malaysian Cocoa Board for the permission to present this paper and Mrs Harnie Hj. Harun, the Director of Market Development and Economy Division for their review and encouragement throughout this study. REFERENCES
Bangkele, E.M., Antara, M., & Damayanti, L. (2016). Cocoa processing industry feasibility analysis (case study in house of chocolate department of industry Central Sulawesi province) in Palu. The Agriculture Science Journal, 1: 57-70.
Bjornsdottir, A.R. (2010). Financial feasibility
assessments: Building and using assessment models for financial feasibility analysis of investment projects. University of Iceland.
El Quliti, S.A., & Khashoggi, G.A. (2017). A
feasility study for snacks manufacturing/ retailing investment project. American Scientific Research Journal for Engineering, Technology and Science, 31(1): 1-23.

Malaysian Cocoa Journal 2019, Vol. 11
15
Garrett, S.J. (2013). Project appraisal and investment performance. In Introduction to the mathematics of finance (Second edition): A deterministic approach (pp. 95-119). Institute and Faculty of Actuaries.
Remer, D.S., & Nieto, A.P. (1995). A
compendium and comparison of 25 project evaluation techniques. Part 1: Net present value and internal rate of return methods. International Journal of Production Economics, 42: 79-96.

Malaysian Cocoa Journal 2019, Vol. 11
16
FLUORESCENCE SENSING DURING CACAO POD DEVELOPMENT: SOME PRELIMINARY RESULTS
Tee, Y.K.1, Balasundram, S.K.2, Ding, P.3 and Husni, M. H.A4
1Cocoa Upstream Technology Division, Cocoa Research & Development Centre Bagan Datuk, Malaysian Cocoa Board, P.O. Box 30, Sg. Dulang Road, 36307 Sg. Sumun, Perak Malaysia.
2Department of Agriculture Technology, Faculty of Agriculture, Universiti Putra Malaysia, 43400 Serdang, Selangor, Malaysia.
3Department of Crop Science, Faculty of Agriculture, Universiti Putra Malaysia, 43400 Serdang, Selangor, Malaysia.
4Department of Land Management, Faculty of Agriculture, Universiti Putra Malaysia, 43400 Serdang, Selangor, Malaysia.
Corresponding author email: [email protected]
Malaysian Cocoa J. 11: 16-22 (2019) ABSTRACT - Quantification of secondary metabolites that control the external pigmentation in cacao pods can serve as a useful indicator of pod maturity. Typically, such quantification is done using a wet chemistry approach that is not only laborious but costly. Non-destructive and rapid methods to estimate these metabolites are necessary. In this study, the contents of anthocyanin, flavonol, chlorophyll and nitrogen balance were determined monthly over a period of 5 months after flower fertilization using a multi-parametric fluorescence sensor. Fluorescence sensing was carried out on cacao pods from five different clones, i.e., DESA 1, KKM 22, KKM 25, MCBC 1 and PBC 221. Significant differences in concentrations of anthocyanin, flavonol and chlorophyll, and nitrogen balance were observed across different clones and across different pod development stages. As pods matured, anthocyanin and flavonol concentration increased while chlorophyll concentration and nitrogen balance decreased. Among these clones, as expected, the natural red appearance in DESA 1 pods corresponded to the highest concentration of anthocyanin (0.637), followed by KKM 22 (0.255). There was no significant difference in anthocyanin concentration in KKM 25, MCBC 1 and PBC 221. During pod development, MCBC 1 showed the lowest flavonol concentration. Chlorophyll concentration in KKM 22 and MCBC 1 were lower compared to the other clones. This work suggests that non-destructive fluorescence-based indices can be used to estimate secondary metabolites in cacao pods. Key words: Fluorescence sensing, cocoa pod development, secondary metabolites, flavonoids, non-destructive, pod maturity INTRODUCTION Cacao (Theobroma cacao) is a perennial tropical crop that produces pods continuously to sustain the large market demand for chocolate. Good quality of cacao beans accounts for high price rate is much depends on pod maturity during harvesting. There are several factors account for the poor quality of cacao produced by some farmers in Malaysia, including poor fermentation and wrong harvesting time of pods. Pods which are harvested immature or over-ripe may influence the quality of the beans during fermentation. After harvesting, the beans are extracted from the pods prior to fermentation, drying and roasting and these processes contribute
significantly to the development of cacao flavor (Afoakwa et al., 2007; Afoakwa et al., 2008; Beckett, 2008; Fowler, 2009; Adeyeye et al., 2010; Owusu et al., 2012). Thus, harvesting pod at the right timing with optimum maturity stages is important because it influences the subsequent process to develop good flavor of beans. For farmers, pod maturity with good bean quality is usually related to pod size and appearance changes of color during harvesting. However, pods with different cultivars perform distinct characteristics in terms of pod color, shape and size. Sometimes, it is hard to identify the maturity stages of pods due to its similar color

Malaysian Cocoa Journal 2019, Vol. 11
17
changes during pod development and maturity. So, the detection of pigments, flavonoids and nitrogen content in cacao pods is expected to serve as a combined indicator to determine pod maturity indices among different cacao cultivars. Cacao possesses compounds such as pigments and flavonoids, which includes anthocyanin and flavonol in pods. There are many factors can affect the biosynthesis of these compounds in the pod during development such as genetic differences, soil characteristics, environmental changes and cultural practices. The composition of these compounds may vary significantly depending on the cultivars (Mattivi et al., 2006). Thus, precision agriculture by applying the optical method of fluorescence sensor has became a great tool to assess the variability of cacao pods at different maturity stages from young until harvesting. This technology allows rapid and non-destructive measurements of cacao pods and hence enables the monitoring of the pigments and flavonoid contents throughout cacao ripening (Tuccio et al., 2011).
MATERIAL AND METHODS Plant material Five cultivars of cacao (DESA 1, KKM 22, KKM 25, MCBC 1 and PBC 221) were collected from the field plot (N 03°53.752' E 100°52.061') in the Research and Development Centre Bagan Datuk. A total of 125 cacao pods at one-month until five-month old after flower fertilization were labeled and data were taken at the field. Fluorescence equipment Cacao pods at different maturity stages were measured using the Multiplex 3® (Force-A, Orsay, France) sensor. The sensor consisted of a fluorimeter with six light-emitting diode sources in the UV-A (370 nm), and the blue (470 nm), green (516 nm) and red (635 nm) spectral regions. The excitation light of the light-emitting diodes was pulsed sequentially at 240 Hz with 45 µs per flash and synchronised with the photodiode detectors to record the fluorescence signals. According to Ben Gozlen et al. (2010), the combinations of fluorescence signals in the red at 680-690 nm (RF)
and far-red at 730-780 nm (FRF) were acquired with the different excitation bands which provide the following indices of anthocyanin (ANTH), flavonol (FLAV), chlorophyll (CHL) and nitrogen balance index (NBI): ANTH = log (FRFred / FRFgreen) (1) FLAV = log (FRFred / FRFUV) (2) CHL = FRFred / RFred (3) NBI = FRFUV / RFgreen (4) Measurements were taken by keeping in contact the cacao pods with a 4 cm diameter window of the sensor at a distance of 0.1 m from the sources and detectors. Statistical analysis A 5x5 factorial experiment was conducted (five cacao cultivars and five maturity stages) and data was analyzed using Statistical Analysis System (SAS Institute, 2002). Multiple mean comparisons were analyzed by using Least Significant Difference (LSD). Results were further computed in graphs to study the trend of each parameter during pod development and were displayed as means ± standard error using Microsoft Excel (Microsoft Corporation, 2003).
RESULTS AND DISCUSSION Changes of fluorescence indices on cacao cultivars during pod development and maturity There were significant differences (P≤0.05)
observed between the interaction of five different cacao clones and pod development periods in flavonol, chlorophyll and nitrogen balance contents (Table 1). For the anthocyanin, according to the definition expressed in Equation 1, the anthocyanin index increased proportionally with the anthocyanin content. From the study, DESA 1 was expected to have significantly higher anthocyanin compared to other cultivars due to its natural red pod color. Therefore, the optimal localization of anthocyanin in the epidermis of DESA 1 enables them to efficiently filter part of the green excitation light travelling towards the chlorophyll molecules in the pod layers (Lancaster et al., 1994; Bae et al., 2006). Furthermore, the anthocyanin content increased by 50.4% as the pod

Malaysian Cocoa Journal 2019, Vol. 11
18
matured at five months after fertilization compared to young and growing pod at one month after fertilization (Table 1). This indicated that with increasing anthocyanin concentration, the green
light was attenuated much more than the red excitation light. Similar trend was also observed for flavonol where the content increased as the pod matured.
Table 1. Changes of fluorescence indices in cacao pods of five cultivars harvested at five maturity stages. Factor Fluorescence indices
Anthocyanin Flavonol Chlorophyll Nitrogen balance Clones (C)
DESA 1 0.637az 0.844a 1.214a 1.141a KKM 25 0.100c 0.893a 1.249a 0.387c KKM 22 0.255b 0.856a 1.050b 0.504c MCBC 1 0.140c 0.276c 1.155ab 1.071a PBC 221 0.100c 0.612b 1.266a 0.744b
** ** * ** Months after
fertilization (M)
1 0.232b 0.329c 1.221b 1.299a 2 0.252b 0.347c 1.247b 1.205a 3 0.222b 0.607b 1.312ab 0.812b 4 0.177b 1.053a 1.413a 0.366c 5 0.349a 1.145a 0.739c 0.164d * ** ** **
Interactions C x M n.s. ** * **
Z Means followed by the same letter in the same column separately are not significantly different by DMRT at P˃0.05. n.s., *, ** Non-significant different at P˃0.05 or significant difference at P≤0.05 or P≤0.01, respectively. Changes of fluorescence indices pattern among clones In the Multiplex sensor, chlorophyll index was denoted as FRF / RF (equation 3) and chlorophyll absorption spectrum was partially overlays the chlorophyll red fluorescence, therefore, re-absorption occurred at the chlorophyll in the pod layers when the RF signal at 680 nm was emitted inside the pod before reaching the detector (Ramos and Lagorio, 2006). However, the FRF signal is not affected by re-absorption. Thus, the index increases when the chlorophyll concentration increases. In this study, chlorophyll and nitrogen contents in cacao pods decreased as pod maturity progressed (Table 1).
Both of the non-destructive indices of anthocyanin and flavonol showed sudden increased at five-month old of cacao pod, where the pods are matured and ripened, except cultivar of DESA 1 (Figure 1). The accumulation of flavonoids, including anthocyanin and flavonol as pod matured, can be explained by the multiple functional roles played by flavonoids in operating as antioxidant compounds to overcome the light induce oxidative stress (Agati and Tattini, 2010). In addition, the increased in flavonoids of anthocyanin and flavonol might be primarily due to the loss of chlorophyll but also due to changes in optical properties (Agati et al., 2007).

Malaysian Cocoa Journal 2019, Vol. 11
19
Figure 1. Non-destructive indices of anthocyanin (A) and flavonol (B) of five cacao cultivars during pod development. In contrast, the chlorophyll content showed sudden decrease at the five-month old pods across all the cultivars (Figure 2A). This indicated that the pods were matured and ripened at that period with chlorophyll being degraded at the thylakoid membrane through chlorophyllase and oxidase enzymes (Shemer et al., 2008). Recent studies reported that the content of flavonoids
(anthocyanin and flavonol) increases as nitrogen availability decreases (Bragazza and Freeman, 2007; Liu et al., 2010) which is also generally inversely related to chlorophyll content and these findings were coincided to the results analyzed in cacao.
A
B

Malaysian Cocoa Journal 2019, Vol. 11
20
Figure 2. Non-destructive indices of chlorophyll (A) and nitrogen balance (B) of five cacao cultivars during pod development. CONCLUSIONS Non-destructive fluorescence-based indices can be used to estimate secondary metabolites in cacao pods. These estimates vary across cacao clones and cacao pod development stages. The findings can be applied at the field during harvesting to ensure the pods are harvested at optimum maturity and thus control the quality of the beans.
ACKNOWLEDGEMENT
The study was financially supported under 11th Malaysian Plan, Economical Planning Unit from the Prime Minister’s Department: Integration of
cocoa with other commodities and pilot-plot of precision farming (P20001001116002). We gratefully thank the Ministry of Primary Industries (MPI) for their long-term support for our research. Special thanks to the Director General of
A
B

Malaysian Cocoa Journal 2019, Vol. 11
21
Malaysian Cocoa Board and the Director of Cocoa Upstream Technology, Malaysian Cocoa Board for their kind approval in publishing this research.
REFERENCES Adeyeye, E.I., Akinyeye, R.O., Ogunlade, I.,
Olaofe, O. and Boluwade, J.O. (2010). Effect of farm and industrial processing on the amino acid profile of cocoa beans. Food Chemistry 118: 357-363.
Afoakwa, E.O., Paterson, A. and Fowler, M.
(2007). Factors influencing rheological and textural qualities in chocolate – a review. Trends in Food Science and Technology 18: 290-298.
Afoakwa, E.O., Paterson, A., Fowler, M. and
Ryan, A. (2008). Flavour formation and character in cocoa and chocolate: a critical review. Critical Reviews in Food Science and Nutrition 48: 840-857.
Agati, G., Meyer, S., Matteini, P. and Cerovic, Z.
G. (2007). Assessment of anthocyanins in grape (Vitis vinifera L.) berries using a non-invasive chlorophyll fluorescence method. Journal of Agriculture and Food Chemistry 55: 1053-1061.
Agati G and Tattini M, (2010). Multiple functional
roles of flavonoids in photoprotection. New Phytology 186:786–793.
Bae, R.N., Kim, K.W., Kim, T.C. and Lee, S.K.
(2006). Anatomical observations of anthocyanin rich cells in apple skins. Hortscience 41: 733–736.
Bragazza, L. and Freeman, C. (2007). High
nitrogen availability reduces polyphenol content in Sphagnum peat. Science of the Total Environment 377: 439-443.
Beckett, S.T. (2008). The Science of
Chocolate. Second edition. Royal Society of Chemistry Paperbacks, London, UK.
Ben Ghozlen, N., Cerovic, Z. G., Germain, C,. Toutain, S. and Latouche, G, (2010). Non-destructive optical monitoring of grape maturation by proximal sensing. Sensors 10: 10040–10068.
Fowler, M.S. (2009). Cocoa beans: From Tree
to Factory. In: Industrial Chocolate manufacture and use. Fourth Edition. Beckett ST (eds) Wiley-Blackwell Science, Oxford, UK. pp 137-152.
Lancaster, J.E., Grant, J.E., Lister, C.E. and
Taylor, M.C. (1994). Skin color in apples – Influence of copigmentation and plastid pigments on shade and darkness of red color in five genotypes. Journal of the American Society for Horticultural Science 119:63–69.
Liu, W., Zhu, D.W., Liu, D.H., Geng, M.J., Zhou,
W.B., Mi, W.J., Yang, T.W. and Hamilton, D. (2010_. Influence of
nitrogen on the primary and secondary metabolism and synthesis of flavonoids in
Chrysanthemum morifolium Ramat. Journal of Plant Nutrition 33: 240–254.
Mattivi, F., Guzzon, R., Vrhovsek, U., Stefanini,
M. and Velasco, R. (2006). Metabolite profiling of grape: flavonols and anthocyanins. Journal of Agriculture and Food Chemistry 54: 7692–7702.
Owusu, M., Petersen, M.A. and Heimdal, H.
(2012). Effect of fermentation method, roasting and conching condition on the aroma volatiles of dark chocolate. Journal of Food Processing and Preservation 36(5): 446-456.
Ramos, M.E. and Lagorio, M.G. (2006). A model
considering light reabsorption processes to correct in vivo chlorophyll fluorescence spectra in apples. Photochemical and Photobiological Sciences 5: 508–512.
Shemer, T.A., Harpaz-Saad, S., Belausov, E.,
Lovat, N., Krokhin, O. and Spicer, V.

Malaysian Cocoa Journal 2019, Vol. 11
22
(2008). Citrus chlorophyllase dynamics at ethylene-induced fruit color-break: a study of chlorophyllase expression, posttranslational processing kinetics, and in situ intracellular localization. Plant Physiology 148: 108–118.
Tuccio, L., Remorini, D., Pinelli, P., Fierini, E.,
Tonutti, P., Scalabrelli, G. and Agati, G. (2011). Rapid and non-destructive method to assess in the vineyard grape berry anthocyanins under different seasonal and water conditions. Australian Journal of Grape and Wine Research 17: 181–187.

Malaysian Cocoa Journal 2019, Vol. 11
23
THE EFFECTIVENESS OF SYSTEMIC FUNGICIDES IN CONTROLLING VASCULAR STREAK DIEBACK (VSD) ON MATURE COCOA TREE
Suhaida, S.1, Shari Fuddin, S.2, Alias, A.3, Roselee, O.3 and Ali, K.3
1Malaysian Cocoa Board, Cocoa Research and Development Centre, Jengka 23 Road, P.O. Box 34, 28000 Temerloh, Pahang.
2Malaysian Cocoa Board, Cocoa Research and Development Centre, Batu 10, Apas Road, P.O. Box 60237, 91012 Tawau, Sabah.
3Malaysian Cocoa Board, Cocoa Research and Development Centre, P.O. Box 30, Sungai Dulang Road, 36307 Sungai Sumun, Perak.
Corresponding author email: [email protected]
Malaysian Cocoa J. 11: 23–26 (2019) ABSTRACT - Vascular streak dieback (VSD), caused by Ceratobasidium theobromae (P.H.B. Talbot & Keane), has a considerable impact on cacao (Theobroma cacao L.) production in Southeast Asia. The pathogen can kills branches of mature cocoa trees, but serious damaging may occurs if the pathogen infest on cocoa seedlings less than ten months old. The common practices for controlling VSD are using fungicides, resistant planting materials and cultural practices. This study has evaluated the potential of systemic fungicides namely difenoconazole and tebuconazole in controlling VSD on mature cocoa trees. The treatments were applied followed concentration recommended by manufacturer every 2 weeks. Foliar sprays of these fungicides were effectively reduced the VSD symptoms only for 8 to 11 months of application. However, on the following months the disease were failed to be suppressed. Different method might need to be investigated to enhance the effectiveness of these fungicides in controlling VSD at cocoa field. Key words: Cocoa, fungicides, vascular streak dieback INTRODUCTION Vascular streak dieback (VSD) of cocoa (Theobroma cacao), caused by the basidiomycete fungus Ceratobasidium theobromae (syn. Oncobasidium theobromae) is one of the most threatening diseases on cocoa in Southeast Asia and Melanesia regions. Keane and Turner were first revealed this problem in Malaysia in 1971, where they found particular form of VSD symptoms similar with recorded in Papua New Guinea (Zainal Abidin, 1982). Since then, it was reported to be potentially destructive disease on cocoa in Malaysia by several researchers. Vascular streak dieback causes cocoa branches dieback with infections capable of killing seedlings and mature cocoa trees. The symptoms includes three blackened vascular traces on leaf abscission scars, chlorosis and necrosis of leaves, enlarged lenticels causing roughening of the bark and dark streaks within the vascular tissue (Guest and Keane, 2007). Currently, VSD is controlled by cultural practices, resistance planting materials and chemicals. Since VSD is a systemic disease, the
application of systemic fungicides had been suggested. Guest and Keane (2007) reported that systemic ergosterol biosynthesis inhibiting fungicides, such as flutriafol, hexaconazole, propiconazole, tebuconazole, and triadimenol, have a potential in suppressing VSD in seedlings and mature cocoa trees. In Malaysia, triadimenol has been extensively used in commercial cocoa plantations. However, all triadimenol-based fungicide is no longer available in Malaysia market. So, evaluation of alternative fungicide is important to prevent the outbreak of this disease. According to the study done by Choong and Ng (1990), tebuconazole and difenoconazole also have a good potential in controlling VSD on cocoa seedlings. However, very little information is available on the effectiveness of these fungicides in suppressing VSD on mature cocoa trees in Malaysia as well as in other countries in the world. Hence, the aim of this study was to determine the efficacy of tebuconazole and difenoconazole against VSD on mature cocoa trees.

Malaysian Cocoa Journal 2019, Vol. 11
24
MATERIALS AND METHODS This study was conducted at Cocoa Research and Development Centre (CRDC) Bagan Datuk, Perak. Eight-year-old of mature cocoa trees were used and all infected branches were removed prior to evaluation. Two different fungicides were selected due to their effectiveness in controlling VSD at seedlings stage which are tebuconazole and difenoconazole. Application of these treatments was done by spraying over tree branches every 2 weeks interval following the manufacturer’s recommended rate.
The trees were individually assessed for VSD symptoms monthly for 18 months. The symptoms were scored from 0 to 6 (Table 1), according to modified method proposed by Efron et al. (2002) and Ahmad Kamil et al. (2006). The severity rating was then transformed into percentage disease reduction and calculated using the equation by Omar et al. (2006) as follows: DR = [1− DT/DC] × 100 where: DR = disease reduction DT = disease percentages in treatments DC = disease percentages in control
Table 1. Severity scale used for disease assessment of VSD
Severity scale
Primary symptom severity of a flush Associated symptom
0 Apparently uninfected or healthy Leaves glossy, healthy 1 One or two infected leaves; infected leaves
showing early signs of symptoms-loss of glossiness or shine; discrete brown vascular bundles on petiole of leaf scar or midrib of the leaf lamina.
Smooth bark of twigs or stem no swollen lenticels
2 Few infected leave, one showing or more showing chlorosis in progress
Lenticels on bark may or may not be swollen
3 Some leaves infected; one infected leaf abscised; one or more of the leaves showing chlorosis and necrosis in progress
Lenticels on bark may or may not be swollen
4 Two infected leaves abscised, some or all of the remaining leaves showing chlorosis and/or partial necrosis
Lenticels on bark may or may not swollen
5 Three or more infected leaves have abscised; remaining leaves infected, chlorotic or necrotic; apparent cessation of growth (of first flush)
Lenticels usually swollen; fruit bodies may or not be present
6 Near complete or complete defoliation from abscission of infected leaves; dieback (first flush) in progress as indicated by the drying of the twig/stem.
Lenticels usually swollen; fruit bodies may or may not be present; may or may not be any proliferation of auxiliary shoots.
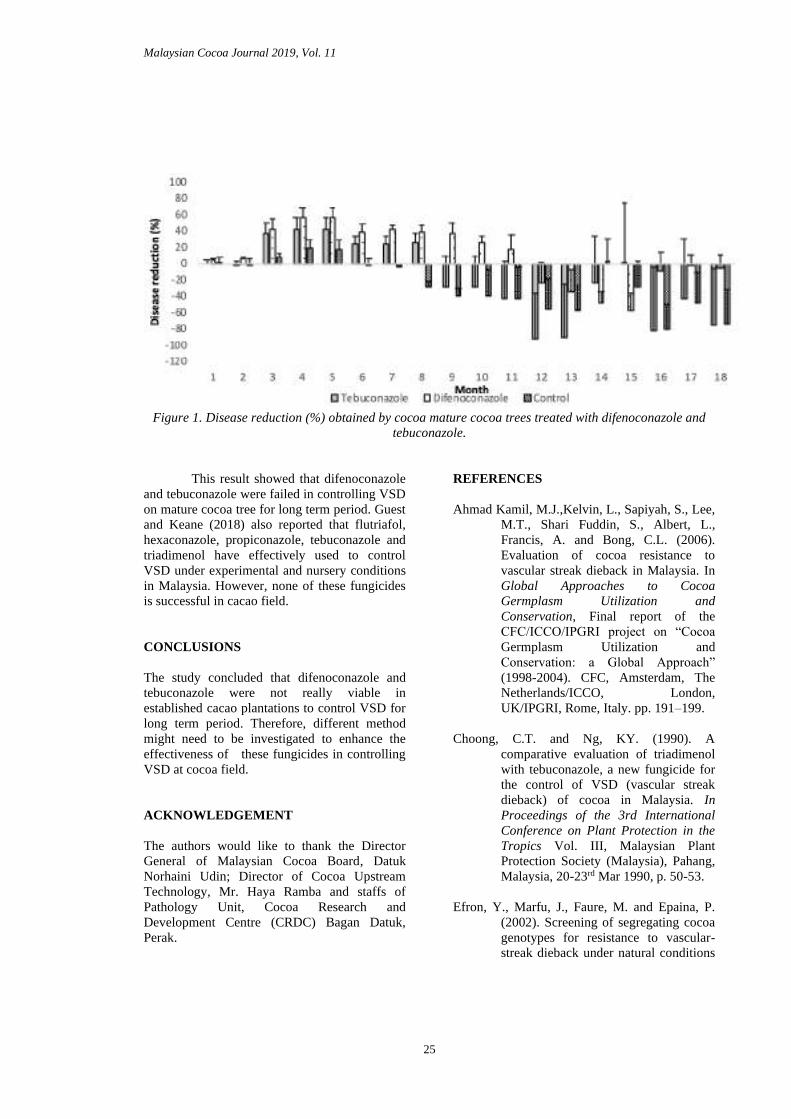
The data of percentage disease reduction were subjected to one-way analysis of variance (ANOVA) and the means were compared using fisher test at p ≤ 0.05. RESULTS AND DISCUSSION Tebuconazole and difenoconazole is a triazol, sterol biosynthesis-inhibiting and systemic fungicide, widely used against various economically important diseases of crops grown not only in the temperature, but also in the tropical and sub-tropical regions (Choong and Ng, 1990).The effect of these fungicides on mature cocoa trees was presented on Figure 1. These fungicides were effectively reduced the
VSD symptoms only for 8 to 11 months of application. However, on the following months the disease was failed to be suppressed which giving negative disease reduction values. Tebuconazole and difenoconazole might only can prevent the penetration of spores on the cocoa leaves for the first 8 to 11 months. The increasing number of spores on the leaves on the following months has reduce the effectiveness of these chemicals.
Malaysian Cocoa Journal 2019, Vol. 11
25
Figure 1. Disease reduction (%) obtained by cocoa mature cocoa trees treated with difenoconazole and
tebuconazole. This result showed that difenoconazole and tebuconazole were failed in controlling VSD on mature cocoa tree for long term period. Guest and Keane (2018) also reported that flutriafol, hexaconazole, propiconazole, tebuconazole and triadimenol have effectively used to control VSD under experimental and nursery conditions in Malaysia. However, none of these fungicides is successful in cacao field.
CONCLUSIONS The study concluded that difenoconazole and tebuconazole were not really viable in established cacao plantations to control VSD for long term period. Therefore, different method might need to be investigated to enhance the effectiveness of these fungicides in controlling VSD at cocoa field. ACKNOWLEDGEMENT The authors would like to thank the Director General of Malaysian Cocoa Board, Datuk Norhaini Udin; Director of Cocoa Upstream Technology, Mr. Haya Ramba and staffs of Pathology Unit, Cocoa Research and Development Centre (CRDC) Bagan Datuk, Perak.
REFERENCES Ahmad Kamil, M.J.,Kelvin, L., Sapiyah, S., Lee,
M.T., Shari Fuddin, S., Albert, L., Francis, A. and Bong, C.L. (2006). Evaluation of cocoa resistance to vascular streak dieback in Malaysia. In Global Approaches to Cocoa Germplasm Utilization and Conservation, Final report of the CFC/ICCO/IPGRI project on “Cocoa
Germplasm Utilization and Conservation: a Global Approach”
(1998-2004). CFC, Amsterdam, The Netherlands/ICCO, London, UK/IPGRI, Rome, Italy. pp. 191–199.
Choong, C.T. and Ng, KY. (1990). A
comparative evaluation of triadimenol with tebuconazole, a new fungicide for the control of VSD (vascular streak dieback) of cocoa in Malaysia. In Proceedings of the 3rd International Conference on Plant Protection in the Tropics Vol. III, Malaysian Plant Protection Society (Malaysia), Pahang, Malaysia, 20-23rd Mar 1990, p. 50-53.
Efron, Y., Marfu, J., Faure, M. and Epaina, P.
(2002). Screening of segregating cocoa genotypes for resistance to vascular-streak dieback under natural conditions

Malaysian Cocoa Journal 2019, Vol. 11
26
in Papua New Guinea Australasian. Plant Pathology, 31: 315–319.
Guest, D. and Keane, P. (2007). Vascular-Streak
Dieback: A new encounter disease of cacao in Papua New Guinea and Southeast Asia caused by the obligate basidiomycete Oncobasidium theobromae. Phytopathology, 97: 1654–1657.
Guest, D. and Keane P.J. (2018). Cacao
diseases: vascular-streak dieback. 10.19103/AS.2017.0021.18.
Keane, P.J. and Turner P.D. (1971). Vascular
Streak die-back of cocoa in West Malaysia. In Proceeding of the Cocoa and Coconut Conference. Kuala Lumpur.
Omar, I., O’Neill, T.M. and Rossall, S. (2006).
Biological control of fusarium crown and root rot of tomato with antagonistic bacteria and integrated control when combined with the fungicide carbendazim. Plant Pathology, 55: 92–
99. Zainal Abidin, M. A. (1982). Vascular streak
dieback of cocoa in West Malaysia. Published master dissertation, Universiti Putra Malaysia.

Malaysian Cocoa Journal 2019, Vol. 11
27
EFFECT OF STORAGE TEMPERATURE ON VIABILITY AND VIRULENCE OF Beauveria bassianna CONIDIOSPORES
Shari Fuddin, S. and Stephen, M.
Cocoa Research and Development Center, Mile 10 Apas Road, P.O. Box 60237, 91012 Tawau, Sabah
Corresponding author: [email protected]
Malaysian Cocoa J. 11: 27–28 (2019) ABSTRACT - Effect of different storage temperatures on conidiospores of the entomopathogenic fungus Beauveria bassiana strain LKM/140 were investigated. The aim of this study was to get the information on the shelf-life of the conidiospores. The experiment proceeded at control temperatures of 4°C and at room temperature. The evaluation was based on vitality bioassays germination. The germination differed between temperatures as well as between carriers. Nutritive carrier was found to be the most suitable for storage of B. bassiana conidia in all aspects, especially when kept at low temperatures. The germination rate was 95.7% after storage at 4°C for 90 days. On the other results, it showed poor worse effects revealed in unformulated conidia stored at 22°C (germination rate 13.33% after 90 days). Key words: Beauveria bassiana, biopesticides, biological control INTRODUCTION Beauveria bassiana Vuillemin (Deuteromycotina: Hyphomycetes) is an entomopathogenic fungus known to have a wide host range. This fungus has been studied as a microbial control agent of insect pests in various areas. It is a promising fungal biocontrol agent in management of cocoa pod borer, Conopomorpha cramerella (Shari et al., 2016). Mass scale production of the fungal and medium for formulation must be considered compatible. It will influence their shelf-life during storage and field performance. Apart from media, temperature and moisture content are also the major factors which influence conidial longevity in term of the rate of germination, growth, sporulation and survival of entomopathogenic Hyphomycetes (Hong et al., 1997). Carriers should be non-inhibitory to conidia and at the same time should maintain viability during storage. The aim of this study was to find the suitable storage temperature of the spores of B. bassiana strain LKM/140. MATERIALS AND METHODS A total of 24 packets B. bassiana (unformulated conidia and mixed with carrier) are stored in two controlled conditions which are at room temperature and 4°C (inside a refrigerator). Each packet contains 0.1 grams of conidia and the experiment proceeded throughout one year
duration. Samples will be analyzed within 30 days interval. Conidial suspension was prepared by mixing of dry formulated (F) and unformulated (UF) conidia samples with sterile 0.05% Tween 80. The number of conidia was adjusted to the final concentration of 1.0 x 10⁷ conidia/ml. A 100µL of the solution was then transferred to MEA (Malt Extract Agar) growth media and flattened using L-shaped glass rod and incubated for 24 hours. Percentage of germination was determined by viewing the number of germinate and dead spores under the microscope. RESULTS AND DISCUSSION Most previous study on viability of the conidiospores were conducted within 3 month of evaluation. We conducted a study for one year assessments to look for the performance of the fungal growth against time. Vitality of stored spores of B. bassiana depended on the storage temperature as well as on the carrier formulated. Figure 1 showed a viability of spores decreased over time and the differences among two storage temperatures. The highest percentage of germinating conidia (97.53% after 90 days of storage) was observed at conidia formulated with carrier at 22°C. It support the finding reported by Jana (2009) and Ali Derakhshan et al. (2008) that decrease in temperature will increase the longevity of conidia of B. bassiana.

Malaysian Cocoa Journal 2019, Vol. 11
28
Figure 1. A percentage germination of conidiospores at different temperature
The shelf-life of the biopesticides product can be best at 90 days of storage which is a viable requirement for any biopesticide product should be. It also showed that germination of the spores within one year of evaluation was up to 89.02% at 22°C. However, it is still able to store up to 7 months at refrigerator temperature with 95.05% germination. It is necessary to know how the spores are influenced with temperature storage condition since it is proposed to apply to farmers cocoa field with unpredictable temperature changes. The product may be suitable within 1 to 2 months after packaging as the result showed decreasing 100% growth rate to 91.82% at normal room ambient temperature. In addressing these limiting factors, careful steps should be taken in handling this product in order to prolong their shelf life.
ACKNOWLEDGEMENT The authors would like to thank all the staff at Pilot Plant of Biopesticide Production for their kind assistance throughout the study.
REFERENCES Ali Derakhshan, Rabindra, R.J. and Ramanujam,
B. (2008). Effect of storage conditions of formulations on viability of Verticillium lecanii (Zimmerman) Viegas and its virulence to Brevicoryne brassicae (L.). Journal of Biological Sciences 8: 498-501
Hong, T.D., Ellis, R.H. and Moore, D. (1997).
Development of a model to predict the effect of temperature and moisture on fungal spore longevity. Ann. Bot. 79: 121-128.
Jana. S. (2009). Influence of different storage
conditions on vitality and virulence of Beauveria bassiana spores. Journal of Agrobiology 26(2): 75-81.
Shari Fuddin, S. and Stephen M. and Mohd
Hadizam, M.B., (2016). Field Evaluation on the potential of Beauveria bassiana to control the cocoa pod borer in Malaysia. Malaysian Cocoa Journal, 9(2): 93-96.
Malaysian Cocoa Journal 2019, Vol. 11
29
FOGGING TECHNIQUE: WERE DIFFERENT RATES OF INSECTICIDE INFLUENCED THE EGGS AND ADULT OF Conopomorpha cramerella?
Saripah, B.
Malaysian Cocoa Board, 5-7th Floor, Wisma SEDCO, Lorong Plaza Wawasan, Locked Bag 211, 88999 Kota Kinabalu, Sabah, Malaysia.
Corresponding author: [email protected]
Malaysian Cocoa J. 11: 29–37 (2019) ABSTRACT - Observation on the effectiveness of insecticide fogging were tested on the eggs and adult of cocoa pod borer, Conopomorpha cramerella (Snellen). Five different rates of insecticide were applied, which were 100 ml of insecticide per 4L solution, 150 ml, 200 ml, 250 ml, and 300 ml. Thirty pods were tagged for each treatment, and field observation was carried out at Days 1, 3, 7, 10 and 14 after the spraying was commenced. The results denoted that the mean of deposit eggs was the highest at 100 ml insecticide and significantly different (p<0.05) with 300 ml insecticide. Observation in the post-spraying data recorded that the mean fluctuated, where the highest was at Day 10, and the lowest was recorded at Day 14. Throughout the observation, the number of eggs was the highest at the cocoa canopy, which above than seven feet from the ground. The mean (9.866a) was significantly different (p<0.05) compared to trunk (5.88 b; 4 to 7 feet from the ground) and lower trunk (5.808 b; 4 feet from the ground). Eight hours after fogging, the dead adult was the highest at 100 ml (63.64 a), followed by 300 ml (40.00 b), 200 ml (37.50c), 250 ml (20.83d) and 150 ml (20.45e). Percentage of dead adults were increased after spraying, and 58.67 % of the adult was dead after eight hours. Most of the C. cramerella eggs were located in the canopy 14 days after fogging, thus suggest that control approach must also focus on pods within this area. Key words: Cocoa, cocoa insect, insecticide fogging, cocoa pod borer, Conopomorpha cramerella
INTRODUCTION Cocoa is well-known as a shade-loving plant; therefore it usually cultivated with Gliricidia sp. as a permanent shade tree. In some areas, cocoa was intercropped with coconut, fruit trees, banana, or other economic crops. This intercrop planting system may provide species diversity of flora and fauna (Saripah, 2019). Massive cocoa cultivation and gradual expansion of the host-ranges of indigenous insect species were believed to be one of the factors contributing to the species richness and composition in cocoa. Lee et al. (2014) listed more than 200 insect species were found in cocoa agroecosystems, and there are few species have economic importance. Among the species, the cocoa pod borer (CPB), Conopomorpha cramerella (Lepidoptera: Gracillariidae), emerged as the most critical pest of cocoa, particularly in Southeast Asia. C. cramerella was first detected infested cocoa plantation in Sulawesi, Indonesia in the 1860s. The pest recorded in the Philippines in the year 1936, 1980 in Malaysia, Papua New
Guinea (2006) and in 2011 at the North Queensland, Australia (Saripah & Alias, 2016). C. cramerella has become one of the major caused, contributed to the declining production of cocoa in Malaysia (Saripah et al., 2019; ICCO, 2015). This multivoltine insect is currently responsible for an average of 40 to 60% loss of cocoa production, and up to 80 to 90% yield loss in unmanaged farms. Yield losses caused by the pest and disease incidence were forecast can be reduced to 30 to 40% if the control approach was undertaken properly (Wessel & Quist-Wessel, 2015). Add to the seriousness, the monetary loss caused by this tiny moth in Indonesia was estimated at USD 500 million (Niogret et al., 2019). To reduce the infestation rate, cocoa farmers usually applied pesticides to limit losses with the aid of broader choices of insecticides available in the market (Tijani, 2006). Biweekly prophylactic treatment with chemical insecticides

Malaysian Cocoa Journal 2019, Vol. 11
30
was considered as one of the most effective approaches; even the method is costly. Beevor et al. (1993) discussed on the heavy reliance of insecticide was implemented in managing C. cramerella. Pyrethroids group most among the commonly uses insecticides worldwide, which accounting for more than 30% of global use (Shukla et al. 2002). Insect of the order Lepidoptera, Coleoptera, Diptera, and Hemiptera were mainly controlled using this synthetic pyrethroid. Control of this C. cramerella which is a Lepidopteran species, was studied using different active ingredients from the group of deltamethrin, alphacypermethrin, cypermethrin, and chlorpyrifos (Lee et al. 2013). Exploration of new active ingredients of insecticide is crucial to avoid resistance to the same active ingredient. The use of only one active ingredient for two years may reduce the effectiveness of insecticides, and may affect the non-target organisms (Saripah, 2014). There was a suggestion that prolonged reliance on insecticide may lead to decreasing capability of insecticide due to losing effectiveness over time (Lee, 1996). Frequent use of the same chemicals can lead to the development of resistance of insects as widely discussed by Wojciechowska et al. (2016) in their review paper. Comparison of the effectiveness of insecticide with cocoa black ants for managing C. cramerella was discussed by Saripah (2015). The author denoted that throughout two years of observation using knapsack spraying, infestation in all treatments can be considered as severe, with the respect of a number of good pods, ADSI values, and infestation category. The infestation was high, especially during low crop season, when the number of available pods was low. Low pod number gave a chance to the same pod to be attacked several times by this Lepidopteran, although insecticide spraying was conducted at bimonthly or monthly. In different observation, Saripah & Alias (2016) conducted field research using five different active ingredients of insecticides; thiamethoxam, fipronil, emmamectin benzoate, deltamethrin and chlorantraniliprole; in one year of observation. Their result concluded that four active ingredients (thiamethoxam, deltamethrin, chlorantraniliprole, and fipronil) recorded Average Damage Severity Index (ADSI)
values that ranged between Light to Medium infested category. Fipronil recorded lowest ADSI value and the highest percentage of good beans weight. These promising results may suggest that fipronil may be useful as alternative active ingredients, in spite of prolonged reliance to deltamethrin and cypermethrin. Insecticide spraying is employed for a variety of purposes and types of equipment. The primary function of the sprayer is to break the liquid into small droplets of adequate size. The droplets then can uniformly distribute over the surface or space to be protected. The sprayer is also beneficial to regulate the amount to avoid excessive application of insecticide. Different design of spraying equipment was introduced, using manually operated hydraulic sprayers viz. knapsack sprayers, foot sprayers, hand compression sprayers; and air carrier sprayers such as motorized knapsack mist blower. The present trend is to apply concentrated pesticides employing low and ultra-low volume (ULV) sprayers. ULV equipment is designed to produce tiny droplets, thus ensuring even coverage with low volumes. ULV fogging machines are cold fogging machines that use large volumes of air at low pressures to transform the liquid into droplets that are dispersed into the atmosphere. According to the U. S. Environmental Protection Agency (EPA 1998) ULV as used in common agricultural practice refers to a total volume of 0.5 gal or less per acre (1.89 L or less per hectare) broadcast. For the control of public health vectors and pests, formulations are dispersed in concentrations of 10-90% at flow rates up to 18 fluid ounces per minute. Insecticides must be delivered within specific droplet size parameters to be effective (Armed Forces Pest Management Board, 2011). Fogging involves the use of a machine which emits the pesticide in a fog form. The thermal fogging is the generation of ultra-fine droplets in a range of 1-50 μm, using
thermopneumatic energy (www.pulsefog.com). Dense, visible fog-clouds were created when liquid substances are vaporized at the end of the fogging barrel (resonator), forming an ultra-fine aerosol by condensing on contact with fresh ambient air. Fogging is more target specific to be

Malaysian Cocoa Journal 2019, Vol. 11
31
implemented in smaller locations and more cost-effective than aerial spraying frequently (Bingham County, Department of Homeland Security, 2019). Thermal fogging is useful for extensive scale control of pest, the notion that active substances should be uniformly distributed, even in inaccessible places. Fogging supposed to have little harm to the environment due to fewer pesticide residues, and no penetration into the ground. Insecticide fogging is widely implemented in controlling the dengue vector, the mosquito Aedes aegypti. Oki et al. (2011) studied on the optimal timing of insecticide fogging and its impact on reducing dengue cases, by modeling dengue transmission among different seasonality and transmission intensities. Conventional primary vector control was based on fogging ULV insecticide particles that target adult mosquitoes. On the other hand, the effect of dengue mosquito control insecticide thermal fogging on non-target insects were studied by Thilanka et al. (2017). The simultaneous effect to the non-target organisms denoted that 12.44% of insects recovered during a 24-hour recovery period, and the Dipteran was the most affected order. Apart from pest control, fogging was also implemented as a part of robust sampling methods for canopy-dwelling arthropod collection (BEFTA Protocols, 2013). Insecticide fogging is often used to document the arthropod species richness in forest canopies (Yanoviak et al., 2003), but this technique may not adequately sample invertebrates that are concealed within a variety of microhabitats, such as epiphytes. It was proven that the majority of arthropods inhabiting epiphyte mats are not killed by fogging, and those that do die tend to remain trapped in the substrate. However, their results were contradicted by the findings from Erwin (1995) and Stork & Hummond (1997), where previous studies cited that pyrethrin insecticide fogging on the tree crowns and forest canopies was an accepted method for collecting arthropods. Even numerous studies in controlling C. cramerella was carried out in Malaysia, none of the studies were reported using the fogging application in cocoa plantations. Almost all of the study was conducted using manually operated
knapsack sprayer. Therefore the objective of this study is to evaluate the effectiveness of thermal fogging equipment based on the different rates of insecticide. The study focused on the number of deposit eggs and the effect of fogging on the endurance rate of adult C. cramerella after treating with insecticide fogging. MATERIALS AND METHODS Observation on the effectiveness of insecticide fogging at different rates was conducted at the Cocoa Research and Development Center (CRDC), Malaysian Cocoa Board, Jengka, Pahang, Malaysia (Longitude 100° 30’ 31.64” E,
Latitude 3° 36’ 59.73° N). Spraying was
conducted using thermal fogging machine ENTOFOG TS35 S® (Syarikat Perniagaan Kemuncak, Selangor). This German technology fogging machine is effective and reliable to control insects, diseases, disinfection in public health industrial and agricultural applications. The machine was designed with a robust formulation tank, and the nozzle can be easily converted from oil-based to the water-based carrier. The dimension of the machine (W x H x L) is 1,325 x 270 x 330mm with 5.5L tank capacity and solution nozzles ranging from 0.8 to 1.2mm. The solution output was estimated at 8 to 42 liter per hour, with the pressure in the solution tank is at 0.30 bar. Water-based fogging carrier (FX HIDRO®, Syarikat Perniagaan Kemuncak, Selangor) was used as an additive to prepare water-soluble (emulsifiable concentration) for suspendable and water-flowable pesticides. This water-based carrier is a mixture of alcohols and water, is a limpid liquid of higher viscosity as water and neutral, with a pH of 7. The flashpoint is approximately 130°C and quickly absorbed by the air after application due to its unlimited water solubility. FX HIDRO was selected due to there is no effect on the efficiency of the dissolved and suspended pesticides used in this study. Fogging was taking place early in the morning, between 7.45 to 9.30 am when wind disturbance is less. The fog did not apply directly at the cocoa trees due to the force, temperature, and high concentration of active material. Light

Malaysian Cocoa Journal 2019, Vol. 11
32
and thin fog density were applied to the combination of 0.5L of the water-based carrier, with additional of 3.5L of water. Insecticide with Emulsifiable Concentrate (EC) formulation, NAGA 505® (Maspro Resources Sdn. Bhd.) with active ingredients of chlorpyrifos and cypermethrin (Organophosphate and Pyrethroid groups) was selected in this study. Five different dosages of insecticide was implemented, which were at 100, 150, 200, 250, and 300ml. Spraying was conducted between rows of cocoa, and thirty pods were tagged for each treatment. Field observation was carried out at Days 1, 3, 7, 10, and 14 after the spraying was commenced. The number of deposited eggs and percentage of successfully hatched eggs were observed at three different heights from the ground. Eggs were observed at the lower trunk which approximately four feet and below, the trunk (4 to 7 feet) and cocoa canopy (7 feet and above). In another observation, one to two days old adult C. cramerella (10-12 individuals) were released in the individual cage. The cage was hanged at the appropriate location, especially in
the trunk area in an open cocoa canopy, regarding the different treatments. Observation on the percentage of dead C. cramerella was carried out eight hours after exposure to the insecticide fogging. RESULTS Observation on the mean of deposited C. cramerella eggs and percentage of hatching eggs were recorded in the field for 14 consequence days as depicted in Figure 1. Mean of deposit eggs was the highest at 100 ml insecticide (9.400a) and significantly different (p<0.05) with 300 ml insecticide (3.533b). There was a decreasing trend on the number of deposit eggs with the increment of insecticide dosage throughout these two weeks observation. Higher insecticide dosage is the notion that may lead to a decreasing percentage of successful egg hatchability as observed in this study. Even the percentage of hatching success shows no difference between treatments, the lowest percentage was recorded at 300ml treatment (59.690a) compared with other applied dosages.
Figure 1. Mean of deposit eggs and percentage of egg hatchability at different treatments
Sampling on the number of deposit eggs was recorded at three-day interval, which was at Days 1, 3, 7, 10, and 14 after fogging occasions in the field (Figure 2). The mean shows fluctuated results, where the highest mean was recorded on
Day 10 (11.067a), and the lowest was recorded at Day 14 (2.867b). Percentage of egg hatchability was the lowest at Day 14 (71.01a), even though no significant different (p>0.05) was recorded among treatments.
9.400 a
7.800 ab
6.400 ab
5.600 ab
3.533 b
87.110 a 84.870 a89.180 a
71.340 a
59.690 a
0.000
10.000
20.000
30.000
40.000
50.000
60.000
70.000
80.000
90.000
100.000
0.000
2.000
4.000
6.000
8.000
10.000
12.000
100ml 150ml 200ml 250ml 300ml
Perc
enta
ge of
hat
ched
egg
s (%
)
Mea
n of
dep
osite
d CP
B eg
gs
Mean of deposited eggs Percentage of hatched eggs

Malaysian Cocoa Journal 2019, Vol. 11
33
Figure 2. Mean of deposit eggs and percentage of egg hatchability at Days 1, 3, 7, 10 and 14 after fogging. Meanwhile, the observation of C. cramerella eggs on the different height from the ground denoted that the number of eggs was the highest at the cocoa canopy. The canopy which above than seven feet from the ground (Figure 3)
recorded the mean of 9.866a. The mean was significantly different (p<0.05) compared to the trunk which located in between four to seven feet (5.88b) and lower trunk (5.808b; 4 feet from the ground).
Figure 3. Mean of deposit eggs at a different location (height) of cocoa tree Observation on the adult C. cramerella eight hours after fogging was implemented showed fluctuated result (Figure 4), where the percentage of dead adults were the highest at 100 ml (63.64a),
followed by 300 ml (40.00b), 200 ml (37.50c), 250 ml (20.83d) and 150 ml (20.45e). Inconsistent results might be due to variation in the placement of an insect cage, where the cage was placed at
6.667 ab 6.600 ab 5.533 b 11.067 a 2.867 b
79.59 a
75.09 a
82.37 a
84.12 a
71.01 a
60.000
65.000
70.000
75.000
80.000
85.000
90.000
0.000
2.000
4.000
6.000
8.000
10.000
12.000
1 3 7 10 14
Perc
enta
ge o
f ha
tche
d eg
gs (%
)
Mea
n of
dep
osit
ed C
PB e
ggs
Mean of deposited eggs Percentage of hatched eggs
5.808 b 5.88 b
9.866 a
0
2
4
6
8
10
12
14
16
18
20
Lower trunk (4 feet and below) Trunk (4 -7 feet) Canopy (7 feet and above)
Me
an o
f C
PB
egg
s
Location mean of CPB eggs

Malaysian Cocoa Journal 2019, Vol. 11
34
different tree height, due to the tree architecture itself. Therefore, to have a more accurate result, it is suggested that the placement of cages must be more uniform in term of tree height. An avoidance placement of cage inside the dense cocoa canopy is highly recommended for the future study. Percentage of dead adults were increased hours
after spraying, and 58.67 % of the adult was dead after eight hours of exposure to the fog (Figure 5). The percentage of death gradually increased, where the results notion that the duration period after fogging period may influence the death of adult C. cramerella.
Figure 4. Percentage of dead adults at the different dosage of insecticide
Figure 5. Percentage of dead adult eight hours after fogging
DISCUSSION The preference of an adult C. cramerella to deposit egg might be lesser when higher insecticide residue found on the pod surface. This deterrence action might be due to the chance of egg survival is more magnificent when low treatment residue is found on the cocoa pod. The finding was in agreement with Saripah et al. (2019), where high pupation of C. cramerella was observed on the cocoa leaves compared to the
cocoa pods after the pods were treated with treatments. Most of the newly-emerged pupa will crawl to find a convenient place for pupation. This pre-pupa tends to wander away from areas with the presence of organic or non-organic particles. This escaping action may reduce pupation on pods, compared to the dry cocoa leaves where treatment did not directly spray onto the surface. The dense cocoa canopy is believed to be an excellent place for adult C. cramerella to rest;
18.73 f
27.21 e 27.21 e 29.03 d
39.52 c 39.52 c
52.00 b
58.67 a
0
10
20
30
40
50
60
70
1 2 3 4 5 6 7 8
Num
ber o
f dea
d CP
B af
ter f
oggin
g
Hour(s) after exposure
63.64 a
20.45 e
37.50 c
20.83 d
40.00 b
0.000
10.000
20.000
30.000
40.000
50.000
60.000
70.000
100ml 150ml 200ml 250ml 300ml
Perc
enta
ge o
f dea
d ad
ult
(%)
Percentage of dead adult

Malaysian Cocoa Journal 2019, Vol. 11
35
therefore the number of eggs frequently can be observed in this location. An adult commonly found it perched on the underside of host branches during daylight (Day, 1985). When at rest, adult moths are often disturbed naturally by wind, raindrops, or other insects moving along the branches (Niogret et al., 2019). Adults were caught resting on the underside of the branches, but not on the trunk or leaves. Therefore, to disturb their resting habitat and later on affect the infestation, the combination of management package as well as control techniques, including proper agronomic practices and various control approaches were highly recommended (Azhar, 2007). In addition to the multi-methods, disturbing their resting sites is a must. Hence, it was highly suggested to implement a part of the 4P basic concept in managing C. cramerella in the field. The concept of 4P [in Malay: Pembersihan (field sanitation), Pemangkasan (regular pruning), Penuaian (frequent ripe pod harvesting) and Pembajaan (schedule fertilization)] are greatly recommended, especially at the block with light to heavily infested symptoms (Saripah & Alias, 2016). Niogret et al. (2019) observed that C. cramerella adult would have an initial flight before landing on a branch. This moth then quickly walked to the underside of the branch and will find another convenient resting site that usually positioned perpendicularly to the branch. Therefore, thinning of the cocoa canopy by regular pruning and proper field sanitation will result in more proper cocoa canopy architecture. When such a disturbance of existing canopy occurs, the moths usually fly away from the disturbance to locate a new resting site on either the same or a different branch on the same tree, or another tree nearby (Niogret et al., 2019). It was believed that C. cramerella would try to avoid resting in a lower trunk or trunk that less than seven feet from the ground, where the area was directly exposed to the insecticide fog, as found in this study. However, to an extent, insecticide fogging must be conducted in a proper way due to their residues might affect non-target organisms in the cocoa field. Thilanka et al. (2016) reported that even using positive controls regarding the WHO standard cage bioassays with the mosquito Aedes albopictus and the stingless bee Trigona
iridipennis was applied, unfortunately, the results were appalling. Their studies showed with the fogging application there was 100% initial knockdown, alas 83.5% mosquito and 93.5% bee mortalities were observed after the recovery period. Fogging application for managing C. cramerella in this study were conducted in the morning, nevertheless the period also the active time for many other insect species, particularly the cocoa pollinators. Hence, a fogging application must be conducted in a controlled manner, and avoidance of indiscriminate fogging must be promoted due to their adverse effect on beneficial insects of cocoa. CONCLUSIONS Exposure to the higher dosage of insecticide using the ULV fogging machine was able to reduce the number of deposit eggs as well as egg hatchability. In this study, it was found that most of the C. cramerella eggs were located in the canopy 14 days after fogging was commenced. Therefore, it might suggest that the control approach must follow the spraying interval as recommended by the manufacturer of the pesticide, to deter the life cycle of C. cramerella. Priority must be given on the pods within the cocoa canopy, due to the tree architecture will affect the number of deposited eggs and resting sites of this tiny moth. ACKNOWLEDGMENT Thanks, devoted to the Datuk Norhaini Udin, the Director-General of the MCB, and the Director of Upstream Technology Division, Tn. Hj. Haya Ramba. Special thanks to technical assistance provided by Mr. Sulaiman Hashim, Mr. Norusdi Mat Kamar, and Mr. Mt Anuar Mt Desa for their valuable assistance in the field. REFERENCES Armed Forces Pest Management Board (2011).
Dispersal of Ultra Low Volume (ULV) Insecticides by Cold Aerosol and Thermal Fog Ground Application Equipment.

Malaysian Cocoa Journal 2019, Vol. 11
36
Armed Forces Pest Management Board Technical Guide No. 13. Pp 69.
Azhar, I. (2007). The ways towards sustainability
of cocoa industry in Malaysia. ICCO Round Table on a Sustainable World Cocoa Economy, 3-6th October 2007, Accra, Ghana.
Beevor, P.S., Mumford, J.D., Shah, S., Day, R.K.
and Hall, D.R. (1993). Observations on pheromone-baited mass trapping for control of Cocoa pod borer, Conopomorpha cramerella in Sabah, East Malaysia. Crop Protection. 12:134-140.
BEFTA Protocol (2013). Insecticide Fogging.
www.oilpalmbiodiversity.com. It is retrieved on August 7th, 2019.
Bingham County Department of Homeland
Security. Fogging application. https://www.co.bingham.id.us/homeland_security/fogging_application.html. It is retrieved on August 7th, 2019.
Day, R.K. (1985). Control of the cocoa pod borer
(Conopomorpha cramerella). PhD Thesis, University of London, London, United Kingdom.
Erwin T.L. (1995). Measuring arthropod
biodiversity in the tropical forest canopy. In: Lowman M.D. and Nadkarni N.M. (eds), Forest Canopies. Academic Press, San Diego, California, pp. 109–127.
Fogging Application. https://www.co.bingham.id.us/homeland_security/fogging_application.html. It is retrieved on August 8th, 2019.
ICCO (International Cocoa Organization). 2015.
Pest and diseases. Cocoa pod borer (C. cramerella). https://www.icco.org/about-cocoa/pest-a-diseases. html. Retrieved on August 7th, 2019.
Lee, C.T. (1996). Insecticides resistance in cocoa
pod borer, Conopomorpha cramerella
(Snellen) and a strategy to prevent its development. Planter. 72: 593-599.
Lee C.H, Kelvin, L., Haya, R., Navies, M. and
Saripah, B. (eds.) (2013). Cocoa planting manual. Sustainable cocoa. Malaysian Cocoa Board, Kota Kinabalu, Sabah, Malaysia.
Lee, C.H., Ling, A.S.C., Soetikno, S.S., Jeremy, N.
C.K., Ramle, K., Sabariah, S. and Haya, R. (Eds) (2014). Manual Latihan Keselamatan Koko: Pembangunan modal insan dan perkongsian pengetahuan dalam piawaian sanitari dan fitosanitari (SPS) koko di Asia Tenggara. Malaysian Cocoa Board, Sabah, Malaysia. Pp 202.
Niogret, J., Arni Ekayanti, Ingram, K., Lambert,
S., Kendra, P. E., Alborn, H. and Nancy D. Epsky, N. D. (2019). Development and behavioral ecology of Conopomorpha cramerella (Lepidoptera: Gracillariidae) Florida Entomologist, 102(2): 382-387. https://doi.org/10.1653/024.102.0214.
Oki, M., Sunahara, T., Hashizume, M.,
Yamamoto, T. (2011). Optimal Timing of Insecticide Fogging to Minimize Dengue Cases: Modeling Dengue Transmission among Various Seasonalities and Transmission Intensities. PLoS Negl Trop Dis. 5(10): e1367. doi:10.1371/journal.pntd.0001367
Saripah, B. (2014). Control of Cocoa Pod Borer
using insecticides and Cocoa black ants. Malaysian Cocoa Journal. 8: 14-22.
Saripah, B. and Alias, A. (2016). Screening of
different active ingredients of insecticides to cocoa pod borer infestation. Malaysian Cocoa Journal. 9(2): 76-87.
Saripah, B., Noor Hajjar, M.L.S., Alias, A. and
Zhang, A. (2019). Pupation Preference of Conopomorpha Cramerella (Snellen) after Treated with Zingiber officinale, Curcuma longa and Alpinia galanga Essential Oils. Journal of Engineering

Malaysian Cocoa Journal 2019, Vol. 11
37
and Applied Sciences. 14: 6150-6155. doi: 10.3923/jeasci.2019.6150.6155.
Saripah, B. (2019). The conservation and
collection of cocoa insects fauna at the Malaysian Cocoa Board. Journal of Science and Mathematical Letters. 7: 1-10. ISSN 2462-2052.
Shukla, Y., Yadav, A. and Arora, A. (2002).
Carcinogenic and cocarcinogenic potential of cypermethrin on mouse skin. Cancer letters. 182: 33-41.
Stork N.E. and Hammond P.M. (1997). Sampling
arthropods from tree-crowns by fogging with knockdown insecticides: lessons from studies of oak tree beetle assemblages in Richmond Park (UK). In: Stork N.E., Adis J. and Didham R.K. (eds), Canopy Arthropods. Chapman & Hall, London, pp. 3–26.
Tijani, A.A. (2006). Pesticide use practices and
safety issues: The case of cocoa farmers in Ondo State, Nigeria. Journal of Human Ecology. 19(3): 183-190.
Thermal Fogging: Advantages of the Pulse-Jet
Technology. www.pulsefog.com. It is retrieved on August 7th, 2019.
Thilanka, K.G., Abeyasuriya, N., Nalaka, N.W.,
Nugapola, P., Devika, M., Perera, B., Inoka, W.A., Karunaratne, P. and Parakrama Karunaratne, S.H.P. (2017). Effect of dengue mosquito control insecticide thermal fogging on non-target insects. International Journal of tropical Insect Science. 37(1):11-18. doi:10.1017/S1742758416000254.
Wessel, M. and Quist-Wessel, P. M. F. (2015).
Cocoa production in West Africa, a review and analysis of recent developments. NJAS-Wageningen Journal of Life Sciences. 74-75:1-7.
Wojciechowska, M., Stepnowski, P. and
Gołębiowski, M. (2016). The use of
insecticides to control insect pests. ISJ 13: 210-220.
Yanoviak, S.P., Nadkarni, N.M., and Gering, J.C.
(2003). Arthropods in epiphytes: a diversity component that is not effectively sampled by canopy fogging. Biodiversity and Conservation 12: 731–741.

Malaysian Cocoa Journal 2019, Vol. 11
38
EFFECT OF BIOENHANCER ON GROWTH PERFORMANCE OF COCOA (Theobroma cacao L.) SEEDLINGS
Nurfadzilah, M.1, Halimi, M.S.2, Fisal, A.3 and Tan, G.H.²
1Division of Cocoa Upstream Technology, Cocoa Research and Development Centre, Malaysian Cocoa Board, Jalan Jengka 23, P.O. Box 34, 28000 Temerloh, Pahang, Malaysia.
2 Department of Agriculture Technology, Faculty of Agriculture, Universiti Putra Malaysia, 43400 Serdang, Selangor, Malaysia.
3 Chemistry and Technology Division, Malaysian Cocoa Board, Lot 12621, 71800 Nilai, Negeri Sembilan, Malaysia.
Malaysian Cocoa J. 11: 38-41 (2019)
ABSTRACT – Success of bioenhancer requires evaluation on the effectiveness of the formulation on the growth performance and productions of selected crops. The efficacy of the formulation from combination of beneficial bacteria with carrier materials has to be evaluated as a proven that the formulation has the functionality when applied to soil and crops. Beneficial bacteria with several ability such as nitrogen fixer, phosphorus and potassium solubilizer can successfully use as a courtesy tools to both organic and inorganic in enhancing the plant nutrition. In this study, beneficial bacteria with ability to fix nitrogen, phosphorus and potassium has been selected to be incorporated with carrier material of cocoa pod husk and rice husk char. This formulation were tested on cocoa seedlings (Theobroma cacao L.) within a randomized completely block design with three replications and inorganic fertilizers as control. Cocoa seeds from BR 25 clone were adopted and planted into pots after two days of germinations. The bioenhancer formulations were applied six weeks after planting and 5g of NPK fertilizer were applied a week after bioenhancer applications. The physical parameters evaluated were growth parameter which is plant height and plant girth and were recorded biweekly. Based on the data recorded, the application of 30g of bioenhancer and addition of 50% of inorganic fertilizer applications increase the cocoa seedlings growth by 56.05% (plant girth) and 73.15% (plant height) as compared with normal applications of NPK fertilizer. Key words: Bioenhancer, growth performance, cocoa seedlings, beneficial bacteria, carrier materials and formulations
INTRODUCTION There are several types of farming include mineral fertilizers were accounts more than 90 percent of the fertilizer used (Sabri, 2009). Straight, mixture and compound fertilizer were commonly used in the plantations. Unfortunately, prolonged use of mineral fertilizers can cause leaching and run-off of nutrients, especially nitrogen and phosphorus which lead to environmental problems (Adesemoye and Kloepper, 2009). Several reports showed that continuous use of fertilizer is generating environmental problems. Over 50% of nitrogen application was lost from agricultural systems through evaporation, trace gases or leaching (Adesemoye and Kloepper, 2009). Same goes to phosphorus, where up to 90% is precipitated by metal complexes in the soil and lead to phosphorus pollution (Park et al., 2011). In the past few decades, the application of mineral fertilizer has increased
tremendously. Based on the statistics from FAO (Food and Agriculture Organization, 2014 world demand for N, P and K fertilizer is increase to 7.3% from 186,895 thousand tonnes in 2014 to 200,522 thousand tonnes in 2018. In addition, the usage of mineral fertilizer effect the microbial biodiversity by reducing the viability of beneficial microbes in the soil (Vassilev et al., 2015). Organic biofertilizer or bioenhancer was used as alternative replacement in order to reduce the effect of mineral fertilizer usage. This type of fertilizer is a low-cost technology, eco-friendly and harmless too environment with the benefit of supplementing nutrients. Biofertilizer is an organic fertilizer which contains living microorganism which, when applied to soil, or root surface of the plants, it helps in promoting growth by increasing the availability of major nutrient to the plants (Bhattacharjee and Dey, 2014). For suitable applications of biofertilizer,

Malaysian Cocoa Journal 2019, Vol. 11
39
carrier materials are used as a carrier for microorganisms to be inserted in the biofertilizer. The use of potential carrier will increase the efficiency of the biofertilizer. It allows easy handling and prolonged the shelf life of biofertilizer. Clay mineral, diatomaceous soil, rice bran, peat, lignite, humus, vermiculite, charcoal or a mixture of such materials is an example of carrier which often been used (Bhattacharjee and Dey, 2014). In common practice, carrier materials were chosen based on the capability of the microorganism to incorporate with the carrier materials. Organic waste from animal production, agriculture waste and food processing such as composts, manure from farmyard, cellulose, charcoal, rice straw, were also meet the criteria of good carrier materials (Herrmann and Lesueur, 2013). Biofertilizer is reported to have many positive effects on growth and production of crop. As reported by Malusa et al. (2016), plant growth promoting microorganism can successfully use as a courtesy tools to both organic and inorganic in enhancing the plant nutrition. Study by Gonzales et al. (2017) indicated that the use of biofertilizer on Trifolium rubens L., showed a high increase in terms of growth and development. For maize study, as reported by Dicko et al. 2018, actinomycetes based biofertilizer have significantly increase the maize growth and yield production in both nursery and field conditions. The development of biofertilizer requires assessment on the efficiency of the formulation on the crops. In this study, the effectiveness of bioenhancer by combining the beneficial bacteria with surplus product from agriculture sector has to be evaluated to prove that the formulation has the ability to increase crop growth when applied to cocoa seedlings. The evaluation can be done through field trials or pot trials in growth chamber or greenhouse where the formulation of bioenhancer is applied to the soils planted with tested crop (Cechin and Fatima, 2004; Gonzales et al. 2017). The efficient of the bioenhancer can be confirmed by the substantial growth of crop parameter such as plant height and plant girth due to the capability of the bioenhancer. The main objective of this study was to evaluate the effectiveness of bioenhancer on the growth parameters of cocoa seedlings.
MATERIALS AND METHODS
The experiments was conducted in the nursery at Cocoa Research and Development Centre, Malaysian Cocoa Board, Jalan Jengka 23, Temerloh, Pahang which located at latitude 3°36’ 38.5” N and longitude of 102°32’ 07.3”E.
This study consists of seven treatments with six formulation of micro soil enhancer with 1 control treatment. All treatments have the same amounts of identified beneficial bacteria. The treatments were as follows: Treatment 1 - 15g of combination between rice husk ash and cocoa pod husk with 2.5g of inorganic fertilizer, Treatment 2 - 15g of rice husk ash with 2.5g of inorganic fertilizer, Treatment 3 - 30g of combination between rice husk ash and cocoa pod husk with 2.5g of inorganic fertilizer, Treatment 4 - 30g of rice husk ash with 2.5g of inorganic fertilizer, Treatment 5 - 45g of combination between rice husk ash and cocoa pod husk with 2.5g of inorganic fertilizer, Treatment 6 - 45g of rice husk ash with 2.5g of inorganic fertilizer, and Control - 5g application of inorganic fertilizer as control. Bioenhancer were applied after 2 weeks of planting while inorganic fertilizer was applied a month after application of bioenhancer. Second application was carried out after 4 months of planting. Study was conducted by using Randomized Complete Block Design (RCBD) with three replications. The parameters studied were plant height and plant girth of cocoa seedlings. All data in this experiment were analysed by using SAS Version 8 for mean separations of the treatments effects.

Malaysian Cocoa Journal 2019, Vol. 11
40
RESULTS AND DISCUSSION
The applications of bioenhancer in cocoa seedlings treatments brought about increases in plant girth and plant height (Table 1). Significant effect were observed in plant girth for all treatments using 30g and 45g of bioenhancer
when compared to normal application of inorganic fertilizer, however applications of 30g of combination between rice husk ash and cocoa pod husk showed highest efficiency on plant height and plant girth of cocoa seedlings as compared with applications of inorganic fertilizer only.
Table 1. The effects of bioenhancer treatments on plant girth and plant height
Treatments Plant girth (mm) Plant height (cm) 15g of combination between rice husk ash and cocoa pod husk with 2.5g of inorganic fertilizer
7.72±0.92bc 28.65±6.64bc
15g of rice husk ash with 2.5g of inorganic fertilizer, 8.59±0.46ab 34.06±1.54abc 30g of combination between rice husk ash and cocoa pod husk with 2.5g of inorganic fertilizer
10.19±0.56a
42.70±6.26a
30g of rice husk ash with 2.5g of inorganic fertilizer 9.65±0.71a 39.71±1.78ab 45g of combination between rice husk ash and cocoa pod husk with 2.5g of inorganic fertilizer
9.44±0.96a
39.58±4.70ab
45g of rice husk ash with 2.5g of inorganic fertilizer 9.60±0.66a 40.11±7.73ab Normal application of inorganic fertilizer
6.53±1.089c
24.66±7.46c
CV 9.44 16.93 F-value 5.55* 2.87*
¹Column means followed by the same letter are not significantly different (P>0.05, Duncan’s Multiple
Range Test)
Bioenhancer applications led to an increase in plant girth and plant height with respect to the control. These effects were observed in treatment 30g of combination between rice husk ash and cocoa pod husk with 2.5g of inorganic fertilizer (T3), 30g of rice husk ash with 2.5g of inorganic fertilizer (T4), 45g of combination between rice husk ash and cocoa pod husk with 2.5g of inorganic fertilizer (T5) and 45g of rice husk ash with 2.5g of inorganic fertilizer (T6). The application of 30g of combination between rice husk ash and cocoa pod husk with 2.5g of inorganic fertilizer (T3) showed an increase in plant girth and plant height of 56.05% and 73.15% respectively. Beneficial bacteria in the bioenhancer helped in stimulates plant growth, helped in dissolve organic and inorganic phosphate, helps in breakdown of organic matter and as a results, higher height and plant girth can be obtained. Based on the above results, combination between bioenhancer with inorganic fertilizer (50% of the recommended dosage) increased vegetative growth (plant height and plant number) as compared with inorganic fertilizer. It is similar finding by Mahfouz and Sharaf-Eldin
(2007), where the combination between biofertilizer with half dose of chemical fertilizer has resulted in highest oil yield of fennel (Foeniculum vulgare Mill.), crop growth and productions. CONCLUSIONS In conclusion, beneficial bacteria and combination between cocoa pod husk and rice husk char with inorganic fertilizer were successfully used as bioenhancer. Application of 30g of cocoa pod husk and rice husk char as carrier material displayed the most promising formulation to be used as bioenhancer.
ACKNOWLEDGEMENT
The authors would like to thank the Director General of the Malaysian Cocoa Board, YBhg. Datuk Norhaini Udin for permission to publish this paper. A special thanks to Tuan Haji Haya Ramba, Director of Cocoa Upstream Technology, Dr. Rozita Osman, Manager of Cocoa Research and Development Centre,

Malaysian Cocoa Journal 2019, Vol. 11
41
Jengka, Mr. Saaidan Mad Saaid, and staffs of CRDC Jengka for their technical assistance. REFERENCES
Adesemoye, A.O., and Kloepper, J.W. (2009).
Plant-Microbes Interactions in Enhanced Fertilizer-use Efficiency. Appl. Microbiol Biotechnol 85: 1-12.
Bhattacharjee, R. and Dey, U. (2014).
Biofertilizer, A Way towards Organic Agriculture: A review. African Journal of Microbiology Research, 8(24): 2332-2342.
Cechin, I., and Fatima Fumis, T.D. (2004).
Effect of Nitrogen Supply on Growth and Photosynthesis of Sunflower Plants Grown in the Greenhouse. Plant Science 166: 1379-1385.
Dicko, A.H., Babana, A.H., Kassogue, A.,
Fane,R., Nantoume, D., Quattara, D., Maiga, K., and Dao, S. (2018). A Malian Native Plant Growth Promoting Actinomycetes Based Biofertilizer Improves Maize Growth and Yield Symbiosis, 75: 267-275.
Food and agriculture organization (2014),
website: www.fao.org. Gonzalez, X.C., Perez, N.L., Mateos, P., and
Rivas, R. (2017). Analysis and Effect of the Use of Biofertilizers on Trifolium rubens L., A Preferential Attention Species in Castile and Leon, Spain, With the Aim of Increasing the Plants Conservation Status. AIMS Microbiology, 3(4): 733-746.
Herrmann L., and Lesueur D. (2013).
Challenges of Formulation and Quality of Biofertilizer for Successful Inoculation. Applied Microbiology and Biotechnology, 97(20): 8859-8873.
Mahfouz, S.A., and Sharaf-Eldin (2007). Effect
of Mineral VS Biofertilizer on Growth, Yield, and Essential Oil Content of Fennel (Foenicculum vulgare Mill.). International Agrophysics 21(4): 361-366.
Malusa, E., Pinzari, F., and Canfora, L (2016)
Efficacy of Biofertilizers: Challenges to Improve Crop Production. In: Singh DP, Singh HB, Prabha R (eds) Microbial Inoculants in Sustainable Agricultural Productivity. Springer, Mumbai, pp 17-40
Park, J.H., Lamb, D., Paneerselvam, P.,
Choppala, G., Bolan, N., and Chung, J.W. (2011). Role of Organic Amendments on Enhanced bioremediation of Heavy Metal (Loid) Contaminated Soils. Journal of Hazardous Materials 185: 549-574.
Park, Y., Mun, B., Kang, S., Hussain, A.,
Shahzad, R., Seo, C., Kim, A., Lee, S., Oh, K.Y., Lee, D.Y., Lee, I. & Yun, B. (2017). Bacillus aryabhattai SRB02 Tolerates Oxidative and Nitrosative Stress and Promotes the growth of soybean by Modulating the production of phytohormones. Plos One, 12(3)
Sabri M.A. (2009). Evolution of Fertilizer Use
by Crops in Malaysia: Recent Trends and prospects, IFA crossroads Asia Pacific. Kota Kinabalu, Malaysia: Fertilizer Industry Associations of Malaysia: 8-10 December 2009: 1-39.
Vassilev, N., Vassileva, M., Lopez, A., Martos,
V., Reyes, A., Maksimovic, I., Eichler-Lobermann, B., and Malusa, E. (2015). Unexploited potential of some biotechnological techniques for biofertilizer production and formulation. Applied Microbiology and Biotechnology, 99(12): 4983-4996.

Malaysian Cocoa Journal 2019, Vol. 11
42
EVALUATION AND ASSESSMENT OF COMMERCIAL COCOA CLONES AT COCOA RESEARCH AND DEVELOPMENT CENTER BAGAN DATUK, PERAK
Nuraziawati Mat Yazik1, Haya Ramba2, Aizat Japar2 and Zailaini Mohd. Jamil1
Upstream Technology Division, Malaysian Cocoa Board, 1CRDC Bagan Datuk, Peti Surat 30, Jalan Sg. Dulang, Sg. Sumun, 36307 Perak.
2CRDC Kota Samarahan, Lot 248 Block 14 Biotechnology Park, 94300 Kota Samarahan, Sarawak. Corresponding author: [email protected]
Malaysian Cocoa J. 11: 42-46 (2019)
ABSTRACT - Thirty-eight commercial clones were observed and assessed for yield potential and VSD incidence under Cocoa Research and Development Center (CRDC) Bagan Datuk, Perak agro-climatic conditions. The clones are BAL 244, BR 25, DESA 1, KKM 1, KKM 15, KKM 17, KKM 2, KKM 22, KKM 25, KKM 27, KKM 28, KKM 3, KKM 4, KKM 5, KKM 6, MCBC 1, MCBC 2, MCBC 3, MCBC 4, MCBC 5, MCBC 7, PBC 112, PBC 123, PBC 130, PBC 131, PBC 137, PBC 139, PBC 140, PBC 159, PBC 179, PBC 221, QH 1003, QH 1176, QH 22, QH 326, QH 37, QH 441 and QH 968. Those genetic materials are part of fifty-three commercial cocoa clones recommended for planting throughout Malaysia with specific conditions. Results showed that KKM 2 produced the highest potential yield followed by DESA 1 and PBC 123. Eighteen clones indicated pod yield per plot above mean value, 60.41 pods per year. The clones produced highest pods at year three and four. For the VSD disease assessment, QH 1176 showed the lowest DSI for two years assessments followed by KKM 25 and QH 37. Meanwhile, PBC 130 indicated the highest VSD incidence followed by MCBC 3, MCBC 5, MCBC 7 and PBC 140. Key words: Genetic materials, clone, VSD incidence, assessment
INTRODUCTION
In cacao crop plantation, planting material is one of the important factors which contribute towards the increase of cocoa production and productivity. Thus, it is pertinent to choose the right and suitable planting materials for plantings. Other factors that included are soil and environment conditions, good agriculture practices and etc.
There are many choices of cacao planting materials recommended for planting in Malaysia. Most of the cacao growers are advised to use recommended cacao clones compared to hybrids. This is because of the known status on yield and pest and disease resistance in those materials (Haya et al., 2017). An effort to produce superior planting materials is time consuming and has to go through a long process (Haya et al., 2006) as development of clonal planting materials is included in long period of cacao breeding program.
In this study, thirty-eight clones developed by various agencies including government and private agencies such as Borneo Abaca Limited, Tawau (BAL clones), Balung
River Estate, Tawau (BR clone), Koperasi Pembangunan Desa, Sabah (DESA clones), MARDI (KKM clones), Golden Hope Plantation Bhd. (PBC clones) and Jabatan Pertanian Sabah (QH clones) beside Malaysian Cocoa Board (MCBC clones) were used for evaluation. The clones were actually recommended for planting by respective agencies based on their potential yield, pod and bean characteristics and other agronomic traits at their respective specific testing areas (Haya et al., 2006). Those genetic materials are part of fifty-three commercial cacao clones recommended for planting throughout Malaysia with specific conditions.
As the vascular streak dieback (VSD) disease which is caused by fungal pathogen Ceratobasidium (Oncobasidium) theobromae (Wood, 1975) remain one of the economic importance diseases in cocoa industry in Malaysia, those materials should be tested for a meaningful assessment. According to Anita Sari et al. (2017), the disease could lead to heavy damage in susceptible plants compared to tolerance planting materials.
The study is conducted at Bagan Datuk agro-climatic conditions. Bagan Datuk

Malaysian Cocoa Journal 2019, Vol. 11
43
topography is flat low-laying and elevation range from about 0m to 32m above mean sea level (MSL). Climate data at CRDC Bagan Datuk revealed area mean maximum temperature 32.72oC, average minimum temperature 23.79oC, relative humidity average 75%, and average evaporation 3.17 mm. The rainfall is 1,377-2,370 mm per annum, dry season not exceeding three consecutive months, with more than 100 mm rain per month. Soil type is the non-acid sulphate marine clay soil i.e Selangor series.
This paper will discuss on the performance of some of the recommended clones at CRDC Bagan Datuk, Perak. From this observation and evaluation, it would provide some information on the clones suitability and VSD incidence of the materials at the circumstance.
MATERIALS AND METHODS
In this study, thirty-eight clones were used for evaluation viz. BAL 244, BR 25, DESA 1, KKM 1, KKM 15, KKM 17, KKM 2, KKM 22, KKM 25, KKM 27, KKM 28, KKM 3, KKM 4, KKM 5, KKM 6, MCBC 1, MCBC 2, MCBC 3, MCBC 4, MCBC 5, MCBC 7, PBC 112, PBC 123, PBC 130, PBC 131, PBC 137, PBC 139, PBC 140, PBC 159, PBC 179, PBC 221, QH 1003, QH 1176, QH 22, QH 326, QH 37, QH 441 and QH 968. The evaluation was conducted at Field 19B. The clones were planted into 2x7 triangular field plots un-replicated. The cacao trees were spaced at 3m x 3m under Gliricidia stands. Farm management and data recording were conducted as described by Haya et.al., (2007). Evaluation on Agronomic Trait The clones were evaluated for pod yield bimonthly on a single tree basis according to Haya et.al. (2007). Assessment of VSD The clones was assessed and evaluated for vascular streak dieback (VSD) disease to determine their degree of tolerance. The extent of disease symptom severity or damage is quantified by using a disease severity or damage scale which is from 0-6 on progressive damage from chlorosis to defoliation to dieback. The
scale is used to score the severity of the disease of a plant sub-unit (flush region of seedling or twig or branch of a jorquetted plant). The severity score (x) is then weighted with a factor according to the position or age of the flush or subunit. The weighting factors (k) are arbitrarily set at 1 (k₁), ½ (k₂), and ¼(k₃) for the first, second and third flush respectively. To obtain the weighted severity score of a plant subunit, the assigned weighting factor will be multiplied with the severity score of the plant subunit. The disease severity index (DSI) will be calculated according the method used in Nuraziawati et.al. (2014). Data Collection The data collection for the trial plot was number of mature pods (Haya et al., 2007) and vascular streak dieback (VSD) disease assessment.
RESULTS AND DISCUSSIONS
Pod yield per plot Figure 1 below show pod yield per plot of the clones over seven year’s period. The average pod yield of the clones ranged between 18.86 pods to 156.57 pods. The mean pod yield per plot of the clones was 60.41 pods. Eighteen clones (BAL 244, BR 25, DESA 1, KKM 1, KKM 2, KKM 22, KKM 25, KKM 28, MCBC 1, MCBC 2, MCBC 7, PBC 123, PBC 131, PBC 137, PBC 139, QH 441, QH 968 and QH 1003) were observed to have pod yield per plot above the mean level. KKM 2 indicated the most pod yield per plot (156.57 pods) over seven years period followed by DESA 1 (137.86 pods) and PBC 123 (116 pods). The clones produced the highest pods at the third (88.39 pods) and fourth (80.32 pods) year production. At the fifth year, the yield declined 26% from the previous year. This is because year 2016 (Figure 2) has experienced the highest temperature (33.42oC) with the lowest amount of rainfall per annum (1,377 mm) within the seven years period of data collection. At the following year, yield increased 13% to 66.63 pods. According to Wuriandani et al. (2018), production decline during hot season also would affect the following year. ICCO (2017) mentioned that extreme weather especially temperature and rainfall are important factors that will affect the optimal result of yield production.

Malaysian Cocoa Journal 2019, Vol. 11
44
Figure 1. Pod yield of the recommended clones observed at CRDC Bagan Datuk, Perak, Malaysia across seven years periods (2012 – 2018).
Figure 2. Meteorological data of CRDC Bagan Datuk, Perak across seven years period.
For the genotype perspective, six clones i.e BR 25, DESA 1, KKM 2, KKM 4, PBC 123 and PBC 139 showed high yield potential in 2016 compared to others. This indicated that the genotypes could tolerate towards high temperature and low amount of rainfall.
VSD disease assessment According to Anita Sari et al. (2017), genotype and agro-climatic conditions influence the VSD disease severity level. Figure 3 below shows the degree of tolerance level towards VSD disease of the commercial clones under CRDC Bagan Datuk, Perak agro-climatic conditions. The

Malaysian Cocoa Journal 2019, Vol. 11
45
disease severity index (DSI) with the lowest number or score is expressed as resistant or more tolerant to VSD while the highest is susceptible. The extreme weather especially temperature and rainfall in 2016 under CRDC Bagan Datuk agro-climatic conditions (Figure 2) resulted high disease incident across all genotypes. The VSD disease severity index recorded variation ranging from a minimum of 0.605 in QH 1176 to a maximum of 1.433 in PBC 130 with the mean 0.807. Twenty-five clones (BAL 244, BR 25, DESA 1, KKM 1, KKM 2, KKM 5, KKM 6,
KKM 15, KKM 22, KKM 25, KKM 28, MCBC 1, PBC 112, PBC 123, PBC 137, PBC 139, PBC 159, PBC 221, QH 22, QH 37, QH 326, QH 441, QH 968, QH 1003 and QH 1176) showed DSI below the average compared to others. QH 1176 was observed to have the lowest DSI (0.605) followed by KKM 25 (0.646) and QH 37 (0.658). Meanwhile PBC 130 has the highest DSI (1.433) followed by MCBC 3 (1.170), MCBC 5 (1.150), MCBC 7 (1.069) and PBC 140 (1.021).
Figure 3. VSD disease assessments of the clones at CRDC Bagan Datuk, Perak, Malaysia across two years assessments (2016 – 2017). CONCLUSIONS Based upon the pod yield over seven year’s
period, it was noted that the most prolific commercial clones were KKM 2, DESA 1 and PBC 123 compared to others under CRDC Bagan Datuk, Perak agro-climatic conditions. For the VSD disease assessment under the same circumstance, QH 1176 indicated the lowest DSI for two years assessments followed by KKM 25 and QH 37. Meanwhile, PBC 130, MCBC 3, MCBC 5, MCBC 7 and PBC 140 showed the most susceptible clones against VSD disease compared to others.
Although there are many collections of
cacao planting materials in Malaysia, their performance are still affected by the existences of genotype and environment factors. It is important to observe and evaluate them under local agro-climatic conditions prior to selection for planting. From this study, genotypes and agro-climatic conditions influenced the yield potential and VSD disease severity levels in cacao plants thus, should become consideration for cacao planting.

Malaysian Cocoa Journal 2019, Vol. 11
46
ACKNOWLEDGEMENT
The authors would like to thank the Director General of MCB for her permission to present this paper. Thanks are also extended to En. Haya Ramba, the Director of Cocoa Upstream Technology Division for his constructive suggestions and comments. REFERENCES Anita-Sari, I., Susilo, A.W., Puspita Sari, N.,
Nur’Aini, F., Setyawan, B., McMahon, P.
and Keane, P. (2017). Intensity of Vascular Streak Dieback in Different Cocoa Clones and Various Agro-Climatic Conditions. Pelita Perkebunan, 33(1): 1-9
Haya, R., Francis, A., Nuraziawati, M.Y. and
Mohd. Jaafar, H. (2006). Bahan Tanaman Klon di Malaysia. Kertas kerja dibentangkan dalam Kursus Lanjutan Teknologi Koko 2006, Lembaga Koko Malaysia. 4-7 September, 2006, Temerloh, Pahang.
Haya, R., Kelvin, L., Francis, A., Nuraziawati,
M.Y and Mohd. Jaafar, H. (2007). Manual on Cocoa Breeding Scheme, Trial Designs and Data Recordings. Malaysian Cocoa Board, Kota Kinabalu.
Haya, R., Tee, Y. K. and Nuraziawati, M. Y.
(2017). Cocoa Best Practices At Smallholder Level On The Mitigation Of The Climate Change. Paper presented at the Indonesian International Cocoa Symposium, Grand Sahid Jaya Hotel, Jakarta, Indonesia, 18-20 October 2017.
ICCO (2017). Quarterly Bulletin of Cocoa
Statistics. International Cocoa Organization. Abidjan, Côte d'lvoice.
Nuraziawati, M. Y., Azmi, C. A., Shari Fuddin,
S. and Zailaini M. J. (2014). The Tolerance Level of Cacao Clones against Vascular Streak Dieback Disease. In Proceedings Malaysian International Cocoa Conference (MICC 2013), Kuala Lumpur, Malaysia, 7-8th October 2013. Pp. 48 - 50.
WOOD, G.A.R. (1975) Diseases. In G.A.R.WOOD. COCOA 3rd ed. London: Longman Publishers.
Wuriandani, A., Susilo, A.W., Mitrowiardjo, S.,
Setyawan, B. and Anita Sari, I. (2018). Diversity of Pods and Beans of Twelve Cocoa Clones in Rainy and Dry Seasons. Pelita Perkebunan, 34(1): 1-10.

Malaysian Cocoa Journal 2019, Vol. 11
47
PRELIMINARY ASSESMENT: DETERMINATION OF MAJOR FERTILISER ELEMENTS DISTRIBUTION ON COCOA (Theobroma cacao L.) TREE FOR OPTIMUM FERTILISER
ABSORPTION
Nurafiza, A1, Tee, Y. K.1 and Isa, I2
1Malaysian Cocoa Board, 5th 6th and 7th Floor, Wisma SEDCO, Locked Bag 211, 88999, Kota Kinabalu, Sabah
2Faculty of Resource Science and Technology, Universiti Malaysia Sarawak (UNIMAS), Jalan Datuk Mohammad Musa, 94300 Kota Samarahan, Sarawak, Malaysia
Malaysian Cocoa J. 11: 47-50 (2019)
ABSTRACT - Fertilizer is one of the most important components in managing agriculture sector especially in order to gain higher yield annually. However, gradual increase of fertilizer prize due to highly demand from agriculture sector has caused fluctuation on management’s cost. Therefore, this study
was to determine if there were any significant differences of macronutrient (nitrogen (N), phosphorus (P) and potassium (K)) in five different tree parts of cocoa; i) branches, ii) main stem, iii) main root, iv) fibrous root, v) leaves. 20 cocoa trees (aged 10 years old) at Kpg Muara Ahi, Serian Sarawak were destructively sampled in March, 2016, and cut into five tree compartments prior to analysis by using AAS Analyzer. Mean comparison was carried out by using one-way ANOVA SPSS 21.0 software. Leaves showed significantly (p<00.1) the highest in nitrogen, phosphorus and potassium content compared to other tree parts with N 2.55 ± 0.04 ppm, P; 0.20 ± 0.006 ppm and K; 2.68 ± 0.24 ppm, respectively. From the preliminary result, it showed that macronutrients adsorbed optimally by leaves compared to other cocoa tree parts. By knowing N, P and K partitioning within cocoa tree, this enable further study to be done especially in applying fertilizer for optimum yield. Key words: Cacao (Theobroma cacao L.), fertiliser, macronutrients, optimum absorption INTRODUCTION Fertilizer is one of the most important components in managing agriculture sector especially in order to gain higher yield annually. According to FAO (2015) nutrient consumption in Asia is 58.5% of the world total with Malaysia covered 1% and 2% for nitrogen (N) and potash (K), respectively. However, year by year, the gradual increase of fertilizer prize due to highly demand from agriculture sector has caused fluctuation on management’s cost. Ruf
and Kiendré (2012) agreed that one of the action to overcome increase cost of fertilizer for cocoa farming in Côte d’Ivoire while promoting cocoa productivity is by determining fertilizers optimum adsorption area. Effendy et al. (2019) added that cocoa’s potential cost reductions may
range from 36 to 76%, with an average of 60%, if farmers practice efficiently (especially on fertilizer application).
Nitrogen (N), phosphorus (P) and potassium (K) are the macronutrient needed for plant growth. Potassium functions in osmoregulation, carbohydrate translocation,
protein synthesis, enzyme activation, cell expansion, and stomatal regulation (Pallardy, 2008). By knowing the allocation of these macronutrients, further research on fertilizer application in order to optimize productivity by reducing fertilizer leaching or run off as plant leaves readily absorb mineral nutrients and foliar application has been widely used as a method of fertilization (Johnson et al., 2001). MATERIAL AND METHODS Study area The soils of Samarahan series is include to Bijat and Gley soils based on soil classification unit. Samarahan unit is covered by mainly secondary growth (shifting cultivation-wet rice) and generally between 20-0 feet above level. Under the Sarawak Soil Classification System, Samarahan Series is found in small interior valleys surrounded by hills formed by sedimentary rocks and comprises soils which have formed in sediments derived from argillaceous rocks which have not been enriched by magnesium, calcium or potassium from tidal water (Andriesse, 1972).
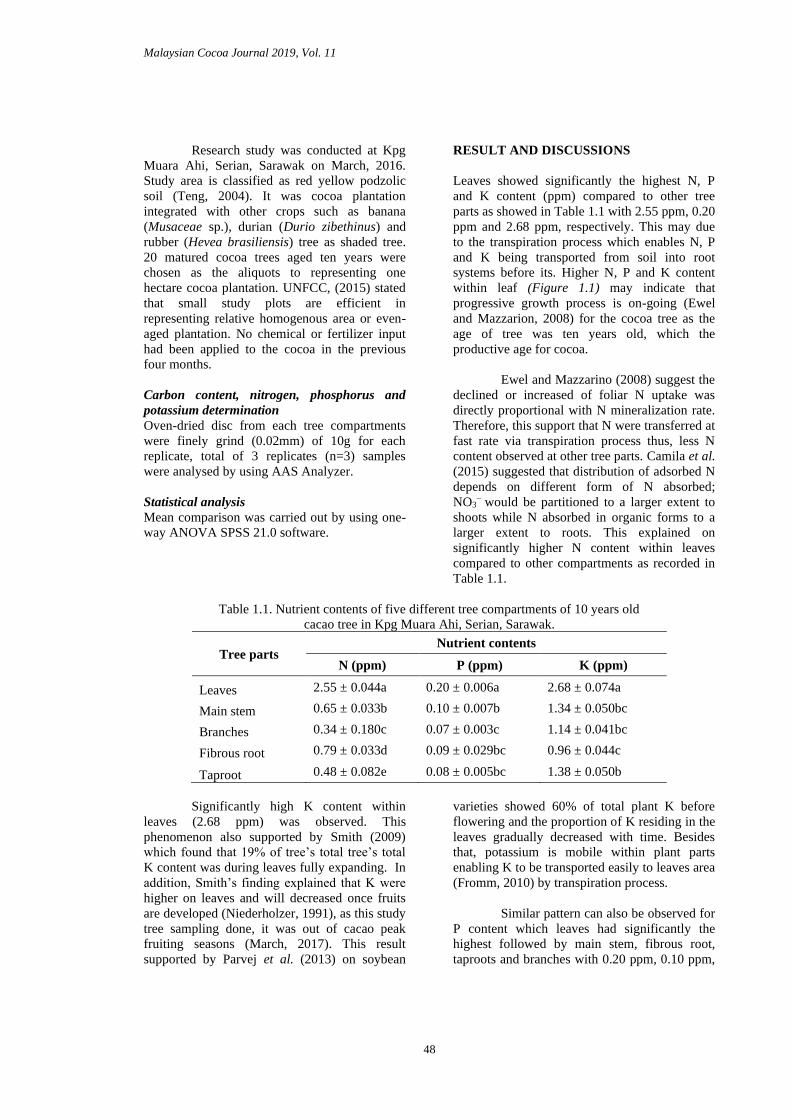
Malaysian Cocoa Journal 2019, Vol. 11
48
Research study was conducted at Kpg Muara Ahi, Serian, Sarawak on March, 2016. Study area is classified as red yellow podzolic soil (Teng, 2004). It was cocoa plantation integrated with other crops such as banana (Musaceae sp.), durian (Durio zibethinus) and rubber (Hevea brasiliensis) tree as shaded tree. 20 matured cocoa trees aged ten years were chosen as the aliquots to representing one hectare cocoa plantation. UNFCC, (2015) stated that small study plots are efficient in representing relative homogenous area or even-aged plantation. No chemical or fertilizer input had been applied to the cocoa in the previous four months. Carbon content, nitrogen, phosphorus and potassium determination Oven-dried disc from each tree compartments were finely grind (0.02mm) of 10g for each replicate, total of 3 replicates (n=3) samples were analysed by using AAS Analyzer. Statistical analysis Mean comparison was carried out by using one-way ANOVA SPSS 21.0 software.
RESULT AND DISCUSSIONS Leaves showed significantly the highest N, P and K content (ppm) compared to other tree parts as showed in Table 1.1 with 2.55 ppm, 0.20 ppm and 2.68 ppm, respectively. This may due to the transpiration process which enables N, P and K being transported from soil into root systems before its. Higher N, P and K content within leaf (Figure 1.1) may indicate that progressive growth process is on-going (Ewel and Mazzarion, 2008) for the cocoa tree as the age of tree was ten years old, which the productive age for cocoa.
Ewel and Mazzarino (2008) suggest the declined or increased of foliar N uptake was directly proportional with N mineralization rate. Therefore, this support that N were transferred at fast rate via transpiration process thus, less N content observed at other tree parts. Camila et al. (2015) suggested that distribution of adsorbed N depends on different form of N absorbed; NO3
− would be partitioned to a larger extent to shoots while N absorbed in organic forms to a larger extent to roots. This explained on significantly higher N content within leaves compared to other compartments as recorded in Table 1.1.
Table 1.1. Nutrient contents of five different tree compartments of 10 years old
cacao tree in Kpg Muara Ahi, Serian, Sarawak.
Tree parts Nutrient contents
N (ppm) P (ppm) K (ppm)
Leaves 2.55 ± 0.044a 0.20 ± 0.006a 2.68 ± 0.074a
Main stem 0.65 ± 0.033b 0.10 ± 0.007b 1.34 ± 0.050bc
Branches 0.34 ± 0.180c 0.07 ± 0.003c 1.14 ± 0.041bc
Fibrous root 0.79 ± 0.033d 0.09 ± 0.029bc 0.96 ± 0.044c
Taproot 0.48 ± 0.082e 0.08 ± 0.005bc 1.38 ± 0.050b
Significantly high K content within
leaves (2.68 ppm) was observed. This phenomenon also supported by Smith (2009) which found that 19% of tree’s total tree’s total
K content was during leaves fully expanding. In addition, Smith’s finding explained that K were
higher on leaves and will decreased once fruits are developed (Niederholzer, 1991), as this study tree sampling done, it was out of cacao peak fruiting seasons (March, 2017). This result supported by Parvej et al. (2013) on soybean
varieties showed 60% of total plant K before flowering and the proportion of K residing in the leaves gradually decreased with time. Besides that, potassium is mobile within plant parts enabling K to be transported easily to leaves area (Fromm, 2010) by transpiration process.
Similar pattern can also be observed for P content which leaves had significantly the highest followed by main stem, fibrous root, taproots and branches with 0.20 ppm, 0.10 ppm,

Malaysian Cocoa Journal 2019, Vol. 11
49
0.09 ppm, 0.08 ppm and 0.07 ppm, respectively. Result were in line with Smith (2009) research study’s on pecan trees as P content in leaves were the highest ranging from 100 to 136 g/tree
P contributing 28% to 32% of the tree’s P
content. Thus it proved that leaves are the main P source for a tree prior to fruiting season (Smith, 2009).
Figure 1.1. Nitrogen (N), phosphorus (P) and potassium (K) content in five compartments of 10 years old cacao tree in Kpg Muara Ahi, Serian, Sarawak.
CONCLUSION As a conclusion, per tree compartments, taproots had the highest carbon content (42.58%) and leaves had the highest N, P and K content with 2.55 ppm, 0.20 ppm and 2.68 ppm, respectively. ACKNOWLEDGEMENT A highly gratitude to Ministry of Plantation Industries and Commodity (MPIC) for fully funding this research project (RMK-11) and also to Datuk Norhaini Udin (Director General of Malaysian Cocoa Board, MCB), Mr Haya Ramba (Deputy Director General of Cocoa Upstream Technology, Dr Rozita Osman (Head of Plant Development Section) for the opportunity to present this paper. Special thanks to MCB’s staff who have helped in the field work. REFERENCES Ewel, J.J. & Mazzarino, M.J. (2008).
Competition from below for light and
nutrients shift productivity among tropical species. The National Academy of Science of the USA. 48(105): 18836 – 18841
Effendy Pratama, M.F., Rauf, R.A., Antara, M.,
Basir-Cyio, M., Mahfudz, et al. (2019) Factors influencing the efficiency of cocoa farms: A study to increase income in rural Indonesia. PLoS ONE 14(4): e0214569.
Food And Agriculture Organization Of The
United Nations (2018). World Fertilizer Trends And Outlook To – Rome. ISBN 978-92-5-108692-6
Ruf, F. and Kiendre, J. (2012). Adoption and
impact of fertilizer in cocoa farms of Côte d’Ivoire. COPAL, 17th International Cocoa Research Conference, Yaoundé, 15-20 Oct, 2012. Pp. 1 – 8.
Parvej, M.R., Slaton, N.A., Roberts, T.L.,
DeLong, R.E., Massey, C.G., Dempsey, R.J. and Fryer (2013). Dry Matter and

Malaysian Cocoa Journal 2019, Vol. 11
50
Potassium Accumulation and Partitioning in Determinate and Indeterminate Soybean Varieties Sabbe Arkansas. In eds. Sabbe, W. E. Soil Fertility Studies. pp 34 – 42
Picard, N., Saint-Andre, L. and Henry, M.
(2012). Manual for building tree volume and biomass allometric equations: from field measurement to prediction. Food and agricultural organization of the United Nations, Rome and Centre de Coopération Internationale en Recherche Agronomique pour le Dévelopment, Montpellier, 215pp.
Poorter, H., Niklas, K. J., Reich, P.B., Oleksyn,
J., Poot, P. and Mommer, L. (2012). Biomass allocation to leaves, stems and roots: meta-analyses of interspecific variation and environmental control Author for correspondence. New Phytologist. 193: 30–50.
Smiley, G.L. and Kroschel, J. (2008). Temporal
change in carbon stocks of cocoa-Gliricidia agroforests in Central Sulawesi, Indonesia. Agroforestry systems. 73: 219-231.
Teng. C, S. (2004). Keys to soil classification:
Sarawak. Department of Agriculture Sarawak.

Malaysian Cocoa Journal 2019, Vol. 11
51
EVALUATION OF CPB SEX PHEROMONE LONGEVITY IN THE COCOA FIELD
Navies, M.1, Mohd Shakri, A., Muliadi, T., Saripah, B.2 and Zhang, A.3 1 Malaysian Cocoa Board, Cocoa Research and Development Center,
Tawau, Sabah, Malaysia 2 Malaysian Cocoa Board, Cocoa Research and Development Center,
Bagan Datuk, Perak Darul Ridzuan, Malaysia 3 US Department of Agriculture, Agricultural Research Service,
Invasive Insect Biocontrol and Behavior Laboratory, Beltsville, MA, USA Corresponding author: [email protected]
Malaysian Cocoa J. 11: 51-54 (2019)
ABSTRACT - The cocoa pod borer (CPB), Conopomorpha cramerella (Snellen) (Lepidoptera: Gracillariidae), sex pheromone was identified. This pheromone can be introduced in the CPB management programme. A study was conducted to evaluate its longevity in the field with 300 g/lure for 12 months period at 2 ha farmers cocoa field in Tawau. The pheromone lure was provided by USDA for MCB to evaluate it. Males CPB caught in the sticky liner were recorded weekly. It was found that the pheromone amount in the lure was able to attract the male only up to three months and diminished afterward. This finding indicated that for a year period, four times lure replacement should be done to be more effective as a pest management tool. Hence, the cost of pheromone in CPB management could be maintained at low levels. The pheromone can be used in the IPM programme to control CPB as a monitoring tool. Another usage will be as a killing station for the male CPB thus reducing the female ability to produce fertile eggs. Key words: Cocoa pod borer, Conopomorpha cramerella, sex pheromone, pest management, monitoring tool INTRODUCTION The cocoa pod borer (CPB) Conopomorpha cramerella (Snellen) (Lepidoptera: Gracillariidae) is an important insect pest affecting cocoa (Theobroma cacao L.) production in South-East Asia (Shapiro et al. 2008). The sex pheromone components of C. cramerella were identified in 1986 (Beevor et al. 1986a, b) and field-tested in Sabah, Malaysia. They consist of 40 : 60 : 4 : 6 ratios of (E,Z,Z)-4,6,10-hexadecatrienyl acetate [(E,Z,Z)-16:OAc], (E,E,Z)-4,6,10-hexadecatrienyl acetate [(E,E,Z)-16:OAc], (E,Z,Z)-4,6,10-hexadecatrienyl alcohol [(E,Z,Z)-16:OH] and (E,E,Z)-4,6,10-hexadecatrienyl alcohol [(E,E,Z)-16:OH] (Beevor et al. 1986a). A mass trapping study on 200-ha plot using synthetic sex pheromones was conducted and reported by Beevor et al. (1993), and found out that the pod damage due to C. cramerella infestation was significantly reduced compared with pods harvested from untreated plots. A mating disruption trial on a 22-ha plot, using 1000 lures per ha (one per tree), the percentage damage was reduced compared with that of the
control plot (Tay and Sim 1989), even though the results were not conclusive because the experiment was conducted only in one location. Since 2004, this research was revived with pheromone activity and trap design re-evaluation experiments in Malaysia and Indonesia. Lures containing 100 g of a synthetic sex pheromone blend were found to attract male C. cramerella moths in Sabah and Peninsular Malaysia, and in Sumatra and Sulawesi (Indonesia), (Maisin 2007 and Zhang et al. 2008). There has been a concern on the blend purity during synthesis process of the sex pheromone, however Vanhove et al. (2015) found out that the impurity in the blend is not reducing its attractancy by male CPB. Suggestion role of sex pheromone in CPB management including, as a monitoring tool in IPM program, male mass-trapping, lure and kill and mating disruption (Tay and Sim 1989, Beevor et al. 1993, Maisin 2007, Zhang et al. 2008). It was reported that an attract and kill strategy uses much less pheromone than mating disruption and mass trapping (Charmillot et al. 2000). This study was in collaboration with

Malaysian Cocoa Journal 2019, Vol. 11
52
USDA, we evaluated the sex pheromone lure longevity in the cocoa field. MATERIALS AND METHODS This study was very straight forward due to limited number of sex pheromone lure, the delta trap and its sticky liner. The CPB sex pheromone lures (300 g/lure) were provided by USDA-
ARS, Invasive Insect Biocontrol and Behavior Laboratory, Beltsville, MA, USA and delta trap with sticky liner was obtained from Pest Control (India) PVT. LTD. (Figure 1). Eight traps were arranged in two transects (four traps each) with distance between traps were 12 m in cocoa field at Sin On, Tawau during July 2018 – March 2019 (Figure 2). Numbers of male CPB caught were recorded weekly.
Figure 1. Delta trap with sticky liner and pheromone lure (vial hanged inside the trap) is ready for the trial.
Figure 2. Delta-traps were hanged above the cocoa canopy. RESULTS AND DISCUSSION The insects caught in the traps were identified as male CPB (Figure 3), counted and recorded for
graphic analysis weekly. The data were plotted as a line graph to observe the dynamic of total CPB caught for the whole trial period as in Figure 4.

Malaysian Cocoa Journal 2019, Vol. 11
53
Figure 3. Male CPB caught on sticky liner on the first week of the trial.
Figure 4. Dynamic of total male CPB caught weekly for the trial period. The maximum total number of male CPB caught per week was eight while the minimum was zero. Lower number of CPB caught was due to low CPB population in that area. The cocoa field is isolated and surrounded with oil palm. Nevertheless, the data were able to provide desired result for the longevity observation for the sex pheromone on the field. This study found out that for 300 g/lure, it will stand for four months before diminished. This suggests in that amount of sex pheromone per lure, will only effective to catch CPB for four months.
CONCLUSIONS As a conclusion, the 300 g/lure is effective to catch male CPB for four months. Therefore if the sex pheromone is used to attract and kill, it only requires three replacements yearly. Less replacement activities mean the control method is not requiring high cost. This is necessary important aspects as discussed by Charmillot et al. (2000) in using sex pheromone for pest control.

Malaysian Cocoa Journal 2019, Vol. 11
54
ACKNOWLEDGMENT We would like to express our gratitude to the MCB Director General, Deputy Director General (R & D), Cocoa Upstream Technology Division Director for their permission and encouragement to publish this article. We extend our appreciation to the technical staffs for their commitment during field work and data collection. The study was funded by the Government of Malaysia through MCB. REFERENCES Beevor, P.S., Cork, A., Hall, D.R., Nesbitt, B.F.,
Day, R.K., Mumford, J,D. (1986a). Components of female sex pheromone of cocoa pod borer moth, Conopomorpha cramerella. J. Chem. Eco.l, 12: 1–14.
Beevor, P.S., Day, R.K., and Mumford, J.D.
(1986b). Female sex pheromone of cocoa pod borer moth Acrocercops cramerella: identification and field evaluation. In: Cocoa and Coconuts: Progress and Outlook. Ed. by Pushparajah E, Soon CP, C P Soon, Incorporated Society of Planters, Kuala Lumpur, Malaysia, 287–292.
Beevor, P.S., Mumford, J.D., Shah, S., Day,
R.K. and Hall, D.R. (1993). Observations on pheromone-baited mass trapping for control of cocoa pod borer, Conopomorpha cramerella, in Sabah, East Malaysia. Crop Prot., 12: 134–140.
Charmillot PJ, Pasquier D, Hofer D, 2000.
Attract and kill: a new method for control of the codling moth Cydia pomonella. Entomol. Exp. Appl., 94: 211–216.
Maisin, N. (2007). Management of cocoa pod
borer using sex pheromone – an up date. MICCOS 2007, PWTC, Kuala Lumpur.
Shapiro, L.H., Scheffer, S.J., Maisin, N.,
Lambert, S., Purung, H.B., Sulistyowati, E., Vega, F.E., Gende, P.,
Laup, S., Rosmana, A., Djam, S. and Hebbar, P.K., (2008). Conopomorpha cramerella (Lepidoptera: Gracillariidae) in the Malay Archipelago: genetic signature of a bottlenecked population? Ann. Entomol. Soc. Am., 101: 930–938.
Tay, E.B., Sim, C.H., 1989. Field evaluation of a
synthetic sex pheromone of the control cocoa pod borer (Conopomorpha cramerella Snellen). MAPPS Newslett., 13: 25–28.
Vanhove, W., Vanhoudt, N., Bhanu, K.R.M.,
Abubeker, S., Feng, Y., Yu, M., Van Damme, P. and Zhang, A. (2015). Geometric isomers of sex pheromone components do not affect attractancy of Conopomorpha cramerella in cocoa plantations. J. Appl. Entomol., 139(9): 660-668.
Zhang, A., Kuang, L.F., Maisin, N., Karumuru,
B., Hall, D.R., Virdiana, I., Lambert, S., Purung, H.B., Wang, S., Hebbar, P., (2008). Activity evaluation of cocoa pod borer sex pheromone in cacao fields. Environ. Entomol., 37: 719–724.

Malaysian Cocoa Journal 2019, Vol. 11
55
COMPOSITION OF WEEDS IN DIFFERENT COCOA AREA – RELATED TO CLIMATE CHANGE AND ORGANIC COCOA AREA
Meriam, M.Y.
Malaysian Cocoa Board, P.O Box 60237, 91012 Tawau, Sabah. Corresponding author: [email protected]
Malaysian Cocoa J. 11: 55–59 (2019)
ABSTRACT - It is believe that the climate changes will also give an impact on weeds composition in cocoa area. Not many studies have been conducted on weed in cocoa plantation area especially in Sabah State. Therefore, this study was carried to study the composition families of the weeds in different locality in cocoa area, to compare the composition of the weeds within 10 years times and to study the composition of weeds families in normal cocoa field vs. organic cocoa field. All the samples of weeds collected using hang manual collecting method. All the samples preserve as a herbarium and deposit in Museum Flora and Fauna Cocoa Research and Development Centre Tawau Sabah. Result from this study showed that at least 24 families of weeds exist in nearby Tawau cocoa area followed by cocoa area at Ungkaraya Semporna. These studies also indicate that there are changes of weeds families and the density of weeds within ten (10) years times. It is indicates that climate change give an impact of the composition of weeds at Field 28 Madai Sabah. Higher number of weed families grows at normal cocoa field compared to organic cocoa field. And the species number of weed is also higher at normal cocoa field compared to organic cocoa field. Key words: Weeds, cocoa, organic, climate change
INTRODUCTION
Weed is any plant growing with the crops in a place where it is not wanted (Anon, (b) 2019). It is consider not a favorite topic to study but it is become a big issue for maintenance and to control. The weed is perennial and it can be spread easily and faster by stolon or rhizome. How persistent a weed is depends on its ability to grow back from small fragments and the life span of its seed. Certain perennial weeds can grow back from even the smallest root fragment, and the seeds of some weeds can survive dormant in the soil for decades. It is requires complete removal or destruction method to control them.
Weeds also play so many important key roles in the ecosystem. It can be as a nectar sources for pollinators and beneficial insects. It is also serving as alternate hosts for pests and diseases, as trap and host of the crops. Good example such as Lamb's Quarters, a common garden weed across the United States. It is as a trap for leaf miners but a host to beet leafhoppers. This weed also attracting pests that would normally eat crops and providing home for predatory insects. The weed going to seed the
soil and use as a plant in the garden. Some weeds can serve as indicators for the soil type where they are growing, and can be "read" to provide a preliminary description of the soil type when a soil test has not yet been performed (Anon, (a), 2019).
Weeds are no exception for effective and economic management (David and Luz, 1990). Currently, there is a lot of manpower, money, and time going into scouting for weeds (Jessica, 2019). Spraying with certain chemicals called weedicides to kill the weeds is one of the popular methods for control the weeds (Anon (b), 2019. Many tools can be used and available for weed control. There are hand or powered hoes, flame weeders, hand or powered cultivators, scythes and similar hand cutting tools, mowers, all the way up to tractor-mounted flail mowers for knocking down weedy brush at the edges of meadows or pastures (Anon, (a), 2019). Trilling is one of the methods to help in uprooting and killing of weeds, which then the weeds will dry up and get mixed with the soil.
Study by Tesfay, (2016) showed that changing in climate conditions will give a significant influence on the spread, population

Malaysian Cocoa Journal 2019, Vol. 11
56
dynamics, life cycle duration, infestation pressure and the overall occurrence of the majority of agricultural pests or weeds. The changing in climate conditions will shift in the floral composition, reflected on flowering, fruiting and seed dormancy. Weed species distribution and their competitiveness within a weed population and within crop are also the impact when the climate is changing. Among the effect on the climate changing is the weed more vulnerable to attack by insects and plant pathogens and less competitive with weeds. This will affect the existing plants and will replace native and will be expanded in to new areas which is not existed before.
Some weeds produce allele-chemical that made weeds to thrive well and compete with crop, increases in the growth of roots or rhizomes, particularly of perennial weeds. This situation may make it harder to control. Some weeds that regrow from root fragments left after mechanical tillage, change on the biology of the biological control agent and or on the ability of the host plant to resist, tolerate or compensate for the presence of the herbivore or plant pathogen. This will increase the rate of life cycles of both the biological control agents and the weeds and increased water stress will affect the host plant’s development, and through this,
the development of biological control agents, so they might be less effective in drier situations.
The global climate is changing especially in Sabah State and give an impact on composition of insect (Meriam, 2017; Meriam, 2018). It is believe that the climate changes will also give an impact on agricultural production systems including weeds. In plantation area especially in the wet tropic like Malaysia, weeds also known as agriculture pest. It is also commonly flourish competing with crops for many factors such as moisture, nutrients, light and spacing. Many weeds reported highly demanding on many nutrients (David and Luz, 1990). Not many studies have been conducted on weed in cocoa plantation area especially in Sabah State. Therefore, this study was carried
out to study the composition families of the weeds in different locality in cocoa area, to compare the composition of the weeds within 10 years times and to study the composition of weeds families in normal cocoa field vs. organic cocoa field. MATERIALS AND METHODS
In first study, five (5) different localities nearby Tawau cocoa area were selected to examine the composition families of weeds. In each locality, weeds were collected using manual hand collecting method. For study 2, on composition of weed families at Field 28 Madai in year 2007, weeds were also collected manually. The same procedure was repeated in year 2016 in the same locality AT Field 28 Madai. The same procedure of weeds collecting was repeated in year 2016 in organic field to study the composition of the weed in this field. To study the density of weeds in normal cocoa area and organic cocoa area, a quadrat size 1 meter square (1 M2) was set up. All the weeds found in this quadrat were counted and recorded. All the weeds collected for Study 1, Study 2, Study 3 and Study 4 were then preserve as a herbarium and deposit in Museum Flora and Fauna Cocoa Research and Development Centre Tawau Sabah. All the collection was identified up to Family level collaboration with University Malaysia Sabah.
RESULTS AND DISCUSSION This study showed that Field 28 Madai and Ungkaraya Semporna have the higher Families of weeds compared to the other cocoa area (Figure 1). However, Field 28 Madai have more in species abundant with total of 35 compared to Ungkaraya Semporna only have 22 species. It is indicates that Field 28 Madai cocoa area have more species richness compared to other cocoa area. This may effect of the locality of the cooca area which is nearby the forest or jungle will give an impact of the weed number that growth in this area.

Malaysian Cocoa Journal 2019, Vol. 11
57
Figure 1. Composition families of weed in different cocoa area in year 2007.
Weeds families
1. Acanthaceae 2. Adiantaceae 3. Araceae 4. Aspleniaceae 5. Asteraceae 6. Capparidaceae 7. Cappraridaceae 8. Costaceae 9. Cyperaceae 10. Euphorbiaceae 11. Fabaceae 12. Lindernaceae 13. Malvaceae 14. Melastomaceae 15. Mimosaceae 16. Olendroideae 17. Onagraceae 18. Piperaceae 19. Poaceae 20. Polygalaceae 21. Polypodiaceae 22. Rubiaceae 23. Schizaeceae 24. Verbenaceae This study indicates that the number of weeds species is higher in year 2007 compared to year 2016 especially on Asteraceae, Poaceae and Verbanaceae (Figure 2). However, the species number of Rubiaceae Family is tremendously increased in year 2016. This study showed that the changes in climate (Meriam, 2017; Meriam, 2018) will give an impact on weed families’ composition in cocoa area in
Field 28 Madai Sabah. Ten (10) new families of weeds such as Acanthaceae, Adiantaceae, Apocynaceae, Cappridaceae, Fabaceae, Malvaceae, Olendroideae, Onagraceae, Rutaceae and Scrophulariaceae exist in year 2016. Whereas, only three (3) new families of Costaceae, Polyglaceae and Schizaeceae exist in year 2007.
Figure 2. Composition of weed families at Field 28 CRDC Madai in year 2007 vs. 2016

Malaysian Cocoa Journal 2019, Vol. 11
58
Normal cocoa field have an extra seven (7) families such as Adiantaceae, Apocynaceae, Araceae, Malvaceae, Polypodiaceae, Rutaceae and Scrophulariaceae. Meanwhile, organic cocoa field which have only one (1) an extra family of weeds of Athyriaceae (Figure 3). This study showed that normal cocoa field have more species richness of weeds compared to organic cocoa field. Organic cocoa field have higher
number of Families Acantaceae, Asteraceae, Cyperaceae and Mimosaceae. Whereas, normal cocoa field only have higher number of Family Rubiaceae. This may be the impact of the fertilizer source used in these two different fields. Normal cocoa field used commercial or chemical fertilizer compared to organic cocoa field which only use animal dung as a fertilizer.
Figure 3. Composition of weeds families in normal field vs. organic field in year 2016
Weeds families
1. Acanthaceae 2. Adiantaceae 3. Apocynaceae 4. Araceae 5. Asteraceae 6. Athyriaceae 7. Capparidaceae 8. Cyperaceae 9. Euphorbiaceae 10. Fabaceae 11. Malvaceae 12. Melastomace 13. Mimosaceae 14. Olendroideae 15. Onagraceae 16. Piperaceae 17. Poaceae 18. Polypodiaceae 19. Rubiaceae 20. Rutaceae 21. Scrophulariaceae 22. Verbenaceae This study showed that normal cocoa field have two (2) families with higher number of weeds compare to organic cocoa field only have one (1) with the families’ number of weeds
is more than 100 plants. Figure 4 also showed that normal cocoa have denser weeds families compared to organic cocoa field. This may be the impact of the fertilizer source used in these two different fields. Normal cocoa field used commercial or chemical fertilizer compared to organic cocoa field which only use animal dung as a fertilizer.
CONCLUSIONS
This study showed that at least 24 families of weeds exist in nearby Tawau cocoa area followed by cocoa area at Ungkaraya Semporna. Family of Poaceae have maximum of species richness followed by Family of Asteraceae and Rubiaceae. These studies also indicate that there are changes of weeds Families and the density of weeds within ten (10) years times. It is indicates that climate change give an impact of the composition of weeds at Field 28 Madai Sabah. Study on composition of weeds at normal vs. organic cocoa field indicate that higher number of weed Families grow at normal cocoa field compared to organic cocoa field. The species number of weed is also higher at normal cocoa field compared to organic cocoa field.

Malaysian Cocoa Journal 2019, Vol. 11
59
Figure 4. Density of weeds family in normal field vs. organic field in 1M2 area.
Weeds families
1. Acanthaceae 2. Asteraceae 3. Athyriaceae 4. Capparidaceae 5. Cyperaceae 6. Euphorbiaceae 7. Fabaceae 8. Linderniaceae 9. Melastomaceae 10. Mimosaceae 11.Olendroideae 12. Onagraceae 13. Piperaceae 14. Poaceae 15. Polygalaceae 16. Polypodiaceae 17. Rubiaceae 18. Schizaeceae 19. Scrophulariaceae 20.Verbenaceae REFERENCES Anon (a), 2019. Horticulture / The Importance of
Studying Weeds. en.wikipedia.org/wiki/Weed.
Anon (b), 2019. What is the study of weeds
called? Category: Weeds (plants) - Wikimedia Commons commons. wikimedia.org/wiki/Category: Weeds_ (plants).
David, E.B. and Luz, G.C. (1990). Common
Weed of Malaysia and their Control. Ancom Berhad. Perpustakaan Negara Malaysia. 349 pp.
Jessica, T. (2019). Study: Aerial Sensing Of
Weeds Saves Time and Labor. California Ag Today. Bitdev Web Development.
Meriam, M.Y. (2017). The changes of ant
composition in cocoa germplasm area in 11 years’ time – Related to climate change. 23 – 26 October 2017. MASW
2017. Hotel Grand Borneo, Kota Kinabalu, Sabah.
Meriam, M.Y. (2018). Changes in Weather
Pattern Affect Insect Composition in Madai, Sabah. Pelita Perkebunan 34 (1): 40-49.
Tesfay, A. (2016). Review on Impact of Climate
Change on Weed and Their Management. Department of Plant Sciences, College of Agriculture and Veterinary Science, Ambo University, Ambo, Ethiopia. American Journal of Biological and Environmental Statistics 2 (3): 21-27. Home / Journals / Biology and Life Sciences / American Journal of Biological and Environmental Statistics.

Malaysian Cocoa Journal 2019, Vol. 11
60
APPLICATION CHARRED PADDY HUSK ON COCOA SOIL
Helmi, S1., Nurfadzilah, M.2 and Fisal, A.3
1Malaysian Cocoa Board, Cocoa Research and Development Center Bagan Datuk, Peti Surat 30, Jalan Sg.Dulang, 36307Sg. Sumun,
Perak DarulRidzuan 2Malaysian Cocoa Board, Cocoa Research and Development Center Jengka,
JalanJengka 23, Peti Surat 34, 28000 Temerloh, Pahang DarulMakmur.
3Malaysian Cocoa Board, Cocoa Innovative and Technology Centre, Lot 12621, KawasanPerindustrian Nilai, 71800 Nilai
Negeri Sembilan DarulKhusus.
Malaysian Cocoa J. 11: 60 - 62 (2019) ABSTRACT - Charred paddy husk is considered as one of the common biochar used in agriculture. When it is added to the soil, biochar has generally been shown to be beneficial for growing crops. Certain crop yield improvements with biochar have been demonstrated repeatedly for acidic and highly weathered tropical field soils. The objective of this study is to identify the effect of charred paddy husk application on soil Cation Exchangeable Capacity (CEC) and its relation to soil pH over time. five rates of charred paddy husk (0, 1, 2, 3 and 4 kg per tree) were applied. Charred paddy husk was applied using broadcast method around each tree. Application of all treatment has 3 replicates. Sixteen trees represent 1 experimental plot. The data obtained indicate that the application of charred paddy husk has a positive effect in increasing soil pH but also show soil pH start to decrease again after 6 months of application. Application of charred paddy husk has a direct effect on soil CEC and soil pH. The data also shows that the effect of charred paddy husk decreases overtime and effected by soil pH. Application of charred paddy husk is beneficial for cocoa cultivation with frequent application annually in increasing CEC and decreasing soil acidity. Key words: Cocoa, CEC, biochar, paddy husk, soil pH
INTRODUCTION Paddy husk is a major agricultural byproduct obtained from the food crop of paddy. Generally, it was considered a worthless byproduct of the rice mill. When heated in a closed container without or limited presence of air, a solid carbon-rich product produced (Hariz et al., 2015). Charred paddy husk is considered as one of the common biochar used in agriculture. When biochar is applied to the soil, the interaction of the biochar and soil is influenced not only by the biochar characteristics but also by the soil properties and will determine the nutrient leaching or retention characteristics of the mixture (Mukherjee and Zimmerman, 2013). When it is added to soil, biochar has generally been shown to be beneficial for growing crops (Lehmann et al., 2003). Biochar contains stable carbon that remains sequestered for much longer periods than it would in the original biomass that biochar was made from (Rondon et al., 2007).
Cocoa in Malaysia has faced a decline in productivity and area since 1999. The cultivated area remained are on undesired area such as acidic coastal soil in Bagan Datuk, Perak. Certain crop yield improvements with biochar have been demonstrated repeatedly for acidic and highly weathered tropical field soils (Kimetu et al., 2008). Cation Exchangeable Capacity (CEC) of biochar is the most important factor influencing ammonium adsorption (Yao et al., 2012). Applying charred paddy husk in soil might increase CEC in cocoa cultivated area.Cation Exchangeable Capacity value of soil caused by biochar might be a factor in the increased ammonium adsorption ability of the soil and thus reduced total ammonium loss (Lehmann et al., 2003, Sika and Hardie, 2014). Recommended application rates for any soil amendment including charred paddy husk must be based on extensive field testing. At this time, there is insufficient field data to make general recommendations for cocoa.

Malaysian Cocoa Journal 2019, Vol. 11
61
The objective of this study is to identify the effect of charred paddy husk application on soil CEC and its relation to soil pH over time. This will help in understanding the benefits of biochar application on the cocoa cultivated area and determine its management process. MATERIAL AND METHODS The field trial was conducted in Cocoa Research and Development Center Bagan Datuk. The experiment site is a coastal area and largely cultivated with cocoa and coconuts. Investigations done earlier by other agencies stated that recent alluvium and the inference is that the area is a mud flat underlain by soft marine silty clay (Ali et al., 2013). The trial plot consists of 240 trees of mature cocoa trees intercropped with coconut. The total area of the plot trial is 0.15 hectare.
Five rates of charred paddy husk (0, 1, 2, 3 and 4kg per tree) were applied. Charred paddy husk was applied using broadcast method around each tree. Application of all treatments has 3 replicates. Sixteen trees represent 1 experimental plot. The design is single factor Randomized Complete Block Design (RCBD) where the replicates are considered block. Blocking was done due to heterogeneity of the area and variety. Soil pH and CEC were recorded every month. Cation Exchangeable Capacity was analyzed using ammonium acetate method at pH 7 (Schollenberger and Dreibelbis, 1930). RESULTS AND DISCUSSION Soils dominated by clays with variable surface charge are typically strongly weathered. The fertility of these soils decreases with decreasing pH which can be induced by acidifying nitrogen fertilizer, nitrate leaching and by clearing and agricultural practices. Soil pH change can also be caused by natural processes such as decomposition of organic matter and leaching of cations. The lower the CEC of soil, the faster the soil pH will decrease with time. Figure 1 indicates that the application of charred paddy husk has a positive effect in increasing soil pH but also show soil pH start to decrease again
after 4 months of application. Treatment 5 with no charred paddy husk applied shows no pH and CEC increase (Figure 1 and Figure 2). The data shows that higher amount of paddy husk applied will result in higher CEC increase, but the deterioration rates are influenced by soil pH. This is manifested on treatment 3 showing lower CEC decrease rates when pH is maintained.
Figure 1. Effect of charred paddy husk on soil pH over time.
Figure 2. Effect of charred paddy husk on soil CEC overtime. There is a strong positive correlation between soil pH and Soil CEC (Figure 3) with an r-value of 0.898. The regression line was calculated at R2: 0.807. This indicates that application of charred paddy husk will increase soil pH and CEC. But acidity of the soil will cause the CEC of the soil to gradually drop. Effect of high acidity in the soil causes CEC to decline more rapidly.

Malaysian Cocoa Journal 2019, Vol. 11
62
Figure 3. Linear regression of soil pH and Soil CEC CONCLUSIONS From the experiment, it shows that the application of charred paddy husk has a direct effect on soil CEC and soil pH. The data also shows that the effect of charred paddy husk decreases overtime and effected by soil pH. Application of charred paddy husk is beneficial for cocoa cultivation with frequent application annually in increasing CEC and pH. This is made clear due to the declining of both parameters overtime. The charred paddy husk deteriorates faster when initial soil pH is lower.Further studies are required to identify its effect on cocoa dry bean productions. REFERENCES Ali, F., Ahmad, E. and Al-Samaraee, S. (2013).
Field Behavior and Numerical Simulation of Coastal Bund on Soft Marine Clay Loaded to Failure.
Mohammad Hariz, A.R., Wan Azlina,
W.A.K.G., Mohd Fazly, M., Norziana Z.Z., Mohd Ridzuan, M.D., Tosiah, S. and Nurul Ain, A.B. (2015). Local practices for production of rice husk biochar and coconut shell biochar: Production methods, product characteristics, nutrient and field water
holding capacity. J. Trop. Agric. and Fd. Sc. 43(1): 91 – 101.
Kimetu, J.M., Lehmann, J., Ngoze, S.O.,
Mugendi, D.N., Kinyangi, J.M., Riha, S., Verchot, L., Recha, J.W., Pell, A.N. (2008). Reversibility of soil productivity decline with organic matter of differing quality along a degradation gradient. Ecosystems 11: 726–739.
Lehmann, J., Pereira da Silva, J., Steiner, C.,
Nehls, T., Zech, W., Glaser, B. (2003). Nutrient availability and leaching in an archaeological Anthrosol and Ferralsol of the Central Amazon basin: fertilizer, manure and charcoal amendments, Plant Soil, 249:
Mukherjee, A. and Zimmerman, A.R. (2013).
Organic carbon and nutrient release from a range of laboratory-produced biochars and biochar-soil mixtures, Geoderma, 193-194, pp. 122-130.
Rondon, M., Lehmann, J., Ramirez, J., Hurtado,
M. (2007). Biological nitrogen fixation by common beans (Phaseolus vulgaris L.) increases with bio-char additions. Biology and Fertility of Soils 43: 699–
708. Schollenberger, C. J., and Dreibelbis, E.R.
(1930). “Analytical methods in base-exchange investigations on soils. Soil Sci., 30(3): 161–174.
Sika, M.P. and Hardie, A.G. (2014). Effect of
pinewood biochar on ammonium nitrate leaching and availability in a South African sandy soil, Eur. J. Soil Sci., 65: 113-119.
Yao Y., Gao, B., Zhang, M., Inyang, M., and
Zimmerman, A.R.. (2012). Effect of biochar amendment on sorption and leaching of nitrate, ammonium, and phosphate in sandy soil. Chemosphere, 89: 1467-1471.
.

Malaysian Cocoa Journal 2019, Vol. 11
63
FACTORS AFFECTING COCOA POD VALUE AND COCOA BEAN CONVERSION RATE
Rozita, O., Saiful Mujahid, A.R. and Sharih, S. Division of Cocoa Upstream Technology, Malaysian Cocoa Board Research and Development Centre,
P.O. Box 34, 28000 Temerloh, Pahang
Malaysian Cocoa J. 11: 63-66 (2019) ABSTRACT – Cocoa pod value (PV) and cocoa bean conversion rate (BCR) are among the important factors that determine the agronomic quality of cocoa bean. Pod value is the measurement to determine how many cocoa pods are needed to get 1 kg of cocoa dry bean. From pod value, an estimation on the productivity of the farm can be made. Meanwhile, BCR is to determine the percentage of wet bean weight to dry bean weight. The information on bean conversion rate is important especially when the farmers or anyone want to sell/buy cocoa bean in wet bean basis. Till to date, there is no known written information on the factors that affect PV or BCR even though sometimes we observed on the variability of these two pod characteristics. Sometimes we realized that either clones, pod storage or fruiting season might influence them but there is no data to support. Therefore, this study was carried out to determine pod value and bean conversion rate by individual clones, combination of clones, duration of pod storage before fermentation and also by fruiting season. Six commercial cocoa clones were chosen for clonal effect, pod storage until five days after harvest was implemented accordingly and effect of four fruiting season were investigated. From these studies, individual clones, combination of clones and fruiting season are contributing in pod value and bean conversion rate. Key words: Cocoa bean, bean conversion rate, clones, pod storage, fruiting season INTRODUCTION Cocoa bean is the part of cocoa that is used in chocolate making. Cocoa beans are usually sold in form of dry bean and the published price also based on cocoa dry beans. However, some of the farmers sell their cocoa pods in form of fresh pods and cocoa wet beans. Therefore, it is important to know the pod value and cocoa bean conversion rate, so that the farmers will get fair price for the goods. Pod value is the indicator of how many pods that requires to get 1kg of dry cocoa bean. Meanwhile, bean conversion rate is the rate in percentage that shows the conversion of 100kg of wet bean to dry bean.
Report on the characteristics of the bean in various altitude showed that cocoa pods and cocoa beans tend to decrease lower at higher altitude (Nurdin and Robert, 2018) because usually higher altitude has lower temperature which can reduce intensity of cocoa flowers, fruit formation and fruit development (Alvim and Kozlowski, 1977). Other study on the effect of rainy and dry season in Indonesia showed that pod number per tree is significantly higher during dry season compared to rainy season (Adinda et al. 2018). Normally, pod value and cocoa bean conversion rate for each cocoa clones have been documented during the
development of their breeding programme. However, this pod value and cocoa bean conversion rate might vary due to some factors such as changing in fruiting pattern, duration of pod storage before fermentation and others. Furthermore, there is no known published report on this matter. Therefore, study on the cocoa pod value and bean conversion rate was conducted to evaluate the factors that affecting them. These factors include clones, clonal combination, duration of pod storage before fermentation and fruiting season. MATERIALS AND METHODS
This study has been divided into four sub studies. First study is to identify the pod value and bean conversion rate on few individual commercial clones. The clones that have been selected included KKM 22, KKM 25, PBC 123, QH 1003, BR 25 and MCBC 1. Harvested ripe clones were cut and split wet bean from the husk. All beans were counted for good bean and flat bean. Then the beans were weighed and recorded before fermented at the fermentation centre in individual netting bags to split between the clones. Fermentation took about 5 days prior to sun drying. Sun drying process took 3 to 4 days to fully dry bean and the moisture content of the bean at this stage is approximately 7.5%

Malaysian Cocoa Journal 2019, Vol. 11
64
using protimeter. Then, the dry bean weight was recorded.
The second study is to identify pod value and bean conversion rate when cocoa
clones mixed during the fermentation process. The cocoa clones were mixed either two clones, three clones, four clones, five clones or six clones. The combination of the clones is shown below in Table 1.
Table 1. The combination of cocoa clones during fermentation
No. Mixture of clones Pod/clone 1 PBC 123, BR 25, KKM 22, KKM 25, QH 1003, MCBC 1 1 2 PBC 123, BR 25, KKM 22, KKM 25, QH 1003 1 3 PBC 123, BR 25, KKM 22, KKM 25 1 4 PBC 123, BR 25, KKM 22 2 5 PBC 123, BR 25 3
All cocoa beans were split from the husk and fermented separately according to their combination. After 5 days, the beans were dried under the sun until the moisture content is about 7.5%. All the processes were followed as the first study. The third study is to identify the effect of pod storage on pod value and bean conversion rate. For this study, clones were mixed. The clones were PBC 123, BR 25, KKM 22, KKM 25, QH 1003 and MCBC 1. The durations of pod storage were as followed: Zero day after harvested (splitting and fermenting immediately after harvest) One day after harvested Two days after harvested Three days after harvested Four days after harvested Five days after harvested
These clones were harvested, cut, split, weighed and then fermented according to their duration of pod storage. Bean number and bean weight were recorded. The other study is on the effect of fruiting season to the pod value and bean conversion rate. Fruiting seasons were divided into four categories. They were: Early harvesting months (Aug – Sept) Peak harvesting season (Dec – Jan) Late harvesting months (Feb – Mac) End of harvesting months (April – May) For this study, the clones were also mixed. The clones were PBC 123, BR 25, KKM 22, KKM 25, QH 1003 and MCBC 1. All cocoa clones were harvested according to the fruiting season, cut and fermented. Others process was followed as the first study.
Calculation of cocoa pod value (PV) and bean conversion rate (BCR)
Pod value = No of pods x 1,000 Dry bean weight (g)
Bean Conversion Rate = Dried bean weight (g) x 100 Wet bean weight (g)
RESULTS AND DISCUSSION
For the first study, there was no significant difference of pod value between clones. Pod value of all selected commercial clones range between 24 to 25 (Table 2). This result indicated that each clones need 24 or 25 cocoa pods to get 1kg of cocoa dry bean. This result was also consistent with those reported in Malaysian
Cocoa Clones Booklet (2013). For the cocoa bean conversion rate, it is ranged between 23 to 31. This figure meant that in every 100kg wet bean, it will turn to about 23 to 31kg of dry bean depends on the clones. From this result, KKM 22 shows the lowest conversion rate compared to the other clones, although the difference between the clones is not significant.

Malaysian Cocoa Journal 2019, Vol. 11
65
Table 2. Effect of different clones on pod value (PV) and beans conversion rate (BCR)
Clones PV BCR
1 PBC 123 24 29
2 BR 25 24 30
3 KKM 22 24 23
4 KKM 25 25 31
5 QH 1003 25 29
6 MCBC 1 25 28
Result from this study also indicated that clonal composition gave a significant number of pod value. Pod value ranged between 21 to 31 depends on the combination of the clones (Table 3). Among the combination, the lowest pod value was recorded in combination of three clones i.e. PBC 123, BR 25 and KKM 25, which is only 21. Meanwhile, combination of
others clones gave the similar result where pod value ranged between 27 – 31.
There was no significant difference between clones combination on bean conversion rate. However, the least combination of the clones gave the highest value of bean conversion rate compared to many clones combination.
Table 3. Effect of clonal mixture on pod value (PV) and beans conversion rate (BCR) of cocoa
Combination of clones PV BCR
1 Combination of PBC 123, BR 25, KKM 22, KKM 25, QH 1003, MCBC 1 27 32
2 Combination of PBC 123, BR 25, KKM 22, KKM 25, QH 1003 27 35
3 Combination of PBC 123, BR 25, KKM 22, KKM 25 28 34
4 Combination of PBC 123, BR 25, KKM 22 21 37
5 Combination of PBC 123, BR 25 31 38
Cocoa pod value in different durations of pod storage did not show any trend in this study (Table 4). The result for bean conversion rate also similar with pod value where there was no consistency between the duration of pod storage either when stored between zero to 5
days after harvested. These result happened because the study was commenced during the end of fruiting season. To confirm the data, this study will be repeated during peak fruiting season.
Table 4. Effect of pod storage on pod value (PV) and beans conversion rate (BCR) (PBC 123, BR 25, KKM 22, KKM 25, QH 1003, MCBC 1) Pod storage PV BCR
1 Zero day after harvest
(splitting and fermentation immediately after harvest)
23 36
2 1 day after harvest 29 38
3 2 day after harvest 24 36
4 3 day after harvest 23 37
5 4 day after harvest 28 34
6 5 day after harvest 29 36

Malaysian Cocoa Journal 2019, Vol. 11
66
For the result of pod value, there was
no significant difference between the seasons. Pod value of each seasons ranged between 21 to 23. However, for bean conversion rate, it seems
that fruiting season plays an important role. Early and end of harvesting months shows the highest BCR, while peak and late harvesting months had the lowest BCR (Table 5).
Table 5. Effect of fruiting season on pod value (PV) and beans conversion rate (BCR)
(Combination of PBC 123 + BR 25 + KKM 22 + KKM 25 + QH 1003 + MCBC 1)
Fruiting seasons PV BCR
1 Early harvesting months (Aug – Sept) 22 44
2 Peak harvesting season (Dec – Jan) 23 33
3 Late harvesting months (Feb – Mac) 22 33
4 End of harvesting months (April – May) 21 43 CONCLUSIONS
From this study, we know that pod value did not differ much in each study. However, it can be a guideline to the farmers to demand for the price if there buyers interested in buying cocoa pods. For the bean conversion rate, it shows that different clones have different pod value. But if the clones were mixed together during fermentation and drying, the value of bean conversion rate is similar. As well as fruiting season, it indicated that early harvesting month which is in August and September and end of harvesting months which is in April and May have higher bean conversion rate compared to peak harvesting season (December – January) and late harvesting months (February-March). Therefore, the price of wet bean might differ according to these factors. For future study, another factor that should be included is weather pattern since we believed it will also affect bean conversion rate.
ACKNOWLEDGEMENT The authors would like to thank Director General of Malaysian Cocoa Board for allowing them to present this article in Malaysian Cocoa Board Annual Scientist Workshop 2019. Our appreciation also goes to all staffs for their invaluable help in research team and farm management.
REFERENCES Adinda, W., Agung, W. S., Suyadi, M., Bayu, S.
and Anita Sari, I. (2018). Diversity of Pods and Beans of Twelve Cocoa Clones (Theobroma cacao L.) in Rainy and Dry Seasons. Pelita Perkebunan 34 (1): 1-10.
Ahmad Kamil, M.J., Alias, A., Azmi, C.A.,
Boney, M., Harnie, H., Haya, R., Khairul Bariah, S., Lee, C.H., Meriam, M.Y., Mohd Yusoff, A.S., Mohd Zamri, A.G., Mohamed Helmi, S., Navies, M., Nuraziawati, M.Y., Nurfadzilah, M., Rozita, O., Saripah, B. & Shari Fuddin, S. (2013). Cocoa Planting Manual, Sustainable Cocoa. Sabah, Malaysia: Malaysian Cocoa Board.
Alvim, P.T. and Kozlowski, T.T. (1977).
Ecophysiology of Tropical Crops. Academic Press: New York - San Francisco - London: 520 p.
Malaysian Cocoa Board (2012). Malaysian
Cocoa Clones. Nurdin, S. and Robert, S. (2018). Fruit
Characteristics of Cocoa in Various Altitude Place. International Conference on Agribussines, Food and Agro-Technology, 205 (2018) 012022. doi:10.1088/1755-1315/205/1/012022

Malaysian Cocoa Journal 2019, Vol. 11
67
EFFECT OF ORGANIC MATERIALS AND APPLICATION FREQUENCY ON COCOA (Theobroma cacao L.) CROP PRODUCTION AND SOIL FERTILITY
Boney M.1, Mohd Dandan M. A.2 and Azwan, A.2
1Malaysian Cocoa Board, Cocoa Research and Development Centre, Mile 10, Apas Road, P.O. Box No. 60237, 91012, Tawau, Sabah, Malaysia
2Faculty of Sustainable Agriculture, Universiti Malaysia Sabah, Sandakan Kampus, Mile 10, Jalan Sg. Batang, 90000, Sandakan, Sabah, Malaysia
Malaysian Cocoa J. 11: 67 - 75 (2019)
ABSTRACT – The use of fertiliser particularly for the inorganic fertilisers has increased annually to cope the global demand of crop production. Nevertheless, inorganic fertiliser is expensive and associate with the negative affects to the environment and the soil structure. Alternatively, organic materials can be composted and used as fertiliser. Although such organic materials have low nutrient concentration and solubility, it releases nutrients slowly which makes them available for a longer period. Moreover, the waste by-products such as biomass and manure from plantation and livestock farms are available in abundance. By separating fertiliser applications, it also could help produce high levels of nutrients in time for peak growth demand. Therefore, this study was conducted to determine the effects of different types of organic materials (chicken manure, cow manure, empty fruit bunch and cocoa pod husk) with inorganic fertiliser as a control, and its frequency application (every 2 and 4 months) on the production of cocoa and its soil fertility. The results have shown that organic materials with its consistency application has produce comparable production with inorganic fertiliser and have no differences in the soil chemical properties between the treatments regardless the frequency of application. Hence, this study has clearly demonstrated that organic materials were able to increase crop production and improved the soil fertility. Key words: Cocoa, organic soil amendment, frequency application, crop production, soil fertility INTRODUCTION Fertilizers are organic or inorganic materials which are added to the soil to supply certain essential elements to plants for growth (Panda, 2010). They have played an important role in increasing crop production, including cocoa. Global consumption of fertilizers is steadily increasing every year as the demand from growers is continuously rising particularly for inorganic fertilizers. However, with the recent increase in the price of inorganic fertilizers and negative affects to the environment and the soil structure, the best alternative is using organic fertilizers optimally.
Organic materials are naturally occurring materials of biological or mineral origin (Allen, 2010). Although organic materials are low in nutrient concentration or solubility or both, but the slow release of nutrients makes them available for a longer period. In plantation and livestock farming, there is abundance of waste by-products (biomass and manure) available that can be used as a source of nutrient. The application of these organic materials is
fundamentally important to supply various kinds of plant nutrients, including micronutrients, improve soil physical and chemical properties, nutrient holding and buffering capacity, and enhance microbial activities (Suzuki, 1997).
Earlier study by Thong and Ng (1978) found that the nutrient uptake by cocoa is quite high (400 kg N, 40 kg P and 500 kg K with 5-years old matured cocoa). However, some of these requirements have been met through the appropriate use of cocoa pod husk, poultry manure and mineral fertilizer in the release of nutrient for crop production and yield in Southwestern Nigeria (Ayeni, 2008). Another study also has shown the effectiveness of nutrient-rich oil palm residues, coconut husks and other agricultural wastes in a cocoa plantation (Sharifuddin and Zaharah, 1987). Besides that, previous study by Hew and Ng (1968) reported that uptake efficiency was increased with more frequent applications of fertilizer and designed a schedule for fertilizer application according to tree age and fertilizer source. In contrast, applying very large amounts of fertilizer to any crop at one time may result in

Malaysian Cocoa Journal 2019, Vol. 11
68
large losses due to leaching, surface runoff and erosion. Therefore, the objective of this study was to determine the effects of different types of organic soil amendments (chicken manure, cow manure, empty fruit bunch and cocoa pod husk) in comparing with a mix of inorganic fertilizer of Urea, TSP and MOP, and its frequency of application (every 2 and 4 months) on the production of cocoa and its soil fertility. The result from this study was expected positively contributed by the organic materials despite of different frequency application in cocoa cultivation.
MATERIALS & METHODS The trial was conducted at Malaysian Cocoa Board Research and Development Centre in Madai, Kunak. The design of the trial was Randomized Complete Block Design (RCBD) with three replicates. Planting material was clone BR 25 (Class II Clone; Pod Weight (PW): 395 g, No. Bean per Pod (BNP): 40, average of dry bean weight (ADBW): 1.00 g, and pod value (PV): 25) and approximately 7 years old. The treatments in the study based on cocoa nutrient uptake – 400 kg N, 40 kg P and 500 kg K on the cocoa matured tree. The treatments were: (T1) – Mix of inorganic fertilizer (0.86 ton/ha/year Urea (46% N) + 0.086 ton/ha/year TSP (46% P2O5) + 1.0 ton/ha/year MOP (50% K2O), (T2) – Chicken manure (3% N, 1% P, 2% K = 13.3 ton/ha/year), (T3) – Cow manure (2% N, 1% P, 2% K = 20.0 ton/ha/year), (T4) – Empty fruit bunch (1.5% N, 0.02% P, 1.28% K = 26.6 ton/ha/year), and (T5) – Cocoa pod husk (2.18% N, 2.15% P, 3.54% K = 18.3 ton/ha/year). Each treatment was applied with either F1 - Every two (2) months or F2 – Every four (4) months onto 35 trees and total of the experimental size was about 1.0 ha. All harvested pods were cut, and beans fermented in a wooden box for five (5) days with one turning on day 3. Then the beans were sun-dried for seven days attaining 6 to 7% moisture content. Samples of the dried bean from each treatment were taken to the laboratory for bean analyses. All experimental plots were given similar agronomic practices according to the field program; including pruning activity, application of weedicide and pesticide. Below were the parameters taken for the study:
Pod and bean analysis Pod and bean analyses were conducted according to Malaysian Cocoa Board (n.d.). Five (5) pods were sampled out from each plot during peak harvest and measured for their length, diameter and girth of pods (cm), weight of harvested pods (kg), average number of beans/pods, single dry bean weight (g) and pod value (number of pods to produce 1 kg dry beans). Production Production were evaluated according to Osman et. al. (1994). The number of pods per tree was taken every month to determine the production of pods. Successful pods having a perimeter of 20 – 25 cm were counted and marked with blue paint. The number of pods were recorded starting from 2 months after all treatments applied. Mature pods were harvested twice a month or 10-14 days interval and total number of harvested mature pods were recorded to determine the actual yield of harvested mature pods. Soil sampling Soil sampling were conducted according to Denamany & Rosinah (1994). Soil samples from depths of 0 – 20 cm (topsoil) and 20 – 40cm (subsoil) were taken at the beginning and the end of project. They were sent to the laboratory for analysis of soil pH, total nitrogen (%), available P (ppm) and exchangeable K (cmol (+) kg-1). Statistical analysis Statistical analysis was carried out for one-way and two-way ANOVA and Tukey’s multiple
comparison tests for all data obtained using Statistical Product and Service Solutions (SPSS 21.0) software. RESULTS AND DISCUSSION Effect of Different Types and Frequency of Fertilizer Application on Crop Production Generally, the development of the pod takes 5 - 6 months from pollination of the flower to the full ripeness. Cocoa pod also can be harvested throughout the year. There are two main fruiting seasons for cocoa depending on the climate condition, and this study has indicated that there were two peak months of cropping for all treatments, with less pronounced and likely to be

Malaysian Cocoa Journal 2019, Vol. 11
69
the same (July – September and December – March) despite of its different frequency application (Table 1). This yield pattern has been affected by rainfall as the distribution pattern was uniform all over the year with a mean total annual rainfall almost 2000 mm. This result has agreed with previous studies by Philips and Armstrong (1978) on the crop pattern in BAL
Tawau, Sabah, stated that the harvest in the peak month is on average of the annual crop. Nevertheless, the less pronounced peak has advantages by spreading the task of harvesting and reducing the required capacity of the box fermenter and dryers, which must be sufficient to handle the largest expected harvest (Wood and Lass, 1985).
Table 1. Monthly rainfall distribution for two-years of study
Month Year 1 Year 2
Rainfall Distribution (mm)
January 593.8 47
February 45 63.1
March 113.1 102.2
April 63.9 102
May 130.4 127.8
June 165.6 120.5
July 70.9 127.7
August 130.5 224.5
September 63.9 244.6
October 107.7 272.6
November 188.4 215.8
December 223.7 217.6
Total 1896.9 1865.4 Source: Cocoa Research and Development Centre Madai, Kunak
The effect of types and frequencies of fertilizer application to the yield pattern and production are shown in Figure 1 and Figure 2 over a 21-months period. On the frequency of every 4 months application, the highest production was in inorganic fertilizer (2042.4 kg ha-1) or 33.1% higher than the others followed by empty fruit bunch (1921.3 kg ha-1), chicken manure (1571.1 kg ha-1), cow manure (1519.7 kg ha-1) and the lowest production, cocoa pod husk (1367.0 kg ha-1). While, for every 2 months application, the highest production was in chicken manure (1743.7 kg ha-1) or 16.97% higher than the others followed by cow manure (1734.4 kg ha-1), empty fruit bunch (1707.6 kg ha-1), inorganic fertilizer (1691.5 kg ha-1) and still the lowest production, cocoa pod husk (1447.7 kg ha-1). These varying production results for both frequency application, however, still gave no significantly different (p>0.05) between the treatments. A two-way ANOVA
also was conducted to examine the effect of different types of fertilizer and frequencies of application on the crop production. The results found no interaction between different types and frequencies of fertilizer application on crop production. From the result, it showed that average production of frequency fertilizer application of every 4 months was higher than applied every 2 months. The reason for the differences most probably because of high nutrients amount supply per application for every 4 months compared to every 2 months application. This was in line with Asiegbu and Uzo (1984) study stated that the higher rates of the fertilizer application, the higher production of fruits obtained, although the risk of leaching, surface runoff and erosion can deteriorate the soil fertility and reduce the yield. However, the consistency amount of fertilizers with high frequency application which applied every 2 months resulted in almost similar production for

Malaysian Cocoa Journal 2019, Vol. 11
70
the treatments. Although, there is no empirical proof that increasing the frequency of application always increases uptake efficiency, common practice is to apply fertilizers 2 – 3 times per year in order to reduce the risk of nutrient losses. Despite that, according to Hew and Ng (1968), they suggested that the best fertilizer application with high frequency is on seedlings in the nursery or immature plants in the field as their needed more nutrients in earlier stage. Study by Yadav et al. (2013) on cow manure, Adeniyan and Ojeniyi (2005) on chicken manure, Sharifuddin and Zaharah (1987)
on the empty fruit bunch and Ayeni (2008) on cocoa pod husk has indicated that organic materials produced greater or similar yield production in compared with inorganic fertilizer. Parallel with present result, it was determined that organic materials such as cow manure, chicken manure, empty fruit bunch and cocoa pod husk has consistently produced a positive yield production that comparable with conventional or inorganic fertilizer as indicated in the result. Therefore, such yield consistency should help better understanding of the important role of organic materials to improve the crop yield particularly in cocoa plantations.
Figure 1. Yield pattern and its cumulative production for different types of fertilizer application at every 4 months
Means with same letter are not statistically different using Tukey’s at p>0.05 probability level. Crop pattern: - T1– Inorganic fertilizer, T2 – Chicken manure, T3 – Cow manure, T4 –Empty fruit bunch and T5 – Cocoa pod husk; Cumulative production of dried bean: - t1– Inorganic fertilizer, t2 – Chicken manure, t3 – Cow manure, t4 –Empty fruit bunch and t5 – Cocoa pod husk.

Malaysian Cocoa Journal 2019, Vol. 11
71
Figure 2. Yield pattern and its cumulative production for different types of fertilizer application at every 2 months
Means with same letter are not statistically different using Tukey’s at p>0.05 probability level. Crop pattern: - T1 – Inorganic fertilizer, T2 – Chicken manure, T3 – Cow manure, T4 –Empty fruit bunch and T5 – Cocoa pod husk; Cumulative production dried bean: - t1– Inorganic fertilizer, t2 – Chicken manure, t3 – Cow manure, t4 –Empty fruit bunch and t5 – Cocoa pod husk Effect of different types and frequency of fertiliser application on soil chemical properties The soil used in this experiment site initially was low in organic matter with pH below 5. However, the total N, available P, and exchangeable potassium were found to be adequate (Table 2). Twenty-one (21) months after the first treatments were applied (Table 3 and Table 4), the pH for both top and subsoil has slightly increased up to 8% in all treatments compared with the initial results. Nitrogen concentration on both applications have mean value ranging from 0.08% to 0.14%, even though topsoil usually has higher concentration of nitrogen, while below of it not much such nutrition was acquired. For phosphorus, the nutrient concentration on every 4 months application shows that all treatments have mean value as low of 2.80 ppm to 13.25 ppm in
compared with every 2 months application, 16.70 ppm to 26.53 ppm. As for potassium, all treatments on both frequencies showed higher nutrient concentration which ranging between 0.27 cmol/kg to 0.59 cmol/kg. Two-way between-groups analysis of variance was conducted to examine the influence of different types and frequencies of fertilizer application on levels of nutrients for top and subsoil. It was found that there was significant (p<0.05) difference between frequencies application on nitrogen concentration for topsoil and potassium concentration for topsoil and subsoil. The reason for the differences again is because of the high nutrients amount supplied per application for every 4 months compared to every 2 months application in all treatments which affect the nitrogen concentration in topsoil and potassium concentration both in topsoil and subsoil.
1743.7a 1734..4a
1707.6a 1691.5a
1447.7a

Malaysian Cocoa Journal 2019, Vol. 11
72
Table 2. The initial chemical characteristics of the soil at 2 depths of the experimental site
Characteristics Adequate
range* Topsoil
(0-20 cm) Subsoil
(20-40 cm)
pH (H2O) 5.5 -6.5 4.167 ± 0.18 4.133 ± 0.08
Total N (%) > 0.16 0.18 ± 0.03 0.093 ± 0.003
Available P (ppm) > 15 32.13 ± 6.11 18.83± 1.92
Exchangeable K (cmol (+) kg-1) > 0.24 0.243 ± 0.12 0.11± 0.005
Organic Matter (%) 3.5 (2.0% C) 0.97 ± 0.38 0.41± 0.05
Cation Exchange Capacity (CEC) (cmolc kg-1) >12 11.12 ± 0.67 10.49± 0.71
*Source: Wong, I. F. T. (1974) (revised) – Soil-crop suitability classification for Peninsular Malaysia, Soils and Analytical Services Bulletin Nr.1, Ministry of Agriculture, Kuala Lumpur) (mean ± S.E.) Organic materials release its nutrients slowly through its microbial activity by breaks down the material to ammonium (mineralization) in the soil (Ann et al., 2017). This will affect the soil pH. In addition, lime was also applied onto the soil twice annually to adjust the soil pH, but it often takes a year or more before a response can be seen even under perfect conditions. It is known that the optimum pH for cocoa is 6.5 and the soils within the range of 5.5 – 7.0 should be selected where major nutrients and trace elements will be available. If the acidity increased, the major nutrients, phosphorus in specific, become less available, while others like iron, manganese, copper and zinc could increase, possibly creating toxicity. The concentration of nitrogen in soil for all treatments in both frequency of application was lower than the adequate range. As for inorganic fertilizer, the reason was probably due to rapid mineralization of nitrogen, whereby the higher concentration of nitrogen will accelerate the rate of mineralization. While for organic materials, it is known that the slow process of decomposition into plant-available nitrogen (mineralization) form depends on the nitrogen concentration in organic materials. Besides that, immobilization of nitrogen in soil also occurs probably because of the high C:N ratio in organic materials that is unsuitable for incorporating into the soil, which eventually makes unavailable to plants until the microorganism die and their organic matter is mineralized (Allen, 2010). Phosphorus concentration was statistically not different in both frequency of application. However, it still indicates that interval of 4-month application were less than adequate range in compared with 2-month interval application. This can be described that the longer interval application of the fertilizer into the field, the less concentration
of phosphorus accessible in the soil due to its low concentration in organic materials that can be used. Apart from that, soil at pH 4 to 5 may increase the effect of phosphorus fixation in the soil, thus lime needs to be added onto the soil not only to increase the pH but also to reduce the phosphorus fixation by half. As for potassium, both frequency application and treatments showed high concentration level than adequate range. The reason for this is that organic matter derived from plant and animal, so their potassium ion is water-soluble and always available to plants. From this study, organic materials treatments such as cow and chicken manure, empty fruit bunch and cocoa pod husk have provided some positive effect to the soil nutrients. The high availability of potassium in both top and subsoil for organic amendment was good as the soil treated by the inorganic fertilizer. This was agreed by Akanbi et al. (2014) which stated that organic fertilizer application had given a significant impact particularly on soil nutrients, organic matter and pH in cocoa crops.

Malaysian Cocoa Journal 2019, Vol. 11
73
Table 3. Mean of soil chemical properties in topsoil (0 – 20 cm) for different types and frequency of fertilizer application
Parameters
Frequency Treatments
Total Mean
Sig.
(2-tailed) T1
(Inorganic Fertiliser)
T2 (Chicken Manure)
T3 (Cow
Manure)
T4 (Empty fruit
bunch)
T5 (Cocoa pod
husk)
Soil
Che
mic
al
Pro
pert
ies
pH (H2O)
F1 (Every 4 months) 4.60 ± 0.15a 4.46 ± 0.03a 4.37 ± 0.08a 4.67 ± 0.16a 4.37 ± 0.03a 4.49 .200 ns F2 (Every 2 months) 4.80 ± 0.25a 4.73 ± 0.28a 4.50 ± 0.01a 4.53 ± 0.06a 4.53 ± 0.20a 4.62
Total N F1 (Every 4 months) 0.12 ± 0.01a 0.14 ± 0.02a 0.09 ± 0.006a 0.15 ± 0.01a 0.13 ± 0.01a .128 .028 * (%) F2 (Every 2 months) 0.10 ± 0.01a 0.11 ± 0.01a 0.11 ± 0.006a 0.11 ± 0.003a 0.09 ± 0.008a .106
Available P F1 (Every 4 months) 8.40 ± 3.20a 13.35 ± 6.05a 2.80 ± 0.70a 6.60 ± 0.70a 21.70 ± 12.99a 11.31 .184 ns (ppm) F2 (Every 2 months) 18.50 ± 9.65a 22.80 ± 10.46a 7.20 ± 0.50a 16.70 ± 13.7a 26.53 ± 13.7a 19.33
Exchangeable K F1 (Every 4 months) 0.56 ± 0.05a 0.56 ± 0.12a 0.59 ± 0.15a 0.49 ± 0.04a 0.57 ± 0.10a .55 .016 * (cmol (+) kg-1) F2 (Every 2 months) 0.52 ± 0.08a 0.42 ± 0.09a 0.43 ± 0.05a 0.36 ± 0.09a 0.35 ± 0.04a .41
Means with same letter (superscript) within rows are not statistically different using Tukey’s at p>0.05 probability level (mean ± S.E.), * – significant, ns – not significant for Two-way ANOVA (Sig. 2-tailed) at p>0.05 probability level between frequencies.
Table 4. Mean of soil chemical properties in subsoil (20 – 40 cm) for different types and frequency of fertilizer application
Parameters
Frequency Treatments
Total Mean
Sig.
(2-tailed) T1
(Inorganic Fertiliser)
T2 (Chicken Manure)
T3 (Cow
Manure)
T4 (Empty fruit
bunch)
T5 (Cocoa pod
husk)
Soil
Che
mic
al
Pro
pert
ies
pH (H2O)
F1 (Every 4 months) 4.53 ± 0.18a 4.50 ± 0.11a 4.43 ± 0.09a 4.53 ± 0.09a 4.30 ± 0.15a 4.46 .821 ns F2 (Every 2 months) 4.76 ± 0.26a 4.30 ± 0.01a 4.33 ± 0.12a 4.37 ± 0.07a 4.43 ± 0.03a 4.44
Total N F1 (Every 4 months) 0.09 ± 0.006a 0.11 ± 0.02a 0.11 ± 0.02a 0.10 ± 0.03a 0.09 ± 0.02a .101 .466 ns (%) F2 (Every 2 months) 0.10 ± 0.01a 0.09 ± 0.01a 0.08 ± 0.006a 0.09 ± 0.008a 0.09 ± 0.01a .094
Available P F1 (Every 4 months) 1.43 ± 0.71a 3.05 ± 1.85a 1.45 ± 1.15a 1.05 ± 0.35a 2.57 ± 1.28a 1.92 .098 ns (ppm) F2 (Every 2 months) 1.53 ± 0.57a 1.03 ± 0.44a 1.05 ± 0.45a 0.73 ± 0.39a 0.65 ± 0.55a 1.02
Exchangeable K F1 (Every 4 months) 0.51 ± 0.06a 0.44 ± 0.07a 0.50 ± 0.03a 0.50 ± 0.09a 0.56 ± 0.11a .504 .001 * (cmol (+) kg-1) F2 (Every 2 months) 0.36 ± 0.02a 0.44 ± 0.04a 0.32 ± 0.05a 0.27 ± 0.04a 0.31 ± 0.04a .341
Means with same letter (superscript) within rows are not statistically different using Tukey’s at p>0.05 probability level (mean ± S.E.), * – significant, ns – not significant for Two-way ANOVA (Sig. 2-tailed) at p>0.05 probability level between frequencies.

Malaysian Cocoa Journal 2019, Vol. 11
74
CONCLUSIONS
As conclusion, this present study has clearly demonstrated that organic materials produce comparable results to inorganic fertilizer on the crop production and soil chemical properties particularly the empty fruit bunch and chicken manure treatment, in every 4 months and 2 months application, respectively. Although inorganic fertilizer provided more readily nutrients to the soil for plant uptake, the effect on the crop production still comparable to the organic fertilizers as it increases the soil pH and making the nutrient available for longer nutrient uptake by plant. This study also suggested that frequency application with every 4 months is the best frequency as it gave high amount of nutrient per application into the soil and substantially affect the plant uptake and the yield. Therefore, this study has highlighted the utilization of organic materials in cocoa plantation is feasible particularly for the smallholders. ACKNOWLEDGEMENT The author wishes to thank the Ministry of Science, Technology and Innovation (MOSTI), Malaysia, for the financial support (Project No. 06-03-13-SF0119), and the Director General of MCB for her permission to publish this paper. Appreciation is also extended to the Director of Cocoa Upstream Technology Division, Tuan Haji Haya Ramba for his guidance and comments for the paper. Sincere thanks are also extended to En. Jenrry Sompokon, En. Mohd. Yusof Mohd. Yunus and all field staffs, for their assistances with highly committed REFERENCES
Adeniyan, O. N and Ojeniyi, S. O. (2005). Effect
of poultry manure, N.P.K 15:15:15 and combination of the reduced levels on maize growth and soil chemical properties. Nigerian Journal of Soil Science, 15: 34-41.
Akanbi, O.S.O, Ojeniyi, S.O, Famaye, A.O,
Ipinmoroti, R.R, Oloyede, A.A,
Oyewumi, I.K, Ayegbonyin, K, Adejobi, K.B, Idrisu, M. (2014). Soil nutrients and cocoa seedling performance as influenced by plant residue ash and NPK fertilizer addition on a depleted soil in Ibadan, south western, Nigeria. International Research Journal of Agricultural Science and Soil Science (ISSN: 2251-0044) 4(1): pp. 1-xxx, January 2014.
Allen, V. B. (2010). Science and Technology of
Organic Farming. CRC Press, Taylor and Francis Group.
Ann, M., Clain, J. and Kathrin, O. R. (2017).
Nutrient Management: Soil pH and Organic Matter. Module 8. Montana State University Extension.
Asiegbu, J.E. and Uzo, F.O. (1984). Yield and
yield components response of vegetable crops to farmyard manure rates in the presence of Inorganic fertilizer. Journal of Agriculture Pueterico, 68: 243-252.
Ayeni, L. S. (2008). Integrated application cocoa
pod husk ash and poultry manure on soil and nutrient contents and maize yield. Am. Eur. J. Sustainable Agric., 2: 92-97.
Denamany, G. and Rosinah, R. (1994). Kaedah
pengambilan serta pemprosesan sample tanah dan daun untuk analisa. Konvensyen Kakitangan Bahagian Penyelidikan Koko / Kelapa, pp. 1-10. Institut Penyelidikan dan Kemajuan Pertanian Malaysia (MARDI).
Hew, C.K. and Ng, S.K. (1968). A General
Schedule for Manuring Oil Palms in West Malaysia. Planter, 44: 417-429.
Malaysian Cocoa Board, n.d. Manual on cocoa
breeding scheme, trial designs and data recordings. Malaysian Cocoa Board.
Osman, Y., Abdullah, O. and Nik Aziz, N.M.,
(1994). Kaedah pengambilan data pertumbuhan dan hasil koko untuk penyelidikan dalam bidang agronomi.

Malaysian Cocoa Journal 2019, Vol. 11
75
Konvensyen Kakitangan Bahagian Penyelidikan Koko / Kelapa, pp. 1-5. Institut Penyelidikan dan Kemajuan Pertanian Malaysia (MARDI).
Panda, S.C. (2010). Rice Crop Science. India:
Agrobios. Phillips, T. A and Armstrong, K.B., (1978).
Performance of Amelonado cocoa on basalt soils in Sabah. Proc. Int. Conf. Cocoa Coconuts, Kuala Lumpur 1978, 32-34
Sharifuddin, H.A.H. and Zaharah, A.R., (1987).
Utilization of natural and agricultural waste products in Malaysian agriculture. Paper presented at the Organic Farming Conference, Khon Kaen, Thailand Suzuki, A., 1997. Fertilization of rice in Japan. Japan FAO Association, Tokyo, Japan
Suzuki, A. (1997). Fertilization of rice in Japan.
Japan FAO Association, Tokyo, Japan. Thong, K.C., and Ng, W.C. (1978). Growth and
nutrient composition of monocrop cocoa plants on inland Malaysian soils. Proceedings of the Int. Conf. on Cocoa and Coconuts. Kuala Lumpur, Malaysia, June 21 24, 1978. 1980 pp.262-286 ref.32.
Wong, I.F.T. (1974) (revised) – Soil-crop
suitability classification for Peninsular Malaysia, Soils and Analytical Services Bulletin Nr.1, Ministry of Agriculture, Kuala Lumpur.
Wood G.A.R. and Lass, R.A. (1985). Cocoa –
Fourth Edition. Tropical Agriculture Series. Longman Group Limited.
Yadav A., Gupta R. and Garg V. K., (2013).
Organic manure production from cow dung and biogas plant slurry by vermicomposting under field conditions. International Journal of Recycling of Organic Waste in Agriculture, 2: 21.

Malaysian Cocoa Journal 2019, Vol. 11
76
PRELIMINARY EVALUATION OF NEW LOCAL VERIFICATION TRIAL AT FARMER’S
FIELD SERIAN, SARAWAK
Aizat, J.1, Nuraziawati, M.Y.2, Haya, R.1, Abdul Rahman, R.1
1Upstream Technology Division, Malaysian Cocoa Board, CRDC Kota Samarahan, Lot 248 Block 14 Biotechnology Park, 94300 Kota Samarahan, Sarawak
2CRDC Hilir Perak, Jalan Sg. Dulang, 36307 Perak Corresponding author: [email protected]
Malaysian Cocoa J. 11: 76-78 (2019)
ABSTRACT - Malaysia Cocoa Board (MCB) has established a new local verification trial (LVT) plot in 2015 at farmer’s field Tebekang, Serian, Sarawak to evaluate twenty new clones with three control clones
(KKM 22, PBC 123 and MCBC 10). The new clones were selected based on their yield performance, pod/bean characteristics and VSD tolerance from the previous clone trials conducted at MCB research station. The clones were grafted in October 2015 in RCBD system, 3 replications of 15 trees per plot with spacing 3m x 3m. Among the main objectives of this trial is to evaluate the potential yield of the new clones and Vascular Streak Dieback (VSD) disease tolerance based on the local agro-climatic condition. Preliminary data analysis show that several clones produce higher average pod yield per tree (PYT) compare to the control clone PBC 123 (7.72) with clone such as BTKU-A07 and BTKU-A05 produce more than (15.0). Clones BTKU-A16 (1.64g) and BTKU-A14 (1.42g) on the other hand has higher (ADBW) compare to control clones MCBC 10 with 0.86g. Most of the clones also demonstrate moderate tolerance to VSD with average score ADSI below than 2. Key words: Local verification trial, new clones, yield INTRODUCTION Cocoa (Theobroma cacao L.) is a tropical crop tree that is typically grown on small farms but play an important agricultural commodity in the developing countries in West Africa, South-East Asia, Latin America and Caribbean (Becker, 1999). Globally, the challenge to cocoa beans production are losses due to pest and disease (e.g. Black pod, Vascular streak dieback, Witches broom), low productivity, high cost production and the need to maintain good quality. Disease is one of the major limiting factors for cocoa beans production in Malaysia. The use of selected and improved planting materials with desirable traits in terms of high yield, pest and disease resistance is one of the recognized key to sustainable cocoa production system. Cocoa hybrids had been widely planted in Malaysia from 1960s until 1980s because of limited recommended improved planting materials. Since then clone materials such as MCBC 1-9, PBC 123 and KKM 22 have been recommended by the Malaysia Cocoa Board to replace the hybrid materials (Francis, 2009).
The selection of more productive and resistant cocoa clones have been among the main objectives of Malaysia Cocoa Board (MCB) breeding programs, but other objectives such as bean characteristics, flavour and desirable agronomic traits are also incorporated to produce superior planting materials. To achieve this, MCB has established a new local verification trial (LVT) plot in 2015 at farmer’s
field Tebekang, Serian, Sarawak to evaluate twenty new clones with three control clones (KKM 22, PBC 123 and MCBC 10). The main objective of this trial is to evaluate the potential yield of the new clones and Vascular Streak Dieback (VSD) disease tolerance based on the local agro-climatic condition. MATERIALS & METHODS The trial was set up in 2015 at the farmer’s plot
in Tebakang, Serian, Sarawak. The genetic material used consisted of twenty new selected clones (BTKU-A01-A20) (Figure 1) selected from the Previous local clone trial and three commercial cocoa clones (PBC 123, MCBC 1 & KKM 22) as the control.

Malaysian Cocoa Journal 2019, Vol. 11
77
Figure 1. New selected cocoa clones.
The field trial plot was established according to completely randomized block design, with three replications and fifteen plants per plot. Crop bananas (Musa spp.) were planted between the cocoa trees as temporary shade. Standard maintenance treatments were applied uniformly. Data collection of this trial includes girth measurement, pod yield counting for each tree, pod and bean characteristics.
The evaluation and scoring of disease symptom severity of VSD infection based on the following indexes: (0 – healthy; 1 – infected leaf, few or many; 2 – infected leaf, some or most of which showing chlorosis in progress; 3 – most of infected leaves showing chlorosis and necrotic, still remain attached; 4 – infected leaves began to abscise; 5 – most infected leaves have abcised, apparent cessation of first flush growth; 6 – near complete defoliation dieback). DISCUSSION The result of cocoa pod yield for the selected cocoa clones recorded in 2018 was shown in Table 1. Based on the result pod yield per plot and annual average pod yield per tree, high heterogeneity in cocoa-tree yields was observed with coefficient of variation 0.50. The distributions of cocoa-tree yields between selected cocoa clones demonstrate that they can be group into low and high-yielding clones. Examples of the high-yielding clones were A07 (19.66 pods) and A14 (15.52 pods) while the low-yielding clones were A01 (2.81 pods) and A02 (3.08 pods). Compare to the yield value shown by clone PBC 123 (7.72 pods) which is widely planted, clones such as A07 and A14 have huge potential to increase the cocoa production in the future. However, more data are required in the following years to prove this
potential as dynamic of yield through the year provide important information for breeders to classify which of the clones can perform continous or discontinuous pod bearing. The world’s average yield cocoa production is
slightly above 0.4 t/ha, well below the 3-5 t/ha obtained under experimental conditions (Motamayor et al., 2008).
Table 1. Pod yield per tree recorded in 2018.
CLONE PYP PYT
A01 45 2.81
A02 37 3.08
A03 278 14.63
A04 505 14.02
A05 421 18.30
A06 101 7.76
A07 531 19.66 A08 215 10.75
A09 166 8.73
A10 158 9.29
A11 54 3.60
A12 267 14.83
A13 148 8.22
A14 559 15.52
A15 19 3.16
A16 201 7.73
A17 423 10.57
A18 49 6.12
A19 86 9.55
A20 7 7.00
PBC123 85 7.72
MCBC 1 70 6.36
KKM 22 94 8.54
Avg 9.48

Malaysian Cocoa Journal 2019, Vol. 11
78
Table 2. Pod bean analysis of the selected clones.
CLONE AWBW ADBW PV BNP BCR PYP PYT A16 5.45 1.642 15.71 41.25 30.16 201 7.73 A18 3.71 1.068 33.46 32 25.99 49 6.12 A14 4.18 1.442 20.38 37 34.55 559 15.52 A11 4.36 1.116 31.99 32 25.6 54 3.60 A12 3.98 1.182 32.39 26.82 29.71 267 14.83 A05 2.95 1.016 31.96 34.65 34.1 421 18.30 A02 3.72 1.023 40.06 28 27.24 37 3.08 PBC 123 2.73 1.15 23.23 48 33.71 85 7.72 KKM 22 3.40 1.09 26.04 35.95 37.32 94 8.54 MCBC10 3.65 0.86 49.74 28.8 23.56 70 6.36 A09 2.71 0.912 32.53 34.73 33.58 166 8.73
Results from the assessment of VSD
disease (Figure 2) show that most of the selected clones in this trial have a good resistance towards the disease except to one clone (A 02) which is moderately tolerance. While the losses due to VSD in mature area have been difficult to assess, death due to VSD in immature field
planting have been frequently observed at smallholder farmers in Malaysia. This result might indicate that the selected cocoa clones can adapt to the selected local area and further emphasize that selection of resistant planting materials is the practical approach to long term control of VSD.
Figure 2. Comparison of VSD disease scores for all selected clones.
CONCLUSIONS The main conclusion based on the preliminary results of this trial points out that there are few clones that show promising potential compare to the commercial clones PBC 123 regarding yield or disease resistance. Clone PBC 123 was released as commercial clones during 1980’s and
still widely planted by the cocoa farmers in Malaysia due to good yield and adaptation to the environment.
REFERENCES Motamayor, J. C., Lachenaud, P., da Silva e
Mota, J. W., Loor, R., Kuhn, D. N., Brown, J. S., & Schnell, R. J. (2008). Geographic and Genetic Population Differentiation of the Amazonian Chocolate Tree (Theobroma cacao L). PLoS ONE, 3(10).
Malaysian Cocoa Journal 2019, Vol. 11
79
COLONIZATION OF ENDOPHYTIC Bacillus subtilis strain LKM-BL IN COCOA SEEDLINGS.
Ishak, Z.1, Ernie Eileen, R. R.2 , and Wan Syaidatul, A.3 1 Division of Biotechnology, Cocoa Innovation & Technology Center, Malaysia Cocoa Board, Lot PT12621,
Nilai Industrial Area, 71800 Nilai, Negeri Sembilan, Malaysia. 2Faculty of Applied Sciences, Universiti Teknologi MARA, 40450 Shah Alam Selangor, Malaysia.
3 School of Biosciences and Biotechnologies, Faculty of Science and Technology, Universiti Kebangsaan Malaysia, 43600 Bangi, Selangor, Malaysia.
Malaysian Cocoa J. 11: 79-84 (2019)
ABSTRACT – Endophytes are microbial symbionts residing within the plant tissues without any detrimental effect to the host plant. Selected Bacillus subtilis endophytic bacteria previously isolated within tissues of healthy Theobroma cacao L. The objectives of this study were to introduce the isolate into cocoa seedlings, to quantify the population and to observe colonization intracellular leaf and stem tissue by confocal laser microscope. Colonization was observed in leaves and stems of cocoa seedlings at 2, 4, 6, 8, 15 and 30 days of inoculation. The results showed that B. subtilis LKM-BL managed to colonize into cocoa seedlings by spraying the culture directly to the leaves of cocoa seedlings. The optimum colonization of the endophyte was achieved between 8 to 30 days of inoculation with cell count about 8.5 to 8.8 log10 CFU/g inside leaves, and 8.7 to 8.8 log10 CFU/g of stems. The observation under confocal laser scanning microscope indicated that endophytic bacteria B. subtilis LKM-BL showed compatible to live internally in stem and leaf tissues of the cocoa seedlings and harmless to the host. Key words: Endophytic, bacteria, colonization, confocal laser microscope and cocoa seedlings INTRODUCTION Endophytes were discovered living in the tissues of plants without causing any negative effects to the host plants. They can be found in the genera of Agrobacterium, Arthrobacter, Bacillus, Burkholderia, Chryseobacterium, Enterobacter, Klebsiella, Micrococcus, Ochrobactrum, Paenibacillus, Pantoea, Pseudomonas, Salmonella, Serratia, and Stenotrophomonas (Akbaba & Ozaktan, 2018). Endophytic populations are known to vary from plant to plant and also from species to species. Same species of plant may also show different endophytic population occurring at different regions and different climatic changes (Nair & Padmavanthy, 2014).
Endophytic bacteria as previously reported have capability to colonize at early stage of seedling growth (Nelson, 2017) in the internal tissues of healthy plants (Zubir et al., 2019). Colonization occurred at intercellular spaces of various plant parts including leaves, roots, stems,
flowers, and seed (Shyam et al., 2017). They occupy these areas most likely because of the abundance of carbohydrates, amino acids, and inorganic nutrients (Hardoim et al., 2015). Fisher et al. (1992) reported that endophytic bacterial colonized highest at the lower stem compared to the stem closer to the shoot apex of maize plants. In leaves, bacterial endophytes colonization was observed in the intercellular spaces of mesophyll, xylem tissues and sub stomatal areas of inoculated leaves of grapevine plants (Compant et al., 2005).
In this study cocoa seedlings was used to introduce endophytic Bacillus subtilis strain LKM-BL, to quantify the population and to observe colonization intracellular leaf and stem tissue by confocal laser scanning microscope. MATERIALS AND METHODS Preparation of cocoa seedlings The healthy ripe cocoa pods were washed with soap and tap water. The pods were opened with

Malaysian Cocoa Journal 2019, Vol. 11
80
sterile scalpel and seeds coats (pulps) were removed under sterile conditions (laminar air flow). The seeds were immediately immersed in sterile distilled water and then surface sterilized using 70% ethanol for 2 min, 3.5% sodium hypochlorite for 10 min and then rinsed three times with sterile distilled water (Pavlo et al. (2011). The sterile seeds were germinated onto sterile wet gunny sack for 4 days. The individual germinated seedling was transferred to the sterile plastic pot contained a sterile soil. The plants were maintained by suitable watering with sterile distilled water in a greenhouse until 2 months old. Preparation of endophytic B. subtilis LKM-BL Endophytic Bacillus subtilis LKM-BL was cultured on nutrient agar at 28oC for 24 h, and single colony was inoculated into nutrient broth (100 mL in 250 mL Erlenmeyer flask) with constant aeration at 150 rpm for 24 h at 28oC. The bacterial culture was centrifuged at 10,000 rpm for 20 min to get bacterial cells, and the cells were suspended in sterilized distilled water and the cell concentration was adjusted to 109 colony forming units (CFU) per microliter. Freshly prepared bacterial cell suspensions were used for the experiment. Colonization of endophytic B. subtilis LKM-BL Freshly prepared bacterial cell suspensions were directly sprayed on the surface of leaves and stems of the 2 months old cocoa seedlings. Stem and leaf samples were obtained after 4 days inoculation and were surface-sterilized. The samples were immersed in Hoechst dye (33342, USA) for 30 minutes in dark and then inspected under confocal laser scanning microscope. The leaf and stem samples were also subjected to re-isolation of endophytic bacteria. The re-isolated bacteria was then identified using 16s rDNA sequencing. Quantification of endophytic bacteria population Cocoa seedlings used in the experiment were grown until 2 month and treated with 100 mL suspension of B. subtilis strain LKM-BL standard inoculums (1 x 10⁸ CFU/mL) by direct sprayed to both surface of the leaves. Cocoa seedlings untreated without endophyte were treated with sterile distilled water as control. The population of endophyte inside leaf and stem were evaluated in
2, 4, 6, 8, 10, 15 and 30 day old seedlings. The leaf and stems samples were surfaced sterilized as described by Pavlo et al. (2011). As much as 1 g of each samples were crushed with a sterile mortar and pestle and mixed with 9 mL sterile distilled water. The suspensions were serially diluted and plated on NA agar. The plates were incubated for 24 h at 28oC, the number of colonies was counted and the total population was expressed as CFU/g of the samples. RESULTS AND DISCUSSION Colonization of endophytic bacteria B. subtilis LKM-BL was observed in leaves and stems of cocoa seedlings at 2, 4, 6, 8, 15 and 30 day inoculation (Table 1). The results showed that B. subtilis LKM-BL managed to colonize into cocoa seedlings by spraying the culture direct to the leaves of cocoa seedlings. Cocoa seedlings untreated with endophytic bacteria did not showing any colonization. Population of endophytic bacteria began to colonize in leaves with the high cells population of 6.73±0.13 log10 CFU/g and slowly spread to the stem at 2 days of inoculation. The population continued to grow until 6 days of inoculation revealed that no significantly different (P < 0.05) of cells growth between leaves and stems. The optimum growth of the endophytic cells in the cocoa seedlings was achieved between 8 to 30 days inoculation inside leaves (8.5 - 8.8 log10 CFU/g) and stems (8.7 - 8.8 log10 CFU/g). The colonization showed that endophytic bacteria B. subtilis LKM-BL is compatible to live inside cocoa seedlings and harmless to the host since the seedling were found to be growing healthily throughout the 30 days of the experiment. A similar study was also performed by Ren et al. (2013) in which the endophytic bacteria isolated from the poplar tree B. pumilus JK-SX001 can be reconstituted into the poplar tree with the population density found to be highest on leaf, stems and roots of poplar trees after 10 days of inoculation. In another study, it was shown that endophytic B. subtilis isolated from mulberry tree requires 30 days of inoculation to colonize the entire roots, stems and leaves until it reaches the

Malaysian Cocoa Journal 2019, Vol. 11
81
highest population in the host (Ji et al. 2008). However, B. subtilis LKM-BL only took 8 days
for post inoculation to reach optimal colonization in the leaves and stems of cocoa trees.
Table 1. Population of endophytic bacteria B. subtilis LKM-BL cells in leaves and stems cocoa seedlings.
Treatments Days of colonization endophytic bacteria B. subtilis LKM-BL
2 4 6 8 10 15 30 Leaf (with endophyte) (log10 CFU/g)
6.73±0.13a
7.51±0.21a
7.53±0.44a
8.54±0.21a
8.24±0.33a
8.82±0.16a
8.87±0.24a
Leaf (without endophyte) (log10 CFU/g)
0.00
0.00
0.00
0.00
0.00
0.00
0.00
Stem (with endophyte) (log10 CFU/g)
6.30±0.20b
6.56±0.18b
7.07±0.24a
8.74±0.15a
8.55±0.27a
8.82±0.21a
8.84±0.11a
Stem (without endophyte) (log10 CFU/g)
0.00
0.00
0.00
0.00
0.00
0.00
0.00
In this study, colonization of endophytic bacterial strains of B. subtilis LKM-BL through leaves and stems was performed according to Melotto et al. (2006) Bacteria can enter plant tissue through openings of stomata microscopy holes on leaf surface. In addition, endophytic bacteria may also enter plant tissues through the surface of lenticidal stems (Fox et al., 1971), opening of sprouting seeds (Gagne et al., 1987), injuries to the plant surface and root surface of the plant (Jacobs et al., 1985). In addition, some endophytic bacteria have the ability to produce specific enzymes such as cellulase that breakdown plant cell walls allowing them to enter the plant tissues (Quadt-Hallmann et al., 1997). Besides that, endophytes can access plant tissues using polysaccharide degradation enzymes (Lanham et
al., 1991), cell wall degradation enzymes (Benhamou et al., 1996), hydrolytic enzymes (Bell et al., 1995) and pectinase (Baker et al., 1990). Microscopy study such as confocal laser scanning microscopy combined with fluorescent dyes for labelling or staining of specific bacterial cells allows the detection of endophyte colonization inside the plant tissues (Shyam et al. 2017). Observations of cocoa leaf tissue (Figure 1) and stem samples (Figure 2) after 4 days of inoculation detected the presence of endophytic bacterial cells of B. subtilis LKM-BL stained as fluorescent blue bacilli due to Hoechst dye (33342, USA) clearly indicated successful colonization of the bacteria in the cocoa seedlings.

Malaysian Cocoa Journal 2019, Vol. 11
82
Figure 1. Observation of the colonization of B. subtilis LKM-BL in the leaf tissue of cocoa
seedling after 4 days of endophyte inoculation through confocal laser scanning microscope.
Figure 2. Observation of the colonization of B. subtilis LKM-BL in the stem tissue of cocoa seedling after 4 days of endophyte inoculation through confocal laser scanning microscope.

Malaysian Cocoa Journal 2019, Vol. 11
83
The use of confocal laser scanning microscopy was also used by Thomas & Reddy (2013) to show the presence of endophytic bacteria colonizing in banana plant tissue.
After successful colonization of endophytic bacterial colonies into leaf tissue and stem cells of cocoa seedling, re-isolation of the bacteria was performed. The re-isolated bacteria were confirmed to B. subtilis LKM via sequencing the 16S rDNA gene. CONCLUSIONS Endophytic bacteria have been reported to live in symbiosis within diverse plants but, their known function is still limited. Findings showed that the endophytic Bacillus subtilis LKM-BL is an endophyte that can be reconstituted to colonize internal tissues of cocoa seedling. The isolate takes only 8 days of inoculation to reach optimal colonization populations in the leaves and stems of cocoa seedlings. ACKNOWLEDGEMENT This work was supported by Intensive Research in Priority Area (IRPA) of Ministry of Sciences, Technology and Environment of Malaysia.
REFERENCES Akbaba, M. & Ozaktan, H. (2018). Biocontrol of
angular leaf spot disease and colonization of cucumber (Cucumis sativus L.) by endophytic bacteria. Egyptian Journal of Biological Pest Control, 28: 14 DOI 10.1186/s41938-017-0021-1
Baker, C.J., Mock, N., Atkinson, M.M. &
Hutcheson, S. (1990). Inhibition of the hypersensitive response in tobacco by pectate lyase digests of cell wall and of polygalacturonic acid. Physiological and Molecular Plant Pathology, 37: 155-167.
Bell, C.R., Dickie, G.A., Harvey, W.L.G. & Chan, J.W.Y.F. (1995). Endophytic bacteria in grapevine. Canadian Journal of Microbiology, 41: 46-53.
Benhamou, N., Belanger, R.R. & Paulitz, T.
(1996). Preinoculation of Ri T-DNA-transformed pea roots with Pseudomonas fluorescens inhibits colonization by Pythium ultimum Trow: an ultrastrucural and cytochemical study. Planta, 199: 105-117.
Compant, S., Reiter, B., Nowak, J., Sessitsch, A.,
Clement, C. & Barka, E.A., (2005). Endophytic colonization of Vitis vinifera L. by plant growth-promoting bacterium Burkholderia sp. strain PsJN. Appl. Environ. Microbiol., 71: 1685-1693.
Fisher, P.J., Petrini, O. & Lappin Scott, H.M.
(1992). The distribution of some fungal and bacterial endophytes in maize (Zea mays L.). New Phytol., 122: 299-305.
Fox, R.T.V., Manner, J.G. & Myers, A. (1971).
Ultrastructure of entry and spread of Erwinia carotovora var. atroseptica into potato tuber. Potato Research, 14: 61-73.
Gagne, S., Richard, C., Rouseau, H. & Antoun, H.
(1987). Xylem-residing bacteria in alfalfa roots. Canadian Journal of Microbiology, 33: 996-1000.
Hardoim, P.R., van Overbeek, L.S., Berg, G.,
Pirttila, A.M., Compant, S., Campisano, A., Doring, M. & Sessitsch, A. (2015). The hidden world within Plants: Ecological and evolutionary considerations for defining functioning of microbial endophytes. Microbiol. Mol. Biol. Rev., 79: 293-320.
Jacobs, M.J., Bugbee, W.M. & Gabrielson, D.A.
(1985). Enumeration, location, and characterization of endophytic bacteria within sugar beet roots. Canadian Journal of Botany, 63: 1262-1265.

Malaysian Cocoa Journal 2019, Vol. 11
84
Ji, X., Lu, G., Gai, Y., Zheng, C., & Mu, Z.
(2008). Biological control against bacterial wilt and colonization of mulberry by an endophytic Bacillus subtilis strain. FEMS Microbiology Ecology, 65: 565-573.
Lanham, P.G., Mcllravey, K.I. & Perombelon,
M.C.M. (1991). Production of cell wall dissolving enzymes by Erwinia carotovora subsp. atroseptica in vitro at 27oC and 30.5oC. Journal of Applied Bacterialogy, 70: 20-24.
Melotto, M., Underwood, W., Koczan, J., Nomura,
K. & He, S.Y. (2006). Plant stomata function in innate immunity against bacterial invasion. Cell, 126(5): 969-980.
Nair, D.N. & Padmavathy, S. (2014). Impact of
endophytic microrganisms on plants, environment and Human. Hindawi Publishing Corporation Scientific World Journal, Article ID 250693.
Nelson, E.B. (2017). The seed microbiome:
Origin, interaction, and impacts. Plant Soil, 1-28.
Pavlo, A., Leonid, O., Iryna, Z., Natalia K. &
Maria P.A. (2011). Endophytic bacteria enhancing growth and disease resistance of potato (Solanum tuberosum L.). Biological Control, 56: 43-49.
Quadt-Hallmann, Benhamou, N. & Kloepper, J.W.
(1997). Bacterial endophytes in cotton: mechanisms of entering the plant. Canadian Journal of Microbiology, 43: 577-582.
Ren, J.H., Li, H., Wang, Y.F., Ye, J.R., Yan, A.Q.
& Wu, X.Q. (2013). Biocontrol potential of an endophytic Bacillus pumilus JK-SX001 against poplar canker. Biological Control, 67: 421-430.
Thomas, P. & Reddy, K.M. (2013). Microscopic
elucidation of abundant endophytic
bacteria colonizing the cell wall-plasma membrane peri-space in the shoot-tip tissue of banana. AoB Plants, 5: plt011. doi: 10.1093/aobpla/plt011.
Shyam, L.K., Pierre, M.J. & Sharon, L.D. (2017).
Bacterial endophyte colonization and distribution within plants. Microorganisms, 5(77): 1-26
Zubir, I., Ross, E.E.R., Hamzah, A. & Aqma, W.S.
(2019). Endophytic bacteria with antagonistic activities against pathogenic fungal Oncobacidium theobromae of cocoa. Bioscience Research, 16(1): 648-657.

Malaysian Cocoa Journal 2019, Vol. 11
85
CONSTRUCTION, CLONING AND EXPRESSION OF SYNTHETIC GENES ENCODING ARTIFICIAL TRANSCRIPTION FACTORS OF THEOBROMA CACAO LEC2
Rahman, M.Z.A., Jainuddin, H. and Kasran, R.
Biotechnology Division, Centre for Cocoa Biotechnology Research, Malaysian Cocoa Board, Commercial Zone 1, Norowot Road, South KKIP, 88460, Kota Kinabalu, Sabah, Malaysia
Malaysian Cocoa J. 11: 85-88 (2019)
ABSTRACT – LEAFY COTYLEDON 2 (LEC2) exerts significant impacts on determining embryogenic potential and various metabolic processes through a complicated genetic regulatory network and is sufficient to induce somatic embryo development in vegetative cells. Previously, five new designs of TcLEC2 artificial transcription factors (ATFs) were successfully designed and constructed that comprised a modular structure. The synthetic genes encoding recombinant TcLEC2 ATFs (L1, L2, L6, L7 and L8) have been constructed and cloned into the expression vector pET100/D-TOPO. Constructions of the recombinants L1, L2, L6, L7 and L8 were confirmed by PCR amplification and sanger sequencing. Soluble fusion proteins of the TcLEC2 ATFs were induced by 0.1mM IPTG and were expressed in Escherichia coli KRX under optimal conditions. The results showed that the proteins induced from recombinants pET100/D-TOPO-L1 and pET100/D-TOPO-L2 were 20 and 16 kDa repectively. For pET100/D-TOPO-L6, pET100/D-TOPO-L7 and pET100/D-TOPO-L8 the results showed that they shared a similar protein size as 7 kDa. The recombinant proteins were separately purified by HisTrap HP, a nickel-charged IMAC columns for high resolution his-tagged protein purification with high binding capacity for maximized recovery using ÄKTA pure protein purification system. Key words: LEAFY COTYLEDON 2, artificial transcription factor, molecular cloning, gene expression, protein purification. INTRODUCTION LEAFY COTYLEDON 2 (LEC2) regulates many distinct aspects of embryogenesis (Meinke et al., 1994; Stone et al., 2001) and encodes a transcription factor with a B3 domain, a DNA binding region found thus far only in plant proteins (D. Gaj, 2001; Santos Mendoza et al., 2005; Braybrook et al., 2006) which binds specifically to the RY motifs in the 5′ flanking
regions of LEC2-induced genes (Giraudat et al., 1992). LEC2 is exclusively expressed in developing zygotic embryos during both the early development and maturation phases. It is required for development and maintenance of suspensors and cotyledons and for the acquisition of desiccation tolerance and inhibition of premature germination (D. Gaj, 2001). Two transcription factors most closely related to LEC2, ABA INSENSITIVE3 (ABI3) and another LEC protein, FUSCA3 (FUS3), also play critical roles in embryogenesis (Luerssen et al., 1998; D. Gaj, 2001). The LEC genes are also involved in regulation of fatty acid biosynthesis and storage lipid deposition during embryo development. The seed specific overexpression of ZmLEC1 and BnLEC1 led to 35% and 20%
increase in seed oil contents in maize and canola, respectively (Shen et al., 2010; Tan et al., 2011) Ectopic expression of AtLEC2 in Arabidopsis leaves resulted in the accumulation of seed specific fatty acids (C20:0 and C20:1) and increased the mRNA level of oleosin (Stone et al., 2001). Furthermore, a direct downstream target of AtLEC2, AtWRI1 is known to control fatty acid metabolism through interactions with key genes upstream in the pathway (Maeo et al., 2009).
Attempts have been made to enhance somatic embryogenesis in cacao by the overexpression of the BABYBOOM (BBM) gene and LEC2 gene in transgenic cacao tissue by promoting the transition of somatic cacao cells from the vegetative to embryonic state (Zhang et al., 2014). The expression of TcLEC2 was higher in dedifferentiated cells competent for somatic embryogenesis (embryogenic calli), compared to non-embryogenic calli. Transient overexpression of TcLEC2 in immature zygotic embryos resulted in changes in gene expression profiles and fatty acid composition. Ectopic expression of TcLEC2 in cacao leaves changed the expression levels of several seed related

Malaysian Cocoa Journal 2019, Vol. 11
86
genes. The overexpression of TcLEC2 in cacao explants greatly increased the frequency of regeneration of stably transformed somatic embryos. TcLEC2 overexpressing cotyledon explants exhibited a very high level of embryogenic competency and when cultured on hormone free medium, exhibited an iterative embryogenic chain-reaction (Shires et al., 2017). The first demonstration of a titratable control over somatic embryo formation in a commercially relevant plant, T. cacao, was achieved using a dexamethasone activatable chimeric transcription factor. This four-fold enhancement in embryo production rate utilized a glucocorticoid receptor fused to an embryogenic transcription factor LEAFY COTYLEDON 2 (Shires et al., 2017). Where previous T. cacao somatic embryogenesis has been restricted to dissected flower parts, this construct confers an unprecedented embryogenic potential to leaves.
The works on these transcription factors
have shown very promising results and provide confirmation that transcription factors can be used to enhance SE without compromising plant development. To gain insight into the mechanisms by which cells change their fate and become embryogenic, we analyzed protein-DNA structure interaction of LEC2 cotyledon from cacao. In this study, we determined the protein structure of TcLEC2 by using comparative modeling approach followed by molecular docking to uncover the interaction between LEC2 and targeted recognition site on the promoter region of AGL15.
MATERIALS AND METHODS Sequence analysis TcLEC2 protein sequence was retrieved from Genome criollo V2 at http://cocoa-genome-hub.southgreen.fr/. The B3 domain of LEC2 protein was identified based on consensus sequence via Multiple Sequence Alignment (MSA) of closely related plant LEC2 proteins (Arabidopsis thaliana, Brassica napus and Malvaceae) using Clustal Omega (https://www.ebi.ac.uk/Tools/msa/clustalo/). Gene synthesis of TcLEC2 ATFs The genes for TcLEC2 ATFs (L1, L2, L6, L7 and L8) were sent for gene synthesis at GeneArt
and were delivered as recombinant plasmids pMX. Molecular cloning of TcLEC2 ATFs The synthetic constructs of L1, L2, L6, L7 and L8 were subcloned into pET100/D-TOPO and transformed into E. coli strain KRX for prokaryotic expression. The positive transformants were verified by Sanger sequencing. Protein expression and purification of TcLEC2 ATFs The TcLEC2 ATFs (L1, L2, L6, L7 and L8) proteins were expressed by 0.1mM IPTG induction in 2000ml E. coli KRX batch culture under optimal conditions at 37C for 16 hours. The soluble fractions of the expressed fusion proteins were subjected to affinity chromatography using 1ml HisTrap HP columns and were run using ÄKTA pure protein purification system. The purified fusion proteins were analyzed by using 12% SDS-PAGE. RESULTS AND DISCUSSION Sub-cloning of Synthetic TcLEC2 ATF Constructs into Prokaryotic Expression Vector The host harbouring the recombinant pMX plasmids for TcLEC2 ATF constructs were grown in LB broth containing ampicillin (50 μg/mL) overnight at 37°C, 150 rpm. The
recombinant plasmid was extracted by using QIAprep Spin Miniprep kit (Qiagen, Germany) as described in the manufacturer’s manual. The
genes encoding TcLEC2 ATF constructs were amplified and cloned into the expression vector of pET100/D-TOPO (Thermo Fisher, USA) as instructed in the manufacturer’s manual. The
recombinant plasmids were transformed into E. coli KRX. The positive transformants of L1, L2, L6, L7 and L8 constructs were confirmed by plasmid isolation (Figure 1) and sanger sequencing. Protein Expression and Purification of L1, L2, L6, L7 and L8 TcLEC2 ATFs into Prokaryotic Expression System Soluble fusion proteins of the TcLEC2 ATFs (L1, L2, L6, L7 and L8) were successfully induced by 0.1mM IPTG and were expressed in E. coli KRX under optimal conditions. The results (Figure 2) showed that the induced

Malaysian Cocoa Journal 2019, Vol. 11
87
proteins from recombinants pET100/D-TOPO-L1 and pET100/D-TOPO-L2 were 20 and 16 kDa repectively. For pET100/D-TOPO-L6, pET100/D-TOPO-L7 and pET100/D-TOPO-L8 the results showed that they shared a similar protein size as 7 kDa. The recombinant proteins were separately purified by HisTrap HP, a nickel-charged IMAC columns for high resolution his-tagged protein purification with high binding capacity for maximized recovery using ÄKTA pure protein purification system.
Figure 1. Plasmid extraction of recombinant transformants. Lane M : 1kb DNA marker. Lane
1 : pET100/D-TOPO-L1 plasmid. Lane 2 : pET100/D-TOPO-L2 plasmid. Lane 3 : pET100/D-TOPO-L6 plasmid. Lane 4 : pET100/D-TOPO-L7 plasmid. Lane 5 :
pET100/D-TOPO-L8 plasmid Figure 2. SDS-PAGE (12%) analysis of purified
synthetic TcLEC2 ATFs. Lane 1: Purified L1. Lane 2: Purified L2. Lane 3: Purified L6. Lane
4: Purified L7. Lane 5: Broad range protein marker.
CONCLUSIONS The synthetic TcLEC2 ATF constructs (L1, L2, L6, L7 and L8) were successfully expressed in
prokaryotic system under 0.1mM IPTG induction and were purified using his-tagged affinity protein chromatography. Further DNA binding protein characterization experiments will be employed such as EMSA, ChIP-Seq and DNase footprinting assay in order to determine the interaction between ATFs and their corresponding targeted DNA. ACKNOWLEDGEMENT This work is supported by Developmental Fund (P20001001116013-Collection and Sequencing of Cocoa Genome) from Ministry of Finance under Eleventh Malaysia Plan. REFERENCES Braybrook, S.A., Stone, S.L., Park, S., Bui,
A.Q., Le, B.H., Fischer, R.L., Goldberg, R.B. and Harada, J.J. (2006). ‘Genes
directly regulated by LEAFY COTYLEDON2 provide insight into the control of embryo maturation and somatic embryogenesis.’, Proceedings of the National Academy of Sciences of the United States of America. National Academy of Sciences, 103: 3468–3473.
D. Gaj, M. (2001). ‘Direct somatic
embryogenesis as a rapid and efficient system for in vitro regeneration of Arabidopsis thaliana’, Plant Cell, Tissue and Organ Culture. Kluwer Academic Publishers, 64: 39–46.
Giraudat, J., Hauge, B.M., Valon, C., Smalle, J.,
Parcy, F. and Goodman, H.M. (1992). ‘Isolation of the Arabidopsis ABI3 Gene
by Positional Cloning’, The Plant Cell Online, 4: 1251–1261.
Luerssen, H., Kirik, V., Herrmann, P. and
Miséra, S. (1998). ‘FUSCA3 encodes a
protein with a conserved VP1/AB13-like B3 domain which is of functional importance for the regulation of seed maturation in Arabidopsis thaliana.’, The Plant journa : for cell and molecular biology, 15: 755–764.
Maeo, K., Tokuda, T., Ayame, A., Mitsui, N.,

Malaysian Cocoa Journal 2019, Vol. 11
88
Kawai, T., Tsukagoshi, H., Ishiguro, S. and Nakamura, K. (2009). ‘An AP2-type transcription factor, WRINKLED1, of Arabidopsis thaliana binds to the AW-box sequence conserved among proximal upstream regions of genes involved in fatty acid synthesis’, The Plant Journal, 60: 476–487.
Meinke, D.W., Franzmann, L.H., Nickle, T.C.
and Yeung, E.C. (1994). ‘Leafy
Cotyledon Mutants of Arabidopsis.’, The Plant cell. American Society of Plant Biologists, 6: 1049–1064.
Santos Mendoza, M., Dubreucq, B., Miquel, M.,
Caboche, M. and Lepiniec, L. (2005). ‘LEAFY COTYLEDON 2 activation is
sufficient to trigger the accumulation of oil and seed specific mRNAs in Arabidopsis leaves’, FEBS Letters. No longer published by Elsevier, 579: 4666–
4670. Shen, B., Allen, W.B., Zheng, P., Li, C.,
Glassman, K., Ranch, J., Nubel, D. and Tarczynski, M.C. (2010). ‘Expression of
ZmLEC1 and ZmWRI1 Increases Seed Oil Production in Maize’, Plant Physiology, 153: 980–987.
Shires, M. E., Florez, S.L., Lai, T.S. and Curtis,
W.R. (2017). ‘Inducible somatic
embryogenesis in Theobroma cacao achieved using the DEX-activatable transcription factor-glucocorticoid receptor fusion’, Biotechnology Letters, 39: 1747–1755.
Stone, S. L., Kwong, L.W., Yee, K.M., Pelletier,
J., Lepiniec, L., Fischer, R.L., Goldberg, R.B. and Harada, J.J. (2001). ‘LEAFY
COTYLEDON2 encodes a B3 domain transcription factor that induces embryo development’, Proceedings of the National Academy of Sciences, 98: 11806–11811.
Tan, H., Yang, X., Zhang, F., Zheng, X., Qu, C.,
Mu, J., Fu, F., Li, J., Guan, R., Zhang, H., Wang, G. and Zuo, J. (2011). ‘Enhanced
Seed Oil Production in Canola by Conditional Expression of Brassica napus LEAFY COTYLEDON1 and LEC1-LIKE in Developing Seeds’, Plant Physiology, 156: 1577–1588.
Zhang, Y., Clemens, A., Maximova, S.N.,
Guiltinan, M.J. (2014). ‘The Theobroma cacao B3 domain transcription factor TcLEC2 plays a duel role in control of embryo development and maturation’,
BMC Plant Biology. BioMed Central, 14: 106
.

Malaysian Cocoa Journal 2019, Vol. 11
89
EFFECT OF HIGH ANTIOXIDANT DARK CHOCOLATE ON PLASMA GLUCOSE AND CHOLESTEROL LEVEL IN DIABETIC RATS
Rosmawati, M.S.1, Siti Azriena, A.1, Muhamad Zulkhairi, M.A.1 and Kasran, R.2
1Division of Biotechnology, Cocoa Innovation & Technology Centre, Malaysian Cocoa Board, Lot Pt 12621, Nilai Industrial Park, 71800 Nilai, Negeri Sembilan, Malaysia
2Division of Biotechnology, Centre for Cocoa Biotechnology Research, Malaysian Cocoa Board, Commercial Zone 1, North KKIP Norowot Road, 88460 Kota Kinabalu Industrial Park, Sabah, Malaysia
Malaysian Cocoa J. 11: 89-93 (2019)
ABSTRACT – There was variety of chocolate in the market nowadays. Chocolate constituents such as cocoa liquor, cocoa butter, types of sugar and other additional ingredients were determined its potential as healthy chocolate. Supporting with historically records and recent scientific data shown that cocoa the main ingredient of chocolate, is rich in polyphenols that have been shown potential antioxidant which contribute to improve health and prevent degenerative disease. The study was carried out to examine the effect of two formulations high antioxidant dark chocolate on serum glucose and cholesterol level in Sprague-Dawley rats. Forty rats were divided into four groups (n=10) and received: normal diets (group C); normal diets+control dark chocolate, normal diets+chocolate F1 (group F1) and normal diets+chocolate F2 (group F2) for four weeks. There is an increased of body weight in control diabetic rats, dark chocolate and high antioxidant F1 chocolate groups. Small decreasing pattern were showed in % normality of serum glucose level in rats given high antioxidant chocolate F1 and F2 compare to control diabetic rats and rats given dark chocolate. Almost no changes in % normality of serum cholesterol level in all groups of diabetic rats. As conclusion, existing high antioxidant dark chocolate is not suitable to be consume among diabetic people and new high antioxidant dark chocolate formulation must be developed for better diabetic people consumption. Key words: Chocolate, polyphenol, antioxidant, diabetic, glucose. INTRODUCTION Chocolate always associated with joy and pleasure, potentially being stimulant, relaxant, euphoriant, or antidepressant [1] it also carrying beneficial effect to human health. Cocoa is the main ingredients in chocolate including cocoa butter, milk, sugar and emulsifier. The differences between milk and dark chocolate refers to dark chocolate do not contain milk component in the formulation. Dark chocolate contain at least 15% cocoa liquor but may contain as much as 60%, rich in polyphenols such as monomer flavanols (epicatechin and catechin) as well as procyanidins, especially dimer procyanidin B2 and B1 which are abundant phytochemicals in cocoa [2]. Accumulating epidemiological evidences suggest that polyphenol plays an important role in the prevention of chronic disease such as cardiovascular disease (CVD), cancer, diabetes, obesity and neurodegenerative disease [3-8]. Different preventive mechanisms have been
proposed due to its high antioxidant properties (free radical scavenging and metal chelating) of polyphenol although the regulatory mechanism involved still unknown. Recent epidemiological study shows long term consumption of any kind of chocolate may evoke an inverse relation with occurrence of type 2 diabetes (T2D) in younger and normal-body weight men [9]. Crichton [10], also reported that a moderate chocolate intake of several times per week may be related to the reduction of the incidence of T2D. Evidence from intervention studies show flavanol rich dark chocolate (500mg polyphenols/day) decreased blood pressure, lowered insulin resistance and increased insulin sensitivity in healthy volunteers [11]. Meanwhile, in a longer intervention with diabetic patients showed that the ingestion of high polyphenol chocolate providing 50 mg of epicatechins during 8 weeks was effective in improving the atherosclerotic cholesterol profile without

Malaysian Cocoa Journal 2019, Vol. 11
90
affecting body weight, insulin resistance, blood pressure or glycemic control [12].
Moreover, as the market for functional foods continues to expand, research in the development of food products containing antioxidant will also continue to grow. Polyphenol used in this study is defined as antioxidant food ingredient, officially recognized as natural food ingredients and also classified as a health food in most European countries. This research is carried out to investigate the effect of high antioxidant chocolate on serum glucose and cholesterol in Sprague-dawley rats. MATERIALS AND METHODS Chemicals and ingredients High antioxidant dark chocolate composition comprises of cocoa liquor, cocoa butter, sugar, emulsifier and polyphenol extract. Most of the ingredients were directly obtained from Cocoa Innovation and Technology Centre, Malaysia Cocoa Board, Nilai, Negeri Sembilan. Ethanol (Systerm), chloroform (Merck) Preparation of polyphenol extract Fresh seeds of Theobroma cacao from clone KKM4 were obtained from Cocoa Research and Development Centre, Malaysia Cocoa Board, Bagan Datuk, Perak. Cocoa seeds were soaked in water with ratio 1 to1 and then pour into depulper machine to remove the pulp and left for sundried. Then, dried cocoa beans were deshelled and defatted (Komat, Germany) to remove the shell and fat from cocoa beans. 80% of ethanol (v/v) was used to extract cocoa polyphenol from defatted cocoa beans. The organic solvent is removed by rotary evaporation (N-N-series, EYELA) under partial vacuum at 40C and the aqueous extract were freeze-dried (LABCONCO, US) and kept in -40C for further used.
Development of chocolate Dark chocolate was formulated using melted cocoa butter, cocoa liquor and sugar which were mixed homogeneously in a kneader and the chocolate mass (75% fats) was pre-refined on a lab scale
three roller refiner (EXACT 501, Germany). Then, the mass was transferred to the concher machine (CAPCO, United Kingdom) and remaining cocoa butter (25%) was added for a total of 8 hours. Meanwhile, high antioxidant dark chocolate (F1) and high antioxidant dark chocolate (F2) contains the same ingredients as conventional dark chocolate however, 1% and 1.4% of polyphenol extract added to mixer 2 hours before final stage followed by emulsifier, respectively. Then, tempering of finished chocolate mass manually will take place on a marble slab and moulded to 10g shape. Finally, the chocolate was stored at 16oC in the chiller (BERJAYA, Malaysia) after demoulded them into praline shape. Nevertheless, all samples produced met the legal standard of ‘quality chocolate’.
Animal study The present study was approved by the Ethical Committee on the use of animals for the research, University Putra Malaysia (UPM), Serdang, Selangor, Malaysia. Forty male Spraque-dawley streptozotocin (STZ)-induced diabetes rats (160-180g) were purchased from Institute Medical Research (Kuala Lumpur, Malaysia). The rats were housed in individual plastic cages with stainless steel covers and kept at room temperature (24-28C) under 12-h dark: 12-h light cycle. Rats were allowed free access to their water intake. However, the food intakes were 20 g for control diabetic group (C) and 15 g for dark chocolate, high antioxidant F1 and F2 groups given after 5 g chocolate intakes every day for 4 consecutive weeks. The experiment was carried out over 4 weeks, and body weights were recorded weekly. The rats were divided into four groups and received: normal diets (group C); normal diets+dark chocolate; normal diets+chocolate F1 (group F1) and normal diets+chocolate F2 (group F2). Rats were fasten overnight and blood was collected via cardiac puncture and sacrificed using chloroform. Determination of glucose and cholesterol At 0 and 4 weeks of experiment, 5 ml blood was collected from the intra cardiac cavity and placed into a plain tube. Then, the samples were centrifuged (Universal 32®, Hettich

Malaysian Cocoa Journal 2019, Vol. 11
91
Zentrifugen, Germany) for 10 min at 1000 x g at 4C. The supernatant was collected and kept at -20C for further analysis. Serum glucose and cholesterol level were measured using the Chemistry Analyzer (Hitachi 902 Automatic Analyzer, Japan). Statistical analysis All data are presented as mean ± S.E.M. (standard error mean). The data were analyzed using ANOVA test and Duncan New Multiple Range Test through Statistical Package for the Social Science (SPSS) software version 25 (2017). Mean difference between groups of variables were tested with variance analysis
(ANOVA). Two ended p values less than 0.05 were considered as statistically significant.
RESULTS AND DISCUSSION Body weight Body weight of diabetic rats were weighted weekly for 4 weeks. Maximum body weight was 212 g and minimum body weight was 140 g. Table 1 show the pattern of increased in body weight in control diabetic rats, dark chocolate and high antioxidant F1 chocolate groups but not significantly different (P>0.05). However, there was a decreased in body weight of high antioxidant F2 chocolate.
Table 1.The % normality of body weight of diabetic rats.
Groups % Normality body weight Control diabetic 126.75± 5.86 Dark choc 127.33±17.48 High antioxidant F1 138.00±12.29 High antioxidant F2 117.83±10.01 Data were expressed as mean±SE. N=4-7. Serum glucose and cholesterol level Dark chocolate is rich in polyphenols such as monomer flavanols (epicatechin and catechin) as well as procyanidins, especially dimer procyanidin B2 and B1 which are abundant phytochemicals in cocoa [2]. These components were reported to possess marked antioxidant activity [13] particularly polyphenols are reported to be potential bioactive component for diabetic use [14, 15]. This study showed small decreased (Table 2) in % normality of serum glucose level in rats given high antioxidant chocolate F1 and F2 compare to
control diabetic rats and rats given dark chocolate. Serum glucose level was decreased in high antioxidant F1 and F2 from 7.33±0.46 to 4.84±0.33 mmol/l and 8.37± 0.48 to 4.90±0.68 mmol/l respectively. It may be due to the antioxidant properties of the cocoa content. Cocoa content also suggested can lowering the glucose level due to polyphenol that inhibit or suppress the generation of free radical by STZ in diabetic rats [16]. The possibility that cocoa content could regenerate the damage of ß-cells cause by STZ.
Table 2. The % normality of serum glucose and cholesterol level of diabetic rats.
Groups % Normality serum glucose % Normality serum cholesterol Control diabetic -94.40±0.42 -97.62±0.31 Dark choc -94.62±0.44 -97.91±0.13 High antioxidant F1 -95.16±0.33 -97.59±0.14 High antioxidant F2 -95.10±0.68 -97.63±0.24 Data were expressed as mean±SE. N=4-7.
Changes in plasma cholesterol and triglyceride concentration always related to lipid abnormalities in diabetes mellitus [17] which are certainly contributes to the development of
vascular disease. Our study showed almost no changes in % normality of serum cholesterol level in all groups of diabetic rats. However, result from Ruzaidi et al. [18], found that cocoa extract was

Malaysian Cocoa Journal 2019, Vol. 11
92
significantly increased HDL-cholesterol and suggested that cocoa content might have some protective effects against hypercholesterolemia risk in diabetes. CONCLUSIONS In conclusion, concentration cocoa polyphenol extract used in dark chocolate do not contributed to reduce glucose and cholesterol level in diabetic rats. New high antioxidant dark chocolate with higher concentration of cocoa polyphenol extract is needed to elucidate the mechanism of polyphenol present in chocolate can lower the serum glucose and cholesterol level, safe to be consume in diabetes patients. ACKNOWLEDGEMENT This study was supported by the internal research fund provided by Malaysia Cocoa Board (MCB) Project No. L15257. The authors would like to acknowledge Pharmaceutical Biotechnology Division, MCB and Animal Unit, Universiti Putra Malaysia (UPM) for their excellent technical assistance throughout the entire study. REFERENCES 1. Parker, G., Parker, I., and Brotchie, H. (2006).
Mood effects of chocolate. Journal of Affective Disorders, 92:149–159.
2. Rusconi, M. and Conti, A. (2010). Theobroma
cacao L., the food of the Gods: a scientific approach beyond myths and claims. Pharmacol. Res., 61: 5-13.
3. Maskarinec, G. (2009). Cancer protective
properties of cocoa: a review of the epidemiologic evidence. Nutr. Cancer, 61: 573-579.
4. Farhat, G., Drummond, S., Fyfe, L. and
Aldujaili, E.A. (2014). Dark Chocolate:
an obesity paradox or a culprit for weight gain? Phytother. Res., 28: 791-797.
5. Ramos, S. (2008). Cancer chemoprevention and
chemotherapy: dietary polyphenols and signaling pathways. Mol. Nutr. Food Res., 52: 507-526.
6. Scholey, A. and Owen, L. (2013). Effect of
chocolate on cognitive function and mood: a systemic review. Nutr. Rev., 71: 665-681.
7. Corti, R., Flammer, A. J., Hollenberg, N. K. and
Luscher, T.F. (2009). Cocoa and cardiovascular health. Circulation, 119: 1433-1442.
8. Martin, M.A., Goya, L. and Ramos, S. (2016).
Antidiabetic actions of cocoa flavanols. Mol. Nutr. Food Res., 60: 1756-1769.
9. Matsumoto, C., Petrone, A.B., Sesso, H.D.,
Gaziano, H.M. and Djouss, L. (2015). Chocolate consumption and risk of diabetes mellitus in the Physician’ Health
Study. Am. J. Clin. Nutr., 101: 362-367. 10. Crichton, G.E., Elias, M.F., Dearborn, P. and
Robbins, M. (2017). Habitual chocolate intake and type-2 diabetes mellitus in the Maine-Syracuse Longitudinal Study: (1975-2010): prospective observations. Appetite, 108: 263-269.
11. Grassi, D., Lippi, C., Necozione, S., Desideri,
G. and Ferri, C. (2005a). Short term administration of dark chocolate is followed by a significance increase in insulin sensitivity and a decrease in blood pressure in healthy persons. Am. J. Clin. Nutr., 81: 611-614.
12. Mellor, D.D., Sathyapalan, T., Kilpatrick, E.S.,
Beckett, S. and Atkin, S.L. (2010). High cocoa polyphenol rich chocolate improves HDL cholesterol in type 2 diabetes patients. Diabet. Med., 27: 1318-1321.

Malaysian Cocoa Journal 2019, Vol. 11
93
13. Osakabe, N., Yamagishi, M., Sanbogi, C., Natsume, M., Takizawa, T. and OSAWA, T. (1998). The antioxidative substances in cacao liquor. J. Nutr. Sci. Vitaminol. 44:313–321.
14. Ivora, M.D., Paya, M. and Villar, A. (1989). A
review of natural products and plants as potent antidiabetic drugs. Journal of Ethnopharmacology, 27:243-275.
15. Manicham, M., Ramanathan, M., Farboodinay
Jahromi, M.A., Chansouria, J.P.N. and Ray, A.B. (1997). Antihyperglycemic activity of phenolics from Pterocarpus marsupium. Journal of Natural Products, 60: 609-610.
16. Chakravarthy, B.K., Gupta, S. and Gode, K.D. (1982). Functional beta cell regeneration in the islets of pancreas in alloxon induced diabetic rats by (-)-epicatechin. Life Sciences, 31: 2693-2697.
17. Sachdewa, A. and Khemani, L.D. (2003).
Effects of Hibiscus rosa sinensis Linn. ethanol flower extract on blood glucose and lipid profiles streptozotocin induced diabetes in rats. Journal of Ethanopharmacology, 89: 61-66.
18. Ruzaidi, I., Amin, I., Nawalyah, A.G., Hamid,
M. and Faizul, H.A. (2005). The effects of Malaysia cocoa extract on glucose levels and lipid profiles in diabetic rats. Journal of Ethanopharmacology, 98: 55-60

Malaysian Cocoa Journal 2019, Vol. 11
94
REVALIDATION OF IDENTIFIED SNP MARKERS BY MICROARRAY EXPRESSION AND DEVELOPMENT OF SNPS FIELD VALIDATION WITH MULTIPLEX PCR
Roslina, M.S1., Nuraziawati M.Y2, Aizat, J3, Ahmad K, M.J3, Navies, M.4, Alias A2, Kasran, R.1, Neoh, J.5
1Malaysian Cocoa Board, Commercial Zone 1, Norowot Road, Kota Kinabalu Industrial Park, 88460 Kota Kinabalu, Sabah
2Malaysian Cocoa Board, P.O. Box 30, Sg. Dulang Road, 36307 Sg. Sumun, Perak 3Malaysian Cocoa Board, Lot 248, Block 14, Daerah Muara Tuang, Daerah Muara Tuang, Bahagian
Samarahan, Locked Bag 3131, 93450, Kuching, Sarawak. 4Malaysian Cocoa Board, Centre of Cocoa Research and Development, Mile 10, Apas Road, P.O. Box
60237, 91012 Tawau, Sabah 5NeoScience Sdn Bhd (946222-U) P91, Block C, Level P, Kelana Square, Jalan SS 7/26, Kelana Jaya,
47301 Petaling Jaya, Selangor Darul Ehsan
Malaysian Cocoa J. 11: 94-100 (2019) ABSTRACT - Nowadays, gene-based molecular markers used in crop breeding programs for marker-assisted selection. However, the identification of genetic variants associated with important agronomic traits has remained a difficult task in any crops. Bioinformatics information from transcriptomic, genomics and microarray expression were combined to achieve the ultimate goals of finding and identify SNP-related gene for each agronomical traits studied. From previous Target enrichment sequencing, we confirmed that about 20,614 SNPs were able to be verified from 70,000 SNPs (with stringent filtering). Through comparing data to the microarrays expressions, we found out (tentatively) about forty potentially SNPs-related genes need to be further analysis on a field test samples by PCR amplification. To check the utility of identified SNPs, these validated SNPs were required to be asses by genotyping a relatively larger population soon. These SNPs identified by gene expression profile provide a useful resource for genetic and genomic studies of cocoa. Key word: SNP, microarray, validated, gene-associated, markers
INTRODUCTION Considerable progress has been made in genomic research in plant and animal worldwide (Pandey et al., 2019). Various metabolic pathways were unravelled and provide essential information for finding molecular markers for agronomic traits. New tools and knowledge are frequently changing how strategies applied in crop plant research (Mochida et al., 2010). Ultimate benefits for all are to reduce overall cost and increase potential yield for crop sustainability. New disciplines such as genomics, transcriptomics, proteomics, metabolomics need to be integrated with plant physiology and conventional plant breeding. Bioinformatics will provide an essential integration to facilitate these process and giving out means to view these complexes datasets into valuable and meaningful analysis for plant breeders (Pérez-de-Castro et al., 2012).
Functional markers vs random markers - Among these strategies, functionally characterised genes, EST, and genome sequencing projects have facilitated the development of molecular markers derived from the genome (VLK et al., 2016). Putative functions can be deduced from ESTs or gene using homology search using nucleotides or even protein database. Molecular markers derived from gene sequences in the genome called ‘functional markers’. These functional markers have some advantages compared to any random markers (markers from an anonymous region of the genome) because they are highly related to the desired allele for certain agronomic traits. In this study, Single Nucleotide Polymorphism (SNPs) is an alteration of one nucleotide in a DNA sequence, can be identified and used as markers (Batieno et al., 2018). Their frequent occurrence provides a comprehensive source of widely distributed genetic markers and likely to be found close to the target gene of interest (Dubiela et al., 2019).

Malaysian Cocoa Journal 2019, Vol. 11
95
Microarray-based gene expression - Microarray-based gene expression data between two genetically different lines can also be used to identify SNPs and ultimately develop functional markers for different traits (Gupta et al., 2008). Identification of single-feature polymorphism from visualising microarray profiling data alone is complicated as many putative SNPs could not be confirmed. Furthermore, different microarray platform with the same RNA samples or different bioinformatic tools might not identify the same sets of a differently expressed gene (Calvino et al., 2009). However, by combining various datasets from genomic, transcriptomic, and microarray gene expression datasets, an overview of small sets of genes can be later identified and used as functional markers (Hayden et al., 2008). MATERIALS AND METHOD a) Previous listing of validated SNPs from
Target Enrichment project. b) Microarray gene expression performed on
the selected SNPs. The expression analysis was performed to validate whether the SNPs detected from the previous project, has any significant expression effect. (whether any changes in gene expression level will involve in the production of protein and subsequently, whether this will impact the phenotype studied). The result obtained from the microarray gene expression compared with the SNP data from previous NGS target enrichment study.
c) An allele-specific primer designed for the seven selected SNP from each trait.
d) Multiplex PCR performed for each set of allele-specific primers
RESULTS AND DISCUSSIONS There will be two types of product size expected if using allele-specific primer set; one indicates that there is no SNP and another size will show there will be SNP/SNP is confirmed present in that specific sample. If there is any mismatch (SNP), a particular size of band will be detected. Only primer sets which produce one specific size will be observed indicating that there is SNP in the sequences.
Testing of Primer Specificity- Seven samples selected from previously targeted sequencing project were used to check the primer specificity. Table 1. Seven samples for primer testing
No Sample Name
Primer SNP location Bp Size (bp)
1 MCB10 (H03)
BP BP_g1481.t1 213
2 DR 1 (S26)
H H_g7417.t1 190
3 FP 8
(H27) L L_g84.t1 153
4 KKM17 CBP CBP_g6449.t
1 175
5 MCBC1 SCSI SCSI_g8311.
t1 206
6 KKM 4 (C04)
VSD VSD_g410.t1 163
7 C62 PH PH_g2238.t1 129
The PCR condition is as below: The sample concentration for each reaction is 10ng (2ul of 5ng/ul) Table 2. PCR condition for primer testing
Reagent 1x 9x PCR Master Mix 10.0 90 F primer (5uM) 1.2 10.8 R primer (5uM) 1.2 10.8 Nuclease free H2O 5.6 50.4 TOTAL 18.0 162
Each primer was tested with seven
samples and run on DNA1000 Bioanalyzer to check for PCR product size (Figure 1). A comparison was made from the targeted sequencing, and PCR analysis can be viewed in Table 3 and Table 4 below. From the comparison, we can conclude that primer for Cocoa Pod Borer (CBP), Cocoa Butter (Lemak) and Vascular Streak Dieback (VSD) are quite comparable with the expected PCR product size during the design/blasting in NCBI. However, a few samples that we expect SNP for a specific trait does not show any band in the PCR run. It could be that sample with the attribute does not have that SNP targeted. For example; sample DR1 has SNP reported from targeted sequencing for trait yield (Hasil) but did not has any band for Hasil primer in the PCR run.

Malaysian Cocoa Journal 2019, Vol. 11
96
Lane 1: BlackPod MCB10 Lane 7: BlackPod C62 Lane 2: BlackPod DR1 Lane 8: BlackPod NTC Lane 3: BlackPod FP8 Lane 4: BlackPod KKM17 Lane 5: BlackPod MCBC1 Lane 6: BlackPod KKM4 Lane 1: Hasil MCBC1 Lane 2: Hasil KKM4 Lane 3: Hasil C62 Lane 4: Hasil NTC Lane 5: Lemak MCB10 Lane 6: Lemak DR1 Lane 1: CPB MCB10 Lane 2: CPB DR1 Lane 3: CPB FP8 Lane 4: CPB KKM17 Lane 5: CPB MCBC1 Lane 6: CPB KKM4 Lane 1: PodHard MCBC1 Lane 2: PodHard KKM4 Lane 3: PodHard C62 Lane 4: PodHard NTC Lane 5: SCSI MCB10 Lane 6: SCSI DR1 Lane 1: VSD MCB10 Lane 2: VSD DR1 Lane 3: VSD FP8 Lane 4: VSD KKM17
Lane 9: Hasil MCBC10 Lane 10: Hasil DR1 Lane 11: Hasil FP8 Lane 12: Hasil KKM17 Lane 7: Lemak FP8 Lane 8: Lemak KKM17 Lane 9: Lemak MCBC1 Lane 10: Lemak KKM4 Lane 11: Lemak C62 Lane 12: Lemak NTC Lane 7: CPB C62 Lane 8: CPB NTC Lane 9: PodHard MCB10 Lane 10: PodHard DR1 Lane 11: PodHard FP8 Lane 12: PodHard KKM17 Lane 7: SCSI FP8 Lane 8: SCSI KKM17 Lane 9: SCSI MCBC1 Lane 10: SCSI KKM4 Lane 11: SCSI C62 Lane 12: SCSI NTC Lane 5: VSD MCBC1 Lane 6: VSD KKM4 Lane 7: VSD C62 Lane 8: VSD NTC
Figure 1. Bioanalyser image on primer
tested

Malaysian Cocoa Journal 2019, Vol. 11
97
Samples such as MCBC10, FP10, KKM17, KKM4 and C62 does show consistent or tally with the SNPs from targeted sequencing. Sanger sequencing still needs to be performed from the isolated PCR product to confirm that the primer is targeted to the correct position of the SNP location Multiplex Pilot Run - As for the multiplex pilot run, the PCR Master Mix used for this project is Thermo Scientific Phusion U Multiplex PCR Master Mix. The kit is a ready-to-use, 2X end-point PCR Master Mix designed for simultaneous amplification of multiple targets.
Three different master mix with each different primer sets were used to screen all the DNA samples.
Primer mix A BlackPod – 213bp CBP – 175bp PodHardness – 129bp
Primer mix B Hasil – 190bp Lemak – 153bp
Primer mix C SCSI – 206bp VSD – 163bp
The master mix reaction set up is as below:
Component 1x Reaction (ul) Master Mix 10 Primer mix 1.2 dH2O 6.8
Each sample will go through three PCR
run with each different primer mix, as shown above. Then the PCR product was loaded into the Agilent 2200 Tapestation to check for the sizes. A total of 224 samples had been screened with three different primer mix, with a total of 7 primer sets. There is a total of 224 reactions used in running the Tapestation.
Table 3. SNP from targeted sequencing result Primer BP H L CBP SCSI VSD PH Expected Size (with SNP) 213 190 153 175 206 163 129 MCB10 (H03) hetero homo alt DR 1 (S26) hetero homo alt hetero homo alt FP 8 (H27) homo alt hetero KKM 17 homo alt MCBC1 hetero hetero hetero homo alt hetero hetero hetero KKM 4 (C04) homo alt hetero hetero hetero hetero hetero hetero C62 Table 4. PCR product observation from PCR run
Primer BP H L CBP SCSI VSD PH
Size 213 190 153 175 206 163 129 MCBC10 208 160 177 127
DR 1 FP8 210 205 161 175 161 126
KKM 17 122 237 160 175 218 161 126
MCBC1 (3) KKM4 199 159 175 220 162 125
C62 198 157 175 162 125

Malaysian Cocoa Journal 2019, Vol. 11
98
Screening by Multiplex PCR
Well Sample
Description Expected Product Size
Product Size based on PCR (primer mix A)
Product Size based on PCR (primer mix B)
Product Size based on PCR (primer mix C)
A1 Ladder B1 C62 150bp 157bp 161bp C1 H07 (BP, H,
SCSI) primer mix A (213), primer mix B (190), primer mix C (206)
D1 H09 (H) primer mix B (190) 147bp 165bp 176bp E1 P71 (PH) primer mix A (129) F1 P78 (PH) primer mix A (129) 153bp 153bp 166bp G1 P02 153bp 163bp 162bp H1 B04 A2 MBC C9/1 143bp, 104bp 126bp 175bp B2 P72 (PH) primer mix A (129) 140bp 157bp C2 P07 (PH) primer mix A (129) D2 H03 (H) primer mix B (190) 116bp 128bp 171bp E2 P09 (PH) primer mix A (129) F2 H06 153bp 147bp 165bp G2 B07 (BP) primer mix A (213) H2 NTC
Primer Mix A (BP, CBP, PH)
Primer Mix B (H, L)
Primer Mix C (SCSI, VSD)

Malaysian Cocoa Journal 2019, Vol. 11
99
From this study, we discovered that from the 224 samples validation run, most of the PCR product size is not the expected size as per design. For example; for Primer Mix A run, we consistently getting band size at 140 plus bp instead of 129bp for PodHardness SNP site. Among all the primer set, the only primer which targets the SNP from VSD trait is showing consistent expected product size on the samples, which is around 163bp of PCR product size. CONCLUSIONS From this validation/ pilot run, the majority of the expected PCR product size is not tally with the reported phenotype traits. Further filtering of SNPs needs to be done for the next stage with the SNPs finding from Whole Genome Sequencing by MGRC and the targeted sequencing done in 2018 to look for more specific and unique SNPs. Unique SNPs in this strategy will be a SNPs which consistently or has high SNP coverage.
We found that by including the SNPs, which showed the expression on the trait is not enough because we did not find any correlation between the SNPs and the expression to further proceed for SNPs genotyping project.
The next step will be testing for allele-specific primer set and design more primer sets per trait to test out after the unique common SNPs have been selected. The allele-specific primer for SNP detection should be 3’ end
specific. The 3’ end can be designed for both
forward and reverse primer. The enzyme will need a perfect match at the 3’ end, or extension will not happen.
Therefore, to increase the allele specificity, more mismatches can be added into the primer set. From here, each allele-specific primer set for one trait will be tested and optimised first before proceeding to do multiplex PCR. REFERENCES Bali, S., Robinson, B.R., Sathuvalli, V.,
Bamberg, J. and Goyer, A, (2018), Single Nucleotide Polymorphism (SNP) markers associated with high folate
content in wild potato species. PLoS ONE, 13(2): 1-17.
Batieno, T.B.J., Souleymane, O., Tignegre, J.B.,
Huynh, B.L., Kusi, F., Poda, S.L., Close, T.J., Roberts, P., Danquah, E., Ofori, K. and Ouedraogo, T.J. (2018). Single nucleotide polymorphism (SNP)-based genetic diversity in a set of Burkina Faso cowpea germplasm. African Journal of Agricultural Research, 13(19): 978-987.
Calviño M, Miclaus, M., Bruggmann, R. and
Messing, J, (2009). Molecular Markers for Sweet Sorghum Based on Microarray Expression Data. Rice, (2): 129–142.
Dubiela, C., Montecelli, T.D.N., Lazzari, F., de
Souto, E.R. and Schuster I. (2019). Development and validation of SNP assays for the selection of resistance to Meloidogyne incognita in soybean, Crop Breeding and Applied Biotechnology, 19: 102-109.
Gupta, P.K., Rustgi, S. and Mir, R.R. (2008).
Array-based high-throughput DNA markers for crop improvement, Heredity, 101: 5–18.
Hayden, M.J., Nguyen, T.M., Waterman, A. and
Chalmers K.J. (2008). Multiplex-Ready PCR: A new method for multiplexed SSR and SNP genotyping, BMC Genomics, 9: 80.
Huq, M.A., Akter, S., Nou, I.S., Kim, H.T.,
Jung, Y.J. and Kang, K.K. (2016). Identification of functional SNPs in genes and their effects on plant phenotypes, J. Plant Biotechnol., 43: 1-11.
Jiang, G.L. (2013). Molecular Markers and
Marker-Assisted Breeding in Plants, Plant Breeding from Laboratories to Fields: Chap 3
Liu, R., Maia, A.T., Russell, R., Caldas, C.,
Ponder, B.A. and Ritchie, M.E. (2012). Allele-specific expression analysis methods for high-density SNP

Malaysian Cocoa Journal 2019, Vol. 11
100
microarray data. Bioinformatics, 28: 1102–1108.
Mochida, K. and Shinozaki, K.. (2010).
Genomics and Bioinformatics Resources for Crop Improvement, Plant Cell Physiol., 51(4): 497–523.
Pandey, S., Mishra, S., Chandra, K. (2019).
Tools and Resources for SNP Mining in Crop Plants, International Journal of Current Microbiology and Applied Sciences, 8(01):
Pérez-de-Castro, A.M., Vilanova, S., Cañizares,
J., Pascual, L., Blanca, J.M., Díez, M.J., Prohens, J. and Picó, B. (2012). Application of Genomic Tools in Plant Breeding, Current Genomics, 13: 179-195.
Vlk, D. and Řepkova, J. (2016). Application of
Next-Generation Sequencing in Plant Breeding, Czech J. Genet. Plant Breed.

Malaysian Cocoa Journal 2019, Vol. 11
101
SCREENING AND IDENTIFICATION OF SPECIAL COCOA FLAVOR COMPOUND IN FRESH COCOA BEANS USING RAPID AND FAST MICROANALYSIS TECHNIQUES FOR
MALAYSIAN RENAISSANCE COCOA
Mohd Zaini, N. Cocoa Innovative and Technology Centre, Malaysian Cocoa Board, Lot 12621, Kawasan Perindustrian
Nilai, 71800 Nilai, Negeri Sembilan, Malaysia
Malaysian Cocoa J. 11: 101-107 (2019) ABSTRACT - The analysis of pharmacological content in cocoa beans is important and crucial for quality control of chocolate product since cocoa flavor are one of the major components in chocolate industry. Accurate microanalysis remains challenging, because it still in develops. Conventionally, this achieved by combining multiple microanalysis techniques such as GC/MS, HPLS and UV/Vis Spectrometry. Development of simpler and quicker analytical method is anticipated. At the same time, we would like to share a new unique identification and qualification strategy that will discover and allow accurate identification and qualification of important compound in fresh cocoa beans. The analysis of pharmacological content in cocoa beans is important and crucial for quality control of chocolate product since cocoa flavor are one of the major components in chocolate industry. Accurate microanalysis remains challenging, because it still in develops. Conventionally, this achieved by combining multiple microanalysis techniques such as GCMS, HPLC and UV/Vis Spectrophotometry. Development of simpler and quicker analytical method is anticipated. This study will focus on determination of several compound that contribute to special flavor such as fruity flavor (ethyl-3-methylbutanoate, ethyl-2-methylbutanoate and linalool), and flowery flavor (2-phenylethylcetate and 2-phenylethanol) using fresh beans analysis and application of microanalysis with 10mg of samples. At the same time, we would like to share a new unique identification and qualification strategy that will discover and allow accurate identification and qualification of important compound in fresh cocoa beans.
Key words: Flavour, microanalysis, volatile compound, aromatic compound, cocoa flavour, special flavour INTRODUCTION In traditional cocoa plant breeding, crosses are made between selected clones and seeds are planted. The resultant trees are evaluated for agronomic traits such as yield, precocity, and disease and insect resistance. One breeding cycle takes about 10 years and perhaps only a few trees are saved for the next cycle. After several breeding cycles, some clones are released to farmers. Almost 20 years of traditional breeding were required before Malaysian Cocoa Board (MCB) released its own MCB 1-9 clones. And much land, labor, and money were needed. An unfortunate consequence of breeding primarily for agronomic traits is that flavor and other bean traits may suffer. This is fine if only ordinary low-value bulk beans are wanted. But Malaysia does not want such beans. We are not a Third World country desperately trying to employ as many people as possible at low wages. We are an emerging industrialized country with a well-paid workforce. That is why
MCB is creating high value beans unlike any others on earth today “Malaysian Renaissance
Cocoa” (MRC). In addition, by processing our exclusive MRC beans, Malaysia can become the Gourmet Chocolate Capital of the world, not merely a supplier of beans, butter, and liquor. In our program to create MRC, flavor and other bean traits are of paramount importance. They are selected for first. There are several important features of MRC trees that set them apart from ordinary trees now in production: 1. MRC trees are populations of trees, rather than individual clones. Our populations will be continuously improved, unlike clones, which are static. 2. Each of the various populations will be highly genetically diverse, but share an enhanced bean trait: - Intense cocoa flavor. - High aroma notes (fruity or nutty or floral or
spicy, etc.).

Malaysian Cocoa Journal 2019, Vol. 11
102
- High flavanols for health chocolate. - High caffeine for a stimulating beverage (to
partially replace coffee). - Low theobromine and caffeine for low
bitterness. - High cocoa butter (the most valuable
component of beans and the most expensive edible lipid).
- Other unique characteristics, such as high in compounds that relax people
To create MRC trees quickly and inexpensively, MCB has developed a single beans analysis method (microanalysis techniques) to select for trees that will bear beans with enhanced traits. We know of no other group anywhere performing such analyses. We are the pioneers. Single bean analyses and selection is based on the realization that every cocoa bean ever produced – even from the same pod - has different trait potentials. Thus the few superior beans from an otherwise mediocre population of beans will produce trees that will on average produce superior beans. Six properties of cocoa make single bean selection feasible: - Cotyledons (nibs) are the source of
chocolate and cocoa powder (13). - The vast bulk of the embryo is cotyledon
(13). - The cotyledons are genetically identical to
the germ (13). - Cocoa is highly genetically diverse (2, 4, 9,
10). - Cocoa is highly heterozygous (4). - Individual embryos are large enough to
perform the necessary chemical analyses easily (personal observation).
- Embryos can be cut in half without affecting germination (personal observation).
MATERIALS AND METHODS Single bean from high flavor characteristic were analyses using several steps: - Crosses are made between trees that are
already known to bear flavorful beans.
- Each bean (embryo) is cut transversely without injuring the germ.
- Plant the portion with the germ (we know it will germinate and grow well).
- Analyze the upper nib (cotyledon) portion for compounds that influence bean traits: - Flavan-3-ols (condensed tannins =
procyanidins): astringent and reduce cocoa flavor precursors: want low for high cocoa flavor or want high for health chocolate.
- Caffeine and theobromine: want low for low bitterness or want high caffeine for stimulating beverage.
- Storage proteins (vicilin-class globulin): Generates flavor precursors - always want high.
- Aroma note (nutty, fruity, floral) compounds: esters, alcohols, aldehydes, etc.
- Seedlings from beans with the desired level of compound are saved, the others discarded.
- Saved trees are given to breeders to select those that have acceptable agronomic traits.
- The entire selection process is repeated with beans from the first improved population. And so on. Superior populations keep improving with each selection cycle.
Selection of trees for good agronomic traits is still done, but after beans is selected for desirable bean traits. Thus single bean analysis is a powerful pre-agronomic trait selection method. In genetic terms, single bean analysis enriches populations of trees for alleles and their combinations that enhance bean traits. Single bean analyses must be: Fast Easy Sensitive Precise Reproducible Inexpensive (<RM20.00/sample) (Able to be automated is a bonus) At this early stage in the selection process, we need to know the relative amounts of compounds in samples, not the absolute amounts. That is, single bean analysis is a selection tool.

Malaysian Cocoa Journal 2019, Vol. 11
103
If a compound in embryos is not vital for survival (e.g. secondary metabolite), can be measured precisely, and embryos are genetically diverse, it’s amount in beans can be increased or
decreased. Procyanidins, aroma note
compounds, methylxanthines (theobromine and caffeine), and - to a large extent – the vicilin-class globulin cocoa flavor/aroma precursor protein meet these criteria.
First step single beans analysis
Second step single beans an

Malaysian Cocoa Journal 2019, Vol. 11
104
RESULTS AND DISCUSSION Microanalysis techniques Single bean analyses and selection are based on the realization that every cocoa bean produced and the same pods, has different trait potentials. Nine hundred twenty five cocoa seeds cut transversely. The upper portions were used for analysis while the lower portions were planted in the nursery. Only 792 plants were survived. 223 cocoa plants were ready to transfer to field. And there are 569 cocoa plants were successfully transferred to field. Currently, there are 605 samples were analyzed using HPLC for methylxanthine (theobromine and caffeine) (Figure 1).
Six hundred thirty six samples were analysed using GC-MS to detect several compound that contribute to special aromatic flavors (nutty, fruity and floral). This information will be used as an indicator for cocoa plants selection. It was found that only flowery compound can be detected from all cocoa samples (Figure 2). From all selection, there are 20 plants selected from GCMS analysis. Out of them, 4 died, and 16 plants still survived and will be added from time to time. At this early stage in the selection process, we need to know the relative amounts of compounds in samples, not the absolute amounts.
Figure 1. Detection of methylxanthine (theobromine and caffeine). using High Performance Liquid Chromatographic.
Figure 2. Detection of aromatic flavors (nutty, fruity, flowery) in cocoa beans using Gas Chromatographic
Mass Spectrometry

Malaysian Cocoa Journal 2019, Vol. 11
105
Special beans with different chemical properties Single bean analyses and selections are based on the realization that every cocoa bean ever produced, even from the same pod, it has different trait potentials. Although cocoa embryos with the bean minus the seed coat were look pretty similar, the flavor potentials of those from even the same pod are not the same as seen in Figure 3. All farmers in a region will be plant the same population to prevent pollen and bean contamination from neighboring populations. Beans from each generation two population will be processed separately from every other population (Figure 4). The same principles can
be applied to any seed crop, such as coffee, in order to create naturally decaffeinated – or at least dramatically reduced caffeine – coffee beans and coffee beans oozing with aromatic oils. A single population (e.g. high flavor) will be grown in a cluster of adjacent farms, perhaps with one such cluster in several states (Figure 4). Farmers in their designated cluster must grow only their assigned population and must process their beans only within their cluster. This is necessary to prevent pollen contamination between different populations and inadvertent mixing of beans from different populations.
Figure 3. Fresh beans condition in one cocoa pod.
Figure 4. Hypothetical map of Malaysia with generation two populations demarcated.

Malaysian Cocoa Journal 2019, Vol. 11
106
CONCLUSIONS As a conclusion, the analysis shows that each cocoa bean have different special compound. Within this analysis, we can produce the premium cocoa bean based on the level of special flavor. This is because the cocoa compound with specific characteristics is the main factor that influence the “fine flavor” of
cocoa bean. This experiment will be applied in a thousand cocoa beans analysis for the improvement of the fast, cheap and accurate techniques for microanalysis of individual’s
beans. The benefit of microanalysis techniques for special cocoa beans to everyone in our cocoa industry will be immense: - Novel high-value beans unlike any others on
earth. - Contracts with processors to produce
specific types of beans. - Higher income from growers to exporters to
chocolate manufacturers. - Beans are not merely “fine flavor.” They
will be unlike any others on earth today! Truly revolutionary!
- By making “Malaysian cocoa and
chocolate” synonymous with “purity,
excellence, and uniqueness” we can ensure a
robust cocoa industry for many centuries to come.
ACKNOWLEDGEMENT We would like to thank to Mr Rahmat Mohammed for technical assitance and also the Director General of Malaysian Cocoa Board for permission to publish these research results. REFERENCES 1. Amin, I, Jinap, S. and Jamilah, B. (1997).
Vicilin-class globulins and their degradation during cocoa fermentation. Food Chemistry, 59(1): 1-5.
2. Bartley, B.G.D. (2005). The genetic diversity of cacao and its utilization. Oxford University Press (CABI Publishing), Oxford, UK.
3. Clapperton, J.F., Lockwood, G., Yow, S.T.K. and Lim, D.H.K. (1994). Effect of planting materials on flavor. Cocoa Grower’s Bulletin, Cadbury Ltd, England; 47-57.
4. Dias, LAD, J Marita, CD Cruz CD, et al. (2003). Genetic distance and its association with heterosis in cacao. Brazilian Archives of Biology and Technology, 46: 339-347.
5. Johnsiul, L., Lamin, K. and Furtek, D.B. (2005). Cocoa Genetic Linkage Map. Proceedings of the 4th Malaysian International Cocoa Conference, Kuala Lumpur, Malaysia: 301-305.
6. Khairul Bariah, S, Azhar, I. and Furtek, D.B. (2007). Correlation of cocoa flavor with the concentration of vicilin (7S)-class globulin in embryos. Proceedings of the 2007 Conference on Plantation Commodities, Kuala Lumpur. Ed: Malaysian Cocoa Board, 55-58.
7. Kratzer, U., Frank, R., Kalbacher, H., Biehl, B., Wöstemeyer, J. and Voigt, J. (2009). Subunit structure of the vicilin-like globular storage protein of cocoa seeds and the origin of cocoa- and chocolate-specific aroma precursors. Food Chemistry, 113: 903–913.
8. Niemenak, N, Rohsius, C., Elwers, S., Ndoumou, D.O. and Lieberei, R. (2006). Comparative study of different cocoa (Theobroma cacao L.) clones in terms of their phenolics and anthocyanins contents. Journal of Food Composition and Analysis, 19: 612-619.
9. Kasran, R., Alias, A.D. and Furtek, D.B. (2005). AFLP genetic fingerprinting of Theobroma cacao. Proceedings of the 4th Malaysian International Cocoa Conference, Kuala Lumpur, Malaysia, 311-315.
10. Sereno, M.L., Albuquerque, P.S.B., Vencovsky, R. and Figueira, A. (2006). Genetic diversity and natural population structure of cacao (Theobroma cacao L.) from the Brazilian Amazon evaluated by microsatellite markers. Conservation Genetics, 7: 13-24.

Malaysian Cocoa Journal 2019, Vol. 11
107
11. Saunders, J.A., Mischke, S., Leamy, E.A. et al. (2004). Selection of international molecular standards for DNA fingerprinting of Theobroma cacao. Theoretical and Applied, 110: 41-47.
12. Voigt J., Biehl, B. Heinrichs, H., Kamaruddin, S., Gaim Marosner, G. and Hugi, A. (1994). In-vitro formation of cocoa-specific aroma precursors: aroma related peptides generated from cocoa-seed protein by co-operation of an aspartic endoprotease and carboxypeptidase. Food Chemistry, 49: 173-180.
13. Wood, G.A.R and Lass, L.A. (2001). Cocoa (Tropical Agriculture). Wiley-Blackwell; 4th edition, 620 pages.

Malaysian Cocoa Journal 2019, Vol. 11
108
METATRANSCRIPTOMIC SEQUENCING AND ANALYSIS OF CACAO RHIZOSPHERE
Norasekin Tamchek1,2, Ping-Chin Lee2 and Rosmin Kasran1 1Center for Cocoa Biotechnology Research, Malaysian Cocoa Board, Norowot Road, Commercial Zone 1,
KKIP, 88450 Kota Kinabalu, Sabah, Malaysia 2Faculty of Science and Natural Resources, Universiti Malaysia Sabah, Jalan UMS, 88400, Kota Kinabalu,
Sabah, Malaysia
Malaysian Cocoa J. 11: 108-115 (2019) ABSTRACT - Cacao also known as Theobroma cacao L. is the third of the most important cash crop in Malaysia after oil palm and rubber. However, cacao production has plummet in recent years due to diseases, insufficient land and climatic changes. Understanding how this crop interacts with the environments is vital to ensure the survival of this crop. Soil microbial communities or microbiome, comprises a large portion of life’s genetic diversity, acting as important regulators of plant productivity
and growth especially under extreme conditions. Rhizosphere or the interface zone between the plant roots and its surrounding soil offers a range of ecosystem services to the plant, including nutrient acquisition and tolerance to biotic and abiotic stresses, yet it is remain poorly understood. In this research, the metatranscriptomic approach was used to analyse cacao soil rhizosphere and the results provide new insights into microbial abundance and their activities under drought stress conditions.
Key words: Theobroma cacao L., microbiome, rhizosphere, metatranscriptomic
INTRODUCTION
Theobroma cacao L. or cacao tree is the most widely known from twenty-two species of Theobroma genus. After oil palm and rubber, the cacao industry has grown to become Malaysia’s
third major commodity crop. The cacao tree usually grown under the shades of large trees at relatively high humidity with a stable temperature. Cacao withstand waterlogging for short periods only, and at the same time sensitive to a lack of water. With this physical properties, the soil must have both water retention properties and good drainage.
Environmental stresses are the most limiting factor to plant growth and agricultural productivity around the world (Yamaguchi-Shinozaki and Shinozaki, 2006; Zolla et al., 2013), with drought being one of the most detrimental (Ciais et. al, 2005; Rolli et. al, 2016). Drought decreases main productivity, crop quality, and weakens ecosystem services, resulting in severe economic losses. According to Ofori-Boateng & Insah (2014), increasing temperature and decreasing waterfall have a negative impact on the cacao production because of higher mortality for seed and younger trees. In order to assist in the development and growth of drought resistant crops, it is important to understand the mechanisms of
drought tolerance in plants such as stress sensing, systemic signalling pathways, and genetic regulation, including epigenetic controls and activities of small RNAs (Shinozaki and Yamaguchi-Shinozaki, 2007). Other than these mechanisms, plant-microbe interaction also might contribute to drought tolerance in plants. Soil is a complex environment which consist incredibly diverse microbial community, harbouring thousand species of bacteria and fungi in a single gram of sample. Rhizosphere is a nutrient rich zone located at the plant-root interface that acts as a junction for nutrient exchange between plants, soil and microbes (Hinsinger et al., 2005). Plant associated bacteria may provide beneficial, harm or neutral effects on roots, thus increase plant productivity. However, the abundance of bacteria and fundamental mechanism in cacao rhizosphere are poorly understood. The main constraints is because of the traditional studies only focused on culturable bacteria which is estimated less than 1%. While metagenomics will reveal the functional potential of a microbiome, metatranscriptomics will revealed kingdom-level changes in the structure of crop-plant rhizosphere microbiomes (Turner et al., 2013). Enriched mRNA analysis has the potential to discover novel genes and reveal the functional adaptation of microbial communities, whereas

Malaysian Cocoa Journal 2019, Vol. 11
109
rRNA analysis provide the information of active microorganism abundance.
In this study, metatranscriptomic approach was used to identify a potential group of microbial communities in rhizosphere which could effectively promote cacao trees to tolerate under abiotic stress. The objective of this study is to compare the presence of microbial community from survival and dead cacao trees under drought condition in the selected cacao plantation. The most potential and active strains will be identified and investigated.
MATERIALS AND METHODS
Sampling Soil rhizosphere was collected from a cacao plantation which was experiencing drought stress. This drought plantation is located at Kampung Pinawantai, Matunggong (6°44'13.8"N 116°43'42.6"E). Selection of this plantation is based on the data and information gathered from Malaysian Cocoa Board’s
Transfer of Technology team and the latest record of drought occurrence. Sampling was performed in May 2017. Two dead (DBD1, DBD2) and two survival (DBS1, DBS2) cacao trees due to the drought stress were selected. At least five different zone and soil subsamples were collected from each tree in two replicates. Stone, roots and other debris were removed. All five subsamples were then homogenized, pooled and kept in LifeGuard Soil Preservation Solution to protect the viability of bacteria while keeping them in stasis during the transportation from the field to the laboratory. The pH, moisture and NPK concentration were also analysed using standard method such as pH meter, CHNS/O Analyzer and Inductively Couple Plasma – Atomic Emission Spectrometer (ICP-AES) platform for all soil samples.
Extraction of total RNA Total RNA from each sample was extracted using an RNA PowerSoil Total RNA Isolation Kit (MO BIO Laboratories, Carlsbad, CA) according to the manufacturer’s instructions.
Total RNA extracted from soil was subjected to DNase treatment to remove DNA contamination. The quantity of RNA was determined using NanoDrop and the quality was assessed using an Agilent 2100 Bioanalyzer. Library construction and Illumina HiSeq sequencing Ribosomal RNA (rRNA) was removed from total RNA. mRNA obtained was fragmented randomly and unique barcode adapters were applied to each library. After purification, terminal repair, A-tailing, ligation of sequencing adapters, size selection and PCR enrichment, cDNA library was quantified using a Qubit 2.0 fluorometer. Finally, libraries were sequenced using Illumina HiSeq-4000 platform using paired-end technology (150 PE reads). De novo assembly and functional annotation After sequencing, the raw paired-end reads were cleaned and filtered to produce clean data in order to ensure the accuracy and reliability of the downstream analysis results. The filtering process including (i) discard reads with adaptor contamination, (ii) discard reads when unknown nucleotides constitute more than 10% of either read (N > 10%), and (iii) discard reads when low quality nucleotides (quality score Q 40) constitute more than 40% of the read. Putative mRNA reads were assembled by Trinity (version: r20140413pl) and redundancy was removed by CD-HIT-EST to get unigenes. These unigenes were used to perform taxonomic analysis to gain more information on the structure of the microorganism (Figure 1).
Figure 1. The workflow of taxonomic analysis in metatranscriptome study
Taxonomic Analysis
Reference Alignment Gene Functional Annotation
NR
Raw Data Data Assessment Transcript Assembly

Malaysian Cocoa Journal 2019, Vol. 11
110
RESULTS AND DISCUSSION Soil metadata was recorded at the time of sample collection. Soil analysis was done to measure conductivity, moisture and available nutrient in a soil sample. Data was recorded in Table 1. The soil in the study site was generally acidic (4.57 – 4.85). This might be due to the effect of prolonged drought, which resulted in a small concentration of soluble salts present in the soil contributing to higher hydrogen ion concentration. However the soil samples are not saline as the conductivity reading were below 100 uS/cm. The NPK amount in the samples were considered marginal for cacao cultivation, however, it was expected because of drought condition during sampling. Based on NanoDrop measurement, total RNA extracted from soil samples showed concentration between 86 to 332 ng/μl with
OD260/OD280 reading 2.0 (Table 2). An aliquot of 1 uL RNA was run on 1% agarose gel in 1x TAE buffer at 100 V for 60 minutes. No DNA contamination was observed in the gel
electrophoresis after DNase treatment (Figure 2). The results confirmed that the usage of the LifeGuard Soil Preservation Solution had successfully stops the degradation of microbial RNA in soil samples. All samples passed RNA QC in order to proceed with library preparation. RNA sequencing by Illumina HiSeq 4000 generated a total of 333,322,160 raw reads from the constructed cDNA libraries (Table 3). After a rigorous quality check and data filtering, a total of 324,233,688 clean reads with an average of 97.96% had quality scores at Q20 (percentage of bases whose correct base recognition rates are greater than 99% in total bases) were obtained. The maximum number of reads was 91254074 for DBS1 and the minimum reads was 74404160 for DBS2. The total of clean bases was 48.64 Gbp with an average GC was 58.82%. The cleaned reads were then pooled and assembled de novo in order to explore the microbial shift of the cacao rhizosphere under drought stress condition.
Table 1. Soil metadata and soil analysis
Sample Name
pH Conductivity
(uS/cm) Moisture (%) N (%) P (%) K (%)
DBS1 4.66 84.50 0.78 0.09 0.02 0.28
DBS2 4.57 70.90 0.82 0.09 0.02 0.26
DBD1 4.85 92.50 0.91 0.12 0.03 0.29
DBD2 4.78 78.50 0.59 0.10 0.03 0.25
Table 2. RNA quality and quantity measurement
Sample Name Conc (ng/uL) Vol. (uL) Amt. (ug) 260/280 RIN
DBS1 118 27 3.186 2.107 8.8
DBS2 86 59 5.074 2.15 8.3
DBD1 110 27 2.97 1.964 7.6
DBD2 332 29 9.628 2.184 9.3

Malaysian Cocoa Journal 2019, Vol. 11
111
Table 3. The statistic of data pre-filtering
Sample DBS1 DBS2 DBD1 DBD2
Raw reads 93332254 76830702 82886636 80272568
Clean reads 91254074 74404160 79935518 78639936
Clean Bases 13.69G 11.16G 11.99G 11.8G
Error (%) 0.01 0.01 0.01 0.01
Q20 (%) 97.83 97.83 98.39 97.8
Q30 (%) 93.96 94.03 95.27 94.02
GC (%) 61.17 56.91 57.31 59.91
Figure 2. Total Ribonucleic acid (RNA) extracted from 4 rhizosphere samples of survival (DBS1, DBS2) and dead cacao trees (DBD1, DBD2) under drought condition. One uL RNA from each sample were run
on 1% agarose gel in 1x TAE buffer at 100 V for 60 minutes. A number of taxonomic ranks for each unigene was obtained by BLAST analysis (E-value ≤ 1e-5) to the non-redundant (NR) database in NCBI. According to the relative abundance at Phylum level, the statistical diagram can be plotted using the top ten phyla in each sample as shown in Figure 3. Detailed taxonomic analysis of prokaryotes majorly revealed the presence of the dominant phyla were members of the classes Proteobacteria, Acidobacteria, Firmicutes, Actinobacteria, Bacteroidetes, Planctomycetes, Verrucomicrobia, Thaumarchaeota, Gemma-timonadetes and Chloroflexi in all samples, accounting for about 46% in average of all
microbial taxa excluding ‘others’. Among them,
the top three phyla in DBS1 and DBS2 samples were Proteobacteria, Acidobacteria and Firmicutes. On the other hand, in DBD1 and DBD2 samples, the top three phyla were Proteobacteria, Firmicutes and Actinobacteria. In this study, we found that the community structure and composition of microorganism in both DBS1 and DBS2 were positively dominate by 11 and 13 genera (top 20) of Proteobacteria respectively, however DBD1 and DBD2 were only dominate by 5 and 10 Proteobacteria, respectively. Proteobacteria is detected as the dominant phylum in the
Lad
der
D
BS1
D
BD
2
DB
S2
DB
D1

Malaysian Cocoa Journal 2019, Vol. 11
112
rhizosphere. It might be due to their rapid growth rates and many studies also suggested that this phylum have stronger tolerance to heavy metals (Gillan et al., 2005). Most bacteria in this phylum are Gram-negative and responsible for nitrogen fixation and polycyclic aromatic hydrocarbons (Yang et. al., 2017).
The analysis also revealed that the abundance of Acidobacteria, Bacteroideteds, Planctomycetes and Thaumarchaeota were increased, while, the Gemmatimonadetes abundance was decreased in both survival samples when compared to the dead samples. Meanwhile, Actinobacteria abundance shows no significant difference in all samples.
.
Figure 3. Relative abundance of bacterial community distribution in all drought samples. The top 10 of bacterial community by Phyla in each sample with majorly revealed the presence of Proteobacteria.
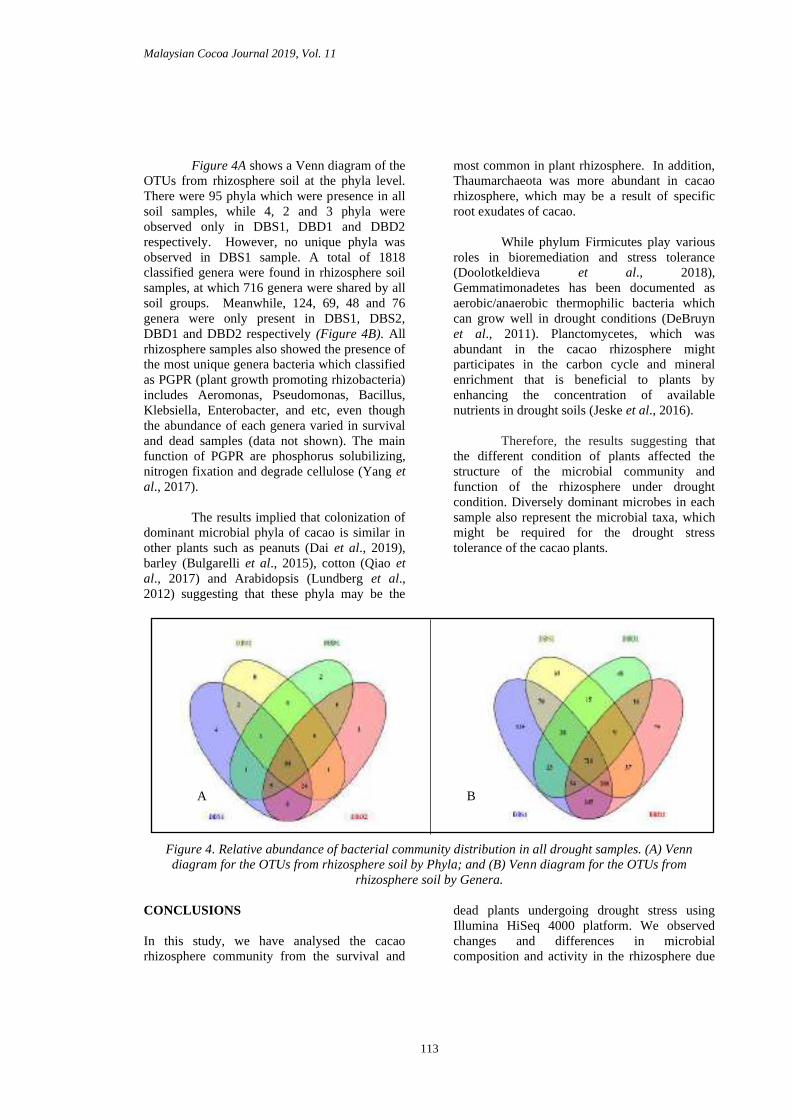
Malaysian Cocoa Journal 2019, Vol. 11
113
Figure 4A shows a Venn diagram of the
OTUs from rhizosphere soil at the phyla level. There were 95 phyla which were presence in all soil samples, while 4, 2 and 3 phyla were observed only in DBS1, DBD1 and DBD2 respectively. However, no unique phyla was observed in DBS1 sample. A total of 1818 classified genera were found in rhizosphere soil samples, at which 716 genera were shared by all soil groups. Meanwhile, 124, 69, 48 and 76 genera were only present in DBS1, DBS2, DBD1 and DBD2 respectively (Figure 4B). All rhizosphere samples also showed the presence of the most unique genera bacteria which classified as PGPR (plant growth promoting rhizobacteria) includes Aeromonas, Pseudomonas, Bacillus, Klebsiella, Enterobacter, and etc, even though the abundance of each genera varied in survival and dead samples (data not shown). The main function of PGPR are phosphorus solubilizing, nitrogen fixation and degrade cellulose (Yang et al., 2017). The results implied that colonization of dominant microbial phyla of cacao is similar in other plants such as peanuts (Dai et al., 2019), barley (Bulgarelli et al., 2015), cotton (Qiao et al., 2017) and Arabidopsis (Lundberg et al., 2012) suggesting that these phyla may be the
most common in plant rhizosphere. In addition, Thaumarchaeota was more abundant in cacao rhizosphere, which may be a result of specific root exudates of cacao. While phylum Firmicutes play various roles in bioremediation and stress tolerance (Doolotkeldieva et al., 2018), Gemmatimonadetes has been documented as aerobic/anaerobic thermophilic bacteria which can grow well in drought conditions (DeBruyn et al., 2011). Planctomycetes, which was abundant in the cacao rhizosphere might participates in the carbon cycle and mineral enrichment that is beneficial to plants by enhancing the concentration of available nutrients in drought soils (Jeske et al., 2016). Therefore, the results suggesting that the different condition of plants affected the structure of the microbial community and function of the rhizosphere under drought condition. Diversely dominant microbes in each sample also represent the microbial taxa, which might be required for the drought stress tolerance of the cacao plants.
Figure 4. Relative abundance of bacterial community distribution in all drought samples. (A) Venn diagram for the OTUs from rhizosphere soil by Phyla; and (B) Venn diagram for the OTUs from
rhizosphere soil by Genera. CONCLUSIONS
In this study, we have analysed the cacao rhizosphere community from the survival and
dead plants undergoing drought stress using Illumina HiSeq 4000 platform. We observed changes and differences in microbial composition and activity in the rhizosphere due
A B

Malaysian Cocoa Journal 2019, Vol. 11
114
to drought. Generally, the abundance and diversity of microbial community in survival and dead plant are almost similar. However, some plant growth-promoting rhizobacteria appeared to be more abundant in the survival plant when compared to the dead such as a bacteria belonging to Acidobacteria, indicating that these microbes might play an important role to help drought stress tolerant in cacao plants. The results provided an understanding of microbial community alterations in survival and dead cacao trees due to drought.
ACKNOWLEDGEMENT This research is supported by Developmental Fund (P20001001116013-Collection and Sequencing of Cocoa Genome) from Ministry of Finance under Eleventh Malaysia Plan. REFERENCES Bulgarelli, D., Garrido-Oter, R., Munch, P.C.,
Weiman, A., Droge, J., Pan, Y., McHardy, A.C. & Schulze-Lefert, P. (2015). Structure and function of the bacterial root microbiota in wild and domesticated barley. Cell Host Microbe, 17: 392–403.
Ciais, P., Reichstein, M., Viovy, N., Granier, A.,
Ogée, J., Allard, V., Aubinet, M., Buchmann, N., Bernhofer, C., Carrara, A., Chevallier, F., De Noblet, N., Friend, A.D., Friedlingstein, P., Grünwald, T., Heinesch, B., Keronen, P., Knohl, A., Krinner, G., Loustau, D., Manca, G., Matteucci, G., Miglietta, F., Ourcival, J.M., Papale, D., Pilegaard, K., Rambal, S., Seufert, G., Soussana, J.F., Sanz, M.J., Schulze, E.D., Vesala, T. & Valentini, R. (2005). Europe-wide reduction in primary productivity caused by the heat and drought in 2003. Nature, 437 (7058): 529–533.
DeBruyn, J.M., Nixon, L.T., Fawaz, M.N.,
Johnson, A.M. & Radosevich, M. (2011). Global biogeography and quantitative seasonal dynamics of Gemmatimonadetes in soil. Applied and
Environmental Microbiology, 77: 6295–6300.
Doolotkeldieva, T., Konurbaeva, M. &
Bobusheva, S. (2018). Microbial communities in pesticide-contaminated soils in Kyrgyzstan and bioremediation possibilities. Environmental Science and Pollution Research, 25: 31848 – 31862.
Dai, L., Zhang, G., Yu, Z., Ding, H., Xu, Y. &
Zhang, Z. (2019). Effect of drought stress and developmental stages on microbial community structure and diversity in peanut rhizosphere soil. International Journal of Molecular Sciences, 20(9): 2265.
Gillan, D.C., Danis, B., Pernet, P., Joly, G.,
Dubois, P. (2005). Structure of sediment associated microbial communities along a heavy-metal contamination gradient in the marine environment. Applied and Environmental Microbiology, 171: 679–690.
Hinsinger, P., Plassard, C. & Jaillard, B. (2005).
Rhizosphere: A new frontier for soil biogeochemistry. Journal of Geochemical Exploration, 88: 210-213.
Jeske, O., Surup, F., Ketteniss, M., Rast, P.,
Forster, B., Jogler, M., Wink, J. & Jogler, C. (2016). Developing techniques for the utilization of Planctomycetes as producers of bioactive molecules. Frontiers in Microbiology, 7: 1242.
Lundberg, D.S., Lebeis, S.L., Paredes, S.H.,
Yourstone, S., Gehring, J., Malfatti, S., Tremblay, J., Engelbrektson, A., Kunin, V. & Del Rio, T.G., Edgar, R.C., Eickhorst, T., Ley, R.E., Hugenholtz, P., Tringe, S.G. & Dangl J.L. (2012). Defining the core Arabidopsis thaliana root microbiome. Nature, 488: 86–90.
Ofori-Boateng, K. & Insah, B. (2014). The
impact of climate change on cocoa production in West Africa. International Journal of Climate

Malaysian Cocoa Journal 2019, Vol. 11
115
Change Strategies and Management, 6(3): 296-314.
Qiao, Q., Wang, F., Zhang, J., Chen, Y., Zhang,
C., Liu, G., Zhang, H., Ma, C. & Zhang, J. (2017). The variation in the rhizosphere microbiome of cotton with soil type, genotype and developmental stage. Scientific Reports, 7: 3940.
Rolli, E., Marasco, R., Vigani, G., Ettoumi, B.,
De Angelis, M., Casati, E., Previtali, F., Borin, S., Gandolfi, C., Zocchi, G., Gerbino, R., Cei, F.P., & Daffonchio, D. (2016). The plant growth promoting microbiome increases grapevine resistance to drought stress: A collaborative study between Fondazione Bussolera Branca, Le Fracce Farm and Milan Universities. Bulletin de I’OIV, 85: 974-975-976.
Shinozaki, K. & Yamaguchi-Shinazaki, K.
(2007). Gene tolerance in drought stress response and tolerance. Experimental Botany, 58(2): 221-227.
Turner, T.R., James, E.K. & Poole, P.S. (2013).
The Plant Microbiome. Genome Biology, 14: 209.
Yamaguchi-Shinazaki, K. & Shinozaki, K.
(2006). Transcriptional regulatory networks in cellular responses and tolerance to dehydration and colds stresses. Annual Review of Plant Biology, 57: 781-803.
Yang, Y., Wang, N., Guo, X., Zhang, Y., & Ye,
B. (2017). Comparative analysis of bacterial community structure in the rhizosphere of maize by high-throughput pyrosequencing. PloS ONE, 12(5): e0178425.
Zolla, G., Badri, D.V., Bakker, M.G., Manter,
D.K. & Vivanco, J.M. (2013). Soil microbiomes vary in their ability to confer drought tolerance to Arabidopsis. Applied Soil Ecology, 68: 1-9.

Malaysian Cocoa Journal 2019, Vol. 11
116
EVALUATION OF THE GENETIC DIVERSITY AND RELATIONSHIP OF CLASS II MALAYSIAN COMMERCIAL COCOA CLONES USING MICROSATELLITE MARKERS
Lea Johnsiul1 and Nuraziawati Mat Yazik2 1Centre for Cocoa Biotechnology Researches, Malaysian Cocoa Board, Locked Bag 211, 88999 Kota
Kinabalu, Sabah, Malaysia. 2Division of Downstream Technology, Cocoa Research & Development Centre Bagan Datuk, Malaysian
Cocoa Board, P.O. Box 30, Sg. Dulang Road, 36307 Sg. Sumun, Perak, Malaysia.
Malaysian Cocoa J. 11: 116-126 (2019)
ABSTRACT - The Malaysian Commercial Clones are cocoa clones that has been selected based on their good agronomic characteristics recommended for farmers’ planting. There are currently 53 cocoa clones in commercial cocoa clones list which are divided into 4 classes, Class I, Class II, Class III and Class IV according to their adaptability to a wide range of Malaysia agro-climatic condition, good agronomic traits, tolerant to major pests and diseases and high butter fat content and good flavour. This paper aims to evaluate the genetic diversity and relationship of the Class II Malaysian Commercial Cocoa Clones as these clones are part of the cocoa clones recommended for planting in the cocoa farms in Malaysia. Taking advantage of heterosis occurring in cross breeding two high genetic distance clones, this paper also aim to predict the genetic distance of the clones in order to get clones with the highest genetic distance values as promising parental clones, to increase the chances of positive heterosis to occur in the planting material produced in the cocoa breeding programme. The evaluation using microsatellite markers was done to access the genetic information in cocoa clones for germplasm conservation, in obtaining correct parental crosses in breeding program and plant materials generation for farmers’ fields’
distribution. The International Cocoa Molecular Markers Standard was used to generate microsatellite markers on three samples taken randomly to represent each of the clones. DNA extraction was done using Qiagen DNeasy Plant DNA kit.
Key words: Heterosis, microsatellite markers, Theobroma cacao L., Malaysian commercial cocoa clones. INTRODUCTION Increased in productivity, pest and diseases tolerant and high beans quality of cocoa has always been the main aims of cocoa by cocoa researchers. However, to achieve this aims, availability of good quality planting materials is needed. Breeding programme of cocoa trees can be challenging due to long living cycle, self-incompatibility and constrained by limited knowledge of the genetic inheritance and technical issues such as mislabelled trees. Mislabeling error is not unusual in cocoa collection. In fact, many cocoa collections around the world have reported from 5 to 30%, mislabelling errors (Dadzie et al., 2013; Cervantes-Martinez et al., 2006; Schnell et al., 2005) in one case it was reported to be up to 54.5% error (Padi et al., 2015). In cocoa, there are always possibilities of pedigree errors at almost all level of the breeding programme,
resulting in mislabelled individual trees. These include pollen contamination, accidental selfing, loss of plant label or label become illegible, label got mixed-up using transfer or moved before being properly labelled, label mixed-ups during propagation, detached labels attached to the wrong tree, label attached to broken /infected branches accidentally removed, chupon grew from rootstock confused with the scion, human error in labelling, seedlings confused with the original tree and imported synonymous germplasm from abroad (Turnbull et al., 2004). The distribution and use of these mislabelled individuals in breeding programmes would alter the expected genetic results from bi-clonal crosses and would affect the subsequent generations when mislabelled germplasm is used in the recurrent selection programmes (Adomako, 2006; Dadzie et al., 2013). In breeding programmes, mislabelled parent

Malaysian Cocoa Journal 2019, Vol. 11
117
materials could contribute to failures in achieving the predicted phenotypes. Molecular fingerprinting technique can be useful in identifying mislabelled individuals for correction of labelling errors in germplasm collections (Livingstone et al., 2012; Olasupo et al., 2017). Even though it has been recommended that all parental stocks should be genotyped before used in a breeding programmes, not many breeding programme has followed the recommendation. However, the negative impact of the mislabelling has on the previous breeding programmes has never been accessed (Takrama et al., 2005). MATERIALS AND METHODS Plant materials Leaf samples were collected from Bagan Datuk Cocoa Germplasm Collection (denoted as HP) in Bagan Datuk, Perak and KKIP Cocoa Germplasm Collection (denoted as K) in Kota Kinabalu, Sabah. A total of 78 plant samples (3 samples of each clone from two locations), consisting of thirteen Class II Cocoa Commercial Clones were used to access genetic variability in this study (Table I). DNA isolation, SSR markers and polymerase chain reaction (PCR) amplification Genomic DNA was extracted from 100mg of leaf sample using DNeasy Plant Mini Kit (Qiagen, Hilden, DE) according to manufacturer’s instruction. The study used 11
SSR loci (Table 2) identified as the International Standard set for cocoa germplasm characterization as reported by Saunders et al. (2004). Primers were synthesized by First Base (Malaysia) and forward primers were 5’ labelled
using HEX or 6-FAM dyes. PCR (polymerase chain reaction) mixtures consisted of 1µl containing 10-200ng of genomic DNA template, 1.6µl of a stock solution containing both forward and reverse primers (10µM each), 2µl of 2.5mM dNTP mix, 1x PCR buffer, 1.6µL of 2.5mM MgCl2, 0.5µL of 0.5unit/µl Taq DNA Polymerase and sterile distilled water for a total volume of 20µL. PCR amplification were carried out in a GeneAmp PCR System 9700 (PE Applied
Biosystems) and MyIQ Single Color Real-Time PCR Detection System iCycler (BioRad) with following profile: 94oC for 4 minutes, followed by 35 cycles of 94oC 30 seconds, 46oC to 60oC (depending upon the annealing temperature of the primer pair) for 1 minute; followed by a hold at 72oC for 5 minutes. The amplified microsatellite loci were separated by capillary electrophoresis and analysed on an ABI Prism 3730 Genetic Analyzer (fragment analysis service outsourced to First Base Sdn Bhd, Malaysia). A dataset of multi-locus genotype was generated as a result. Data analysis Duplicates were identified by using pair-wise comparisons among all the 78 individuals (13 clones x 3 replicates x 2 location) based on their multilocus SSR profile. The program GenAlEX 6.5 (Peakall and Smouse, 2006) was used for genotype matching. After exclusion of duplicates, summary descriptive statistics were computed for the collection. The descriptive statistics were computed using POPGENE version 1.32 (Yeh et al., 1999). Polymorphic information content (PIC) was calculated using the formula PIC = 1 -∑ pi
2 where pi is the frequency of the allele. The genetic distance was calculated using POPGENE software and the matrices were used to build dendrogram using software NTSYS pc version 2.2 (Exeter Software, Setauket, NT) using the unweighted pair group method with the arithmetic mean (UPGMA) mathematical averaging function. The genetic structure of the MCB Class II collection was examined using a Bayesian cluster analysis (Pritchard et al., 2000). The program STRUCTURE v2.4 (Pritchard et al., 2000) was used for computation. An admixture model with 200,000 iterations after a burn-in period of 100,000 was used. Ten independent runs were computed to detect the most probable number of clusters. The run with the highest Ln Pr (X|K) value of the 10 was chosen and presented as bar plots per genotype.

Malaysian Cocoa Journal 2019, Vol. 11
118
Table 1. Malaysian Cocoa Board Class II Cocoa Clones Technical Information (Malaysian Cocoa Board, 2012).
Clone Name Potential Yield Pod and bean characteristics Pod yield per tree
Dry bean yield per hectare (kg/ha/yr)
Bean number per pod
Average dry bean weight (g)
BR 25 67 2,690 40 1.0 KKM 1 68 3,930 51 1.05 KKM 4 51 2,040 38 1.06 KKM 5 44 2,020 42 1.07 KKM 19 49 2,700 47 1.18 KKM 25 72 2,440 24 1.30 MCB C9 91 3,760 33 1.29 PBC 112 38 1,530 38 1.01 PBC 137 49 2,250 39 1.18 PBC 139 43 2,250 44 1.18 PBC 221 42 2,500 41 1.47 QH 22 75 3,510 42 1.15 RP 1 48 2,000 35 1.27
Table 2. Description for the 11 SSR loci genotyped in the cocoa germplasm collection.
Locus Name Linkage group Tm (oC) Estimated size range (bp) mTcCIR1 8 56 120-140 mTcCIR6 6 52 220-260 mTcCIR8 9 52 300-320
mTcCIR12 4 56 170-260 mTcCIR15 1 56 230-270 mTcCIR22 1 50 280-300 mTcCIR24 9 60 180-210 mTcCIR26 8 46 280-310 mTcCIR33 4 52 270-350 mTcCIR37 10 50 140-190 mTcCIR60 2 52 190-220
RESULTS AND DISCUSSION Variability of alleles generated from microsatellite markers genotyping Fingerprint profiles for all 78 trees were generated with all 11 microsatellite markers. Reproducibility of the identical amplification profiles were evident when all trees of a given clones were compared. Clones with matching profiles at all 11 microsatellite markers were considered as identical and only one profile was used in the further analyses. The amplification process of 78 DNA samples from thirteen clones (3 samples of each clones from both locations) using 11 microsatellite markers was completed done using PCR method. All amplified markers were scored and used for further analysis.
Allelic variation of the polymorphic microsatellite markers was determined using POPGENE (Yeh et al., 1999) analysis. The result showed that polymorphic microsatellite markers used possessed diverse alleles. The eleven loci generated 990 alleles with average of 90 per locus and observed alleles of 69 with average of 6.67 alleles per locus. All the primers resulted in high allele numbers (Table 3) which was an advantage because high level of genetic variability is important in accessing the collection genetic diversity. Small numbers of alleles would be a bottleneck for accessing genetic diversity in a population and lower their ability to discriminate between cocoa clones (Saunders et al. (2004). High level of heterozygosity also indicates that there are considerable levels of admixture present in the studied collection.

Malaysian Cocoa Journal 2019, Vol. 11
119
Table 3. Allele variations of 11 polymorphic SSR markers used to evaluate the variability of thirteen cocoa clones
Locus Allele Number Exp_Het* Nei** Ave_Het PIC
mTcCIR1 94 0.518 0.5124 0.1277 0.7537 mTcCIR6 92 0.6495 0.6425 0.3617 0.9642 mTcCIR8 82 0.455 0.4494 0.1383 0.6664
mTcCIR12 90 0.7446 0.7363 0.4149 0.9961 mTcCIR15 94 0.8197 0.811 0.5 0.9998 mTcCIR22 88 0.5927 0.586 0.3404 0.9389 mTcCIR24 92 0.2941 0.2909 0.1702 0.8519 mTcCIR26 92 0.7664 0.758 0.3723 0.9980 mTcCIR33 90 0.8345 0.8252 0.3085 1.000 mTcCIR37 88 0.8819 0.8719 0.4255 1.000 mTcCIR60 88 0.7821 0.7732 0.4255 0.9993
Mean 90 0.6671 0.6597 0.3259 0.9243
* Expected heterozygosity were computed using Levene (1949) ** Nei's (1973) expected heterozygosity The PIC value is between 0.6664 to 1.000 throughout the primers that indicates the loci were informative loci, in accordance with Borstein et al. (1980) who stated that locus with PIC value > 0.5 can be considered informative. The high variation in the PIC values also indicated the high diversity of the Class II Malaysian Commercial Cocoa clones and can be utilized as genetic materials in cocoa breeding programmes. Genetic uniformity and relationship of thirteen Class II Malaysian commercial cocoa clones The genetic variability and relationship of thirteen Class II Malaysian Commercial Cocoa Clones were analyzed using genetic similarity values using NTSYS programme after removing the duplicates and matching fingerprint profiles. A dendrogram of 47 trees clones were successfully developed which formed 3 groups at coefficient 0.96. Group 1 held four clones comprises of BR 25, PBC 221, KKM 5 and KKM 4, Group 2 held MCB C9, PBC 112, RP 1, QH 22, KKM 1, PBC 137, KKM 19, PBC 221(1)HP, PBC 139(7)K and KKM 25 and Group 3 held two clones PBC 139 and PBC 137(5)K. Interestingly, PBC 221(1)K, PBC 139 (7)K and PBC 137(5)K were located at different group from the rest of the samples of the same clones’ name. Thus, these three individuals were
suspected to be off-types.
Based on the dendrogram in Figure 1, it indicates that there were mislabeled trees in the collection. In the clone PBC 221 collection, sample PBC 221(1)K was far separated group from the rest of PBC 211 individuals. This indicates that they were not uniform genetically even though they were labeled the same clone name. Similar occurrence can be seen at clone PBC 137 collection, PBC 137(5)K is separated in a different group from the rest of the PBC 137 individuals. The same issue was also observed in PBC 139 clone collection, where PBC 139 (7)K was located as different group from the rest of the PBC 139. This indicates that they were not uniform genetically even though they were labeled the same clone name.
There are many reasons for non-uniformity in the cocoa germplasm collection. As mentioned earlier, according to Turnbull et al. (2004), there are several ways in which mislabeling can occur. Examples are (i) plant lose their labels or the label become illegible, (ii) plant moved before properly labeled, (iii) mixed up of labels during vegetative propagation (iv) chupons grew from the rootstock confused as the scion, (v) plant mislabeled in the greenhouse (human error) or confused with the original tree and (vi) introduction of synonymous germplasm (with different name) from abroad.

Malaysian Cocoa Journal 2019, Vol. 11
120
Group 1
Group 2
Group 3
Figure 1. The grouping of MCB Class II Clones based on 11 polymorphic SSR markers

Malaysian Cocoa Journal 2019, Vol. 11
121
Table 4. Some of the Genetic Distance values calculated from MCB Class II clones based on SSR Markers. The highest genetic distances were shown in bold.
BR25(7)K BR25(8)K BR25HP1 BR25HP2 KKM5(7)HP KKM5(11)K MCBC9(4)HP MCBC9(5)HP MCBC9(5)K MCBC9(8)K PBC139(18)HP PBC139(19)HP PBC139(20)HP PBC139(7)K RP1HP1 KKM1(6)K KKM1(7)K KKM1(1)HP KKM1(8)HP KKM1HP1 KKM19(5)K BR25(7)K 0.0000 BR25(8)K 0.0371 0.0000 BR25HP1 0.1682 0.1312 0.0000 BR25HP2 0.0763 0.0392 0.1825 0.0000 KKM5(7)HP 0.3365 0.3507 0.2736 0.4048 0.0000 KKM5(11)K 0.3365 0.3507 0.2736 0.4048 0 0.0000 MCBC9(4)HP 0.6791 0.642 0.5108 0.642 0.5249 0.5249 0.0000 MCBC9(5)HP 0.8572 0.8202 0.689 0.8202 0.6902 0.6902 0.1965 0.0000 MCBC9(5)K 0.7302 0.6931 0.562 0.6931 0.3507 0.3507 0.1312 0.3277 0.0000 MCBC9(8)K 0.7302 0.6931 0.562 0.6931 0.3507 0.3507 0.1312 0.3277 0.0392 0.0000 PBC139(18)HP 1.9538 1.9167 1.7855 1.9167 1.6661 1.6661 1.4979 1.589 1.629 1.629 0.0000 PBC139(19)HP 0.8102 0.7732 0.8243 0.7732 0.6561 0.6561 0.9297 1.0209 0.8602 0.6931 0.3763 0.0000 PBC139(20)HP 0.9667 0.9297 1.0498 0.9297 0.7661 0.7661 0.9163 0.8897 0.8243 0.729 0.5816 0.1825 0.0000 PBC139(7)K 1.5749 1.5379 1.4067 1.5379 0.8018 0.8018 0.4259 0.6506 0.3339 0.3339 1.2951 0.8447 0.8959 0.0000 RP1HP1 1.7895 1.7525 1.6213 1.7525 0.9141 0.9141 0.6658 0.7569 0.4715 0.4715 1.3274 0.7229 0.7458 0.298 0.0000 KKM1(6)K 0.9141 1.0593 1.1513 1.0593 0.7599 0.7599 0.9281 1.0193 0.5893 0.6539 1.3274 0.797 0.7458 0.489 0.47 0.0000 KKM1(7)K 0.9688 1.0271 1.0012 1.0271 0.6587 0.6587 0.7136 0.8917 0.4393 0.4964 1.2951 0.7647 0.6335 0.4568 0.5431 0.1013 0.0000 KKM1(1)HP 0.834 0.964 1.0335 0.964 0.6264 0.6264 0.8328 0.924 0.5287 0.5893 1.3274 0.797 0.7458 0.489 0.5754 0.0645 0.0323 0.0000 KKM1(8)HP 1.3863 1.3492 1.2181 1.3492 0.8473 0.8473 0.8614 0.9525 0.5226 0.5871 1.443 0.8973 0.9667 0.4763 0.5086 0.3544 0.2312 0.2635 0.0000 KKM1HP1 0.9688 1.0271 1.0012 1.0271 0.6587 0.6587 0.7136 0.8917 0.4393 0.4964 1.2951 0.7647 0.6335 0.4568 0.5431 0.1013 0 0.0323 0.2312 0.0000 KKM19(5)K 0.8973 0.9555 1.181 0.9555 0.8102 0.8102 1.0475 1.1386 0.8602 0.9555 1.629 0.9555 0.8243 1.0271 0.5893 0.7229 0.9318 0.877 1.0979 0.9318 0.0000 KKM19(6)K 0.6902 0.7332 1.141 0.7332 0.9525 0.9525 1.0075 1.0986 1.0209 1.1386 2.2822 1.1386 1.0075 1.3437 1.0193 1.0193 1.0924 1.0193 1.3092 1.0924 0.127 KKM19(8)HP 1.0845 1.0475 1.204 1.0475 0.8614 0.8614 0.9163 1.0075 0.729 0.729 1.0924 0.8243 0.7985 0.6335 0.4581 0.7458 0.7136 0.7458 0.6791 0.7136 0.562 PBC112(1)K 1.0979 1.0609 1.181 1.0609 0.9926 0.9926 0.562 0.7332 0.4855 0.4855 1.9167 0.9555 0.729 0.5571 0.4715 0.6539 0.6216 0.7229 0.8102 0.6216 0.4855 PBC112(5)K 1.135 1.0979 1.2181 1.0979 1.0296 1.0296 0.6791 0.7702 0.5871 0.5871 1.9538 0.9926 0.8614 0.5941 0.4545 0.6909 0.7276 0.7599 0.8473 0.7276 0.4619 PBC112(10)K 1.9459 1.9089 1.7777 1.9089 1.0296 1.0296 0.8614 0.8572 0.5226 0.5871 1.1065 0.9926 0.9667 0.5941 0.5086 0.6909 0.7276 0.7599 0.6931 0.7276 0.7302 PBC112(6)HP 1.135 1.0979 1.2181 1.0979 1.0296 1.0296 0.6791 0.7702 0.5871 0.5871 1.9538 0.9926 0.8614 0.5941 0.4032 0.6909 0.7276 0.7599 0.8473 0.7276 0.5226 PBC112(10)HP 1.0979 1.0609 1.181 1.0609 0.9926 0.9926 0.562 0.7332 0.4855 0.4855 1.9167 0.9555 0.729 0.5571 0.4175 0.6539 0.6216 0.7229 0.8102 0.6216 0.55 PBC112(11)HP 1.0979 1.0609 1.181 1.0609 0.9926 0.9926 0.642 0.7332 0.55 0.55 1.9167 0.9555 0.8243 0.5571 0.4175 0.6539 0.6906 0.7229 0.8102 0.6906 0.55 PBC221(3)K 0.5726 0.5355 0.4043 0.5355 0.5036 0.5036 0.6455 0.7367 0.6897 0.6897 1.5455 0.7767 0.8462 1.1667 1.4866 1.3325 0.9435 1.0812 1.1322 0.9435 1.2287

Malaysian Cocoa Journal 2019, Vol. 11
122
PBC221(6)K 0.4219 0.3849 0.3788 0.3849 0.3648 0.3648 0.602 0.6931 0.51 0.51 1.589 0.6531 0.689 1.0924 1.2425 1.1247 0.8047 0.924 0.9525 0.8047 1.0209 PBC221(1)HP 1.9459 1.9089 1.7777 1.9089 0.7673 0.7673 0.5249 0.6902 0.2994 0.3507 1.1065 0.8973 0.7661 0.371 0.4545 0.6909 0.4763 0.5658 0.5596 0.4763 0.8102 PBC221(2)HP 0.4825 0.4455 0.4478 0.4455 0.4219 0.4219 0.602 0.6931 0.51 0.51 0.8959 0.4455 0.5219 0.987 1.0193 0.924 0.6506 0.7569 0.7702 0.6506 1.1386 KKM4(5)K 0.5596 0.5871 0.5249 0.6561 0.1967 0.1967 0.599 0.7702 0.3507 0.4048 1.2606 0.7302 0.7661 0.5941 0.7599 0.5658 0.5335 0.5086 0.6931 0.5335 0.8102 KKM4(7)K 0.6587 0.6906 0.6335 0.7647 0.2757 0.2757 0.8006 0.987 0.4964 0.5571 1.141 0.6906 0.7136 0.568 0.5431 0.489 0.6286 0.6003 0.8018 0.6286 0.5571 KKM4(11)HP 0.5596 0.5871 0.5249 0.6561 0.1967 0.1967 0.599 0.7702 0.3507 0.4048 1.2606 0.7302 0.7661 0.5941 0.7599 0.5658 0.5335 0.5086 0.6931 0.5335 0.8102 KKM25(11)K 0.6246 0.5876 0.7247 0.6482 0.8188 0.8188 0.517 0.7417 0.5304 0.5304 1.7918 1.0229 0.8917 0.602 0.8856 0.8166 0.7198 0.8166 0.8929 0.7198 0.8559 KKM25(3)HP 0.8929 0.8559 1.0924 0.9359 1.1553 1.1553 0.7247 0.8959 0.7128 0.7128 2.4849 1.2236 1.2102 0.602 0.8856 0.8166 0.7843 0.8166 0.7498 0.7843 1.0229 KKM25(6)HP 0.6517 0.6146 0.7517 0.6753 0.9199 0.9199 0.6776 0.7688 0.6753 0.6753 1.8188 1.0499 1.0141 0.7468 0.9867 0.8436 0.8113 0.8436 0.6517 0.8113 0.8829 PBC137(1)K 1.3784 1.3414 1.2102 1.3414 0.6853 0.6853 0.6506 0.7417 0.4764 0.4764 1.2321 0.8559 0.5816 0.5479 0.6914 0.4801 0.2735 0.3891 0.5134 0.2735 1.0229 PBC137(2)K 1.6931 1.6561 1.5249 1.6561 0.8458 0.8458 0.6776 0.7688 0.5034 0.5034 1.2592 0.8829 0.6776 0.4749 0.6072 0.4162 0.2236 0.3328 0.4404 0.2236 1.1453 PBC137(5)K 0.7702 0.7332 0.7843 0.8202 0.7702 0.7702 0.602 0.7802 0.51 0.4455 1.0294 0.4455 0.4478 0.517 0.6828 0.5493 0.3993 0.4887 0.5471 0.3993 0.9155 PBC137(2)HP 1.2606 1.2236 1.0924 1.2236 0.6246 0.6246 0.7247 0.8158 0.5304 0.5304 0.8755 0.7818 0.7247 0.8533 0.9597 0.752 0.4966 0.6343 0.7498 0.4966 1.0229 PBC137(12)HP 1.6661 1.629 1.4979 1.629 0.8188 0.8188 0.8047 0.8959 0.5876 0.5876 1.3863 0.9359 0.7247 0.7198 0.8166 0.6343 0.4013 0.5289 0.6246 0.4013 1.1182 QH22(11)K 1.5404 1.5034 1.3722 1.5034 0.8473 0.8473 0.599 0.7702 0.3507 0.4048 1.2606 0.8973 0.6791 0.4223 0.3544 0.5086 0.4763 0.5658 0.5596 0.4763 0.5871 QH22(1)HP 1.4634 1.4263 1.2951 1.4263 1.1757 1.1757 0.5219 0.6931 0.51 0.579 1.3659 1.1386 0.8897 0.3993 0.4887 0.6828 0.6506 0.7569 0.7702 0.6506 0.6531 QH22(3)HP 1.5749 1.5379 1.4067 1.5379 0.8018 0.8018 0.6335 0.8047 0.3852 0.4393 1.4775 1.0271 0.8959 0.3102 0.3424 0.5431 0.568 0.6003 0.5941 0.568 0.6216

Malaysian Cocoa Journal 2019, Vol. 11
123
Figure 2. Population structure of the Class II samples studied showing representative genotypes of the genetic groups described by Motamayor et al., (2008) produced using Structure version 2.3.4. Each vertical line represents one individual genotype. Individuals with multiple colours have admixed genotypes from multiple clusters.

Malaysian Cocoa Journal 2019, Vol. 11
124
In addition to grouping of cocoa clones, microsatellites markers may also help breeders in selecting promising parental clones candidates for new varieties. Cross breeding two parental clones is predicted to produce progenies with combination of both parents’ traits. According to
Dias and Kageyama (1997), cocoa exhibits strong heterosis for yield and yield-contributing traits and the success of heterosis in cross breeding is determined by the genetic distance between the parental clones. The further the genetic distance between two parents, the higher probability of heterosis to occur. The clones located in different groups can assumed to have high genetic distance values, thus can be selected as parental clones or candidate clones in breeding programme of the release of new superior varieties. The promising parents can also be predicted based on the yield data on Table 1 and the genetic distance values as shown in Table 4. Based on Table 4, two promising parental clones combinations can be deduced, KKM25(3)HP with PBC139(18)HP and KKM19(5)K with PBC139(18)HP with the highest genetic distances of 2.4849 and 2.2822 respectively. However, since Dias and Kageyama (1997) reported that cocoa exhibit strong heterosis for yield, thus parental clones could also be referred based on combination of Table 1 and Table 4. Although Table 1 showed that KKM25, KKM19 and PBC139 are not the highest dry beans yielder clones, it also showed that they have high yield contributing traits. Based on Table 1, KKM25 produced high average dry bean weight of 1.30g (second highest in Class II clones) and KKM19 has the highest butter fat content of 58%. Thus crossing KKM25(3)HP and KKM19(5)K with PBC139(18)HP would be predicted to produce higher probability of positive heterosis on yield contributing traits. The result of Bayesian clustering evaluation of the Class II clones for their relationship to the 10 representative cocoa genetic groups as defined by Motamayor et al., (2008) showing that all the Class II clones had predominantly Amelonado lineage (Figure 2). Among these Amelonados, four clones had 5-30% of Criollo admixture and four had up to 30% Contamana (RP1 clone) admixed. Clones KKM1 and PBC137 mostly had a small lineage of Guiana. Only one individual was found to
have four admixture of Amelonado, Nanay, Contamana and Guiana. None of the individuals studied was found to have lineage to Purus, Nacional, Maranon, Curaray and Iquitos. CONCLUSIONS The study using 11 microsatellite markers had successfully generated a dendrogram based on thirteen Class II Malaysian Commercial Cocoa Clones. The markers used in this study proven capable to analyse the uniformity of the Class II Malaysian Commercial Cocoa Clones with high polymorphism level. The clones can be grouped into three whereby Group 1 held four clones comprises of KKM4 clone, KKM5, PBC221 and BR25, Group 2 held MCBC9, PBC112, RP1, QH22, KKM1, PBC137, KKM19 and KKM25 with two suspected mislabeled individuals PBC221(1)HP and PBC139(7)K and Group 3 held one clone PBC139 and a suspected mislabeled individual PBC137(5)K. Additionally, based on the dendrogram and genetic distance values, we could also predict that the clones in the same group might share the same common ancestors.
Based on this finding, it is suggested that there is a need for a coordinated policy on identifying mislabeled or/and duplicate in the cocoa germplasm collection in all locations in Malaysia. Identified mislabeled plants should be assigned a new name unique to the clone which have meaning and could assist in documenting the origin of off-types. It is also possible that this new unique name might just be temporary once the correct clone name is identified.
Based on the genetic distance values, the findings obtained from this study may also provide valuable information for future cocoa breeding programme. Clones in different groups or with high genetic distances can be chosen as parental materials for cross breeding works to produce superior planting materials based on heterosis occurrence.
The degree of genetic diversity and the admixture level observed as a result of showed the Class II commercial clones were predominantly of Amelonado lineage. Even though the number of individuals used in this study was small, the results confirmed that there

Malaysian Cocoa Journal 2019, Vol. 11
125
were mislabelling errors affecting propagation of clones. Nevertheless, the studied individuals only covered the Class II Malaysian commercial clones and do not represent the whole cocoa germplasm collection as a whole.
The information and the knowledge of the genetic diversity, population structure, degree of admixture in cocoa collection will greatly help and enhance the ability to select for potential parents in breeding for superior planting materials. One limitation of this study is samples were obtained from just a few samples from each cocoa germplasm from each location. It is thus suggested that the study should be extended to all the other cocoa germplasm collections that housed the Class II Malaysian Commercial Cocoa Clones. Furthermore, to ensure all the non-uniform trees are accurately identified, all the trees with the Class II clones’ labeled should be analyzed for
their genetic uniformity using the microsatellite markers in order for mislabeled trees to be identified and marked properly for future reference and efficient management of germplasm collection.
The study also suggested that the use of microsatellite markers could be a powerful tool to tap the genetic variability and relationships, to select new planting materials and to predict promising combination of parental clone candidates for breeding programmes. and it is recommended that the same study should be done with the other classes of Malaysian Commercial Clones. ACKNOWLEDGEMENT
The project was supported by Malaysian Cocoa Board Development Fund. The authors would like to thank the Director General of the Malaysian Cocoa Board for permission to publish these results. We also thank Mr Haya Ramba, Ms. Sairan Asim, Ms. Rafiah Abdul Karim, Ms. Sarina Abu Samah and Hj Zailaini Md. Jamil, for their excellent experience in cocoa breeding, cocoa germplasm, technical and samples collection assistance.
REFERENCES Borstein, D., White, R. L., Skolnick, M., and
Davis, R. W. (1980). Construction of A Genetic Linkage Map in Man Using Restriction Fragment Length Polymorphisms. American Journal of Human Genetics, 32: 314 – 331.
Boza, E., Irish, B. M., Meerow, A. W., Tondo,
C. L., Rodriquez, O. A., Ventura-Lopez, M., Gomez, J. A., Moore, J. M., Zhang, D., Motamayor, J. C., and Schnell, R. (2013). Genetic Diversity, Conservation and Utilization Of Theobroma Cacao L.: Genetic Resources In The Dominican Republic. Genetic Resources Crop Evolution, 60: 605 - 619.
Dias, L. A. and Kageyama, P. Y. (1997).
Temporal Stability of Multivariate Genetic Divergence in Cacao (Theobroma Cacao L.) In Southern Bahia Conditions. Euphytica, 93: 181 – 187.
Duval, A., Gezan, S. A., Mustiga, G., Stack, C.,
Marelli, J-P., Chaparro, J., Livingstone, D. III., Royaert, S. and Motamayor, J. C. (2017). Genetic Parameters and The Impact of Off-Types of Theobroma Cacao L. In A Breeding Program in Brazil. Front. Plant Sci., 8: 2059.
ICCO (2019). International Cocoa Organization.
ICCO Quarterly Bulletin of Cocoa Statistics, Vol. XLV, No.1, Cocoa Year 2018/19.
Irish, B. M., Goenaga, R., Zhang, D., Schnell, R.
J., and Brown, J. S. (2010). Microsatellite Fingerprint of the USDA-ARS Tropical Agricultural Research Station Cacao (Theobroma Cacao L.) Germplasm Collection. Crop Science, 50: 656 – 668.
Malaysian Cocoa Board (2012). Malaysia Cocoa Clones. Malaysian Cocoa Board. Malaysian Cocoa Board (2019) Statistics Cocoa
Cultivated Area by Region and Sector

Malaysian Cocoa Journal 2019, Vol. 11
126
(Ha). https://www.koko.gov.my/lkm/industry/statistic/cocoacultivated.cfm
Motilal, L., And Butler, D. (2003). Verification
of Identities in Global Cacao Germplasm Collections. Genet. Resour. Crop Evol., 50:799-807.
Motilal, L. A., Zhang, D., Umaharan, P.,
Boccara, M., Mischke, S., Sankar, A., and Meinhardt, L. W. (2012). Elucidation of Genetic Identity and Population Structure of Cacao Germplasm Within an International Cacao Genebank. Plant Genet. Resour., 10: 232-241.
Parida, S. K., Yadava, D. K., and Mohapatra, T.
(2010). Microsatellites in Brassica Unigenes: Relative Abundance, Marker Design, And Use in Comparative Physical Mapping and Genome Analysis. Genome, 53: 55- 67.
Peakall, R. and Smouse, P. E. (2006) GENAlEX
6: Genetic Analysis in Excel: Population Genetic Software for Teaching and Research. Mol. Ecol. Notes, 6: 288 – 295.
Saunders, J., Mischke, S., Leamy, E., and
Hemeida, A. (2004). Selection of International Molecular Standards for DNA Fingerprinting of Theobroma
cacao L. Theor. Appl. Genet., 100: 41 – 47.
Turnbull, C. J, Butler, D. R., Cryer, N. C.,
Zhang, D., Lanaud, C., Daymond, A. J., Ford, C.S., Wilkinson, M. J. and Hardly, P. (2004). Tackling Mislabelling in Cocoa Germplasm Collection. INGENIC Newsletter, 9: 8-11.
Wickramasuriya, A. M., and Dunwell, J. M.
(2018). Cacao Biotechnology: Current Status and Future Prospects. Plant Biotechnology Journal, 16: 4-17.
Yeh, F. C., Yang, R. C. and Boyle, T. (1999).
POPGENE Version 1.32: Microsoft Window-Based Freeware for Population Genetics Analysis. University of Alberta, Edmonton.
Young A, and Severson, D. (1994). Comparative
Analysis of Steam Distilled Floral Oils of Cacao Cultibars (Theobroma Cacao L.) And Attraction of Flying Inserts: Implication for A Theobroma Pollination Syndrome. J. Chemical Ecol., 20: 2687-2703.
Zhang, D., Mischke, S., Johnson, E. S., Philips-
Mora, W., and Meinhardt, L. (2009). Molecular Characterization of An International Cacao Collection Using Microsatellite Markers. Tree Genet Genomes, 5: 1–10.
Malaysian Cocoa Journal 2019, Vol. 11
127
FORMULATION AND EVALUATION OF COCOA ANTIBACTERIAL NIGHT CREAM FROM COCOA SHELL EXTRACT OF Theobroma cacao FOR SKINCARE
Zainal Baharum1, Nurul Amirrah Rahimudin2, Rasma Suzielawanis Ismail1, Azila Abdul Karim3,
Nur Azilah Abdullah3 1Division of Biotechnology, Cocoa Innovation &Technology Centre, Malaysian Cocoa Board, Lot Pt
12621, Nilai Industrial Park, 71800 Nilai, Negeri Sembilan, Malaysia; 2Faculty of Chemical Engineering, Universiti Teknologi MARA, Cawangan Shah Alam, 40450 Shah
Alam, Selangor; 3Division of Downstream, Cocoa Innovation &Technology Centre, Malaysian Cocoa Board, Lot Pt 12621,
NilaiIndustrial Park, 71800 Nilai, Negeri Sembilan, Malaysia. Corresponding author email: [email protected]
Malaysian Cocoa J. 11: 127-135 (2019)
ABSTRACT – The cocoa shell of Theobroma cacao is a valuable by-product obtained from the chocolate industry and rich source of dietary fiber, lipids and protein, as well as valuable bioactive compounds (theobromine, polyphenolic, methylxanthine, caffeine, flavonoids, etc). Pharmacological compounds related to antibacterial activity were determined using GC-MS. About seven major active phytoconstituents with potential antibacterial in unfermented cocoa shells (UCS) extract were discovered. The aim of this study was to evaluate the antibacterial activity of aqueous extract of (UCS) extract on Staphylococcus aureus and Propionibacterium acnesspecies and to formulate the cocoa antibacterial night cream. The bactericidal method was used to assess antibacterial activity of UCS extract. To prepare the cream, a different amount of ingredients were incorporated together, then the required amount of the UCS extract was added. The cream formulations were compared according to their physical and chemical stability. Finally, the best formulation was selected by altering the type and quantity of formulation factors. Results showed that cocoa antibacterial night cream was effective on P. acnes with 99.9 % inhibition. The formulations showed good spreadability, no evidence of phase separation and good consistency during this study period. It was found that the cream behaved as non-Newtonion liquid, where the viscosity of the cream increases when the rate of shear decreased, and vice versa. There is no sign of microbial growth after an incubation period of 72 hours at 30C and it was comparable with the control. The results of different chemical and physical tests of cream showed that the formulation could be used topically to protect face skin against damage caused by this P. acnes. From this investigation suggest that unfermented cocoa shell is a suitable candidate for further pharmacological evaluation. Key words: Skincare, cocoa shell, antibacterial, night cream, formulation, Theobroma cacao INTRODUCTION One of the main functions of the skin is as a barrier maintenance between a body and the external environment. To assess the individual skin type, different parameters such as trans-epidermal water loss, sebum production, elasticity and pH can be used. It is difficult to categorize the normal skin type skin its characteristics vary according to ambient temperature, humidity, mechanical or chemical stressors and age has always been exposed to environmental factors such as pollutants and UV radiation (Piccioni et al., 2017). Thus, large amounts of active oxidants are produced which could lead to severe damage to all of the biological skin cell membranes. The use of
skincare products and cosmetics has been utilized to reduce the photo-aging process and commonly composed of the plant extracts (Fonseca-Santos et al., 2017). Consequently, skin infections generally can be caused by different types of bacteria. Topical antibacterial drugs created by pharmacists could inhibit the growth of microorganism and used in superficial infection treatment. Gels, creams, ointments, sprays and liquids are some of the forms of topical antibacterial drugs (Amirthalingam, Yi, Ching & Mun, 2015). Nowadays, a lots of skincare product has been offered by the cosmetic and pharmaceutical industry to keep our skin in good condition. The skincare products are readily available with procedures to clean, soothe, restore, reinforce, protect and treat

Malaysian Cocoa Journal 2019, Vol. 11
128
our skin effectively (Surber & Kottner, 2017; Sekar et al., 2017). Natural ingredients have been traditionally used for centuries for skincare purposes especially formulated in creams. Sources of natural ingredients include herbs, fruits, flowers, leaves, minerals, water and land. In skincare products, the effect of natural ingredients depends on the type of dermatological base and in vitro and in vivo efficacy (Ribeiro et al., 2015). Theobroma cacao L, popularly known as Cocoa, is an evergreen tree belonging to the family Malvaceae which is a neotropical species native to the humid tropical plains of Central and South America. The sequence of the cacao genome identified 28,798 protein-coding genes, about 20% of which consist of transposable elements and identified as coding for flavonoids, aromatic terpenoids, theobromine and many other metabolites as the source of natural active ingredients. Cocoa contains more than 500 different chemical compounds some of which have been traditionally used for their antioxidant, anti-carcinogenic, immunomodulatory, vasodilatory, analgesic, and antimicrobial activities (Singh et al,, 2015). Based on bioactivity of antibacterial, cocoa shell extract was reported effective against the yeast Saccharomyces cerevisiae and the basidiomycete Moniliophthoraperniciosa and also Gram-positive and Gram-negative bacteria such as Staphylococcus aureus, Staphylococcus epidermidis, and Bacillus subtilis (Gram-positive) and Pseudomonas aeruginosa, Klebsiellapneumoniae, and Salmonella choleraesuis (Gram-negative) (Panak Balentić et al., 2018). The aim of the present study was to investigate antibacterial activity of aqueous extract of UCS, to formulate a natural, safe cocoa antibacterial night cream and to evaluate its physicochemical properties and stability. MATERIALS AND METHODS Unfermented cocoa shells preparation Unfermented cocoa shells (UCS) extract was selected for this study due to the potential of antibacterial activities against Gram-positive and Gram-negative pathogenic bacteria (Zainal et al., 2006). About hundred (100) kg of fresh
unfermented dried cocoa beans were collected from Cocoa Research and Development Centre Malaysian Cocoa Board, Jengka Pahang Malaysia. The UCS were collected through the de-shelling process which involved heating at 130 °C for 2 minutes at rotation speed of 600 rpm using infrared micronizer, breaking using bean-breaker and shells separation from nibs using winnower. The ground UCS were kept at room temperature before used and all analyses were conducted in Biotechnology Laboratory of Malaysian Cocoa Board, Nilai Malaysia. Unfermented cocoa shells extraction The extraction process of ground UCS was conducted with minor modification at TPM Nexus Sdn. Bhd. (formerly TPM Biotech Sdn. Bhd.) in Raub, Pahang Malaysia. About twenty (20) kg of UCS material were extracted with water using solid-liquid extraction (leaching) and soaking for 2 hours at 100 °C. The ratio of raw material to water is 1:16 for per batch of extraction (about 5 kg (UCS):80 L of water) was used. The crude extract was filtered using cloth filter with a pore size of 150 mesh. Before spray drying, the UCS crude extract was heated at 40 ºC and mixed, for 15 minutes, with maltodextrin DE 10 according to the defined proportions in the experimental design. The pilot plant scale spray dryer with counter-current airflow was
used for the encapsulation of UCS extract. The spray dryer was in a pilot-scale with a cylindrical chamber operated at an inlet temperature of 185 °C - 190 °C and outlet temperature 105 °C - 110 °C. For each experiment, 100 mL of solution was pumped through a feed pipe. The feed flow rate and
pressure were fixed as 8 mL/min. and 0.4 kg/cm2 respectively. The obtained powders were stored in a vacuum pack for further analysis. Phytoconstituents profiling of UCS Gas chromatography-mass spectroscopy (GC-MS) method with some modifications was conducted in Makmal Pencirian Struktur Molekul (MPSM), Centre for Research and Instrumentation Management (CRIM), Universiti Kebangsaan Malaysia (UKM). GC-MS analysis for the UCS extract of Theobroma cacao was performed by using the equipment Agilent 7890A gas chromatograph (GC) directly coupled to the mass spectrometer system (MS) of an Agilent 5975C inert MSD with triple-axis detector. The equipment has a DB-5MS UI

Malaysian Cocoa Journal 2019, Vol. 11
129
capillary standard non-polar column with dimensions 30 m x 0.25 mm ID x 0.25 μm
(composed of 5% phenyl methylpolysiloxane). The MSD Chemstation was used to find all the peaks in the raw GC chromatogram. The oven temperature was started from 50C with an increase of 6 C/min up to 280 C withholding time of 10 minutes. Helium gas (99.999%) was used as the carrier gas at a constant flow rate of 1.3 ml/min. An aliquot of 1μl of the sample was
injected into the column at injector temperature 250ºC with splitlessmode. The ionizing energy of 70 eV was used for electron ionization of molecules. The mass range is 45 amu to 600 amu was used and the total GC running time was 50.33 minutes. A library search was carried out for all the peaks by using the NIST/EPA/NIH version 2.0 and the results were combined in a single peak table.
Formulation of the cream The basic formulation of the cream was summarized in Table 1. The three formulations with different amont of UCS extract antibacterial powder (9.28% and 13.30%) were selected for comparison purposes. First, the thickener was soaked with water and homogenized until it became crystal clear texture. Then, the UCS antibacterial extract were added and heated up to 75-80˚C. In another beaker, the phase B was
heated to the same temperature as phase A. When both phase A and B achieved the desired temperature, phase B was added to phase A and homogenized for 20 minutes under a speed of 3000 rpm by using a homogenizer (Silverson) to form an emulsion. Finally, the phase C was added and stirred up evenly until the emulsion got into a homogenous cream.
Table 1. The composition of cocoa antibacterial night cream
Ingredients INCI Name Phase A Water
Aqua
Thickener
Acrylates/C10-30 Alkyl Acrylate Crosspolymer
UCS extract Theobroma Cacao Extract Phase B Cocoa butter
Theobroma Cacao Seed Butter
Emulsifier Cetyl Alcohol (and) Glyceryl Stearate (and) PEG-75 Stearate (and) Ceteth-20 (and) Steareth-20
Goat milk powder Goat Milk Powder Phase C Emulsifier
Polysorbate 20
Preservative Methyl paraben Fragrance
Physico-chemical evaluation Stability tests were carried out to determine whether any phase separation will occur after the emulsions are prepared. Three set of the formulated products were stored at room temperature (37 C) for three months. Then after three months, their stability was check (Ali et al., 2013) according to the following parameter. Cream centrifugation stability test The centrifuging test was used to assess possible formulation instabilities as they will indicate of the incoming phase separation, precipitation and sedimentation. A total of 20 g of each night cream formulation was placed into each
centrifuge tubes. Then, they were centrifuged at 30˚C at 5000 rpm for 20 minutes (Moraes, 2018). Appearance The appearance of the cream was judged by its color, pearlescence, and roughness and graded (Sekar & Abdul Jalil, 2017). pH The pH value of cosmetic formulation was determined by using digital pH tester Basic (Oakton, U.S.A). One (1) g of night cream sample weighed in a 50 mL beaker and diluted with 9 ml of distilled water. The measurement was done triplicate and average values were

Malaysian Cocoa Journal 2019, Vol. 11
130
calculated. The readings were recorded up to 1 decimal point (Bournen, 2017). Rheological test Emulsion viscosity depends on ten parameters which are shear rate, time, continuous viscosity and dispersed phase, continuous density and dispersed phase, particle radius, particles concentration, thermal energy and interfacial tension. Rheological instruments characterization has been used for research, development and quality control through the test of creams with different consistencies (Moravkova & Filip, 2014). The rheological measurement was carried out using rheometer (Model AR2000ex, TA instrument, U.S.A) to obtain the viscosity value. The cone plate with a diameter of 40 mm with an angle of 1.0.7 degree was used in the measurement. The measurement was done in triplicates using 0.5 g of each sample. To obtain the viscosity, the shear stress and shear rate value of the samples were measured for 22 points in 20 minutes at 32˚C.
The rheological data was recorded and viscosity was obtained. Homogeneity The formulation was tested for homogeneity by visual appearance and touch (Sekar & Abdul Jalil, 2017). Colour and odour Colour and odour of prepared cream was examined by visual examination (Sekar & Rashid, 2016). After feel Emolliency, slipperiness and the amount of residue left after the application of fixed amount of cream was checked (Sekar & Abdul Jalil, 2017). Type of smear After application of the cream, the type of film or smear formed on the skin was checked (Sekar & Abdul Jalil, 2017). Removal The ease of removal of the cream applied was examined by washing the applied part with tap water (Sekar & Abdul Jalil, 2017).
Bactericidal activity test In this study, the bactericidal activity test of cocoa antibactrial night cream was conducted by Industrial Biotechnology Research Centre, SIRIM Berhad using Test Method Requirement (phase 1) BS EN 1040:2005 with modification. Staphylococcus aureus (ATCC 6538) and Propionibacterium acnes (ATCC 11827) were used to evaluate the bactericidal activity of cocoa antibacterial night cream. One (1) mL of bacterial suspension of known viable cell count was spiked into 9 ml of 50 % sample and incubated in a water bath at 30 oC for 6 hours contact time. Immediately after 6 hours, 1 mL was then transferred into 9 mL neutralizer (phosphate buffer) and further incubated in a water bath at 30 C for 5 minutes. One (1) ml was then transferred into tryptone water and serial dilution performed. Viable cell count of bacterial cells that survived after treatment was determined using Tryptic Soy Agar. Microbiology limit test The total viable microbial count was conducted at Analytical Service Laboratory, Malaysian Cocoa Board and colony count technique were used with some modification. Sterilized Petri plates were taken and labeled. One (1) mL solution from second test tube was taken and poured into the Petri plate. After that 15-20 mL of sterile standard plate count agar (SPCA) was poured and mixed properly with that dilution. The same procedure was done for 106and 108 dilutions. Yeast and mold were isolated on rose Bengal agar (RBA) by using the same method. Solidified SPCA plates were incubated for 72 ± 3 hours at 30 ± 1 °C. Each dilution was plated out in triplicates. After incubation, the numbers of colonies were counted by using colony counter. As all the dilutions were plated out in triplicates, so mean value for each dilution was taken after counting colonies separately. Those samples were considered contaminated in which the colony count exceeded 300 colonies. To estimate the viable microbial count per gram of sample dilution, colony count was multiplied with appropriate dilution factor. All the values were obtained in CFU/g.

Malaysian Cocoa Journal 2019, Vol. 11
131
RESULTS AND DISCUSSION Phytoconstituents profiling of unfermented cocoa shell extract GC-MS method is used to identify phytoconstituents in a direct and fast analytical approach with few grams of plant material. In GC-MS analysis of aqueous extract of unfermented cocoa shell from Theobroma cacao has revealed the presence of nine (7) major active compounds with high percentage of similarity of more than 80% such as 9,12-octadecadienoic acid (Z,Z)-, 9-octadecenoic acid, octadecanoic acid, eicosanoic acid, docosanoic acid, tetracosanoic acid and octacosanol. The compounds with their peak area, compound name, retention time, molecular structure and compound group are listed in Table 2. These characterized compounds have different pharmacological properties. The component of 9-octadecenoic acidwas found in highest concentration based on the value of peak area reported in Table 2. The dominant fatty acids such as 9,12-octadecadienoic acid (Z, Z)-, 9-octadecenoic acid, octadecanoic acid, eicosanoic acid, docosanoic acid and tetracosanoic acid in UCS extract showed potential antibacterial activity. Hence, multiple
antimicrobial fatty acids have shown in vivo therapeutic potential, and there is also growing interest to investigate combinations of several antimicrobial fatty acids that have antibacterial potency against specific bacteria in order to achieve synergistic and broad-spectrum effects.
Antimicrobial lipids such as fatty acids and monoglycerides are promising antibacterial agents that destabilize bacterial cell membranes, causing a wide range of direct and indirect inhibitory effects (Yoon et al., 2018). In several reports, a few plants also exhibited the potential of fatty acids as antibacterial agents such as Laminaria japonicaextract (Patra et al., 2015), Albiziaadianthifolia and Pterocarpusangolensis extracts (Abubakar & Majinda, 2016), Carica papaya extract (Sani et al., 2017), Archidendronbubalinum extract (Irawan et al., 2017). In this study, we reported the presence of some of the important phytocomponents resolved by GC-MS analysis and their biological activities. The GC-MS analysis is the initial step towards understanding the nature of active phytoconstituents in this medicinal plant (Theobroma cacao) and this type of work will be helpful for a further detailed study on product formulation.
Table 2. Phytocomponents detected in UCS extract of Theobroma cacao
Retention Time
Peak Area
Chemical Name Similarity (%)
Molecular Structure
Group
30.85 5.5069 9,12-Octadecadienoic acid (Z,Z)-
99 C18H32O2 Unsaturated
fatty acid
30.97 14.1103 9-Octadecenoic acid, (E)-
98 C18H34O2 Unsaturated
fatty acid
31.37 4.564 Octadecanoic acid 98 C18H36O2 Saturated fatty
acid
34.32 3.2293 Eicosanoic acid 97 C20H40O2 Saturated fatty
acid
37.01 1.8108 Docosanoic acid 98 C22H44O2 Saturated fatty
acid
39.51 5.0416 Tetracosanoic acid 99 C24H48O2 Saturated fatty
acid
40.87 3.2832 Octacosanol 89 C28H58O2 Primary alcohol
Physico-chemical evaluation The aqueous extract of UCS from Theobroma cacao was formulated into a night cream and this formulation did not show a considerable change in characters such as color, odor, consistency and no phase separation was observed during the course of the study. The
example appearance of stable cocoa antibacterial night cream is in Figure 1. Consequently, the results of pH, viscosity, homogeneity, after feel, type of smear and removal were recorded in Table 3. The results from Table 3 revealed that the pH of developed formulation was pH 5.8 which was acceptable as for topical preparations,

Malaysian Cocoa Journal 2019, Vol. 11
132
the pH should be in the range of skin pH (4.5-7.0) to avoid any irritation to the skin (Budiman et al., 2018). The appropriate viscosity level for the cream base is between 20,000 to 200,000 cP (20 to 200 Pa.s) so that 80% of pressure required by the cream started to flow (Xie & Jin, 2016). The results showed that the viscosity of the cream was 42,580 cP and was within the standard range mentioned. This indicates that the cream is easily spreadable by small amounts of shear (Sakthi Priyadarsini et al., 2018). Our results also indicated that the cocoa antibacterial night
cream formulation was in uniform distribution. This was confirmed by visual appearance and touch. Besides that, the formulation was found to be more stable when stored for a longer period and no separation phase occurred. The formulation was homogenous, emollient, slipperiness, non-greasy and can be easily removed after the application (Table 3) and was safe with respect to skin irritation and allergic sensitization (data not shown). For further evaluation, the study on cutaneous permeation and in vivo efficacy of the formulation are necessary to confirm their usage for the treatment of the face skin.
Table 3. Evaluation of physical-chemical parameters of cocao antibacterial night cream
Parameters Cream Stability Stable Appearance No change in color pH 5.8 Viscosity 42,580cP Homogeneity by visual Homogenous Homogeneity by touch Smooth and consistent Color Light brown Odor Good After feel Emollient and slipperiness Type of smear Non greasy Removal Easy
Figure 1. Formulated cocoa antibacterial night cream product
Bactericidal activity test The antibacterial activity of cocoa antibacterial night cream product against two Gram-positive bacteria (Staphylococcus aureus and Propionibacterium acnes) was examined by
killing assays performed after exposing the cells to the concentration of cocoa antibacterial night cream product for 6 hours. The percentage of survival of cocoa antibacterial night cream product treated bacterial sample was calculated

Malaysian Cocoa Journal 2019, Vol. 11
133
after comparing with initial inoculum (untreated) as presented in Table 4. Cocoa antibacterial night cream product showed a strong killing potential with 99.94 % against the Propionibacterium acnes after 6 hours treatment as compared to Staphylococcus aureus showed killing potential about 56.92 % only. This observation indicates that the activity due to the presence of fatty acid phytoconstituent such as 9,12-octadecadienoic acid (Z,Z)-, 9-octadecenoic acid, octadecanoic acid, eicosanoic
acid, docosanoic acid and tetracosanoic acid mentioned in Table 2. Fatty acid, hydroxy fatty acid ester and hydroxichavicol compounds can act as anionic surfactants and have antibacterial and antifungal properties at low pH, in addition to selective against Gram-positive organisms by targeting the structure and function of cell walls and bacterial membranes (Budiman et al., 2018). This was a good sign to do further studies on the development of anti-acne cream for skincare product.
Table 4. Bactericidal activty of cocoa antibacterial night cream product after 6 hours treatment
Microorganism Initial inoculum
(cfu/ml)
Number of cells in test mixture after 6 hours contact time
Number of cells (cfu/ml)
Log reduction (%)
Staphylococcus aureus (ATCC 6538)
3.25 x 10⁸ 1.40 x 10⁸ 56.92
Propionibacterium acnes (ATCC 11827)
4.10 x 10⁷ 2.60 x 10⁴ 99.94
Microbial limit evaluation Table 5 showed the colony counts results for cocoa antibacterial night cream product. The mean values were used in duplicates of a sample in the colony formation unit per gram. For the colony-forming unit of microorganisms in cocoa antibacterial night cream product, 0 CFU/g were recorded. For the colony-forming unit of yeasts and moulds, product formulation was recorded less than 10 CFU/g. The microbiology test was carried out on cocoa antibacterial night cream product showed that the product is within the safe range of bacterial count which less than 1000 CFU/g based on European Union (EU) legislation for the cosmetic products. Microbiological contamination test on cosmetic products is crucial to be carried out because of the daily use and skin direct contact. Although
creams products are not sterile, they must not be contaminated with any microorganisms. Various sources can cause microbiology contamination including environment, body sweat, consumer’s
hands and during the time of manufacturing. Also, the frequency of use, applying method and storage conditions could highly risk the microbial contaminants in products. The microbial contaminants may be originate from raw materials during the process, expose to the air for a long time and during the use of the products by the consumers. The microbial contaminants may also affect human health as a result of a formation of microbial metabolites and spoilage of the products (Bagherinejad et al., 2014). Based on the experiment, the night cream product is less contaminated and passed the standard thus, it is safe to be used.
Table 5. Microbiological test results of cocoa antibacterial night cream product
Formulation Colony-forming unit of microorganism/g sample (CFU/g)
Colony-forming unit of yeast and moulds/g sample (CFU/g)
Cocoa Antibacterial Night Cream
0 <10
CONCLUSIONS
To our knowledge, this is the first study dealing with UCS extract to be formulated as an antibacterial topical formulation. Cocoa
antibacterial night cream demonstrated the higher antibacterial capability to protect face skin against damage caused by Propionibacterium acnespathogens and the cream preparation due to its higher antimicrobial

Malaysian Cocoa Journal 2019, Vol. 11
134
fatty acid contents. Based on physico-chemical results proved that the ability of cocoa antibacterial night cream with potential application to reduce face skin infection with consequent health benefits. The night cream was formulated for nourishing, moistening, lightning and treatment for any types of facial skin. Further study on heavy metal and sensory evaluation are needed to validate the safety and people acceptance of this natural antibacterial cream from UCS against all skin disorder. ACKNOWLEDGEMENT
The authors wanted to express their gratitude to Director General, Malaysian Cocoa Board, Director, Division of Biotechnology, Malaysian Cocoa Board and Director, Division of Downstream, Malaysian Cocoa Board for providing laboratory facility and financial support to carry out this research study. REFERENCES Abubakar, M., & Majinda, R. (2016). GC-MS
Analysis and Preliminary Antimicrobial Activity of Albizia adianthifolia (Schumach) and Pterocarpus angolensis (DC). Medicines, 3(1): 3.
Ali, H. S., Shehab, N. A., & Mohamed, E. ahaj B. (2013). Formulation and Evaluation of Herbal Cream From Ziziphus spina Leaves Extract. International Research Journal of Pharmacy, 4(6): 44–48.
Amirthalingam, S., Yi, K., Ching, L., & Mun, N. (2015). Topical Antibacterials and Global Challenges on Resistance Development. Tropical Journal of Pharmaceutical Research, 14(5): 919.
Bagherinejad, M., Haftbaradaran, B., Abedi, D., & Jalali, M. (2014). Microbial quality survey of sunscreen products in Iranian market. Advanced Biomedical Research, 3(1): 180.
Bouranen, A. (2017). Determination of the stability of cosmetic formulations with incorporation of natural products.
Budiman, A., Rusnawan, D. W., & Yuliana, A. (2018). Antibacterial activity of piper betle L. Extract in cream dosage forms against Staphylococcus aureus and Propionibacterium acne. Journal of
Pharmaceutical Sciences and Research, 10(3): 493–496.
Fonseca-Santos, B., Funagoshi, E. E., de Oliveira, J. R. S., do Sacramento, L. V. S., dos Santos, A. G., Leonardi, G. R., & Chorilli, M. (2017). Organic cocoa extract -loaded surfactant-based systems intended to skin bioadhesion. Brazilian Journal of Pharmaceutical Sciences, 53(3): 1–13.
Irawan, C., Foliatini, Hanafi, Sulistiawaty, L., & Sukiman, M. (2017). Volatile Compound Analysis using GC-MS, Phytochemical Screening and Antioxidant Activities of the Husk of “Julang-Jaling” (Archidendron
bubalinum (Jack) I.C Nielsen) from Lampung, Indonesia. Pharmacognosy Journal, 10(1): 92–98.
Moraes, A. R. U. and C. A. P. (2018). Development and Stability Evaluation of Liquid Crystal-Based Formulations Containing Glycolic Plant Extracts and Nano-Actives. Cosmetics, 5: 1–7.
Moravkova, T., & Filip, P. (2014). The influence of thickeners on the rheological and sensory properties of cosmetic lotions. Acta Polytechnica Hungarica, 11(6): 173–186.
Panak Balentić, J., Ačkar, Đ., Jokić, S.,
Jozinović, A., Babić, J., Miličević, B.,
… Pavlović, N. (2018). Cocoa Shell: A
By-Product with Great Potential for Wide Application. Molecules, 23(6): 1404.
Patra, J., Das, G., & Baek, K.-H. (2015). Chemical Composition and Antioxidant and Antibacterial Activities of an Essential Oil Extracted from an Edible Seaweed, Laminaria japonica L. Molecules, 20(7): 12093–12113.
Piccioni, A., García-Rodrigo, C. G., Pellegrini, C., Mazzocchetti, G., & Fargnoli, M. C. (2017). Improving Skin Aging, Skin Hydration and Sensitive Skin with Four Specific Skin Care Products: Results from a Single-Centre, Observational, Prospective Study. Journal of Cosmetics, Dermatological Sciences and Applications, 07(01): 48–56.
Ribeiro, A. S., Estanqueiro, M., Oliveira, M. B., & Lobo, J. M. S. (2015). Main benefits and applicability of plant extracts in skin care products. Cosmetics, 2(2):

Malaysian Cocoa Journal 2019, Vol. 11
135
48–65. Sakthi Priyadarsini, S., Kumar, P. R., &
Thirumal, M. (2018). Formulation and evaluation of a herbal antibacterial cream from ethyl acetate extract of leaves of Spinacia oleracea Linn. against Aeromonas skin and soft tissue infections. International Journal of Green Pharmacy, 12(3): S537–S542.
Sani, M. S. A., Bakar, J., Rahman, R. A., & Abas, F. (2017). The antibacterial activities and chemical composition of extracts from Carica papaya cv . Sekaki / Hong Kong seed. International Food Research Journal, 24(April): 810–818.
Sekar, M., & Abdul Jalil, N. S. (2017). Formulation And Evaluation Of Novel Antibacterial And Anti-Inflammatory Cream Containing Muntingia Calabura Leaves Extract. Asian Journal of Pharmaceutical and Clinical Research, 10(12): 376.
Sekar, M., & Rashid, N. A. (2016). Formulation, evaluation and antibacterial properties of herbal ointment containing methanolic extract of Clinacanthus nutans leaves. International Journal of Pharmaceutical and Clinical Research, 8(8): 1170–1174.
Sekar, M., Sivalinggam, P., & Mahmad, A. (2017). Formulation and Evaluation of Novel Antiaging Cream Containing Rambutan. International Journal of Pharmaceutical Sciences and Research, 8(3): 1056–1065.
Singh, N., Datta, S., Dey, A., Chowdhury, A. R., & Abraham, J. (2015). Antimicrobial activity and cytotoxicity of Theobroma cacao extracts. Der Pharmacia Lettre, 7(7): 287–294.
Surber, C., & Kottner, J. (2017). Skin care products: What do they promise, what do they deliver. Journal of Tissue Viability, 26(1): 29–36.
Xie, J., & Jin, Y. C. (2016). Parameter determination for the cross rheology equation and its application to modeling non-Newtonian flows using the WC-MPS method. Engineering Applications of Computational Fluid Mechanics, 10(1): 111–129.
Yoon, B., Jackman, J., Valle-González, E., & Cho, N.-J. (2018). Antibacterial Free Fatty Acids and Monoglycerides:
Biological Activities, Experimental Testing, and Therapeutic Applications. International Journal of Molecular Sciences, 19(4): 1114.
Zainal, B., Nordin Affendy, M. A., & Ag. Adzman, A. J. (2006). Screening Of Cocoa Tissues For Activity Against Staphylococcus aureus, Salmonella typhimurium and Candida albicans. Malaysian Cocoa Journal, 2: 16–21.

Malaysian Cocoa Journal 2019, Vol. 11
136
USE OF RNAi TECHNOLOGY TO CONTROL COCOA POD BORER, AN AGRICULTURAL IMPORTANT PEST IN SOUTHEAST ASIA.
Tan, C. L.1, Mohd. Firdaus, A.1 Masooq, M.2. Fosu-Nyarko, J.2 Jones G.K.M.2
1Division of Biotechnology, Cocoa Research & Development Centre, Kota Kinabalu Industrial Park, 88460 Kota Kinabalu, Sabah, Malaysia.
2State Agricultural Biotechnology Centre, Murdoch University, 6150 Western Australia.
Malaysian Cocoa J. 11: 136-144 (2019) ABSTRACT - Cocoa pod borer (CPB) is the most important pest of cocoa plantations in Southeast Asia. It causes crop production loss of 5-20 percent. In severe cases, more than 50% of the crop production damage can be due to CPB. The normal control method is by using chemical pesticide. However, this leave residues that is harmful for human consumption and damage to the environment. In this project, we are exploring the use of RNA interference (RNAi) technology to control CPB. Ribonucleic acid (RNA) is a natural element that is found in living organism. RNAi is a biological mechanism whereby RNA molecules interfere with gene expression and translation. We designed several genes controlling metabolic processes in CPB insect using bioinformatics. We cloned these genes into double stranded RNA (dsRNA) vector to synthesize dsRNA. The dsRNA were then used in CPB feeding trials. Our results showed that several of these genes increased the mortality of the insect as compared to control treatment. Quantitative PCR analysis confirmed the suppression of these genes as compared to the control treatment. A significant decrease in gene expression were observed in Amp, Crt and Cpl genes. Key words: Theobroma cacao, cocoa pod borer, RNA interference, biopesticide INTRODUCTION Cocoa pod borer (CPB) or Conopomorpha cramerella (Snellen) is the most damaging pest of cocoa in South-east Asia (Malaysia, Indonesia, Philippines, Vietnam) and Papua New Guinea. It can cause complete crop loss unless measures are taken to control it. CPB is considered the major hindrance to the development of the cocoa planting industry. Average bean losses in Malaysia due to CPB have been estimated to be at least 15 percent of annual potential yields. Infestation of cocoa pod borer (CPB) posed a persistent problem to cocoa growers by reducing yield and increasing production cost (Saripah et al., 2014; Wood & Lass, 1985). In spite of the severe damage by CPB, no cost-effective control strategy has yet been devised, even though the problem has been studied for more than a hundred years. Mechanism of RNAi - Double-stranded RNA (dsRNA)-mediated gene silencing, commonly referred to as RNA interference (RNAi), is becoming a widely used functional genomics tool in insects to ascertain the function
of the many newly identified genes accumulating from genome sequencing projects (Garcia et al., 2017; Naedety et al., 2015). The basic components of the RNAi process, namely the endonuclease Dicer, which first chops long dsRNAs into short interfering RNAs (siRNAs), and the RNA-induced silencing complex (RISC), which facilitates the targeting and endonucleolytic attack on mRNAs with sequence identity to the dsRNA, are evolutionarily conserved across virtually all eukaryotic taxa (Lim et al, 2016), and consequently, RNAi could be readily applied to any insect species. The sequence specificity of dsRNA coupled with its ability to suppress genes critical for insect survival suggests that dsRNAs could be developed as tailor-made pesticides, for use on pest insects where it is important to target only one or several closely related species, without adversely affecting non-target species (Song et al, 2017; Andrade & Hunter, 2016, Li et al., 2015). Many pesticides in use today are broad-spectrum, capable of killing many species. Unfortunately, our current repertoire of pesticides will soon reach

Malaysian Cocoa Journal 2019, Vol. 11
137
its expiration date, as there are growing public concerns about the off-target effects of pesticides in our environment and the frequency of pesticide resistance is steadily increasing.
RNAi and insect control - To implement RNAi in insect control, the target organism should be able to take up the dsRNA autonomously, e.g. through feeding and digestion (Singh et al., 2017; Lim et al., 2016, Wang et al., 2016). The demonstration that eukaryotic pests are inhibited by small interfering RNAs (siRNAs) targeting their essential genes has raised the possibility that plants can be protected by a new generation of eco-friendly RNA-based insecticides, which are highly specific and can be easily adapted to control pests (Wang et al., 2017; Wynant et al., 2014).
Proof of principle for the application of RNAi in insect crop pest control comes from early studies conducted on the western corn rootworm (WCRW - Diabrotica virgifera), and cotton bollworm (CBW - Helicoverpa armigera) (Scott et al., 2013). The researchers fed larval WCRW on 290 dsRNAs, from which they identified 14 genes that reduced larval performance, and one of these, vacuolar ATPase subunit A (V-ATPase), was carried forward for detailed analysis. Low concentrations of orally-delivered dsRNA against V-ATPase in artificial diet suppressed the corresponding WCRW mRNA. Importantly, larvae reared on transformed corn plants that express V-ATPase dsRNA also displayed reduced expression of the V-ATPase gene and caused much reduced plant root damage. In the study on CBW, the target gene was a cytochrome P450, CYP6AE14, which is expressed in the larval midgut and detoxifies gossypol, a secondary metabolite common to cotton plants. When CBW was exposed to either Arabidopsis thaliana or Nicotiana tobacum expressing CYP6AE14 dsRNA, levels of this transcript in the insect midgut decreased, larval growth was retarded, and both effects were more dramatic in the presence of gossypol.
Transgenic cotton plants expressing CYP6AE14 dsRNA also support drastically retarded growth of the CBW larvae, and suffered less CBW damage than control plants (Zhang et
al., 2017). In another study, researchers used hairpin RNA expressed in both Escherichia coli and transgenic tobacco plants to decrease mRNA and protein levels of the H. armigera-derived molt-regulating transcription factor in larval H. armigera, which resulted in developmental deformity and larval lethality (Kim et al., 2015). Another example is provided by nicotine, a neurotoxin made by species of tobacco. The tobacco hornworm Manduca sexta (Lepidoptera) can tolerate high nicotine concentrations. Larvae even exhale nicotine through their spiracles, deterring spider predation. Dietary nicotine induces the cytochrome P450 gene CYP6B46 in M. sexta. Tobacco plant transformed with a construct expressing dsRNA targeting 300 nt of the M. sexta gene for CYP6B46. Tobacco hornworm larvae consuming the transformed tobacco were more susceptible to spider predation because they exhaled less nicotine (Kumar et al., 2014). The success of these studies attests to the functionality of the RNAi in controlling insect pests.
MATERIALS AND METHODS Identification of target genes Suitable target genes for lepidopteran insects were identified by reviewing the literature (Table 1). The functions of the target genes in the insects were identified. The mRNA sequences of the genes were retrieved from the NCBI database for various lepidopteran insects (Helicoverpa armigera, Manduca sexta, Epiphyas postvittana, Plutella xylostella and Spodoptera frugiperda). The various gene sequences were aligned using DNA* software (MegAlign). Consensus sequence was obtained from aligning the various gene sequences. Suitable primers were designed using Primer 3 software. Isolation of CPB RNA, reverse transcription and PCR amplification of target genes RNA used for both reverse transcription-polymerase chain reaction (RT-PCR) of target genes and quantitative RT-PCR was extracted from mixed stages populations of C. cramerella using TRIzol Reagent (Life Technologies Corporation) and ethanol precipitation. The

Malaysian Cocoa Journal 2019, Vol. 11
138
number of insects used depended on the purpose of the experiment. Insects were first macerated with liquid nitrogen in a 1.5 mL RNAse-free centrifuge tube after which 800 mL of TRIzol Reagent was added and vortexed for 5 min. RNA was extracted with 200 mL of chloroform. The aqueous phase was ethanol-precipitated for 30 min at 12,000 g, resuspended in DEPC-treated water and treated with DNase I (Qiagen, Australia). cDNA preparations were made using the High Capacity cDNA Reverse Transcription kit (Applied Biosystems, Australia) according to the manufacturer’s protocol. PCRs of target genes, amplified from 300 ng of cDNA, were done with MyTaq DNA Polymerase (Bioline, Australia) following the manufacturer’s recommendation in a
20 mL reaction volume using the following temperature profile: 95 oC for 3 min, followed by 35 cycles of 95 oC for 15 s, 55 oC for 15 s and 72 oC for 30 s followed by 72 oC for 10 min in a Veriti 96-Well Thermal Cycler (Applied Biosystems). Sequencing of CPB genes and confirmation by BLAST search The genes obtained by PCR were excised from agarose gel and purified by Promega SV Gel Clean kit. They were then quantified using Nanodrop. The samples were then prepared for sequencing by incorporating Big Dye via thermal cycling. The samples were run on ABI 3730 96 capillary machine. Cloning into dsRNA vector The genes that were correctly verified via sequencing were cloned into dsRNA vector, pDoubler. The genes and vector were excised with KpnI and XhoI overnight at 37oC. The next day, the vector and genes were ligated at 4oC overnight. The ligated products were transformed into bacteria JM109 and selected on LB media with 25 mgml-1 kanamycin. Generation of double-stranded (ds)RNA A 745 nucleotide long dsRNA corresponding to the gfp gene of Aequorea victoria was used as a control. The dsRNAs were synthesised using the MEGAscript RNAi Kit according to the manufacturer’s protocol (Ambion, Austin, USA)
from PCR products as templates. The DNA
templates for the insect genes were generated with primer pairs, each with the T7 promoter sequence upstream of the gene-specific portion for in vitro transcription with the T7 RNA polymerase promoter. Primers used to amplify the gfp gene were T7GFP-F and T7GFP. Briefly, 2 mg of DNA was incubated with the T7 enzyme mix and 75 mM each of ribonucleotides for 16 h at 37 oC, followed by 1 h of DNase-1 treatment at 37 oC. An extra annealing step at 75 oC for 5 min was done to ensure the longer dsRNA of gfp was completely annealed before nuclease treatment. DsRNAs were purified and checked for integrity on a 1.5% non-denaturing agarose gel prepared with 1X TBE as described by the manufacturer. Feeding bioassay of dsRNA with CPB insects CPB insects were collected from field-infested cocoa pods. They were wrapped in papers and kept in the dark for two weeks. During the period, they were constantly checked for pupae. The pupae were collected and kept in a Petri dish until the eclosion of the adult moth. The CPB insects were treated with seven different in-vitro synthesised dsRNA (30 µg/ml) and control (negative and test control). Each type of treatment method and control were carried out with at least 4 insects each and repeated thrice. The experiment were carried up to 7 days. Quantitative reverse transcriptase PCR (qRT-PCR) assay on CPB insect One live CPB insect (triplicates) from the feeding bioassays (after 3 days) were subjected to total RNA extraction with Trizol reagent (Invitrogen). Total RNA was treated with RNase free DNase I at 37oC to remove residual DNA. First strand cDNA synthesis was performed using oligo-dT primer (Fermentas). The newly synthesised cDNA was subjected to qRT-PCR. A gene encoding beta actin (Forward: 5’-AGGTATCCTCACCCTGAAGT-3’ and Reverse
5’-CTTCATGAGGTAGTCGGTCAAG-3’) was
used as internal control. Analyses of gene expression in cocoa pod borer insects were done with the GoTaq qPCR Master Mix (Promega Corporation, USA) in a Corbett RotorGene Quantitative Thermal Cycler (Qiagen Pty Ltd., Australia). Briefly, 1 L of

Malaysian Cocoa Journal 2019, Vol. 11
139
cDNA, converted from 500 ng of RNA of experimental and control samples, was added to 1x GoTaq qPCR master mix, 10 M each of the gene specific primer pair and sterile deionised water to make the reaction mixture to 20 L. All PCRs were done in triplicate and the mean of Ct values determined. Expression of Cpl, Crt and Amp was quantified with primer pairs qCpl-F and qCpl-R, qCrt-F and qCrt-R and qAmp-F and qAmp-R, which amplified 123, 128 and 134 bp, respectively
in CPB insect (Table 1). PCRs were done at 95oC for 10 min, followed by 45 cycles of 95oC for 15 s and 55oC for 60 s. Gene expression was normalised with actin gene using primer pairs qActin-F and qActin-R that amplified 116 bp (Table 1). Relative gene expression was determined using the Ct method as described in the ABI PRISM 7700 Sequence Detection System Bulletin 2 (Applied Biosystems).
Table 1. Degenerate PCR primers used for PCR and qRT-PCR Primer Forward (from 5’ to 3’) Reverse (from 5’ to 3’) Axn TACCTCGAGGCAAGGATATCGTAGAGA TAGGGTACCCGCATCATAGCTAAAGAG Crt ATACTCGAGGGTGAAACTCCGTATGA GTAGGTACCCCCATACTCCCTTGTAAT Ctns AATCTCGAGGGTTACGCTGGTATTGA ATAGGTACCTTACGTGTGGGAGAATG Tdxn ATACTCGAGTCAAGACGGTAACTTAGAACCA ATAGGTACCTCTTTGCCATCTTTGGGATTTC Amp ATACTCGAGATTTGCCTTGGAAGTTG ATAGGTACCGATGGCCTACAGGTATT Cpl ATACTCGAGTGGAAGGACAACATTTC ATAGGTACCTACGTGCCACCATTAT Gp ATACTCGAGGTAACACAGCGAACAA AGTGGTACCTTCTCCAAACCCAAAG Qact GAGAAGATCTGGCATCACACC TGGGTCATCTTCTCCCTGTT Qcrt TGATGACCCCAATGATGAGA ATCATTGCTGGTTCCCATTC Qamp TCTGGTGCTATGGAAAATTGG AACCATTGGTGAGCCAACTC Qcpl CATGCATGCTTTGGCTACTG CACCATGGTCCAGTTCTGTG Note: Those primers prefix with Q are primers for qRT-PCR. RESULTS AND DISCUSSION A series of target genes were identified and their functions were identified. They were Thioredoxin (Tdxn), Calreticulin (Crt), Annexin (Axn), Aminopeptidase (Amp), Chitinase (Ctns), Gluthathione peroxidase (Gp) and Cathepsin L (Cpl).
Isolation of CPB genomic DNA - Genomic DNA was isolated from CPB adult moth using caesium chloride ultracentrifugation method (Figure 1). The DNA was ultra-centrifuged twice in caesium chloride gradient to ensure the purity of the DNA. The DNA was quantified using Nanodrop® 2000. Readings of 260/280 and 260/230 were 1.92 and 2.12 respectively (Figure 2).
Figure 1. Caesium chloride ultracentrifugation Figure 2. Nanodrop measurement of CPB gDNA

Malaysian Cocoa Journal 2019, Vol. 11
140
Isolation of CPB total RNA and synthesis of cDNA transcript - CPB total RNA was isolated using TRIazol method. The readings for 260/280 and 260/230 were 1.97 and 2.27 respectively (Figure 3). The total RNA was reverse transcript to cDNA (Figure 4). The cDNA is then used to isolate CPB target genes for RNA interference study.
Degenerate PCR primers were used to amplify target genes from CPB cDNA - Degenerate PCR primers (Table 1) were used to amplify target genes from cDNA obtained. The amplicons were extracted from the gel, purified and sequenced. BLAST analysis on NCBI database showed that the genes were more than 90% similar to the mentioned genes in other insect species. Examples of these are shown in Figure 5 and Figure 6.
Accession Description Identity
XM_022311334.1 Myzus persicae calreticulin-like mRNA 99%
XM_003240040.3 Acyrthosiphon pisum calreticulin mRNA 94%
XM015524006.1 Diuraphis noxia calreticulin (LOC107173458), mRNA 92%
Accession Description Identity
XM_022305806.1 Myzus persicae puromycin-sensitive aminopeptidase (LOC111027432), transcript variant X5, mRNA
97%
XM_015524093.1 Diuraphis noxia puromycin-sensitive aminopeptidase (LOC107173520), transcript variant X3, mRNA
94%
XM016808083.1 Acyrthosiphon pisum puromycin-sensitive aminopeptidase (LOC100162520), transcript variant X5, mRNA
94%
Figure 3. Total RNA isolated from CPB Figure 4. Reverse transcript CPB cDNA
Figure 5. Blast results of CPB Crt gene
Figure 6. Blast results of CPB Amp gene

Malaysian Cocoa Journal 2019, Vol. 11
141
Cloning target genes into vector to generate dsRNA - The target genes that were verified by DNA sequencing and BLAST analysis were
cloned into dsRNA vector, pDoubler (Figure 7). The pDoubler vector were then transformed into E. coli (Figure 8).
Identifying the correct clones by colony PCR; restriction digest of the dsRNA vector - Correct clones with CPB genes were identified by colony PCR (Figure 9). These were confirmed with restriction digest of the dsRNA vector (Figure 10).
Feeding bioassay of double stranded RNA on CPB moth - CPB moth were fed with dsRNA at 30 g/ml synthesised from the dsRNA vector. Amp dsRNA caused complete mortality after 4 days of feeding. This is followed by Crt and Cpl dsRNA that caused 60% mortality (Figure 11).
Figure 7. dsRNA vector, pDoubler
Figure 8. Transformation pDoubler with CPB genes into E. coli. (A) Control without CPB gene; (B) pDoubler with Crt gene; (C) pDoubler with Tdxn gene.
A
Figure 9. Colony PCR to identify correct clones with CPB genes Figure 10. Restriction digest of dsRNA vector to confirm the presence of insert.

Malaysian Cocoa Journal 2019, Vol. 11
142
Quantitative reverse-transcriptase PCR of target genes of CPB - Total RNAs from CPB moth fed with dsRNA were extracted and cDNA synthesised from them. These were used for experiments on quantitative RT-PCR of the target genes (Figure 12). The target genes studied were Cpl, Crt and Amp genes as these were the most effective in causing mortality in CPB moth in the
feeding bioassay. Gene Cpl caused 23 million fold reduction in transcript as compared to the Control, gene Crt caused approximately 58 thousand fold decrease in transcript whereas gene Amp caused 10 thousand fold decrease in transcript (Table 2).
Figure 11. Feeding bioassay of CPB insect with dsRNA
Fig. 12 Quantitative RT-PCR analysis of target genes
Figure 12. Quanttitative RT-PCR analysis of CPB target genes

Malaysian Cocoa Journal 2019, Vol. 11
143
Table 2. Quantification of reduction of gene expression after feeding dsRNA
Target gene Concentration of dsRNA Fold decrease in transcript level
Cpl 30 g/ml 23,562,675.04
Crt 30 g/ml 58,656.36
Amp 30 g/ml 10,960.30
CONCLUSIONS The mortality rate of CPB insect was highest for those fed with Amp dsRNA, followed by Cpl and Crt dsRNA. However, this need to be confirmed with further replicate experiments. This project demonstrated that gene silencing occurred in CPB as demonstrated by the high -fold reduction in transcripts as compared to those fed without dsRNA. The study also showed that RNAi is a promising technology for developing biopesticide to control CPB infestation in cocoa cultivation. ACKNOWLEDGEMENT We would like to thank the Australian government for providing research fellowship to enable the main author to carry out part of the research at State Agricultural Biotechnology Centre (SABC), Murdoch University, Western Australia. Thanks also to the manager for CRDC, LKM Tawau for providing some of the CPB pupa samples for bioassay studies. We would also like to thank the Director of Biotechnology for providing funding under the 11th Malaysian Development Fund to complete the project. Lastly, we like to thank the Director-General and Deputy Director-General for their support and permission to publish this paper. REFERENCES Andrade, C.E., Hunter, W.B. (2016). RNA
interference – natural gene-based technology for highly specific pest control (HiPecC) In: Abdulrakhmonov,
I.Y. (Ed.) RNA interference. In Tech Open, Croatia, pp 391-409.
Garcia, R.A., Macedo, L.L.P., Nascimento, D.C.,
Gillet, F.X., Moreira-Pinto, C.E., Faheem, M., Basso, A.M.M., Silva, M.C.M. and Grossi-de-Sa, M.F. (2017). Nucleases as a barrier to gene silencing in the cotton boll weevil, Anthonomus grandis. PLOS One
Kim, Y.H., Soumaila Issa, M., Cooper, A.M. and
Zhu, K.Y. (2015). RNA interference: Applications and advances in insect toxicology and insect pest management. Pestic Biochem Physiol., 120:109-17.
Kumar. P., Pandit, S.S., Steppuhn, A. and
Baldwin, I.T. (2014). Natural history-driven, plant-mediated RNAi-based study reveals CYP6B46's role in a nicotine-mediated antipredator herbivore defense. Proc. Natl. Acad. Sci. U.S.A., 111: 1245–
1252. Li, H., Guan, R., Guo, H. and Miao, X. (2015).
New insights into an RNAi approach for plant defence against piercing-sucking and stem-borer insect pests. Plant Cell Environ., 38: 2277-2285.
Lim, Z.X., Robinson, K.E., Jain, R.G., Chandra,
G.S., Asokan, R., Asgari, S. and Mitter, N. (2016). Diet-delivered RNAi in Helicoverpa armigera – Progresses and challenges. Journal of Insect Physiology, 85: 86–93.
Nandety, R.S., Kuo, Y.W., Nouri, S. and Falk,
B.W. (2015). Emerging strategies for

Malaysian Cocoa Journal 2019, Vol. 11
144
RNA interference (RNAi) applications in insects. Bioengineered, 6(1): 8-19.
Ramesh Kumar, D., Saravana Kumar, P., Gandhi,
M.R., Al-Dhabi, N.A., Paulraj, M.G. and Ignacimuthu, S. (2016). Delivery of chitosan/dsRNA nanoparticles for silencing of wing development vestigial (vg) gene in Aedes aegypti mosquitoes. Int J Biol Macromol., 86: 89-95.
Saripah, B, Hassan, S.T.S. and Sajap, A.S. (2014).
Distribution of cocoa pod borer eggs at different levels of shade in small-size plantations. Malaysian Cocoa J., 8: 23-30.
Singh, I.K., Singh, S., Mogilicherla, K., Shukla,
J.N. and Palli, S.R. (2017). Comparative analysis of double-stranded RNA degradation and processing in insects. Sci Rep., 7(1): 17059.
Song, H.F., Zhang, J.Q., Li, D.Q., Cooper,
A.M.W., Silver, K., Li, T., Liu, X.J., Ma, E.B., Zhu, Y.K. and Zhang, J.Z. (2017). A double-stranded RNA degrading enzyme reduces the efficiency of oral RNA interference in migratory locust. Insect Biochemistry & Molecular Biology, 86: 68-80.
Scott, J.G., Michel, K., Bartholomay, L,C.,
Siegfried, B.D., Hunter, W.B., Smagghe, G., Zhu, K.Y. and Douglas, A.E. (2013). Towards the elements of successful insect RNAi. Journal of Insect Physiology, 59: 1212–1221.
Thairu, M.W., Skidmore, I.H., Bansal, R.,
Nováková, E., Hansen, T.E., Li-Byarlay, H., Wickline, S.A. and Hansen, A.K. (2017). Efficacy of RNA interference knockdown using aerosolized short interfering RNAs bound to nanoparticles in three diverse aphid species. Insect Mol Biol., 26(3): 356-368.
Wang, K.X., Peng, Y.C., Pu, J., Fu, W.X., Wang,
J.L. and Han, Z.J. (2016). Variation in RNAi efficacy among insect species is attributable to dsRNA degradation in vivo. Insect Biochemistry & Molecular Biology, 77: 1-9.
Wang, M, Thomas, N. and Jin, H. (2017). Cross-
kingdom RNA trafficking and environmental RNAi for powerful innovative pre- and post-harvest plant protection. Curr Opin Plant Biol., 38:133-141.
Wood & Lass (1985) Cocoa. John Wiley & Sons,
New York. Wynant, N., Santos, D. and Vanden Broeck, J.
(2014). Biological mechanisms determining the success of RNA interference in insects. Int. Rev Cell Mol Biol., 312: 139-67.
Zhang, J., Khan, S.A., Heckel, D.G. and Bock, R.
(2017). Next-Generation Insect-Resistant Plants: RNAi-Mediated Crop Protection. Trends in Biotechnology, September 2017, 35( 9): 871-882.

Malaysian Cocoa Journal 2019, Vol. 11
145
OCHRATOXIN A AND AFLATOXIN REFERENCE MATERIAL FOR COCOA BEANS-PRELIMINARY STUDY
Suzannah S., Badrul H.Z., and Aznie A.A.
Analytical Services Laboratory, Cocoa Innovation & Technology Centre, Malaysian Cocoa Board, Lot PT 12621, Nilai Industrial Park, 71800 Nilai, Negeri Sembilan, Malaysia
Malaysian Cocoa J. 11: 145-153 (2019)
ABSTRACT - Ochratoxin A (OTA) and aflatoxin are toxic fungal metabolites which have been reported in cocoa beans and cocoa products. They are hepatoxic, teratogenic, mutagenic and carcinogenic. Aflatoxin has been classified by the International Agency for Research on Cancer (IARC) as carcinogen to human (Group 1) while OTA is classified as a possible human carcinogen (Group 2B). OTA is produced by a few species in the genera Aspergillus and Penicillium. In cocoa beans, studies have shown that only Aspergillus species, specifically A. carbonarius and A. niger agregate, with lower numbers of A. westerdijkiae, A. ochraceus and A. melleus are involved. Aflatoxin are produce by Aspergillus esp A. flavus. A. parasiticus and A. nomius. The most important aflatoxin in term of toxicity and occurance is aflatoxin B1. Mycotoxins are produced when favourable conditions of water activity, nutrition and temperature required for growth of fungi and mycotoxin biosynthesis are present. In the development of new analytical methods for mycotoxins, the analytical methods must be fully validated particulaly if they are to be used for control, monitoring and risk assessment studies. Thus, reference materials (RMs) or (CRMs), the materials containing a known or certified content of analyte(s) along with its uncertainty, are essential tools in achieving comparability and trueness of analytical data. Aside from that, the use of (CRMs) is a major requirement for an accreditation according to ISO/IEC 17025. This preliminary study aims to produce OTA and aflatoxin (B1, B2, G1 and G2) in cocoa in order to be developed as OTA and aflatoxin reference material. Two approaches to simulate fungal growth and mycotoxin production were investigated. The first and simpler approach involves storing dried cocoa beans at 90% RH and 40 deg C for 15 days. The second approach start with storage of cocoa pods which had been injured to promote fungal contamination. The cocoa beans underwent the normal fermentation and drying processes. Cocoa beans sampled at critical points were analysed for ochratoxin A and aflatoxin (B1, B2, G1 and G2) using a validated method. Key words: Aflatoxin, cocoa reference material, ochratoxin A INTRODUCTION Ochratoxin A (OTA) and aflatoxin are toxic fungal metabolites which have been reported in cocoa beans and cocoa products. They are hepatoxic, teratogenic, mutagenic and carcinogenic. Aflatoxin has been classified by the International Agency for Research on Cancer (IARC) as carcinogen to human (Group 1) while OTA is classified as a possible human carcinogen (Group 2B). OTA is produced by a few species in the genera Aspergillus and Penicillium. In cocoa beans, studies have shown that only Aspergillus species, specifically A. carbonarius and A. niger agregate, with lower numbers of A. westerdijkiae, A. ochraceus and A. melleus are involved. Aflatoxin are produce by Aspergillus especially A.
flavus. A. parasiticus and A. nomius. The most important aflatoxin in term of toxicity and occurance is aflatoxin B1. Mycotoxins are produced when favourable conditions of water activity, nutrition and temperature required for growth of fungi and mycotoxin biosynthesis are present.
Fungi contamination is possible at many critical points in the cocoa production chain. The cocoa beans are susceptible to fungal colonization during fermentation and drying. The critical moisture range is 6-8% which is equivalent to about 0.75-0.85 aw (Magan and Aldred, 2005). Cocoa beans are highly hygroscopic and will absorb moisture during storage and transport. Growth of fungi and production of mycotoxin is

Malaysian Cocoa Journal 2019, Vol. 11
146
possible above the critical moisture content. The mycotoxin are shown to reside mainly on the cocoa shell (Amezqueta et al., 2005 and Ochratoxin A and aflatoxins occurances have been reported in cocoa, cocoa powders and cocoa marketed products in different countries (Turcotte, Scott and Tague, 2013; Copetti et al., 2011).
Reference materials play a critical role in validating analytical methods and assessing accuracy and comparability of results among different laboratories and over time. A reference material is defined as a material, sufficiently homogeneous and stable with respect to one or more specified properties, which has been established to be fit for its intended use in a measurement process (ISO 17034).
The aim of this preliminary study is to identified a procedure to simulate the production of ochratoxin A and aflatoxins in cocoa and evaluate amount of mycotoxins produce. Informations gathers will be used to develop a reference material for ochratoxin A and aflatoxins in cocoa and later on, products such as cocoa liquor and chocolate. MATERIALS AND METHODS First approach Sampel Dried cocoa beans were obtained from Pusat Penyelidikan dan Pembangunan Koko Jengka.
Sample preparation 12 petri dishes containing crushed cocoa beans and 12 petri dishes containing whole cocoa beans were kept in an oven equipped with humidifier. The condition was set at 30⁰C and 90% humidity (Adhianata, Sardjono, Mahakarnchanakul and Setyabudi, 2017). Sampling were done on day 0, 5, 10 and 15. The cocoa beans were analysed for water activity, moisture content, pH and mycotoxin content.
Second approach Sample 150 cocoa pods were obtained from Pusat Penyelidikan dan Pembangunan Koko Jengka on 24 April 2019. All the cocoa pods were injured using a knife. The cocoa pods were separated into two heaps for pod storage treatment (A and B). At the end of pod storage the pods were opened and the cocoa beans fermented followed by sun-drying to obtain dry cocoa beans. At the end of all processes such as pod storage and fermentation some samples were collected and dried in the oven to represent the mycotoxin level at that process. Control sample is cocoa beans from fresh pod which were dried in oven. All cocoa beans samples were analysed for ochratoxin A and aflatoxin. Moisture content measurement Moisture content was analysed using moisture analyzer (Mettler-Toledo). 5 g sampel was heated at 105oC. Water activity measurement Water activity was analysed using a water activity analyzer (Aqualab Series 3, Decagon Devices Inc., USA). The equipment was calibrated daily with calibration solutions that covers the water activity of samples to be analysed. For example if the water activity of sample is 0.600, a calibration solution with water activity of 0.760±0.003 (6M NaCl) and solution with water activity of 0.500±0.003 (8.57M KCl). pH measurement 10 g of sample was mixed with 90ml hot boiling water. Stir and filter. Cool the filtrate and measure pH using pH meter (pH 2700, Eutech Instrument). Ochratoxin and aflatoxin analyses Samples homogenization Cocoa beans were ground roughly so that the greatest dimension of the particles does not exceed 1 mm, while avoiding the formation of paste.

Malaysian Cocoa Journal 2019, Vol. 11
147
Chemicals HPLC grade acetonitrile and reagent grade formic acid were obtained from Merck (Darmstadt, Germany) while reagent grade ammonium formate was obtained from Sigma-Aldrich (St. Louis, USA). Water was purified through an ElgaPurelab Option-Q system (High Wycombe, UK). MgSO4, C18, and primary secondary amine (PSA) were purchased from Agilent Technologies (Palo Alto, USA). Standard Ochratoxin A (OTA) and aflatoxin standards were purchased from Sigma-Aldrich (St. Louis, USA). OTA stock solution (100 mg L-1) was prepared in acetonitrile and kept at -20 °C in the dark. Intermediate standard solutions (1 mg L-1 and 0.05 mg L-1) were prepared by diluting an appropriate volume of individual stock standard solution in acetonitrile. Working solutions were prepared freshly by dilutions of the intermediate standard solution in acetonitrile and kept in scintillation vials at 4 °C in the refrigerator. Extraction and clean-up procedure After homogenization, 5 g of samples were weighed in a 50 mL screw cap centrifuge tubes and fortified with intermediate standard solution to give final spiking concentration of 2 and 5 μg/kg.
Deionised water was added and the mixtures were homogenised using a vortex mixer for 30 seconds and left to stand at room temperature for 15 minutes for matrix swelling (hydration). Then, 10 mL of acetonitrile (1 % acetic acid) was added to the samples. The tubes were shaken using SPEX SamplePrep 1500 ShaQer (New Jersey, USA) for 1 min at 1516 rpm. After that, 4 g MgSO4, 1 g NaCl, 1 g sodium citrate dihydrate, and 0.5 g sodium hydrogen citrate sesquihydrate were added and the mixtures were immediately shaken using 1500 ShaQer for 1 min at 1516 rpm, then
centrifuged at 12000 rpm for 5 min at 4 °C. After centrifugation at 12000 rpm for 5 min, an aliquot of 0.5 mL extract was filtered through 0.2 μm
PVDF filter into autosampler vial to give 0.5 g sample/mL final extract. The extracts was diluted two times with deionized water before injecting into LC-MS/MS. Liquid chromatography-quadrupole-time-of-flight mass spectrometry analysis LC-QTOF-MS analysis was performed using a WatersI-Class ultra performance liquid chromatography (UPLC) (Waters Corporation, Manchester, UK). It was equipped with a reversed-phase BEH C18 analytical column of 100 mm x 2.1 mm x 1.7 μm particle size (Waters
Corporation, Manchester, UK). The column oven temperature was set to 45 °C and the flow rate was 0.45ml/min. Mobile phase A and B were water and methanol each containing 5 mM ammonium acetate. The linear gradient programme was set as follows: 2% B was maintained for 0.1 min before increased to 99% B from 0.1-3 min, followed by 1 min elution time before re-equilibration back to 2% B for 3 min.The injection volume was 5 μL
with a run time of 7 min. The UHPLC system was coupled to a Vion IMS QTOF hybrid mass spectrometer from Waters, equipped with a Lock Spray ion source. The ion source was operated in positive electrospray ionization (ESI) mode under the following specific conditions: capillary voltage, 0.45 kV; reference capillary voltage, 3.00 kV; source temperature, 120 °C; desolvation gas temperature, 550 °C; desolvation gas flow, 800 L/h, and cone gas flow, 50 L/h. Nitrogen (>99.5%) was employed as desolvation and cone gas. Data were acquired in high-definition MSE (HDMSE) mode in the range m/z 50 - 1500 at 0.1 s/scan for initial scanning and TOF-MRM mode for quantitation purpose. Argon (99.999%) was used as collision-induced-dissociation (CID) gas.

Malaysian Cocoa Journal 2019, Vol. 11
148
Figure 1. Flowchart of mycotoxin extraction

Malaysian Cocoa Journal 2019, Vol. 11
149
RESULTS AND DISCUSSION
First approach Storage of whole cocoa beans and crushed cocoa beans increases both moisture content and water
activity. pH also showed increasing trend as storage time increases (Table 1).
Table 1. Water activity, moisture content and pH of whole cocoa beans and crushed
cocoa beans following storage for 0, 5, 10 and 15 day at 30⁰C and 90% RH. Storage duration
Sample Water activity, aw Moisture content pH
Day 0 Whole cocoa beans 0.618 2.24 5.24 Crushed cocoa
beans 0.618 7.31 -
Day 5 Whole cocoa beans 0.889 16.17 5.39 Crushed cocoa
beans 0.930 21.31 5.46
Day 10 Whole cocoa beans 0.774 14.78 5.79 Crushed cocoa
beans 0.886 18.11 5.85
Day 15 Whole cocoa beans 0.869 15.30 6.28 Crushed cocoa
beans 0.870 14.74 6.31
On day 5, the appearance of the samples is normal however the whole cocoa beans feels considerably less dry. Small growth of white moulds can be seen on the surface of some of the whole cocoa beans. After 10 days, a lot more molds can be seen. Most of the moulds are white. Some green moulds can be seen. More molds are observed on whole cocoa beans compared to crushed cocoa beans (Figure 2). Mycotoxin analyses for all samples of whole cocoa beans and crushed cocoa beans did not detect any ochratoxin A or aflatoxins. This may be due to absence of fungi which is capable of producing ochratoxin A and aflatoxins. Kaokeng, Mahakarnchanakul, Maneeboon, Chuaysrinule and Vagnai (2014) failed to obtained ochratoxin A from several culture including Aspergillus ochraceus grown on maize and rice with 20%, 30% and 40% moisture content after storage for 7 and 14 days. All the fungi showed excellent
mycelium productions. Only Aspergillus alliaceus produces ochratoxin A in both maize and rice at both 7 days (250-400ng/g) and 14 days (300-500 ng/g) treatment. This approach of simulating the occurance of mycotoxin in cocoa beans was inspired by Adhianata et al., (2017). In their study the initial cocoa beans used is already contaminated with ochratoxin A (~ 8ppb) and aflatoxin (~ 5ppb). After storage for 15 days the OTA level showed slight increase while aflatoxin level showed an increase at day 5 however after 10 and 15 days storage, the aflatoxins level reduces to below the initial level. Adhianata el al. (2017) suggest that fermentation by-product such as acetic acid may inhibit the growth of OTA producing fungi such as A. carbonariu and A. niger subsequently reduces the OTA production. Acetic acid may also detoxify by changing aflatoxin B1 into aflatoxin D which is less toxic.

Malaysian Cocoa Journal 2019, Vol. 11
150
Day 5- Whole
cocoa beans
Day 5-Crushed
cocoa beans
Day 10-Whole
cocoa beans
Day 10-Crushed
cocoa beans
Day 15- Whole ocoa
beans
Day 15-Crushed
cocoa beans
Figure 2. Pictures of whole cocoa beans and crushed cocoa beans at the end 5, 10 and 15 days storage at 30⁰C and 90% RH.

Malaysian Cocoa Journal 2019, Vol. 11
151
Second approach The second approach taken to produce cocoa beans contaminated with ochratoxin A and aflatoxin was successful in producing ochratoxin A and four types of aflatoxin in all the step during cocoa processings. Injured cocoa pods were colonized by fungi following pod storage. The fungi were able to colonise the whole cocoa pod through the opening in the cocoa pods (Figure 3).The slit on the cocoa pods ensure fungal penetration and proliferation inside the cocoa pods and
consequently formation of ochratoxin and aflatoxins.
However storing injured cocoa pods for long duration caused a lot of cocoa beans to germinate cause cocoa beans to spoil (Figure 4). In a similar study where 500 cocoa pods including 250 cocoa pods injured with deep slits were left in open air for 7 days followed by 4 days cocoa beans fermentation and 7 days sun-drying produced dry cocoa beans with average level of 22.9±3.6 μg/kg ochratoxin A (Manda et al., 2009).
Figure 3. Pictures of injured cocoa pods and the cocoa beans inside after pod storage.
Figure 4. Pictures of germinated cocoa beans after storing injured cocoa pods.

Malaysian Cocoa Journal 2019, Vol. 11
152
Figure 5 showed the mycotoxin level in the various treatments. Processes such as storing of injured cocoa pods, fermentation and drying affect the ochratoxin A and aflatoxins level. Oven dried fresh cocoa beans did not have any ochratoxin A and aflatoxin G1, however low level of aflatoxin B1, B2, and G1 was detected). Ocratoxin A level was observed to decrease after fermentation. This is similar for aflatoxin G1 and G2. For aflatoxin B1 and B2 the toxin level increases at the end of fermentation. Sun drying was found to significantly increase Ochratoxin A level but had no similar effect on all types of aflatoxins. Mounjouenpou et al. (2008) showed that wounded cocoa pod after storing for 10 days were contaminated with ochratoxin A with high level 12.14, 22.20 and 48.01 ng/g during beginning of season, mid season and end of season respectively. However this level showed a reduction after fermentation and drying process (1.01 to 5.40 ng/g).
This study gave some indications on the procedure and the amount of ochratoxin A and aflatoxins (B1, B2, G1 and G1) that were produced. The amount of mycotoxins produced is very high in some instances for example reaching about 180 ppb. Although mycotoxin can be obtained from stored cocoa pods, the best reference material should contain very similar composition to the normal cocoa beans. This means that the reference material should undergo fermentation and drying processes. The mycotoxin levels should be tailored so that the levels are within normal occurrence levels so that laboratory testing is more valid. Reference materials for semi-finished products such as cocoa liquor can be produced from the cocoa beans produced here. However mycotoxin levels will be lower since almost 93% of mycotoxin for example ochratoxin A was reported to occur on the cocoa shell (Manda et al., 2009).
Figure 5. Ochratoxin A and aflatoxins content in cocoa beans at the end of processes

Malaysian Cocoa Journal 2019, Vol. 11
153
REFERENCES Adhianata, H., Sardjono, Mahakarnchanakul, W.
and Setyabudi, E.M.C.S. (2017). The susceptibility simulation of ochratoxin A and aflatoxin contamination on fermented and unfermented cocoa beans in high storage humidity. Indonesian Food and Nutrition Progress, 14(2): 108-117.
Amezqueta, S., Gonzalez-Penas, M., Murillo,
M., Lopez de Cerain, A. (2005). Occurrence of ochratoxin A in cocoa beans: effect of shelling. Food Additives and Contaminants, 22: 590–
596. Copetti, M.V., Iamanaka, B.T., Pereira, J.L.,
Fungaro, M.H. and Taniwaki, M.H. (2009). Aflatoxigenic fungi and aflatoxin in cocoa. International Journal of Food Microbiology, 148:141-144.
Hasan, H.A.H. (1999). Role of caffeine and
tannin in anti-toxigenic properties of coffee and tea. Cryptogamie Mycologie, 20 (1): 17–21.
International Standards Organization (ISO)
(2016) General requirements for competence of reference material producers. ISO Guide 17034.
Kaokaeng, S., Mahakarnchanakul, W.,
Maneeboon, T., Chuaysrinule, C. and Vangnai, K.. (2014). The optimized condition of Ochratoxin A production for reference material production. Proceeding of 2nd AFSSA Conference on Food Safety and Food Security. August 15-17, 2014. Asian Food Safety and Security Association. ISSN: 2306-2150.
Magan, N. and Aldred, D. (2005). Conditions of
formation of ochratoxin A in drying, transport and in different commodities. Food Additives and Contaminants, 22: 10–16.
Manda, Pierre, Dano, Djédjé Sébastien,
Kouadio, James Halbin, Diakité,
Aïssata, Sangaré-Tigori, Béatrice, Ezoulin.
Miezan Jean Marc, Soumahoro, Awa, Dembele,
Ardjouma and Fourny, Gérard. (2009). Impact of industrial treatments on ochratoxin A content in artificially contaminated cocoa beans. Food Additives & Contaminants: Part A. 26(7): 1081-1088.
Mounjouenpou, P., Gueule, D., Fontana-Tachon,
A., Guyot, B., Tondje, P.R. and Guiraud, J.P. (2008) Filamentous fungi producing Ochratoxin A during cocoa processing in Cameroon, International Journal of Food Microbiology, 121: 234-241.
Turcotte, A.M, Scott, P.M. and Tague, B.
(2013). Analysis of cocoa products for ochratoxin A and aflatoxins. Mycotoxin Res., 29:193-201.

Malaysian Cocoa Journal 2019, Vol. 11
154
PRELIMINARY STUDY ON VACUUM ROASTING AND EFFECTS TO THE MALAYSIAN COCOA FLAVOUR CHARACTERISTICS
Rahmat Mohamed1, Wan Aida Wan Mustapha2 & Noor Farizah Dzulkifli1
1Malaysian Cocoa Board, Cocoa Innovative and Technology Centre, PT 12621 Nilai Industrial Area, 71800 Nilai, Negeri Sembilan, Malaysia
2School of Chemical Sciences and Food Technology, Faculty of Science and Technology, Universti Kebangsaan Malaysia, 43600 Bangi, Selangor, Malaysia
Corresponding author: [email protected]
Malaysian Cocoa J. 11: 154-159 (2019) ABSTRACT - An alternative roasting technique using a combination of cocoa nibs pretreatment, vacuum and heating was developed in a labscale at Cocoa Innovation Technology Centre (CITC), Nilai. Preliminary study using Ghanaian cocoa suggested that 1 mm particle size of cocoa nibs, treated with 40% water and vacuum dried at 72 mbar followed by roasting at 140oC for 45 min could improved the sensory characteristics of cocoa flavour. This technique was applied to Malaysian cocoa nibs and sensory result shows that the overall acceptance and sourness attributes were insignificant (p>0.05) compared to Ghanaian samples. A significant reduction (p<0.05) of sour attribute was noted as well as the organic acid content of lactic and acetic acid. Lactic acid and acetic acid were reduced by 17.6% and 23.70% respectively. Key words: Cocoa nibs, vacuum, roasting, sensory, acidity INTRODUCTION
Bean blending is a normal practice applied in the cocoa grinding or manufacturing process for several reasons such as to obtain specific taste and availabilities of specific types of beans in specific quantities at times. These unpredictable variables have prompted the manufacturer to put more emphasis on processing, specifically roasting and alkalization, which are two key processing steps that can assure consistency of the quality especially on flavour. The alkalization process is to neutralize the acidity of the cocoa beans and remove astringent flavour notes, develop specific colour through the reaction between cocoa pigment with alkali in the presence of air and heat, and to promote flavour development by promoting reaction between flavour pre-cursors (peptide or protein compound and reducing sugars) present in the cocoa beans. Besides influencing colour and flavour, alkalization has other effects such increase of the pH. The alkalization process will neutralizes the normal cocoa acidity and raise the pH from normal pH range 5 to 5.6 into the 7 to 8. Normally, it is carried out by treating cocoa nibs, or cocoa mass or cocoa solids with a solution of water and
alkali, first heating and drying the cocoa beans to the proper working moisture. In actual practice, the cocoa to be alkalized is first heated in a closed container or mixing vessel, warm alkali solution is added, reaction time is allowed and then the excess moisture is driven off by heating or drying. The end product of alkalizing process will be cocoa solids with a higher pH and darker color than in the natural state. The degree of change is controlled by several parameters such as the type and strength of the alkali, moisture level of reaction, duration and temperature of the reaction. However, since the alkalizing agents are a chemical additives and it uses in food products may give a health effects to consumer as far as food safety are concerns. The Food Drug Administration (FDA) of USA Code of regulations (Anon, 2014) described that the alkalis permitted for processing cocoa are limited to bicarbonate, carbonate or hydroxide of sodium, ammonium or potassium, or carbonate or oxide of magnesium. The most commonly alkali used in cocoa processing are potassium carbonate, ammonium bicarbonate and sodium hydroxide. The Code defines the permissible usage levels of alkalis by
Malaysian Cocoa Journal 2019, Vol. 11
155
limiting them to the neutralization value of 3 parts anhydrous potassium carbonate to 100 parts of cocoa nibs (a maximum of 3 kg of any permitted alkalizing agent per 100 kg nib). E.U Regulation permitted a maximum of 5 kg sodium carbonate (or an equivalent quantity of another permitted alkalizing agent) per 100 kg fat free dry matter. Furthermore, the quantity of alkali used is also limited by the national food laws. This is expressed in limits for the ash content and the alkalinity of the ash for alkalized cocoa powder. However, this limits is vary between country to country, for example the ash content for alkalised cocoa powder produced in Malaysia (Anon 2010), Iran, Ghana, India are set at 12.5%, 9%, 8.20-9.50% and 12% respectively. The excessive uses of alkalizing agent especially in producing unique or different colour of cocoa powder will give a problem to the manufacturer to comply with the requirements. In some extent, the products could be rejected at the entrance point by the national authority. As a Malaysia perspective, alkalized cocoa powder is the one of cocoa product that contributed significantly to the national GDP and well accepted worldwide in chocolate and confectionaries industry. However, with the stringent level of ash content imposed by importing country will give bad impact to export earning of Malaysian. Consequently, the overall objective of this study is to develop a new processing approach that can enhance Malaysian cocoa flavour quality by eliminating alkalization stage. The objective was evaluated based on the organic acids content and sensory characteristics.
MATERIALS AND METHODS Dried cocoa beans samples In this study, dried and fermented cocoa beans originating from Ghana and Malaysia were used. Ghanaian cocoa beans was selected which considered as premium and preferences cocoa beans in terms of it’s flavor quality. Ghanaian
commercial cocoa bean was obtained from Guan Chong Cocoa Manufacturer Sdn. Bhd, Johor Baharu. Sample was collected in two different batches with 25 kg samples for each batch, were mixed in the lab and then divided into 3 replicates for the purpose of this study. While Malaysian cocoa beans was obtained from Malaysian Cocoa Board (MCB’s)
Research and Development Station, Jengka, Pahang. The dried cocoa beans are derived from wet cocoa beans that have undergone a 5-day fermentation accordance to normal practiced in Malaysia. At the end of fermentation, the beans were sun dried before taken for this study and subsequently divided into 3 replicates. Reagents and materials Certified Reference Material (CRM) lactic acid, citric acid and acetic acid were purchased from Dr. Ehrenstorfer GmbH, Germany. Roasting apparatus Buchi's Vacuum Distillation Unit, Model R-250V Diagonal Condenser was used as a roaster which capable to perform heating, stirring, distillation and vacuum. In addition, the unit also equipped with a solvent inlet. The diagram is shown in Figure 1.1 with some modifications whereby the aluminum stirrer rod was mounted inside the diagonal condenser (No.1) to function as a stirrer during the system running.

Malaysian Cocoa Journal 2019, Vol. 11
156
Figure 1.1. The Rotary Evaporator, Buchi R-250V as a roaster unit.
The apparatus consisting of several components which were described as follow; 1 : diagonal condenser 2 : oilbath operating at 90oC and 140oC 3 : vacuum pump operating at 72 mbar 4 : refrigerated circulating waterbath 5 : 500 mL round bottom flask 6 : 500 mL condensation flask Pretreatments and roasting Dried cocoa beans samples were initially pre-heated in Memmert convection oven at 104 ± 0.5oC for 15 min. Then, samples were cooled and broke using Winnower Breaker (John Gordon, UK) to separate the nib and testa. The extracted cocoa nib was ground using the Waring blender and filtered using Retsch AS200 vibrating filtration tool, at amplitude 40 to obtain cocoa nib with <1.0 mm particle size. A 250 g cocoa sample was pre-treated and mixed with distilled water 40% (100 mL). The mixing was carried out in round bottom flask (5) which mounted at the distillation unit. The moisten sample was mixed by means of rotating blade for 30 min. before heated at 90oC using oilbath reservoir. During heating, the 72-mbar vacuum pressure was applied to allow the
distillation process to occur. The vacuum was terminated once the amount of water added at the iniatial stage was completely removed or distilled (based on the optimization stage, it’s will take 5
hours to remove or distilled out 40% water). Next, the temperature of the oilbath heater is adjusted to 140oC for 45 minutes for roasting. The selection of roasting temperatures is based on previous studies (Krysiak & Motyl-Patelska, 2006; Krysiak, 2006; Krysiak et al., 2013). Once roasting process completed and sample was cooled, then the sample mixture was taken for liquor preparation using Labscale Mortar Pestle Concher. The cocoa liquor sample was then used for organic acids analysis and sensory analysis. Determination of organic acids content Analysis of citric, lactic and acetic acid was carried out according to the method described by

Malaysian Cocoa Journal 2019, Vol. 11
157
Tomlins et al. (1990) using HPLC system (Shimadzu, Japan) with UV-Vis detector at 210 nm, and Aminex HPX-87H cation-exchange column (7.8mm x 300mm, Bio-rad Laboratories, UK) controlled at 45oC. A 20μl of sample aqueous extracts was introduced via autosampler into mobile phase of 0.004M sulfuric acid H2SO4 set at isocratic flow rate 0.6 ml/min. with acquisition time was about 25 min. Quantitative values were obtained by relating chromatographic peak areas to those derived from externally run calibration standards ranging from 250 – 5000 ppm and the concentration of each organic acid was calculated using equation below.
Organic acid (ppm) = R x DF,
where R is reading from the standard curve; and DF is dilution factor Sensory analysis The sensory evaluation of cocoa liquor samples were conducted by trained panelists of Sensory Laboratory of Malaysian Cocoa Board (MCB), using a Quantitative Descriptive Analysis (QDA) method (Aminah, 2000). Cocoa liquor samples were given a score on a 0-10 scale for attributes of cocoa taste, astringent, bitter, sourness/acidity and overall acceptability. Sensory panelist were assessed the intensity of each attributes based on agreed value of reference cocoa liquor. RESULTS AND DISCUSSION Effect of pretreatments on organic acids content The quantitative results of citric acid, lactic acid and acetic acid are presented in Table 1.1. The amount of organic acids content in both Malaysian and Ghanaian dried cocoa nibs (MS-O and GS-O) were significantly different (p<0.05). The concentration of citric acid was found higher in Ghanaian dried cocoa nibs compared to Malaysian sample. However, Malaysian dried cocoa nibs contains higher amount of lactic acid and acetic acid by 5.1% and 11% respectively compared to Ghanaian beans. After vacuum roasting process, the organic acids content in both samples were decreased tremendously in both samples. The result shown in Table 1.1 indicates that the citric,
lactic and acetic acid content in Ghanaian roasted sample (GS-1) was reduced 48.1%, 22.45% and 32.7% respectively. Similar reducing trend was also observed for Malaysian roasted sample (MS-1) whereby the citric, lactic and acetic was reduced by 15.5%, 17.6% and 23.7%. Meanwhile, statistical result also indicates there was a significant difference (p<0.05) of lactic acid and acetic acid content between Malaysian cocoa nib vacuum roasted sample (MS-1) and control sample (MS-Oven). Result shows that the pre-treatment technique of Malaysian cocoa nib with 40% water, followed by vacuum roasting was able to remove organic acids especially acetic acid in Malaysian cocoa nib sample (MS-1) effectively compared to the oven roasting method or control sample (MS-Oven). Effect of pre treatments on flavour characteristics of Malaysian and Ghanaian cocoa liquor Table 1.2 shows the score obtained from the sensory evaluation of cocoa liquor samples involved in this study. All attributes related to flavour characteristics were successfully evaluated by trained panels. Ghanaian cocoa nibs sample (GS-1) score significantly higher (p<0.05) or more intense in cocoa characteristics compared to Malaysian cocoa nibs sample (MS-1) and MS-Oven (control). No significant different (p>0.05) also been observed between vacuum roasting of Malaysian sample and control sample (MS-Oven). Bitter attribute was found most intense significantly (p<0.05) for Malaysian pre treated sample (MS-1) compared GS-1. However, the astringent characteristic taste were found not significant different between samples. According to Stark (2006), the flavonoids compounds responsible to the astringency notes are flavonoids glycoside, γ-aminobutyric acid and α-aminobutyric acid. Stark (2006) suggested that cocoa bitter flavors were caused by alkaloid such as diketopiprazin, L-amino acid or peptides. Whereas Kongor et al. (2016), mentioned that other compounds such as polyphenolic compounds (tannins and flavanol) contribute to bitter-astringent sensation.

Malaysian Cocoa Journal 2019, Vol. 11
158
Table 1.1. Organic acids content of Malaysian and Ghanian dried cocoa nib sample (MS-O and GS-O),
pretreated samples (MS-1 and GS-1 : nib size <1mm, pretreatment 40% water, vacuum roasting) and Control sample (MS-Oven).
Sample
Organic acids content (x103 ± sd , ppm)
Citric acid Lactic acid Acetic acid
Ghanaian dried cocoa nib (GS-O)
25.53 a (±1.04) 13.45 b (±0.09) 3.92 b (±0.17)
Malaysian dried cocoa nib (MS-O)
21.74 b (±0.14) 14.14 a (±0.24) 4.35 a (±0.15)
Malaysian bean vacuum roasting (MS-1)
18.37 c (±0.90) 11.65 c (±0.02) 3.32 c (±0.10)
Ghanaian bean vacuum roasting (GS-1)
13.26 d (±0.58) 10.43 d (±0.40) 2.64 d (±0.04)
Malaysian beans oven roasting (MS-Oven)
17.88 c (±1.37) 13.88 a,b (±0.30) 3.80 b (±0.04)
a - d : Mean value with same alphabet in same column indicates no significant difference at p>0.05 (n=3)
Table 1.2. Organoleptic profile (score ± s.d) of Malaysian cocoa nib sample (MS-1: nib size <1mm, pretreatment 40% water, vacuum roasting), Control sample (MS-Oven) and Ghanaian cocoa nib (GS-1: nib size <1mm, pretreatment 40% water, vacuum roasting).
Acidity/sourness attribute was found less intense in both sample GS-1 and MS-1 and insignificant difference (p>0.05). However, the
sourness taste was quite significant difference (p<0.05) compared to MS-Oven (control). This clearly indicates that the pre treatment technique
Sample
Cocoa Bitter Astringent Acidic/sour Overall
acceptance
Malaysian beans Oven roasting (MS-Oven)
4.6 ± 1.0 b 3.9 ± 0.6 a,b 4.3 ± 0.8 a 2.8 ± 0.8 a 4.3 ± 1.0 b
Malaysian bean vacuum roasting (MS-1)
4.8 ± 0.7 b 4.6 ± 1.0 a 4.3 ± 0.8 a 2.1 ± 0.8 b 4.6 ± 1.1 a,b
Ghanaian bean vacuum roasting (GS-1)
5.8 ± 1.1 a 3.8 ± 1.0 b 3.8 ± 0.7 a 2.0 ± 0.8 b 5.6 ± 1.2 a
a – b : Mean value with same alphabet in same column indicates no
significant difference at p>0.05 (n=17)

Malaysian Cocoa Journal 2019, Vol. 11
159
could improve the quality of Malaysian cocoa flavour. Result also shows a very good relationship with the overall acceptance which the Malaysian cocoa nibs sample (MS-1) do not significant differences (p>0.05) compared to the Ghanaian cocoa sample (GS-1). Overall, sensory results demonstrate that the Ghanaian cocoa nib (GS-1) carries good flavour characteristics, followed by the treated Malaysian cocoa sample (MS-1) sample as the second option and then the control sample (MS-Oven). Besides that, this study found that MS-1 samples get better score for Overall Acceptance than Control samples (MS-Oven). CONCLUSIONS In conclusion, the entire cocoa nib pre-treatments; cocoa nib size not exceeding 1mm (<1mm) mixed with 40% distilled water in airtight flask, then re-dried by vacuum distillation at 90oC followed by roasting at 140oC for 45 min. The alternative roasting method developed was adapted to Malaysian cocoa nibs, and the sensory assessment demonstrate better organoleptics characteristic especially on overall acceptance and low in sourness taste. The organoleptics profile of Malaysian cocoa nibs roasted using this develop technique also improved positively and closer to Ghanaian flavor profile. Organic acids, especially lactic acid and acetic acid were significantly reduced during roasting. Additionally, both of these organic acids could potentially be significant markers to determine the overall sensory acceptability of cocoa liquor and chocolate in specific. ACKNOWLEDGEMENT The authors would like to thank the Malaysian Cocoa Board (MCB) for financially supporting this work under Temporary Research Fund (TRF L15282) and the Director of Cocoa Downstream Technology for her guidance and permission to publish this paper. The authors are also highly indebted to staffs of Analytical Services Laboratory, CITC Nilai for the valuable assistance.
REFERENCES Aminah, A. (2010). Panduan Makmal Penilaian
Sensori. Bangi: Penerbit Universiti Kebangsaan Malaysia.
Anon. (2010). Cocoa and Cocoa Products in Malaysia Food Acts 1983 and Regulations. hlm. 180-183. International Book Services, Selangor.
Anon (2014). Code of Federal Regulations Title 21. Vol. Part 163: Cacao Products. United States. Food and Drug Administration. Department of Human Health and Services.USA
Kongor, J.E., Hinneh, M., Davy Van deWalle, D.V., Afoakwa, O.E., Boeckx, P. & Koen Dewettinck, K. (2016). Factors influencing quality variation in cocoa (Theobroma cacao) bean flavour profile — A review. Food Research International, 82: 44–52.
Krysiak, W. (2006). Influence of roasting conditions on coloration of roasted cocoa beans. Journal of Food Engineering., 77: 449–453.
Krysiak, W. & Motyl-Patelska, L. (2006). Effects of air parametrers on changes in temperature inside roasted cocoa beans. Acta Agrophysica, 7(1): 113–128.
Krysiak, W., Adamski, R. & Żyżelewicz, D.
(2013). Factors affecting the color of roasted cocoa bean. Journal of Food Quality, 36(1): 21-31.
Stark, T., Bareuther, S. & Hofmann, T. (2006). Molecular definition of the taste of roasted cocoa nibs (Theobroma cacao) by means of quantitative studies and sensory experiments. Journal of Agricultural and Food Chemistry, 54(15): 5530-5539.
Tomlins, K.I., Baker, D.M. & McDowell, I.J. (1990). HPLC Method for the analysis of organic acids, sugars, and alcohol in extracts of fermenting cocoa beans. Chromatograpia, 29: 11-12.

Malaysian Cocoa Journal 2019, Vol. 11
160
COMPARISON BETWEEN INFRARED AND MICROWAVE MICRONIZING OF WET FERMENTED COCOA BEANS
Hidayatullah, H.
Cocoa Research and Development Centre, Bagan Datuk, Perak Darul Riduan
Malaysian Cocoa J. 11: 160–168 (2019) ABSTRACT - The process of micronizing is conducted at the cocoa grinding factories as one of the processing steps before the production of semi-finished products. Typically, the process was known as pre-heat treatment to loosen the shells in order to separate the shells from the nibs. This study was conducted to assess the effectiveness of wet beans micronizing using two different method, i.e; infra-red and microwave. The results shows that both treatment were able to reduce the moisture content of the nibs significantly. The trend of moisture reduction in infrared was less rapid compared to domestic microwave. The reduction of nib moisture was more significant at around 30% wet beans moisture in both treatment. Similar effect of drastic moisture loss was observed when the wet beans were treated with different temperature in infrared and different microwave intensity in domestic microwave. The nibs moisture content was found less than 5%, when the initial wet beans moisture was 16% in the infrared and 12% in the domestic microwave. The nibs experienced a drastic moisture loss in domestic microwave beginning at 31% initial wet beans moisture, with the power intensity set to high power mode. Similarly, the present of un-retrieved beans, as an indication of effective separation was found in higher percentage if the condition of the initial wet beans was moist and the heating intensity was low. The amount of un-retrieved beans was almost un-detectable in both the infra-red and microwave if the initial wet beans condition was 23% or less. Comparing between this two treatments, it can be concluded that the effect of domestic microwave was more pronounce in reducing the nib final moisture. In the domestic microwave, if the target nibs final moisture is less than 5%, than the option to work with high initial wet beans moisture is available in 31%, 21% and 12%, combine with three microwave power intensity. This works shows the potential of integrating the primary processing with factory secondary processing in order to reduce the cocoa processing steps. Key words: Infrared, microwave, micronizing, separation efficiency INTRODUCTION After harvesting, the cocoa pods were broken and its seeds were collected to undergo fermentation process. Between 5 to 7 days were required in order to optimize the fermentation process. Immediately after fermentation, the beans must be dry without further delay, failing which can cause the beans to decay. Cocoa bean processing required the use of thermal pre-treatment process in achieving effective separation of the shells from nibs. This involves giving the beans a thermal shock by hot air, steam or infra-red heat (Beckett, 2009). The second requirement of heat treatment occurred at factory level, where dried beans were cleaned and processed using sophisticated machinery. The dried beans were then subjected to short time high temperature treatment and the process is known as micronizing. This process involves giving the dried beans a thermal shock by hot air, steam or infrared. The method consists of
treating the beans with infrared radiation for a period between two to three minutes, during which time the beans are typically heated to a temperature of about 165°C which can caused the shells to dry rapidly and separate from the cocoa nib. Others have reported much less exposure time and less prevailing temperatures (Kelly, 2000). The micronizing treatment is to ensure an effective separation of the shells and the nibs besides reducing the nib moisture contents.
The usage of microwaves as a means for heating and subsequently drying in foods and agricultural products are slowly gaining acceptance (Azadbakht, 2015; Bouraoui et al., 1993; Vadivambal and Jayas, 2007). Microwave energy has advantage in relation to conventional heating methods, which include time and energy saving, since the microwave penetrate the products and generate heat intensely, considerably reducing processing time

Malaysian Cocoa Journal 2019, Vol. 11
161
(Metaxas, 1991). The use of microwave in cocoa drying was scarce, however a study on microwave cocoa drying showed promising results with improved quality and quick drying (Firihu and Sudiana, 2016). This study explain the comparison between infrared and microwave micronizing by accessing the effectiveness in the shell and nibs percentage. The distinct different is that it uses wet beans instead of dry beans as a materials source. Different stage of wet beans conditioned were tested and the effectiveness between infrared and microwave micronizer were compared. This study uses a domestic microwave oven and infrared in manipulating the drying process by treating the drying of wet beans as micronizing process. The variable parameters used to measure the effectiveness were different levels of initial wet beans moisture contents and different microwave power levels. For infrared, temperature were use as one of the parameters. The finished products from this process were assessed by the quality parameters such as beans separation efficiency, nibs moisture content and nibs final temperature. MATERIALS AND METHODS Sample preparation Fresh fermented beans were obtained from Stesen Penyelidikan dan Pembangunan Koko Jengka Pahang. The samples were stored in a chiller (-30oC) before used. Initial moisture content of the sample was determined immediately using AOAC (2000) method. The five different moisture conditions that were used as a treatment in this study was prepared by drying the sample in the convection laboratory oven (Memmert) from initial moisture to the desired moisture content by monitoring the weight changes. Infrared micronizer A pilot plant scale rotary drum micronizer (G.W. Barth GmbH) was used to conduct the micronizing procedure. The micronizer contains six units of electrically heated infra-red radiator arranged along the circular drum. The unit has a capacity of 100 to 120 kg dry beans per hour and the temperature range was from 90 to 250oC. In its normal operating condition, the temperature was usually set at 150 to 160 o C for 3 minutes.
The drum speed can be adjusted to roll from 5 to 15 revolutions per minutes. For this study, three temperature setting was selected with a single speed of drum rotation. The temperature was 180, 200 and 220 oC and the drum rotation was set constant at 10 rpm. The total time the samples being exposed to the infrared was considered to be equivalent to the time taken by the beans to travelled along the drum micronizer from inlet to outlet point, which was six minutes. Immediately at the outlet point, the micronized beans passed through the vibrating trough and collected for breaking. For each test 200gm of beans were used as sample and the experiments were conducted in triplicates and the average value was reported. The control experiments were conducted using dried beans with 7.5% (wb) moisture and 165 oC infrared temperatures for three minutes. Domestic microwave oven A domestic microwave oven brand National Panasonic with model number NNC867BV was used in this experiment. The microwave power based on the technical specification was rated at 850 Watts. The microwave power level can be selected from the pre-setting mode at high, medium and low power. The specification also stated that the microwave power level at each pre-set power mode utilized 100%, 55% and 10% microwave irradiation for high, medium and low respectively. The oven has a cavity size of 375mm (W) x 201 mm (H) x 386 mm (D) equipped with glass rotating pan measuring 350 mm diameter. The cavity volume was 29 liters. Earlier studies have indicated that wet cocoa beans can be dried using a microwave oven with on and off cycle pattern of 4x5x3 minutes (Oven and Ing, 1990). The pattern means that four time of five minutes on followed by three minutes off. In this experiment, the same pattern was used. In each test, 200 gm of beans was used by placing it on four petri dish arranged in a circular pattern surrounding the rotating plate. One of the petri dish was designated as a constant weight marker where weight loss during drying was measured using an analytical balance. The weight loss was recorded at the end of every on cycle. Shortly after the cycle completed, the beans were subjected to breaking and winnowing process. The control experiments were conducted using dried beans with 7.5% (wb) moisture and 165 oC infrared temperatures for three minutes.

Malaysian Cocoa Journal 2019, Vol. 11
162
Breaking and winnowing procedure Breaking The breaking of the micronized beans was conducted immediately after the micronizing process. A laboratory size electric motor driven impact breaker (John Gordon & Co. UK) was used to break the micronized beans. The breaker has rotating disc which turn clockwise and the beans were compressed against a static disc. The gap between the static and the rotating disc can be adjusted by turning a knob. Vibratory Sieve shaker The broken fragment of beans, which consists of various sizes of nibs and the shell mixture was homogenized using vibratory sieve shaker Retsch AS200 (Retsch, UK). The sieve shaker was programmed to run on 2 mm amplitude with 14 second intervals for 1 minute. Three different mesh sizes of sieve shaker were used. There were 4 mm, 2 mm and 1mm. The mixture of shells and nibs at each sieve size were kept separately for winnowing. Winnowing The homogenized mixture of nibs and shells was winnowed using laboratory winnower (John Gordon & Co. UK). The winnower separates the nibs from the shells by aspiration. The effectiveness of the separation depends on the apparent density of the nibs and shells. Once the machine has been set into motion the mixture of nibs and shell material was fed gently into the hopper. Nibs were discharged at the outlet below the hopper, whilst shells were discharged from a separate outlet. The aspiration velocity can be adjusted according to the particle size of the mixture in order to get clean nibs and clean shells. Any present of nibs in the cleaned shell was considered as wastage, while the presence of shell in the cleaned nibs was considered as a contamination. A total of three cycles of winnowing was conducted at each separation for better result. The separation efficiency The effectiveness of the separation process was determined using equation (1) and (2). While the amount of beans which were unbroken and failed to be separated was determined as a percentage of non-retrieved beans (U%) using equation (3).
The percentage of shells in nibs (SiN%)
= (1)
where is the weight of the fraction of shells in gm found in the clean nibs and
Is the weight of clean nibs at 4 mm, 2 mm and 1mm mesh size respectively. The percentage of nibs in shells (NiS%)
= (2)
where is the weight of the fraction of nibs in gm found in the clean shells and is the weight of clean shells at 4 mm, 2 mm and 1mm mesh size respectively. The percentage of unbroken beans (U%)
= (3)
where is the total weight of unbroken beans in gm. and was calculated using equation (4) and (5).
) (4)
(5) The percentage of the un-retrieved bean parameter was formulated to assess the performance of the separation efficiency in this study. This parameter was required in order to cater for the amount of beans, which failed to break and appeared as whole or partial broken beans. Moisture content determination Moisture content determination of the wet beans sample and the nibs final moisture content was determined using the Association of Analytical Communities (AOAC, 2000) method. Moisture content of cocoa beans and cocoa nibs can be defined as the loss in mass determined after drying of crushed cocoa beans for 16 hours in an oven controlled at 103C to 105C and expressed as percentage by mass. The moisture content was calculated using equation (6).

Malaysian Cocoa Journal 2019, Vol. 11
163
(6) where;
= weight of wet sample, gm = weight of dried sample, gm
Statistical analysis The analysis of variance (ANOVA) and Tukey’s
multiple comparison test with 95 % (p=0. 05) level of significance were used to analyze the data using the Minitab® 14 (Minitab Inc., USA).
RESULTS AND DISCUSSION The percentage of shells in nibs (SiN%) The effects of the micronizing temperature and the wet beans moisture on the separation efficiency specifically on the percentage of shells in nibs on infrared and microwave are as shown on Figure 1 and Figure 2 respectively. The general trend of the percentage of shell in nibs reduced proportionately with the infrared temperature and the wet beans moisture. However in the domestic microwave oven, the trend of shell in nibs exhibit an uneven trend.
Figure 1. The percentage of shell in nibs in infrared micronizing
Figure 2. The percentage of shell in nibs in microwave micronizing

Malaysian Cocoa Journal 2019, Vol. 11
164
For example in 43% wet beans moisture, the percentage of SiN reacts positively with the microwave power intensity, with high microwave power resulted in minimum amount of shell that presents in the nibs compartment. In infrared wet beans micronizing, the percentage of SiN started to reduced and eventually confirmed to the regulation starting from 23% wet beans moisture with the infrared temperature of 220oC and below. However, in the infrared micronizer, the % of SiN appeared to be generally higher compared with domestic microwave oven. The percentage of SiN was more than 2% of the 33% wet beans moisture. In the domestic microwave, the highest SiN% was 1.5% as shown in the 43% wet beans. The physical condition of the wet beans at this stage is still surface dry. The reduced amount of SiN percentage can be attributed to the high amount of water available in the beans coupled with high intensity of microwave power. The two conditioned which are favorable in microwave heating or microwave drying (Sadeghi, Mirzabeigi Kesbi and Mireei, 2012). However, for 31% wet beans moisture, the reduction of SiN was more significant compared with all the other wet beans moisture. It is interesting to note that in microwave micronizing, only two conditioned appear to be in confirmation with the percentage
of SiN regulation. The first situation was when the beans moisture was at 42% and microwave was at high power mode. The second situation was when the moisture of the wet beans was at 32%, but in this situation, regardless of the microwave power setting, the amount of SiN % did not exceed the control amount. Comparing between the two methods of wet beans micronizing, the domestic microwave show a distant advantage since the micronizing process can be initiate at higher wet beans condition. This gave the benefits of reduced processing time at the farm level. On the other hand, the wet beans micronizing concept can be introduce earlier in the process and manufacturing chain as intensification method (Barba, Dalmoro and d’Amore, 2012). The percentage of nibs in shell contamination (NiS%) The effect of infrared temperature and the wet beans moisture on the separation efficiency in term of the percentage of nibs in shells (NiS) for both techniques are as shown in Figure 3 and Figure 4. The results shows that the highest percentage of NiS% was 7.36% of the 180oC infrared temperature and 33% wet beans moisture. High percentage of NiS% means high wastage since nibs are high value products and use in the production of cocoa butter and cocoa mass.
Figure 3. The percentage of nibs in shell in infrared
Figure 4. The percentage of nibs in shell in infrared

Malaysian Cocoa Journal 2019, Vol. 11
165
The contamination of nibs in the shell compartment was more stringent due to the economic reasons. The nibs contains cocoa butter and dry matter and these two semi-finished products has it significant share of the economics value (Krysiak, 2011). Result shows that in the infrared wet beans micronizing, out of all the wet beans tested, only 16% wet beans moisture and 220oC infrared temperature confirmed to the regulation in term of the amount of nibs in shell (NiS) percentage. However, compare to the domestic microwave, the wet beans percentage that confirmed to the regulation was more as shown by the 21.9 and 12% wet beans moisture. These two wet beans conditioned can be micronized using domestic microwave regardless whether the power was set
at low, medium or high. The other two wet beans moisture, i.e; 43 and 31 percent exhibit a conditioned that was close to the control value if expose to the high microwave power. These show the advantage and versatility of microwave as a medium to conduct wet beans micronizing technique (Hussein et al., 2016). The percentage of un-retrieved beans (U%) The effect of infrared temperature on the separation efficiency in term of the un-retrieved beans at different level of wet beans moisture is as shown in Figure 5. The presence of the un-retrieved beans was detected during sieve shaker operations and mostly was retained at the 4 mm mesh sieve size.
Figure 5. The percentage of unretrieved beans in infrared micronizing
Figure 6. The percentage of unretrieved beans in microwave micronizing
Comparatively, there appear to be a similar trend for both infrared and microwave wet beans micronizing (Figure 6) whereby both shows an absent of un retrieved beans (U%) when wet beans was at 23% and lower. These can be regards as a potential conditioned to start wet beans micronizing since all whole beans are fragmentized and results in a mixture of fine particles that consists of shell and nibs (Hussein et al., 2016). Results from this experiment shows that wet beans from 21.9% and lower can be broken successfully when subjected to microwave treatment. This also proves that the microwave treatment can act as a micronizing
process whereby high temperature short time heat treatment was applied to prepare the beans for breaking and separation before roasting (Beckett, 2009). Microwave drying was known to be effective at product moisture contents below 20%, and microwave heat treatment does appear to have a high potential for the processing of agricultural products (Vadivambal and Jayas, 2007). High percentage of U% was observed in 180oC infrared temperature and 33% wet beans moisture. The high percentage of U% could be due to the physical condition of the beans, which was elastic and therefore failed to break when passed through the impact breaker.

Malaysian Cocoa Journal 2019, Vol. 11
166
The elasticity of the beans only happens at high wet beans moisture, which could be due to the transfer of moisture from the internal bean to skin layer when the skin becomes drier due to infrared exposure. The other reason could be a slower rate of moisture migration from the internal bean since the mechanism of infrared heating is effective to dry the outer layer (Zhongli Pan, Atungulu and Li, 2014). The slower moisture rate will result in dense and non-porous nibs which contribute to the elasticity characteristic. In one of the infrared micronizing study using high moisture lentils for pre-treatment, the end product of lentils also resulted in a softer texture (Arnt et al., 1998) The effect of temperature and moisture on nibs final moisture content (MCf)
The final nibs moisture content (MCf) is one of the crucial factor in order to preserved the beans and conditioned the beans for further processing. Current practices of dry beans micronizing require the beans to be less than 5% of beans moisture (Castro-fettermann et al., 2017). As materials dry, the shrinkage of thin materials can result in low absorption of infrared energy, since most of the radiation energy can be reflected and transmitted through the thin layer (Z. Pan, Atungulu and Li, 2013). In the infrared wet beans micronizing, result show that only 16% wet beans and 220oC infrared temperature meet the current practice as shown in Figure 7. Compare with microwaves, wet beans as high as 31.1% can match the current practice if micronized under high power as shown in Figure 8.
Figure 7. The nibs final moisture content in infrared micronizing
a
b
c
d d
a
b
cd d
a
b b cb
0
5
10
15
20
25
30
35
43.54 31.1 21.9 12 Control
MC
F (%
)
Wet Bean Moisture (%)
Low
Medium
High
Figure 8. The nibs final moisture content in the microwave micronizing

Malaysian Cocoa Journal 2019, Vol. 11
167
The other conditioned that meet the current practice in term of nibs final moisture content was 21.9% wet beans moisture micronized at high microwave power and 12% wet beans moisture micronized at medium microwave power. Again, by comparisons, wet beans micronizing using microwave gave more versatility in term of the choice of wet beans conditioned and selection of microwave power. The versatility could be derived from microwave heating results in surface moisture build-up due to enhanced (pressure-driven) flow of moisture to the surface and the cold ambient air's inability to remove moisture at a high rate (Azadbakht 2015; Manish et al., 2012). Based on these two values, the condition of the nibs final content indicates that wet beans micronizing can be achieved using microwave as a heat source with the selection of appropriate levels of wet beans moisture and specific microwave power. Generally, by increasing the microwave power, moisture was also loss (Azadbakht, 2015). CONCLUSIONS Wet beans micronizing techniques is perhaps a novel technology and the potential of its success is still at its infant stage. This study shows some promising aspects of wet beans micronizing using two above mentioned methods. While the infrared techniques is considered as a benchmarks techniques due to its wide spread use in the cocoa grinding sector, the results from this study suggests some promising potential if microwave is used to achieved wet beans micronizing. Wet beans as high as 31% can be considered for initiating the wet beans micronizing in microwave, while in infrared micronizing, the moisture of wet beans need to be at least 16%. The other advantage of microwave is quick and rapid heat treatment using the product own moisture availability. The other disadvantage points in infrared wet beans micronizing was the high moisture contents of beans hindered its practical use especially in the rotary infrared micronizer since the movement of wet beans would be limited due to the sticky condition of the wet beans. Contrary to the microwave, the wet beans rotates on the rotating plates in order to achieved uniformity.
ACKNOWLEDGEMENT The author would like to thank the Malaysian Cocoa Board for supporting this study under the Temporary Research Fund code PTJ 15255. REFERENCES
Arnt, S D, M G Scanlon, L J Malcolmson, B
Watts, D Ryland, and V Savoie. (1998). “Effect of Tempering and End Moisture Content on Micronazed Lentils.Pdf” 30
(5). Azadbakht, Mohsen. (2015). “The Effect of
Thickness and Power on the Hayward Variety in Drying Process of Kiwifruit Using Microwave”, 17(1): 300–305.
Barba, Anna Angela, Annalisa Dalmoro, and
Matteo d’Amore. (2012). “An
Engineering Approach to Biomedical Sciences: Advanced Strategies in Drug Delivery Systems Production.”
Translational Medicine @ UniSa, 4(1): 3–11.
Beckett, Stephen T. (2009). Industrial
Chocolate. Bouraoui, M, P Richard, J Fichtali, 1) Bouraoui
(∗M., P Richard, J Fichtali, M Bouraoui, et al. (1993). “Review Paper:
A Review of Moisture Content Determination in Foods Using Microwave Oven Drying.” Food Research International, 26 (1): 49–57.
Castro-fettermann, Diego, Ângelo Márcio,
Oliveira Sant, Guilherme Luz, Giuliano Alberton, Márcia Elisa, and Soares Echeveste. (2017). “Improvements in
the Processing of Agricultural Commodities : The Case of Cocoa
Liquor, 84 (201): 117–22. Firihu, Muhammad Zamrun, and I. Nyoman
Sudiana. (2016). “2.45 GHZ
Microwave Drying of Cocoa Bean.”
ARPN Journal of Engineering and Applied Sciences, 11 (19): 11595–98.

Malaysian Cocoa Journal 2019, Vol. 11
168
Hussein, H, M Nordin Ibrahim, A A Norashikin, and A Ismail. (2016). “Microwave
Application in Micronizing Wet Fermented Cocoa Beans.” International Conference on Agricultural and Food Engineering (Cafei2016), no. August: 23–25.
Kelly, B-. (2000). “Solids with Polyphenols By-
Product.” Krysiak, W. (2011). “Effects of Convective and
Microwave Roasting on the Physicochemical Properties of Cocoa Beans and Cocoa Butter Extracted from This Material, 62 (4): 467–78.
Manish, Soni, Patidar Kalpana, Varsha Patel,
and Jain Dharam Chand. (2012). “Past ,
Present, and Possible Future Applications of Microwave Technique”, 1: 25–32.
Metaxas, A.C. (1991). “Microwave Heating.”
Power Engineering Journal, 5(5): 237–
47. Stephen Tiong Mee Ing. (1990). Moisture
Determination of Cocoa Beans by Microwave Oven. Vol. 13. http://ezproxy.upm.edu.my/login?url=http://search.ebscohost.com/login.aspx?direct=true&db=ir00116a&AN=upm.2865&site=eds-live&scope=site.
Pan, Z., G. Atungulu, and X. Li. (2013). Infrared
Heating. Resource: Engineering and Technology for Sustainable World. Second Edi. Vol. 20. Elsevier Ltd. https://doi.org/10.1016/B978-0-12-411479-1.00025-5.
Pan, Zhongli, Griffiths G Atungulu, and Xuan
Li. (2014). “Chapter 25 - Infrared Heating.” In Emerging Technologies for Food Processing (Second Edition), edited by Da-Wen Sun, 461–74. San Diego: Academic Press.
Sadeghi, Morteza, Omid Mirzabeigi Kesbi, and
Seyed Ahmad Mireei (2012). “Mass
Transfer Characteristics during Convective, Microwave and Combined Microwave? Convective Drying of
Lemon Slices.” Journal of the Science of Food and Agriculture, n/a-n/a.
Vadivambal, R, and Jayas, D. S. (2007).
“Changes in Quality of Microwave-Treated Agricultural Products--a Review.” Biosystems Engineering 98 (1): 1–16. http://www.sciencedirect.com/science/article/B6WXV-4PC4F6T-1/2/c92980e63bfaacf2e204a1e15f812d4b.

169
SENSORY AND CHEMICAL PROFILES OF SUGAR FREE PLAIN CHOCOLATE WITH FISH OIL INCORPORATED WITH MACA AND GINKGO BILOBA EXTRACTS
Hassan, M.R. and Johari, K.
Cocoa Downstream Technology Division, Cocoa Innovation and Technology Centre, Malaysian Cocoa Board,
Lot 12621, Nilai Industrial Area, 71800 Nilai, Negeri Sembilan, Malaysia.
Malaysian Cocoa J. 11: 169 - 174 (2019) ABSTRACT - Sugar free plain chocolate with fish oil was value added by incorporating functional ingredient, namely Maca and Ginkgo biloba extract between 120 mg to 240 mg and 250 mg to 450 mg respectively. Factorial Design of nine treatments and one replication was carried out on three levels amount of both extracts. The samples were analysed for the organoleptic quality using Hedonic Scale Rating Test of nine scale points on six attributes; the intensity of texture, mouthfeel, bitterness, off flavour, after taste and overall acceptability, antioxidant capacity by using DPPH scavenging activity as well as the peroxide value (PV. One way Analysis of varians (ANOVA) on sensory evaluation showed that there were no significant different among samples on all attributes tested; the intensity of texture, mouthfeel, bitterness, off flavour, after taste and overall acceptability at p>0.05. The antioxidant activity of chocolates significantly increased (at p<0.05) as the amount of both extracts in the formulation increased. There was no correlation between the peroxide value and the amount of Maca and Gingko biloba incorporated into the chocolates. The level of the peroxide value for all chocolate samples incorporated with both extracts were below 10 mEq/kg and acceptable according to The Codex Alimentarius, 2001
Key words: sugar free plain chocolate, maca, ginkgo biloba, sensory, antioxidant activity, peroxide value
INTRODUCTION Sugar free plain chocolate with fish oil was successfully developed in previous project (Hassan, 2016). The product was then value added with other functional ingredients to improve their functionality and health benefit of the chocolate. Two type of herbs selected in this study, namely Maca and Gingko biloba based on their well-known benefits in maintaining health and wellbeing. Maca, scientifically known as Lepidium meyenii, is referred as “Peruvian ginseng” which
traditionally has been used to enhance men’s
fertility and sex drive (Gonzales et al., 2002). It's also claimed to improve energy and stamina (Eun et al., 2012) as well as improved learning and memory (Rubio et al., 2007). Maca also helped alleviate menopausal symptoms, including hot flashes and interrupted sleep in women (Lee, 2011). Ginkgo biloba contains high levels of flavonoids and terpenoids, which are strong in antioxidant activity (Pier-Giorgio, 2000). It may treat men’s sexual dysfunction, such as erectile
dysfunction or low libido through its ability to improve blood levels of nitric oxide, which improves circulation via the dilation of blood vessels (Wu et al., 2008) besides able to reduce anxiety, stress and other symptoms associated with Alzheimer’s disease and cognitive decline
associated with aging as well (Yang et al., 2016). Another study found that supplement with gingko may increase mental performance and perceived well-being (Cieza et al., 2003). This paper will discuss the sensory and chemical profiles, namely antioxidant activity (DPPH) and peroxide value of sugar free plain chocolate with fish oil incorporated with Maca and Ginkgo biloba extracts.
MATERIALS AND METHODS The sugar free plain chocolate with fish oil was value added by incorporating functional ingredients, namely, Maca and Ginkgo biloba extract in order to improve their functionality and health benefit of the chocolate. Several amounts of both extracts were added into the chocolate formulation based on their
170
Recommended Daily Allowance (RDA). RDA of Gingko biloba is within 120 mg to 240 mg per person daily while Maca is 250 mg to 450 mg. The study was carried out using Factorial design with nine treatments and one replication using
Minitab version 14 software with three levels amount of both extracts ranging within their minimum and maximum value of RDA (Please refer to Table 1).
.
Table 1. Factorial design of Ginkgko biloba and Maca extracts in sugar free plain chocolate with fish oil.
Sensory evaluation Sensory evaluation was carried out using 15 trained and semi trained chocolate panelist among LKM’s staffs on nine samples of sugar
free plain chocolate with functional oil containing different portion of Ginkgo biloba and Maca as mentioned in Table 1. Sugar free plain chocolate without neither Gingko biloba nor Maca was used as a control. The sensory evaluation was carried out two sessions of five and six samples including control sample for each session using Hedonic Scale Rating Test base on nine scale points where nine is the highest intensity while one is the lowest intensity on six attributes; intensity of texture, mouthfeel, bitterness, off flavour, after taste and overall acceptability. For both sessions, the sample of sugar free plain chocolate containing fish oil without Maca and Ginkgo biloba extracts was used as a control. DPPH Free Radical Scavenging Activity The experiment was carried out according to Godocokova et al. (2017) method. Radical scavenging activity of the samples was measured using 2,2-diphenyl 1-picrythydrazyl (DPPH). The extract of defatted chocolate (0.4 ml) was mixed with 3.6 ml of DPPH solution (0.025 g DPPH in 100 ml ethanol). After 10 minutes of incubation in dark place, the absorbance of the sample extract was determined using the
spectrophotometer Jenway (6405 UV/Vis, England) at 515nm. Trolox (6-hydroxy-2,5,7,8-tetramethylchroman-2-carboxylic acid) (10-100 mg.l-1.; r2= 0.9881) was used as the standard and the results were expressed in mg/g Trolox equivalents (TE). Peroxide value (PV) The determination of peroxide value for sugar free dark chocolate samples was carried out according to Tee et al. (1996). The fat of chocolate was extracted using soxhlet using petroleum benzene as a solvent. One to four g of oil sample was weighted and transferred into 250ml round bottom flask, and then 10 ml of chloroform was added to dissolve the oils and swirled for few seconds. Later, 15 ml of glacial acetic acid was added followed with 1 ml fresh saturated aqueous potassium iodide solution. The solution then was shaken for one minute and kept in dark for 5 minutes. After that, 75 ml of distilled water was added followed by few drops of starch solution (1%). The sample solution was then titrated with 0.002N sodium thiosulphate. The peroxide value was calculated as the difference between the volumes, in ml, of 0.002N sodium thiosulphate consumed, multiplied by Normality then multiplied by 10 and divided by the weight, in g, of the sample taken.
SAMPLE GINGKO BILOBA EXTRACT (%) MACA EXTRACT (%)
SDCOB0 0 0 SDCOB1 0.24 0.5 SDCOB2 0.24 0.7 SDCOB3 0.24 0.9 SDCOB4 0.36 0.5 SDCOB5 0.36 0.7 SDCOB6 0.36 0.9 SDCOB7 0.48 0.5 SDCOB8 0.48 0.7 SDCOB9 0.48 0.9

171
Statistical analysis was conducted using ANOVA (Minitab version 14) to organoleptic quality, DPPH profile and peroxide value among samples.
RESULTS AND DISCUSSION
Sensory evaluation Figure 1 generally shows that chocolate samples which contain highest amount of Maca and Ginkgo extracts gave higher score on bitterness but lower in overall acceptability compared to samples containing lower amount of both extracts. Control sample without Maca and
Ginkgo biloba gave the highest score on overall acceptability and the lowest score of bitterness. Statistical analysis of sensory results in Table 2 showed that there is no significant different among samples on all attributes tested; intensity of texture, mouthfeel, bitterness, off flavour, after taste and overall acceptability at p>0.05. Incorporation of maca and gingko biloba extract in any amount within their minimum to maximum of Recommended Daily Allowance (RDA) did not affect the organoleptic quality of the sugar free plain chocolate with functional oil.
Figure 1. Flavour profile of sugar free plain chocolate with functional oil incorporated with different amount of gingko biloba and maca extracts
Table 2. Sensory evaluation of sugar free plain chocolate with functional oil containing different amount of Ginkgo biloba and Maca extracts
No. Sample DPPH Free Radical Scavenging Activity mg TE/g
1 SDC (CONTROL-1) 1.08 ± 0.05 b* 2 SDCOB0 (CONTROL-2) 1.06 ± 0.04 b* 3 SDCOB1 1.06 ± 0.06 b* 4 SDCOB2 1.12 ± 0.04 b* 5 SDCOB3 1.17 ± 0.05 ab* 6 SDCOB4 1.18 ± 0.06 ab* 7 SDCOB5 1.20 ± 0.05 ab* 8 SDCOB6 1.22 ± 0.05 ab* 9 SDCOB7 1.24 ± 0.03 ab* 10 SDCOB8 1.25 ± 0.06 a* 11 SDCOB9 1.26 ± 0.07 a*
Mean value followed by same alphabets indicated no significant different at p > 0.05. (n=15)
172
DPPH Free Radical Scavenging Activity Analysis using DPPH radical is most frequently used to determine the antioxidant capacity of food. The results in Table 3 showed that control samples, sugar free plain chocolate without functional oil (fish oil) do not significantly differ on antioxidant activity compared to chocolate containing fish oil at p>0.05. By increasing the
amount of maca and gingko biloba extract in the formulation of sugar free dark chocolate containing fish oil will significantly increase their antioxidant activity (at p>0.05). The incorporation of gingko biloba as well as maca extract at highest level of RDA were gave significantly highest antioxidant activity in chocolate (at p>0.05).
Table 3. Antioxidant profile of sugar free plain chocolate with functional oil incorporated with different amount of gingko biloba and maca extracts.
Same alphabets indicates no significant different at p>0.05. Peroxide value of functional sugar free plain chocolate with maca and gingko biloba extract The peroxide value is the number that expresses, in milliequivalent (mEq) of active oxygen, the quantity of peroxide contained in 1000 g of the substance. A low peroxide value meant the chocolate is more stable towards oxidation. The result in Table 4 shows that control sample of sugar free plain chocolate without neither fish oil nor maca and gingko biloba gave the lowest peroxide value which
meant the sample is most stable to fat oxidation compared to other tested samples. The result also shows that there was no correlation between peroxide value and amount of maca and gingko biloba incorporated into sugar free plain chocolate containing fish oil where the value was not influenced by increasing amount of that functional ingredients into the formulations. However, the level of the peroxide value for all chocolate samples was acceptable since below than 10 mEq/kg (The Codex Alimentarius, 2001).
Sample
(mean ± Standard deviation)
Texture Mouthfeel Bitterness Off flavour After taste Overall
acceptability
SDCOB0 5.3 ± 1.2 a* 5.3 ± 1.3 a 5.1 ± 1.5 a 4.7 ± 1.7 a 4.9 ± 1.8 a 5.3 ± 1.3 a
SDCOB1 5.4 ± 1.1 a 5.6 ± 1.0 a 5.3 ± 1.3 a 4.9 ± 1.6 a 4.9 ± 1.9 a 5.2 ± 1.3 a
SDCOB2 4.6 ± 1.1 a 5.9 ± 1.2 a 5.4 ± 1.0 a 4.6 ± 1.5 a 4.5 ± 1.6 a 5.7 ± 1.2 a
SDCOB3 5.2 ± 1.2 a 5.5 ± 1.2 a 6.1 ± 1.2 a 4.8 ± 1.8 a 4.8 ± 2.1 a 5.1 ± 2.0 a
SDCOB4 4.9 ± 1.2 a 5.3 ± 1.2 a 5.9 ± 1.2 a 5.3 ± 2.1 a 5.4 ± 2.1 a 4.7 ± 1.2 a
SDCOB5 5.3 ± 1.0 a 5.5 ± 1.0 a 5.5 ± 1.1 a 4.9 ± 1.5 a 4.7 ± 1.9 a 5.2 ± 1.3 a
SDCOB6 5.3 ± 1.2 a 5.4 ± 1.3 a 5.7 ± 1.2 a 5.0 ± 1.9 a 5.1 ± 1.9 a 5.0 ± 1.4 a
SDCOB7 5.1 ± 1.2 a 5.9 ± 1.4 a 5.7 ± 1.2 a 5.1 ± 1.8 a 5.2 ± 1.9 a 5.1 ± 1.5 a
SDCOB8 5.1 ± 1.1 a 5.9 ± 1.2 a 5.6 ± 1.1 a 4.8 ± 1.7 a 4.9 ± 1.8 a 5.1 ± 1.2 a
SDCOB9 5.3 ± 1.1 a 5.7 ± 1.0 a 5.7 ± 1.5 a 4.7 ± 2.0 a 4.7 ± 2.0 a 5.0 ± 1.6 a

173
Table 4. Peroxide value of sugar free plain chocolate with functional oil incorporated with different amount of gingko biloba and maca extracts.
No Sample Peroxide value mEq/kg 1 SDC (CONTROL-1) 3.57 ± 0.26 c* 2 SDCOB0 (CONTROL-2) 4.4 ± 0.33 ab* 3 SDCOB1 4.75 ± 0.11 ab* 4 SDCOB2 4.58 ± 0.2 ab* 5 SDCOB3 4.67 ± 0.3 ab* 6 SDCOB4 4.71 ± 0.3 ab* 7 SDCOB5 4.67 ± 0.12 ab* 8 SDCOB6 4.37 ± 0.36 ab* 9 SDCOB7 4.20 ± 0.06 b*
10 SDCOB8 4.86 ± 0.42 a* 11 SDCOB9 4.48 ± 0.17 ab*
Same alphabets indicates no significant different at p>0.05
CONCLUSIONS
Sensory evaluation showed that there was no significant different among chocolate samples on intensity of texture, mouthfeel, bitterness, off flavour, after taste and overall acceptability at p>0.05 for chocolate containing maca and gingko biloba extract in any amount within their minimum to maximum of Recommended Daily Allowance (RDA). Antioxidant activity will increase significantly by increasing the amount of maca and gingko biloba extract in the formulation of sugar free plain chocolate containing fish oil (at p>0.05). There was no correlation between peroxide value and amount of maca and gingko biloba incorporated into sugar free plain chocolate containing fish oil. However, the level of the peroxide value for all chocolate samples was acceptable since below than 10 mEq/kg (The Codex Alimentarius, 2001).
ACKNOWLEDGEMENT
This project was funded by Ministry of Science, Technology and Information, Malaysia under e-Science fund (Project No: 06-03-13-SF0070).
REFERENCES
Hassan, M.R (2016). Physical and chemical properties of blended functional oils with cocoa butter. Oral Presentation at MCB Annual Scientific Workshop, 10-
13 October 2016, Institut Semarak Felda Bangi, Selangor.
AOAC (1984). Official Methods of Analysis. 14th
Ed. Association Official Analytical Chemistry. Washington, D.C., 64-67.
The Codex Alimentarius, Codex Standards for
named vegetable oils, CODEX STAN 210-1999,
FAO/ WHO Rome, vol. VIII, 2nd eds., 2001,
pp.1-13. Tee, E.S., Kuladevan, R., Young, S.I., Khor,
S.G. and Omar, Z.H. (1996). Laboratory procedures
Nutrient Analysis of Foods. Division of Human
Nutrition, Institute for Medical Research, Kuala Lumpur, Malaysia
Gonzales, G.F., Córdova, A., Vega, K., Chung,
A., Villena, A., Góñez, C. and Castillo, S. (2002). Effect of Lepidium meyenii (MACA) on sexual desire and its absent relationship with serum testosterone levels in adult healthy men. Andrologia, 34(6): 367-72.
Lee, M.S., Shin, B.C., Yang, E.J., Lim, H.J.
and Ernst, E. (2011). Maca (Lepidium meyenii) for treatment of menopausal symptoms: A systematic review. Maturitas Nov 70(3): 227-33. doi:
https://www.ncbi.nlm.nih.gov/pubmed/?term=Castillo%20S%5BAuthor%5D&cauthor=true&cauthor_uid=12472620
174
10.1016/j.maturitas.2011.07.017. Epub 2011 Aug 15.
Rubio, J., Dang, H., Gong, M., Liu, X., Chen,
S.L. and Gonzales, G.F. (2007). Aqueous and hydroalcoholic extracts of Black Maca (Lepidium meyenii) improve scopolamine-induced memory impairment in mice. Food Chem Toxicol. 2007 Oct 45(10): 1882-90.
Cieza, A., Maier, P. and Pöppel, E. (2003).
Effects of Ginkgo biloba on mental functioning in healthy. Volunteers. Arch Med Res. 2003 Sep-Oct 34(5): 373-81.
Choi, E.H., Kang, J.I., Cho, J.Y., Lee, S.H.,
Kim, T.S., Yeo, I.H. and Chun, S., (2012). Short communicatons. Supplementation of standardized lipid-soluble Hyang extract from maca (Lepidium meyenii) increases swimming endurance capacity in rats. Journal of Functional Foods. April 2012, 4(2): 568-573.
Wu, Y.Z., Li, S.Q., Zu, X,G,, Du, J,, Wang, F.F. (2008). Ginkgo biloba extract improves coronary artery circulation in patients with coronary artery disease: contribution of plasma nitric oxide and endothelin-1. Phytother Res., (6): 734-9. doi: 10.1002/ptr.2335.
Yang, G., Wang, Y., Sun, J., Zhang, K., Liu, J.
(2016). Ginkgo Biloba for Mild Cognitive Impairment and Alzheimer's Disease: A Systematic Review and Meta-Analysis of Randomized Controlled Trials. Curr Top Med Chem., 16(5): 520-8.
Pier-Giorgio Pietta (2000). Flavonoids as
Antioxidants. J. Nat. Prod., 63: 1035-1042
Godoĉiková, L., Ivaniŝová., E. , Kaċániová, M.,
(2017). The influence of fortification of dark chocolate with sea buckthorn and mulberry on the content of biologically active substances. DOI: 10.1515/arls-2017-0004. Advance Research In Life Science, 1(1): 26-31.

175
PROXIMATE ANALYSIS OF COCOA POD HUSK FROM DIFFERENT CLONE IN MALAYSIA
Hannim, H. H. Malaysia Cocoa Board, Cocoa Innovative and Technology Centre, Lot 12621 Kawasan Perindustrian
Nilai, 71800 Nilai, Negeri Sembilan, Malaysia.
Malaysian Cocoa J. 11: 175–179 (2019) ABSTRACT - In the cocoa industry, the cocoa pods are a material that not provide any economic returns and is regarded as an undesirable waste. As concern, this study will apply the cocoa pod husk to become as a high-value resource and will provide advantages in terms of nutrition and health for the consumers. Because cocoa pod husks are readily available, so it could be used to recover value-added compounds such as peptide. In this project, first step is to determine the proximate analysis of cocoa pod husk from different clone in Malaysia. In this study used 3 types of clones together with 1 mix clone, which are PBC123, PBC159 and KKM22. All the cocoa pod husks were grind into the powder before done the proximate analysis. In proximate analysis, the analysis involves were, determination of moisture, protein, fat, ash, fibre and carbohydrate content. From the results indicate that all cocoa pod husk (CPH) powder had high in crude fibre (range between 42.60±3.40% to 27.07±3.52%) and carbohydrate (range between 46.62±1.35% to 32.85±2.97%) but low contents in moisture, fat, and ash. While for protein composition, is still consider high even though the value is between 9.11±0.25% to 6.68±0.02%. The finding from this study is a valuable contribution for obtaining cocoa pod husk (CPH) from an abundant, inexpensive, renewable, and sustainable source to apply the cocoa pod husk to become as a high-value resource and will provide advantages in terms of nutrition and health for the consumers.
Key words: Cacao pod husk, value added compound, proximate analysis, sustainable source, high-value resource INTRODUCTION
Theobroma cacao L. (Sterculiaceae) is an economically important crop in several tropical countries. Its commercially valuable beans constitute about 10% of the cacao fruit’s fresh
weight. Cocoa beans are used primarily in chocolate manufacturing, and they also have pharmaceutical and cosmetic importance (Lucia et al., 2011).
However, along with its great economic importance, cocoa production generates substantial quantities of waste. In this study, particular attention is given to cocoa pod husk, which are generated after cocoa beans are extracted from the mature cocoa fruit and are the main by-product of the cocoa and chocolate industry.
For each ton of dry beans produced, 10 ton of wet cocoa pod husks are generated, representing a serious disposal problem (Figueira et al., 1993). In most cases, these husks are underexploited and considered an undesirable waste of the cocoa and chocolate industry. Normally, they are left to rot on the
cocoa plantation, which can cause environmental problems. Besides producing foul odours, rotting cocoa pod husks can propagate diseases, such as black pod rot, went left on the cocoa plantations (Donkoh et al., 1991; Barazarte et al., 2008). Currently, increases in the production and processing of cocoa beans, it also generated increasing waste, resulting in million tons of cocoa pod husks being disposed every year. In Malaysia and other cocoa producing countries, processing this cocoa waste could provide economic advantages and decrease some of the environmental problems. Cocoa pod husks is one example of naturally available agricultural waste, which have the potential applications in biotechnological aspect because it non-toxic, abundant, easily available, totally re-generable, non-exotic, cheap and able to support the rapid growth (Dhanasekaran et al., 2011).
This cocoa pod husk can be exploited as sources of food and hence provide adequate levels of nutritional, pharmacological and industrial with benefit to humans (Savithramma, et al., 2011). However because of inadequate scientific knowledge of it nutritional potentials,

176
this valuable source is not explored. Therefore, this study assessed the proximate of cocoa pod husk as the indicator for the next study. MATERIALS AND METHODS
Sampling and preparation of CPH powder Cocoa pod husks (CPH) from three different clones were used in this study, which have been collected from Cocoa Research and Development Centre Jengka. The clones used in this study were KKM 22, PBC 159, PBC 123 and mix clone. All samples were dried using sun drying. Then dried CPH was ground to 100µm particle size. All samples powder was kept in air tight container prior to use.
The proximate analysis of cocoa pod husk powder was carried out accordance to the Association of Official Analytical Chemists (AOAC, 2000). The parameters assayed involve the determination of moisture, crude protein, fat, ash, crude fibre and carbohydrate content in each cocoa pod powder.
Determination of moisture In brief, 5g of cocoa pod powder of each samples were weighed, W1 and the crucibles were left for drying in an oven at 103°C for 30 minutes. After that, crucibles were cooled inside the desiccator for 30 minutes and the weight was recorded as W2. Then the samples were placed in the crucibles and dried again in an oven at 103°C for another 14 hours. The samples were taken out from the oven, cooled in a desiccator and weighed and recorded as W3. The moisture content was determined using equation below: Moisture (%) = 100% - (W3-W2) X 100 W3 Where ; W1 = sample weight W2 = crucible weight W3 = crucible + sample weight Determination of crude protein The samples were weigh into tin boats without pre-treatment and pressed to pellets using the manual pressing tool. Analysis was run using a standard method implemented in the instrument software, with a total analysis time of about 5 minutes. A protein factor of 6.25 was applied to calculate the average protein content.
All samples have been analysed ten times. The average difference between two successive analyses was calculated to compare with International Standard ISO 16634-2(diff. N<0.1%), while relative standard deviation (RSD) were compare to International Standard AOAC 992.23 (RSD<2%).
Determination of fat content First, all the glass apparatus were rinsed by petroleum ether and dried in the oven at 102°C and after removing it were kept in the desiccator. 5 gram of grounded and dried sample was weight and placed it in the round bottom flask. 45ml of boiling distilled water, H2O and 55ml HCI 25% and 3 anti-bumping agent is added. Then, covered with watch glass and boiled for 15 minutes. The digest is filtered and placed in extraction thimble. The thimble was dried with the beaker and watch glass for 18 hours at 100°C.
The thimble was then placed in the soxhlet extractor. 150ml round bottom flask are taken, cleaned and filled with 90ml petroleum ether. The whole setting are placed on a heating mantle and allowed the petroleum ether to boil. The extraction process continued for several hours, almost 6 hours.
The condensing unit from extraction unit are removed and the sample allowed cooling down. Finally, it removed the entire lipid. All the solvent after distillation collected and placed in the oven and after 4 hours, placed in the desiccator. Weight of the sample is taken and the total fat content is calculated using formula below:
Crude fat percentage = (W2-W1) X 100 P Where; Empty thimble = W1 Thimble with sample = W2 Weight of sample = P Determination of ash Determination of ash content was based on AOAC (200). First, crucibles were heated using Bunsen flame. Then, the crucibles were cooled inside the desiccators before being weigh; 2g of cocoa pod powder of each sample were weight in each crucible. Next, the crucible was heated inside the muffle furnace at 550oC until the day

177
after. After that, the sample was cooled in the desiccator. Finally, samples were weight and the ash content was determined using equation below:
% Ash = Weight of ash X 100 Weight of sample
Determination of fibre 2 g of samples were weighted and transferred into a 600 mL round bottom flask of the fibre digestion apparatus. 200 mL of boiling 1.25% sulphuric acid solution (H
2SO4) are added with 3 piece of anti-bumping granule. Flask is placed on digestion apparatus with pre-adjusted heater and boiled exactly 30 minutes. Flask is removed and the contents are filtered through crucible-fritted glass No.2 (200mesh) which pre-coated with about 1.5 g of ceramic fibre of Celite 545. Flask is rinsed with 50-75 mL of boiling water, and wash through filtration set. Repeat with three 50 mL portions of water, and sucked dry. The fibre mat with residue is transferred back to flask and 200 mL of boiling 1.25% sodium hydroxide solution (NaOH) is added and flasks are returned to heater and boiled exactly 30 minutes. Flasks was removed and filter as before and then washed with 25 mL of boiling 1.25% sulphuric acid solution (H2SO4), three 50 mL portions of water, and 25 mL of methanol. Vacuum were sucked until dry and the dry residue with fritted glass were dried for 2 hours at 130°C. Then, it was cool in desiccator, weighted and transferred to ashing dish for ignition about 30 minutes at 600°C. The samples were cooled in desiccator and final weight was taken. The calculation was based on the equation below:
% Crude Fiber = (Weight of residue after drying-weight of residue after ashing) – Weight of blank x 100 Initial weight of sample Determination of Carbohydrate Content The carbohydrate content was determined by calculation using the different method (Nielsen, 1998). The calculation was based on the equation below:
%Total Carbohydrate = [100 − % (Moisture +
Protein + Fat + Ash + Fiber)]
RESULTS AND DISCUSSION Based on the result obtain, the entire sample are significantly difference between each other. Sample B which is PBC 123 cocoa pod powder has the highest percentage of moisture rather than other samples (Table 1). The mixed clone, D sample and PBC 159 have no significant difference with 11.739 % and 11.205 % of moisture. While KKM 22 sample has the lowest amount of moisture. Table 1. Moisture content of cocoa pod powder
Sample R1(%) R2(%) R3(%) Mean±SD A 6.718 6.872 6.916 6.835 ±
0.104 B 13.009 12.764 12.810 12.861 ±
0.130 C 11.238 11.205 11.172 11.205 ±
0.033 D 11.763 11.728 11.725 11.739 ±
0.0021 Where; A= Sample KKM 22 C= Sample PBC 159 B= Sample PBC 123 D= Sample Mix. Clone R1= Replication 1 R2= Replication 2 R3= Replication The protein content shows that sample C, PBC 159 and sample KKM 22 has no significant difference with percentage of protein of 9.114% and 7.541% (Table 2). For the sample KKM 22 and sample PBC 123 no significant difference is shown and the mix clone sample D has the lowest intensity of protein among the four samples.
Table 2. Protein content of cocoa pod powder
Sample R1(%) R2(%) R3(%) Mean±SD A 6.562 7.932 8.128 7.541 ±
0.853 B 6.666 6.687 6.700 6.684 ±
0.017 C 9.180 9.321 8.840 9.114 ±
0.247 D 5.532 4.765 3.259 4.519 ±
1.156 Where; A= Sample KKM 22 C= Sample PBC 159 B= Sample PBC 123 D= Sample Mix. Clone R1= Replication 1 R2= Replication 2 R3= Replication 3

178
For fat content, sample A which is KKM 22 has the highest percentage of fat (0.814%) between the four samples, followed by sample B, Sample C and sample D, while mix clone sample has no significant difference in the percentage of fat (Table 3).
Table 3. Fat content of cocoa pod powder
Sample R1(%) R2(%) R3(%) Mean±SD A 0.816 0.798 0.828 0.814 ±
0.015 B 0.704 0.722 0.680 0.702 ±
0.021 C 0.036 0.028 0.024 0.029 ±
0.006 D 0.046 0.048 0.050 0.048 ±
0.002 Where; A= Sample KKM 22 C= Sample PBC 159 B= Sample PBC 123 D= Sample Mix. Clone R1= Replication 1 R2= Replication 2 R3= Replication
The result of ash content shows that sample D, mix clone sample has highest percentage of ash while sample A, sample KKM 22, sample B PBC 123 and sample C, PBC 159 have no significant difference in the percentage of ash between the samples (Table 4).
Table 4. Ash content of cocoa pod powder
Sample R1(%) R2(%) R3(%) Mean±SD A 6.925 7.215 7.500 7.213 ±
0.290 B 7.250 6.954 6.484 6.896 ±
0.386 C 6.675 6.739 6.854 6.756 ±
0.091 D 8.225 8.313 8.100 8.213 ±
0.107 Where; A= Sample KKM 22 C= Sample PBC 159 B= Sample PBC 123 D= Sample Mix. Clone R1= Replication 1 R2= Replication 2 R3= Replication
The percentage of crude fibre in each sample is quite higher, where sample D has the highest crude fibre followed by sample C, B and A (Table 5).
Table 5. Crude fibre of cocoa pod powder
Sample R1(%) R2(%) R3(%) Mean±SD A 30.900 30.800 31.230 30.980 ±
0.225 B 24.710 31.130 25.380 27.070 ±
3.529 C 33.240 32.670 38.910 34.940 ±
3.450 D 43.480 38.870 45.540 42.600 ±
3.403 Where; A= Sample KKM 22 C= Sample PBC 159 B= Sample PBC 123 D= Sample Mix. Clone R1= Replication 1 R2= Replication 2 R3= Replication The carbohydrates content in all the samples are high and there is no significant difference among sample A, B, C and D (Table 6).
Table 6. Carbohydrates content of cocoa pod
powder
Sample R1(%) R2(%) R3(%) Mean±SD A 48.079 46.383 45.398 46.620 ±
1.356 B 47.661 41.743 47.946 45.783 ±
3.502 C 39.631 40.037 34.200 37.956 ±
3.259 D 30.954 36.276 31.326 32.852 ±
2.971 Where; A= Sample KKM 22 C= Sample PBC 159 B= Sample PBC 123 D= Sample Mix. Clone R1= Replication 1 R2= Replication 2 R3= Replication CONCLUSIONS The contents of cocoa beans have high demands but nowadays a cocoa pod also represents a valuable food industry by-product. Cocoa pod are a rich source of dietary fibre and protein, as well as valuable bioactive compounds. The finding from this study is a valuable contribution for obtaining cocoa pod husk (CPH) from an abundant, inexpensive, renewable, and sustainable source to apply the cocoa pod husk to become as a high-value resource and will provide advantages in terms of nutrition and health for the consumers.

179
ACKNOWLEDGEMENT
This Research project is supported by Research Development grant of Malaysia Cocoa Board.
REFERENCES
AOAC (2000). Official Method of Analysis (18th
ed.) Association of official Analytical Chemists Washington D.C, pp 106
Barazarte, H., Sangronis, E., Unai, E., 2008.
Cacao (Theobroma cacao L.) hulls: A Possible Comercial Source of Peptins, 58: 64-70.
Dhanasekaran, D., Lawanya, S., Saha, S.,
Thajuddin, N., Panneerselvam, A. (2011). Innov. Rom. Food Biotechnol., 8: 26–32.
Donkoh, A., Atuahene, C.C., Wilson, B.N., Adomako, D. (1991). Chemical composition of cocoa pod husk and its effect on growth and food efficiency in broiler chicks. Animal Feed Sci. Technol., 35: 161–169.
Figueira, A., Janick, J., BeMiller, J.N. (1993).
New products from Theobroma cacao: seed pulp and pod gum. In: Janick, J., Simin, J.E. (Eds.), New Crops. Wiley, New York, pp. 475–478.
Lucia, C. V., Renata, & Carmen L., 2011. Cacao
Pod Husks (Theobroma cacao L.): Composition & Hot Water Soluble Pectins. Industrial Crops & Products, 34: 1173-1181
Savithramma, N; Ling Rao, M; Suhralatha, D
(2011). Screening of Medicinal plants for secondary metabolites. Middle-east. J. Sci. Res., 8 (3): 579- 584.
.

180
COSMETIC WAX PRODUCTION BY LIPASE TRANSESTERIFICATION BETWEEN COCOA BUTTER FREE FATTY ACIDS AND PALMITYL ALCOHOL
Samuel Yap Kian Chee
Malaysian Cocoa Board. Lot 12621, Nilai Industrial Park, 71800 Nilai, Negeri Sembilan, Malaysia. Corresponding author: [email protected]
Malaysian Cocoa J. 11: 180-186 (2019)
ABSTRACT - Due to the high demand on deodorized cocoa butter globally, a vast amount of cocoa butter free fatty acids is therefore could be extracted from cocoa butter deodorization plants. Cocoa butter free fatty acids is treated as waste by cocoa grinders in Malaysia. Previous work showed that the cocoa butter free fatty acids comprised of palmitic acid, stearic acid, oleic acid, linoleic acid and myristic acid. Equal mole of the cocoa butter free fatty acids and palmityl alcohol were subjected to an esterification process catalysed by lipase Novozym® 435, to produce ester wax. Principle component analysis on the ester conversion rate of more than 90% showed that it was positively correlated with the lipase concentration being used and incubation temperature. The ester wax produced had a melting point of 50.2-50.4oC and crystalized at 45.2oC. Thermogravimetric analysis tandem with mass spectrometry showed that the produced ester wax started to decompose at 200oC and completely decomposed to carbon dioxide and water at 600oC suggested that the ester wax produced was solely organic. The enzyme could be reused up to three cycles without a significant drop in wax conversion. Key words: Enzyme esterification, ester wax, fatty acids, cocoa butter deodorization INTRODUCTION Cocoa belongs to a family of Malvaceae. Theobroma cacao L. is the most widely cultivated species commercially. Ripen cocoa fruits are harvested and the fresh beans are extracted from the pods. Fermentation is the first process. Well fermented cocoa beans are dried to not more than 7% moisture contents (Minifie, 1982). Dried cocoa beans are normally de-shelled and cracked into smaller pieces known as cocoa nibs. These cocoa nibs are then roasted at 130-150oC. Additional process of alkalizing before roasting may be carried out to modify the flavor and color of cocoa powder or cocoa liquor. Alkalizing process consists of treating the cocoa nibs with an alkali solution such as sodium or potassium carbonate. Roasted cocoa nibs are then further ground into paste known as cocoa liquor. Pressing of this cocoa liquor will give cocoa butter and cocoa cake. Cocoa powder is the product from the pulverizing process on cocoa cake. After the roasting and alkalizing steps, cocoa butter intrinsically incorporates all the typical cocoa flavor elements: It will therefore
have a distinct cocoa flavor. Cocoa butter made from alkalized liquor has a somewhat stronger flavor than cocoa butter obtained from non-alkalized liquor. By far the largest quantity of cocoa butter today is made from alkalized cocoa liquor. Particularly the bitter and specific cocoa flavor components are accentuated in this type of cocoa butter. The flavor intensity of cocoa butter can be influenced by subjecting it to a deodorizing treatment. A fully deodorized cocoa butter has hardly any cocoa flavor of its own, whereas a non-deodorized cocoa butter will have absorbed the contributing cocoa flavor components released during the roasting process (Anon, 1999). Deodorized cocoa butter is mainly used in milk chocolate in order to obtain the desired mild milky flavor. In cocoa industry, deodorization of cocoa butter is to heat the cocoa butter to about 105°C with superheated steam under vacuum in the deodorizer. Volatile substances from the butter are stripped by the entails steam and are carried over to a condenser where they are removed and discarded as cocoa butter free fatty acids. (Yap et al., 2009).

181
Fatty acids composition analysis of the cocoa butter free fatty acids by gas chromatography revealed that palmatic acid (C16:0) with 47.34% was the major compound followed by stearic acid (C18:0) with 20.60% and oleic acid (C18:1) with 20.40%. Linoleic acid (C18:2) and myristic acid (C14:0) were also detected with the concentration of 4.95% and 1.05% respectively (Yap et al., 2009). Cosmetic waxes are categorized in the group of ester wax. They are monoester of fatty alcohols and fatty acids with the chain length between 16-30 atom carbons respectively (Leonard, 2005). Cosmetic waxes are used extensively in lipstick to give the strength and the structure of the products. MATERIALS AND METHODS Materials and reagents Immobilized lipase Novozym® 435 was from Novozyme; palmityl alcohol, molecular sieve 4 Ǻ,
sodium hydroxide pallets, n-hexane, ethanol and phenolpthalein were from Merck; cocoa butter free fatty acids (hereinafter called the “fatty acids”)
was from Malaysia local cocoa grinder. All reagents used were analytical grade. Esterification of ester wax A full factorial experimental design consists of different lipase concentration (0.5%, 1.0%, 1.5% and 3.0% from the total fatty acids used); incubation temperature of 55oC, 65oC, 75oC & 80oC; and reaction period of 1 hour, 3 hours and 5 hours was carried out. Equal mole of fatty acids (271.6 g/mol (Yap, 2011)) and palmityl alcohol (242.5 g/mol) were calculated, weighed and placed into a reaction vessel with molecular sieve (30% from the total weight of fatty acids used), mixed well by means of orbital shaking at 150rpm with lipase in a reaction conditions respectively to the factorial experimental design. Determination of wax conversion Five grams of produced wax sample from each trials of the full factorial experimental design was taken, dissolved in 25.0 ml of solvent mixture (1 part of dicholomethane mixed with 1 part of
methanol) and titrated with 0.1 M NaOH in ethanol. Phenolpthalein was used as indicator. Percentage of wax conversion was determined based on the formula (1): Convx (%) = ((Vo – Vx )/ Vo ) x 100 (1) Where, Convx (%) = percent conversion at tratment x Vo = titration volume of 0.1M NaOH for blank Vx = titration volume of 0.1M NaOH for sample at treatment x Ester wax confirmation Ester wax formation was confirmed with Fourier Transform Infra-Red (FTIR) spectrometry. Sample was scaned from 4000 cm-1 to 650 cm-1. Thermogravimetric analysis (TGA) Sample weight of 3.2mg was placed in a platinum pan and heated from 40oC to 700oC with 20oC/min increament. Purging gas was nitrogen with 99.999% purity at 50ml/min. Emitted gases were analysed with single quad mass spectrometry. Differential scanning calorimetric (DSC) Sample wax weight of 5 mg was placed in a hermatically sealed aluminium pan and kept isothermal at 10oC for 5 minutes in the DSC chamber, purged with 99.999% purity of nitrogen gas at 50ml/min. A heating-cooling-heating method was applied, whereby the sample was heated from 10oC to 80oC; cooled from 80oC to 10oC; and heated again to 80oC with the rate of 20oC/min respectively. Enzyme reusable cycle Experiments were carried out at the determined optimum parameters of enzyme concentration, temperature and incubation period at 150 rpm stirring speed. Enzyme used at the end of each processing cycle was cleaned three times with 10.0 ml solvent mixture (as para 2.3) and air dried before the next cycle was started. These processes were repeated until a significant drop in percentage of wax conversion was observed.

182
RESULTS AND DISCUSSION Esterification of ester wax Canonical analysis of response surface from SAS® statistical software, the stationary point was an optimum at 99.93% of ester conversion with the critical value for enzyme concentration at 2.4%
(wt/wt) from the total amount of fatty acids being used, reaction temperature at 65.2oC and reaction time of 4.7 hours. Basically, higher concentration of enzyme will reduce the time of reaction to achieve more than 97% of fatty ester conversion as shown in Figure 1.
Figure 1. Effect of enzyme concentration towards ester wax conversion rate at 65oC
Higher concentration of enzyme being used had shorter reaction time to achieve more than 97% of wax conversion (Figure 2) due to the higher availability of active surface to interact with substrate at any once time, and hence, increased the reaction rate. Nevertheless, the slope of the graph decreased dramatically after the first hour of reaction period and became nearly zero after the fourth hours of reaction period indicated the availability of the substrate reduced greatly after
the first hour of reaction and almost all substrate had been converted into wax after the fourth hours of reaction and achieved more than 97% of conversion at fifth hours for all concentrations of enzyme used. Principle component analysis on the wax conversion rate of more than 90% was shown as in Table 1.

183
Figure 2. Response surface curve of incubation temperature and enzyme concentration towards
percentage of wax conversion at the fifth hours of reaction time.
Table 1. Principle component analysis on the wax conversion rate of more than 90% PC1 PC2 PC3 Eigenvalue 1.3278 0.9965 0.6757 Proportion 0.443 0.332 0.225 Cumulative 0.443 0.775 1.000 Variable PC1 PC2 PC3 [Lipase] 0.652 0.382 0.655
Temperature 0.278 -0.924 0.262 Incubation time -0.705 -0.011 0.709 The first principle component had an eigenvalue more than one. The variables that correlated the most with the first principle component were lipase concentration (0.652) and incubation temperature (0.278) and it was possitively correlated with both of these variables. Therefore, increasing value of lipase concentration and incubation temperature increase the value of the first principle component. The PC2 and PC3 had an eigenvalue less than 1 and hence, would not discuss further based on Kaiser criterion.
Wax conversion was in increasing direction when the reaction temperature was increased from 55oC and decreased when the reaction temperature was above 65oC for all treatments of various enzyme concentration (Figure 2). Generally, increase of reaction temperature will enhance solubility of the compounds and reduce its viscosity. Thus, giving higher mobility of reaction matrix, and hence, leading to higher reaction rate. Nevertheless, to a certain extent of higher temperature, the structure of enzyme was deformed and giving a lower yield (Yankah & Akoh, 2000; Hirata et al., 1990).

184
FTIR spectrum for the sample wax produced (Figure 3) showed strong peak at frequency 2928.2 cm-1 and 2864.4 cm-1, which are C-Hstr for alkanes group, 1738.4 cm-1 for ester –COOC- bond, and 1461.4 cm-1 is C-Hdef for alkanes group. No peak were observed at
frequency around 3300 cm-1 for primary alcohol and peak at around frequency 1710 cm-1 for carboxylic acid confirmed that the esterification process was taking place and the wax produced was an ester wax (Stuart, 2004).
Ester wax confirmation
Figure 3. FTIR spectrum of the wax sample (reaction condition: enzyme concentration at 2.4%, incubation temperature at 65oC and reaction period of 5 hours).
Figure 4 showed sample started to decompose at 200oC and decomposed completely at 600oC into CO2 and H2O as detected by TGA
tandem with mass spectrometry suggested that the wax produced was solely organic.
Thermogravimetric analysis (TGA)
Figure 4. TGA thermogram of the wax sample

185
Differential scanning calorimetric (DSC) Solid sample showed a sharp peak at 50.2oC when temperature was increased from 10oC to 80oC (line no. 1) (Figure 5). When the melted sample cooled from 80oC to 10oC, only one peak was observed (line no. 2) indicated only single crystal was formed. Re-heating of the sample (line no. 3) gave good superimpose with the ”line no. 1” suggested
that cooling and re-heating of the sample in this
temperature range would not do much damage on its thermal properties. Good correlation between first heating run to second heating run suggested that there was no thermal history stored in the material from the production processes (Hammer et al., 2013). No transition glass stage was observed, and hence, it formed crystalline product in this temperature range.
Figure 5. DSC thermogram of the wax sample
Enzyme reusable cycle Enzymes are proteins that speed up the rate of reactions and are not altered by the reaction. Novozym® 435 is a lipase from Aspergillus niger immobilized in acrylic resin (Novozymes, 2011). Immobilization is to aid the multiple time of uses of the enzyme to make it cost effective for commercial applications.
Figure 6 showed that Novozym® 435 could be reused up to three cycle in these experiment conditions to synthesis ester wax from fatty acids derived from cocoa butter deodorizer distillate and palmityl alcohol before a significant drop in yield was observed. The yield drop at the forth cycle was likely due to some extend of lipase leakage from Novozym® 435 during each reaction cycle (Chen et al., 2008).

186
Figure 6. Enzyme reusability. Experiment conditions: enzyme concentration at 2.4% (wt/wt) from the total amount of fatty acids being used, reaction temperature at 65oC and reaction time of 5 hours. Same
alphabet indicated no significant differences at p>0.05.
CONCLUSIONS An ester wax could be synthesised from cocoa butter free fatty acids, a by-product from cocoa butter deodorization plant, with palmityl alcohol via lipase. The ester wax produced exhibited as a single simple crystal solid in room temperature (25oC), liquid at elevated temperature of 51oC and started decomposed at 200oC and decomposed completely at 600oC into carbon dioxide and water. Immobilized enzyme of Novozymes® 435 could be re-use as much as three cycles without a significant drop in yield. The optimum conditions in producing ester wax from cocoa butter free fatty acids and palmityl alcohol with lipase Novozymes® 435 were at enzyme concentration (wt/wt) of 2.4% from the total amount of free fatty acids used, incubated and shake at 65.2oC with 150 rpm for 4.7 hours. ACKNOWLEDGEMENT The authors would like to thank the Ministry of Science, Technology and Innovation of Malaysia for the funding of this project. REFERENCES
Anon (1999). The De Zaan Cocoa Products Manual. Netherlands: ADM Cocoa B.V.
Chen, B., Hu, J., Miller, E.M., Xie, W.C., Cai, M. & Gross, R.A. (2008). Candida antarctica Lipase B Chemically Immobilized on Epoxy-Activated Micro- and Nanobeads: Catalysts for
Polyester Synthesis. Biomacromolecules, 9: 463-471.
Hammer, A., Fedelich, N., Gian, S., Hempel, E., Ni, J., Nijman, M., Riesen, R., Schawe, J., & Schubnell, M. (2013). Thermal Analysis of Polymers Selected Applications. Greifensee: Metler-Toledo AG.
Hirata, H., Higuchi, K. & Yamashina, T. (1990). Lipase- catalyzed tranesterification in organic solvent: Effect of water and solvent, thermal stability and some applications. Biotech, 14: 151-167.
Leonard, M. (2005). Module 6: Oils, Fats and Waxes. London: Society of Cosmetic Scientists.
Minifie B.W. (1982). Chocolate, Cocoa and Confectionery: Science and Technology Second Edition. Westport: AVI Publishing Company, Inc.
Novozymes A/S. (2011). Novozym® 435 Product Data Sheet. Denmark: Novozymes A/S.
Stuart, B. (2004). Infrared Spectroscopy: Fundamentals and Application. West Sussex: John Wiley & Sons, Ltd.
Yankah, V.V. & Akoh, C.C. (2000). Lipase- catalyzed acidolysis of tristearin with oleic or caprylic acids to produce structured lipids. J Am Oil Chem Soc., 77(5): 495-500.
Yap, K.C.S. (2016). Method for Producing Wax Ester Named ‘Palmityl Theobromate’.
Malaysia Patent MY-159217-A. Yap, K.C.S., Sarini,H., Aminah, A., & Sabariah,
S. (2009). Fatty acids from the cocoa butter deodorizer distillate. Journal of Science and Technology in Tropics, 5: 53-57.

187
COCOA FACE MASK COSMETIC: RESPONSE SURFACE METHODOLOGY APPLIED TO THE FORMULATION DESIGN
Wahab, N.A. and Halim, A.N.A
Malaysian Cocoa Board, Cocoa Innovation and Technology Centre, Lot Pt 12621, Nilai Industrial Park,
71800, Bandar Baru Nilai, Negeri Sembilan.
Malaysian Cocoa J. 11: 187-193 (2019) ABSTRACT – Dispersion of high percentage of cocoa products in a liquid phase for the development of cocoa face mask cosmetic has become of special interest due to its efficient way to enrich the endogenous cutaneous protection against elements of harmful external. This work aimed at investigating the effects of four independent variables, namely cocoa powder (CP), cocoa liquor (CL), lipocire DM (LDM) and kaolin (KA) on two response variables, i.e., skin adhesion and dispersion force by using central composite design (CCD). It was observed that CP, CL, LDM and KA had significant effects on the product dispersion force whereas skin adhesion level was affected significantly only by CP, CL, and LDM (p<0.05). The optimal formulation of cocoa face mask was mathematically determined to contain 22.50% (w/w) CP, 25.09 (w/w) CL, 3.75% (w/w) LDM and 17.31% (w/w) KA, achieving high level of product’s adherence to skin with
minimal dispersion force. Response surface methodology (RSM) has been shown to be a useful statistical tool in the determination of different ingredients behaviour as well as their concentrations for the studied responses, allowing an investigation being conducted on the optimization of cocoa face mask formulations with desirable properties. Key words: Cocoa face mask, central composite design, cocoa products, skin adhesion, product dispersion force INTRODUCTION Most face mask cosmetics on the market consist mainly of dried clay powder that needs to be moistened prior to use. After facial application, the product dries naturally, forming a sandy-cracked material due to the low cohesion between the dried particles. In general, the dry aspect of this type of product leads to low acceptance by domestic users because it is hard to apply and remove. Thus, incorporating cocoa liquor into cosmetic formulations, which are easy to apply and remove, is an interesting option to increase the adherence to the final product. In this context, cocoa products-enriched face masks are a viable alternative to promote the incorporation of active compounds, namely flavan-3-ols (monomers) catechin and epicatechin (monomeric units) and proanthocyanidins (also termed as procyanidins), which are polymeric compounds comprising catechin and epicatehin subunits (Zhu et al., 2002), into a cocoa layer-forming formulation that is designed to allow easy, residue-free removal. Moreover, it also provides slight moisturizing action and enhances the effect of the active compounds on the epithelium, especially as a result of the occlusive
effect caused by the polymeric layer (Baby et al., 2004). Topical application of antioxidants provides an efficient way to enrich the endogenous cutaneous protection system and thus, may be a successful strategy for diminishing UV radiation-mediated oxidative damage in the skin (Ramel et al., 2013; Bonina et al., 1996). Although formulations containing polyphenol compounds still have remarkable commercial appeal, the high technological quality of current dermocosmetics generates the need for more complex products in order to ensure their commercial viability, safety, and efficacy. Accordingly, the association of polyphenols may be an interesting alternative to add value to the final product. One of the most common topically applied plant products is cocoa bean (Theobroma cacao). Several reports indicate that this species was used for cosmetic and therapeutic purposes in ancient Mesoamerican people, and it has become a fundamental active compound for modern cosmetology (Studies, 2009; Hurst et al., 2002). The most interesting effects of cocoa products in topical use are anti-inflammatory (Selmi et al., 2006), antimicrobial (Santos et al., 2014),

188
antioxidant (David et al., 2011), and anti-aging (Giovanni et al., 2014). It has been demonstrated that the association of cocoa products exerts a beneficial synergistic effect when it comes to developing a facial mask as a regenerative aid. However, information pertaining to data on incorporation of semi-finished cocoa products particularly cocoa liquor and cocoa powder as potential ingredients which would deliver the desirable face mask property is still limited. In this study, the Response Surface Methodology (RSM) was used as a tool to analyze different parameters related to the critical characteristics of cocoa face masks, thus optimizing the final formulation. RSM is an advanced statistical tool that has outstanding applicability in a formulation design. It fosters an understanding of the relation between several variables and their effect on the responses using a sequence of designed experiments (Myers et al., 2009). In addition, RSM provides maximum information on how the investigated factors can influence the responses with minimal consumption of time and resources. Considering all of the advantages offered by this type of experimental approach, RSM is a valuable tool in research and development for both academic and industrial purposes. In this context, this study presents a proposal for the mathematical and technological development of an optimized cocoa face mask formulation in order to improve the skin adhesion, dispersion force and also to enhance the therapeutic properties of cocoa products. The association of these active compounds in a face mask formulation results in a product with high commercial appeal, which links technology with practicality. MATERIALS AND METHODS
Materials and chemical reagents Chemical reagents and other materials were obtained from the following commercial sources: cocoa liquor, cocoa powder (Barry Callebaut Malaysia Sdn. Bhd.), plurol diisostearique, compritol 888 ATO, corum 7031, lipocire DM, kaolin (Gattefossé Corporation, France), and euxyl PE 9010 (Schülke & Mayr GmbH, Germany). All samples and solutions were prepared with water purified by reverse osmosis (OS20LZ, Gehaka). All other materials were of cosmetic grade.
Preparation of cocoa face masks The base formulation (Table 1) was set according to previously published data (Baby et al., 2004; Vieira et al., 2009; Nishikawa et al., 2007), and the concentrations of the ingredients to be employed were determined experimentally.
Table 1. Concentrations of each component of the base formulation of cocoa face mask Component Concentrations
(%; w/w) Cocoa liquor (CL) Cocoa powder (CP) Plurol diisostearique Euxyl PE 9010 Compritol 888 ATO Corum 7031 Lipocire DM (LDM) Kaolin (KA) Water q.s.
15.0-30.0 15.0-30.0
6.50 0.40 1.96 7.80
2.25-4.50 11.54-23.08
100 Note: q.s. quantity sufficient Although the concentrations of some compounds varied according to the experimental design (Table II), the preparation procedure was the same for every formulation. Initially, all the ingredients were dispersed in the heated water (80oC) used to produce the formulation. The dispersion was constantly homogenized until total dissolution using an ultrahomogenizer (Silverson L5M-A, MA US) at 2,400 rpm for 6 min. After preparation, every formulation was left to rest for 48 h before any evaluation in order to release the air incorporated into the formulation during the ultrahomogenization. Experimental design The effect of 4 independent variables, (CP),
(CL) (LDM) and (KA) on 2 response variables ( and , namely Skin Adhesion Level and Dispersion Force) was evaluated by using the RSM. A four-factor central composite design (CCD) was as follows; (1) to study the main and combined effects of main ingredients on the physical parameters of cocoa facial mask, (2) to create models between the variables, and (3) to determine the effect of these variables to optimize proportion of the ingredients in terms of response variables leading to the desirable goals. Therefore, 31 formulations were assigned based on the second-order CCD with 4 independent variables at 5 levels of each variable. The independent variable ranges were: CP (15.0−30.0% w/w), CL (15.0−30.0% w/w),

189
LDM (2.25-4.50% w/w) and KA (11.54−23.08% w/w). The matrix of the CCD including the values corresponding to the levels of factors is shown in Table 2.
Table 2. Levels of independent variables established according to the central
composite design (CCD) Levels CL CP LDM KA
(%; w/w) Axial (-) 7.5 7.5 1.13 5.77 Low 15.0 15.0 2.25 11.54 Centre 22.5 22.5 3.38 17.31 High 30.0 30.0 4.50 23.08 Axial (+) 37.5 37.5 5.63 28.85
Dispersion force evaluation The dispersion force or applicability of each formulation was estimated based on a sensorial score. The score is cumulative, and this approach allowed an internal comparison of the experimental design formulations. The formulations were applied on a smooth translucent glass surface and the sensorial score ranged between 0 and 10. The points observed were as follows: “easy spreadability?,” “good
sensory properties?,” “user-friendly application?,” “pleasing appearance?,” and
“remains on the surface without sagging?.” For
each applicability-related positive response, one point was added to the score of the formulation analyzed, and the higher the score, the better the applicability of the formulation. The final value was determined as the average of the scores assigned by five observers (André et al., 2013). Skin adhesion Approximately 2.0 g of each formulation was spread over a millimeter-marked glass plate of 120×120 mm, forming a uniform mask layer of 13.8 mg/cm2 with a thickness of approximately 1.0 mm. The mask layer in this evaluation was thinner than that usually applied in order to facilitate the detection of flaws in the film formation. The glass plate was submitted to a heated environment in the oven (37.0±2.0°C) in order to simulate skin temperature. The sensorial score ranged between 0 and 10 as follows: “is
there film formation?,” “is the film formed
homogeneous?,” “50% of the surface covered?,”
“80% of the surface covered?,”and “100% of the
surface covered?.” The score is cumulative, and
this approach allowed internal comparison
across the experimental design formulations. For each positive response, one point was added to the score of the formulation analyzed, and thus, the higher the score, the better the skin adhesion performance of the formulation. The final value was determined as the average of the scores assigned by five observers (André et al., 2013). RESULTS AND DISCUSSION
Experimental design Among the several factors that determine the feasibility of producing cocoa face masks, knowledge concerning the behaviour of factors related to skin adhesion and applicability or product’s dispersion force, is crucial when it
comes to developing high quality formulations. Product’s dispersion force is an important
parameter to be evaluated since low acceptance by domestic users may compromise the commercial viability of cosmetic products. Another response taken into consideration was the skin adhesion performance of each formulation because the principle of cocoa face masks is based on their ability to adhere to skin long enough in order to allow easy, residue-less removal. LDM and KA are compounds known for their capacity to alter the viscosity of formulations, which may influence applicability and skin adhesion. Thus, the product’s
dispersion force and skin adhesion performance were the responses evaluated in the experimental design. The practical loading efficiency of cocoa liquor as well as powder in all the formulations were found to be 60.0%. None of the formulation parameters significantly influenced the loading efficiency. The quadratic model for all responses was the model maximizing the “adjusted R2” and the “predicted R2”
coefficients. The ANOVA of the independent variables for each response is discussed below. Factors influencing the dispersion force and skin adhesion Viscosity is the main dispersion force-related or applicability characteristic of the formulation. The quadratic term for the KA factor (p=0.000) was strongly significant, indicating that a nonlinear relationship was observed for this factor (Figure 1A).

190
However, the interaction between KA
and CL (p<0.05) was also significant, which indicates that the two factors should be evaluated concomitantly. As shown in Figure 1A, the combinations that led to formulations with the highest applicability indexes (>4) were those combining high KA with low CL amount. These formulations had ideal applicability because the inverse combination of KA and CL concentrations led to an optimum viscosity for facial application. However, formulations containing low concentrations of both KA and CL were too fluid whilst those containing high concentrations of both were too much like a paste, which results in low levels of applicability.
LDM concentration was the most important factor influencing the skin adhesion performance of the cocoa face masks (p<0.05). It was verified that the quadratic term for LDM was strongly significant (p=0.000), indicating that the influence of LDM concentration on the skin adhesion performance was nonlinear (Figure 1B). A plateau was observed at concentrations above 4% (w/w), indicating that
an increase in LDM concentration was not recommended above this level since the increase in skin adhesion performance would not be proportional. Figure 1B showed that the skin adhesion level to be at its finest requirement when the CP content (%; w/w) decreased whereas LDM (%; w/w) was increasing. In other word, formulations containing low concentrations of CP but high of LDM may results in high skin adhesion level which is greatly required in a facial mask preparation. Optimized mask formulation The agreement between adjusted R2 and predicted R2 values (Table 3; difference, <0.2) of the mathematical models obtained by RSM allows one to safely predict the best formulation of cocoa face masks, based on pre-established criteria. The numerical optimization finds a point that maximizes the desirability function. The characteristics of a goal can be altered by adjusting the weight and importance. For several responses and factors, all goals are combined into one desirability function.
Figure 1. Response surface exhibited significant (p<0.05) interaction effects on the variation of
(A) Dispersion Force, and (B) Skin Adhesion Level
(A)
(B)

191
Desirability is an objective function that ranges from zero (outside of the limits) to one (at the goal) and its value is completely dependent on
how close the set lower and upper limits are in relation to the actual optimum.
To establish these criteria, focus was directed toward the maximization of the skin adhesion and minimization of dispersion force. According to the data obtained through the statistical analysis (Table 3; Figure 1), the objective of the optimization was to minimize the CL concentration because the inverse proportion of CL and KA should be maintained in order for high applicability to be achieved. Meanwhile, the KA concentration could not be lowered because the enhancement of the skin adhesion performance is also desired. Both the KA and the LDM concentrations were maximized with careful observation of the plateau reached at the higher concentrations of both compounds, thus avoiding a non-efficient increase in these factors without a proportional increase in the responses. The criteria to find the best overall factor setting are a desirability
function from multiple response optimization (Derringer and Suich, 1980). Desirability function for multiple response optimization One useful approach to optimization of multiple responses is to utilize the simultaneous optimization technique popularized by Derringer and Suich (1980). When there is more than one response variable, factor setting need to be obtained which suitable to optimize all response variables according to a criteria due to the fact that certain factor settings may yield a high desirability for one response, but desirability for other responses (Fuller and Scherer, 1999). The criteria to find the best overall factor setting are a desirability function. The overall desirability (D) is a measure of how well a researcher has satisfied the combined goals for all responses
Table 3. Significant model terms, regression coefficient values, and analysis of variance (p values) for the responses of the experimental design
Polynomial term Dispersion Force (quadratic model)
Skin Adhesion (quadratic model)
Coefficient p value Coefficient p value Model Intercept A: Cocoa Powder B: Cocoa Liquor C: Lipocire DM D: Kaolin A2 B2 C2 D2 AB A C AD BC BD CD R2 Adjusted R2 Predicted R2
- -28.4409 0.9001 0.3903 2.6260 1.5768 -0.0134
- -0.4631 -0.0351
- - - -
-0.0156 -
0.837 0.778 0.721
<0.05 -
0.000 0.011 0.069 0.000 0.007
- 0.030 0.000
- - - -
0.059 -
- 8.629
-0.3709 0.5515 -0.0254
- -0.0085 -0.0137 -0.3134
- -
0.1308 - - - -
0.893 0.861 0.765
<0.05 -
0.057 0.002 0.984
- 0.019 0.000 0.048
- -
0.000 - - - -

192
(Fitrianto and Midi, 2012). In this study, the individual desirability values for the applicability and skin adhesion performance were 0.9901 and 0.9999, respectively. Nevertheless, the combined desirability function of the formulation was 0.7922 in which the applicability and skin adhesion performance predicted by this model were 8.133, and 7.717,
respectively (Figure 2). The problem is solved through composite desirability. A value of composite desirability of D = 0.7922 has been obtained in order to get a factors setting which optimized all response variables. The factors setting are 22.50% (w/w) CP, 25.09 (w/w) CL, 3.75% (w/w) LDM and 17.31% (w/w) KA (Figure 2).
CONCLUSIONS The dispersion force of formulations was considerably influenced by both the CL and KA concentrations as a result of their ability to alter the formulation viscosity whereas skin adhesion performance was affected by the CP and LDM concentrations. The fitted model is then used to obtain optimum response variables. The optimum range of input variables that produced desired formulation was estimated through the use of composite desirability function. As a result, the optimized formulation of the cocoa face mask was mathematically determined as that containing 22.50% (w/w) CP, 25.09 (w/w) CL, 3.75% (w/w) LDM and 17.31% (w/w) KA, achieving high levels of applicability and skin adhesion performance.
ACKNOWLEDGEMENT The authors would like to acknowledge the financial support provided by the Malaysian Cocoa Board (MCB) and for technical assistance by staff of the Cocoa Innovation and Technology Centre, Nilai, Negeri Sembilan. REFERENCES
André, O.B., Julia, M.R., Hellen, K.S., Rosane,
M.B. and Diva, S. (2013). Green clay and aloe vera peel-off facial masks: response surface methodology applied to the formulation design. AAPS PharmSciTech, 14: 445-455.
Figure 2. Response optimizer shows the multiple response optimizer in the determination of optimum levels of cocoa powder, cocoa liquor, lipocire DM and kaolin for the dispersion
force and skin adhesion which were predicted at 8.133 and 7.171, respectively.

193
Baby, A.R., Zague, V., Maciel, C.P.M., Kaneko, T.M., Consiglieri, V.O. and Valesco, M.V.R. (2004). Development of cosmetic mask formulations. Braz. J. Pharm. Sci., 40: 159-161.
Bonina, F., Lanza, M., Montenegro, L., Puglisi,
C., Tomaino, A., Trombetta, D., Castelli, F. and Saija, A. (1996). Flavonoids as potential protective agents against photo-oxidative skin damage. Int. J. Pharm., 145: 87-94.
David, L.K., Kim, D. and Ather, A. (2011).
Cocoa and chocolate in human health and disease. Antioxid. Redox Sign, 15: 2779-2811.
Derringer, G. and Suich, R. (1980).
Simultaneous optimization of several response variables. J. Qual. Technol., 12: 214-219.
Fitrianto, A. and Midi, H. (2012). Multi-
response optimization via desirability function for the black liquor DATA. J. Sci. Technol., 4: 91-102.
Fuller, D. and Scherer, W. (1999). The
desirability function: underlying assumptions and application implications. IEEE Int. Conf. Syst. Man Cybern. p. 4016-4021.
Giovanni, S., Sergio, D., Laura, D.R., Antonino,
D.L., Hector, H.O., Giuseppe, M., Arrigo, F.C. and Salvador, G. (2014). Cocoa bioactive compounds: Significance and potential for the maintenance of skin health. Nutrients, 6: 3202-3213.
Hurst, W.J., Tarka, S.M., Powis, T.G. and
Valdez, F. (2002). Archaeology: Cacao usage by the earliest Maya civilization. Nature, 418: 289-290.
Myers, R.H., Montgomery, D.C. and Anderson-
Cook, C.M. (2009). Response surface methodology: process and product optimization using designed experiments. 3rd ed. New York: Wiley.
Nishikawa, D.O., Zague, V., Pinto, C.A.S.O.,
Vieira, R.P., Kaneko, T.M. and Velasco, M.V.R. (2007). Avaliação da estabilidade de máscaras faciais peel-off contendo rutina. J. Basic Appl. Pharm. Sci., 28: 227-32.
Ramel, F., Mialoundama, A.S. and Havaux, M.
(2013). Nonenzymic carotenoid oxidation and photooxidative stress signalling in plants. J. Exp. Bot., 64: 799-805.
Santos, R.X., Oliveira, D.A., Sodré, G.A.,
Gosmann, G., Brendel, M. and Pungartnik, C. (2014). Antimicrobial activity of fermented Theobroma cacao pod husk extract. Genet. Mol. Res., 13: 7725-7735.
Selmi, C., Mao, T.K., Keen, C.L., Schmitz, H.H.
and Eric, G.M. (2006). The anti-inflammatory properties of cocoa flavanols. J. Cardiovasc. Pharmacol., 47: 163-171.
Studies, S. (2006). Cacao in the Yukatek Maya
Healing Ceremonies of Don Pedro Ucán Itza. In: Diane Z.C. & Arlen F.C. (Eds.), Chocolate in Mesoamerica: A cultural history of cacao. The University Press of Florida: Cameron L. McNeil, 2006. p. 408-428.
Vieira, R.P., Fernandes, A.R., Kaneko, T.M.,
Consiglieri, V.O., Pinto, C.A.S.O. and Pereira, C.S.C. (2009). Physical and physicochemical stability evaluation of cosmetic formulations containing soybean extract fermented by Bifidobacterium animalis. Braz. J. Pharm. Sci., 45: 515-525.
Zhu, Q.Y., Holt, R.R., Lazarus, S.A., Orozco,
T.J. and Keen, C.L. (2002). Inhibitory effects of cocoa flavanols and
procyanidin oligomers on free radical-induced erythrocyte haemolysis. Exp. Biol. Med., 227: 321-329.

194
CHARACTERIZATION ON THE COLOUR OF THE DRIED COCOA BEANS FROM DIFFERENT FERMENTATION DURATION USING A SHALLOW BOX
Khairul Bariah S.1, Fadzillah A.2, and Husin S.1
1Division of Downstream Technology, Cocoa Research & Development Centre Bagan Datuk, Malaysian Cocoa Board, P.O. Box 30, Sg. Dulang Road,36307 Sg. Sumun, Perak, Malaysia.
2Food Technology Division, School of Industrial Technology, Universiti Sains Malaysia, 11800 Pulau Pinang, Malaysia, Malaysia
Malaysian Cocoa J. 11: 194–201 (2019)
ABSTRACT - One of the physical quality of dried cocoa beans is the fermentation level and monitor based on the changes of surface colour of cocoa cotyledons. However, knowledge of the related compounds involves in the colour changes of dried cocoa beans is still lacking as compared to wine. Therefore, this study was carried out to characterize the surface colour and the related compounds of the Malaysian dried cocoa beans produced by different fermentation duration. The surface colour is assessed by the cut test while the related compounds using the high-performance liquid chromatography-variable wavelength detector. The study indicated the slaty beans percentages were reduced as fermentation duration extended. At the same time, the possibility of purple-brown and fully brown to presence is increased. Isolation of colour related compounds identified chlorogenic acid, vanillic acid, catechin, caffeic acid, ferulic acid and protocatechuic acid are involved in a browning reaction. Key words: Cocoa beans, colour, compound, fermentation, HPLC-VWD INTRODUCTION Cut test is a visual examination to monitor physical quality of the dried cocoa beans including the fermentation level. The fermentation level is based on changes of cocoa cotyledons colour from deep purple, pink, ivory or a mottle mixture of the three colour (Cakirer et al., 2010) to pale lilac, pinkish or cream during fermentation (Lopes and Pires, 2014). The cotyledons colour will further transformed during the drying process into the slaty, fully purple, purple-brown, and fully brown (Beckett et al., 2017). The level of fermentation is determined by counting the total of beans in each colour group and expressed in a percentage (MS 230:2007; MS 293:2005).
A cocoa seeds is known to be rich
with polyphenols and the predominantly components are proanthocyanidins, flavanols and anthocyanin (Kongor et al., 2016; Bordiga et al., 2015; Voigt and Lieberei, 2014). The cotyledons colour is primarily reported due to the natural pigment of anthocyanins and classified into six major types namely pelargonidin, cyanidin, peonidin, delphinidin, petunidin and malvidin. In which, the cyanidin types are responsible for the colour
characteristic in the cocoa seeds (Wallace and Giusti, 2011; Cakirer et al., 2010). The colour variations also have been reported from type-specific differences in phenolic compounds within cocoa seed (Elwers et al., 2009). During fermentation, the colour changes as a result of changes in anthocyanins and oxidation products of the polyphenol oxidase (PPO) activities (Afoakwa et al., 2012). The anthocyanins have been reported to be hydrolyzed and producing a component of anthocyanidins and sugar, while leucocyanidins can be dimerised (Misnawi et al., 2004). After undergoing serial transformations with changes in the nib pH, this will be resulted in quinonoidal bases form. This quinonoidal form has been suggested to intermolecular bound with proteolysis products of proteins such as hydrophobic amino acids and oligopeptides to form a high-molecular-weight tannin (Brillouet and Hue, 2017; Counet, et al., 2004). Hence, these can decreases the astringency of cocoa beans and forming to the brown colour typical of well-fermented cocoa beans (Ackar et al., 2013).
Furthermore, the colour changes has
been documented to be associated with the cocoa varieties and post-harvest handling including pod storage and fermentation
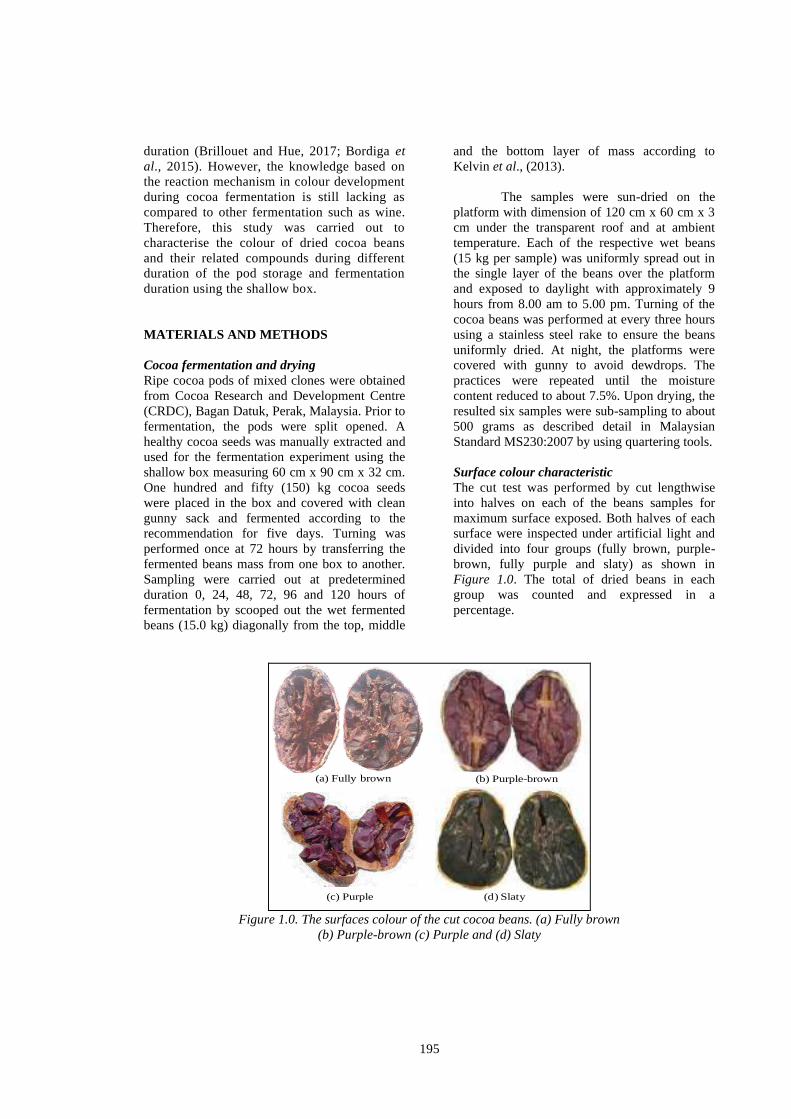
195
duration (Brillouet and Hue, 2017; Bordiga et al., 2015). However, the knowledge based on the reaction mechanism in colour development during cocoa fermentation is still lacking as compared to other fermentation such as wine. Therefore, this study was carried out to characterise the colour of dried cocoa beans and their related compounds during different duration of the pod storage and fermentation duration using the shallow box.
MATERIALS AND METHODS
Cocoa fermentation and drying Ripe cocoa pods of mixed clones were obtained from Cocoa Research and Development Centre (CRDC), Bagan Datuk, Perak, Malaysia. Prior to fermentation, the pods were split opened. A healthy cocoa seeds was manually extracted and used for the fermentation experiment using the shallow box measuring 60 cm x 90 cm x 32 cm. One hundred and fifty (150) kg cocoa seeds were placed in the box and covered with clean gunny sack and fermented according to the recommendation for five days. Turning was performed once at 72 hours by transferring the fermented beans mass from one box to another. Sampling were carried out at predetermined duration 0, 24, 48, 72, 96 and 120 hours of fermentation by scooped out the wet fermented beans (15.0 kg) diagonally from the top, middle
and the bottom layer of mass according to Kelvin et al., (2013). The samples were sun-dried on the platform with dimension of 120 cm x 60 cm x 3 cm under the transparent roof and at ambient temperature. Each of the respective wet beans (15 kg per sample) was uniformly spread out in the single layer of the beans over the platform and exposed to daylight with approximately 9 hours from 8.00 am to 5.00 pm. Turning of the cocoa beans was performed at every three hours using a stainless steel rake to ensure the beans uniformly dried. At night, the platforms were covered with gunny to avoid dewdrops. The practices were repeated until the moisture content reduced to about 7.5%. Upon drying, the resulted six samples were sub-sampling to about 500 grams as described detail in Malaysian Standard MS230:2007 by using quartering tools.
Surface colour characteristic The cut test was performed by cut lengthwise into halves on each of the beans samples for maximum surface exposed. Both halves of each surface were inspected under artificial light and divided into four groups (fully brown, purple-brown, fully purple and slaty) as shown in Figure 1.0. The total of dried beans in each group was counted and expressed in a percentage.
(a) Fully brown (b) Purple-brown
(c) Purple (d) Slaty
Figure 1.0. The surfaces colour of the cut cocoa beans. (a) Fully brown (b) Purple-brown (c) Purple and (d) Slaty

196
Isolation of colour-related compound All of the dried cocoa beans which were cut into halves from the previous section (2.2) were further analysis on the compounds which related to browning reaction. The testa or shell was removed from the beans and the obtaining nibs were ground into powder using the analytical grinder. About 2.0 g was defatted according to Niemenak et al., (2006) with slight modification by suspending the powder in 10 mL of n-hexane. The mixtures were vortexed vigorously for 30 min, then centrifuged (5000 rpm, 10 min, 4°C) using bench top centrifugation (Hermle Z400K, Germany). The supernatant was discarded and the defatting procedure repeated for three times. Lastly, the remaining powder was flushed with 30 mL n-hexane in a Buchner funnel before dried.
Isolation of the colour-related compounds was performed according to Cakirer (2003) and Engida et al., (2015) with slight modification. The defatted powder (0.5 g) was homogenized in 30 ml methanol: HCl (97:3) solution for 5 min before incubated at 4ᴏC overnight. Next, the samples were centrifuged at 5800 rpm for 5 min and supernatants collected. The supernatants (about 25.0 mL) from each sample were dried under nitrogen to further examined using High-Performance Liquid Chromatography (HPLC) together with a Variable Wavelength Detector (VWD). Using the same tube, the obtaining powder of each samples was quickly redissolved by adding 2.0 mL HPLC buffer (95:5 v/v 0.05 M sodium phosphate buffer pH 2.5: Methanol) and filtered through a 0.45 µm filter before HPLC injection. The HPLC system (Agilent 1100 Series, USA) was fitted with a 250 × 4.60 mm Synergi 4 µm MAX-RP 80A column (Phenomenex, Torrance, Calif., USA) and set to a constant temperature of 25°C. Two solvent were used as mobile phase, in which Solvent A consisted of 0.05 M sodium phosphate buffer pH 2.5 and Solvent B was 100% methanol. The gradient solvent program was designed as follows: 0.00-minute 5% B, 12.5-minutes 30% B, 33-minutes 45% B, 37.5-minutes 50% B, decreased to 5% B for 40-minutes and held for another 45 min. An aliquot (15 µL) of each samples was injected into the HPLC system and
eluted at room temperature at a constant flow rate of 1.2 mL/minute. The polyphenols compound which related to browning was identified based on retention time and spectral matching through comparison with HPLC fingerprints of standard phenolic acid compounds in polyphenols database setup for the lab. The database contains HPLC fingerprinting of 15 phenolic acid compounds such as gallic acid, catechin, chlorogenic acid, caffeic acid, vanillic acid, syringic acid, coumaric acid, benzoic acid, ferulic acid, sinapic acid, quercetin, myricetin, luteolin, protocatechuic acid and apegenin. RESULTS AND DISCUSSION
Surface colour characteristic The colour percentages of all the six dried cocoa beans at different duration are presented in Table 1.0. The study observed that the percentages of the slaty and fully purple beans had been decreased significantly as duration of fermentation was extended to 120 hours. In which, the percentages of the slaty beans is below 3% after 24 hours of fermentation and complied with the standard limit in grading cocoa beans specification especially in Malaysian Standard (MS293:2005). In contrast, the percentages of the fully brown beans had been increased significantly as fermentation duration extended to 120 hours and complied 60% of the Malaysian Standard requirement after 72 hours of the fermentation. Whereas, the percentages of the purple-brown beans had been increased and decreased significantly as duration of fermentation was extended to 120 hours. The slaty bean is classified as defective beans with more than 50% of the cotyledons are gray, rubbery texture and hard to cut (Niemenak et al., 2014). Processing the beans into powder or chocolate will result in bluish-gray with a low cocoa aroma and weak cocoa/chocolate taste. The products will be masked with an excessive taste of bitterness and astringency (Lima and Rob Nout, 2014). The percentage of the slaty beans which was high in the dried unfermented cocoa beans was in agreement with earlier findings, whereby drying the unfermented cocoa subsequently after pods have been opened will result in slaty beans (Niemenak et al., 2014; Lima and Rob Nout, 2014).

197
Table 1.0. Colour characteristic of all the six dried cocoa beans.
Fermentation Duration (Hour)
Total percentage of bean colour (%)
Fully Brown Purple Brown
Fully Purple Slaty
0 0. 0 ± 0.0e 22.5 ± 1.5bc 34.5 ± 9.0a 42.3 ± 8.3a
24 35.0 ± 2.2d 49.7 ± 2.1a 10.5 ± 2.7b 2.7 ± 0.5b
48 51.0 ± 2.2c 49.0 ± 2.6a 3.5 ± 1.0b 0. 0 ± 0.0b
72 70.8 ± 3.5b 28.8 ± 3.1b 0.2 ± 0.2b 0. 0 ± 0.0b
96 79.0 ± 1.8b 19.3 ± 0.8c 0. 0 ± 0.0b 0. 0 ± 0.0b
120 90.5 ± 1.4a 9.8 ± 1.5d 0. 0 ± 0.0b 0. 0 ± 0.0b
According to Mikkelsen, (2010), the percentage of the fully purple beans which has been allowed in grade I Ghana dried cocoa beans is 20% and 45% in grade II. If any batch of the dried cocoa beans consists more than 45% of the fully purple beans they will be rejected and sold to the cosmetic industry. However, the percentages of the fully purple beans which is allowed in Malaysian cocoa beans are not stated in the Malaysian Standard (MS293:2005). The fully purple beans are suggested to be associated with improper fermentation as the colour of all the dried cocoa beans are believed to change from the slaty at the beginning of fermentation to the fully brown when dried at the end of the fermentation process. While, CAOBISCO/ECA/FCC (2015) has not classified the purple-brown beans as defective cocoa beans. The purple-brown beans present should be at least to the extent of 20% in the batch of the dried cocoa bean. Adzaho (2007) stated that approximately 30% to 40% of the purple-brown beans was still acceptable but the batch of dried cocoa beans might probably be inadequately fermented and pronounced bitter and astringent flavour when the purple-brown beans were more than 50%. Isolation of Colour-related Compound The chromatograms derived from High-Performance Liquid Chromatography (HPLC) coupled with a Variable Wavelength Detector (VWD) presented in Figure 2.0. Overall, a total of eleven chromatographic peaks detected in the dried cocoa beans at zero hours of the fermentation duration and similar to 48 hours. Only three peaks for 24 hours, while nine, ten and six of chromatographic peaks were detected for 72, 96 and 120 hours of the fermentation
duration, respectively. However, only six of all the chromatographic peaks were identified by comparing their retention times and spectra data with the spectral library. The six compounds were chlorogenic acid, vanillic acid, catechin, caffeic acid, ferulic acid and protocatechuic acid and their existence was summarized in Table 2.0.
Chlorogenic acid, vanillic acid, catechin, caffeic acid, ferulic acid and protocatechuic acid belong to the phenolic acid group. Their roles especially chlorogenic acid, catechin, caffeic acid and ferulic acid in browning reaction either enzymatic or non-enzymatic in fruit are widely reported. The chlorogenic, caffeic and ferulic acid, for example, are proposed as precursor molecules for anthocyanin. On the other hand, protocatechuic acid has structural similarity with gallic acid, caffeic acid, vanillic acid, and syringic acid which are well-known antioxidant compounds (Heras-Roger et al., 2016; Teixeira et al., 2013; Galland et al., 2007). In addition, the chlorogenic are documented to form an important intermediate compound of chlorogenic acid quinone (CQA-Q) when oxidized enzymatically by polyphenol oxidase (PPO). Muñoz et al., (2007), in their study to evaluate the CQA properties and its relationship with browning has revealed that CQA-Q or mixture of CQA-Q and amino acids do not form intensive brown pigments in the acidic aqueous solution. They have suggested that other polyphenols might have played an important role in the formation of the brown colour by enzymatic browning.

198
Figure 2.0. The HPLC-VWD chromatograms at different fermentation duration.
(a) 0 hours, (b) 24 hours, (c) 48 hours, (d) 72 hours, (e) 96 hours and (f) 120 hours.

199
Table 2.0. Colour-related compounds identified at different fermentation duration.
Fermentation duration (hours)
Chlorogenic Acid
Vanillic Acid
Catechin Caffeic Acid
Ferulic Acid
Protocatechuic acid
0 + + + + + +
24 + nd + + nd nd
48 + nd + + + +
72 + nd + + + +
96 + + + + + +
120 + nd + + + nd
nd denote as not detected CONCLUSIONS
As a conclusion, the slaty and fully purple beans percentages were reduced and at the same time, increase the possibility of purple-brown and fully brown to presence. Cocoa seeds required minimum 72 hours of fermentation using the shallow box to achieve 60% of fully brown and without slaty. In addition, isolation of colour related compounds identified chlorogenic acid, vanillic acid, catechin, caffeic acid, ferulic acid and protocatechuic acid are involved in a browning reaction. ACKNOWLEDGEMENT
The study was supported by the ScienceFund 06-03-13-SF0115 under MOSTI, Malaysia. The authors would like to thank the Director General; YBhg. Datin Norhaini Udin and Dr Sabariah Samsuddin, the Director of Cocoa Downstream Technology, Malaysian Cocoa Board for permission to present this paper. REFERENCES Ackar, D., Lendić, K.V., Valek, M. Šubarić,
Miličević, B., Babić, J. & Nedić, I. (2013).
Cocoa polyphenols: Can we consider cocoa and chocolate as potential functional food? Journal of Chemistry, 2013:7. Adzaho, D. K. (2007). Studies of occurrence of purple beans in cocoa produced in Ghana. Master thesis, University of Cape Coast, Ghana.
Afoakwa, E.O., Quao, J., Budu, A.S., Takrama, J.F. & Saalia, F.K. (2012). Influence of pulp pre-conditioning on fermentative quality in Ghanaian cocoa (Theobroma cacao) beans. International Food Research Journal, 19: 59 - 66.
Beckett S.T., Fowler, M.S. & Ziegler, G.R. (eds).
(2017). Beckett's Industrial Chocolate Manufacture and Use. John Wiley & Sons, Chichester, United Kingdom.
Bordiga, M., Locatelli, M., Travaglia, F., Coïsson,
J. D., Mazza, G., & Arlorio, M. (2015). Evaluation of the effect of processing on cocoa polyphenols: Antiradical activity, anthocyanins and procyanidins profiling from raw beans to chocolate. International Journal of Food Science and Technology, 50(3): 840 - 848.
Brillouet, J.M. & Hue, C. (2017). Fate of
proanthocyanidins and anthocyanins along fermentation of cocoa seeds (Theobroma cacao L.). Journal of Applied Botany and Food Quality, 90: 141 - 146.
Cakirer, M.S. (2003). Color as an indicator of
flavanol content in the fresh seeds of Theobroma cacao L. Master Thesis. Pennsylvania State University, USA.
Cakirer, M.S., Ziegler, G.R. & Guiltinan, M.J.
(2010). Seed color as an indicator of flavanol content in Theobroma cacao L. Chocolate, fast foods and sweeteners: Consumption and health, pp: 257-270. Nova Science Pub. Inc, New York.

200
CAOBISCO/ECA/FCC. (2015). Cocoa beans: Chocolate and cocoa industry quality requirements. September 2015 (End, M.J. and Dand, R. Editors). ECA-Caobisco-FCC Cocoa.
Counet, C., Ouwerx, C., Rosoux, D. & Collin, S.
(2004). Relationship between procyanidin and flavor contents of cocoa liquors from different origins. Journal of Agricultural and Food Chemistry, 52: 6243-6249.
Elwers, S., Zambrano, A., Rohsius, C. & Lieberei,
R. (2009). Differences between the content of phenolic compounds in Criollo, Forastero and Trinitario cocoa seed (Theobroma cacao L.). European Journal of Food Research and Technology, 229: 237 – 948.
Engida, A.M., Faika, S., Nguyen-Thi, B.T. & Ju,
Y.S. (2015). Analysis of major antioxidants from extracts of Myrmecodia pendans by UV/visible spectrophotometer, liquid chromatography/tandem mass spectrometry and high-performance liquid chromatography/UV techniques. Journal of Food and Drug Analysis, 23: 303 - 309.
Galland, S., Mora N., Abert-Vian, M.,
Rakotomanomana, N. & Dangles, O. (2007). Chemical synthesis of hydroxycinnamic acid glucosides and evaluation of their ability to stabilize natural colors via anthocyanin copigmentation. Journal of Agricultural and Food Chemistry, 55: 7573 – 7579.
Heras-Roger, J., Alonso-Alonso, O., Gallo-
Montesdeoca, A., Díaz-Romero, C., & Darias-Martín, J. (2016). Influence of copigmentation and phenolic composition on wine color. Journal of Food Science and Technology, 53(6): 2540–2547.
Kelvin, L., Sabariah, S., Khairul Bariah, S.,
Hanim, H. H., Rahmat, M., Wan Aida, W. I. & Amirul, A. A. (2013). Final Project Report: Enhancing cocoa bean quality using microbial fermentation, The Malaysian Cocoa Board (MCB) and Barry Callebaut Collaboration. 1- 60.
Kongor, J.E., Hinneha, M., deWalle, D.V., Afoakwa, E.O., Boeckx, P. & Dewettinck, K. (2016). Factors influencing quality variation in cocoa (Theobroma cacao) bean flavour profile - A review. Food Research International, 82: 44–52.
Lima, L.J.R. & Nout, M.J.R. (2014). Quality and
safety of cocoa beans. In: Schwan, R.F. and Fleet, G.H., (eds). Cocoa and Coffee Fermentations, pp: 227-269. CRC Press, Taylor & Francis Group, Boca Raton.
Lopes, U.V & Pires, L.J. (2014). Botany and
production of cocoa. In: Schwan, S.F. and Fleet, G.H. (eds). Cocoa and Coffee Fermentation, pp: 43-70. CRC press, Boca Raton.
Malaysian Standard MS 230:2007. Cocoa beans -
Sampling method for grading (1st Revision). SIRIM, Shah Alam.
Malaysian Standard MS 293:2005. Specification
for grading of Malaysian Cocoa Beans (4th Revision). SIRIM, Shah Alam.
Mikkelsen, L. (2010). Quality control along the
primary processing chain of cocoa beans from harvesting to export. Dissertation. Faculty of Life Sciences, University of Copenhagen, Denmark. http://www.chokoladeselskabet.dk/Ghana-rapport.pdf.
Misnawi, Jinap, S., Jamilah, B. & Nazamid, S.
(2004). Sensory properties of cocoa liquor as affected by polyphenol concentration and duration of roasting. Food Quality and Preference, 15: 403–409.
Munoz, J., Garcıa-Molina, F., Varon, R.,
Rodriguez-Lopez, J.N., Garcia-Ruiz, P.A., Garcıa Canovas, F. & Tudela, J. (2007).
Kinetic characterization of the oxidation of chlorogenic acid by polyphenol oxidase and peroxidase. Characteristics of the o-quinones. Journal of Agricultural and Food Chemistry, 55: 920 - 928.
Niemenak, N., Eyamoa, J.A., Onomoa, P.E. &
Youmbic, E. (2014). Physical and chemical assessment quality of cocoa beans in south

201
and center regions of Cameroon. Syllabus Review, Science Series, 5: 27 – 33.
Niemenak, N., Rohsius, C., Elwers, S.,
Ndoumoua, D.O. & Lieberei, R. (2006). Comparative study of different cocoa (Theobroma cacao L.) clones in terms of their phenolics and anthocyanins contents. Journal of Food Composition and Analysis, 19: 612–619.
Teixeira, B., Marques, A. & Ramos, C. (2013).
Chemical composition and bioactivity of different oregano (Origanum vulgare) extracts and essential oil. Journal of the
Science of Food and Agriculture, 93(11): 2707 - 2714.
Voigt, J. & Lieberei, R. (2014). Biochemistry of
Cocoa Fermentation. In: Schwan, S.F. and Fleet, G.H. (Eds.). Cocoa and Coffee Fermentation (pp. 194 - 226). Boca Raton: CRC Press.
Wallace, T.C. & Giusti, M.M. (2011). Selective
removal of the violet color produced by anthocyanins in procyanidin-rich unfermented cocoa extracts. Journal of Food Science, 76(7): 1010 - 1017.

202
ANTI-WRINKLES GEL CONTAINING COCOA POD EXTRACT: EFFECT OF COCOA POD EXTRACT ON FIBROBLAST CELL VIABILITY AND MMP-1 GENE EXPRESSION
Azila Abdul Karim1 2, Nur Azilah Abdullah1, Azrina Azlan2 3, Roslina Mohd Shah4 and David Afong4
1Cocoa Innovation & Technology Centre, Malaysia Cocoa Board, Lot PT12621, Nilai Industrial Area off Taman Semarak, 71800 Nilai, Negeri Sembilan, Malaysia
2 Halal Products Research Institute, Universiti Putra Malaysia, 43400 UPM Serdang, Selangor 3Fakulti Perubatan dan Sains Kesihatan, Universiti Putra Malaysia, 43400 UPM Serdang, Selangor
4 Cocoa Biotechnology Research Centre, Malaysia Cocoa Board, Zon Komersial 1, KKIP Selatan Jalan Norowat, 80460 Taman Perindustrian Kota Kinabalu, Sabah
Corresponding author: [email protected]
Malaysian Cocoa J. 11: 202-215 (2019) ABSTRACT - Cocoa pod is an abundant waste of the cocoa industry. About 75% weight percentage of the cocoa fruits is the pod. The pods has variety of color which could resemble the active compound with antioxidant activity. Usually, the cocoa pod has been used as fertilizer, activated carbon and potash. However, the cocoa pod was not vastly studied in cosmetic application. In previous research, the cocoa pod extract (CPE) showed good antioxidant activities, as determined using DPPH and β-carotene bleaching assays, which contributed by polyphenolic compounds. Further, the activity of collagenase and elastase enzymes, which were enzymes related to the formation of wrinkles, reduced with the presence of CPE. Then, the CPE was included in a gel-based formula at 10 wt% and tested for its efficacy in wrinkles removal, which the results showed that skin hydration increased and wrinkles index reduced significantly after three weeks of daily application. In this paper, the effect of CPE onto the expression of matrix metalloproteinase-1 (MMP-1) gene, which was related to the breakdown of interstitial collagens was presented. This result amplified the value-added of cocoa pod and diversified the usage of cocoa pod, which can increase the demand of cocoa and income for cocoa growers. Key words: Cocoa pod extract, MMP-1, antioxidant, cocoa by-product, waste to health. INTRODUCTION Exhibition of high antioxidant activity of plant extract is always known due to its high total phenolic and flavonoid content. However, low toxicity effects of a plant extract containing polyphenolic compounds that exerted high antioxidant effects were also reported. CPE exhibited good antioxidant capacity based on the assays compared to ascorbic acid (AA) as determined in the previous study (Karim, et al., 2014). CPE also showed a high level of total phenolic content (TPC) and total flavonoid content (TFC). Although CPE showed good performance as a scavenger of radical species, it was lower at 2-folds than AA. The capability to reduce ion of CPE was better than AA. CPE exhibited high performance to protect lipid from oxidation but lower than butylated hydroxytoluene (BHT).
CPE was shown to inhibit the collagenase and elastase activities in the assays, thus it is a potential active ingredient in the formulation to reduce wrinkle on skin (Karim, et al., 2016; Karim, et al., 2012). Based on the inhibition concentration at 50% (IC50) value, CPE exhibited 10-folds inhibition activity against collagenase better than AA. The CPE also showed good inhibition against elastase activity.
The effect of plant extract towards a biological system is vital to be determined, especially when the extract is going to be applied on human skin. Fibroblast cells were selected to determine the cell viability due to its role in facial are for the formation of wrinkle (Lee et al., 2008). In addition, highly expressed level of MMP-1 gene was allied to the high secretion of collagenase enzyme in skin collagen degradation (Kim et al., 2006; Kim et al., 2008; Brenneisen et al., 1997).

203
In contrast, highly induced MMP-1 gene was associated with good wound healing process (Lee et al., 2013).
The objective of this study was to determine the EC50 of cell viability for the CPE used in the formula is effective on human and has no cytotoxicity effect (in relation to the antioxidant activities and the enzyme inhibition as determined previously in Karim, et al., 2014 and Karim, et al., 2012, respectively). In addition, CPE effect towards the MMP-1 gene, specifically, was also presented in this paper. MATERIALS AND METHODS Sample (CPE) preparation The cocoa pods were collected from Malaysian Cocoa Board (MCB) plantation in Jengka. After rinsing with tap water, the pods were chopped using mechanical fruit slicer (FC-312, Zhaoqing Fengxiang Food Machinery, China) and dried in a high-performance dryer (FD-825, Protech, Malaysia). The dried cocoa pods were grounded into 1 mm mesh size using a grinder (Automatic Hammer Mill Grinder, China).
Then, the extraction was carried out by soaking one gram of pod powder in 20 mL of aqueous ethanol (80% v/v) in a conical flask. The flask was placed in water bath shaker (BS-21, Lab Companion, Korea) for 30 min, 35oC at 120 rpm. The decanted portion was filtered and the solvent was removed using rotary vacuum evaporator (IKA, Germany). The dried CPE was made freeze-dried at least 24 h (FDA8512, Labconco, USA).
The CPE powder was dissolved in dimethyl sulfoxide (DMSO) prior to determination of the cell viability and gene expression. Ascorbic acid (AA) was used as positive control and reference samples, respectively, in the cell viability study. In cell viability experiment, the concentration of CPE and AA were prepared in a serial dilution from 3.9 μg/mL to 1000 μg/mL.
AA is involved in a stimulation of collagen synthesis and well deliberated (Coldren et al., 2003; Barnes, 1975).
Preparation of cell Human dermal fibroblast adult (HDFa) was purchased from Life Technologies Corporation (catalogue number C-013-5C, Lot number 1378119, Gibco, U.S.A) in 2 mL cryo-vial of dimethylsulfoxide (DMSO). The experiment was carried out in the biological safety cabinet (Class II, ESCO Streamline).
The cells were initiated from cryo-preserved HDFa in a 25 cm2 culture flask filled up with 5 mL of Dulbecco’s modified Eagle’s
medium (DMEM, Gibco, U.S.A) containing 10% fetal bovine serum (FBS, Biowest, U.S.A) and 1% antibiotics (streptomycin/penicillin, Biowest, U.S.A). The flask containing cells was incubated at 37oC, 95% humidity and 5% CO2 (INCO 108, Memmert Incubator, GmbH) until it became confluent. Growth media was refreshed every two days until the cells were at least 80% confluence. Growth of the cell was monitored.
The cells were subcultured into new culture flask at each time of passages. Trypsin LE™ (Gibco, U.S.A) was used as the dissociation
liquid. The Tryp LETM is a ready-to-use dissociating solution that can be stored at room temperature and requires no inhibitors. Detached cells were observed for 3-4 min. The HDFa cells were passaged and used for not more than eight times passages for cell viability study (Joe et al., 2008). Fibroblast cell was used for cell viability study as early as the second passage (Aslam et al., 2006). Detached cells were pipetted into a 15 mL sterile centrifuge tube. Centrifugation was carried out at 180 x g for 7 min to obtain the pellet at the bottom of the tube. The pellet dissolved in one mL growth media. Then, the cell density was calculated using hemacytometer. Cell viability using MTT The cells were seeded into 96-well microplate at density of 1x10⁵ per well. Then, the spent media was removed and 100 μL of CPE and AA were added to the well, respectively before incubated for another 24 h. After rinsing with PBS, a 40 µL of MTT or 3-(4,5-Dimethylthiazol-2-yl)-2,5-diphenyl tetrazolium bromide (Bio Basic, Canada, Inc.) in phosphate buffer saline (PBS; 2.5 mg/mL) was added to each well (Bruggisser et al., 2002)

204
and incubated for 4 h before measuring the absorbance at 570 nm (Riss et al., 2013) using microplate reader (Multiskan FC, Thermo Scientific, U.S).
The percentage of cell viability was calculated based on the optical density of each well against the negative control (Brenneisen et al., 1997). Optical density was the absorbance of each well minus absorbance of blank at 570 nm. Blank was the test material and media solution without the cell. An effective concentration of 50% (EC50) was calculated as the concentration of the tested solution to maintain the cell population up to 50%. The EC calculation was based on the percentage of cells that had survived after the treatment with the tested samples which metabolized the MTT salts to purple formazan (Weyermann et al., 2005; Brenneisen et al., 1997). These effective concentration values were obtained at the x-axis of the cell viability graph when plotting the 50% on the y-axis. In addition, low dose (LD) and high dose (HD) were determined based on the EC90 of cell viability results, to obtain the concentration for gene expression study. Low dose was at least 12% and high dose was at least 50% of the EC90 of cell viability value to generate robust gene expression responses (Coldren et al., 2003). Gene expression on MMP-1 A method proposed by Kim et al. (2008) with some modifications for the determination of gene expression of the MMP-1. For gene expression study, the density of the cell must be at least 2x10⁶ per treatment to be lysed (Kim et al., 2008). However, in this study, RNeasy® Mini Kit Qiagen was used for lysis. The advantage of using the kit is only a small number of cells that was needed to be lysed. Approximately, 1x10⁵ cells were sufficient when using lysis kit to obtain enough ribonucleic acid (RNA) from the cells (Qiagen, 2011).
The cells were seeded in 25 cm2 culture flasks a day before treatment. On the day of the treatment, the concentration of extracts (HD and LD of CPE, HD of AA and negative control) were added into the respective flasks and incubated for another 24 h.
Preparation of mRNA template After incubation, the cells were harvested by dissociating reagent of Trypsin LE™ and rinsed
with PBS to obtain the cell pellet. A protocol in the RNeasy® Mini Kit from Qiagen (2011) was followed. Briefly, the cell pellet was lysed using 600 µL of buffer RLT followed by centrifugation at maximum speed for 3 min. One volume (600 µL) of 70% ethanol was added to the lysate and was resuspended until homogeneous. Then, the sample was transferred into the RNeasy Mini spin column which placed in a 2 mL collection tube. The collection tube was centrifuged for 15 s at >8000 x g. The mRNA was attached to the spin column.
Buffer RW1 at 700 µL was used to wash the bound mRNA from any debris by centrifugation at > 8000 x g for 15 s. Next, 500 µL of diluted buffer RPE (diluted with four volumes of 96-100% ethanol) was added for washing. Then, the washing step was repeated, followed by centrifugation for 2 min. New collection tube was used for elution of mRNA with the addition of 30-50 µL RNase-free water, followed by centrifugation for 1 min at >8000 x g. The mRNA was pooled in the collection tube and could be stored at -20oC up to one month or -80oC for >2 months. For each treated cell, quadruplets mRNA samples were isolated. Before the gene expression analysis, the mRNA was tested for its purity and intactness using Nano Drop 2000c (Thermo Scientific, U.S.A).
Gel electrophoresis analysis was carried out to confirm the purity and the intactness of mRNA. The agarose gel (1%) for electrophoresis was made by mixing 0.3 g agar powder with 30 mL of TBE buffer (5X) and was cooked in the microwave oven for 1-2 min. TBE buffer (5X) was made by mixing 1 M of Tris Base (MW 121.1 g/mol, Calbiochem, U.S.A), 900 mM boric acid (MW 61.8 g/mol, Biochemical, U.S.A) and 25 mM ethylenediaminetetraacetic acid (EDTA, MW 292.2 g/mol, MP Biochemicals, U.S.A) in 1 L of distilled water. The gel was left to set in comb mould.
The purity of mRNA or its template was compared to the housekeeping gene, GAPDH

205
(glyceraldehyde-3-phosphate dehydrogenase) as carried out by Kim (2006). Matrix metalloproteinase 1 (MMP-1) was the targeted gene in this study. The MMP-1 produced a single PCR product (single band) which was clearly distinct to other primers. All primers were acquired from IDT, Integrated DNA Technologies, U.S. Preparation of PCR product The single strand mRNA was converted to complementary DNA (cDNA) or a stable strand template using reverse transcriptase enzyme during PCR. Two microliters (2 µL) of mRNA, diluted with 12 µL purified distilled water were added to the PCR premix (containing reverse transcriptase enzyme). Separately, 1 µL of forward and reverse primers of GAPDH and MMP-1, respectively, was added to each vial. The vials containing mixtures of PCR premix, templates and primers were allowed to react in the PCR machine (Rotorgene, R-Corbett Research, U.S.A.). The annealing phases were set to 48 cycles from 22 cycles and the temperature was set at 47oC.
The final products were electrophoresed in 1.0% agarose gel with the addition of 0.2 µL of ethidium bromide and loading dye (Fermentas) to visualize and observe the RNA fragments using Gel Doc XR System PC (Bio-rad, Canada, U.S.A). Quantification of MMP-1 gene Quantification of a gene was carried out either by using gel electrophoresis or computerized method such as by real time PCR. Quantification by real time PCR could omit gel electrophoresis and densitometry analysis (end-point) since the fluorescent absorbance was recorded by the computer and could be translated into more accurate data due to its sensitivity (Roth, 2002; Schmittgen et al., 2000). Melting curve was obtained to show the targeted gene in a single melting peak (Deprez et al., 2002). Additionally, the amplication curve was obtained for quantification in order to get the crossing point or threshold for fluorescent absorbency. Crossing point or cycle threshold is the time of the fluorescence intensity is greater than the background fluorescence (Wong and Medrano, 2005; Bustin, 2000).
SYBR Green dye was used to quantify the expression of the targeted gene (MMP-1) because it emitted light only when it was bounded to DNA strand (Ponchel, 2006; Deprez et al., 2002). The protocol of using SYBR Green kit (Quantifast® SYBR Green PCR kit, Qiagen) was followed. Then, the crossing point (CP) or crossing threshold (CT) of the MMP-1 gene in PCR product was determined from the amplication curve.
Standard curves were obtained using the CT values of MMP-1 and GADPH genes with untreated cells (control) in serial dilutions. The efficiency value, E = 10(-1/slope) was calculated from the slope of the standard curve. Two efficiency values were required to quantify the fold change of gene expression. Etarget is the efficiency value obtained from the standard curve of control with the targeted gene and Eref is the efficiency value from the standard curve of control with the housekeeping gene. MMP-1 is the targeted gene and GADPH is the reference or housekeeping gene.The efficiency values were used as constant in Pfaffl’s equation (Pfaffl’s, 2001) as in the
following;
Where; ∆CP
MMP-1 was the difference of crossing point of control and samples templates with MMP-1 and ∆CP
GADPH was the crossing point of different of control and samples templates with housekeeping gene. The crossing point or threshold values for the samples are summarized in Table 1. Statistical analysis The results were presented as mean + standard deviation and determined in triplicates of two independent samples unless mentioned. The comparison was made using ANOVA or two-sample t-test where relevant by Minitab Software version 14.12.0 (U.S.A.). The results were considered significantly different when p-value was less than 0.05 (p<0.05).

206
Table1. Crossing point or threshold values of CPE HD, CPE LD, AA HD and negative control
Sample Crossing point (CP)or threshold cycle(CT)
With MMP-1 With GADPH
CPE LD 24.32 +0.66 25.40 +0.99
CPE HD 24.40 +0.31 22.95 +0.38
AA HD 28.47 +1.20 22.50 +0.01
Negative control 27.50 +0.40 24.90 +0.80
Values of mean + standard deviation of two independent samples, in triplicate, CPE is cocoa pod extract collected in bulk; LD is for low dose and HD is high dose, AA is ascorbic acid, MMP-1 is collagenase gene and GADPH is housekeeping gene of glyceraldehyde-3-phosphate dehydrogenase, CPE HD = 0.73 μg/mL, CPE LD = 0.18 μg/mL and AA HD = 0.73 μg/mL. RESULTS Cell viability of CPE on normal adult human fibroblast The results of cell viability for CPE and AA are tabulated in Table 2. The percentage of viable cell was lower than 50% for AA, starting at 31.1 µg/mL. CPE also exhibited less than 50% of cell viability at 62.3 µg/mL until 500 µg/mL. At the lowest concentration (3.9 μg/mL), CPE had similar
cell viability percentage to AA. The higher concentration (250 µg/mL and 125 µg/mL, respectively, and above) showed that the cell viability percentage for AA was not available due to the high absorbance value of blank. The excessive increment in the absorbance value of AA high concentration was due to the reaction of this compound with the MTT (ATCC, 2011) especially ascorbic acid (Bruggisser et al., 2002). Therefore, the absorbance of blank (media + test materials + without cells) was important to be deducted from the absorbance of test materials and the cells. The determination of EC50 was obtained from the cell viability graph and summarized in Table 2. CPE had lower EC50 (47.10+2.90 μg/mL) compared to
AA (39.29+2.96 μg/mL).
Expression of MMP-1 of fibroblast Cell treated with CPE Single concentration amount of AA was used as the positive control (Coldren et al., 2003). The cells were treated accordingly, and the figure of cells after treatment is summarized in Figure 1.
Melting curve of the samples is shown in Figure 2 for low dose and high dose cocoa pod extract (CPE LD and CPE HD) of three replicates for two independent samples, against a negative control. AA HD was plotted against a negative control in triplicates. The CT values obtained from the amplication curve of CPE HD, CPE LD, AA HD and negative control is used to calculate the fold change as in Pfaffl’s equation.
The fold change values of CPE at HD and LD are in Table 3. The results showed that the CPE LD significantly induced the expression of MMP-1 at almost 10-folds relative to the control, while CPE HD induced the expression of MMP-1 at almost 2-folds compared to the controls. CPE at HD showed smaller induction of MMP-1 compared to CPE at LD, which indicated a down-regulation of MMP-1 could be achieved if higher concentration than HD (for CPE) was used. On the other hand, AA at HD showed a down-regulation of MMP-1 expression significantly compared to untreated cells.

207
Table 2. Cell viability of normal adult human fibroblast when treated with CPE compared to AA
Concentration µg/mL
Cell viability (%) CPE AA
0 100a A 100a A 3.9 73.35+4.28aB 74.51+3.03a B 7.8 96.22+1.34a A 70.41+1.61b B 15.5 70.78+3.49a B 63.07+4.56b C 31.1 76.48+1.34a B 51.65+2.41b D 62.3 28.84+1.48b C 45.99+4.28a E 125 34.59+5.36a C 34.33+1.88a F 250 30.80+3.22C n.a 500 33.21+2.68C n.a 1000 n.a n.a EC50 47.10+2.90a 39.29+2.96b EC90 1.46 1.46 LD 0.18 0.18 HD 0.73 0.73
Values of mean + standard deviation of two independent samples, in triplicates, CPE is cocoa pod extract collected in bulk, AA is ascorbic acid,a b c denotes significant different between sample at respective concentration in row, at α=0.05, determined using ANOVA (Tukey test), A B C denotes significant different between concentration for each sample in column, at α=0.05, determined
using ANOVA (Tukey test), n.a is data not available or not detected due to out of absorbance range, n.r is not required for gene expression experiment, EC50 is the concentration of the tested solution to maintain 50% of cell population, EC90 is the concentration of the tested solution to maintain 90% of cell population LD is low dose, calculated from at least 12% of EC90 value,HD is high dose, calculated from at least 50% of EC90 value, EC# obtained by plotting on the graph of cell viability percentage for x-axis based on respective value on the y-axis
Table 3. Fold change of MMP-1 expression when treated with CPE at high and low dose compared with AA and negative control
Sample Fold change relative to negative control CPE LD 9.49+1.11a CPE HD 1.91+0.17b AA HD 0.14+0.04c Negative control 1.30+0.22b Values of mean + standard deviation of two independent samples, in triplicate, a b c denotes significant different at p<0.05, between samples in a column, determined using ANOVA (Tukey test), CPE is cocoa pod extract collected in bulk; LD is for low dose and HD is high dose, AA is ascorbic acid, MMP-1 is collagenase gene and GADPH is housekeeping gene of glyceraldehyde-3-phosphate dehydrogenase, CPE HD = 0.73 μg/mL, CPE LD = 0.18 μg/mL and AA HD = 0.73 μg/mL.

208
Magnify Sample Dose
CPE HD CPE LD AA HD Negative control
4x
40x
Figure 1: Cells After Treatment with CPE at High Dose and Low Dose Compared with AA at High Dose and Negative Control

209
Sample Melting Curve Amplication curve
CPE LD 1 vs Negative
control Legend:
Control/1 Control/2 Control/3 CPE LD/1/1 CPE LD/1/2 CPE LD/1/3
CPE LD 2 vs Negative
control Legend:
Control/1 Control/2 Control/3 CPE LD/2/1 CPE LD/2/2 CPE LD/2/3

210
CPE HD 1 vs Negative control
Legend:
Control/1 Control/2 Control/3 CPE HD/1/1 CPE HD/1/2 CPE HD/1/3
CPE HD 2 vs Negative control
Legend:
Control/1 Control/2 Control/3 CPE HD/2/1 CPE HD/2/2 CPE HD/2/3

211
AA HD vs Negative control
Legend:
Control/1 Control/2 Control/3 AA HD/1 AA HD/2 AA HD/3
Figure 2. Melting and amplication curves for PCR product after treatment with CPE LD and CPE HD compared with AA HD

212
DISCUSSION In an ideal condition, the healthy mammalian cells were dividing and multiplying over time when maintained in medium culture but the presence of foreign toxic chemical influenced the process and gave results in a reduction in cell number after sufficient exposure time for at least 24 h. Meanwhile, the increasing cell number and growth of the cells indicated the cell turnover, which provide new cells and make the skin appear smooth, supple and less wrinkles. Therefore, any increment in cell viability of fibroblast indicated the non-toxic and potential of the extract as anti-wrinkles agent (Lee et al., 2008; Brenneisen et al., 1987).
The EC50 value of CPE indicated that there was no cytotoxicity effect up to 47.10 μg/mL of the extract. This value was higher
than the IC50 of collagenase (23.77+1.04 μg/mL)
and elastase (3.60+0.50 μg/mL) inhibition as
what had been determined in the previous paper (Karim, et al. 2014), thus the amount of CPE at these IC50 were considered safe to be selected to formulate a product. Thus, formulating a product at this concentration was considered toxic to the cell. EC50 value was important to avoid the toxicity effect of the extract onto the skin especially when it involved natural plant crude extract in the formulation. Therefore, the amount of CPE to be used in a product formula must not exceed the EC50 as determined in the cell viability test.
Fujii et al. (2008) and Aslam et al. (2006) reported that although a high concentration of amla and pomegranate crude extract contained high flavonoids compounds, they exerted cytotoxicity to the human cultured cell. In another research, epigallocatechin compound from the Sideroxylon inerme crude extract, also exhibited toxicity effect to melanocytes cell at high concentration, although high antioxidant was exhibited (Momtaz et al., 2008). In contrast, Babich et al. (2005) reported that the epicatechin was less toxic to normal cell as compared to epigallocatechin gallate. The ability of epicatechin to donate hydrogen as the scavenger to radical oxidative species protect the fibroblast cells (Spencer et al., 2001).
Cocoa and apples had a similar type of procyanidin with apple extract (Akazome, 2004),
which was type B with B2 which was predominantly can be found (Glinski et al., 2014). Procyanidin B2 was built up by epicatechin-epicatechin dimer structure and had low toxicity to cells (Lanoue et al., 2010).
MMP-1 was expressed in high levels by fibroblasts cultured cell (Giambernardi et al., 1998). Fibroblast cell is the primary cell that produces collagen type I in the skin (Fisher et al., 2009). MMP-1 is known as fibroblast collagenase (Konttinen et al., 1999) and degrade fibrous collagen Type I, II and III (Fisher et al., 2009; Giambernardi et al., 1998). The production of MMP-1 increased when the fibroblast cell was induced with UV (Fagot et al., 2007). In addition, the increasing level of radical oxidative species (ROS) on the skin also increased the level of MMP-1 (Fisher et al., 2009; Alge-Priglinger et al. 2009; Ma et al. 2005; Ishii et al., 2003). Skin suppleness reduced with the over expressed of MMP-1 due to less stretched and more rounded shape of fibroblast cells (Fisher et al., 2009). An excessive amount of MMP-1 degraded the extracellular matrix (ECM) and formed the wrinkles (Svobodová et al, 2006). Thus, suppleness of skin and prevention of wrinkles can be accomplished by the additional supply of compound that exhibited the reduction of MMP-1 activity.
In this study, the results showed that CPE could up-regulate the MMP-1 gene expression and increase the rate of collagen degradation at a certain concentration. It was also shown that the fold of change was reduced from 10-folds at the low dose of CPE concentration (0.18 μg/mL) to 2-folds at high dose concentration (0.73 μg/mL) which
suggesting the MMP-1 expression might be reduced with the increasing concentration amount of CPE. Previously, it was reported (Karim, et al., 2014) that inhibition against collagenase enzyme activity was exhibited by CPE at higher concentration (IC50 23.77 μg/mL).
Therefore, a higher concentration of CPE (than HD; 0.73 µg/mL) could be better in down-regulating the MMP-1, probably at the EC50 of cell viability. The highly expressed MMP-1 at the amount of concentration in this experiment (LD and HD) could be beneficial to prevent scars during wound healing process or psiarosis (Philips et al., 2011). During inflammation, high

213
level of MMP-1 was expressed by fibroblast cells especially in cell migration and wound healing processes (Lee et al., 2013) to prevent scars or psiarosis. Consequently, MMP-1 level was increased in aged human skin compared to younger skin (Fisher et al., 2009). CONCLUSIONS CPE at low concentration resulted in higher viability of fibroblast cells compared to the high concentration which may reduce skin wrinkles. The amount of CPE in a formula should not exceed the EC50 value of cell viability but sufficient enough up to IC50 of collagenase or elastase reduction activity to be an effective anti-wrinkle product. Although, the level of MMP-1 gene was increased transcriptionally at the low level of CPE, but higher concentration exhibited good activity against the formation of wrinkles. In addition, the ability of CPE (at LD concentration) to stimulate the MMP-1 could be used to prevent scars formation in a wound healing process. ACKNOWLEDGEMENT This project was carried out using TRF L15272 (Malaysian Cocoa Board). The following lecturers were associated and supervised this project; Professor Amin Ismail (PhD, Professor), Puziah Hashim (PhD) and Siti Salwa Abd Gani (PhD) from Halal Products Research Institute, Universiti Putra Malaysia, UPM Serdang, Selangor, Malaysia. Part of this project was supported by grant GPIPS/2013/9399848 (Universiti Putra Malaysia) and published in PhD thesis. We would like to thank Analytical Service Laboratory Malaysian Cocoa Board for the analysis. Special thanks to those who involve in collecting data. REFERENCES Akazome, Y. (2004). Characteristics and
physiological functions of polyphenols from apples. Biofactors, 22(1-4): 311-314.
Alge-Priglinger, C.S., Kreutzer, T, Obholzer, K., Wolf, A., Mempel, M., Kernt, M., Kampik, A. and Priglinger, S.G.
(2009). Oxidative stress-mediated induction of MMP-1 and MMP-3 in human RPE cells. Invest. Ophthalmol. Vis. Sci., 50(1): 5495-5503.
Aslam, M.N., Lansky, E.P. and Varani, J. (2006). Pomegranate as a cosmeceutical source: Promegranate fractions promote proliferation and procollagen synthesis and inhibit matrix metalloproteinase-1 production in human skin cells. J Ethnopharmacol., 103: 311-318.
ATCC (2011). MTT cell proliferation assay. http://www.atcc.org. (accessed November 18, 2014).
Babich, H., Krupka, M.E., Nissim, H.A. and Zuckerbraun, H.L. (2005). Differential in vitro cytotoxicity of (-) epicatechin gallate (ECG) to cancer and normal cells from the human oral cavity. Toxicol. In Vitro, 29(2): 231-242.
Barnes, M. J. (1975). Function of ascorbic acid in collagen metabolism. Ann. NY. Acad. Sci., 258: 264–277.
Brenneisen, P., Briviba, K., Wlaschek, M., Wenk, J. and Kochanek, K.S. (1997). Hydrogen peroxide (H2O2) increases the steady-state mRNA levels of collagenase/MMP-1 in human dermal fibroblasts. Free Rad. Biol. Med., 22(3): 515-524.
Bruggisser, R., von Daenikan, K., Jundt, G., Schaffner, W. andTullberg-Reinert, H. (2002). Interference of plant extracts, phytoestrogens and antioxidants with MTT tetrazolium assay. Planta Med., 68(5): 445-448.
Bustin, S.A. (2000). Absolute quantification of mRNA using real-time reverse transcription polymerase chain reaction assays. J. Mol. Endocrinol., 25: 169-193.
Chueahongthong, F., Ampasavate, C., Okonogi, S., Tima, S. and Anuchapreeda, S. (2011). Cytotoxic effects of crude kaffir lime (Citrus hystrix, DC.) leaf fractional extracts on leukemic cell lines. J. Med. Plants Res., 5(14): 3097-3105.
Coldren, C.D., Hashim, P., Ali, J.M., Oh, S.K., Sinskey, A.J. and Rha, C.K. (2003). Gene expression changes in the human fibroblast induced by Centella asiatica triterpenoids. Planta Med., 69: 725-732.

214
Deprez, R.H.L., Fijnvandraat, A.C., Ruijter, J.M. and Moorman, A.F.M. (2002). Sensitivity and accuracy of quantitative real-time polymerase chain reaction using SYBR green I depends on cDNA synthesis conditions. Anal. Biochem., 307(1): 63-69.
Fagot, D., Asselineau, D. and Bernerd, F. (2007). Matrix metalloproteinase-1 production observed after solar-simulated radiation exposure is assumed by dermal fibroblasts but involves a paracarine activation through epidermal keratinocytes. Photochem. Photobiol., 79(6): 499-506.
Fujii, T., Wakaizumi, M., Ikami, T. and Saito, M. (2008). Amla (Emblica officinalis Gaertn.) extracts promotes procollagen production and inhibits matrix metalloproteinase-1 in human skin fibroblasts. J. Ethnopharmacol., 119: 53-57.
Fisher, G.J., Quan, T., Purohit, T., Shao, Y., Cho, M.K., He, T., Varani, J., Kang, S. and Voorhees, J. (2009). Collagen fragmentation promotes oxidative stress and elevates matrix metalloproteinase-1 in fibroblasts in aged human skin. J. Pathol., 174(1): 101-114.
Giambernardi, T.A., Grant, G.M., Taylor, G.P., Hay, R.J., Maher, V.M., McCormick, J.J. and Klebe, R.J. (1988). Overview of matrix metalloproteinase expression in cultured human cells. Matrix Biol., 16: 483-496.
Glinski, J.A., Thomas, D., Wong, A., Glinski, V.B. and Acworth, I. (2014). Determination of A-type and B-type procyanidins in apple, cocoa and cinnamon extracts. Planta Analytica, Thermo Scientific Poster Note PN71285-ASP-EN 08/14S. 2014.
Ishii, Y., Ogura, T., Tatemichi, M., Fugisawa, H., Otsuka, F. and Esumi, H. (2003). Induction of matrix metalloproteinase gene transcription by nitric oxide and mechanisms of MMP-1 gene induction in human melanoma cell lines. Int. J. Cancer, 103: 161-168.
Joe, M.J., Kim, S.N., Choi, H.Y., Shin, W.S., Park, G.M., Kang, D.W. and Kim, Y.K. (2008) The inhibitory of Eckol and Dieckol from Ecklonia stolonifera on the expression of matrix
metalloproteinase-1 in human dermal fibroblasts. Biol. Pharm. Bull., 29(8): 1735-1739.
Karim, A.A., Azlan, A., Ismail, A., Hashim, P., Gani, S.S.A., Zainudin, B.H. and Abdullah, N.A. (2016). Efficacy of cocoa pod extract as anti-wrinkle gel on human skin surface. J Cosmet. Dermatol., 15(3): 283-295.
Karim, A.A., Azlan, A., Ismail, A., Hashim, P., Gani, S.S.A., Zainudin, B.H. and Abdullah, N.A. (2014). Phenolic composition, antioxidant, anti-wrinkles and tyrosinase inhibitory activities of cocoa pod extract. BMC Complement. Altern, Med., 14: 381. doi: 10.1186/1472-6882-14-381.
Karim, A.A., Azlan, A., Ismail, A., Hashim, P. and Abdullah, N.A. (2012). Elastase inhibition and antioxidant properties of cocoa pod extract. Paper presented at International Science & Technology Conference (ISTEC 2012), 13-15th December, Hotel Sharjah Inn, Dubai, UAE.
Kim, S. and Chung, J.H. (2008). Berberine prevents UV-induced MMP-1 and reduction of type I procollagen expression in human dermal fibroblasts. Phytomed., 15: 749-753.
Kim, M.S., Kim, Y.K., Cho, K.H. and Chung, J.H. (2006). Regulation of type I procollagen and MMP-1 expression after single or repeated exposure to infrared radiation in human skin. Mech. Ageing Dev., 127: 875-882.
Konttinen, Y.T., Ainola, M., Valleala, H., Ma, J., Ida, H., Mandelin, J., Kinne, R.W., Santavirta, S., Sorsa, T., Otin, C.L. and Takagi, M. (1999). Analysis of 16 different matrix metalloproteinases (MMP-1 to MMP-20) in the synovial membrane: different profiles in trauma and rheumatoid arthritis. Ann. Rheum., 58: 691-697.
Lanoue, L., Green, K.K., Kwik-Uribe, C. and Keen, C.L. (2020). Dietary factors and the risk for acute infant leukemia: evaluating the effects of cocoa-derived flavanols on DNA topoisomerase activity. Exp. Biol. Med., 235: 77-89.
Lee, C.W., Choi, H.J., Kim, H.S., Kim, D.H., Chang, I.S., Moon, H.T., Lee, S.Y., Oh, W.K. and Woo, E.R. (2008).

215
Biflavonoids isolated from Selaginella tamariscina regulate the expression of matrix metalloproteinase in human skin fibroblasts. Bioorg. Med. Chem., 16(2): 732-738.
Lee, K.M., Lee, G.S., Park, I.H., Lee, O.S., Lim, S.C. and Kang, T.J. (2013). Chitin from the extract of cuttlebone induced acute inflammation and enhances MMP-1 expression. Biomol. Ther. (Seoul). 21(3): 246-250.
Ma, Y.S., Chen, Y.C., Lu, C.Y., Liu, C.Y. and Wei, Y.H. (2005). Upregulation of matrix metalloproteinase 1 and disruption of mitochondrial network in skin fibroblasts of patients with MERRF syndrome. Ann. N.Y. Acad. Sci., 1042: 55-63.
Momtaz, S., Mapunya, B.M., Houghton, P.J., Edgerly, C., Hussein, A., Naidoo, S. and Lall, N. (2008). Tyrosinase inhibition by extracts and constituents of Sideroxylon inerme L. stem bark, used in South Africa for skin lightening. J. Ethnophamacol., 119: 507-512.
Pfaffl, M.W. (2001). A new mathematical model for relative quantification in real-time RT-PCR. Nucleic Acids Res., 29(9): e45.
Philips, N., Auler, S., Hugo, R. and Gonzalez, S. (2011). Beneficial regulation of matrix metalloproteinases for skin healing. Enzyme Res., article ID 427285, 4 pages.
Ponchel, F. (2006). Real-time using SYBR® Green. In Real-time PCR (M.T. Dorak Ed). U.S.A., Taylor & Francis Group. pp.139-154.
Qiagen. RNeasy® Mini Kit, Part 1, Quick Start Protocol. 2011. www.qiagen.com. (accessed: November 8, 2013).
Riss, T.L., Moravec, R.A., Niles, A.L., Benink, H.A., Worzella, T.J. and Minor, L.
(2013). Cell viability assays. In Assay Guidance Manual [Internet] (Sittampalam, G.S.; Coussens, N.P.; Nelson, H. Eds.). 2013. Bethesda (MD): Eli Lilly & Company and the National Center for Advancing Translational Sciences.
Roth, C.M. (2002). Quantifying gene expression. Curr. Issues Mol. Biol., 4: 93-100.
Schmittgen, T.D., Zakrajsek, B.A., Mills, G.A., Gorn, V., Singer, M.J. and Reed, M.W. (2000). Quantitative reverse transcription – polymerase chain reaction to study mRNA decay: comparison of endpoint and real-time methods. Anal. Biochem., 285: 194-204.
Spencer, J.P.E., Schroeter, H., Kuhnle, G., Srai, S.K.S., Tyrrell, R.M., Hahn, U. and Rice-Evans, C. (2001). Epicatechin and its in vivo metabolite, 3’-O-methyl epicatechin, protect human fibroblasts from oxidative-stree-induced cell death involving caspase3 activation. Biochem. J., 354: 493-500.
Sturm, R.A., Teasdale, R.D. and Box, N.F. (2001). Human pigmentation gene: identification, structure and consequences of polymorphic variation. Gene, 277(1-2): 49-62.
Svobodová, A., Walterová, D. and Vostalova, J. (2006). Ultraviolet light induced alteration to the skin. Biomed. Pap. Med. Fac. Univ. Palacky. Olomouc. Czech. Repub., 150(1): 25-38.
Weyermann, J., Lochmann, D. and Zimmer, A. (2005). A practical note on the use of cytotoxicity assays. Int. J. Pharm., 288: 369-376.
Wong, M.L. and Medrano, J.F. (2005). Real-time PCR for mRNA quantification. BioTechniques, 39: 75-85.

216
PHOSPHINE AND ETHYL FORMATE AS FUMIGANTS FOR CONTROLLING STORAGE COCOA PESTS
Asimah Hamid1 and Ling, A.S.C.2
1Cocoa Innovation & Technology Centre, Malaysia Cocoa Board, Lot PT12621, Nilai Industrial Area off Taman Semarak, 71800 Nilai, Negeri Sembilan, Malaysia
2 Cocoa Upstream Technology Division, 5th – 7th Floor, Malaysian Cocoa Board, Wisma SEDCO, Locked Bag 211, 88999 Kota Kinabalu, Sabah.
Malaysian Cocoa J. 11: 216-222 (2019)
ABSTRACT - Fumigation is required for dry cocoa beans prior to storage and can be used for controlling pests in imported consignments and before the consignments shipped for export. Phosphine and ethyl formate are insecticides in form of gas that kill adult insect, egg, larvae and pupae of stored products pests. Now, phosphine gas is commonly used for controlling dry cocoa beans storage pests. Ethyl formate also has been developed as fumigant for cocoa beans pests’ control. Both fumigants are can be
used for controlling major cocoa pests, however each fumigants has their own characteristic, benefits and side effects to human, living creatures and environment. Ethyl formate requires 190 g/m3 to get 99% mortality of 4 major cocoa beans insects’ pests, whereas fumigation with phosphine requires 1.66 g/m3 for 99% mortality. Both fumigants gave promising action against effectiveness’ in killing all stages (larvae,
pupae and adult) of cocoa pests. However, aluminum phosphide (AIP) leave residue of phosphate and need to be cleared of this leftover after fumigation procedure. Phosphine is poisons to human and living creatures whereas ethyl formate is categorized as generally recognised as safe (GRAS) and safe for all living creatures, human and environment. Ethyl formate is naturally found in fruits, flowers, vegetables, grains and processed food. Key words: Cocoa, fumigant, phosphine, ethyl formate INTRODUCTION Malaysia was formally known as cocoa producing country, however now she has been importing cocoa from major cocoa producer to meet the demand of cocoa beans for domestic users. Imported consignment entering our country need to eliminate cocoa pests and prevent further infestation. Therefore, fumigation upon arrival is vital. Economic losses of cocoa beans in form of weight and quality were mainly attributed by insect’s infestation.
Eleven insects’ species were found in cocoa beans during storage in East Malaysia warehouses. Quality deterioration was attributed to insects infestation are namely by Tribolium castaneum and Ahasverus advena and other 9 insects species collected during the investigation (Asimah and Lopez, 2000). Sivapragasam (1990) has found thirteen pests species in cocoa beans in Peninsular Malaysia. Five major species were T. castaneum, Oryzaephilus spp., Lasioderma serricorne, Ephestia cautella and Cocyra cephalonica. Four of these major species were selected for fumigation study.
Among the newly considered fumigants for controlling storage pests are sulfuryl fluoride, carbonyl sulfide, propylene oxide, aluminium phosphide, methyl iodide, ozone, and hydrogen cyanide. Most common fumigant used for cocoa beans is phosphine. Methyl bromide has been phase out for treatment especially soil in the field treatment prior to cultivation. Methyl bromide causes ozone depletion; therefore it has been phase out since 2014. Then, phosphine has been used widely. It is an insecticide in form of gas that kills adult insect, egg, larvae and pupae of stored products. Commonly, it is used in form of tablet of aluminium phosphide (AIP). Phosphine can be found in form of tablet, blanket, sachet and pellets. Aluminium phosphide tablet and pellet can be applied directly to the commodities. This mode of application is suitable for bags stacks under sheet cover such as dry cocoa beans. Extremely important that the sheet cover material provide sufficient gas tightness to ensure no leakage of fumigant vapour and for safety reasons. Tablets and pellets can be placed on a tray that will facilitate the removal of residues at completion of fumigation and ventilation. Tablet of AIP

217
changes into gas only upon coming into contact with the humidity in the environment which release as hydrogen phosphide. Hydrogen phosphide gas is very toxic to human, animal and living insects.
Ethyl formate has been identified as an alternative treatment and has given promising and effective fumigant as a rapid disinfectant for stored products. Ethyl formate has been used routinely as a fumigant for dried fruits in Australia, New Zealand and other countries, also has been found to be generally effective against stored pests (Muthu et al., 1984; Damcevski and Annis, 2002). Ethyl formate is safe, has advantages in term of workers and environment safety, economical since shorter time and less chemical required for post harvest treatments. Ethyl formate has been found to be very effective in controlling cocoa storage pests. It does not leave any residue in fumigated whole beans, cocoa nib and cocoa bean without shell (Asimah et al., 2015a) and also does not affect cocoa butter and cocoa liquor quality from fumigated cocoa beans (Asimah et al., 2015b). This paper will discussed efficacy of both fumigants and comparison toward the safety, effectiveness to commodity and pest management, fumigant handling and duration of fumigation. MATERIALS AND METHODS
Efficacies of phosphine gas and ethyl format with different concentrations have been studied on four major cocoa pests. Phosphine gas with four concentrations i.e., 0.83g/m3, 1.67g/m3, 2.5g/m3 and 3.54 g/m3 and ethyl formate using 6 different concentrations from 76g/m3, 83.7g/m3,120.5g/m3,152.2g/m3,190g/m3 and 380 g/m3 were introduced onto dry cocoa beans to study the effectiveness against three life stages (larvae, pupae, adult) of four major (T. castaneum, L.serricorne, E. cautella and C. Cephalonica) cocoa pests during storage.
Bioassays were conducted with larvae, pupae and adults of species of four major cocoa pests two moth i.e.; Corcyra cephalonica (Stainton) and Ephestia cautella (Walker) and two beetles, i.e.; Tribolium castaneum (Herbst) and Lasioderma serricorne (Fabricius). All samples used are from generation 3 and 4 and
homogenous. Mortality of all fumigations was calculated according to number of dead insects after fumigations completed. Artificial diet containing rice bran, dry cocoa beans, yeast and glycerol was used for rearing insects’ pests.
Insects for bioassay were reared in laboratory and fumigation was conducted onto 2 metric tonnes of dry cocoa beans in a closure space of 7.74m3 in small size storage facility annex to cocoa primary processing plant. Control samples (without fumigant) of 2 metric tonnes of dry cocoa beans were placed concurrently next to the fumigation trial consignment. Both fumigants were placed in suitable container and put near to cocoa stakes under sheets of tarpaulin to release fumigant vapour. Fumigants vapour leakages were well managed and monitor throughout trial period. Fumigations with were done in closed environments within control temperature and humidity.
RESULTS AND DISCUSSION Fumigation using methyl bromide and phosphine gases are commonly used to eliminate the insects’ infestation but concern on their residual
toxic effects to the stored cocoa and also environment has prompted to find alternative ways to control the pests. Table 1 illustrates criteria of both phosphine gas and ethyl formate. Both fumigants require shorter duration for treatment which is between 2 to 5 days compared to carbon dioxide and other fumigation. However the duration depends on temperature and humidity of surrounding. Fumigation failure is generally caused by the fumigants not being retained for long enough and resistance is one of the most common causes of fumigation failure (Fitzpatrick and Brash, 2003). Therefore, in this study duration of fumigation for both fumigants was extended for 2 days.
In term of safety, ethyl formate is more applicable than phosphine, although both fumigants kill storage pests rapidly. The rapid breakdowns of ethyl formate also ensure that there are no issues of chemical residue on treated products. There are no withholding periods after treatment (Ren and Desmarchelier, 2001: Vu and Ren, 2004). Ethyl formate was recognized as GRAS (generally recognised as safe by FDA, 1979) and widely used as fumigants for stored

218
products, grains, fruits and vegetables in many countries such as United State America, New Zealand, United Kingdom and Australia. Hopes that fruit-derived products such as Ethyl formate can be used as fumigant for managing stored product insects is due to the fact that they do not
pose environmental problems and residues left on treated commodities are only in trace amount (Muthu et al. 1984, Desmarchelier and Ren 1999). Ethyl formate is present in many fruits, wine and range of raw and processed foods (Vu and Ren 2004).
Table 1. Comparison of Phosphine and Ethyl fromate Phosphine Ethyl formate Fumigation duration
4 to 5 days 2 to 4 days
Safety
Poisonous for human and animals
Safe for User and environment
Costing Relatively costly compared to methyl bromide.
Relatively costly compared to phosphine and methyl bromide
Effectiveness Rapidly kills major cocoa pests
Rapidly kills major cocoa pests
Fumigated products and environment
Left over residue No residue left over
Category Not safe (dangerous) for Human.
FDA (1979) characterized this compound as generally recognized as safe (GRAS)
Availability Not found naturally Naturally present in dried fruits, vegetables, flower and grains.
Figure 1 shows mortality of larvae (A),
pupae (B) and adult (C) of four insect species against ethyl formate concentrations. Mortality rate increases towards concentration of the fumigant. The optimal concentration required for ethyl formate is about 190g/m3. In previous study by Muthu et al. (1984), adult of T. castaneum was found to be most susceptible but pupae was the most tolerant stage to ethyl formate at 300-400 g/m3. Mean while, Desmarchelier et al.(1998) has reported that 90 g/t of ethyl formate on wheat in a 55 t bin can of mixed culture of adults and larvae of T. castaneum can have complete control and total mortality. Ren and Mahon (2006) has also reported that fumigation trial of ethyl formate with 85 g/t to wheat, split faba beans and sorghum with two dosage application in unsealed metal bins kill rapidly of all stages of Sitophilus oryxae, Rhyzopertha dominica and T. castaneum within two days.
Figure 2 indicates mortality of larvae (A), pupae (B) and adult (C) of four insect
species against phosphine gas concentrations. Fumigation with phosphine requires 1.66 g/m3 for 99% mortality. Absorption of the fumigant also depends on moisture content of the product. In this study the moisture content of the dry cocoa beans is about 7.5±0.3%. Cut test of the beans are well fermented, uniform in size and comply with Malaysian Standard. In New Zealand, 2g/m3 of phosphine is normally used for fumigation. In India, currently dosage rate for controlling most of the stored product insect under gas tight condition at 25 °C is with 3 aluminium phosphate tablets per tonne of grain stored for 7 days. Tablet each weighing 3 g release 1 g of phosphine. The exposure period has to be extended to more than 10 days, when khapra beetle Trogoderma granarium larvae or psocids Liposeclis sp., are present (Chadda, 2016). If sachets are used, it can retain the fine powder residue left over after the fumigation and this provide an easy way to remove this contaminant from the grain.

219
Figure 1. Mortality of larvae (A), pupae (B) and adult (C) of four insect species against ethyl formate concentrations.
C
B
A

220
Figure 2. Mortality of larvae (A), pupae (B) and adult (C) of four insect species against phosphine gas concentrations.
A
B
C

221
Both fumigants gave promising action against effectiveness’ in killing cocoa pests.
Phosphine disperses easily inside the fumigation chamber and do not need fan for gas distribution. Phosphine is rapidly diffused in air because it has a similar density to air (relative densities 1.13:1). Phosphine is considered slightly soluble in water (0.26% (v/v) at 17°C). Phosphine can corrode several metals, including copper, when oxidized under high humidity conditions. Unlike methyl bromide, phosphine breaks down quickly in the atmosphere when exposed to sunlight. Phosphine is highly toxic to insects and is known to penetrate treated material. Phosphine has replaced many methyl bromide applications for treatment of durable materials where its slower action on pests can be managed successfully. Phosphine is generally ineffective against fungi.
The efficacy of fumigation depends upon
combined effect of exposure period and phosphine concentration. In general, phosphine intake in insects is slow, high absorption and progressive and is not greatly altered by increase in concentration. The finding of the study showed that phosphine vapour has been well established that insects respond better to lower concentrations of phosphine with longer exposure period. The success of any fumigation depends on standard operating procedure with excellent practices, adequate exposure time, sufficient dose of fumigants, and prevention of leakages, temperature and humidity of surrounding and knowledgeable and trained handlers. CONCLUSIONS Both fumigants are effective in killing all four major cocoa pests. Currently, phosphine is widely used for fumigation for stored commodities and this caused insects resistance towards phosphine in many stored product. However, the levels of resistance being detected are still under controllable in cocoa beans.
Ethyl formate is better compared to
phosphine as fumigant in term of human and environmental safety and easier to handle. Performing fumigation with phosphine need
registered handler with face mask and safety dress antiques. Inhalation of toxic phosphine fumes must be avoided by wearing respiratory protection during fumigation.
Training of phosphine and ethyl formate
operators must be given more emphasis. It must be kept in mind that a single effective fumigation is more cost effective than several ineffective ones. Materials and methods for covered fumigation should be given priority attention to ensure success of the fumigation. Fumigation must be well monitored. Warning sign of dangerous and poison must be displayed at the fumigation area to avoid unnecessary accident. Scientific approach is necessary to optimize the commodity dosage, avoid leakage and thereby reduce the number of fumigations and management cost.
ACKNOWLEDGEMENT The authors wish to thank Malaysian Cocoa Board for permission given to publish this work. This research work was financially supported by the Ministry of Agriculture of Malaysia. Project number is 05-03-13-SF0049. Thanks also due to Malaysian Agriculture Research Development Institute (MARDI), Serdang, Selangor for providing facilities and technical assistant. REFERENCES Asimah, H. & Lopez, S. (2000). Quality & Weight
Changes in Cocoa Beans Stored Under Two Warehouses’ Condition in East
Malaysia. The Planter, 76: 619-637. Asimah, H., Albert,L.& Idris,A.B. (2015a).
Application of ethyl formate as a postharvest fumigant for dry cocoa beans under a semi commercial trial. Journal of entomology. ISSN 1812-5670/ DOI:10.3923/je.
Asimah, H., Albert,L.& Idris,A.B. (2015b). Effect
of Ethyl formate on Dry Cocoa Beans, Cocoa liquor and Cocoa Butter. American-Eurasian Journal of

222
Agriculture and Environment Sci., 15(6): 972-977.
Chadda, I.C. (2016). Fumigation with Phosphine-
A Perspective. Journal of Grain Storage Research.
Damcevski, K.A. & Annis, P.C. (2002). Influence
of grain and relative humidity on mortality of Sitophilus oryzea (L.) adults exposed to ethyl formate vapour. Journal of Stored Products Research, 42: 61-74.
Desmarchelier, J.M., S.E. Allen, R. Yonglin, R.
Moss and L.T. Vu, (1998). Commercial-scale trials on the application of ethyl formate, carbonyl sulphide and carbon disulphide to wheat. Technical Report No. 75, CSIRO Entomology, pp: 3-63.
Desmarchelier, J.M. and Y.L. Ren, (1999).
Analysis of fumigant residues-a critical review. J. AOAC Int., 82: 1261-1280.
FDA, (1979). Formic acid, sodium and ethyl
formate. Proposed affirmation of GRAS status as direct and indirect human food ingredient. Federal Register, 44: 18242-18246.
Fitzapatrick, K.and Brash, H. (2003). Fumigation-
what lies ahead? pp. 138-140. Proceedings Australian post harvest technical conference, Canberra, 25-27 June. CSIRO Stored Grain Research Laboratory, Canberra, Australia.
Muthu, M., S. Rajendran, T.S. Krisnamurthy, K.S. Narasimhan, M. Rangaswamy, M. Jayaram and S.K. Majumder (1984). Ethyl formate as safe fumigant. Proceedings of the International Symposium Practical Aspects of Controlled Atmosphere and Fumigation in Grains Storage, April 11-22, 1983, Perth, Western Australia, pp: 369-393.
Ren, Y.L., Desmarchelier, J.M. (2001). Natural
occurrence of carbonyl sulfide and ethyl
formate in grains. In:Donahaye, E.J., Navarro, S., Leesch, J. (Eds.), Proceedings of An International Conference on Controlled Atmosphere and Fumigation in Stored Products, October 29 to November 3, 2000, Fresno, California, USA, pp. 639–649.
Ren, Y.L. and D. Mahon (2006). Fumigation trials
on the application of ethyl formate to wheat, split faba beans and sorghum in small metal bins. J. Stored Prod. Res., 42: 277-289.
Sivapragasam, A. (1990). Insect species of stored
beans in West Malaysia. MARDI Res. J. 18(1):
Vu, L.T. and Ren, Y. L., 2004. Natural level of
ethyl formate in stored grains determined using improved method of analysis. Journal of Stored Products Research, 40(1): 77-85.

223
CHARACTERIZATION AND SENSORY ACCEPTABILITY OF RED PITAYA (Hylocereus polyrhizus) COCOA BUTTER-BASED ICE CREAM
Chin, H. H. and Nor Haslita Ibrahim
Malaysian Cocoa Board, Cocoa Innovation and Technology Centre, PT Lot 12621, Nilai Industrial Park, Nilai, Negeri Sembilan, Malaysia
Malaysian Cocoa J. 11: 223-227 (2019)
ABSTRACT - Red pitaya (Hylocereus polyrhizus) or red dragon fruit has received more attention worldwide due to its high amounts of health-promoting nutrients such as vitamins (A, C), betacyanin, polyphenols, fibre and potassium. The red-violet colour of the flesh attributed by betacyanin had been discovered to have antioxidant properties to protect against certain oxidative stress-related diseases which is beneficial to human health. Although it is commercially used as a natural food colouring agent in healthy food and drinks, no in depth study on the application of red dragon fruit in cocoa butter-based ice cream has been carried out. Therefore, the aim of this study was to characterize and evaluate the acceptability of cocoa butter-based ice cream incorporated with red dragon fruit flesh. Ice cream with the ratio of fresh skim milk to red dragon fruit puree (70:30; 60:40; 50:50) were produced and analysed for physicochemical properties (colour, total solid) and sensorial quality in terms of colour, red dragon fruit flavour, sweetness, texture, meltability and overall acceptability using 5-point hedonic scale. Cocoa butter-based ice cream with the ratio of fresh skim milk to red dragon fruit puree of 50:50 was most preferred by the panels (mean score of overall acceptability: 4.20.8) and having total solid of 36.600.04% and colour with value of L*(61.510.57), a* (22.490.37) and b* (10.830.23). Key words: Cocoa butter, red dragon fruit, ice cream, physicochemical properties, sensory quality INTRODUCTION Red pitaya (Hylocereus polyrhizus) commonly known as red dragon fruit is belongs to the Cactaceae family (Raveh et al., 1993) and believed to be indigenous from Mexico or central and south America (Bellec et al., 2006; Esquivel, et al., 2007; Lim, 2012). The fruit is currently cultivated commercially in tropical and sub-tropical regions namely, Thailand, Philippines, Viet Nam, Malaysia and southern China (Matan et al., 2015). Red dragon fruit is oblong shape with scaly peel in pink to magenta colour. The weight of this species ranges from 300 to 600 grams with the length of 13 to 15 centimetres. The fruit has delicate and sweet flesh in red-violet colour which embedded with a lot of edible small black seeds (Stintzing et al., 2002; Ariffin et al., 2009).
Red dragon fruit has become increasingly popular in recent year due to high amounts of health-promoting compounds as well as high economic importance (Wu et al., 2006; Ong et al., 2014). The flesh of the fruit is rich in fibres, vitamins (A, B1, B2, B3, C), minerals such as potassium, calcium, zinc and iron (Mohd Adzim Khalili et al., 2006; Nurul and Asmah,
2014). The red-violet of the flesh is attributed by a water-soluble pigment known as betacyanin (Wybraniec, 2001; Wybraniec, 2002; Vaillant et al., 2005; Wybraniec et al., 2007; Rebecca et al., 2010; Tenore et al., 2012) which has antioxidant properties to protect against certain oxidative stress-related diseases (Rebecca, et al., 2010; Lim, 2012; Liaotrakoon et al., 2013; Nurul and Asmah, 2014). Moreover, the seeds of red dragon fruit are rich in essential fatty acids namely linoleic acid that is beneficial to human health (Khalili, 2009; Lim, 2012).
Due to the nutritive value and health benefits of red dragon fruit, it is commercially used as a natural food colouring agent in healthy food and drinks. However, no in depth study on the application of red dragon fruit in cocoa butter-based ice cream has been carried out. Therefore, the aim of this study was to characterize and evaluate the acceptability of cocoa butter-based ice cream incorporated with the flesh of red dragon fruit.

224
MATERIALS AND METHODS Materials Ripe and healthy red dragon fruits, sugar, skim milk powder, fresh skim milk, salt and vanilla were purchased from the local supermarket. Deodorised cocoa butter was procured from the local cocoa grinder. Stabilizer and emulsifier were obtained from Danisco Malaysia Sdn. Bhd. Methods Preparation of Red Dragon Fruit Puree Red dragon fruits were washed and dried to remove dirt from the peel/skin. The fruits were cut into two halves using a knife and peeled off the skin to obtain the flesh. The flesh was then diced into small cubes and blended until homogenous.
Production of Cocoa Butter-Based Red Dragon Fruit Ice Cream (CBRDFIC) The production of CBRDFIC is shown in Figure 1. Fresh skim milk and red dragon fruit puree with the ratio of 70:30; 60:40; 50:50 respectively were mixed and heated to 50oC before incorporating the dry ingredients (26%) that consist of sugar, skim milk powder, salt, and mixture of stabilizer and emulsifier. The ice cream mixes were mixed until homogenous prior to pasteurization at 74oC for 20 minutes using batch pasteurizer (Brand: Taylor; Model: CH02, United State of America). Molten deodorized cocoa butter was added to the pasteurized ice cream mixes followed by homogenization at 5000 rotation per minutes (rpm) for 20 minutes (Brand: Silverson; Model: L5M) before aging at 5oC for 24 hours. Vanilla was added to the aged ice cream mixes prior to freezing process (12 minutes) using counter top batch freezer (Brand: Taylor by Frigomat; Model: C122, United State of America). The frozen ice creams were deposited into ice cream plastic containers (1 kilogram) and stored at -20oC prior to analyses.
Figure 1. Production of Cocoa Butter-Based Red Dragon Fruit Ice Cream Physicochemical Properties Analyses Colour Measurement A calibrated colorimeter (Brand: Konica Minolta; Model: CR-5, Japan) was used to measure the colour of ice cream. Petri dish (dimension: 60 x 15 millimetres) was filled until full with ice cream drawn from the counter top batch freezer. The colour was determined in L* (whiteness), a* (redness), and b* (yellowness) values based on illuminant D65 (intended to
stimulated daylight) with 10 degrees viewing angle. Determination of Total Solids Total solid was determined according to Wehr and Frank (2004) method. Melted ice cream (3 gram) was weighed into a dried and weighed pan. The sample was dried in an oven at 1002oC for 3.5 hours. The pan with its dry content was cooled and weighed. The total solid of the sample was calculated as follow:
Ingredients used for production of CBRDFIC Pasteurization
Freezing
Homogenization
Mixing

225
Sensory Evaluation (Acceptability Test) The sensorial quality of the CBRDFIC was assessed according to the procedure of Akbari and co-workers (2016). Twenty-five (25) panels were recruited to evaluate the ice creams in terms of colour, red dragon fruit flavour, sweetness, texture, meltability and overall acceptability using 5-point hedonic scale (Score 5-Extremely Like; Score 4-Like; Score 3-Neither Like or Dislike; Score 2-Dislike; Score 1: Extremely Dislike). Statistical Analysis Data were collected in triplicate and statistically analysed by analysis of variance (ANOVA) and mean separation was by least significant difference at p<0.05 using Minitab®17 (Minitab Inc., United States of America). RESULTS AND DISCUSSION The colour values (L*, a*, b*) and total solid of the cocoa butter-based ice cream with different ratio of fresh skim milk and red dragon fruit puree are shown in Table 1. Cocoa butter-based ice cream with the ratio of fresh skim milk and red dragon fruit puree of 50:50 was significantly (p<0.05) darker (L* = 61.51±0.57), more red (a*=22.49±0.37) and less yellow (b*=10.83±0.23) than cocoa butter-based ice cream with the ratio of fresh skim milk and red
dragon fruit puree of 60:40 and 70:30 respectively. Red dragon fruit flesh contains red-violet pigment: betacyanin (Wybraniec, 2001; Wybraniec, 2002; Vaillant et al., 2005; Wybraniec et al., 2007; Rebecca et al., 2010; Tenore et al., 2012). Therefore, increment of red dragon fruit puree concentration paralleled with the reduction of skim milk concentration in cocoa butter-based ice cream with the ratio of fresh skim milk and red dragon fruit puree of 50:50 had resulted the value of a* increased and the decrement of L* and b* values. On the other hand, there was no significant difference (p>0.05) in terms of total solid despite different ratio of fresh skim milk and red dragon fruit puree.
On the other hand, cocoa butter-based ice cream with the ratio of fresh skim milk to red dragon fruit puree of 50:50 was most preferred by the panels with the overall acceptability score of 4.20.8 (Figure 2), whereby the colour of the product and the dragon fruit flavour intensity in this ratio had the highest mean sensory score. However, there was no significant difference (p>0.05) in terms of sensory scores for the attributes of sweetness, texture and meltability across all treatments. Therefore, colour and dragon fruit flavour intensity played an important role in the product acceptance by the panels.
Table 1. Colour Values and Total Solid of the Cocoa Butter-Based Ice Cream with Different Ratio of Fresh
Skim Milk and Red Dragon Fruit Puree
Ratio of Fresh Skim Milk and Red Dragon Fruit Puree
Colour Total Solid (%) L* a* b*
70:30 72.19±0.39a 15.62±0.07a 11.81±0.26a 36.52±0.10a
60:40 64.56±0.75b 18.51±0.21b 12.76±0.43b 36.38±0.15a
50:50 61.51±0.57c 22.49±0.37c 10.83±0.23c 36.60±0.08a
Mean values with different alphabets in the same column are significantly different (p<0.05) Positive values of L*, a* and b* indicate lightness, red and yellow respectively

226
Mean sensory scores with different alphabets in the same attributes are significantly different (p<0.05)
Figure 2. Sensory Quality of Cocoa Butter-Based Ice Cream with Different Ratio of Fresh Skim Milk and Red Dragon Fruit Puree
CONCLUSION Cocoa butter-based ice cream with the ratio of fresh skim milk to red dragon fruit puree of 50:50 was most preferred by the panels (mean score of overall acceptability: 4.20.8) and having total solid of 36.600.04% and colour with value of L*(61.510.57), a* (22.490.37) and b* (10.830.23). ACKNOWLEDGEMENT The authors wish to acknowledge Malaysian Cocoa Board (MCB) for funding this work.
REFERENCES Akbari, M., Eskandari, M. H., Niakosari, M. and
Bedeltavana, A. (2016). The effect of inulin on the physicochemical properties and sensory attributes of low-fat ice cream. International Dairy Journal, 57: 52-55.
Ariffin, A. A., Bakar, J., Tan, C. P., Rahman,
R.A., Karim, R. and Loi C. C. (2009). Essential fatty acids of pitaya (dragon
fruit) seed oil. Food Chemistry, 114(2): 561-564.
Bellec, F. L., Vaillant, F. and Imbert, E. (2006).
Pitahaya (Hylocereus spp.): a new fruit crop, a market with a future. Fruits, 61(4): 237-250.
Esquivel, P., Stintzing, F. C., and Carle, R.
(2007). Comparison of morphological and chemical fruit traits from different pitaya genotypes (Hylocereus spp.) grown in Costa Rica. Journal of Applied Botany and Food Quality, 81: 7-14.
Khalili, M. A., Norhayati, A. H., Rokiah, M. Y.,
Asmah, R., Siti Muskinah, M. and Abdul Manaf, A. (2009). Hypocholestrolemia effects of red pitaya (Hylocereus spp.) on hypercholestrolemic-induced rat. International Food Research Journal, 16: 431-440.
Liaotrakoon, W., Clereq, N. D., Hoed, V. V.,
Walle, D. V., Lewille, B. and Dewettinck, K. (2013). Impact of thermal treatment on physiochemical, antioxidant and rheological properties of white-flesh and red- flesh dragon fruit (Hylocereus spp.)

227
purees. Food Bioprocess Technology, 6(2): 416-430.
Lim, T. K. (2012). H. polyrhizus. In: Edible
medicinal and non- medicinal plants: Volume 1, fruits, Springer, pp. 643-648.
Matan, N., Puangjinda, K., Phothisuwan, S. and
Nisoa, M. (2015). Combined antibacterial activity of green tea extract with atmospheric radio-frequency plasma against pathogens on fresh-cut dragon fruit. Food Control, 50: 291-296.
Mohd Adzim Khalili, R., Norhayati, A. H.,
Rokiah, M. Y., Asmah, R., Mohd Nasir, M. T. and Siti Muskinah, M. (2006). Proximate composition and selected mineral determination in organically grown red pitaya (Hylocereus sp.). Journal of Tropical Agriculture and Food Science, 34(2): 269-275.
Nurul, S. R. and Asmah, R. (2014). Variability
in nutritional composition and phytochemical properties of red pitaya (Hylocereus polyrhizus) from Malaysia and Australia, International Food Research Journal, 21(4): 1689-1697.
Ong, Y. Y., Tan, W. S., Mohamad, R., Sieo, C.
C., and Tey, B. T. (2014) Biochemical and molecular identification of Enterococcus spp. from red pitaya. Process Biochemistry, 49: 563-568.
Raveh, E., Weiss, J., Nerd, A. and Mizrahi, Y.
(1993). Pitayas (genus Hylocereus): a new fruit crop for the Negev Desert of Israel. In: Janick, J. and Simon, J. E. (Eds.), New Crops, Wiley, New York, pp. 491-495.
Rebecca, O. P. S, Boyce, A. N. and Chandran, S.
(2010). Pigment identification and antioxidant properties of red dragon fruit.
African Journal of Biotechnology, 9(10): 1450-1454.
Stintzing, F. C, Schieber, A. and Carle, R.
(2002). Betacyanins in fruits from red-purple pitaya, Hylocereus polyrhizus (Weber) Britton & Rose. Food Chemistry, 77(1): 101-106.
Tenore, G. C., Novellino, E. and Basile, A.
(2012). Nutraceutical potential and antioxidant benefits of red pitaya (Hylocereus polyrhizus) extracts. Journal of Functional Foods, 4(1): 129-136.
Vaillant, F., Perez, A., Davila, I., Dornier, M.
and Reynes, M. (2005). Colorant and antioxidant properties of red-purple pitahaya. Fruits, 60(1): 3-12.
Wehr, H. M. and Frank, J. F. (2004). Standard
methods for the examination of dairy products, 17th Edition, American Public Health Association, Washington, D. C.
Wu, L. C., Hsu, H. W., Chen, Y. C., Chiu, C. C.,
Lin, Y. I., and Ho, J. A. (2006). Antioxidant and antiproliferative activities of red pitaya. Food Chemistry, 95: 319-327.
Wybraniec, S., Platzner, I., Geresh, S., Gottlieb,
H. E., Haimberg, M. and Mogilnitzki, M. (2001). Betacyanin from vine cactus Hylocereus polyrhizus. Phytochemistry, 58: 1209-1212.
Wybraniec, S. and Mizrahi, Y. (2002). Fruit
flesh betacyanin pigments in Hylocereus cacti. Journal of Agricultural and Food Chemistry, 50(21): 6086-6089.
Wybraniec, S., Nowak-Wydra, B., Mitka, K.,
Kowalski, P. and Mizrahi, Y. (2007). Minor betalains in fruits of Hylocereus species. Phytochemistry, 68: 251-259.

228
COMPREHENSIVE STRATEGY FOR VOLATILE AND NON-VOLATILE PESTICIDE RESIDUE ANALYSIS IN COCOA BEANS AND COCOA PRODUCTS THROUGH MULTI MASS
SPECTROMETRIC METHODS
Badrul Hisyam Zainudin and Salsazali Salleh Analytical Services Laboratory, Cocoa Innovation & Technology Centre, Malaysian Cocoa Board, Lot PT
12621, Nilai Industrial Park, 71800 Nilai, Negeri Sembilan, Malaysia
Malaysian Cocoa J. 11: 228-235 (2019) ABSTRACT – Currently, Malaysia is one of the largest cocoa processors in Asia and the world with a volume of 249,661 tonnes in 2018. Unfortunately, due to the shortage of local beans (814 tonnes in 2018), Malaysia had to import 345,489 tonnes of dried cocoa beans to meet the growing local grindings requirement. Hence, food safety played an important role in cocoa industry since the originality of the agrochemicals used in the exporting countries is unknown. This study covers the screening and quantitation of 26 volatile and non-volatile pesticides by gas chromatography (GC) and liquid chromatography (LC) coupled to triple quadrupole (QqQ) and quadrupole time-of-flight (QToF) mass spectrometry methods. Three steps analysis workflow was proposed using LC-QqQ-MS and GC-QqQ-MS for quantitation and LC-QToF-MS for screening purpose. The comprehensive workflow was validated and applied to cocoa beans and cocoa products collected from farmers, manufacturers, traders and local markets in 2017. Key words: Cocoa beans, cocoa products, pesticides, GC-QqQ-MS, LC-QqQ-MS, LC-QToF-MS INTRODUCTION Pesticide residue analysis in cocoa beans had been studied in the past especially in the African region (Aikpokpodion, Lajide, Aiyesanmi, & Lacorte, 2012; Dankyi, Carboo, Gordon, & Fomsgaard, 2015; K. S. Frimpong, Yeboah, Fletcher, Pwamang, & Adomako, 2012; Kofi Samuel Frimpong et al., 2012; Okoffo, Fosu-Mensah, & Gordon, 2016; Owusu-Ansah, Koranteng-Addo, Boamponsem, Menlah, & Abole, 2010). The identification of pesticide residues in food with high fat content such as cocoa beans is a difficult and challenging task since the inherent complexity of the matrix could interfere in the determination and quantification of the targeted analyte of interests. The high content of fat in cocoa beans (>50 %) makes them easily accumulate the active ingredients in pesticides especially lipophilic insecticides. Among other constituents contained in cocoa beans are high amount of fatty acids, fatty acid esters, phytosterols, tocopherols, sugar, polyphenols, theobromine, and caffeine.
Pesticide residue analysis had traditionally relied on the use of targeted approaches involving both gas chromatography
and liquid chromatography coupled to triple quadrupole mass spectrometry and operated in multiple reaction monitoring (MRM) mode. This type of analysis usually required the optimization of each individual analyte and allows the quantitation of the targeted pesticides at the lowest detection limit. However, by using triple quadrupole instruments, all other pesticides which not previously included in the list will not be detected. These non-detects are essentially false negative results. One possible option to increase the scope of the analysis and decrease the false negative results is the use of high-resolution mass spectrometry (HRMS) instruments to perform non-targeted acquisition across the mass range of interest. Nowadays, HRMS has become a serious alternative to MRM methods, mainly due to the recent popularization of time-of-flight (TOF) and Orbitrap analyzers (Rajski et al, 2014; Garcia-Reyes et al., 2007; Mol et al., 2012; Wang et al., 2015; Zomer et al., 2015).
The purpose of this work was to analyse
multiclass pesticide residues in dried cocoa beans using a comprehensive workflow via LC-QqQ-MS and GC-QqQ-MS for quantitation and LC-QToF-MS for screening purpose. The comprehensive

229
workflow was validated and applied to cocoa beans and cocoa products collected from farmers, manufacturers, traders and local markets in 2017.
MATERIALS AND METHODS Reagents and materials HPLC grade acetonitrile, anhydrous magnesium sulphate (MgSO4) and sodium chloride (NaCl) were all obtained from Merck (Darmstadt, Germany). Water was purified through an Elga Purelab Option-Q system (High Wycombe, UK). Two mL mini-centrifuge tube containing 150 mg MgSO4, 50 mg C18, and 50 mg primary secondary amine (PSA) was purchased from Agilent Technologies (Palo Alto, USA).
Pesticide reference standards of all analytes were purchased from Dr. Ehrenstorfer (Augsburg, Germany). Individual pesticide stock solutions (~1000 μg mL-1) were prepared in acetonitrile and kept at -20 °C in the dark. Mixed intermediate standard solutions (10 μg mL-1 and 1 μg mL-1) of multiple pesticides were prepared by diluting an appropriate volume of each individual stock standard solution in acetonitrile. All working solutions containing the target pesticides were prepared freshly by dilutions of the intermediate standard solution in acetonitrile and kept in scintillation vials at 4 °C in the refrigerator.
Cocoa beans samples for fortification Dried cocoa beans were obtained from Cocoa Research and Development Centre, Jengka. The samples were used for blanks, fortified samples for recovery assays and matrix-matched standards for calibration in the experiments. The samples were also previously tested for the absence of pesticide residues. The whole laboratory samples were ground using Retsch ZM 200 ultra-centrifugal mill (Haan, Germany) so that the greatest dimension of the particles does not exceed 1 mm, while avoiding the formation of paste. Subsequently, representative portions of previously homogenised samples were weighed and transferred into 50 mL screw cap centrifuge tubes and fortified with 200 μL and 100 μL from 0.1 μg mL-1 and 1 μg mL-1
intermediate standard solution respectively. The samples were then allowed to stand at room
temperature for 1 hour until analysis to give final spiking concentration levels of 10 μg/kg and 50
μg/kg. Extraction and clean-up procedure The samples were extracted according to the original unbuffered QuEChERS method (Anastassiades et al., 2003) with some modification. After homogenization, samples were weighed in a 50 mL screw cap centrifuge tubes and fortified with intermediate standard solution to give final spiking concentration of 10 and 50 μg/kg. Deionised water was added and the
mixtures were homogenised using a vortex mixer for 30 seconds and left to stand at room temperature for matrix swelling (hydration). Then, 10 mL of acetonitrile was added to the samples. The tubes were shaken using SPEX SamplePrep 1500 ShaQer (New Jersey, USA) for 1 min. After that, 4 g MgSO4 and 1 g NaCl were added and the mixtures were immediately shaken using 1500 ShaQer for 1 min, then centrifuged at 12000 rpm for 5 min at 4 °C. Hereafter, 1 mL of the supernatant was transferred into d-SPE tube. The tube was vortexed for 30 s. After centrifugation at 12000 rpm for 5 min, an aliquot of 0.5 mL extract was filtered through 0.2 μm PVDF filter into autosampler vial. This 0.5 mL extract was then injected into GC-MS/MS for volatile pesticide analysis before diluted with 0.5 mL water and analysed using LC-MS/MS and LC-QTOF-MS for non-volatile analysis.
Gas chromatography-triple quadrupole mass spectrometry analysis GC-MS/MS analysis was performed using an Agilent 7890A GC equipped with an Agilent 7693B autosampler and an Agilent 7000B triple quadrupole mass spectrometry system (Agilent Technologies, Palo Alto, USA). HP-5MS 30 m x 0.25 mm i.d. x 0.25 μm film thickness was used
for the chromatographic separation of the compounds. Five μL injection volume was
performed using a 7890A GC multimode inlet system operated in a PTV solvent vent injection mode. In this mode, injector temperature was ramped from 70 °C to 325 °C at 600 °C/min. He (99.999%) was used as carrier gas and quenching gas at a flow rate of 1.2 mL/min (constant flow) and 2.25 mL/min, respectively. Nitrogen
230
(99.999%) was used as the collision gas at a flow rate of 1.5 mL/min. The initial oven temperature was 70 °C, with an initial time of 0.1 min. The oven was heated to 170 °C at 50 °C/min and then to 300 °C at 15°C/min. The final temperature was held for 4 min and the total run time was 14.767 min. The mass spectrometer was operated in electron impact ionization (EI) mode. The temperatures of the transfer line, ion source, quadrupole 1 and quadrupole 2 were 280 °C, 300 °C, 180 °C and 180 °C respectively. Agilent MassHunter B.05.00 software was used for instrument control and data analysis. Liquid chromatography-triple quadrupole mass spectrometry analysis LC-MS/MS analysis was performed using an Agilent 1260 LC equipped with an Agilent Agilent 6420 triple quadrupole mass spectrometry system (Agilent Technologies, Palo Alto, USA). Separation was performed at 40 ˚C on a Zorbax
SB-C18 column (2.1 x 50 mm. 1.8 µm particle size, Agilent Technologies). The mobile phase consisted of water (solvent A:0.1 % formic acid, 5 mM ammonium formate) and acetonitrile (solvent B: 0.1 % formic acid, 5 mM ammonium formate). The following gradient profile was used: 5% B for 1 min, linear gradient to 95% B in 6 min and stayed for 1 min. Finally, gradient was back to equilibrium condition of 5% B for 4 min. The flow rate used was 0.4 mL/min with sample injection volume of 5 µL. The following MS parameter settings were used: Nitrogen gas temperature 350 ˚C at a flow rate of 11 mL/min. Nebuliser pressure of 30 psi, capillary voltage of 4 kV, and delta EMV of 200 V. Quantification was performed using MRM in positive ionization mode. Liquid chromatography quadrupole-time-of-flight mass spectrometry analysis UPLC was performed on ACQUITY UPLC I-Class system from Waters (Manchester, UK), consisting of binary pump, a vacuum degasser, an autosampler and a column oven. Separation was done using an ACQUITY UPLC BEH C18 (100 x 2.1 mm, 1.7 µm) from Waters at 45 °C. A linear binary gradient of water (mobile phase A) and methanol (mobile phase B), both containing ammonium acetate (5 mM, pH 5.0), was used. The mobile phase composition was changed during the
run as follows: 0 min, 2% B; 0.25 min, 2% B; 12.25 min, 99% B; 18.00 min, 99% B; 19.01 min, 2% B; 22.00 min, 2% B. The flow rate was set to 0.45 mL/min and the injection volume was 10 µL. The UPLC system was coupled to a Vion IMS QTOF mass spectrometer from Waters (Manchester, UK). The ion source was operated in positive electrospray ionization (ESI) mode under the following specific condition: capillary voltage, 0.45 kV; reference capillary voltage, 3.00 kV; cone voltage, 40 V; source offset, 80 V; source temperature, 120 °C; desolvation gas temperature, 550 °C; desolvation gas flow, 1000 L/h; cone gas flow, 50 L/h. Nitrogen (>99.5%) was employed as desolvation and cone gas. Data were acquired in high-definition MSE (HDMSE)mode in the range m/z 50 – 1200 at 0.25 s scan time. Two independent scans with different collision energies (CE) were alternatively acquired during the run: a low energy (LE) scan at a fixed CE of 4 eV, and a high energy (HE) scan where the CE was ramped from 10 – 45 eV. Argon (≥99.999%) was used as
collision-induced-dissociation (CID) gas. Data were evaluated with a UNIFI software and in-house database containing information on molecular formulae, retention time, accurate m/z, CCS values and fragment ions was established using pesticide standards in cocoa beans matrix. Cocoa beans and cocoa powder samples Domestic cocoa beans samples for monitoring study were collected from local farmers, while imported beans were collected from ports and comprised beans from Indonesia, Cameroon, Nigeria, Venezuela, Ghana, Ecuador and Papua New Guinea. Each sample was analyzed in duplicate and adhered to the confirmation criteria as described in Document No. SANTE/11945/2015 (European Commission, 2016). On the other hand, cocoa powder samples were obtained from local manufacturers, traders, and local markets. Sampling was done quarterly throughout the year in 2017.

231
RESULTS AND DISCUSSION Cocoa beans and cocoa powder monitoring The proposed method was applied to evaluate the status of pesticide level of local and imported cocoa beans and cocoa powder. Since the limit of quantification of the optimized method was set at 10 μg/kg, concentration below this value was not
reported and only documented for internal purpose. In total, 75 cocoa beans samples comprised of 52 local beans and 23 imported beans were analysed. Local beans were collected from smallholders of various regions of Malaysia such as Johor, Kelantan, Melaka, Pahang, Perak, Penang, Sabah, Sarawak, and Selangor. On the other hand, imported beans were collected from ports and came from various countries such as Ecuador, Ghana, Indonesia, Ivory Coast, Nigeria, Papua New Guinea, Peru, Philippine, Solomon, Tanzania, Uganda, and Congo.
In local beans, 55% of total beans collected were tested positive for 7 pesticides such as metalaxyl, chlorpyrifos, triadimenol, cypermethrin, deltamethrin, ametryn, cyfluthrin, and difenoconazole. Metalaxyl, triadimenol, deltamethrin, cyfluthrin, and difenoconazole were detected below national Maximum Residue Limit (MRL) (Food Regulations, 2010)). However, some pesticides for instance chlorpyrifos, cypermethrin, and ametryn were detected above national MRLs. Metalaxyl were detected in 18 samples and ranged from 10 to 108 µg/kg. However, none of them exceeded the national MRL of 200 µg/kg. Chlorpyrifos were detected in 17 samples and ranged from 10 to 2595 µg/kg with 6 samples were found above national MRL of 50 µg/kg. Cypermethrin were found in 9 samples and ranged from 11 to 495 µg/kg. However, only one sample exceeded MRL which regulated at 50 µg/kg. Other pesticides detected were found in 3 samples such as deltamethrin and ametryn. Ametryn concentrations were ranged from 10 to 315 µg/kg where one sample exceeded national MRL of 200 µg/kg. Cyfluthirn, difenoconazole and triadimenol were detected at one sample each and none of them exceeded national MRL. In imported beans, 4 pesticides were detected for 35% of total beans monitored. They are metalaxyl, chlorpyrifos, permethrin, and cypermethrin. All pesticides were
well below national MRLs except for permethrin. In the case of permethrin, no regulation was set at the moment hence the default MRL value of 10 µg/kg was used. Two samples were detected for permethrin at 34 and 107 µg/kg.
Cocoa powder samples were obtained
from local manufacturers, traders, and local markets. In all, 66 samples were collected and analysed in 2017 and 12% of the samples were tested positive for metalaxyl, chlorpyrifos, triadimenol, permethrin, cypermethrin, and deltamethrin. As discussed previously, permethrin residues exceeded the default MRL value of 10 µg/kg where the concentrations were ranged from 50 to 75 µg/kg. Metalaxyl concentrations were below MRL and ranged from 11 to 29 µg/kg, where else chlorpyrifos were ranged from 45 to 46 µg/kg. Cypermethrin was also detected in 5 of the samples and ranged from 14 to 46 µg/kg while deltamethrin was detected at 17 to 20 µg/kg. Triadimeol was only found in one sample at 11 µg/kg.
The monitoring study found that most of
the pesticides detected belong to insecticide which can be classified as organophosphorus and synthetic pyrethroid. Synthetic pyrethroid insecticides were known for their hydrophobic properties and the residues might have systemically enter the pods and find their way into the beans. The nature of cocoa beans matrix which is high in fat content prolonged these residues in the beans and eventually in the semi-finished products such as cocoa powder. High amount of synthetic pyrethroids such as permethrin, cypermethrin and deltamethrin found in cocoa powder further confirm this statement. All these pesticides were used in the field to fight against cocoa pod borer (C. cramerella). Other classes of pesticide found were fungicide and herbicide. High amount of herbicide was found in one cocoa beans sample near Kapar where two out of three samples collected in 2017 were found positive for ametryn. However, the final sample collected in November that year found that ametryn was not a concern anymore where no residues were found. Three types of fungicide were found in the form of difenoconazole, triadimenol and metalaxyl. While difenoconazole and triadimenol were only detected

232
in one sample, metalaxyl was the most prevalent compound found in both cocoa beans and cocoa powder samples. Metalaxyl with the combination of cuprous oxide were identified to be successful to control black pod (P. palmivora) and therefore high incidences of the residue are expected.
In this study, three different powerful
mass spectrometric techniques were used in order to confirm the positive residues. Samples were first analysed using gas chromatographic and liquid chromatographic technique combined with triple quadrupole mass spectrometric detector in order to quantify a wide range of pesticides, from nonpolar to polar. Figure 1 depicted the detected pesticide residues in cocoa beans samples. For confirmation of the studied compounds, two transitions and a correct ratio between the abundances of the two transitions are used, along with retention time matching. The ion ratio should have specified tolerances of ± 20 % and the retention time of the analytes must not vary beyond ± 0.2 min (European Commission, 2016).
However, triple quadrupole instruments can only analyse the preconfigure list of targeted pesticides. In order to analyse a wider range of pesticide residues, qualitative screening method will be needed to cover the pesticides not in the targeted group of quadrupole instruments. Hence, in this study, a liquid chromatographic technique coupled to quadrupole-time-of-flight instrument was applied as the final screening approach to further confirm the positive pesticides found in cocoa beans and cocoa powder samples. The optimized screening criteria consisted of mass accuracy (± 5 ppm), retention time (± 0.2 min) and collision cross section (CCS) (± 2%). Figure 2 shows the extracted ion chromatograms of the precursor ions and its main fragment ions for metalaxyl, one of the positively detected pesticides in cocoa beans samples. Metalaxyl recorded a CCS value of 163.29 Ų. Focusing on the low and high energy spectra obtained with and without drift time filtering, it can be observed that the drift time alignment resulted in much more cleaner spectra, which greatly simplifies the identification process.

233
Figure 1. [A] Extracted ion chromatogram (XIC) of incurred residues cocoa beans sample; [B] Chlorpyrifos standard solution; [C] Chlorpyrifos incurred residue in sample
B C
A
Metalaxyl
Chlorpyrifos
Permethrin Cypermethrin

234
Figure 2. Incurred residues of metalaxyl in cocoa beans: (A) Extracted ion chromatograms for the [M + H]+ ion and its main fragment ions; (B) Extracted ion mobiligram for the [M + H]+ ion; (C) Low energy (LE) and high energy (HE) spectra with drift time filtering; (D) Low energy (LE) and high energy (HE) spectra without drift time filtering.
A BA
C D
Drift time filtering
163.29 Ų
[M + H]+
[M + H]+
LE
HE
LE
HE

235
CONCLUSIONS In conclusion, three steps analysis workflow was proposed using LC-QqQ-MS and GC-QqQ-MS for quantitation and LC-QToF-MS for screening purpose. The comprehensive workflow was validated and applied to cocoa beans and cocoa products collected from farmers, manufacturers, traders and local markets in 2017. The combination of ion ratio, retention time, mass accuracy and collision cross section values gave unequivocal identification and confirmation of pesticide residues and ultimately decreased the occurrence of false positive and negative in the interpretation and reporting or results. ACKNOWLEDGEMENT The authors would like to thank the Malaysian Cocoa Board (MCB) for financially supporting this work and the Director General of the MCB for permission to publish this paper. The authors are also highly indebted to the Regulatory and Quality Control Division for providing the monitoring samples for analysis. REFERENCES Aikpokpodion, P., Lajide, L., Aiyesanmi, A. F.
& Lacorte, S. (2012). Residues of Dichlorodiphenyltrichloroethane (DDT) and its Metabolites in Cocoa Beans from Three Cocoa Ecological Zones in Nigeria. European Journal of Applied Sciences, 4(2): 52–57.
Anastassiades, M., Lehotay, S. J., Stajnbaher, D. & Schenck, F. J. (2003). Fast and Easy Multiresidue Method Employing Acetonitrile. Journal of AOAC International, 86(2): 412–431.
Dankyi, E., Carboo, D., Gordon, C. & Fomsgaard, I. S. (2015). Application of the QuEChERS procedure and LC-MS/MS for the assessment of neonicotinoid insecticide residues in cocoa beans and shells. Journal of Food Composition and Analysis, 44: 149–
157. http://doi.org/10.1016/j.jfca.2015.09.002
European Commission. (2016). Directorate-General for Health and Food Safety. Guidance document on analytical quality control and method validation procedures for pesticides residues analysis in food and feed. SANTE/11945/2015.
Food Regulations. (2010). Food Act 1983 (Act 281) and Regulations. Selangor: International Law Book Services.
Frimpong, K. S., Yeboah, P. O., Fletcher, J. J., Pwamang, J., & Adomako, D. (2012). Assessment of synthetic pyrethroids pesticides residues in cocoa beans from Ghana. Food Science, 49: 9871–9875.
Frimpong, K. S., Yeboah, P., Fletcher, J. J., Adomako, D., Osei-fosu, P., & Acheampong, K. (2012). Organochlorine pesticides levels in fermented dried cocoa beans produced in Ghana. Elixir Agriculture, 44: 7280–
7284. Garcia-Reyes, J.F., Hernando, M.D., Molina-
Diaz, A., Fernandez-Alba, A.R. (2007). Comprehensive screening of target, nontarget and unknown pesticides in food by LC-TOF-MS. Trac-Trends Anal. Chem., 26: 828–841.
Okoffo, E. D., Fosu-Mensah, B. Y., & Gordon, C. (2016). Persistent organochlorine pesticide residues in cocoa beans from Ghana, a concern for public health. International Journal of Food Contamination, 3(1): 5. http://doi.org/ 10.1186/s40550-016-0028-4.
Owusu-Ansah, E., Koranteng-Addo, J. E., Boamponsem, L. K., Menlah, E. & Abole, E. (2010). Assessment of Lindane pesticide residue in Cocoa beans in the Twifo Praso district of Ghana. Journal of Chemical and Pharmaceutical Research, 2(4): 580–
587. Rajski Ł., Del Mar Gomez-Ramos, M. &
Fernandez-Alba, A.R. (2014). Large pesticide multiresidue screening method by liquid chromatography-Orbitrap mass spectrometry in full scan mode applied to fruit and vegetables, J. Chromatogr. A, 1360: 119-127.

236
ARTIFICIAL NEURAL NETWORK (ANN) AND RESPONSE SURFACE METHODOLOGY (RSM) BASED MODELLING FOR OPTIMIZATION OF POLYPHENOLS EXTRACTION
CONDITION FROM COCOA SHELL
Arief Huzaimi Md Yusofa,b, Siti Salwa Abd Ganib,c,*, Uswatun Hasanah Zaidand, Mohd Izuan Effendi Halmie
aMalaysia Cocoa Board, Cocoa Innovative and Technology Centre, Lot 12621 Nilai Industrial Area, 71800 Nilai, Negeri Sembilan, Malaysia
bHalal Products Research Institute, Universiti Putra Malaysia, Putra Infoport, 43400 Serdang, Selangor, Malaysia.
cDepartment of Agriculture Technology, Faculty of Agriculture, Universiti Putra Malaysia dDepartment of Biochemistry, Faculty of Biotechnology & Biomolecular Sciences, Universiti Putra
Malaysia. eDepartment of Land Management, Faculty of Agriculture, Universiti Putra Malaysia
Corresponding addresses: [email protected], [email protected]
Malaysian Cocoa J. 11: 236-242 (2019) ABSTRACT - In the present study, response surface methodology (RSM) and artificial neural network (ANN) were used to develop an approach for the extraction of bioactive compound process. Low cost and green enhancement (ultrasound) was used to increase the extraction yield. In this study, the effect of the condition parameters on constant frequency ultrasound at 40 kHz such as percentage of solvent ration, temperature, and duration was studied using Central Composite Design (CCD). For ANN, the training set was obtained from the RSM design. Both model result and experimental data were compared and show a high correlation of coefficient (R2 ANN 0.9906, R2 RSM 0.9874). This showed the two models were able to predict the polyphenols extraction yield. The optimum condition predicted by RSM occurred at 63.18%
ethanol concentration, 55 ᵒC and 45 minutes with total phenolic content 40.09±0.07 mgGAEdwg-1 with predicted value 39.96 mgGAEdwg-1 while the predicted value by ANN is at 40.08 mgGAEdwg-1.The ANN model shows better prediction data with a higher R2 value and smaller root mean square error (RMSE) and average absolute deviation (ADD) of 0.4511 and 1.4092% respectively. This finding suggests that the ANN showed a better prediction and fitting ability compared to the RSM for nonlinear regression analysis.
Key words: Cocoa shell, ultrasound-assisted, response surface methodology, and artificial neural network. INTRODUCTION Polyphenols the word itself is unique. Polyphenols are one of the compounds that have antioxidant properties. The antioxidant concept was used to proposed mechanism in free-radical reaction. Previous study has shown that the free radicals have proven to damage all biochemical compounds such as protein, DNA/RNA and micronutrients [1]. There were many strategies to defend against such aggressive radical species include using radical scavenging such as vitamin A and C, enzymes or antioxidant that can be found in the natural material [2]. Despite the benefits of polyphenols to humans, the technique to obtain a high concentration of polyphenols from natural resources was not inattention. There are many types of extraction to obtain the targeted
bioactive compound [3]. Some of the extraction was used without any analytical modelling or design to optimize the extraction. Traditionally, the aqueous method with high temperature and long duration was used to obtain the polyphenols extract. In the present study the novel extraction with a proper modelling design experiment or simulation such as response surface methodology (RSM), artificial neural network (ANN), Wavelet neural network (WNN), Neural Fuzzy (Nfizz) and etc [4].
So in this study, the RSM and ANN were used as a comparison of modelling in the optimization of the polyphenol extract from the Malaysian cocoa shell (MSC).

237
MATERIALS AND METHODS
Materials and chemicals The fresh cocoa bean used in this study was collected from Pusat Penyelidikan Dan Pembangunan Koko (PPPK), Jengka, Pahang, Malaysia. All the fresh beans were freeze-dried to remove all enzymes and pulp juice. Next, the Malaysian cocoa shell (MCS) was manually removed from the bean and pulp. Other chemicals used in this study are Folin-Ciocalteu phenol reagent, sodium carbonate, gallic acid, and ethanol. All chemicals were analytical grade.
Ultrasound-assisted extraction First, MCS was crushed in a mechanical blender (IKA, German) with 1mm blade. Next, 1g of MCS was mixed with a 50mL various concentration of solvent and extracted using ultrasound assisted extraction (UAE) from a sonication bath machine (Wiseclean 40kHz, Korea). The temperature of the sonication bath was controlled by using a cooler machine connected to the machine. The extraction process was conducted according to Table 2. The aqueous extract obtained was filtered using Watman filter paper number 4, and the solvent was removed using a rotary evaporator (IKA, German) and freeze-dried (Labconco, USA) to get the crude extract. The crude extract was stored at -40 °C in storage vials until further analysis.
Experimental design
Response surface methodology modeling The design to optimize the condition for ultrasound-assisted was built by using a central composite design (CCD) extraction condition. Five levels were used in the design with a range of variables was set as shown in Table 1. The data were analyzed by using the second polynomial equation (equation 1) and total phenolic content was set as an independent variable (Y). For the complex interaction variables, linear and quadratic were analyzed using analysis of variance (ANOVA) to determine the β value in the equation 1,
coefficient of determination (R2) and lack of fit test value on the total phenolic content. All data
were analyzed using Expert Design Software 10, and the T-test was performed by using Minitab 4 software.
(1)
Where Y is the response variable, 0 is a constant, i, ii and ij are the linear, quadratic and interactive coefficients, respectively. X i and Xj are the levels of independent variables.
Artificial neural network modeling In this study, the artificial neural network (ANN) was used to describing the MCS extraction process as in Figure 1. The same data for RSM was used in ANN. The optimized topology of ANN Levenberg-Marquardt (LM) network 3-8-1 (data not published) such as number of nodes, number of the hidden layer, network type, and training function was used to compare with the RSM. The data were divided into 3 groups which were 70% was the main network, 15% was a validation and training group respectively. The selection of the number of data was randomized by the software. The data was run by using Neural Network Toolbox of MATLAB R2018a to obtain the lowest root mean square error (RMSE) and R2.
Figure 1. The architecture of the developed artificial neural network (ANN).
Comparison between the RSM and ANN prediction capacities for the optimization of TPC from MCS The efficiency of the RSM and ANN were determined from the statistical analyses from the value of the R2, RMSE, and absolute average deviation (AAD). These three statistical data were

238
Table 1. Independent variables and their levels for Central Composite Design.
Independent variables Levels
-α -1 0 1 α
Ethanol Concentration (X1)(%) 63.18 70 80 90 96.82
Temperature (X2)(°C) 38.18 45 55 65 71.82
Ultrasound Irradiation Time (X3)(Minutes)
19.77 30 45 60 70.23
Table 2. The central composite design of ethanol concentration, temperature, ultrasound irradiation time and their observed responses using UAE.
Run Ethanol
concentration, X1(%)
Temperature, X2(°C)
Ultrasound irradiation
time, X3(minutes)
TPC Experiment (mg RE/g
DW)
TPC RSM Prediction (mg RE/g
DW)
TPC ANN Prediction (mg RE/g
DW) 1 70.00 45.00 60.00 31.13±0.05 30.72 31.13 2 70.00 65.00 60.00 33.42±0.33 33.14 33.42 3 80.00 38.18 45.00 19.58±0.42 19.69 19.58 4 96.82 55.00 45.00 12.85±0.16 14.32 13.34 5 70.00 65.00 30.00 33.81±0.17 33.36 33.80 6 90.00 65.00 30.00 19.58±0.07 19.05 19.58 7 80.00 55.00 45.00 22.13±0.12 21.72 22.13 8 80.00 55.00 45.00 21.78±0.08 21.72 22.13 9 80.00 55.00 70.23 20.04±0.13 21.21 20.04
10 80.00 71.82 45.00 24.94±0.13 26.16 24.56 11 90.00 45.00 60.00 15.04±0.04 14.54 15.04 12 90.00 45.00 30.00 14.44±0.08 13.78 15.24 13 80.00 55.00 19.77 20.60±0.32 20.76 20.60 14 80.00 55.00 45.00 21.12±0.21 21.72 22.13 15 90.00 65.00 60.00 18.92±0.06 17.36 18.92 16 80.00 55.00 45.00 21.19±0.21 21.72 22.13 17 70.00 45.00 30.00 27.87±0.17 28.48 27.87 18 80.00 55.00 45.00 22.89±0.19 21.72 22.13 19 80.00 55.00 45.00 21.46±0.38 21.72 22.13 20 63.18 55.00 45.00 40.09±0.07 39.96 40.08
Calculated using equation. (2)– (3).
Where Ypred is the predicted data obtained from either RSM or ANN, Yexp is the experimental data, and n is the number of the experimental run (n = 20)

239
(2)
Determination of total phenolic content The total phenolic content of MCS was evaluated by using the method mentioned by Karim et al (2014) and Azizah Othman et al (2007) with several modifications [5,6]. For each sample, 0.5 mL of the extraction with concentration 500 ug/mL were added to the 2.5 mL of 10% FC reagent and vortexed for 10 seconds. Next, the mixture was added with 1.8 mL of 7.5% sodium carbonate, vortexed for 10 seconds and incubated for 60 minutes in the dark at temperature 40 °C. The mixture was then measured its absorbance at 765 nm using a UV-visible spectrophotometer (Cary 60, Agilent, USA). The TPC was expressed as milligrams of gallic acid equivalents per gram of sample [(mg GAE/g DW (dry weight)] using a calibration curve constructed with gallic acid (0–1000
ug/mL), with all samples being analyzed in triplicate. RESULTS AND DISCUSSION
Response surface methodology modeling The second order of the polynomial model is the most commonly used for the engineering optimization process. The data recorded from the experiments have analysed the significance of the model, the lack of fit test through P-value and determined the value of β. The ANOVA was
shown in Table 3. The RSM model showed significant with p<0.0001. This shown the data were fit to the model. On the other hand, the lack of fit test of the model was 0.0709 and the R2 was 0.9874. This shows that the RSM model equation (equation 2) can be used to predict future observation within the design range.
Table 3. Analysis of variance for the fitted quadratic model of TPC from cocoa shell extract.
Source Sum of Square
Degree of freedom
Mean square F-value P-value
Model 905.08 9 100.56 86.98 <0.0001
X1 793.23 1 100.56 686.11 <0.0001
X2 50.50 1 143.68 43.68 <0.0001
X3 0.25 1 0.22 0.22 0.6492
X12 52.85 1 045.71 4571 <0.0001
X22 2.61 1 2.26 2.26 0.1639
X32 0.98 1 0.85 0.85 0.3783
X1X2 0.078 1 0.068 0.068 0.7999
X1X3 1.07 1 0.93 0.93 0.3582
X2X3 3.01 1 2.60 2.60 0.1376
Residual 11.56 10 1.16
Lack of fit 9.33 5 1.87 4.19 0.0709
Pure error 2.23 5 0.45
R2 = 0.9874
R2pred = 0.9182
CV % = 4.65
To visualize the effect of the three variable in the process, the 3D graph as shown in Figure 2,3 and 4. All the variables in the process have an effect on the quantity of the TPC extracted from MCS. This shown by the fact that the p-value for the model is significant.
A previous study done by Javier et al (2016) shows that the extract increased with the increase of ethanol concentration [7]. The

240
increasing of the TPC as the increasing of the ethanol concentration and temperature show that the polarity of the solvent was reduced [8]. This would attract more compound (different polarity) from the targeted cell to be extracted. The same effect was observed when the temperature and time was increased. Another study was done by Thomas et al (2000) mention that by increasing time and temperature can reduce the thermal resistance of the targeted cell in the nature material [9].
Figure2. Response surface plot and of ethanol concentration (X1) and
Temperature (X2).
Figure 3. Response surface plot of ethanol concentration (X1) and Ultrasound irradiation time (X3).
Figure 4. Response surface plot of temperature (X2) and Ultrasound
irradiation time (X3).
Artificial neural network modeling ANN is a linear modeling technique for simulation and optimizing the extraction process [10]. In this study, ANN was utilized to model the process of extraction using LM as the learning algorithm to determine the weigh and biases. By optimized the number of nodes, type of network and hidden layer, and the network 3-8-1 was used in this study. The result achieved recorded in Table 2 was used to build the model. From the optimized network, the model was built with the minimal dimension and errors in training and testing group. In this study, the inputs were ethanol concentration, temperature, and ultrasound irradiation time while the output of the model was TPC. The goodness of fit between the observation and predicted response data from ANN show for the value of R2 was 0.9906. Comparison between RSM and ANN The RSM used lack of fit test to determine the accuracy of the model in predicted the value of the response in the design range while the ANN using RMSE and AAD. For this reason, the RSM were calculated its RMSE and AAD using equation 2 and 3. The result of comparison AAD and RMSE between RSM and ANN were shown in Table 4. The coefficient of determination shown that ANN was more superior in predicted the value of the TPC compared to the RSM. The lowest value of RMSE shown that the experimental and predicted value has a lower error. The AAD confirms that the ANN model was good in predicting the value of TPC form
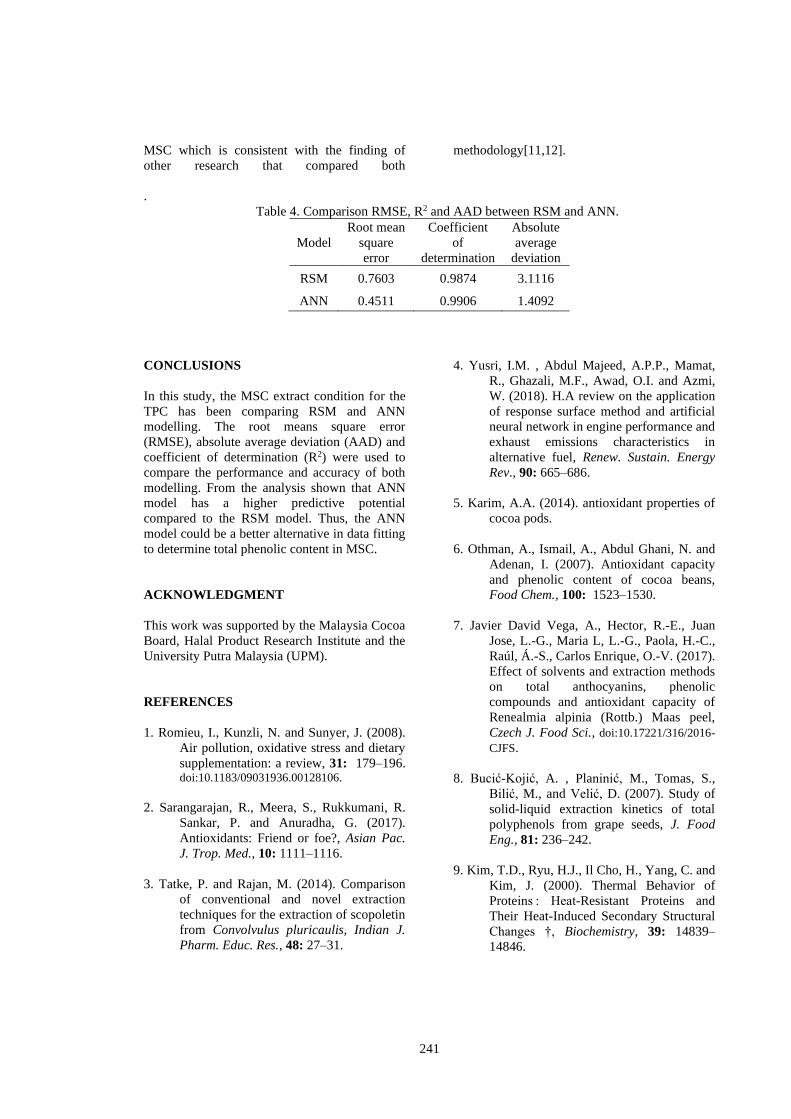
241
MSC which is consistent with the finding of other research that compared both
methodology[11,12].
.
Table 4. Comparison RMSE, R2 and AAD between RSM and ANN.
Model Root mean
square error
Coefficient of
determination
Absolute average
deviation
RSM 0.7603 0.9874 3.1116
ANN 0.4511 0.9906 1.4092
CONCLUSIONS In this study, the MSC extract condition for the TPC has been comparing RSM and ANN modelling. The root means square error (RMSE), absolute average deviation (AAD) and coefficient of determination (R2) were used to compare the performance and accuracy of both modelling. From the analysis shown that ANN model has a higher predictive potential compared to the RSM model. Thus, the ANN model could be a better alternative in data fitting to determine total phenolic content in MSC. ACKNOWLEDGMENT This work was supported by the Malaysia Cocoa Board, Halal Product Research Institute and the University Putra Malaysia (UPM). REFERENCES
1. Romieu, I., Kunzli, N. and Sunyer, J. (2008).
Air pollution, oxidative stress and dietary supplementation: a review, 31: 179–196. doi:10.1183/09031936.00128106.
2. Sarangarajan, R., Meera, S., Rukkumani, R.
Sankar, P. and Anuradha, G. (2017). Antioxidants: Friend or foe?, Asian Pac. J. Trop. Med., 10: 1111–1116.
3. Tatke, P. and Rajan, M. (2014). Comparison
of conventional and novel extraction techniques for the extraction of scopoletin from Convolvulus pluricaulis, Indian J. Pharm. Educ. Res., 48: 27–31.
4. Yusri, I.M. , Abdul Majeed, A.P.P., Mamat, R., Ghazali, M.F., Awad, O.I. and Azmi, W. (2018). H.A review on the application of response surface method and artificial neural network in engine performance and exhaust emissions characteristics in alternative fuel, Renew. Sustain. Energy Rev., 90: 665–686.
5. Karim, A.A. (2014). antioxidant properties of
cocoa pods. 6. Othman, A., Ismail, A., Abdul Ghani, N. and
Adenan, I. (2007). Antioxidant capacity and phenolic content of cocoa beans, Food Chem., 100: 1523–1530.
7. Javier David Vega, A., Hector, R.-E., Juan
Jose, L.-G., Maria L, L.-G., Paola, H.-C., Raúl, Á.-S., Carlos Enrique, O.-V. (2017). Effect of solvents and extraction methods on total anthocyanins, phenolic compounds and antioxidant capacity of Renealmia alpinia (Rottb.) Maas peel, Czech J. Food Sci., doi:10.17221/316/2016- CJFS.
8. Bucić-Kojić, A. , Planinić, M., Tomas, S.,
Bilić, M., and Velić, D. (2007). Study of solid-liquid extraction kinetics of total polyphenols from grape seeds, J. Food Eng., 81: 236–242.
9. Kim, T.D., Ryu, H.J., Il Cho, H., Yang, C. and
Kim, J. (2000). Thermal Behavior of Proteins : Heat-Resistant Proteins and Their Heat-Induced Secondary Structural Changes †, Biochemistry, 39: 14839–
14846.

242
10. Talib, N.S.R., Halmi, M.I.E., Ghani, S.S.A., Zaidan, U.H. and Shukor, M.Y.A. (2019). Artificial Neural Networks (ANNs) and Response Surface Methodology (RSM) Approach for Modelling the Optimization of Chromium (VI) Reduction by Newly Isolated Acinetobacter radioresistens Strain NS-MIE from Agricultural Soil, Biomed Res. Int., doi:10.1155/2019/ 5785387.
11. Alara, O.R., Abdurahman, N.H., Afolabi,
H.K. and Olalere, O.A. (2018). Efficient extraction of antioxidants from Vernonia
cinerea leaves: Comparing response surface methodology and artificial neural network, Beni-Suef Univ. J. Basic Appl. Sci., 7: 276–285.
12. Pilkington, J.L., Preston, C. and Gomes, R.L.
(2014). Comparison of response surface methodology (RSM) and artificial neural networks (ANN) towards efficient extraction of artemisi from Artemisia annua. Ind. Crops Prod., 58: 15 - 24.

243
Aims & Scope Malaysian Cocoa Journal aims • To create and maintain an active communication network for the exchange of information • among scientists and the cocoa industry • To support the research and professional activities of researchers in cocoa through publications • To publish original research on cocoa and thereby added to the existing database of scientific
knowledge. The Journal will be published once a year initially, subject to the discretion of the Editor. The journal cover original scientific contributions dealing with cocoa, cocoa products and byproducts as well as articles dealing with cocoa extension, licensing, marketing and other activities relating to the cocoa industry. Manuscript Preparation Layout of papers Full papers, figures, and tables must be typed double spacing on A4 paper (21.0 cm x 29.7 cm) with margins of at least 4 cm on the left, 2 cm on the right, 4 cm on the top and 4 cm at the bottom. Abstract Each full paper (research) must include an informative summary not exceeding 250 words. It should contain all essential information regarding objectives, materials and methods, results and conclusions, but excluding figures, sectional headings, tables and references. Full paper A paper which reports the results of research should be divided into the following sections: (i) Abstract, (ii) Introduction, (iii) Materials and Methods, (iv) Results, (v) Discussions, (vi) Conclusions, (vii) Acknowledgements and (viii) References. No full paper should exceed 3,000 words (except for review papers), figures and graphs. Each table, figure or graph is considered being equal to the number of words, which could have been typed in the equivalent space. Any contribution in excess of this length may not be published in the Journal. Papers are considered to have been submitted in the final form after they have been fully checked for typographical and other errors. The full paper should be in English. Manuscripts are to be written using Times New Romans, font size 10. A full guideline for manuscript writing is obtainable upon request. Submission of Manuscripts Send three of copies of the manuscript, disk in a heavy-paper envelope, enclosing the copies and figures in cardboard, if necessary, to prevent the photographs from being bent. Place photographs and transparencies in a separate heavy-paper envelope. Manuscripts must be accompanied by a covering letter to the following address,
The Editor, Malaysian Cocoa Journal, Malaysian Cocoa Board,
Locked Bag 211, 88999 Kota Kinabalu, Sabah, Malaysia.
(c/o Dr. Rosmin Kasran)

iii