The IDH Cocoa Productivity and Quality Programme (CPQP ...
198
Verina Ingram, Yuca Waarts, Lan Ge, Simone van Vugt, Lucia Wegner, Linda Puister-Jansen, Francois Ruf and Roger Tanoh Impact assessment framework and baseline The IDH Cocoa Productivity and Quality Programme (CPQP) in Côte d’Ivoire
-
Upload
khangminh22 -
Category
Documents
-
view
1 -
download
0
Transcript of The IDH Cocoa Productivity and Quality Programme (CPQP ...

LEI Wageningen UR carries out socio-economic research and is the strategic partner for governments and the business community in the field of sustainable economic development within the domain of food and the living environment. LEI is part of Wageningen UR (University and Research centre), forming the Social Sciences Group together with the Department of Social Sciences and Wageningen UR Centre for Development Innovation.
The mission of Wageningen UR (University & Research centre) is ‘To explore the potential of nature to improve the quality of life’. Within Wageningen UR, nine specialised research institutes of the DLO Foundation have joined forces with Wageningen University to help answer the most important questions in the domain of healthy food and living environment. With approximately 30 locations, 6,000 members of staff and 9,000 students, Wageningen UR is one of the leading organisations in its domain worldwide. The integral approach to problems and the cooperation between the various disciplines are at the heart of the unique Wageningen Approach.
Verina Ingram, Yuca Waarts, Lan Ge, Simone van Vugt, Lucia Wegner, Linda Puister-Jansen, Francois Ruf and Roger Tanoh
Impact assessment framework and baseline
The IDH Cocoa Productivity and Quality Programme (CPQP) in Côte d’Ivoire
LEI Wageningen URP.O. Box 297032502 LS Den HaagThe NetherlandsE [email protected]/lei
LEI Report 2014-016ISBN 978 90 8615 679

The IDH Cocoa Productivity and Quality Programme (CPQP) in Côte d’Ivoire
Impact assessment framework and baseline
Verina Ingram, Yuca Waarts, Lan Ge, Simone van Vugt, Lucia Wegner, Linda Puister-Jansen, Francois Ruf
and Roger Tanoh
Wageningen UR (Wageningen University, Van Hall Larenstein University of Applied Sciences and various research
institutes) is specialised in the domain of healthy food and living environment.
LEI develops economic expertise for government bodies and industry in the field of food, agriculture and the
natural environment. LEI is accredited with ISO 9001.
LEI Wageningen UR
Wageningen, July 2014
REPORT
LEI 12014-016
ISBN 978-90-8615-679-5

V. Ingram, Y. Waarts, L. Ge, S. van Vugt, L. Wegner, L. Puister-Jansen, F. Ruf, R. Tanoh, 2014. The
IDH Cocoa Productivity and Quality Programme (CPQP) in Côte d’Ivoire; Impact assessment
framework and baseline. Wageningen, LEI Wageningen UR (University & Research centre), LEI Report
2014-016. 196 pp.; 83 fig.;18 tab.; 16 quotations; 33 photo.
Team: LEI Wageningen UR led in partnership with the Centre for Development Innovation (CDI) of
Wageningen UR, the French Centre de Coopération Internationale et Recherche Agronomique pour le
Développement (CIRAD), and Ivorian research organisation Agriculture et Cycles de Vie
Field research: Agriculture et Cycle de Vie (A & CV) collected field data, led by Roger Tanoh and Abel
Galo and advised by Francois Ruf, Verina Ingram and Simone van Vugt. Verina Ingram, Simone van
Vugt and Lucia Wegner also conducted field interviews.
Research sampling design: Yuca Waarts, Lan Ge, Verina Ingram, Lucia Wegener, Simone van Vugt
Trainers: Verina Ingram, Simone van Vugt
Analysts: Yuca Waarts, Lan Ge, Verina Ingram, Lucia Wegener, Simone van Vugt
Field research: November 2012 to June 2013. Workshop to review findings November 2013. Final
Report December 2013. Updated integrating comments: May 2014.
Measures and conversion: Monetary units are stated in the official currency of Côte d’Ivoire,
the African Financial Community franc (Communauté Financière Africaine) (CFAF) and euros. The
prevailing exchange rate during the research period was 655 CFAF to 1 Euro (€).
Measures are given in metric tons and kilograms (kg) and in hectares (ha).
The term ‘control’ denotes non-certified farmers used as a comparison to the farmers participating in
the CPQP.
The term statistical significance uses asterisks as follows: * p<=0.01 at 95% level of confidence and
** denotes p 0.05 levels deemed 'highly' significant, at least 99% level of confidence. See Box 1 for
additional information. In most figures the mean value is displayed with the median value shown by
a red square.
IDH counterparts: Dave Boselie, Jonas Mva Mva, Renske Aarnoudse and Alphonse Kossonou.
Citation suggestion: Ingram V., Waarts Y, Ge L., van Vugt S., Wegner L., Puister-Jansen L., Ruf F.,
Tanoh R. 2013. The IDH Cocoa Productivity and Quality Programme (CPQP) in Côte d’Ivoire. Impact
assessment framework and baseline. LEI Wageningen UR. Den Haag, the Netherlands.
Key words: cocoa, Ivory Coast, certification, sustainability initiatives, baseline, impact assessment
This report can be downloaded for free at www.wageningenUR.nl/en/lei (under LEI publications).
© 2014 LEI Wageningen UR
P.O. Box 29703, 2502 LS Den Haag, The Netherlands, T +31 (0)70 335 83 30,
E [email protected], www.wageningenUR.nl/en/lei. LEI is part of Wageningen UR (University &
Research centre).
For its reports, LEI utilises a Creative Commons Attributions 3.0 Netherlands license.
© LEI, part of DLO Foundation, 2014

The user may reproduce, distribute and share this work and make derivative works from it. Material
by third parties which is used in the work and which are subject to intellectual property rights may not
be used without prior permission from the relevant third party. The user must attribute the work by
stating the name indicated by the author or licensor but may not do this in such a way as to create the
impression that the author/licensor endorses the use of the work or the work of the user. The user
may not use the work for commercial purposes.
LEI accepts no liability for any damage resulting from the use of the results of this study or the
application of the advice contained in it.
LEI is ISO 9001:2008 certified.
LEI Report 2014-016 | Project code 2273000527
Cover photo: Roger Tanoh
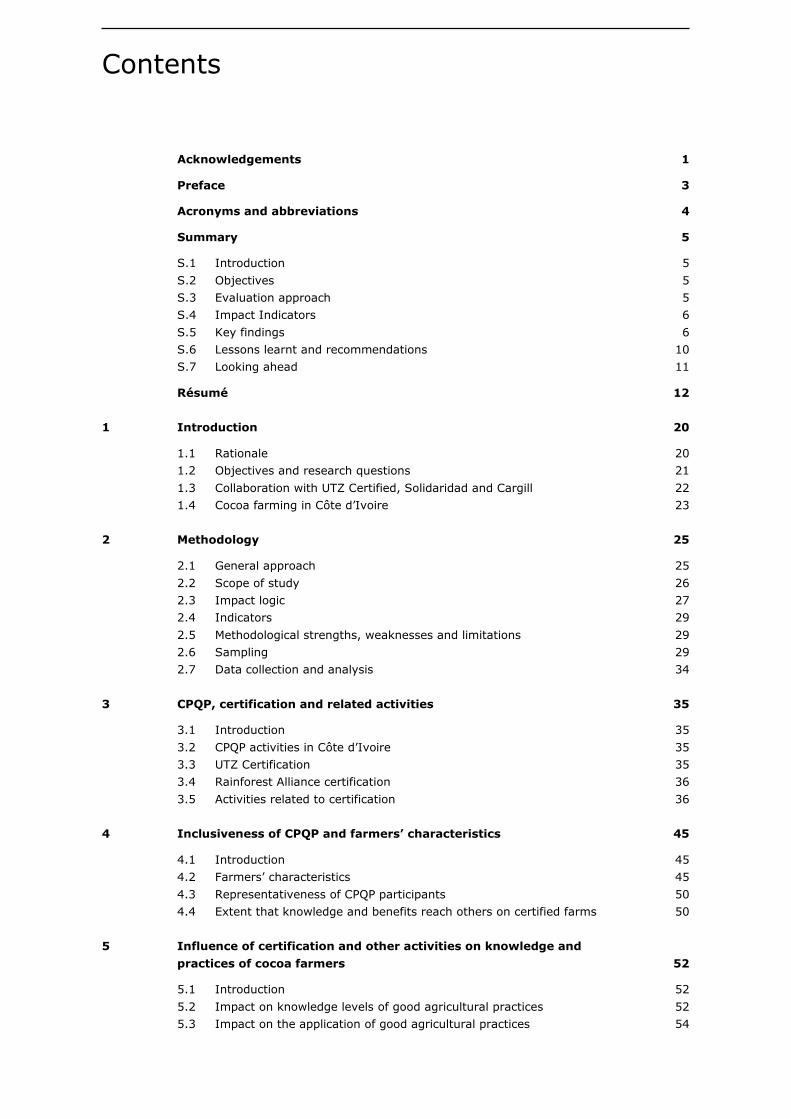
Contents
Acknowledgements 1
Preface 3
Acronyms and abbreviations 4
Summary 5
S.1 Introduction 5 S.2 Objectives 5 S.3 Evaluation approach 5 S.4 Impact Indicators 6 S.5 Key findings 6 S.6 Lessons learnt and recommendations 10 S.7 Looking ahead 11
Résumé 12
1 Introduction 20
1.1 Rationale 20 1.2 Objectives and research questions 21 1.3 Collaboration with UTZ Certified, Solidaridad and Cargill 22 1.4 Cocoa farming in Côte d’Ivoire 23
2 Methodology 25
2.1 General approach 25 2.2 Scope of study 26 2.3 Impact logic 27 2.4 Indicators 29 2.5 Methodological strengths, weaknesses and limitations 29 2.6 Sampling 29 2.7 Data collection and analysis 34
3 CPQP, certification and related activities 35
3.1 Introduction 35 3.2 CPQP activities in Côte d’Ivoire 35 3.3 UTZ Certification 35 3.4 Rainforest Alliance certification 36 3.5 Activities related to certification 36
4 Inclusiveness of CPQP and farmers’ characteristics 45
4.1 Introduction 45 4.2 Farmers’ characteristics 45 4.3 Representativeness of CPQP participants 50 4.4 Extent that knowledge and benefits reach others on certified farms 50
5 Influence of certification and other activities on knowledge and
practices of cocoa farmers 52
5.1 Introduction 52 5.2 Impact on knowledge levels of good agricultural practices 52 5.3 Impact on the application of good agricultural practices 54

5.4 Social impact 55 5.5 Economic impact 60 5.6 Influence of certification on members’ loyalty to their group and
willingness to reinvest in cocoa farming 63 5.7 Ecological impact 66
6 Added value of certification for cocoa farmers 68
6.1 Introduction 68 6.2 Added value of training and certification 69 6.3 Farmers’ and stakeholders’ perceptions of the process and impacts of
certification and training on their livelihoods 70 6.4 Unanticipated impacts of certification and training 71
7 Conclusions 72
7.1 Inclusiveness of the CPQP and characteristics of certified farmers 72 7.2 The influence of certification on knowledge and practices 72 7.3 The added value for farmers of certification 73 7.4 Was the impact logic correct? 75
8 Lessons learnt 80
8.1 Is the CPQP in Côte d’Ivoire inclusive? 80 8.2 How do certification and the related activities of partners influence
knowledge and the related behaviour/practices of cocoa farmers in
Côte d’Ivoire? 81 8.3 What is the added value for farmers of going through the certification
processes and being certified? 84 8.4 Recommendations to improve future assessments 86
References and websites 90
Annex 1 Work Plan 94
Annex 2 Indicators 102
Annex 3 Stakeholders interviewed 117
Annex 4 Statistical analyses 118
Annex 5 Key data correlations between length of UTZ programme
participation and outcome and impact indicators 119
Annex 6 Questionnaires 121
Annex 7 Databases 122
Annex 8 Detailed methodology 123
Annex 9 GPS measurement results 131
Annex 10 Overview of benchmarking data 133
Annex 11 Overview of inputs used by cocoa farmers 138
Annex 12 Figures and graphs 140
Annex 13 Regression analyses 164
Annex 14 Farm ownership and revenue sharing models in Côte d’Ivoire 170
Annex 15 Overview of certification and activities in the cocoa sector in Côte
d’Ivoire 171
Annex 16 Photos 174


LEI Report 2014-016 | 1
Acknowledgements
This study is the result of close collaboration with the Sustainable Trade Initiative (IDH) and their
partners UTZ Certified and Solidaridad. The baseline benchmarking and development of indicators was
supported by the ‘Enhanced sustainability of the imports of cocoa and coffee to the Netherlands:
synergy between practice, policy, strategy and knowledge’ (BO-10-030-001) project, financed by the
Dutch Top sector research initiative and the Policy Support Programme for International Cooperation
of the Dutch Ministry of Economic Affairs.
We are particularly grateful to all the cocoa farmers, producer groups, exporters and traders, ANADER
staff, schoolmasters and other interviewees for their time and cooperation during interviews and the
verification meetings.

2 | LEI Report 2014-016

LEI Report 2014-016 | 3
Preface
Côte d’Ivoire has been the world’s largest cocoa exporter since the 1980s. The cocoa sector faces
a number of challenges such as low productivity and smallholder farmer incomes, poor working
conditions, complex labour issues and environmental challenges such as deforestation and climate
change.
The Sustainable Trade Initiative (IDH) aims to accelerate and up-scale sustainable trade by building
impact-oriented coalitions of multinationals, civil society organisations, governments and other
stakeholders through co-funding and convening public and private interests, strengths and knowledge.
The IDH Cocoa Productivity and Quality Programme (CPQP) is a four-year programme that aims to
mainstream the results of the previous Cocoa Improvement Programme (CIP1). It seeks to assist
smallholder cocoa farmers to move out of poverty and make a transition to running viable businesses
for sustainable cocoa production. The programme promotes four tools to do this: good agricultural
practices (GAPs), standards systems (certification), farmer aggregation and financing mechanisms.
In 2013, IDH commissioned LEI Wageningen UR to set a baseline for this programme. LEI Wageningen
UR led the study in partnership with the Centre for Development Innovation (CDI Wageningen UR),
the French Centre de Coopération Internationale et Recherche Agronomique pour le Développement
(CIRAD), and Ivorian research organisation Agriculture et Cycle de Vie (A & CV).
This report presents the results of the independent baseline survey and assessment framework carried
out by the research team. It contains an evaluation of the effectiveness of the cocoa programme in
bringing about improvements for cocoa farmers and cooperatives participating in the programme.
The report also presents the lessons learnt and provides recommendations to improve the quality of
the programme.
We are greatly indebted to farmers and their cooperatives for the information they provided, also to
our partners at A & CV for collecting the data. We thank IDH and partners for their assistance and
collaboration, providing us with information and constructive feedback.
Ir. L.C. van Staalduinen
Director General LEI Wageningen UR

4 | LEI Report 2014-016
Acronyms and abbreviations
ACI African Cocoa Initiative
ANADER Agence National d’Appui au Développement Rural (National Agency for Rural
Development)
CAADP Agriculture Development Programme
CDC Cocoa Development Centres
CFAF Communauté Financière Africaine franc (African Financial Community franc)
CIP1 Cocoa Improvement Programme 1
CISCI Côte d’Ivoire Sustainable Cocoa Initiative
CNPS Caisse Nationale de Prévoyance Sociale (National Social Security Fund)
CNRA Centre National de Recherche Agronomique (National Agronomic Research Centre)
CPQP Cocoa Productivity and Quality Programme
CVC Cocoa Village Clinics
EFA Projet Ecoles Familiales Agricoles (Family Farm Schools Project)
FLO Fairtrade International
FFS Farmer field schools / Champs écoles ou Champs écoles paysans
FS Field apprenticeship / Champ d’apprentissage
GAP Good agricultural practice
GlobalGAP Private sector voluntary standards setting body for certification of production
processes for agricultural products
ICCO International Cocoa Organisation
ICS Internal Control System
IDH Sustainable Trade Initiative
IITA International Institute of Tropical Agriculture
ILO International Labour Organisation
LEI Agricultural Economics Institute of Wageningen UR
LF Lead farmers / planteur relais (PR)
PEFAC Plateforme des Ecoles Familiales Agricoles de Côte d'Ivoire (Plaform of Family Farm
Schools in Côte d’Ivoire)
PPE Personal protective equipment
PRODEMIR Economic and Rural Development Programme / Programme de Développement
Economique en Milieu Rural
RA Rainforest Alliance
SAN Sustainable Agriculture Network
STCP Sustainable Tree Crops Programme
ToC Theory of Change
ToR Terms of Reference
UNDP United Nations Development Fund
USAID United States Agency for International Development
WAFF West Africa Fair Fruit
WCF World Cocoa Foundation
WWF Worldwide Fund for Nature
LEI Report 2014-016 | 5
Summary
S.1 Introduction
The Sustainable Trade Initiative (IDH) aims to accelerate and up-scale sustainable trade by building
impact-oriented coalitions of multinationals, civil society organisations, governments and other
stakeholders through co-funding and convening public and private interests, strengths and knowledge.
IDH’s four-year Cocoa Productivity and Quality Programme (CPQP) builds on the Cocoa Improvement
Programme (CIP1), which ended on 31 December 2012. The CIP helped UTZ Certified to develop its
Code of Conduct for cocoa and to stimulate the market for certified cocoa. The aim of the CPQP is to
assist large numbers of smallholder cocoa farmers to move out of poverty and make the transition to
running viable businesses for sustainable cocoa production by promoting a variety of tactics and tools
to create change in cocoa production, focusing on: productivity improvement based on good
agricultural practices (GAPs), standards systems (certification), farmer aggregation, and increasing
access to services, inputs and finance. The CPQP aims to support the training of over 50,000 farmers
and certify over 30,000, to produce over 64,000 tonnes of certified cocoa and make UTZ Certified
cocoa widely available in the international market. The CPQP brings together more partners than the
CIP1 to cover over 40% of the worldwide cocoa processing industry and 30% of worldwide chocolate
manufacturing businesses. It seeks to involve local governments and other stakeholders. Alongside
UTZ Certified and Solidaridad, participants include Ahold, ADM, Armajaro, Barry-Callebaut, BT Cocoa,
Cargill, Continaf, Ecom, Ferrero, Friesland Campina, Mars, Heinz, ICCO, Nestlé, Swiss Contact, Oxfam
Novib, Petra Foods (Delfi), UNDP, WCF and WWF.
S.2 Objectives
This report provides a baseline of the farm-level situation in mid-2013 and can be used to measure
changes in future impact assessments. It provides information about the inclusiveness of the CPQP
in Côte d’Ivoire. It presents an evaluation of how certification and related activities by the CPQP and
partners have affected cocoa farmers’ knowledge and implementation of good agricultural
practices, social and environmental issues and related behaviour/practices in Côte d’Ivoire and the
results of these in terms of people, planet and profit, as well as an assessment of the added value of
certification. Lessons learned are drawn from the results, feeding recommendations to improve
the quality and effectiveness of the programme.
S.3 Evaluation approach
Independent, evidence-based assessment
IDH commissioned the Agricultural Economics Institute (LEI) of Wageningen University and Research
centres to provide this independent baseline study and assessment. The study was led by LEI
Wageningen UR in partnership with the Centre for Development Innovation (CDI Wageningen UR),
the French Centre de Coopération Internationale et Recherche Agronomique pour le Développement
(CIRAD), and the Ivorian research organisation Agriculture et Cycles de Vie (A & CV).
Rigorous quantitative data collection with qualitative interviews
In 2013, quantitative and qualitative interviews were conducted with 944 farmers in 97 producer
groups. A representative sample of 730 farmers in the CPQP was selected. These farmers are
members of 89 cooperatives that are connected to seven different traders participating in the CPQP for
different periods of time and are situated across the three main agro-ecological zones across the
country. A control group of 214 farmers who had not participated in the programme was selected.
These farmers are members of nine cooperatives, situated in the same three agro-ecological zones at
6 | LEI Report 2014-016
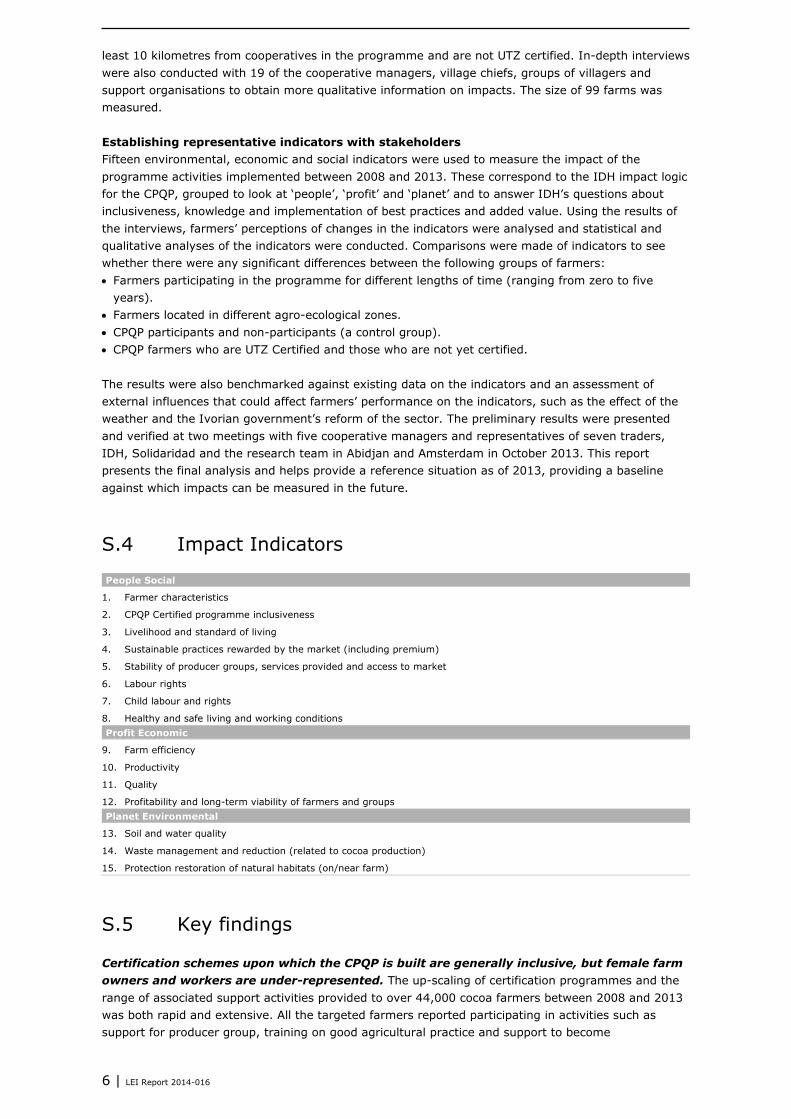
least 10 kilometres from cooperatives in the programme and are not UTZ certified. In-depth interviews
were also conducted with 19 of the cooperative managers, village chiefs, groups of villagers and
support organisations to obtain more qualitative information on impacts. The size of 99 farms was
measured.
Establishing representative indicators with stakeholders
Fifteen environmental, economic and social indicators were used to measure the impact of the
programme activities implemented between 2008 and 2013. These correspond to the IDH impact logic
for the CPQP, grouped to look at ‘people’, ‘profit’ and ‘planet’ and to answer IDH’s questions about
inclusiveness, knowledge and implementation of best practices and added value. Using the results of
the interviews, farmers’ perceptions of changes in the indicators were analysed and statistical and
qualitative analyses of the indicators were conducted. Comparisons were made of indicators to see
whether there were any significant differences between the following groups of farmers:
Farmers participating in the programme for different lengths of time (ranging from zero to five
years).
Farmers located in different agro-ecological zones.
CPQP participants and non-participants (a control group).
CPQP farmers who are UTZ Certified and those who are not yet certified.
The results were also benchmarked against existing data on the indicators and an assessment of
external influences that could affect farmers’ performance on the indicators, such as the effect of the
weather and the Ivorian government’s reform of the sector. The preliminary results were presented
and verified at two meetings with five cooperative managers and representatives of seven traders,
IDH, Solidaridad and the research team in Abidjan and Amsterdam in October 2013. This report
presents the final analysis and helps provide a reference situation as of 2013, providing a baseline
against which impacts can be measured in the future.
S.4 Impact Indicators
People Social
1. Farmer characteristics
2. CPQP Certified programme inclusiveness
3. Livelihood and standard of living
4. Sustainable practices rewarded by the market (including premium)
5. Stability of producer groups, services provided and access to market
6. Labour rights
7. Child labour and rights
8. Healthy and safe living and working conditions
Profit Economic
9. Farm efficiency
10. Productivity
11. Quality
12. Profitability and long-term viability of farmers and groups
Planet Environmental
13. Soil and water quality
14. Waste management and reduction (related to cocoa production)
15. Protection restoration of natural habitats (on/near farm)
S.5 Key findings
Certification schemes upon which the CPQP is built are generally inclusive, but female farm
owners and workers are under-represented. The up-scaling of certification programmes and the
range of associated support activities provided to over 44,000 cocoa farmers between 2008 and 2013
was both rapid and extensive. All the targeted farmers reported participating in activities such as
support for producer group, training on good agricultural practice and support to become

LEI Report 2014-016 | 7
UTZ Certified. Compared to the control group, more farmers (between 6 to 20%) benefited from
access to services to improve crops, such as crop protection products, fertilisers, seedlings and credit.
Between 8 and 13% of farmers participating in the CPQP benefited from inclusion in community and
social programmes. This is a similar proportion to the control group. Certification is implemented
through registered members of a producer group. The focus of the CPQP on cooperatives means that
unorganised farmers are only able to structurally benefit from activities when they join a group. Whilst
a producer group focussed strategy has been effective in reaching large numbers of farmers and
aiding access to traders to both sell their produce and receive support services in the last five years,
comments made by farmers and producer groups indicate that further support to strengthen and
professionalise producer groups is essential to ensure that this strategy succeeds. As the vast majority
(97%) of participants are male farm owners and share croppers, women and youths have been less
structurally included in activities. This is important as women are a target group of the CPQP. Both
women and youths, either as family members or paid labourers, also perform a large amount of work
on cocoa farms. Youths represent the future generation, given the advanced age of most farmers.
As many farmers train their wives, children and workers, knowledge relevant to good agricultural
practices and certification standards is passed on. However, the extent to which such knowledge is
actually implemented on-farm is not known.
Certification seems to contribute to influence farmers’ knowledge and implementation of
good agricultural practices. Knowledge levels and implementation were predicted in the impact
logic to improve with certification and training. This baseline shows the level of knowledge and
practices of participating and control farmers regarding good agricultural practices and the
environmental standards and working conditions required as part of the UTZ Code of Conduct.
Farmers in the CPQP have higher knowledge and implementation scores than control group farmers.
Certified farmers have higher levels of knowledge and implementation than uncertified farmers. Higher
levels of knowledge and implementation were associated with other variables, such as the agro-
ecological zone, farm size and type of ownership, and group membership. Multiple certification was
also found to positively affect knowledge levels. Farmers with multiple certifications (UTZ and
Rainforest Alliance) have higher knowledge levels than non-certified farmers. This is attributed to the
similar types of knowledge acquired through the different certification schemes.
Farmers with higher knowledge levels implement GAPs in a better way than farmers with lower
knowledge levels. However, both CPQP participants’ and certified farmers’ knowledge and
implementation levels are relatively low, with on average 25% of farmers responding correctly to the
questions concerning their knowledge and implementation of the standards contained in the UTZ Code
of Conduct. This was an anticipated impact of training and certification and follows the CPQP impact
logic that certified farmers comply with the standards set in certification schemes for health and
safety, workers’ rights and working conditions. However, whether increased levels of knowledge and
skills can be attributed to training and certification programmes, or to other factors, such as prior
knowledge before joining the CPQP, will only be apparent in subsequent assessments.
Particular areas of low knowledge and practices are children’s and labour rights, personal protective
equipment, waste management and composting, weeding, record keeping, shade trees, soil
conservation and field buffer zones, fertiliser and crop protection use, pruning and disease
management. Farmers and stakeholders suggested that improvements could be made to increase
the frequency, quality and quantity of training, particularly in-field and focused on the GAPs that
farmers find more difficult to implement, and the competences of trainers. As certification and training
have been up-scaled, farmers noted that their quality and intensity have changed, in some instances
decreasing. Farmers requested that trainers adapt to farmers’ learning styles, expressing a preference
for extension and field-based learning, rather than classrooms.

8 | LEI Report 2014-016
Given that this is a baseline and most of the CPQP started in the field only in mid-2012,
impacts are not yet visible or attributable. These can only be cautiously interpreted from
previously initiated certification and related activities, which appear to contribute to
improve farmers’ social and economic situations. There appear some limited, positive
impacts on the environment. Attributing these impacts to the CPQP will be possible only once this
baseline situation has been compared to their position in the future. Farmers are generally satisfied
with their livelihoods, their producer groups and the services they provide, as well as the traders they
sell to. They indicated positive developments in a safer working conditions. However, compliance with
and respect of some labour and children’s rights are low. Certification and related activities are
positively correlated with impacts on productivity, efficiency and incomes. Farmers in the CPQP have
statistically significantly higher productivity than non-certified farmers in the control group, as do
certified farmers compared to non-certified farmers. These figures are comparable to benchmark
figures for Côte d’Ivoire, but remain lower than productivity in other countries. However, the accuracy
of reported productivity per hectare is questionable, given farmers’ tendency to over-estimate farm
size. Around 60% of farmers attributed productivity improvements to a certification programme,
especially GAPs. Farmers in the CPQP have higher total production costs, but significantly lower
production costs per kilogram than uncertified farmers. However, although CPQP farmers have lower
costs per kilogram, they do not have higher efficiency ratios. This may be due to a time delay, as
changes in farming take time and this study is the first measurement.
Farmers generally feel ‘stuck’ in cocoa farming, cannot easily change or enhance their means of
cocoa-based income and have no or few other opportunities to generate cash. As a result, cocoa is
generally not seen as a viable option for the future. Most farmers would not encourage their children
to be cocoa farmers. Certification and related activities aim to reverse this trend by focussing attention
on and revitalising the sector.
Practices that improve the environment, particularly soil and water quality and conservation appear to
have had limited impact to date This may be due to the timescale involved before environmental
impacts are apparent, as well as the methods used to determine changes in indicators concerning soil
and water quality, waste management and natural habitats on and near farms.
By organising farmers into producer groups and assisting in their professionalisation, certification and
training have been up-scaled considerably, providing a basis for broad support programmes of the
four traders participating in the CPQP. Farmers’ participation has also enabled up-scaling, albeit on
a smaller scale, of access to inputs to crop protection and fertilisers, and pre-finance and credit, for
between 6 to 20% of farmers. Producer groups provide both social capital and a forum for learning
and exchange, and are positively associated with obtaining access to credit, farm inputs, other
services and buyers. Not all farmers enjoy these benefits, however, and most still do not have
sufficient access to credit, inputs or to seedlings to rejuvenate their cocoa farms.
Partnerships between IDH, traders, certification schemes, non-profit organisations, the Ivorian
government extension service and cooperatives appear to be important channels that add value to
certification for farmers and enhance its effect by providing a range of services needed by farmers.
Partnerships may contribute to improving the effectiveness and efficiency of certification, as
duplications of effort are avoided. However, a perceived negative impact of multiple certification
schemes is that they create more effort and costs for farmers, producer groups and traders. This is an
example of where collaboration and partnerships could help minimise or mitigate such impacts. Recent
studies (KPMG 2012, GBCG 2012) appear to confirm the perceptions of farmers and producer groups
that they bear substantial costs related to certification. An analysis of the full financial and economic
costs and benefits for farmers in different stages of certification and a control group is recommended,
taking into account that most farmers do not keep records of their costs and benefits. The many
different activities implemented by traders in the framework of or associated with certification,
highlight that certification enables farmers to be reached by traders and the organisations running
projects and programmes.
The certification premium – the market reward for sustainable, responsible production - is one of
the most important motivations for farmers to become certified. The premium embodies the market

LEI Report 2014-016 | 9
reward for sustainable, responsible production. It is an incentive for farmers, particularly in the earlier
stages of participation when the expected productivity and quality increases have not yet become
apparent. However, the premium represents a small proportion of the total price gained by farmers
(7% of the total kilogram selling price). The premium receives a lot of attention, as most producer
groups pay out premiums separately from main payments for cacao beans. The premium is also used
to create loyalty and recognition between farmers, their producer groups and traders. Farmers and
farmer groups expressed concerns that, if payments of the premium were discontinued, one of the
main added values of maintaining the certified status for them would disappear. The indicators about
productivity, income and efficiency suggest that a refocus on increasing the overall price and profit
earned by farmers on certified beans, rather than the excessive focus on the premium, would be of
more benefit to farmers in the long term.
Certification has supported and massively promoted collective action. Farmers note numerous benefits
of their producer groups, such as marketing their beans at a good price, access to information and
training, providing a forum for exchange and building social capital. Services to producer groups
provided by the CPQP (and by other traders and projects) have resulted in improved farmer access to
seedlings, crop protection products and credit. Activities associated with certification, often provided
by traders, have also contributed to the professionalisation of producer groups, by providing
management training, models for internal control systems, financial support, equipment and transport.
However, many farmers indicated that better access to sufficient credit and inputs, as well as other
farm and non-farm related services, are still required to improve farming and their families’
livelihoods, and that support to help manage and diversify revenue sources is required. However, the
current scale, frequency and timing of the provision of these services requires up-scaling to benefit the
majority of farmers in the CPQP.
Certification has also had some unintended outcomes. It has added to farmers’ difficulties in managing
large, seasonal cash flows. The auditing process is perceived as open to corruption. The premium
setting process is seen as not transparent and does not appear to be linked to actual costs at farmer,
producer group or trader level. Multiple certification is complex and has been difficult for some traders
and producer groups to manage. The rapid up-scaling and out-scaling of certification related activities
(especially training) has resulted in perceptions of a variable quality, lack of minimum standards, with
possible influences on farmers’ knowledge and practices.
There appears to be an added value of the process of certification combined with support
activities. Farmers indicated that implementing the good agricultural practices taught as part the
certification programme, lead to higher productivity and therefore higher income. The initial baseline
and impact assessment lend some support to this. The added value of the certification programme
combined with training and other assistance, is that farmers obtain certification premiums and that
producer groups and traders provide services that farmers indicated are needed and that they are
satisfied with. Certification influences trading practices to produce a range of positive outcomes.
Certified farmers, as members of a producer group, have access to traders and generally sell only to
those traders who have provided them support. For farmers, this adds value by responding to the
major needs. For traders, this loyalty provides a secure source of certified, good quality bean supplies.
These relationships help secure market access for farmers and their groups and increase access to
support services that improve production. These enhanced relationships also allow access to other
social and community activities, which were prioritised lower but still remain as priorities for farmers.
Farmers indicated that particularly healthcare, schools and infrastructure continue to be issues of
concern affecting livelihoods in their communities.
The CPQP impact logic seems to be correct that certification and associated activities and
inputs contribute to economic outcomes. It assumes that higher knowledge is related to improved
implementation of good agricultural practices, higher productivity, higher net income and higher
satisfaction levels with regard to farmer livelihoods. Both higher knowledge levels and improved
implementation of record keeping are positively correlated with increases in measured increases in
productivity, net income and livelihoods. No relationship was found between the implementation of
GAPs overall or the implementation of post-harvest practices and bean quality, indicated by the rate of
rejection. This may be affected by external factors, such as the institutional reform of the cocoa sector

10 | LEI Report 2014-016
in Côte d’Ivoire in 2012. Overall, higher knowledge levels are positively related to improved
implementation of GAPs, confirming the impact logic. However, for specific agricultural practices
(waste management and soil, water and biodiversity protection), this was not the case. To ensure that
these outcomes are met, particularly with the later entrants and possible new entrants into the
programme who have slightly different characteristics, adjustments in how the programme is
implemented are recommended.
The social outcomes are only partially met, as certified farmers report better and safer working
conditions. However, the outcomes of including female owners in the programme and certified child
labour free cocoa farming require further actions to make an impact. The ecological outcomes also
appear to be only partially met: whilst chemical use complies with national recommendations,
indicators of farm rehabilitation and regeneration – such as access to improved seedlings and
acquiring grafting skills – are low. The CPQP logic also assumes that inputs will result in higher
productivity. As a smaller number of farmers have been involved in interventions to access to fertiliser
(7%), credit (24%), seedlings (11%) and pesticides (36%), testing that higher productivity has
resulted from these interventions will be only possible in a future impact evaluation.
S.6 Lessons learnt and recommendations
Cocoa is clearly critical to the livelihoods of the farmers involved in the CPQP, as it is the only or
the main source of cash income for most of them. Improving the economics, social aspects and
environment of these cocoa farmers, however, extends beyond the cocoa fields (as farmers grow
other cash and subsistence crops) and beyond certification (which has a specific focus). To have
sustainable, diversified livelihoods a holistic view of the interaction with other subsistence and cash
crops that complement cocoa is needed. More than a single commodity focus of the CPQP may be
needed to improve livelihoods. This may mean testing new diversified business models that will
persuade cocoa farmers and their children to continue to grow and process certified cocoa. This may
require a shift in mind-sets to think more broadly about the role of certified cocoa as one (albeit
important) element in the livelihoods of farmers, their families and their workers (male and female,
young and old). This implies continued partnerships and dialogues, as many of these issues go beyond
the current boundaries of traders’ and partners’ activities and spheres of influence. Effort needs to be
made to ensure that the benefits and costs of certification are clear and transparent to all
stakeholders, and that efficiency in (multiple) certification processes is ensured. As certification cannot
or does not satisfactorily respond to all farmers’ needs, combinations of activities, such as those used
in the CPQP, appear to be important to convince farmers and producer groups that verifiably
sustainable cocoa is a viable farming and livelihood option in the long term for both them and their
children.
Suggestions for the future direction of the CPQP in Côte d’Ivoire are:
Include workers and particularly women and youths as target groups in activities.
Further address ways to increase farmer productivity and efficiency and reconsider how to enhance
market rewards for sustainable production to focus on profitability at farmer and producer group
level.
Address areas of low farmer knowledge and implementation of specific good agricultural practices;
and particularly evaluate the efficacy of training techniques used over time with different farmers.
Maintain a continued focus on ensuring that the worst forms of child labour are eliminated and that
children’s rights and labour rights are respected. Supporting initiatives that support children's
schooling (such as ensuring access to schools in cocoa communities) will remain essential in
eliminating child labour.
Soliciting, listening to and taking into account farmers’ and stakeholders’ perceptions of their needs
(such as pesticide and fertiliser inputs, seedlings, improved plant material, credit, insurance,
business training) and the feasibility of integrating their suggestions into the CPQP and/or partners
support programmes are also recommended.

LEI Report 2014-016 | 11
S.7 Looking ahead
While this preliminary evidence suggests that the CPQP has contributed to improving the livelihoods,
communities and environments of cocoa farmers in Côte d’Ivoire, it also raises questions. Follow-up
and monitoring will allow these results to be discussed with stakeholders, new data to be collected on
selected topics and a deeper understanding of the impacts of sustainable cocoa production to be
gained.
Recommendations for actions concern improving the methods and changing the indicators used to
evaluate impacts and outcomes. Data collection could be made more efficient and less burdensome on
farmers through a more collaborative research design and by making more use of traders, certification
agencies, producer groups and other stakeholders’ environmental data. Future monitoring and impact
assessments should reconsider the methods used and pay attention to the representativeness of the
sample.

12 | LEI Report 2014-016
Résumé
Introduction
L'Initiative pour le commerce durable (IDH) souhaite accélérer et étendre le commerce durable grâce
à la création de coalitions axées sur l'impact regroupant des multinationales, des organisations de la
société civile, des gouvernements et autres parties prenantes, par le biais de cofinancements et en
réunissant les intérêts publics et privés ainsi que les atouts et les connaissances de chacun. D'une
durée de quatre ans, le programme « Cocoa Productivity and Quality Programme » (CPQP) d'IDH
s'appuie sur le programme « Cocoa Improvement Programme » (CIP1), qui a pris fin le 31 décembre
2012. Le programme CIP a aidé UTZ Certified à développer son Code de conduite dans le secteur du
cacao et à stimuler le marché du cacao certifié. L'objectif visé à travers le programme CPQP est
d'aider un grand nombre de petits producteurs de cacao à sortir de la pauvreté et de faire la transition
vers la conduite d'entreprises viables assurant la production de cacao durable, en favorisant plusieurs
tactiques et outils permettant de créer un changement dans la production du cacao, l'accent étant mis
ici sur les aspects suivants : amélioration de la productivité sur la base de bonnes pratiques agricoles
(BPA), systèmes de normes (certification), regroupement de producteurs et amélioration de l'accès
aux services, intrants et fonds. Le CPQP vise à soutenir la formation de plus de 50 000 agriculteurs et
à certifier plus de 30 000 agriculteurs, pour produire plus de 64 000 tonnes de cacao certifié et veiller
à ce que le cacao d'UTZ Certified soit largement disponible sur le marché international. Le CPQP
rassemble davantage de partenaires que le CIP1 afin de couvrir plus de 40 % de l'industrie mondiale
de transformation du cacao et 30 % des entreprises de fabrication du chocolat dans le monde. Ce
programme cherche à impliquer les gouvernements locaux et autres parties prenantes. Outre UTZ
Certified et Solidaridad, les autres participants incluent Ahold, ADM, Armajaro, Barry-Callebaut , BT
Cacao, Cargill, Continaf, Ecom, Ferrero, Friesland Campina, Mars, Heinz, ICCO, Nestlé, Swiss Contact
Oxfam Novib, Petra Foods (Delfi), PNUD, WCF et WWF.
Objectifs
Ce rapport offre un aperçu de la situation des exploitations agricoles telle qu'elle se présentait fin
juin 2013 et pourra servir de base pour mesurer l'évolution lors de futures évaluations des impacts.
Il fournit des informations sur la capacité d'intégration du programme CPQP en Côte d'Ivoire.
Il évalue l'impact que la certification et les activités associées du CPQP et des partenaires ont eu sur
les connaissances et la mise en œuvre par les agriculteurs de bonnes pratiques agricoles, sur les
questions sociales et environnementales et les pratiques/comportements associés en Côte d'Ivoire et
sur les résultats au niveau des 3 P (personnes, planète, profit). Ce rapport évalue également la valeur
ajoutée de la certification. Les enseignements tirés des résultats ont permis d'émettre des
recommandations pour améliorer la qualité et l'efficacité du programme.
Approche de l'évaluation
Évaluation indépendante, fondée sur les faits
IDH a demandé à l'Agricultural Economics Institute (LEI) de l'Université et Centre de recherche de
Wageningen (Wageningen UR) de lui fournir cette étude qui associe une étude de référence et une
évaluation indépendante. L'étude a été conduite par LEI Wageningen UR en partenariat avec le Centre
for Development Innovation (CDI Wageningen UR), le Centre de Coopération Internationale et
Recherche Agronomique pour le Développement (CIRAD – France) et l'organisme de recherche ivoirien
Agriculture et Cycles de Vie (A & CV).
LEI Report 2014-016 | 13
Collecte rigoureuse de données quantitatives et entretiens qualitatifs
En 2013, des entretiens quantitatifs et qualitatifs ont eu lieu avec 944 agriculteurs appartenant à 97
groupements de producteurs. Un échantillon représentatif de 730 agriculteurs du CPQP a été
sélectionné. Ces agriculteurs sont membres de 89 coopératives qui sont associées à sept négociants
différents, ayant participé au programme CPQP sur des durées différentes et situées dans les trois
principales zones agro-écologiques du pays. Un groupe témoin de 214 agriculteurs n'ayant pas
participé au programme a été sélectionné. Ces derniers sont membres de neuf coopératives situées
dans les mêmes zones agro-écologiques, à au moins 10 km des coopératives du programme, et ne
sont pas certifiés UTZ. Des entretiens approfondis ont également eu lieu avec 19 des gérants de
coopérative, chefs de village, groupements de villageois et organisations d'accompagnement afin
d'obtenir davantage d'informations qualitatives sur les impacts. La taille de 99 exploitations agricoles
a été mesurée.
Élaboration d'indicateurs représentatifs avec les parties prenantes
Quinze indicateurs environnementaux, économiques et sociaux ont été utilisés pour mesurer l'impact
des activités du programme mises en œuvre entre 2008 et 2013. Ces indicateurs correspondent à la
logique d'impact d'IDH pour le programme CPQP, regroupés pour examiner les 3 P (personnes, profit,
planète) et répondre aux questions d'IDH sur la capacité d'intégration, les connaissances et la mise en
œuvre des bonnes pratiques et de la valeur ajoutée. La perception qu'ont les agriculteurs des
changements intervenus au niveau des indicateurs a été analysée sur la base des résultats des
entretiens. Des analyses statistiques et qualitatives des indicateurs ont ensuite été réalisées. Des
comparaisons ont été faites entre les indicateurs pour détecter d'éventuelles différences significatives
entre les groupes d'agriculteurs suivants:
Agriculteurs ayant participé au programme sur différentes durées (allant de zéro à cinq ans).
Agriculteurs situés dans différentes zones agro-écologiques.
Agriculteurs participant au programme CPQP et agriculteurs n'y participant pas (groupe témoin).
Agriculteurs certifiés et non certifiés parmi ceux qui participent au programme CPQP.
Les résultats ont également été comparés aux données qui existent sur les indicateurs ainsi qu'à une
évaluation des influences extérieures susceptibles d'avoir un impact sur les performances des
agriculteurs, notamment les conditions météorologiques et la réforme sectorielle menée par le
gouvernement ivoirien. Les résultats préliminaires ont été présentés et vérifiés à l'occasion de deux
réunions organisées à Abidjan et à Amsterdam en octobre 2013, en présence de cinq dirigeants de
coopératives, de représentants de sept négociants, d'IDH, de Solidaridad et de l'équipe chargée de
l'étude. Ce rapport présente l'analyse définitive qui pourra servir de référence (2013) pour mesurer et
comparer les futurs impacts du programme.

14 | LEI Report 2014-016
Tableau1
Indicateurs d'impact.
Personnes - Domaine social
1. Caractéristiques des agriculteurs
2. Capacité d'intégration du programme certifié CPQP
3. Moyens de subsistance et niveau de vie
4. Pratiques durables rémunérées par le marché (prime comprise)
5. Stabilité des groupements de producteurs, des services fournis et de l'accès au marché
6. Droit du travail
7. Travail des enfants et droits associés
8. Conditions de vie et de travail sûres et saines
Profit - Domaine économique
9. Efficacité des exploitations agricoles
10. Productivité
11. Qualité
12. Rentabilité et viabilité à long terme des agriculteurs et groupements
Planète - Domaine environnemental
13. Qualité des sols et de l'eau
14. Gestion et réduction des déchets (liés à la production de cacao)
15. Protection et restauration des habitats naturels (sur l'exploitation ou à proximité)
Résultats clés
Les programmes de certification qui étayent le CPQP incluent de manière générale toutes
les catégories de personnes susceptibles d'être intéressées, mais les propriétaires
d'exploitations agricoles et travailleurs de sexe féminin sont néanmoins sous-représentés.
L'expansion des programmes de certification et des activités de soutien associées proposées à plus de
44 000 producteurs de cacao entre 2008 et 2013 a été rapide et extensive. Tous les agriculteurs ciblés
ont déclaré participer à des activités, notamment des activités d'accompagnement pour les
groupements de producteurs, des formations sur les bonnes pratiques agricoles et des activités de
soutien visant à l'obtention de la certification UTZ. Comparativement au groupe témoin, un plus grand
nombre d'agriculteurs (entre 6 et 20 %) ont eu accès à des services pour améliorer leurs cultures, tels
que des produits phytosanitaires, des engrais, des jeunes plants ainsi que des crédits. De 8 à 13% des
agriculteurs participant au programme CPQP ont été inclus dans des programmes communautaires et
sociaux. Cette proportion est semblable à celle du groupe témoin. La certification est mise en œuvre
par l'intermédiaire des membres inscrits dans un groupement de producteurs. L'accent mis par le
programme CPQP sur les coopératives signifie que les agriculteurs qui ne font partie d'aucune
organisation ne sont en mesure de profiter des activités de manière structurelle que lorsqu'ils se
joignent à un groupe. Bien qu'une stratégie axée sur les groupements de producteurs ait permis de
toucher un grand nombre d'agriculteurs et de faciliter l'accès aux négociants, non seulement lors de la
vente de leurs produits mais aussi lors de l'obtention de services d'assistance au cours de ces cinq
dernières années, les commentaires faits par les agriculteurs et les groupements de producteurs
indiquent qu'une assistance supplémentaire visant à renforcer et à professionnaliser les groupements
de producteurs est essentielle pour garantir la réussite de cette stratégie. La majorité (97 %) des
participants étant des propriétaires d'exploitations agricoles et des métayers de sexe masculin, les
femmes et les jeunes ont, de manière structurelle, moins souvent participé aux activités. Cette
donnée est importante, les femmes étant l'un des groupes cibles du programme CPQP. Les femmes et
les jeunes, que ce soit en tant que membres de leur famille ou en tant qu'ouvriers agricoles
rémunérés, ont eux aussi effectué énormément de travail dans les exploitations de cacao. Les jeunes
représentent la génération future, étant donné l'âge avancé de la plupart des agriculteurs. Dans la
mesure où un grand nombre d'agriculteurs forment eux-mêmes leurs épouses, leurs enfants et leurs
travailleurs, ils leurs transmettent ainsi des connaissances pertinentes en matière de bonnes pratiques
agricoles et de normes de certification. Toutefois, nous ne savons pas dans quelle mesure ces
connaissances sont réellement mises en œuvre dans les exploitations.

LEI Report 2014-016 | 15
La certification semble contribuer à influencer les connaissances des agriculteurs et la mise
en œuvre par ces derniers de bonnes pratiques agricoles. Selon les prédictions faites dans
la logique d'impact, les niveaux de connaissance et la mise en œuvre devraient s'améliorer grâce aux
certifications et formations. Cette situation de référence montre le niveau de connaissances et de
pratiques des agriculteurs participant au programme et du groupe témoin d'agriculteurs en ce qui
concerne les bonnes pratiques agricoles et les normes environnementales et conditions de travail
requises dans le cadre du Code de conduite d'UTZ. Les agriculteurs participant au CPQP ont obtenu de
meilleurs résultats en termes de connaissances et de mise en œuvre que le groupe témoin. Les
niveaux de connaissance et de mise en œuvre des agriculteurs certifiés sont plus élevés
comparativement aux agriculteurs non certifiés. Ces meilleurs niveaux de connaissance et de mise en
œuvre ont été associés à d'autres variables, notamment la zone agro-écologique, la taille de
l'exploitation agricole, le type de propriété et l'adhésion à un groupement. La certification multiple
s'est également avérée avoir un effet positif sur les niveaux de connaissance. Les agriculteurs qui
possèdent plusieurs certifications (UTZ et Rainforest Alliance) affichent des niveaux de connaissance
supérieurs aux agriculteurs non certifiés. Cette situation est attribuable à la similarité des
connaissances acquises au cours des différents programmes de certification. Les agriculteurs avec
des niveaux de connaissance élevés appliquent davantage les BPA que les agriculteurs dont le niveau
de connaissance est plus faible. Toutefois, le niveau de connaissance et de mise en œuvre tant des
participants au programme CPQP que des agriculteurs certifiée est relativement faible. En moyenne,
25 % des agriculteurs ont en effet répondu correctement aux questions posées concernant leurs
connaissances et la mise en œuvre des normes contenues dans le Code de conduite d'UTZ. Impact
attendu des programmes de formation et de certification, cette situation découle de la logique
d'impact du CPQP stipulant que les agriculteurs certifiés respectent les normes définies dans les
programmes de certification en matière d'hygiène et de sécurité, de droits des travailleurs et de
conditions de travail. Cependant, il faudra attendre les évaluations suivantes pour savoir si ces
niveaux de connaissance et de compétences plus élevés sont attribuables aux formations et aux
programmes de certification ou à d'autres facteurs, tels que des connaissances préalables à une
participation au CPQP. Les connaissances et pratiques sont notamment faibles dans les domaines
suivants : droits des enfants, droit du travail, équipements de protection individuelle, gestion et
compostage des déchets, désherbage, tenue des registres, arbres d'ombrage, préservation des sols,
zones tampons, utilisation des engrais et des produits phytosanitaires, taille et gestion des maladies.
Les agriculteurs et les parties prenantes suggèrent l'apport d'améliorations au niveau de la fréquence,
de la qualité et de la quantité des formations, en particulier sur le terrain et eu égard aux BPA que les
agriculteurs ont plus de mal à appliquer, ainsi qu'au niveau des compétences des formateurs. Suite à
l'expansion des certifications et formations, les agriculteurs ont signalé un changement au niveau de la
qualité et de l'intensité de ces certifications et formations, dans certains cas même une baisse. Les
agriculteurs ont demandé à ce que les formateurs s'adaptent aux styles d'apprentissage des
agriculteurs, ces derniers semblant préférer les activités de vulgarisation et la formation sur le terrain
plutôt que les formations en salle.
Étant donné qu'il s'agit ici d'une situation de référence et que, dans la majorité des cas, le
programme CPQP n'a pas été commencé sur le terrain avant la mi-2012, les impacts ne sont
pas encore visibles ni attribuables. Ces derniers doivent donc être interprétés avec la plus
grande prudence et sur la base des certifications et activités associées qui ont été initiées
antérieurement et semblent contribuer à améliorer la situation sociale et économique des
agriculteurs. Il semblerait qu'y ait lieu de parler de certains impacts positifs limités sur
l'environnement. Mais ces impacts positifs ne pourront être attribués au programme CPQP qu'une
fois que cette situation de référence aura été comparée à la position occupée par les agriculteurs dans
le futur. Les agriculteurs sont généralement satisfaits de leurs moyens de subsistance, de leurs
groupements de producteurs et des services qu'ils fournissent, ainsi que des négociants auxquels ils
vendent. Ils ont signalé des développements positifs et des conditions de travail plus sûres. Toutefois,
le respect de certains droits du travail et droits des enfants reste faible. La certification et les activités
associées sont mises en corrélation avec les impacts positifs observés en termes de productivité,
d'efficacité et de revenus. Les agriculteurs participant au CPQP ont, d'après les statistiques, une
productivité significativement plus élevée que les agriculteurs non certifiés du groupe témoin, tout
comme c'est le cas également des agriculteurs certifiés comparativement aux agriculteurs non
certifiés. Ces chiffres sont comparables aux chiffres de référence pour la Côte d'Ivoire, mais restent

16 | LEI Report 2014-016
malgré tout inférieurs à la productivité enregistrée dans d'autres pays. La justesse de la productivité
indiquée par hectare peut toutefois être remise en question, les agriculteurs ayant tendance à
surestimer la taille de leur exploitation. Environ 60 % des agriculteurs attribuent l'amélioration de la
productivité à un programme de certification, en particulier les BPA. Les agriculteurs du programme
CPQP affichent des coûts de production totaux plus élevés, mais des coûts de production par
kilogramme considérablement moindres que les agriculteurs non certifiés. Toutefois, bien que les
coûts par kilogramme soient moins élevés pour les agriculteurs du CPQP, leurs ratios d'efficacité ne
sont pas supérieurs. Cette situation est peut-être due au délai nécessaire avant que tout changement
soit visible dans le secteur de l'agriculture. Du reste, cette étude est la toute première mesure
effectuée.
Les agriculteurs ont généralement l'impression d'être « coincés » dans la production de cacao. Ils ne
peuvent pas changer ou accroître facilement leurs sources de revenus (issues de la production de
cacao) et n'ont pas ou peu de possibilités de générer des fonds d'une autre manière. Par conséquent,
le cacao n'est généralement pas considéré comme une option viable pour l'avenir. La plupart des
agriculteurs n'encouragent pas leurs enfants à se lancer dans la production de cacao. La certification
et les activités associées visent à inverser cette tendance en concentrant l'attention sur ce secteur et
en le revitalisant.
Les pratiques d'amélioration de l'environnement, particulièrement en termes de préservation et de
qualité des sols et de l'eau, semblent avoir eu un impact limité à ce jour. Ce résultat est peut-être dû
au délai nécessaire avant que les impacts environnementaux soient visibles, ainsi qu'aux méthodes
utilisées pour évaluer l'évolution des indicateurs portant sur la qualité des sols et de l'eau, la gestion
des déchets et les habitats naturels sur l'exploitation ou à proximité.
En organisant les agriculteurs en groupements de producteurs et en les aident dans leur
professionnalisation, la certification et les formations ont été considérablement élargies, fournissant
ainsi une base pour de vastes programmes d'assistance pour les quatre négociants participant au
CPQP. La participation des agriculteurs a également permis une expansion, quoique sur une plus petite
échelle, de l'accès aux intrants, produits phytosanitaires et engrais, ainsi qu'à des préfinancements et
crédits, pour 6 à 20 % des agriculteurs. Les groupements de producteurs fournissent un capital social
et un forum d'apprentissage et d'échange, et agissent favorablement sur l'obtention d'un accès au
crédit, aux intrants agricoles, aux autres services et aux acheteurs. Tous les agriculteurs ne
bénéficient toutefois pas de ces avantages et la majorité d'entre eux n'ont toujours pas suffisamment
accès aux crédits, intrants ou jeunes plants nécessaires pour renouveler leurs exploitations de cacao.
Des partenariats entre IDH, des négociants, des programmes de certification, des organisations à but
non lucratif, les services de vulgarisation du gouvernement ivoirien et des coopératives semblent être
des canaux importants qui ajoutent de la valeur à la certification pour les agriculteurs et améliorent
son effet en fournissant une gamme de services dont les agriculteurs ont besoin. Des partenariats
peuvent contribuer à améliorer l'efficacité et l'efficience de la certification, les « doublons » en termes
d'efforts étant évités. Toutefois, les programmes de certification multiple auraient, selon les
producteurs, eux aussi un impact négatif, en ce sens qu'ils requièrent plus d'efforts et suscitent
davantage de coûts pour les agriculteurs, les groupements de producteurs et les négociants. Des
collaborations et partenariats pourraient, en l'occurrence, contribuer à minimiser ou atténuer ces
impacts. Des études récentes (KPMG 2012, GBCG 2012) semblent confirmer les impressions des
agriculteurs et des groupements de producteurs, à savoir qu'ils prennent à leur charge des coûts
substantiels dans le cadre des certifications. Une analyse des coûts et des bénéfices financiers et
économiques totaux pour les agriculteurs lors des différentes étapes de certification et pour un groupe
témoin est recommandée, compte tenu du fait que la plupart des agriculteurs ne tiennent pas de
registres faisant mention de leurs coûts et bénéfices. Les nombreuses activités mises en œuvre par les
négociants dans le cadre de ou en rapport avec les certifications, montrent qu'une certification permet
aux agriculteurs d'être contactés par des négociants et par des organisations responsables de projets
et de programmes.

LEI Report 2014-016 | 17
La prime à la certification – la rémunération fournie par le marché pour une production durable et
responsable – est pour les agriculteurs l'un des principaux critères qui les incitent à être certifiés.
Cette prime incarne la rémunération du marché pour une production durable et responsable. Pour les
agriculteurs, c'est un encouragement, surtout pendant les premières étapes de participation lorsque
la hausse de productivité et de qualité attendue n'est pas encore visible. Cette prime ne représente
toutefois qu'une faible proportion du prix total gagné par les agriculteurs (7 % du prix de vente total
au kilogramme). Cette prime fait l'objet d'une grande attention, la majorité des groupements de
producteurs payant les primes séparément des principaux paiements effectués pour les fèves de
cacao. Elle est également utilisée pour garantir fidélité et reconnaissance entre les agriculteurs, leurs
groupements de producteurs et les négociants. Les agriculteurs et les groupements d'agriculteurs
s'inquiètent cependant car ils estiment que si la prime est supprimée, une des principales valeurs
ajoutées du maintien de leur certification disparaîtra. Les indicateurs portant sur la productivité,
les revenus et l'efficacité suggèrent que, pour les agriculteurs, il serait plus avantageux dans le long
terme de se concentrer sur l'augmentation de l'ensemble des prix et des bénéfices gagnés par les
agriculteurs sur les fèves certifiées, plutôt que d'accorder une trop grande attention à la prime.
La certification a soutenu et encouragé massivement les actions collectives. Les agriculteurs
mentionnent les nombreux avantages qu'offre leur groupement de producteurs, par exemple la
commercialisation de leurs fèves à un bon prix, l'accès à des informations et à des formations,
l'existence d'un forum d'échange et le renforcement du capital social. Les services fournis aux
groupements de producteurs par le CPQP (et par d'autres négociants et projets) ont permis
d'améliorer l'accès des agriculteurs à de jeunes plants, des produits phytosanitaires et des crédits.
Les activités associées à la certification, souvent mises à disposition par les négociants, ont également
favorisé la professionnalisation des groupements de producteurs, en fournissant des formations au
management, des modèles de systèmes de contrôle interne, une assistance financière, des
équipements et des moyens de transport. Toutefois, de nombreux agriculteurs ont indiqué qu'il est
toujours nécessaire d'assurer un meilleur accès à suffisamment de crédits et intrants ainsi qu'à
d'autres services associés ou non à leur exploitation agricole, pour améliorer le secteur de l'agriculture
et les moyens de subsistance de leurs familles, et qu'une assistance est requise pour les aider à gérer
et diversifier leurs sources de revenus. Il est toutefois nécessaire d'accroître l'échelle et la fréquence
et de multiplier les moments auxquels ces services sont fournis, de sorte qu'ils puissent profiter à la
majorité des agriculteurs participant au CPQP.
La certification a également eu quelques conséquences imprévues. Elle n'a fait que renforcer les
difficultés des agriculteurs à gérer des flux de trésorerie saisonniers importants. Le processus d'audit
est perçu comme favorisant la corruption. La procédure de calcul des primes est considérée comme
n'étant pas transparente et ne semble pas correspondre aux frais réels que ce soit au niveau des
agriculteurs, des groupements de producteurs ou des négociants. La certification multiple est
complexe et a été difficile à gérer pour certains négociants et certains groupements de producteurs.
En raison de l'expansion et du renforcement rapides des activités associées à la certification (en
particulier les formations), les agriculteurs ont l'impression que la qualité des activités est variable et
ne répond pas toujours aux normes minimales, ce qui peut éventuellement influencer les
connaissances et pratiques des agriculteurs.
Il semblerait que les agriculteurs bénéficient de la procédure de certification combinée aux
activités de soutien. Selon les agriculteurs, la mise en œuvre des bonnes pratiques agricoles
enseignées dans le cadre du programme de certification entraîne une productivité plus élevée et,
parconséquent, des revenus plus importants. L'étude initiale de référence associée à l'évaluation des
impacts y contribue d'une certaine manière. Pour les agriculteurs, la valeur ajoutée du programme
decertification combinée aux formations et autres formes d'assistance réside dans la possibilité de
bénéficier de primes de certification et dans l'accès, par le biais des groupements de producteurs et
des négociants, aux services dont ils ont besoin et dont ils sont satisfaits. La certification influence les
pratiques commerciales et suscite une série de résultats positifs. En tant que membres d'un
groupement de producteurs, les agriculteurs certifiés ont accès aux négociants et vendent en général
uniquement aux négociants qui les ont soutenus. Pour les agriculteurs, cela représente une plus-value
dans la mesure où il est répondu à leurs besoins. Pour les négociants, cette fidélité est la garantie
d'une source sûre de fèves certifiées et de bonne qualité. Ces relations garantissent l'accès aux

18 | LEI Report 2014-016
marchés pour les agriculteurs et leurs groupements et accroissent l'accès à des services d'assistance
qui améliorent la production. Ces meilleures relations permettent également d'accéder à d'autres
activités sociales et communautaires qui ne figurent pas sur le haut de la liste des priorités mais ne
sont pas pour autant moins importantes pour les agriculteurs. D'après les agriculteurs, les soins de
santé, les écoles et les infrastructures continuent à être des sujets de préoccupation influençant les
moyens de subsistance au sein de leurs communautés.
La logique d'impact du CPQP semble être correcte, en ce sens que la certification et les
activités et intrants associés contribuent bel et bien aux résultats économiques. Elle part du
principe qu'une amélioration des niveaux de connaissance conduit à une meilleure mise en œuvre des
bonnes pratiques agricoles, une hausse de la productivité, des revenus nets plus élevés et de
meilleurs niveaux de satisfaction en ce qui concerne les moyens de subsistance des agriculteurs.
L'amélioration des niveaux de connaissance et de la tenue des registres entraîne une hausse de la
productivité, des revenus nets et des moyens de subsistance. Aucun lien ne semble exister entre la
mise en œuvre de BPA de manière générale ou la mise en œuvre de pratiques post-récolte et la
qualité des fèves (indiquée par le taux de rejet). Cela peut être influencé par des facteurs externes,
tels que la réforme institutionnelle du secteur du cacao en Côte d'Ivoire en 2012. De même,
l'amélioration des niveaux de connaissance agit favorablement sur la mise en œuvre de BPA, ce qui
vient confirmer la logique d'impact. Pour certaines pratiques agricoles spécifiques (gestion des déchets
et des sols, protection de l'eau et de la biodiversité), ce n'était toutefois pas le cas. Pour veiller à ce
que ces résultats soient atteints, en particulier par les derniers arrivants et éventuellement les
nouveaux arrivants au programme qui présentent des caractéristiques légèrement différentes, il est
recommandé d'adapter la manière dont le programme est mis en œuvre. Les résultats sociaux ne sont
que partiellement atteints, les agriculteurs certifiés signalant des conditions de travail plus sûres et de
meilleure qualité. Toutefois, face aux résultats obtenus en ce qui concerne l'inclusion d'un plus grand
nombre de propriétaires de sexe féminin dans le programme et une production de cacao certifiée sans
travail des enfants, il est clair que des actions supplémentaires sont nécessaires pour parler d'un
impact significatif. Les résultats écologiques semblent également n'être que partiellement atteints:
si l'utilisation de produits chimiques est conforme aux recommandations nationales, les indicateurs de
réhabilitation et de régénération des exploitations agricoles – notamment l'accès à de jeunes plants
améliorés et l'acquisition de compétences en matière de greffage – restent faibles. La logique du CPQP
suppose également que les intrants vont conduire à une hausse de la productivité. Le nombre
d'agriculteurs impliqués dans des interventions favorisant l'accès aux engrais (7 %), aux crédits
(24 %), aux jeunes plants (11 %) et aux pesticides (36 %) étant moins élevés, des essais éventuels
devant prouver la corrélation entre ces interventions et une hausse de la productivité ne seront
possibles que lors d'une future évaluation des impacts.
Enseignements et recommandations
Le cacao est clairement une composante essentielle des moyens de subsistance des agriculteurs qui
participent au programme CPQP, en tant que source de revenus unique ou principale pour la plupart
d'entre eux. L'amélioration des revenus, des aspects sociaux et de l'environnement de ces producteurs
de cacao, ne se limite cependant pas aux champs de cacao (ces agriculteurs assurant également la
production d'autres cultures commerciales et de subsistance) et à la certification (qui a un objectif
bien spécifique). Pour leur fournir des moyens de subsistance durables et diversifiés, il faut avoir une
vision globale de l'interaction possible avec d'autres cultures de subsistance et commerciales capables
de venir compléter les revenus du cacao. Pour améliorer véritablement les moyens de subsistance des
agriculteurs, il faudrait probablement que le programme CPQP mette l'accent sur plus d'un produit.
Concrètement, cela peut impliquer de tester de nouveaux modèles commerciaux diversifiés pour
pouvoir persuader les producteurs de cacao et leurs enfants de continuer à cultiver et à transformer
le cacao certifié. Il faudra peut-être pour cela faire évoluer les mentalités afin que le cacao certifié ne
soit plus considéré que comme une des multiples composantes (même si elle est importante) des
moyens de subsistance des agriculteurs, de leurs familles et de leurs travailleurs (hommes et femmes,
jeunes et vieux). La mise en place de partenariats et dialogues continus est nécessaire, bon nombre
de ces questions sortant des limites actuelles des activités et sphères d'influence des négociants et
partenaires. Des efforts doivent être consentis pour garantir la clarté et la transparence des bénéfices

LEI Report 2014-016 | 19
et des coûts de la certification pour toutes les parties prenantes ainsi que l'efficacité des procédures
de certification (multiple). La certification ne répondant pas ou ne pouvant pas répondre de manière
satisfaisante à tous les besoins des agriculteurs, des combinaisons d'activités, telles que celles
utilisées dans le CPQP, s'avèrent jouer un rôle important pour convaincre les agriculteurs et les
groupements de producteurs que le cacao durable attesté reste une solution de culture et de
subsistance viable à long terme pour eux et pour leurs enfants.
Les suggestions faites pour l'orientation future du CPQP en Côte d'Ivoire sont les suivantes :
Inclure les travailleurs et particulièrement les femmes et les jeunes en tant que groupes cibles dans
les activités.
Prendre d'autres mesures afin d'accroître la productivité et l'efficacité des agriculteurs et réfléchir
sur la manière de favoriser des rémunérations du marché (pour une production durable) qui mettent
davantage l'accent sur la rentabilité au niveau de l'agriculteur et du groupement de producteurs.
Aborder les secteurs dans lesquels les connaissances des agriculteurs et la mise en œuvre de
bonnes pratiques agricoles sont limitées ; et en particulier évaluer l'efficacité des techniques de
formation utilisées au fil du temps avec les différents agriculteurs.
Continuer à insister sur l'application du droit du travail afin que les pires formes de travail des
enfants soient éliminées et que les droits des enfants et les droits des travailleurs soient respectés.
Le soutien d'initiatives favorisant la scolarisation des enfants (par exemple, veillant à la présence
d'écoles dans les communautés de producteurs de cacao) reste essentielle pour éliminer le travail
des enfants.
Il est également recommandé de solliciter, d'écouter et de prendre en compte les perceptions qu'ont
les agriculteurs et les parties prenantes de leurs besoins (pesticides et engrais, jeunes plants,
matériau végétal amélioré, crédit, assurance, formation commerciale) et d'envisager la possibilité
d'intégrer leurs suggestions dans le programme CPQP et/ou dans les programmes de soutien des
partenaires.
L'avenir
Même si ces résultats préliminaires suggèrent que le programme CPQP a contribué à améliorer les
moyens de subsistance, les communautés et l'environnement des producteurs de cacao en Côte
d'Ivoire, ils soulèvent également des questions. Le suivi et l'évaluation permettront de discuter de ces
résultats avec les parties prenantes, de recueillir de nouvelles données dans certains domaines précis
et de mieux comprendre les impacts de la production durable de cacao.
Les actions recommandées visent notamment à améliorer les méthodes et à changer les indicateurs
utilisés pour évaluer les impacts et les résultats. La collecte de données pourrait gagner en efficacité
et être rendue moins pesante pour les agriculteurs, par le biais d'une méthodologie de recherche
reposant davantage sur la collaboration et en recourant dans une plus grande mesure aux données
environnementales des négociants, des organismes de certification, des groupements de producteurs
et d'autres parties prenantes. Les mécanismes de contrôle et les évaluations d'impact devraient dans
le futur reconsidérer les méthodes utilisées et prêter attention à la représentativité de l'échantillon
d'agriculteurs.
20 | LEI Report 2014-016
1 Introduction
1.1 Rationale
The Sustainable Trade Initiative (IDH) aims to accelerate and up-scale sustainable trade by building
impact-oriented coalitions of multinationals, civil society organisations, governments and other
stakeholders. Through co-funding and convening public and private interests, strengths and
knowledge, IDH programmes aim to create shared value for all partners. The objective is to help make
sustainability the new norm and contribute to achieving the Millennium Development Goals. The IDH
Cocoa Productivity and Quality Programme (CPQP) is a four-year programme that will help catalyse
large-scale positive impact within the sector by mainstreaming the results of the previous Cocoa
Improvement Programme (CIP1), which ended on 31 December 2012. The aim is to assist large
numbers of smallholder cocoa farmers to move out of poverty and make the transition to running
viable businesses for sustainable cocoa production. The CPQP promotes a variety of tactics and tools
to create change in cocoa production, focusing on four tools: good agricultural practices (GAPs),
standards systems (certification), farmer aggregation and financing mechanisms. The 7 million euro
CPQP aims to help to develop and provide match-funded capital through a competitive grant process
that advances the cocoa market in the areas of quality, productivity, professionalisation of farmers
and their organisations, total quality standard systems, financing, and coordination and alignment
(IDH 2012).
The CIP1 was a public–private partnership 50% funded by IDH that ran from 2008 to December 2012.
It convened and aligned parties accounting for approximately 30% of the chocolate market and
focused on the largest producer countries: Côte d’Ivoire, Ghana, Indonesia, Nigeria, Cameroon and
Ecuador. The CIP1 aimed to be a major force behind the up-scaling of certification, increased market
demand for certified chocolate, the institutionalisation of sustainability in the sector, and the
dissemination of innovative sustainability practices. A second tranche of public and private funding set
up the Cocoa Productivity and Quality Programme (CPQP), a four-year programme that started in April
2011. The aim is to mainstream the results of the CIP1 and stimulate innovations on effective farmer
support and improved production to catalyse large-scale positive impacts within the sector.
The CPQP aims to help to develop and provide co-funding for programmes that advance the cocoa
market in quality, productivity, professionalisation of farmers and their organisations, total quality
standard systems, financing, and coordination and alignment of private and public sector actors in
sustainable cocoa production. The CPQP aims to train more than 50,000 farmers and certify over
30,000 farmers, to produce over 64,000 tonnes of certified cocoa and make UTZ Certified cocoa
widely available on the international market. The CPQP brings together more partners to cover over
40% of the worldwide cocoa processing industry and 30% of worldwide chocolate manufacturing
businesses. It involves local governments and other stakeholders. Alongside UTZ Certified and
Solidaridad, participants include Ahold, ADM, Armajaro, Barry-Callebaut, BT Cocoa, Cargill, Continaf,
Ecom, Ferrero, Friesland Campina, Mars, Heinz, ICCO, Nestlé, Swiss Contact, Oxfam Novib, Petra
Foods (Delfi), UNDP, WCF and WWF.
After UTZ Certified commissioned WUR to perform this impact study, UTZ Certified and Solidaridad
were partners in the CIP1 and in the CPQP. UTZ is a programme and label for sustainable farming
worldwide. Sustainable farming aims to help farmers, workers and their families to fulfil their
ambitions and contributes to safeguarding the earth’s natural resources, now and in the future.
UTZ’s mission is to create a world where sustainable farming is the norm, and where farmers
implement good agricultural practices and manage their farms profitably with respect for people and
planet, where industry invests in and rewards sustainable production and consumers can enjoy and
trust the products they buy.

LEI Report 2014-016 | 21
In 2007, UTZ Certified launched its cocoa programme with founding members Cargill, Ecom, Heinz,
Mars, Nestle and Ahold and the not-for-profit organisations Solidaridad, Oxfam Novib and WWF. The
first pilots in Côte d’Ivoire started in 2008 (two projects with Cargill and two with Ecom). Ghana was
the second country where the programme was implemented. In January 2008, a group of partners
travelled to Côte d'Ivoire to understand the issues and the potential for and obstacles to certification.
After extensive stakeholder consultation, the UTZ Certified Good Inside Code of Conduct for Cocoa was
launched in June 2009 and the first producers in Cooperative Agricole de Fiédifoué (CAFD) and
Coopaga were certified in August 2009. In November 2009 the first batch of UTZ Certified cocoa
arrived in Amsterdam amidst much fanfare. By December 2009, Coopagro in Côte d'Ivoire was one of
three more producers that became certified worldwide and 5,400 tons had been produced by UTZ
Certified cocoa farmers. In January 2010, the Chain of Custody (CoC) and corresponding labelling was
finalised and an interim traceability procedure installed. This was seen as essential for the success of
UTZ Certified label in the market. Also in 2010 the first UTZ Certified chocolate products appeared on
the market: Baronie Easter Eggs, 4-finger KitKat Australia, Cocio, AH chocolate bars and letters in two
thirds of all Dutch supermarkets; commitments of Chocomel & Cécémel, Nidar, de Ruijter and Arla.
In 2011, Solidaridad and UTZ Certified commissioned LEI to evaluate their cocoa programme in Ghana
(a baseline study, mid-term review and final evaluation). The baseline report was completed in April
2013. By June 2012, in Côte d’Ivoire UTZ had partnerships with eight traders (four of which are also
partners in the CPQP). A total of 86 producer groups were certified, comprising 44,624 farmers and
128,582 tons of cocoa produced on a total area of 219,100 hectares; a further 103 producer groups
were in the process of certification. These implementing partners have facilitated the training of
producers and producer groups. The training focuses on good agricultural, social and environmental
practices (GAPs) in line with UTZ Code of Conduct. Implementation of better and more sustainable
practices is expected to lead to higher and long-term productivity, improved quality (better market
access and prices), increased efficiency (lower costs per unit of produce), increased income (improved
profitability) and improved social and environmental conditions. Training also includes organisational
management and internal control systems (ICS), which are expected to lead to more effective farmer
organisations with more effective input purchasing, cocoa marketing and better service delivery to
cocoa farmers.
Following on from the study in Ghana, UTZ Certified and Solidaridad wanted to conduct a similar and
comparable study in Côte d’Ivoire, with a broader scope in terms of the implementing partners and
methods. IDH used this opportunity to collect additional data to also answer its research questions.
As Ghana and Côte d’Ivoire are different in terms of the parties involved, the activities and the
context, the theory of change, research questions and indicators were adjusted and influencing factors
(such as the political situation and recent conflict) were taken into account. Also, to improve learning
from the study, capture the initial results of the CIP1, enable triangulation and increase
communication value, IDH, UTZ and Solidaridad wanted the Côte d’Ivoire study to use a mix of
quantitative and qualitative methods.
1.2 Objectives and research questions
The objectives of the study were to:
1. Obtain information about the baseline situation of the CPQP in Côte d’Ivoire
2. Assess whether the activities/strategies lead to the desired outcomes (effectiveness)
3. Draw lessons learned so as to improve the quality of the programme.
The following three learning questions were proposed:
1. Is the CPQP cocoa programme in Côte d’Ivoire inclusive? What are the characteristics
of certified farmers? Are certified farmers representative of Ivorian cocoa farm holders (in terms
of incomes, gender, age, farm size and tenure and ethnic/migrant status)? Do knowledge and
benefits also reach others working/helping on certified farms (spouses, workers, tenants,
children, etc.)?

22 | LEI Report 2014-016
2. How do certification, voluntary standards and the related activities of implementing
partners (Solidaridad, buyer-exporters, private training agencies, consultants and the national
rural development agency) influence knowledge (of GAPs, social and environmental issues in
line with the code of conduct) and the related behaviour/practices of cocoa farmers in
Côte d’Ivoire? And what are the results in economic, social and ecological terms?
3. What is the added value for farmers of going through certification processes and being
certified? What perceptions do farmers and stakeholders (groups, traders, traitants, exporters,
trainers) have of the process and impacts of certification and training on their livelihoods (e.g.
benefits in terms of improved wellbeing, increased professionalism, increased trust and
communication between farmers and co-ops, how certification influences loyalty of members
towards a group and willingness to reinvest in cocoa farming)? How do the training and
certification interventions influence/strengthen each other?
These research questions also draw on IDH’s impact logic (also known as the Theory of Change)
for sustainable cocoa, shown in Figure 3.
1.3 Collaboration with UTZ Certified, Solidaridad and
Cargill
One of IDH’s core strategies is to work through coalitions to implement its mission. This study was
conducted in collaboration with three of its partners: UTZ Certified, Solidaridad and Cargill.
Solidaridad has supported the development of UTZ certification since 2004.1 UTZ and Solidaridad both
started cocoa programmes in 2007. In West Africa, UTZ’s cocoa programme has been implemented
since 2008 with Solidaridad and Solidaridad’s Regional Expertise Centre in West Africa; until 2012,
the centre was known as West Africa Fair Fruit (WAFF). Solidaridad works closely with companies to
help them make the transition to sustainable cocoa. Since 2007, its cocoa programme has focused on
poverty, environmental degradation and social issues (such as child labour), and training, organising
and empowering farmers in Côte d’Ivoire and other major cocoa production countries with partners
Cargill, ECOM, Mars, Ahold, Nestlé, funded by organisations such as IDH, the Netherlands Ministry of
Foreign Affairs and companies. In the next five years, the programme will be expanded to a minimum
of 400,000 farmers, increasing the market share to 15%-20% of global cocoa production by training
producers to increase productivity and improve farm management through good agricultural practices
and organisational development, organising farmers and enabling access to finance and developing
models for rehabilitation and intensification to increase productivity. Since 2008 Solidaridad has
collaborated with Cargill on its sustainable cocoa programme in Côte d’Ivoire. LEI was commissioned
to provide an assessment framework and baseline of the impact of cocoa farmer support activities by
Cargill and Solidaridad in November 2012. UTZ Certified was also a member of the IDH Cocoa
Improvement Programme 1 (CIP1); four companies implementing UTZ certification in Côte d’Ivoire are
also CPQP partners (Cargill West Africa, Zamacom (Ecom), CEMOI and SACOM (Barry Callebaut).
LEI was commissioned to provide an assessment framework and baseline of the impact of cocoa
farmer support activities by Cargill and Solidaridad in November 2012 and by UTZ in December 2012.
IDH’s assessment was commissioned in January 2013. It builds on the same methodology and data as
for the Cargill and Solidaridad and UTZ studies. Due to the close relationships and interests of IDH,
UTZ and Solidaridad in certified cocoa production in Côte d’Ivoire, the three organisations and LEI
came to a framework for collaboration. The basis of this partnership consists of:
1 http://www.solidaridad.nl/merken/utz-certified

LEI Report 2014-016 | 23
A common interest in demonstrating a positive impact of certified/sustainable cocoa at household
level.
By combining resources the organisations are able to capture a large survey base of respondents.
The organisations are aligned on working with one methodology and one research consortium
(led by LEI).
The organisations acknowledge time constraints of wanting to deliver credible results as soon as
possible.
Recognition of the different role played by each organisation, resulting in different analysis and
reporting needs.
IDH, UTZ and Solidaridad agreed to share the primary baseline data as the basis to answer the
similar, but slightly different focus of the questions they each want to answer. Each of the three
organisations would have its own report reflecting its own focus and interests. Figure 1 visualises
the framework.
Figure 1 Organisational framework for the joint impact study
The guidance team for of this research consisted of representatives of IDH, UTZ Certified and
Solidaridad. The team were responsible for ensuring the quality and alignment of the study, and
overall coordination and final approval of the deliverables. They also provided secondary data,
facilitated logistical arrangements during fieldwork and contacts with stakeholders, and reviewed
progress and deliverables.
The study was led by LEI Wageningen UR led in partnership with the Centre for Development
Innovation (CDI Wageningen UR), the French Centre de Coopération Internationale et Recherche
Agronomique pour le Développement (CIRAD), and the Ivorian research organisation Agriculture et
Cycle de Vie (A & CV).
1.4 Cocoa farming in Côte d’Ivoire
The cocoa sector in Côte d’Ivoire has a long and complex history. West Africa is the centre of world
cocoa production and Côte d’Ivoire has been the world’s largest cocoa exporter since the 1980s.
It currently produces between 41% and 60% of world supply, amounting to 1,511–1,480 thousand
tons annually in the last three years (ICCO 2013). This generates 15% of GDP and 30% of national
export income. An estimated 600,000–900,000 farmers work with cocoa, with up to 6 million
dependents. The majority of cocoa is produced on small farms of between 1.5 and 5 hectares, with
different reports of average farm size ranging from 2.8 ha (Alonghi 2011) to 3.7 ha (KPMG 2012b).
Farms generally have low and decreasing productivity rates (300-500 kg per ha) compared to other
cocoa producing countries (Ruf 2007; Oxfam International 2009; KPMG 2012b).

24 | LEI Report 2014-016
Around 6% of the national territory is under cocoa production, the majority grown in very suitable
growing areas – but not all (Läderach 2011). Expansion into unsuitable areas without fertilisers, inputs
or adapted agricultural practices commonly results in low yields (Ruf and Agkpo 2008). Annual
weather patterns and climatic have a major influence on yields (Zuidema et al. 2005; Ojo and Sadiq
2010). Climatic changes in the future are predicted to influence cocoa productivity as some areas
become unsuitable (Lagunes and Sud-Comoe in Côte d'Ivoire), some areas remain suitable, but only if
the farmers adapt to the new conditions and some areas where cocoa is not currently grown but which
may become suitable in the future (Läderach 2011).
Within the global cocoa sector, complex labour issues have been prominent in the last decade. These
issues are related to child labour (Krain et al. 2011), extended family labour migrant labour (Alongi
2011; Ton et al. 2008; Tulane University 2011). The sector was also affected by the Ivorian civil
conflicts in 2002–07 and 2010–11, with cocoa sales contributing to finance the conflict (Global Witness
2007; Guesnet et al. 2009). Given this history, multinational corporations have made significant
investments to secure cocoa output and ethical practices (Abbott et al. 2005). However, farm-gate
prices in Côte d’Ivoire have been among the lowest in terms of $/ton of all major exporting countries
(Abbott et al. 2005), typically less than 5% of cocoa bean equivalent price of chocolate paid by
consumers.
Pisteurs (small, itinerant buyers or middlemen) have mark-ups of less than 0.%, traders of around 5%
and exporters of around 20% (Abbott et al. 2005). Cocoa production has continued to rise despite low
prices in the mid-2000s. With demand expanding, Ghanaian supply contracting (till recently) and
Ghanaian farm-gate prices rising, Côte d’Ivoire led the way in filling the gap to become the world’s
major supplier of beans (Abbott et al. 2005) and increased by 112,000 tons in the period 2002/2003
to 2011/2012 (ICCO 2012 p.13). The value chain in Côte d’Ivoire is unique, with farmer sales at farm
gate to pisteurs or cooperatives (pisteurs sell to traitants (traders)) (Abbott et al. 2005). Farmer
groups are mainly cooperative structures, and traitant-led group structures have only just started to
emerge.
The governance of cocoa production in Côte d’Ivoire has a similar history to that in Ghana, but its
state-controlled governance system, where credit, pricing and export licensing were intimately linked,
has always had more private partners. Until 1990, exports, market power and price setting were
shared between exporters and the government (Ton et al. 2008). After 1999, a market-based
corporate governance and price negotiation system was implemented following the breakdown of
institutions as a result of failed cocoa production, and pressure from the World Bank and IMF
structural adjustment process. Foreign companies used the room to increase investments and increase
‘in-company’ chain integration. Exporters (including major trading houses such as Cargill, Barry
Callebaut, Olam and Armajaro) were then free to buy and sell based on the London market price. The
fully liberalised system left farmers exposed to the international cocoa price set in London. The 2012
reforms of the rules governing trade are a result of this history and the renewed assertion of the role
of the government, given some semblance of return to peace and state authority. The reforms, some
of which are contentious, include a reserve fund, a single regulatory body, a guaranteed 50-60%
benchmark price for farmers, export quality standards, and revised minimum export prices and
transport and handling fees (CTA 2012).
The proportion of certified cocoa from Côte d’Ivoire in terms of world market production certified
cocoa beans is high. In 2010, 26% of certified cocoa was Fairtrade certified. In 2009, 23% was
Rainforest Alliance certified and 78% was UTZ Certified; in that year, a total of 103,696 tons was
certified under the four schemes.(VOICE Network 2012). Organic certification had no market share in
2006 but is now active, although the proportion is not known. However, globally, only 55% of beans
that are certified are sold as certified at retail level and 30% are sold through other sales channels
(VOICE Network 2012).

LEI Report 2014-016 | 25
2 Methodology
This chapter describes the methodology used. More information can be found in the apendices: Annex
2 for indicators, Annex 4 explains the statistical analyses, Annex 8 contains a detailed description of
the methodology and Annex 13 describes the regression analyses methodology.
2.1 General approach
This report presents a combined baseline and initial impact assessment. A baseline study generally
takes place before a programme is implemented. However, as no baseline was established prior to CIP
starting in Côte d’Ivoire, and there was no UTZ Certification, this study aimed to provide a reference
situation as of 2013 and to record the characteristics of farmers participating in the programme as
well as those farmers not who are participating but who appear similar. Future impact assessments
can use this baseline to compare progress on the environmental, social and economic indicators. This
is a pragmatic approach to retrospectively provide a baseline and provide an initial assessment of the
impacts of the programme.
The impact assessment framework is based on a comparative difference in difference approach. This
prepares the ground for a baseline using four types of comparisons. The first looks at differences that
may be due to external factors. Any such differences due to external factors (see Annex 8) can be
seen by comparing indicators of farmers operating in comparable agro-economic circumstances who
are not involved in the CPQP (a control group) with changes in indicators of the farmers participating
in the CPQP (the intervention group). The second compares farmers located in different agro-
ecological zones to determine the possible influence of soil and climate. The third focuses on changes
in indicators over time to establish the effect of interventions such as certification and provision of
inputs by comparing the differences between the indicators ‘before’ and ‘after’ the intervention(s).
The fourth compares farmers who are not certified to those with single (UTZ Certified) or multiple
certification (i.e. UTZ and Rainforest Alliance or Fairtrade).

26 | LEI Report 2014-016
Figure 2 Impact assessment methodology
2.2 Scope of study
This study focused on IDH CPQP in Côte d’Ivoire, specifically concentrating on cocoa farmers who were
certified or were in the process of becoming certified up till June 2013. The main focus was on UTZ
Certified cocoa farmers, all of whom are members of a producer group,2 mostly a cooperative. In June
2012, 51% of UTZ farmers were also Rainforest Alliance certified, allowing farmers with multiple
certifications to be included in the study. As the majority of producer groups are linked to traders who
have assisted producer group certification, the study also focused on the different activities conducted
within the framework of certification and other services provided that may influence outcomes.
Ideally, baseline data should be collected before farmers actively participate in the CPQP to allow
impacts to be assessed against a baseline. As no dedicated baseline data were collected prior to either
the CIP or UTZ programme starting in 2008, a comparison between the before and the after
certification situation is not possible. This study therefore provides a baseline and reflects the situation
of farmers and producer groups in different phases of certification and of activities supported by the
CPQP that commenced prior to CPQP funding. These differences made it necessary to consider how
long farmers had been trained at the time of the survey, if they were certified and, if so, for how long.
It is assumed that the different approaches used by traders to support producer group certification
may result in different impacts for affili+ated farmers (once factors such as farm location in suitable or
less suitable zones for growing cocoa, length of time certified and number of training are controlled
2 An UTZ Certified cocoa producer sells their cocoa to a registered UTZ Certified buyer. They negotiate the contract details
and explicitly agree at producer group level upon the premium that is paid per kilogram for UTZ Certified beans.

LEI Report 2014-016 | 27
for). Thus, knowing how traders implement certification and the different types of delivery and
implementation modes is an essential part of the research. Farmers and their cooperatives associated
with different traders were therefore grouped separately. It is critical to acknowledge that external
events and the activities undertaken by traders (and other organisations, including the government)
towards individual farmers and cooperatives are expected to contribute to the impact of certification,
therefore secondary data about such influences were collected. This also helps to provide a
comparative baseline and triangulate findings.
After this study, it is understood that similar data may be collected for subsequent reviews. Only then
can the impact of the CPQP programme be fully established by comparing changes in the selected
indicators over the time period and between the control group and the CPQP group.
2.3 Impact logic
An impact logic (also known as a theory of change) is a tool to understand and visualise the rationale
behind a programme, the causal relationships between a programme’s activities and its intended
outcomes. It indicates the impact that is and can be expected. IDH’s theory of change, which was
developed for the CIP1 and the CPQP, was used. The impact logics developed retrospectively with
UTZ, Solidaridad and Cargill were also used to understand their interventions and the aims of those
interventions. The logic depicts the entire cocoa programme and is not specific to Côte d’Ivoire.
Impacts are also determined by external factors. However, external factors are not explicitly a part of
nor are they displayed in the impact logic. Notable assumptions implicit in logic are specified in Annex
8. The expected outcomes and impacts are economic, social and ecological (see
Annex 8).

28 |
LEI R
eport 2
014-0
16
Figure 3 IDH impact logic for cocoa.

LEI Report 2014-016 | 29
2.4 Indicators
To measure these expected outcomes, the 15 indicators shown in table 2 were developed on the basis
of the impact logic. These broadly embrace the 29 indicators used by the CPQP, shown in Annex 2.
Eight of the CPQP indicators could not be established, as they were provided too late on in the study
design and required data collection methods other than those that had already been planned. Six of
the CPQP indicators can be only partially measured.
Table 2
Impact indicators.
Social
1. Farmer characteristics
2. Programme inclusiveness
3. Livelihood and standard of living
4. Sustainable practices rewarded by the market
5. Stability of producer groups, services provided and access to market
6. Labour rights
7. Child labour and rights
8. Healthy and safe living and working conditions
Economic
9. Farm efficiency
10. Productivity
11. Quality
12. Profitability and long-term viability of farmers and groups
Ecologic
13. Soil and water quality
14. Waste management and reduction (related to cocoa production)
15. Protection restoration of natural habitats (on/near farm)
Annex 2 provides more detailed information on each indicator and how they are linked to the research
questions, as well as the methods used to calculate and source data on the indicators. The indicators
formed the basis of data collection, during which different methods were used to collect data about
each indicator.
2.5 Methodological strengths, weaknesses and limitations
As the main primary data collection methods have strengths and weaknesses in terms of the validity
of conclusions that can be drawn, four criteria were used to assess these (Ton et al. 2011). The
methods proposed to countervail weaknesses are presented in Annex 8.
2.6 Sampling
A purposive, stratified sample of farmers were selected for data collection from farmers. The sample
had to be representative of and as generalisable as possible for farmers in Côte d’Ivoire. The selection
criteria for the sample were:
1. Farmers who are members of producer groups linked to traders and those with no links.
2. Farmers who are members of producer groups that are in different stages of certification and
training.

30 | LEI Report 2014-016
3. Farmers who are members of producer groups located in three different agro-ecological
zones3 (shown in Figure 5).
4. Farmers in certified producer groups and uncertified farmers (control group).
Table 3 and Figure 4 show the distribution of the sample according to the above criteria. The sample
size of least 60 farmers linked to each trader and in each agro-ecological zone was used to make the
study statistically valid. Individual farmers were randomly selected using the random number
generation technique. The approximate locations of the producer groups are shown in Figure 6.
Table 3
Overview of sampled producer groups and farmers.
Stakeholders Number of producer groups per agro-ecological
zone
Total
producer
groups
%
Marginal Good Excellent
CPQP producer groups 6 29 53 88 90.7
Control group producer
groups
3 2 4 9 9.3
Total number producer groups 7 29 55 97 100.0
Trader Number of producer groups per agro-ecological
zone
Total
producer
groups
%
Marginal Good Excellent
ADM 0 1 1 2 2.1
Barry Callebaut 1 2 1 4 4.1
Cargill 3 19 38 60 61.0
Cemoi 0 1 1 2 2.1
Cocoaf Ivoire 0 2 7 9 9.3
No known trader 3 2 4 9 9.3
Natra 0 0 1 1 1.0
Olam 1 2 1 4 4.1
Zamacom 1 2 3 6 6.2
Total 9 31 57 97 100.0
Note that farmers and their cooperatives participating in other certification schemes either through
programmes and activities with other traders was not a selection criteria, but was recognised as an
external influence that may impact the results of the study. Questions were included in the producer
questionnaire concerning multiple certification and associated activities, to allow this factor to be taken
into account in comparisons where this was felt to be an issue (concerning knowledge and
implementation of GAPs) and analyses. Individual farmers participating in the programme were
randomly selected using the random number generation technique.
The sampling approach resulted in a comparable proportion of farmers located in the three agro-
ecological zones. The proportion is shown in Figure 4 and is seen as similar enough to allow
comparisons between the control group and CPQP participants on the basis of their location in different
agro-ecological zones. A sample of at least 30 farmers linked to each trader was aimed for. Despite
aiming to interview 40 farmers to allow for problems in the field, difficulties experienced by the field
team and time and cost restraints meant that a smaller sample was obtained for one trader. However,
the stratified sample is still seen as sufficiently robust to allow comparison between different groups of
farmers. Although all farmers and stakeholders were asked the same questions, not all questions were
relevant or applicable, and thus not all farmers could answer them. Where this is the case, the number
of respondents is provided in the presentation of results.
3 Using the classification of five zones developed by CIAT and partners (Läderach 2011) of the suitability for cocoa
production, taking into account climate, soil and land cover.
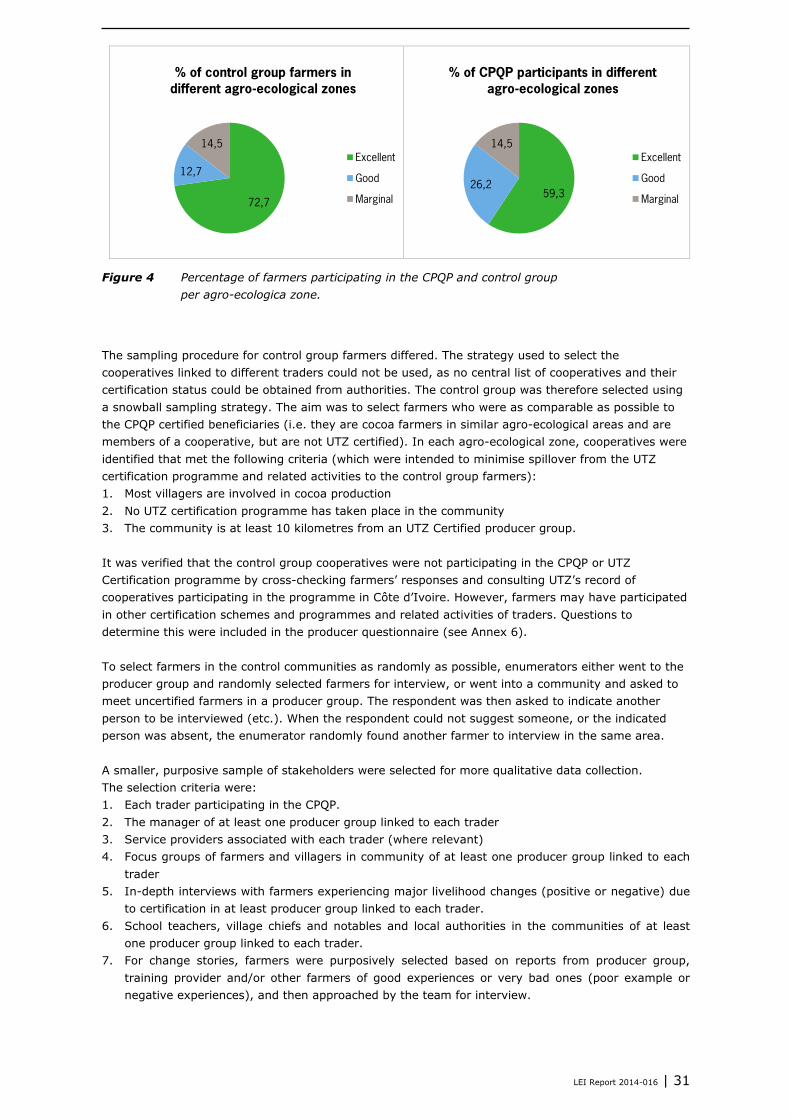
LEI Report 2014-016 | 31
Figure 4 Percentage of farmers participating in the CPQP and control group
per agro-ecologica zone.
The sampling procedure for control group farmers differed. The strategy used to select the
cooperatives linked to different traders could not be used, as no central list of cooperatives and their
certification status could be obtained from authorities. The control group was therefore selected using
a snowball sampling strategy. The aim was to select farmers who were as comparable as possible to
the CPQP certified beneficiaries (i.e. they are cocoa farmers in similar agro-ecological areas and are
members of a cooperative, but are not UTZ certified). In each agro-ecological zone, cooperatives were
identified that met the following criteria (which were intended to minimise spillover from the UTZ
certification programme and related activities to the control group farmers):
1. Most villagers are involved in cocoa production
2. No UTZ certification programme has taken place in the community
3. The community is at least 10 kilometres from an UTZ Certified producer group.
It was verified that the control group cooperatives were not participating in the CPQP or UTZ
Certification programme by cross-checking farmers’ responses and consulting UTZ’s record of
cooperatives participating in the programme in Côte d’Ivoire. However, farmers may have participated
in other certification schemes and programmes and related activities of traders. Questions to
determine this were included in the producer questionnaire (see Annex 6).
To select farmers in the control communities as randomly as possible, enumerators either went to the
producer group and randomly selected farmers for interview, or went into a community and asked to
meet uncertified farmers in a producer group. The respondent was then asked to indicate another
person to be interviewed (etc.). When the respondent could not suggest someone, or the indicated
person was absent, the enumerator randomly found another farmer to interview in the same area.
A smaller, purposive sample of stakeholders were selected for more qualitative data collection.
The selection criteria were:
1. Each trader participating in the CPQP.
2. The manager of at least one producer group linked to each trader
3. Service providers associated with each trader (where relevant)
4. Focus groups of farmers and villagers in community of at least one producer group linked to each
trader
5. In-depth interviews with farmers experiencing major livelihood changes (positive or negative) due
to certification in at least producer group linked to each trader.
6. School teachers, village chiefs and notables and local authorities in the communities of at least
one producer group linked to each trader.
7. For change stories, farmers were purposively selected based on reports from producer group,
training provider and/or other farmers of good experiences or very bad ones (poor example or
negative experiences), and then approached by the team for interview.
72,7
12,7
14,5
% of control group farmers in
different agro-ecological zones
Excellent
Good
Marginal59,3
26,2
14,5
% of CPQP participants in different
agro-ecological zones
Excellent
Good
Marginal
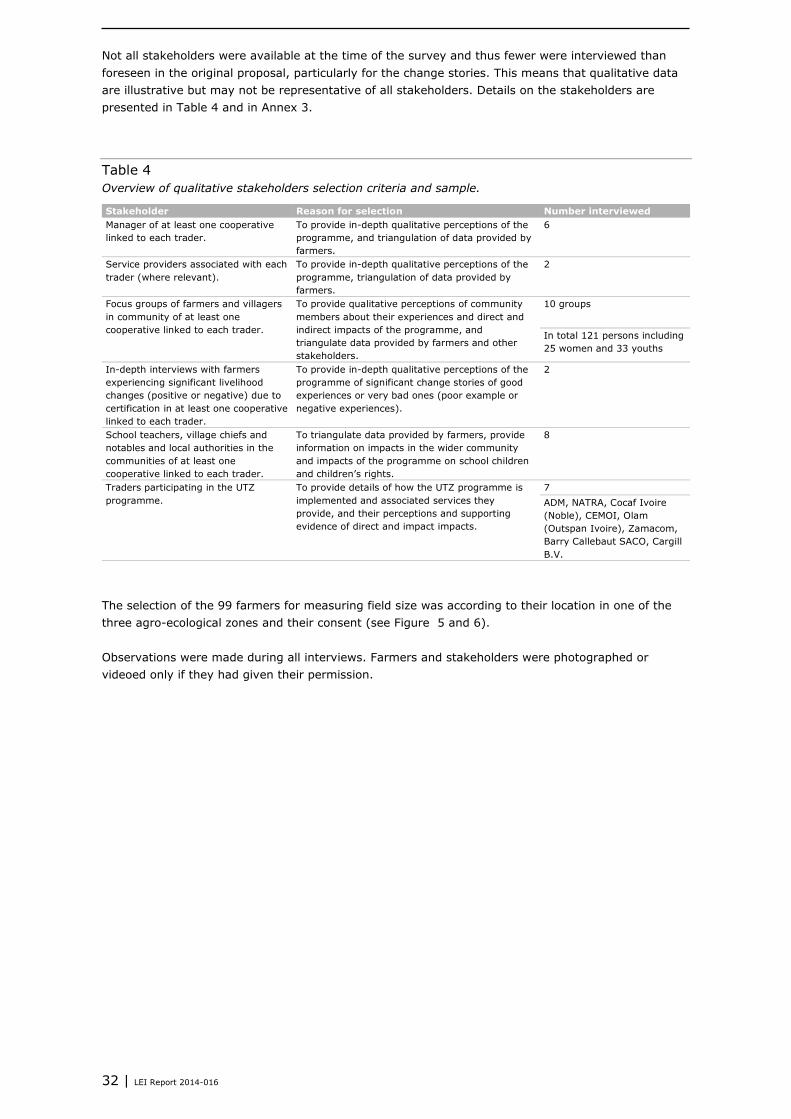
32 | LEI Report 2014-016
Not all stakeholders were available at the time of the survey and thus fewer were interviewed than
foreseen in the original proposal, particularly for the change stories. This means that qualitative data
are illustrative but may not be representative of all stakeholders. Details on the stakeholders are
presented in Table 4 and in Annex 3.
Table 4
Overview of qualitative stakeholders selection criteria and sample.
Stakeholder Reason for selection Number interviewed
Manager of at least one cooperative
linked to each trader.
To provide in-depth qualitative perceptions of the
programme, and triangulation of data provided by
farmers.
6
Service providers associated with each
trader (where relevant).
To provide in-depth qualitative perceptions of the
programme, triangulation of data provided by
farmers.
2
Focus groups of farmers and villagers
in community of at least one
cooperative linked to each trader.
To provide qualitative perceptions of community
members about their experiences and direct and
indirect impacts of the programme, and
triangulate data provided by farmers and other
stakeholders.
10 groups
In total 121 persons including
25 women and 33 youths
In-depth interviews with farmers
experiencing significant livelihood
changes (positive or negative) due to
certification in at least one cooperative
linked to each trader.
To provide in-depth qualitative perceptions of the
programme of significant change stories of good
experiences or very bad ones (poor example or
negative experiences).
2
School teachers, village chiefs and
notables and local authorities in the
communities of at least one
cooperative linked to each trader.
To triangulate data provided by farmers, provide
information on impacts in the wider community
and impacts of the programme on school children
and children’s rights.
8
Traders participating in the UTZ
programme.
To provide details of how the UTZ programme is
implemented and associated services they
provide, and their perceptions and supporting
evidence of direct and impact impacts.
7
ADM, NATRA, Cocaf Ivoire
(Noble), CEMOI, Olam
(Outspan Ivoire), Zamacom,
Barry Callebaut SACO, Cargill
B.V.
The selection of the 99 farmers for measuring field size was according to their location in one of the
three agro-ecological zones and their consent (see Figure 5 and 6).
Observations were made during all interviews. Farmers and stakeholders were photographed or
videoed only if they had given their permission.

LEI Report 2014-016 | 33
Figure 5 Agro-ecological suitability for cocoa production in Ghana and Côte d’Ivoire
Source (Läderach 2011).
Figure 6 Map of study locations.

34 | LEI Report 2014-016
2.7 Data collection and analysis
The 15 environmental, economic and social indicators identified on the basis of the impact logics of
IDH, UTZ, Cargill and Solidaridad were the main measures used to gather baseline data and measure
the impact of the programme activities. Quantitative and qualitative data (i.e. farmers’ and other
stakeholders’ perceptions of impacts) on these indicators were collected through interviews using
structured questionnaires with farmers, and by means of the data made available by traders, UTZ
Certified, ANADER and Solidaridad. In-depth interviews using structured questionnaires were
conducted with farmers, farmer group managers, village chiefs, schoolteachers, groups of villagers,
and support organisations. In addition, fields and villages were visited and observed, and 99 farms
were measured using GPS. The vast majority of the data were collected in Côte d’Ivoire by nine
enumerators guided by Roger Tanoh and Abel Galo of A & CV in Côte d’Ivoire in between November
2012 and July 2013. Additional phone interviews were conducted with traders in Abidjan and in the
Netherlands by the WUR team. Secondary literature to provide benchmarks indicators was also
collected (see Annex 10).
Data were analysed qualitatively and using a statistical program (the methods are further detailed in
Annex 8). Descriptive statistics – such as the minimum and maximum values, mean, median and
standard deviation, and correlations – are presented here. The terms are explained in Annex 4.
Farmers were compared on key indicators such as knowledge of sustainable production, production
and income through cross-tabulation, pairwise t-test and regression analysis (also explained in Annex
4). To account for both fixed and random effects that cause variations in knowledge and
implementation scores, multilevel mixed-effect linear regression was used, with variables such as age,
gender, and level of education used to estimate fixed effects. The full results are shown in Annex 13.
A farmer’s knowledge and implementation of good agricultural practices were established using a
range of questions in the producer questionnaire on good agricultural practices, corresponding to the
UTZ Code of Conduct. Responses were scored on a scale ranging from 0 (incorrect) to 1 (wholly
correct). The higher the number, the more farmers know and the higher level of skills they possess.
Data from interviews were cross-checked with the literature and the results of the producer surveys.
The preliminary results of the analysis were presented and validated at a workshop with
representatives from UTZ, IDH and Solidaridad in Amsterdam in October 2013, and with seven
representatives from trader companies, IDH, one service provider and five producer group managers
at a one-day workshop in Abidjan in October 2013. External influences, anticipated impacts and
lessons learned were also discussed in interactive working groups during the verification workshop.

LEI Report 2014-016 | 35
3 CPQP, certification and related
activities
3.1 Introduction
This section provides a description of the CPQP, certification and related activities implemented with
producer groups and their farmers, and the numbers of farmers and producer groups participating in
these activities. As UTZ certification is generally just one of many activities, some of which are
implemented prior to and alongside certification, farmers were asked if they are certified or not and,
if so, for how long, how long they had participated in which activities, and whether they are certified
by Rainforest Alliance or FairTrade International (FLO). These data were used to attribute any
differences in indicators to their certification status (and which certificate(s)) and to how long the
farmers had been certified. The data were derived from the farmer and trader questionnaires and the
literature.
3.2 CPQP activities in Côte d’Ivoire
Further to the general information provided in section 1.1, the CPQP promotes a variety of tactics and
tools to create change in cocoa production, focusing on four tools: good agricultural practices (GAPs),
standards systems, farmer aggregation, and financing mechanisms. The CPQP activities in Côte
d’Ivoire focus on four traders (Cargill, Ecom, Barry Callebaut and CEMOI) and one processing company
(Mars, enacted with their trader partners and in partnership with other organisations). The activities
are detailed in Table 8. Most of the activities funded by the programme begun in mid-2012 and
involve the up-scaling and out-scaling of current activities, as similar activities had been implemented
prior to the support of IDH and the CPQP and certification has been on-going since 2008. For example,
Mars and partners Cocoa Development Centres (CDC) and Cocoa Village Clinics (CVC) have been in
operation since 2011 and CEMOI has used controlled, village-based fermentation centres since 2009.
3.3 UTZ Certification
The UTZ Certified Code of Conduct for Cocoa (UTZ Certified 2009b; UTZ Certified 2009c) provides a
set of criteria for economically, socially and environmentally responsible production. The code sets
standards and provides guidance and facilitation. It is based on ILO conventions and principles of good
agricultural practices (GAPs). It covers production practices, GAPs related to cocoa farm establishment
and rehabilitation, farm maintenance, soil management and fertilisation, integrated pest management
and crop protection, and harvest and post-harvest product handling; the cocoa community’s health
and safety production practices and workers’ rights; natural resources and biodiversity protection and
maintenance. The code applies to organised groups of smallholder producers producing and selling
cocoa.
Certification must be carried out by a certification body approved by UTZ Certified. A ‘certificate
holder’ refers to the entity responsible for implementing and monitoring the requirements of the code.
This can be a group of producers (organised in an association or cooperative) or another entity that
buys the product from the producers and organises contracts and/or trains the producers according to
the code. The certificate holder applies for group certification and is responsible for the management
of an ICS. UTZ Certification requires that progress in meeting these criteria is demonstrated as part of
a management cycle, internal control system and auditing. The standard allows a low level of entry by
producer groups, as the number of minimum compliance requirements increases over a four-year
period. Internal and external auditing of compliance with the criteria occurs at multiple levels, via

36 | LEI Report 2014-016
a web-based traceability system. An ICS is a documented system of quality management that
manages aspects of the code and controls the producer’s fulfilment of the code’s requirements
according to the internally defined procedures. The code speaks of ‘producers’, referring to persons
who represent their farms towards the certificate holder and have responsibility for the products sold
by the farm. UTZ Certification has been implemented in Côte d’Ivoire through partnerships with eight
traders. These traders have partnerships with producer groups from which they purchase beans.
3.4 Rainforest Alliance certification
The Rainforest Alliance Certified™ seal demonstrates sustainable practices that conserve biodiversity
and improve livelihoods on farms managed to the standards of the Sustainable Agriculture Network
(SAN). Rainforest Alliance certification requires that cocoa farmers adhere to ten main principles of the
SAN Standard dated July 2010 and the SAN Indicators for Sustainable Cocoa Production in Côte
d’Ivoire 2009 (Sustainable Agriculture Network 2009). Certified farms are audited annually against the
environmental, social and economic criteria in the SAN standard. These include having a management
system (internal control system); ecosystem conservation; wildlife protection; good working
conditions for all employees, as defined by such international bodies as the United Nations and the
International Labour Organization; forced and child labour and all forms of discrimination and abuse
are prohibited; occupational health and safety programmes to reduce the risk of accidents; being
a good neighbour; eliminating chemical products that pose dangers to people and the environment;
soil conservation and long-term improvement; and practising integrated waste management.
Rainforest Alliance has been certifying cocoa farmers since 2006, first training them to conserve
natural resources, increase productivity, and secure decent living and working conditions. It has
implemented the certification programme together with traders and exporters. Around 80,000–85,000
cocoa farmers are now enrolled in the Rainforest Alliance certification programme in Côte d’Ivoire,4
with farms covering over 410,000 hectares.5 Farmers producing certified cocoas are paid a premium:
they receive half and the other half is retained by the cooperative (based on an agreement between
the farmer and cooperative, not fixed by Rainforest Alliance) which is used to provide services to its
farmer members or for community facilities.
3.5 Activities related to certification
The activities involved in UTZ, Rainforest Alliance and Fair Trade certification are generally similar in
terms of grouping producers, setting up and using internal control and traceability systems, auditing,
and training of farmers and payment of a premium. They are all based on sustainability claims, using
product labels as visible consumer communication tool. They use gradual, flexible compliance systems
with defined minimum criteria to be met by farmers to substantiate these claims. They pay producers
who are certified under the schemes prices that are comparably higher than those paid on the
conventional world market. Minimum prices and premiums are fixed at a global level for Fairtrade
products and negotiated on a generally higher level than for conventional products, with world market
figures for organic cocoa publicly available. Rainforest Alliance and UTZ Certified operate with
negotiable, non-fixed and not publicly available prices. Apart from their history, other major
differences are in the focus of the content of the schemes (SAN 2010), although a high equivalence
was found concerning the requirements of the standards regarding farming and environmental criteria
in a comparison of UTZ Certified, Rainforest Alliance and Fair Trade Labelling International (Vogel and
Schmitz-Hoffmann 2010).
Unique to the UTZ standard are requirements for actively involving external local stakeholders in
environmental community-relevant issues, more specific criteria for good harvest and post-harvest
practices; a hazard indication on all respective farming sites; an awareness and active communication
4 http://www.kenyalondonnews.org/?p=3014
5 http://thefrogblog.org/2013/10/24/a-behind-the-scenes-look-at-cocoa-farming-in-cote-divoire/

LEI Report 2014-016 | 37
of re-entry times after agrochemical application; a lead farmer to be nominated for monitoring labour
rights; the date of birth of workers to be implicitly documented; the specified treatment of
sharecroppers according to local norms; a reporting mechanism run by group management to prevent
the exploitation of children; and ICS and traceability criteria focusing on female attendance of training
programmes, employees, duties and salaries at group level; documentation of revenues and payments
to producers, transparent product pricing; recording complaints made within the group; regular
meetings at group level to sensitise producers on child labour, HIV, hygiene, workers’ rights and
women's rights and improvements of literacy within the group.
Table 5 provides an overview of the number of interviewed farmers participating in certification
programmes and the year in which they first became certified, and the total number of farmers
interviewed participating in UTZ and RA certification 2008 to June 2012.
Table 5
Farmers’ participation in certification activities.
Certification related to the CPQP CPQP participants
interviewed
Control group
interviewed
Total
No certificate 98 144 242
Single certification (UTZ or RA) 467 43* 510
Multiple certification (UTZ and RA) 165 27* 192
Total number of respondents 730 214 944
Sources: Farmer interviews 1 UTZ (data only available until June 2012 for 85 producer groups).
Table 6
Farmers’ participation in certification, training and other activities.
Type of activity CPQP participants Control group
Certification training 37% 27%
Farmer Field Schools (Champs ecole) 53% 30%
Field apprenticeship (Champs d’ apprentisage) 46% 16%
Production or nursery programme 19% 15%
Community or social programme 19% 13%
Source: Farmers interviews. Multiple responses possible.
Table 5 and Table 6 show that farmers in the control group indicated that they were also certified for
UTZ or Rainforest Alliance. This is apparent contradiction is attributed to three reasons. One is farmer
error (as many farmers had difficulty in recollecting which organisations had provided training).
Secondly, some farmers participated in training but subsequently did not become individually certified
and thirdly their producer group did not become certified. This finding also highlights the difficulties in
selecting control groups (addressed in the methodology chapter).
Table 7 provides an overview of different types of activities CPQP of participants that were supported
by cocoa traders. All of the traders have their own corporate social responsibility programmes
(summarised in Table 8), providing support and activities alongside and other than certification.

38 | LEI Report 2014-016
Table 7
Participation of CPQP participants in activities supported by traders.
Type of activity Participation by CPQP participants
Certification support 94%
Cooperative capacity building 81%
Farmer training in the field 44%
Pesticide supply and treatment gangs 36%
Schools and literacy classes 28%
Access to credit and saving schemes 27%
Pre-finance and credit advances 24%
Pre-audits 16%
Cooperative management skills 13%
Seedling supply 11%
Nursery and training 10%
Education 10%
Demonstration and pilots 7%
Fertiliser 7%
Social training such as on HIV aids, gender, etc. 7%
Business training 6%
Fermentation 5%
Infrastructure e.g. sanitation 4%
Gender training 1%
Source: Information from cocoa traders.
An overview of activities implemented by international organisations, Ivorian government agencies,
certification organisations, the private sector, research institutes, NGOs and partnerships relevant to
the CPQP aims and activities is provided in Table 18 in Annex 15. Further details are provided by
Hatløy (2012). This table highlights not only the many activities occurring, but the multiple partners
and similarity between these activities and those implemented as part of certification. This makes it
difficult to attribute changes in the indicators used in this study specifically to certification or to the
CPQP.
Table 9 shows that the majority of producer groups affiliated to traders interviewed participated in
certification and development activities. Compared to Table 6, these reflect that similar patterns with
certification and activities focusing on farmer development being the most common activities. There
are differences in the data presented in the two tables because not all farmers in a producer group
necessarily participate in training, and conversely, farmers sometimes participate in activities
organised by organisations and traders with which they are not specifically linked. Farmers were also
often not aware which organisations had provided training and services, or named the service provider
or trainer, rather than the financer. Interviewees also indicated that they were not always aware who
was running or financing an activity, with some mentioning the trader, their service provider or the
government. Interviewees asked family members or workers to attend training or participate in
activities, especially abunan and abusan landowners.

39 |
LEI R
eport 2
014-0
16
Table 8
CPQP, trader certification and related activities.
Producer group
capacity building &
certification
Training &
education
Farmer development Financial
support
Community development Proces
sing
Fermen
tation
CPQP
Business
skills
Demo plots Inputs Gifts Nursery’s &
seedling
supply
Credit Advance
purchase
Educa
tion
Infra
Struc
ture
Health
Cargill West Africa
Cocoa Sustainability Programme since 2003, Cargill Cocoa Promise since 2012 with in-house team
Forming & capacity
building of producer
groups with
Solidaridad since
2008. UTZ & RA
Certified cooperatives.
Collaborates with
Mars6, Nestle
7 and
KRAFT8.
Farmer training
initiatives since 2003.
Since 2009, 900 people
trained in FFS field
schools – since 2009,
900 people attended
FFS, provided by
ANADER
Support via CPQP
Cooperative
academy to
commence in
2013
Also with
support via
CPQP
Since 2012
provide CDC &
CVCs in
collaboration
with Mars,
Solidaridad &
ICRAF, in
specific regions
Supply of crop
protec-tion
chemi-cals &
training with
Syngen-ta &
ANADER,
500t of ferti-
lisers dis-
tributed with
support from
IDH CPQP in
2012
Provides
t-shirts
Since 2009
300,000
improved
seedlings
distributed
around Ganoua
and Danoa
since with
CENERA &
ANADER and
support of via
Nestle in 2006-
2007
Support via
CPQP to Mars
ICI
program
me in
schools &
with
canteens
ICI
program
me to
prevent
child
labour
40
Family
Schools
with
CARE,
IECD
from
2009 to
2011.
CPQP
since
mid-
2013
6 http://responsiblecocoa.com/our-solutions/
7 http://www.foodnavigator.com/Financial-Industry/Certified-sustainable-cocoa-source-from-Ivory-Coast-opens-up and http://www.fairlabor.org/blog/entry/nestle-gives-progress-update-consults-stakeholders
8 http://www.greenbiz.com/news/2009/10/30/krafts-purchases-rainforest-alliance-certified-cocoa-increase-ten-fold-2012

40 |
LEI R
eport 2
014-0
16
Producer group
capacity building &
certification
Training &
education
Farmer development Financial
support
Community development Proces
sing
Fermen
tation
CPQP
Zamacom (Ecom)
Since at least 2008 in-house, agronomy team (Akwacao) with 30 people
Since 2008 250
farmer leaders trained
& equipped with
transport and fuel, 24
producer groups
certified RA and UTZ
since 2008.
Also purchase from 6
non-certified groups.
Rabobank support9.
Training programme
for lead farmers who
train farmers in FFS for
7 months with de 2 FFS
per month and 40
farmers per CEP
Finances
‘’brigade
phyto‘’ to treat
trees in
partnership
with fertiliser
distribution
Train families to
manage
nurseries.
Support via
CPQP to Mars
Support
for
savings
schemes
Advance
payments
to
purchase
fertiliser.
School
constr
ucted
2008,
but no
tea-
chers
provi-
ded.
CPQP
support
since
mid-
2012
ADM
SERAP: Encouraging Socially and Environmentally Responsible Agricultural Practices programme since 2001 and with Starbucks since 2004/2005. In-house team
Since 2001 working
with producer groups,
70 co-ops in
programme by 2012.
UTZ, RA and Fairtrade
Certification.
Collaborates with IECD,
KIT, GIZ, ANADER. Also
with KRAFT10
.
Since 2002 training
on GAPs, labour
practices, farm
safety, and product
quality. Participate in
STCP
Nestle tree
project since
2011.
Since 2002
operational
transparency
training
Participating in
IDH fertiliser
programme in
2012
Nestle tree
project since
2011.
Participate in
STCP.
Since
2005,
provided
tens
of
millions
in
revolving
funds
Since
2005,
$10
million
in grower
premiums
, $4
million in
seed
money,
Partner
ship with
co-ops &
IECD on
school
ing
program
mes &
canteen.
Partner
in ICI
elimin
ate child
and
forced
labour
OICI
with
support
bore-
holes,
wells,
medical
centres,
bridges
Since
2001
malaria
& HIV/
AIDS
preven-
tion
program
Collabor
ation in
WCF
Cocoa
Liveli-
hoods
Program
me.
9 https://www.rabobank.com/en/rabo_development/advisory_projects/Ivory_coast.html
10 http://www.greenbiz.com/news/2009/10/30/krafts-purchases-rainforest-alliance-certified-cocoa-increase-ten-fold-2012

41 |
LEI R
eport 2
014-0
16
Producer group
capacity building &
certification
Training &
education
Farmer development Financial
support
Community development Proces
sing
Fermen
tation
CPQP
OLAM
Olam Livelihood Charters since 2010
In 2010 started with 10
now have 20 UTZ
Certified cooperatives.
Also some RA certified.
60,400 farmers
trained in GAPs & IPM
via FFS. Traceable
sustainability Training
programme with
Blommer & Costco.
9,900 farmers
received
Business
Training
CDCs with
Mars &
ICRAFT
Supplied 25 t
pesticides, 210
solar dryers & 1
cooperative
store opened in
2012
T-shirts
provided
and
Cooperati
ve Award
Scheme
via Nestle
supported
Cocoa Plan
with
Costco,
UTZ &
MARS
distributed
1.3 million
improved
seedlings &
shade
trees since
2009 to
13,000
farmers,
44
cooperativ
e
nurseries.
$88.7
million 0%
interest
working
capital to
co-ops for
crop
purchase &
$1.25m
interest
free loans
WCF &
Echoes
program
me
children
& adult
literacy
classes,
250
family
support
scholarsh
ips
awarded
1 water
pump, 1
medical
Labora-
tory, 4
Schools,
3 Health
centres,
1
Mater-
nity Unit
$250,000
3 pro-
jects in
2011/12
and 8 in
2012/13
6,230
farmers
trained
re child
labour &
AIDS
aware-
ness
Cocaf Ivoire (Noble)
Since 2010 with in house team
UTZ, RA and FairTrade
certification of producer
groups. Côte d'Ivoire
Alliance of Farmers,
Olam International and
Blommer Chocolate
(CIFOB) programme11
since 2011 based on RA
certification.
Training on GAPs via Nestle,
improved
seedlings and
trees since
2009
Social
projects,
Part of
WCF
Cocoa
Liveli-
hoods
program
11
http://www.csrwire.com/press_releases/31579-Largest-Cocoa-Shipment-from-Africa-s-Ivory-Coast-Destined-for-Blommer-Chocolate
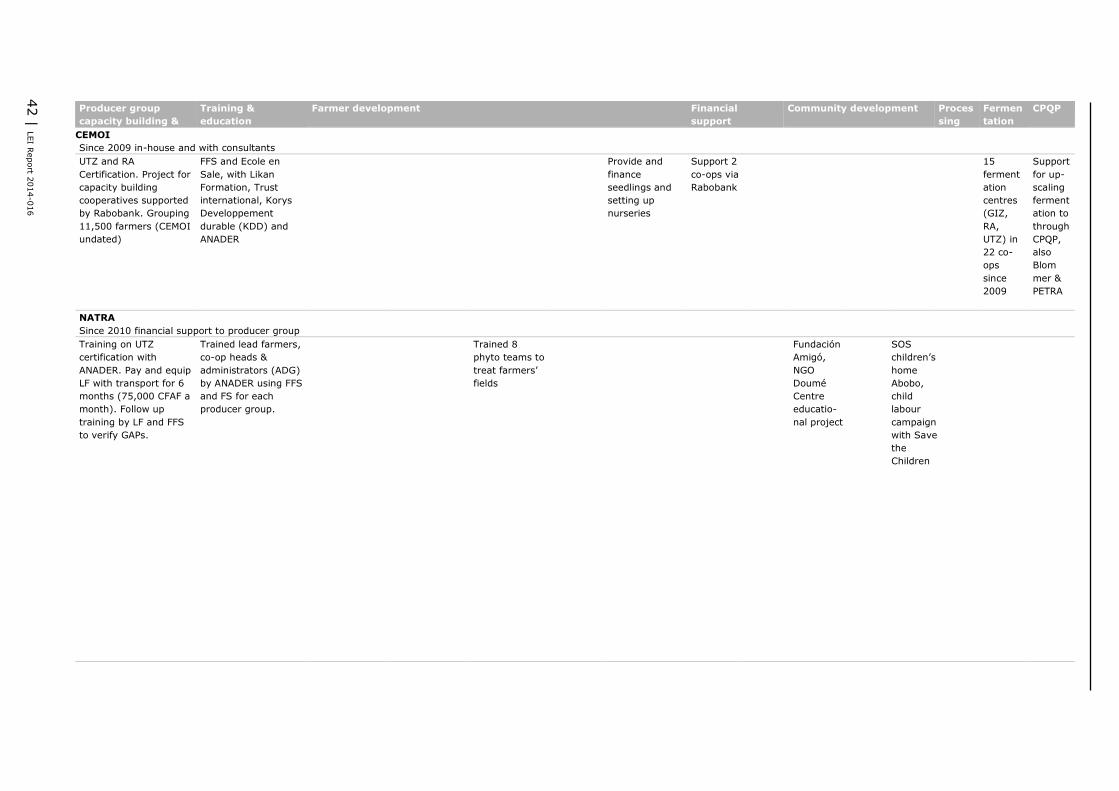
42 |
LEI R
eport 2
014-0
16
Producer group
capacity building &
certification
Training &
education
Farmer development Financial
support
Community development Proces
sing
Fermen
tation
CPQP
CEMOI
Since 2009 in-house and with consultants
UTZ and RA
Certification. Project for
capacity building
cooperatives supported
by Rabobank. Grouping
11,500 farmers (CEMOI
undated)
FFS and Ecole en
Sale, with Likan
Formation, Trust
international, Korys
Developpement
durable (KDD) and
ANADER
Provide and
finance
seedlings and
setting up
nurseries
Support 2
co-ops via
Rabobank
15
ferment
ation
centres
(GIZ,
RA,
UTZ) in
22 co-
ops
since
2009
Support
for up-
scaling
ferment
ation to
through
CPQP,
also
Blom
mer &
PETRA
NATRA
Since 2010 financial support to producer group
Training on UTZ
certification with
ANADER. Pay and equip
LF with transport for 6
months (75,000 CFAF a
month). Follow up
training by LF and FFS
to verify GAPs.
Trained lead farmers,
co-op heads &
administrators (ADG)
by ANADER using FFS
and FS for each
producer group.
Trained 8
phyto teams to
treat farmers’
fields
Fundación
Amigó,
NGO
Doumé
Centre
educatio-
nal project
SOS
children’s
home
Abobo,
child
labour
campaign
with Save
the
Children

43 |
LEI R
eport 2
014-0
16
Producer group
capacity building &
certification
Training &
education
Farmer development Financial
support
Community development Proces
sing
Fermen
tation
CPQP
Barry Callebaut (SACO)
Quality Partner Programme (QPP) since 2010 with In-house team of 23 people
Finance initial
inspection and pre-
audit by Ede
Consulting. OCOA
Raison, and for Bureau
Veritas/IMO to conduct
audits.
Follow up and technical
support by 28-person
team of agro-
technicians based in the
zone with 8 Co-ops
provide audit, training,
maps.
Started UTZ
Certification with 7 co-
ops and by 2011 54 co-
ops (47 to 60 co-ops
with 12,000 farmers
RA12
since 2005, 6 co-
ops UTZ with 300
members) and 6
traitants UTZ Certified,
18,000 farmers by
2012. Also buy FLO-
CERT cocoa.
Since 2010 6
producer groups work
with FFS and ANADER
youth training with
AGE for 1 co-op),
work with a group of
innovative farmers,
support for
warehouse stock
managers, provided
management
consultants,
for auditing ad
accounting
since 2008
business
training &
producer group
management
and assist with
ICS.
provided by
NGO Socodevie
to 90 co-ops
Provide phyto
spraying team
Support for
nurseries and
replanting with
selected
cooperatives
Support
for revol
ving
funds
with
selected
cooperat
ives
Prefinanc
es 100%
with 50
% paid
by
farmers
& 50%
by
cooperati
ve.
Provide
materials
&
transport
means
for
cooperati
ves.
In
partner
ship with
co-ops
provided
school
kids
centre,
schools,
In
partner
ship with
co-ops
provided
wells,
partners
with co-
ops for
medical
centres,
vaccina
tion
camp
aign,
sports,
co-
finance
sports
events
CPQP
since
mid-
2012
Also via
support
to
partner
Biopart
enaire
Sources: Producer group and trader interviews, and company literature (Global Witness 2007; Rosenberg et al. 2009; ADM 2011; Blommer 2011; Cargill 2011; Cargill 2012a; Cargill 2012b; COSA 2012; NCA 2012; Paschall and Seville 2012;
WCF and IDH 2012; NATRA 2013; Noble Group 2013a; Noble Group 2013b; Noble Group 2013c; Cargill undated-b; Cargill undated-a).
12
http://worldcocoafoundation.org/barry-callebaut-pays-chf-2-8-million-in-premiums-to-cote-divoire-cooperatives-for-rainforest-alliance-certifiedtm-cocoa/

44 |
LEI R
eport 2
014-0
16
Table 9
Cooperative’s participation in certification, training and other activities.
Type of
activity
Certification Farmer development Inputs Pre-finance &
credit
Community development Proce
ssing
Pre-audits Certifica
tion
support
Producer
group
capacity
building
Farmer
training
in-field.
FFS,
FS)
Gender
training
Nursery
&
training
Manage
ment
skills
Business
training
Demonst
ration &
pilots
Seedling
Supply
Fertilise
r
Pesticid
e
supply,
treatm
ent
gangs
Pre-
finance
advance
Access to
credit/sa
vings
schemes
Educati
on
Social
trainin
g
Infras-
tructur
e
Schools
& literacy
Ferme
ntation
% of 90
producer
groups
affiliated to
traders
6% 88% 80% 27% 1% 8% 4% 4% 6% 10% 6% 20% 13% 16% 8% 6% 4% 13% 5%
% of 9
producer
control
groups
27% 46% 15% 13%

LEI Report 2014-016 | 45
4 Inclusiveness of CPQP and farmers’
characteristics
4.1 Introduction
This section responds to the first research question. This examines whether the CPQP is inclusive and
whether certified farmers are representative of Ivorian cocoa farmers, in terms of incomes, gender,
age, farm size and tenure and ethnic or migrant status. To determine this, the characteristics of CPQP
farmers are first presented. Inclusiveness is also determined by assessing whether knowledge and
benefits gained through the programme reach others working on farms, such as spouses, workers,
tenants, children, etc.
Box 1 Summary: Inclusiveness of the CPQP
The CPQP includes what appear to be typical Ivorian cocoa farmers in terms of their gender, age and
farms: the vast majority are older males with old cocoa trees on small farms. However, women have
not been focused upon specifically with 3% of CPQP respondents interviewed being female, despite being
a target group. Farmers participating in the programme have higher production, production costs and
quality, and similar incomes to the control group. As men typically own cocoa farms or have
sharecropping arrangements, they are most likely to be registered as a member of a producer group.
The CPQP therefore focuses mostly on male, cooperative members, which are not typical of Ivorian
cocoa farmers.
Women are involved in half of the activities taking place on cocoa farms, as are youths. But due to the
focus of certification based programmes on farmers registered with a producer group, women and youth
workers on cocoa farms appear to have been only marginally included in the programme. UTZ, some
traders and their partners in Côte d’Ivoire are aware of this issue and have started to address this by
focussing more specifically on women in a number of training and empowerment activities on a small
scale. As most farmers train others, including their wives, children and workers, knowledge relevant to
certification and GAP is passed on, however the extent to which this is implemented however is not
known.
4.2 Farmers’ characteristics
The main characteristics of CPQP participants are presented in Table 10. Compared to the control
group, farmers have a comparable number and size of cocoa farms. The vast majority are smallholder
farmers. However, compared to farmers in the control group, CPQP participants have statistically
significantly13
older cocoa farms. Other statistically significant differences include higher levels of
production, higher production costs, higher productivity, better quality and higher levels of knowledge
of GAPs, and spending statistically significantly less on crop production products (shown in Table 14)
and lower production costs (see Figure 54 and Figure 55). Net cocoa income, household income and
income from other sources were all similar.
A small proportion of farmers (2%) had a net negative income from cocoa. These differences might be
explained by the time delay between learning and implementing new practices, and then seeing
increases in productivity (i.e. from replacing old trees and GAPs). Whilst these activities result in the
more accurate application of inputs, and thus lower the costs of production inputs, total production
13
See Annex 4 for explanation of statistical significance.

46 | LEI Report 2014-016
costs per kg increase as more time is spent on the farm and applying GAPs. Negative income may
often not be apparent for farmers, as costs are incurred over the course of a year or more. Income,
however, is generally received at the end of the harvest season(s).14
Many farmers do not keep
records of all production costs for all their fields and farms. This may also be the result of a selection
bias whereby more advanced farmers and cooperatives are the first to be invited to join sustainability
and certification programmes.
In the focus groups, 85% of the interviewees (men, women and youths) said that the higher income
resulting from the higher production of cocoa means that there is now more money to spend on family
needs. Youths interviewed stated that higher income has allowed more money to be spent on their
education needs. There is no evidence of specific benefits accruing to (male or female) labourers.
Most women in Côte d’Ivoire, as in much of West Africa, are not land owners and thus do not have
direct control of cash crops, including cocoa farms, and are not directly able to influence major
household and economic decisions (Gray and Kevane 1999; Doss 2002; IIPRI 2002). The stakeholder
surveys also confirmed that generally, Ivorian women do not hold land titles. Discussions in the
verification meeting suggest that this is gradually changing. Although there is little literature on the
specific situation in Côte d’Ivoire and more on West Africa, literature (Gray and Kevane 1999; Doss
2002), respondents and traders all indicated that there are fewer independent women also due to
ethnic and cultural differences. Independent, female farm owners were more prevalent in the Sud-
Comoé region near the Ghanaian border, where a number of all-female cooperatives are also active.
Demographic characteristics
Compared to benchmarks provided by other studies, similar patterns emerge in terms of basic
demographic characteristics. Cocoa farmers were reported as being mostly older men with an average
age of 49 (FSG 2009). The number of household members for which a farmer is responsible tallies
with other studies (Ruf 2007). Compared to the control group, farmers participating in the programme
are of a similar age and sex: the majority of both being male. Literature indicates that female farmers,
however, have a lower average age (35) and tend to be household heads (UTZ Certified and
Solidaridad 2009). Such differences can be explained by the traditionally large age differences
between husbands and wives (leading to a high number of widows), male mortality from AIDS and
war, and male urban migration. However, it is low compared to estimates.
Whilst the number of independent women cocoa farmers in Côte d’Ivoire is unknown, estimates
indicate up to 20% of farmers may be female (International Institute of Tropical Agriculture 2006).
Reports (UTZ Certified and Solidaridad 2009), focus group discussions and interviews, indicate that
women in most cocoa growing households contribute to many aspects of crop production, particularly
doing such work as field preparation, weeding, planting, transport from the field, drying and sorting.
Keladoué (2010) indicates that female labourers provide between 48% and 69% of farm labour.
According to Oxfam (2013), at least 180,000 small-scale cocoa farmers in Côte d’Ivoire are women,
and many more work on cocoa farms as labourers. Women, however, are the ‘invisible cocoa farmers’
(UTZ Certified and Solidaridad 2009).
In focus group discussions, women indicated their lack of awareness of and involvement in support
activities and certification. It is indicative that that 20% of the people participating in the focus group
discussions were women. However, women do benefit from cocoa income or when income from cocoa
increases. Among the wives of farmers participating in focus groups, about 65% indicated receiving a
larger proportion of cocoa income and 4% had received land to grow cocoa. Some 10% of the women
in focus groups reported not seeing any statistically significant change in their livelihoods since the
inception of the UTZ programme, and about 25% of the women indicated that there were no
community programmes in place to support income generation activities for them.
14
Harvesting is conducted almost year round, but there are generally two peak times in the year with the main harvest at
the end of the wet season, from January through March, although seasons can vary.

LEI Report 2014-016| 47
Few differences were noted between the ethnicity of farmers in the programme and the control group.
Whilst farmers from many ethnic groups participate, Baoulé farmers dominate. This is similar to Ruf
and colleague’s (2013) study of Rainforest Alliance (RA) certified farmers, which found that, probably
unknowingly, certification agencies articulate their activities towards the dominant social structures,
which are ethnically influenced. The Baoulé dominate RA certification because they were the first to
organise themselves into cooperatives. Farmers from Burkina Faso represent 23% of certified farmers.
Cooperative membership
Due to the study design, all surveyed farmers were members of cooperatives. This does not reflect
the situation of the average cocoa farmer in Côte d’Ivoire. Current, accurate figures on the number of
cooperatives and members are difficult to obtain, with official sources listing only 32 approved
cooperatives in the 2013/2014 season.15
It is estimated that around 30% of cocoa production
originates from cooperatives.16
The popularity of collective action has seen peaks and waves, related
to encouragement and facilitation by the state, private sector and projects, and a general interest in
cooperatives (Amoah 2009; Paschall and Seville 2012). With the current increasing popularity of
different certification schemes and their approach of including cooperatives, certification has been
a major driver behind the renewed formation of cooperatives. On average, farmers had belonged to
a cooperative for 4.5 years and 75 % of all farmers had become a member since 2008.
Quotations 1 Inclusiveness
Female farmer, Duékoué: Thanks to certification, my husband gives me more money.
Male farmer, Daloa: Yes, we share our gains with our wives. There are some farmers who have given
a piece of their cocoa farm to their wives.
Young farmer, Guitry: I would like to give a piece of my farm to my wife but I cannot. I have only two
hectares; if I give a share of it to her, I will not be able to fill my family needs.
Male farmer Dagadji, San-Pedro: Yes, I train my wife, as she is part of my labour force and certification
requires training all the people who work on the farm.
15
http://www.conseilcafecacao.ci/index.php?option=com_content&view=article&id=78&Itemid=147. 16
http://www.bloomberg.com/news/2013-10-24/ivory-coast-cocoa-cooperatives-delay-buying-on-funding-troubles.html.

LEI R
eport 2
014-0
16| 4
8
Table 10
Key data on farm and farmer characteristics of CPQP participants.
Indicator Unit of measurement Results Statistically
significant difference a between CPQP
participants and
control group
Mean Median Standard
deviation
Minimum Maximum Numbe
r of
respon
dents
Age No. of years 46 45 11.76 20 83 708 0
Gender % male 96% 725 Too few women for
meaningful analysis
Number of persons the
farmer takes care of
Number 13 11 10.14 0 170 715 0
Position in household % 91% household head, 4%: wife, 2.2% other adult, 3.1% child 715 Not analysed
Particular position in
community
% Traditional authority 63%, religious leader 9%, family or clan head 1%, producer group 9%, lead farmer
4%, trader 1%, youth group leader 14%, School teacher 1%
176 Not analysed
Migrant status % 10% first generation immigrants (92% Burkinabé, 8% Malian)
10% 2nd generation immigrants (92% Burkinabé, 8% Malian)
623 Not analysed
Ethnicity % of ethnic groups 28 ethnic groups: of total Baoulé 46%, Attie 24%, Guéré 6%, Bété 5%, Senoufo 3%, others >1% 623 Not analysed
Membership producer group Number 100% 725 0
Farm ownership % 74% founder, 20% inherited, 6% manger, 1% other. 721 Not analysed
Knowledge levels Score, scale 0-1 0.24 0.22 0.11 0.03 0.65 722 +
Implementation of GAPs Score, scale 0-1 0.24 0.24 0.05 0.08 0.43 722 +
Number of cocoa farms Number 1.16 1.00 0.48 1.00 5.00 717 0
Cocoa farm size (all farms) Hectares (estimated by farmers &
known measured)
5.34 4 4.61 0.5 39 717 0
Cocoa farm size (all farms) Hectares (measured) 3.70 3.00 2.91 0.6 18.77 99 Not analysed
Age of main farm No. of years since establishment 21 19 10.65 3 70 675 -
Cocoa production (main
farm)
Kg 2,202 1,500 2,183 10.00 23126 678 +
Cocoa production (all
farms)
Kg 2,326 1,500 2,959 0.00 39,500 725 +
Total labour costs* CFAF per hectare 118,123 89,759 91,099 666 726,678 720 0
Total input costs CFAF per hectare 39,152 11,891 39,000 0.00 230,000 725 0
Input costs (fertilisers) CFAF per hectare 18,750 9,323 19,000 0.00 200,000 725 0
Input costs (pesticides)a CFAF per hectare 16,017 4,015 16,000 0.00 83,000 725 0
Input costs (fungicides) a CFAF per hectare 1,094 1,167 1,000 0.00 21,000 725 -
Input costs (herbicides) a CFAF per hectare 3,201 2,107 3,000 0.00 30,500 725 -
Input costs (planting
material) a
CFAF per hectare 91 978 0.00 0.00 15,000 725 0
Total production costs c CFAF per hectare 157,275 91,554 128,341 35,303 766,678 720 +

LEI R
eport 2
014-0
16| 4
9
Indicator Unit of measurement Results Statistically
significant difference a between CPQP
participants and
control group
Mean Median Standard
deviation
Minimum Maximum Numbe
r of
respon
dents
Total production costs per
kilogram
CFAF per kg +
Productivity (main farm) Kg per hectare +
Productivity (all farms) Kg per hectare 453 377 379 0 4500 717 +
Cocoa farm efficiency Economic input/output ratio 12.16 8.21 13.23 0.14 91.39 519 0
Gross income from cocoa
(all farms)
CFAF per year 1,858,918 1,120,000 2,316,769 7250 28,637,500 521 0
Gross income (main farm) CFAF per year 1,612,846 1,087,500 1,607,406 7250 13,875,600 520 0
Net cocoa income CFAF per year 1,461,073 958,242 1,597,884 -195730 13,677,734 519 0
Gross income from other
sources
CFAF per year 267,325 0 2,011,366 0 52,000,000 725 0
Gross total household
income d
CFAF per year 2,345,894 1,499,300 3,654,155 300 64,800,000 566 0
Cocoa quality % of farmers whose beans are
rejected by producer group
2.1% 705 -
Farmer’s reported
satisfaction with livelihood
Farmer’s reported perception +
Notes: a Cost calculated based on costs for the main cocoa farm only. b Cost calculated based on costs for the main cocoa farm only. c Total production costs comprise labour costs and input costs. Where input costs were not provided these were
calculated by median costs per cost type.d Based on farmers reported income net cocoa income and gross income from other sources. e Due to the large number of different community and household positions, migrant status and ethnicities,
further analysis was not conducted as the small size of these different groups not allow provide sufficient statistical basis for meaningful analysis.. f The study design and sampling did not include farmers who are not members of cooperatives,
as these were not felt as comparable with the UTZ programme farmers.
Key: + Significant positive difference, - Significant negative difference, 0 No significant difference.

50 | LEI Report 2014-016
4.3 Representativeness of CPQP participants
The goal of IDH is to reach farmers who can benefit from their programme. The theory of change
underlying the programme implies that these may not the poorest farmers and may well be not
representative of farmers in Côte d’Ivoire, as for example, lead farmers who were able to train and
support others are targeted through UTZ Certification, and likewise, farmers organised into
cooperatives were initially targeted by traders, as well as those willing to join cooperatives to benefit
from the programme. It also aims to target female owners of cocoa farms.
Comparing farmers participating in the CPQP to the control group and to benchmarks in literature, and
feedback from the validation workshop, it is concluded that the farmers in the sample are similar to
the average farmer in the Ivorian cocoa sector in terms of age and farm size. The major difference is
that all farmers are members of a producer group. This was to be expected because farmers who in
the process of becoming UTZ Certified need to be a member of a producer group, and the control
group was selected to mirror the target group. Another anomaly is that activities directly focussing on
the certification programmes (and the majority of associated activities) have targeted registered
producer group members who own or sharecrop farms. These are generally male. Female and younger
labourers have had less opportunity to be included, as 97% of farmers interviewed were male. This
means that the programme has inadvertently excluded women and youths, despite its aim to target
female owners.
In Ghana, workers under different types of farm ownership experience the benefits of certification
differently (de Jong 2012), and a similar situation is expected to exist in Côte d’Ivoire. Due to the
design and target group of the study, workers were not interviewed.
UTZ, Solidaridad and Cargill have been aware of the gender issues in cocoa farming since 2009
(UTZ Certified and Solidaridad 2009), and a number of activities have been implemented. However,
this does not yet appear to have resulted in up-scaling by implementing partners to include female
and youth workers and farmers in certification and related activities. By focussing on producer groups,
unorganised farmers are only able to structurally benefit from programme activities if they are
organised. Whilst a producer group focussed strategy has been effective in reaching large numbers of
farmers and aiding access to traders to both sell their produce and receive support services in the last
five years, farmers’ and producer groups’ comments indicate that further support to strengthen and
professionalise producer groups is essential to ensure that this strategy succeeds.
Some traders and partnerships such as the STCP (International Institute of Tropical Agriculture 2006),
and Solidaridad in conjunction with Cargill, have addressed women’s role on farms specifically (see
Table 18). The number of such activities and women targeted are however small. They have targeted
women and used innovative methods to train and empower them, which were reported as being
appreciated by female farmers.
4.4 Extent that knowledge and benefits reach others on
certified farms
Most UTZ programme participants (835) trained others after receiving training as part of the UTZ
programme. About 30% trained their wives and 30% their children, 17% trained their workers and
5% trained other farmers, whilst 17% reported not training anyone. This finding indicates that despite
the small proportion of women being directly involved in the UTZ certification programme, the
programme has indirectly had a potential impact on more women, as lessons and training have been
passed on. The extent to which women, workers and other farmers implement this training on certified
and non-certified farms is not known, as these people were not interviewed.

51 | LEI Report 2014-016
Quotations 2 Engaging female cocoa farmers and workers
Cooperative manager, Guitry: There are no community programmes addressing the improvement
of women’s wellbeing and empowerment. Only female certified farmers benefit from the services
of the co-op in the same way as certified male farmers.
Photo 1 Women drying cocoa beans.

52 | LEI Report 2014-016
5 Influence of certification and other
activities on knowledge and practices
of cocoa farmers
5.1 Introduction
This section responds to the second research question. It presents the findings on how certification
and other activities of implementing partners influence knowledge (of GAPs, social and
environmental issues in line with the code of conduct) and related behaviour/practices of cocoa
farmers in Côte d’Ivoire and the results of these in terms of a better life, income, crops and
environment.
In this chapter, information is presented on the baseline situation of the CPQP participants. This
baseline generally concerns activities they have already participated in, as presented in Chapter 3.
Information from quantitative and qualitative analyses that were based on the survey of 944 farmers
and on interviews with 24 stakeholders and 10 focus groups is presented. The quantitative analyses
provide an indication of the status of participants and the potential impact of previous activities. A
proxy has been established by comparing differences in indicators with between CPQP farmers and
the control group and between farmers with different certification status (non-certified, single
certified, multiple certifications). It thus cannot be established whether the differences and
correlations found are due to the implementation of the activities, other external factors or due to
a selection of CPQP participants, highlighted in Chapter 4. The quantitative impact of the CPQP can be
established using subsequent measurements in the future.
Box 2 A word of caution about attributing impacts to the CPQP
The multitude of prior and parallel activities that seek – directly and indirectly - to improve the crops,
lives, incomes and environment of Ivorian cocoa farmers make it impossible at this baseline stage of the
impact assessment to attribute impacts found to the CPQP, certification or other activities. Care therefore
needs to be exercised in interpreting impacts and attributing causality. The CPQP impact logic also
recognises that other projects, programmes and interventions may affect performance on key indicators
and acknowledges that including certification related interventions and relevant knowledge and skills may
have been acquired prior to participation in the CPQP. In subsequent impact assessments, causality can
be better attributed now that this baseline has been established.
5.2 Impact on knowledge levels of good agricultural
practices
This section responds to the second research question. It presents the findings on how the certification
and related activities of implementing partners influence knowledge (of GAPs, social and
environmental issues in line with the UTZ Code of Conduct) and the related behaviour/practices of
cocoa farmers, and the results of these in terms of a better life, income, crops and environment.
Information from two types of analyses is assessed: the quantitative and qualitative analyses based
on the survey with farmers, and quantitative and qualitative analyses based on interviews with
stakeholders and focus groups. The quantitative analyses provide an indication of potential impact.
As only one measurement has been undertaken, the evolution over time of the indicators cannot be
reported upon. A proxy has been established by comparing differences in indicators with the control
group of uncertified farmers and examining differences in indicators for farmers at different phases of

53 | LEI Report 2014-016
participation in the programme. Box 2 explains the difficulties in attributing the differences,
correlations and trends over time found to the implementation of the programme.17
The quantitative
impact of the programme can be determined in future assessments.
Box 3 Summary: Contribution towards increased knowledge and practices
of cocoa farmers
Measured using indicators about knowledge and implementation of good agricultural, social and
environmental practices, overall knowledge and implementation of GAP, record keeping and biodiversity
conservation practices is generally higher among farmers participating in the CPQP than farmers in the
control group, who are not participating. It is not possible to attribute these to the programme or
certification, as differences may be explained by a farmers’ knowledge prior to joining the programme
(which was not measured). CPQP farmers’ knowledge was however low concerning methods for applying
fertilisers, weeding, soil fertility and record keeping. The weakest areas of implementation of GAPs were
on cocoa pod management, field management, soil and water conservation, inputs and fertiliser use, tree
and vegetation management on farm, and on-farm waste management.
Knowledge levels were predicted in the impact logic to improve with training and increased
participation in the CPQP. Even though the knowledge levels of CPQP farmers are higher than those of
the control group, knowledge levels were relatively low, with maximum averages of 0.25 out of 1
(see Figure 10 and Figure 11), indicating that 25% of all questions on good agricultural practices and
the UTZ Code of Conduct were answered correctly. Certified farmers have a higher knowledge level
than non-certified farmers. Surprisingly, there was a negative association between knowledge and
participation in farmer field schools and field apprenticeships, with participants having a lower
knowledge level than non-participants. This finding is difficult to explain, but may be due to the
farmers initially invited to participate in trader’s programmes having high or higher levels of
knowledge.18
Knowledge levels were also associated with other variables. Positive associations (shown in detail in
Figure 80) were found between farm size and knowledge levels: the larger the main farm and the size
of all farms, the higher the knowledge level. Farmers in the excellent agro-ecological zone have higher
knowledge levels than farmers in good or marginal zones. These two findings may be explained as
farmers have the possibility to apply their knowledge and benefit from slight efficiencies in scale and
a more favourable environment for growing cocoa. Members of a producer group have higher
knowledge scores than farmers who are not members. An explanation for this was provided in the
stakeholder interviews, where farmers indicated that membership facilitates exchanges between
members (see Figure 78).
Farmers’ perceptions of the GAPs about which their knowledge had increased most were weeding
(26% of farmers), pruning (26%), crop protection control (21%), phytosanitary harvesting techniques
(16%) and fermentation and drying (11%) (shown in Figure 14). Producer group managers indicated
that farmers face problems implement pruning according to GAPs and require follow-up training.
17
Unanticipated impacts are presented in section 6.4. 18
So-called low hanging fruit, where traders invited groups with which they already had good relationships and good
experiences as the first to join their programmes, then expanding the programmes to other groups.

54 | LEI Report 2014-016
Quotations 3 Impacts on knowledge
Male farmer, Guitry: Before, I produced between 500 and 800 kilos from two hectares; last season,
I produced one tonne. With certification, we learned to love our plantations. Before, we hardly put our
feet there. It was a job for labourers. Now we go more often.
Male farmer, Diegonefla: Yes, we have learned how to prune, to weed, to harvest in time, to have a good
fermentation, to dry, to select... and the impact has been an increase in production and decrease in plant
diseases.
5.3 Impact on the application of good agricultural
practices
CPQP participants and certified farmers implement GAPs better than farmers in the control group and
farmers who are not certified, as shown in Figure 12 and Figure 13. However, as with knowledge
levels, farmers’ levels of implementation of GAPs are quite low with an average of 0.24 out of 1.
Farmers with higher knowledge levels implement GAPs in a better way than farmers with lower
knowledge levels. Other factors that have a positive relationship with the implementation of GAPs are
UTZ certification, membership of a producer organisation, ownership status (managers implement
GAPs better than other types of owners), and farmers in the excellent agro-ecological zone also
implement GAPs in a better way than farmers in the other zones. More information is provided in
Annex 12 on the implementation of the GAPs by programme participants.
Quotations 4 Implementation of knowledge of GAPs
Non-certified farmer, Guitry: I am not yet certified but I copy what my neighbours who are certified do,
as they apply good practices especially in terms of weeding.
Producer group manager Guitry: The internal inspection sheet allows us to evaluate what farmers have
learned from training and sometimes we adjust and do additional specific training. The first year, 171 out
of 250 farmers passed the evaluation; the second year, almost all of them passed. We have to follow
them carefully as it is only after several visits that they implement GAPs, such as dosing the right density.
We go smoothly since many of them are old.
Box 4 Summary: Social impact
Programme participants have generally higher levels of satisfaction with their livelihoods. Overall, farmers
were satisfied with the impact of certification and training on their livelihoods, in terms of increased
production, increased revenue, and helping farmers to better cater for their family needs.
In 2012, the average price received by farmers for a kilogram of cocoa was 725 CFAF, with no differences
between the farmers in the control and those in the CPQP. This amount did not differ between the
different types of buyers. All certified farmers had received a premium, on average 50 CFAF a kg. The
premium was stated to be the most important motivation for farmers to become certified and to sell to
producer groups, in particular in the earlier stages of participation in the programme when productivity
and quality increases have not yet materialised.
Farmers were between neutral and satisfied with the services delivered to them by their producer groups.
However, 40% of farmers were not satisfied and proposed areas for improvement, particularly providing
access to inputs and credit.
Generally, labour rights are not well respected by any of the farmers, although certified farmers have
slightly better performance than non-certified farmers or farmers in the control group.
55 | LEI Report 2014-016
Farmers knowledge on correct child labour practices and rights is low, and children perform activities on
certified farms that they should not be performing, albeit on a small scale.
CPQP participants and certified farmers had better knowledge and implementation scores than their
counterparts on safe working conditions. However, their low knowledge and implementation levels about
personal protective equipment indicate that improvements could be made.
5.4 Social impact
Livelihoods and standard of living
Certified farmers indicated that they are more satisfied with their livelihoods than non-programme
participants and farmers who are not certified (Figure 15, Figure 16 and Figure 17). Interestingly,
the median satisfaction level is higher than the mean, indicating that some farmers are very
unsatisfied with their livelihood, which negatively influences the mean.
Satisfaction levels are influenced by several factors. Increasing knowledge levels, farm size and
productivity are related to increasing satisfaction levels, and UTZ or RA certified farmers are more
satisfied than non-certified farmers. Farmers in the excellent zone are generally more satisfied than
farmers in the other zones, and farmers in good zones are generally less satisfied. Negative
relationships have been found between the number of people in the household, participation in a
certification programme or ‘other’ programme and satisfaction levels. Figure 15 shows that farmers
participating in the CPQP have higher levels of satisfaction on a range of livelihood indicators
compared to the control group. Future assessments will enable testing of whether this relationship can
be attributed to previous support activities or other factors.
Overall, farmers were satisfied with the impact of certification and training on their livelihoods, in
terms of increased production, increased revenue (thanks to the premium and to generally higher
prices paid by traders with whom they are linked), and in turn higher spending capacity for family
needs. They also indicated a positive outcome of increased collaboration among farmers. Farmers
stated that they used higher cocoa incomes to pay for everyday needs for the family, for children’s
schooling and clothes, and to reinvest in cocoa farming, as shown in Figure 18.
Quotations 5 Livelihoods and standard of living
Young farmer, Anouanzè de Duékoué: Our way of living has changed because we have changed the way
we do many things. For instance, we do not use empty boxes of chemicals any longer. We do not spray
in our fields anymore; it is now done by professionals.
Male farmer, San-Pedro: Before we treated ourselves, now it is the professional phyto sanitation service
that treats our fields and so we are less exposed to illnesses.
Male farmer, Daloa: The cooperative gave us a machine to spray but they have taken it back. We do not
know why because they have not told us. We share the pesticides but it is not sufficient. We three share
1 litre.
Most of the farmers (82%) had experienced an improvement in their living conditions since their
participation in a certification programme (see Figure 17), which shows that only a very few had
experienced a negative change. About half of the farmers indicated that no change had been observed
in the schooling situation for children (construction of schools, number of teachers, literacy
programme), but a third of the farmers indicated a change (Figure 20).

56 | LEI Report 2014-016
With regard to access to healthcare, farmers experienced changes (shown in Figure 21 and Figure 43)
similar to those in schooling: about half of the farmers said there had been no change, and one third
indicated a positive change. More UT programme participants indicated that there had been no change
in the healthcare situation than control group farmers, but fewer UTZ programme participants indicate
not knowing an answer to the question. Programme participants more often indicated a positive
change in access to inputs than control group farmers (Figure 22). Control group farmers indicated
more frequently no change compared to two years ago.
Do you share benefits with others?
More than half of the farmers share their benefits with their family members (see Figure 65). Even
though CPQP participants seem to share benefits more often with their family than control group
farmers, the difference is not statistically significant. No other statistically significant differences
between the groups were found.
The majority of farmers (92%) indicated a variety of positive changes noticed after certification, and
8% indicated no change. The most frequent response (33% of 474 certified farmers) was better farm
management due to GAPs, 16% indicated they had used their increased income to construct a house
or purchase a motorbike, 12% mentioned a better ability to plan and manage their incomes, 9%
increased production, 9% increased income, and 4% a general increase in living standards and health.
Others (all under 2%) mentioned increased money to spend on their children’s education, access to
inputs and a decrease in cocoa diseases.
Sustainable practices rewarded by the market
In 2012, the average price received by farmers for a kilogram of cocoa was 725 CFAF. This amount
did not differ between the different types of buyers: producer groups, pisteurs, independent traders
(commercants) and other buyers. This may be linked to the 2012 price reform. Most farmers in the
focus groups indicated that they are satisfied with the result of the fixed price reform. Most farmers
(70%) sold their cocoa to their producer group, 14% sold to pisteurs, and hardly any farmers (2%)
sold direct to traders or to other buyers.
484 farmers reported having received a premium for their cocoa. Whilst all certified farmers reported
receiving premiums, not all programme farmers had reached the stage of receiving payment and
premium for certified beans. Most farmers (69%) reported receiving a premium of 50 CFAF per kg,
27% received a premium of 30, 35 or 40 CFAF. The reason for the differences in premiums is that
producer groups pay out different levels of premium to their farmers, as some producer groups deduct
an amount agreed with their members to finance producer group operations and community activities,
such as schools, wells, roads, health centres, etc. Figure 24 shows the very small differences (2 CFAF)
between the premiums received by farmers having one or two certificates. Although the premium is an
incentive for farmers to become certified, it is a small part of the total price, representing 7% of the
total kilogram price. The premium stated to be one of the most important motivations for farmers to
become certified and to sell to producer groups (by 28% of farmers), in particular in the earlier stages
of participation in the programme when productivity and quality increases have not yet materialised.
Some traders and producer groups also indicated it was a major incentive, using it to focus attention
on and celebrate certified farming and their trading relationship, for example during a ceremony to
distribute the premium. However, over 90% of respondents in the focus groups perceived that the
premium does not sufficiently cover their costs to produce certified beans, particularly costs for labour
and the inputs required to obtain a certificate.

57 | LEI Report 2014-016
Quotations 6 Market rewards
Male farmer, Daloa: The producer group pays cash, like the pisteurs, and on top it gives a premium,
so we prefer to sell to the producer group.
Male farmer, Fiédifouê: It is thanks to the premium and inputs from the producer group that everybody
wants to be certified.
Male farmer, San Pedro: We would like to sell to the producer group because we gain the premium and
training – for example on the layout – and the distribution of inputs, of cars for transporting cocoa or sick
people in the case of emergencies.
Stable producer groups providing better and reliable social services
Farmers report feeling between ‘neutral’ and ‘satisfied’ with the services delivered by their producer
groups, as shown in Figure 25, Figure 26 and Figure 27. There are no observable differences in the
satisfaction level between CPQP participants and the control group. Certified farmers are more
satisfied with the services provided by their producer group, but the difference is not statistically
significant.
Quotations 7 Stability of producer groups, services provided and access
to market
Manager producer group: Yes, the farmers are listed according to their needs and the cooperative
provides them with credit and working material, but it is not enough. We also act as intermediary and
we stand guarantee when farmers want to access credit to buy phytosanitary products.
Producer group manager: They are satisfied ; they don’t complain. The training helped to increase
the production by 30 to 40%.
Producer group manager: Yes, the income has increased as the production increased because of
the application of good agricultural practices
In the focus groups, farmers stated they were generally satisfied with the services provided by their
producer group. However, 40% of farmers interviewed in focus groups perceive that inputs (fertilisers
and seedlings) are not provided soon enough or in sufficient quantity, and 30% lamented the lack of
or insufficient access to credit. According to 25% of farmers, there is insufficient turnover in the
management committee of their producer groups. Another concern is the limited support of the
producer groups in stimulating children’s education and providing health facilities (see Figure 16 and
Figure 17).
Half of all farmers mentioned that they experienced benefits of group membership (Figure 17). The
most frequently named were better relationships with their fellow farmers (55%), knowledge
exchange between members (33%) and the benefits of problem solving during group meetings (20%).
Only a small proportion (35 of all farmers interviewed) indicated that there are negative aspects to
being a member of a producer group. Half of these farmers mentioned the costs and time involved in
being a member of a group and 9% mentioned record keeping. 43% mentioned diverse issues such as
rivalry between members and leaders; being unable to meet commitments to provide advance
payments, credit and support; and poor management.
Producer groups are the main channel by which farmers participate in a certification programme and
though which they become certified. Farmers indicated generally high levels of satisfaction with their
producer groups as providers of services and marketers of their beans, as shown in Figure 26,
Figure 27 and Figure 30. The vast majority (95%) of all farmers participating in a programme offered

58 | LEI Report 2014-016
by an exporter were satisfied with the certification programme, 2% were neutral and 3% did not
know. Farmers reported being particularly happy with the access to information provided by their
producer group, and the fact that the group sells their cocoa, particularly when they receive prompt
payments from traders. Farmers were less satisfied with their access to fertilisers, insurance systems,
planting material and credit.
94% of certification programme participants indicated that there are advantages to certification, but
61% also said that there are disadvantages. Almost all certified farmers (99%) indicated that
certification has advantages, but 64% also mentioned that certification has disadvantages (shown in
detail in Figure 33 and Figure 34). Farmers are very satisfied with access to information and the fact
that the producer organisation sells their cocoa. Farmers were least satisfied with access to fertilisers,
insurance systems, planting material and credit through the producer organisation.
Quotations 8 Producer group services
Male farmer, Duékoué: We can have money at any moment to face our problems, even in the case of
emergencies since we can access credits from the co-op before giving them our cocoa, for instance to pay
school fees for my kids or when they are sick.
Male farmer, Daloa: We are not satisfied. The products provided are insufficient, there is no credit and
even when there is, there are problems. They make many demands on us. They ask us to make written
requests, but they never reply.
Female farmer, Guitry: No, we are not satisfied. The co-op has not done anything to improve health and
education.
Labour rights
Generally labour rights are not well respected by any of the farmers, although already certified and
CPQP participants have slightly better performance than non-certified farmers or farmers in the control
group. Whilst the majority of all farmers did not make formal contracts with their labourers, with no
major difference between groups (see Figure 35), more certified and programme participants did
make contracts, suggesting that lessons learnt from the Code of Conduct are being implemented.
However, the general finding is in contrast to the UTZ Code of Conduct, which requires producers to
interact with sharecroppers and workers according to local norms.
Overall, there are many challenges to be addressed with regard to labour rights issues; half of the
farmers do not make formal contracts, and most of them do not know about labour rights legislation
or register their farmers with CNPS (shown in Figure 36). Very few farmers register their labourers
with the CNPS, with no difference between the groups. This is despite the certification requirements
that state farmers must comply with national legislation and sector agreements. Between 10 and 20%
of all farmers know about labour rights legislation (Figure 37). This is in contrast to the UTZ Code of
Conduct, which requires the producer group to inform all producers about labour rights. CPQP
participants and certified farmers have higher levels of knowledge than the control group and non-
certified farmers. The same is true for farmers having access to organisations concerned with labour
rights, as between 7 and 22% have ties to these organisation. CPQP participants and certified farmers
are more likely to have links than control group farmers and non-certified farmers (Figure 38).
Respect for children’s rights
According to certification requirements, children and minors (below 18) are allowed to perform light
work only on family farms and only for a limited number of hours, as long as the work does not
jeopardise their physical and mental wellbeing or interfere with their schooling, they do not conduct
hazardous work in unhealthy situations, at night, or with dangerous substances or equipment, and are
always accompanied by an adult relative.

59 | LEI Report 2014-016
Of the 720 programme farmers, 687 (95%) indicated that they know the minimum age at which
children are allowed to do cocoa farming activities, but only 13% could state what the minimum age
is. Most (83%) non-programme farmers indicated that they knew the minimum age, but when
questioned further only 17% correctly stated the minimum age of 18 (Figure 39).
Farmers knowledge of which activities children are allowed to conduct in relation to cocoa production
was relatively low. CPQP participants’ level of knowledge of prohibited activities is low (0.35 out of 1),
but it is statistically significantly higher than for non-programme participants (0.28). Certified farmers
also have a higher level of knowledge of prohibited activities than non-certified farmers. CPQP farmers
are assisted by children in activities (see Table 16 and Figure 39) that are seen as hazardous for
children, although children spend a limited number of hours on these activities each year. On some
activities children at CPQP farms spend more time than children of control group farmers, but also the
opposite was also observed. Children spent on average 40–60 hours on cocoa farm activities in 2012.
CPQP participants make statistically significantly more use of children (in terms of hours spent) than
control group farmers, which may be because programme participants produce on average more
cocoa than control group farmers. The median number of hours spent by children on the farm is zero,
for all groups, indicating that at least half of all farmers were not assisted by their children in cocoa
farming activities.
The teachers and school directors interviewed had very little or no knowledge of certification and
traders’ activities or of initiatives carried out aimed at stimulating children’s education. 90% of
respondents stated that there were no such initiatives in their school or village. It was difficult for
teachers to distinguish between the children of certified and non-certified farmers, and thus to
compare attendance rates. Teachers stated that in general dropout rates for boys are higher (5–8%
higher) than for girls. School absences were noted as being due to sickness and were not reported to
increase during cocoa harvesting seasons. The average distance between schools and farms is 4.5 km.
The presence and distance from a household to school were seen as major determining factors of
school attendance. This mirrors findings by other studies (Tulane University 2011, Nestle 2012). In the
focus groups and observations, big differences were observed between producer groups and
communities, with different interventions and activities enacted by traders and producer groups
occurring that positively associated with respecting children’s rights, such as sensitisation and
awareness raising and the construction of schools or provision of school materials, but also a lack of
these type of activities (details shown in Figure 40).
Quotations 9 Children’s rights
Male farmer, Fiédifouê: I take care of weeding my field. If it is too much, I call up to my brothers to help
me or if I have money I call the youth in the village so that they can help me. Women do not weed.
When we do pod breaking, women help us to put cocoa in the tracks, but children do not work, they just
collect water for us.
Farmer’s wife: The children help their mothers to cook for the workers.
Producer group manager: We have built a school, and offered a school kit to the most deserving children
of our farmers.
Producer group manager, Dioligbi: No, we do not do any particular programme to stimulate access to
schools. We do only verbal awareness raising.
Healthy and safe living and working conditions
An analysis of crop protection products used indicated that none of the farmers applied crop protection
products prohibited by the UTZ Code of Conduct or the Rainforest Alliance. Regarding the use of
personal protective equipment (PPE), knowledge and implementation levels were higher for CPQP
participants and certified farmers than for their counterparts, even though they still scored relatively
low (0.33 out of 1 and 0.27 out of 1 respectively, as shown in Figure 41 and Figure 42). The reason

60 | LEI Report 2014-016
for this may be that farmers who are certified and part of CPQP are already more knowledgeable and
already implement PPE practices in a better way than control group participants. Interestingly, there is
a statistically significant negative relationship between knowledge of PPE and the use of PPE. It is
unclear why this is the case.
Farmers indicated that a number of good agricultural practices had contributed to better working
conditions; however, access to improved health care was not noted, as shown in Figure 43. About
30% of farmers had had an accident themselves or had seen someone else have an accident during
cocoa production activities. One mortality was noted, during pruning. Statistically significantly more
CPQP participants and certified farmers reported ‘no accidents’ compared to the control and uncertified
groups (Figure 44).
Box 5 Summary: Economic impact
CPQP participants had significantly higher levels of productivity than control group farmers in 2012, with a
mean of 467 kg/ha compared to 315 kg/ha for control group farmers, and certified farmers also generally
had higher productivity than non-certified farmers. Productivity increases were mainly attributed by the
farmers to GAP training. Up to 90% of farmers use credit, but indicated that credit was difficult to obtain,
CPQP participants indicated a better access, mainly due to their producer group and participation in a
certification programme. Up to 60% of farmers were able to purchase inputs, with certified farmers
indicating they had better access. Cocoa quality was generally high, with programme participants having
lower rates of rejection due to poor quality. CPQP participants and certified farmers have higher total
production costs than control group and non-certified farmers, but their production costs per kilogram are
significantly lower. These lower production costs per kilogram do not, however, translate into higher
efficiency ratios, which do not differ between programme participants and the control group. On average,
a farmer’s net household income is 6.27 US$ per day. Whilst no statistically significant differences were
found in the income of farmers participating in the CPQP compared to the control group, farmers with
multiple certification earn a statistically significant higher income than non-certified farmers, suggesting
that certification may positively impact incomes. Cocoa is however not seen as a viable option for the next
generation of farmers. Farmers find it difficult to change from cocoa as their main means of earning
income, resulting in half of the farmers feeling ‘stuck in cocoa farming’ with no or few other opportunities.
5.5 Economic impact
Credit
All farmers indicated that accessing credit was difficult. However, more CPQP participants indicated
a positive change compared to the control group (Figure 45). With statistical significance, more
programme participants indicate that the improvement was due to joining a producer group or
because of participation in a certification programme compared to the control group. Although
accessing credit was difficult, between 70 and 90% of the farmers had borrowed money in the last two
years (Figure 46). Programme participants and certified farmers had had statistically significantly less
credit than the control group. When they were asked what their priorities would be if they had access
to additional financing, 90% replied that they would buy additional fertilisers and new varieties to
rejuvenate their plots. This suggests that those participating in the programme are better able to
manage their incomes, but whether this is linked to previous activities they have engaged in is not
discernible. All farmers appear to have difficulties balancing income and expenditure over the year.
Between 70 and 90% of the farmers had borrowed money in the last two years (Figure 46).
Programme participants statistically significantly less often borrowed money than the control group.
Productivity
Productivity is defined as yield per hectare, based on farmers reports of their yields and their farm
size. Programme participants had statistically significantly higher levels of productivity than control
group farmers in 2012, with a mean of 453 kg/ha compared to 330 kg/ha for control group farmers
(Figure 47). Certified farmers have a statistically significantly higher productivity (439 kg/ha) than
non-certified farmers (311 kg/ha), as do farmers with multiple certifications (530 kg/ha) (Figure 48).
These figures are comparable to some benchmark figures (see Box 6) but lower than the productivity

61 | LEI Report 2014-016
of other certified farmers. During focus groups, around 60% of farmers attributed productivity
improvements to a certification programme, especially GAPs. It should be noted that productivity data
is not accurate,19
given that 73% of farmers under- or over-estimated their farm size (see
Annex 9).
The regression analyses showed that multiple factors influence productivity levels. The age of the
farmer and the farm size are negatively correlated with productivity: younger farmers generally have
higher productivity levels than older farmers, and older farms generally have higher productivity levels
than younger farms. Farmers who are RA or UTZ Certified, who are a member of a producer
organisation or who created their cocoa farm generally have higher productivity levels than farmers
who are not. Heirs to cocoa farms have lower productivity. The zone in which the farmer is situated
also matters: farmers in the excellent zone have higher productivity levels than farmers in the other
zones, as could be logically expected. A study of Rainforest Alliance certification confirms the
difficulties of establishing relationships between certification and productivity, and was unable to
demonstrate the impact of RA certification on productivity increases (N’Dao 2012).
Benchmark data on farm size differ widely, from an average of 3.0 ha (Hatløy et al. 2012), to 3.7 ha
(KPMG 2012b) to 12.5 ha in 1985 (Benjamin and Deaton 1993). Productivity benchmarks - shown in
Annex 10 - also vary widely. As farm size is the basis for calculating productivity per hectare, it is
critical to know whether the benchmark data are based on estimated or measured farm size. However
studies either do not state this or rely on farmers’ estimations (KPMG (2012b). This is important as
30% of all farmers interviewed indicated that their fields had been measured, most often by the
Ministry of Agriculture in relation to cadastral planning. Traders and producer group managers also
confirmed that most farmers do not know their farm size. GPS measurements indicated that 26% of
farmers had miscalculated their farm size, with on average a 7% over-estimation of field size. Also
a very low proportion (2% of all farmers, i.e. 17 UTZ programme participants and 2 control group
farmers) indicated they knew the number of cocoa and shade trees on their farms. This compounds
difficulties in calculating productivity per tree and per hectare. It also raises questions about the
comparability of these results to other studies. Comparing these productivity figures to other cocoa
producing countries, the rates of 300 to 500 kg/per ha are low (Ruf 2007; Oxfam International 2009;
KPMG 2012b).
Between 50 and 60% of the farmers indicated that they were able to purchase inputs when needed
(Figure 49). A small number of farmers (24) receive ’free’ inputs via spraying teams. Interviews with
producer groups indicated this this service is generally paid for by the premium. Certified farmers
indicated more often that they have access to inputs than non-certified farmers (Figure 51).
Programme participants and certified farmers indicated that access to inputs through markets and
cocoa buyers had improved more often than the control group and non-certified farmers (Figure 50).
Box 6 Cocoa productivity benchmark figures
620 kg/ha certified (N’Dao 2012)
576 kg/ha RA certified (RA 2013)
570 kg/ha non-certified (N’Dao 2012)
565 kg/ha (KPMG 2012)
450 kg/ha (HatlØy 2012)
352 kg/ha (Gockowski & Sonwa 2007)
19
Both for this study given the tendency to over-estimate farm sizes and for other studies, as the extent to which
productivity was calculated based on measured or perceived farm sizes is not specified in the studies used as
benchmarks.

62 | LEI Report 2014-016
Quotations 10 Productivity
Male Farmer, Dioligbi: I have half a hectare. At the small harvest I used to make only half a bag,
while now I have almost two bags. I am also happy about the new techniques I have learned.
Male farmer, Nizahon: Thanks to the training, productivity has increased.
Male farmer, Duékoué: Production has increased from 1 to 3 bags per tree, or 1500 kilos per hectare.
Producer group manager: Productivity has increased from 350 to 700 kilos per hectare, mainly for those
farmers who follow the recommendations of our trainers.
Producer group manager: The costs of the inputs has increased, but we could take credits which we can
pay back over a period of 6 months.
Improved farm efficiency
Farm efficiency measures the economic inputs compared to the output ratio and is calculated on the
basis of gross income of main farm divided by total production costs main farm. The efficiency ratio
indicates that investing one euro in cocoa production generates 12.2 euros. No statistically significant
differences were found in efficiency ratios between CPQP and non-programme farmers or certified and
non-certified farmers (Figure 51 and Figure 52). These figures show that the median values are lower
than the average, indicating that that average efficiency ratios are influenced by a small number of
farmers who have a very high efficiency level. The average therefore hides large differences between
farmers in the programme. Certified farmers have slightly lower (but not statistically significant)
efficiency ratios (i.e. indicating they are less efficient) than those not yet certified. This finding may be
explained by certified farmers having higher production costs. No relationship was found between
larger farm sizes and higher efficiency ratios, nor did RA certified farmers have higher efficiency ratios
than other farmers. Surprisingly, farmers participating in field apprenticeship training have lower
efficiency ratios on average than farmers who did not participate in such training. Explanations for
efficiency rates may be due to a time delay, as changes in farming take time and this study is the first
measurement. It may also be explained by certified farmers having higher production costs (see the
section on profitability and viability).
Quality meets market demand
Cocoa quality was generally seen by farmers, co-ops and traders as very high, with only 2.1% of all
farmers indicating that producer groups had rejected cocoa due to non-compliance with quality
standards. Cocoa was rejected statistically significantly less from CPQP participants and certified
farmers than from control group and non-certified farmers, which could be an effect of previous
(certification) programme activities.
Three traders reported that bean quality had improved following certification. All traders reported that
quality requirements (moisture content with maximum allowable mould level at 4% and maximum
allowable moisture level at 8% at point of export) had been met. In 2011/12, maximum levels were
8 and 12%, respectively. Traders indicated they were surprised that this was met so easily, but that
external influences (such as the favourable weather conditions in 2012/13) can have a strong
influence and the market reform could have affected bean quality and size improvements. Farmers’
and traders’ anecdotal evidence for the mid-2013 harvest indicated that bean size was smaller. It is
expected that the full impact of the 2012 cocoa market reform will only be fully apparent in future
assessments. Studies (Ruf et al. 2013) indicate that after the reform of September 2012, farmers’
immediate response was to sort and dry beans, led by the combination of a fixed price and state
controls and as exporters no longer have the option of paying for higher cocoa quality and must
’take or reject’.

63 | LEI Report 2014-016
Quotations 11 Quality meets market demand
Male farmer, Dioligbi: Since I started applying good agricultural practices – weeding and pruning – I have
higher quality, I look better at my farm, and I know what is good and what is bad, and this gives me
greater productivity. We adopt ourselves the best therapy for our fields.
Manager producer group: Quality has improved after starting of certification.
Manager producer group, Dioligbi: Quality has improved since the starting of certification. This year it has
also improved thanks to the reform. All cocoa is clean this year and last year as well.
5.6 Influence of certification on members’ loyalty to their
group and willingness to reinvest in cocoa farming
Prices in the study period hardly differed between the different buyers. Most farmers (70%) sold their
cocoa to their producer group rather than to traitants or independent buyers (Figure 74). Their main
reason for doing so is to obtain a certification premium (92%) (see Figure 75). Other advantages of
being part of a producer group include higher fixed prices and prompt payment. Loyalty is influenced
both by financial gains (28% of farmers sold to their producer group because of the premium) and by
social capital, with 17% stating that the group atmosphere or cooperative spirit is important, and by
the different services and support provided to farmers by their group.
Increased profitability and long-term viability of farmers and groups
Profitability was calculated based on reported total cocoa production costs20
and costs per kilogram of
cocoa. The total production cost influences net income; however, the variable of production cost per
kilogram or hectare is more meaningful to compare farmers.
Quotations 12 Impacts on profitability
Male farmer DALOA: There is an improvement in production level and an increase in social cohesion
between the farmers. And there is the premium, which is the most interesting.
Male farmer, Dioligbi: The season was over and my children were surprised as there was still money.
I explained to them that this is due to the certification.
Male farmer Dioligbi: I was paid at the beginning of January and I bought phytosanitary products. I also
gave money to my children.
Male farmer, San Pedro: My profits increased and I paid the school fees for my children. When
I experience difficult times, I use my extra income to buy fertilisers.
CPQP participants and certified farmers have higher total production costs than control group and
non-certified farmers (Figure 54 and Figure 55). The reasons underlying this were confirmed by
farmers’ qualitative responses in focus groups and change stories. They indicated that certification
’costs’ them more, in terms of both their own and their hired labour. In general, farmers do not
calculate their production costs or labour costs or keep track of the cost per kilogram of cocoa.
Farmers tend not to calculate their own labour as a cost or the time spent attending training and
producer group meetings.
20
See Annex 8 for how costs were calculated.

64 | LEI Report 2014-016
However, using the measure of production costs per kilogram, which allows a better comparison, CPQP
participants and certified farmers have statistically significantly lower production costs per kilogram
than uncertified farmers. Whether this is a result of a certification programme or due to the selection
of respondents will only be clear in subsequent evaluation. These lower production costs per kilogram
do not, however, translate into higher efficiency ratios, as the efficiency ratios of certified farmers do
not differ compared to non-certified farmers.
Net income from cocoa production is also a measure of viability and profitability. About 50% of
farmers interviewed in focus groups say that income has increased since the start of certification.
Cocoa farming remains their most important source of revenue. As shown in Figure 58, farmers
earned a net income of on average about 1,500,000 CFAF in 2012 from their main cocoa farm
(equivalent to 4,110 CFAF/6.27 US$ per day). CPQP participants do not earn a statistically significant
higher net income than their counterparts, but farmers with multiple certifications earn a statistically
significant higher income than non-certified farmers (Figure 59). A positive relationship was found
between net income levels and farm size, the implementation of GAPs, productivity levels and the fact
that a farmer is an heir to the cocoa farm. Older farmers and participants in field apprenticeship
training generally have lower net incomes than younger farmers and farmers who did not participate
in such training.
Diversification
Farmers tend to be dependent upon on cocoa for income generation: 79% have cocoa as their sole
income source. The most important crops other than cocoa from which farmers earn their income are
coffee and rubber, although not more than 21% of the farmers earn income from these crops
(Figure 60). Control group farmers more often earn income from these crops and livestock rearing
than CPQP participants. CPQP participants earn income more often from food products or kola nut
production.
Even though relatively few farmers earn income from sources other than cocoa, the gross income
earned from those activities can be relatively high, especially for rubber, coffee and palm oil (see
Figure 61). For these crops, the mean gross income earned is much higher than the median, indicating
that a few farmers earn a relatively high amount from such crops, although most farmers earn much
less. As we do not know the production costs for the activities, we cannot make an estimate how
much income from other sources contribute to net household income.
UTZ Certified farmers earn a statistically significantly higher gross household income (2,636,739
CFAF) than non-certified farmers (1,716,777 CFAF) and farmers who have multiple certifications
(2,157 654 CFAF) (Figure 62). Farmers and producer group managers provided said that multiple
certification incurs additional costs. Farmers in the CPQP (2,354,984 CFAF) do not have a statistically
significantly higher gross total household incomes than the control group (2,174,637 CFAF)
(Figure 63). Net household income was not calculated, as the income and costs from other activities
were not known. Over 80% of farmers spent their income from cocoa production on medicines, school
fees and food (Figure 64), and 64% reinvested in cocoa production. They spent the least of their
cocoa revenues on hiring labour for activities other than cocoa production. There were few differences
in spending patterns between the groups, although 10% more of the control group spent income on
food than CPQP participants and 12% more CPQP participants spent revenues on hiring labourers for
cocoa production. Over half of the farmers shared their revenue with family members (Figure 65).
Programme participants shared benefits with family members and labourers significantly more often
than control group farmers did.
The viability of cocoa farming in the future was measured by asking farmers about their perceptions.
About two thirds stated that they do not want their children to be cocoa farmers in the future
(Figure 66) and 71% of the 121 focus group respondents also did not want their children to become
cocoa farmers. In focus groups, children stated that they would prefer to become teachers rather than
cocoa farmers. Farmers’ expectations of continuing in cocoa farming in the coming 5 to 10 years were
very different: 70–75% expected to continue cocoa farming and 25–30% did not expect to
(Figure 67).
65 | LEI Report 2014-016
The majority of farmers in the focus groups generally do not perceive cocoa as a viable business in the
long run. Some farmers explained this by saying ‘it is cocoa or nothing’. Such findings are attributed
to the lack of other sources of cash income for most farmers, few other opportunities and generally
the old age of farmers, whilst farmers hope that different opportunities will exist for their children.
Around half of the farmers talked about diversifying into crops that provide more regular income and
were seen as more profitable and less work, such as rubber. Some farmers said that rubber provides
more opportunities; but most do not want their children to continue the ‘struggle of cocoa farming’.
Farmers noted that they had asked their producer groups to help diversify their sources of revenue.
Farmers participating in the programme for longer had a more positive opinion about continuing in
cocoa farming, just as farmers who have participated in UTZ certification the longest are more positive
than later entrants, but this trend is not statistically significant.
Quotations 13 Long-term viability of cocoa farming
Male farmer, San Pedro: Yes, I will continue investing in cocoa if I get extra finance to extend the
hectares of cocoa and to buy fertiliser.
Male farmer, San-Pedro: With the new variety CNRA, the yield is improving.
Male farmer, Bohoussoukro: I can’t expand my cocoa farm because there is no room, but even so,
I don’t want to because it's too tiring, I think I’ll go into rubber.
Male farmer, Daloa: I won’t continue with cocoa because we don’t earn at the moment ; when I find
a bit of land I will produce rubber.
Male farmer, Gligbéadji; I produce both rubber and cocoa because of the soil status ; it is good to
diversify the crops in order to increase my income.
Quotations 14 Long-term viability of farmers and groups
Female farmer, Dekoue: No, I don’t want my children to be cocoa farmers, I want them to become civil
servants, because they’ve been to school.
Male farmer, Guiglo: I’d like my son to be a cocoa farmer, I don’t want him to be a slouch. I want him to
take care of me when I’m old. He’s already started planting some rubber.
Female farmer, Bohoussoukro: I’m not going to accept that he becomes a cocoa grower because there are
no more fields available. I’d prefer him to learn another type of job, like tailoring, carpentry, hairdressing.
66 | LEI Report 2014-016
5.7 Ecological impact
Box 7 Summary: Ecological impact
A small proportion of farmers use crop protection products (17% used herbicides, 55% pesticides, 10%
fungicides) and those used all comply with certification and Ivorian regulations, indicating the
maintenance of soil and water quality. Less than 20% of farmers use compost from cocoa production
waste or other sources, suggesting a low but positive impact on soil quality. The correct use of crop
protection products was stated by farmers as one of the main environmental impacts that GAP had
positively impacted for the on- and near-farm environment. Whilst programme participants and certified
farmers have significantly more knowledge about water and soil conservation measures and the
protection or restoration of natural habitats than their counterparts, their knowledge and implementation
scores were low. Farmers also scored low on their knowledge and implementation of waste management
and reduction practices, with very few differences between programme participants and the control group.
Although up to 58% of farms had been cleared from primary forest, these were all before the 2008 as
required by, for instance, the UTZ Code of Conduct. More control group farms had been cleared from
forests. These results suggest that practices improving the environment – particularly soil and water
quality and conservation – appear to have been implemented to a limited extent and may have had a
limited impact to date. Field based monitoring is required to verify this.
Maintained and improved soil and water quality
To ascertain soil quality, farmers were asked about the GAPs that impact soil quality (such as how
they implement clearing, pruning, mulching, composting, etc.) and related to water quality (clearing
vegetation and chemical and waste handling near water courses) the type and quantity of agro
chemicals used and their perceptions of soil quality. Farmers’ use of compost is promoted by the UTZ
Code of Conduct to improve soil fertility and was used as a positive indicator of improved soil quality.
Scrutiny of the crop protection products that farmers use (see Annex 11) revealed that they were not
using any products on the UTZ list of prohibited products (UTZ Certified 2012a) or any of the products
banned by the government Government of Cote d’Ivoire 2008). The proportion of farmers using
different crop protection products is low: 17% used herbicides, 55% pesticides, 10% fungicides and
23% fertiliser and compost. Less than 20% of farmers use waste from cocoa production activities as
compost. 12% more certified farmers than non-certified farmers use such waste as compost
(Figure 81).
Quotations 15 Soil and water protection
Male farmer, Diegonefla: Water and the soil is better protected. The waste is better managed. We have
been reducing pesticide use because of improved management of our farms and training with advice
obtained from the extension farmers.
Producer group manager: We have been advising the farmers to decrease pesticide use or even not use it
anymore. In general, the agents of ANADER tell us that if we clean our fields three times, we won’t have
to use pesticides anymore.
Most farmers stated that the practices they perceive as protecting the environment were waste
management and better spraying and pruning (Figure 68). CPQP programme participants and UTZ
Certified farmers have statistically significantly more knowledge of water conservation measures than
their counterparts in the control group (Figure 69). No positive relationship was found between
programme participation and farmers’ knowledge of soil conservation (Figure 70). A statistically
significant negative correlation was found between knowledge and implementation of water
conservation practices; why this is the case, is not clear. No differences were found between CPQP
and control group participants about knowledge levels and their implementation of soil conservation
practices.

67 | LEI Report 2014-016
Protection or restoration of natural habitats
To ascertain the level of protection or restoration of natural habitats (biodiversity conservation),
one of the subjects of the UTZ Code of Conduct, farmers were asked about their preferences for shade
trees before and after certification, about the status of their farm prior to growing cocoa and land
clearance for cocoa, the number of shade trees on their cocoa farms and the planting of shade trees.
CPQP participants implement biodiversity conservation practices statistically significantly better than
the control group, although their average score is low, at 0.17 (out of 1) (Figure 71).
Effective waste management and waste reduction
None of the farmers interviewed scored higher than 0.27 out of 1 for the implementation of waste
management practices, and the average implementation level is very low (0.12) (Figure 72). No
differences were found in the implementation levels between the groups. Producer group managers
indicated that farmers face difficulties implementing the GAPs concerning waste management.
Protection or restoration of natural habitats on or near farms
Figure 73 shows that 40–58% of the cocoa farms were previously primary forest, and 25–33% were
fallow. As most farms were on average created 21 years ago, the majority of the deforestation took
place decades ago. The most recent farms were created before 2011 and did not originate from
primary forest. Farmers in the control group cited more often that they had converted their fields from
primary forest than CPQP participants. A study of Rainforest Alliance certification confirms the
difficulties of establishing relationships between certification and ecological protection or improvement,
and was unable to prove any impact of the certification on environmental protection (N’Dao 2012).

68 | LEI Report 2014-016
6 Added value of certification for cocoa
farmers
6.1 Introduction
As standards are one of the four main tools used in the CPQP, this chapter responds to the third
research question, presenting data on the added value for farmers of going through the certification
process and being certified. It assesses farmers’ and stakeholders’ perceptions of the impacts of
certification and training on their livelihoods in terms of improved wellbeing, professionalism, trust and
communication between farmers and producer groups, how certification influences the loyalty of
members towards a group and farmers’ willingness to invest in cocoa farming. It also looks at how
training and certification interventions influence and/or strengthen each other. It assesses farmers’
and stakeholders’ (groups, traders, traitants, exporters, trainers) perceptions of the process and
impacts of certification and training on their livelihoods benefits in terms of improved wellbeing,
professionalism, trust and communication between farmers and producer groups.
Box 8 Summary: The added value of certification for cocoa farmers
The certification premium – the market reward for sustainable, responsible production – is one of the
most important motivations for farmers to become certified. The premium also gives a financial stimulus
to farmers particularly in the earlier stages of participation in the programme when the expected
productivity and quality increases have not yet become apparent. Farmers and farmer groups expressed
concerns that, if payments of the premium were to be discontinued, one of the main added values of
maintaining the certified status for them would disappear.
Farmers indicate that implementing the GAP taught by the programme leads to higher productivity and
therefore a higher income. Furthermore, the added value of the programme over a programme focused
only on trainings, is that farmers can access certification premiums and that producer groups provide
services that farmers are satisfied with.
Certification influences trading practices to produce a range of positive outcomes. UTZ Certified farmers,
as members of a producer group, have access to traders and tend to sell only to the traders who have
provided them with support. For farmers, this adds value by responding to their major needs. For traders,
this loyalty provides a secure source of certified, good quality bean supplies. These relationships help
secure market access for farmers and their groups and increase access to the support services that aid
production. They also allow access to other social and community activities, which are prioritised lower
but are still seen as important by farmers.
Certification has supported and massively promoted collective action in the form of producer groups such
as cooperatives. Farmers noted numerous benefits such as marketing their beans at a good price, access
to information and training, providing a forum for exchange and building social capital. It has contributed
to a perception by some farmers that cocoa is a viable cash crop. Certification has aided access to
seedlings, crop protection products and credit. Activities associated with certification, often provided by
traders, have also contributed to professionalize producer groups, by providing training, internal control
systems, financial support and transport.
Certification has also had unintended consequences. It has added to farmers difficulties in managing
large, seasonal cash flows. The payment and auditing process is perceived as vulnerable to corruption.
The premium setting process is not transparent and appears unlinked to actual costs at farmer, producer
group or trader level. Multiple certification is complex and has been difficult for some traders and producer
groups to manage. Rapid up-scaling and out-scaling of certification related activities especially training,
has related in perceptions of a variable quality lack of minimum standards, with possibly influences
farmer’s knowledge and practices.

69 | LEI Report 2014-016
6.2 Added value of training and certification
The added value of UTZ certification was examined by asking farmers about their perceptions of how
certification influences trading and cooperative relations, and their level of satisfaction with their
cooperatives, the services provided, and professionalism and trading patterns.
Certification influences the trading practices of farmers and producer groups
As the majority of producer groups are affiliated with traders, perceptions of the added value of
certification in terms of the trading relationship is important. Interventions made as part of the
certification programme appear to be a factor in the choice of to whom a producer group sells their
members’ beans, in combination with the price offered by traders. About 60% of farmers know to
which trader their producer group sells.
Figure 74 shows that of those who know, mentioned that their producer group sells most often to
Cargill. As 62% of producer groups in the sample are affiliated with the Cargill sustainability
programme and Cargill is one of the largest traders in Côte d’Ivoire (Oxfam International 2009), this
figure is not surprising. Four other exporters are mentioned by about 5% of the farmers. As 40% of
the farmers do not know who their producer group sells to, it appears that producer organisations do
not share information on who they sell cocoa to and why they select a specific buyer.
More than half of the farmers indicated that their producer organisation sells to a certain trader for
specific reason (Figure 75). Most mention that this is due to traders offering training, the price paid or
because inputs are provided. Qualitative responses from farmers mirror this, with loyalty to a trader
(19%), price paid (10%), premiums (10%), provision of inputs (7%) and training (7%) among the
most frequent responses.
Certification influences the formation and professionalisation of producer groups
The majority (75%) of producer groups have been formed as part of the programme activities since
2008. The formation and support of producer groups has been one of the major activities
accompanying certification by the traders. Farmers were satisfied with the types and level of services
provided by their group. They did, however, point to the need for their groups to be more transparent
and accountable, particularly providing more information on prices and benefits, on how premiums are
used by the group and the need to train managers.
Producer group capacity building has been one of the main activities conducted by traders in
conjunction with certification programmes, with 80% of groups sampled having received support to
professionalise, mainly training but also financial support to become legalised, and in terms of
transport, equipment and traders paying the salaries of support staff (Table 5, Table 6 and Table 9).
The producer groups linked to traders in the CPQP appear to function relatively well, as 59–74% of
farmers feel represented by their officials, experience that complaints lead to action and noted that
officials are replaced when they do not function properly (Figure 30). Even though CPQP participants
are relatively satisfied with the functioning of their producer group, about two thirds made suggestions
for improvements. Similar observations were made in the focus groups and other stakeholder
interviews. A third mentioned the need to improve transparency on information on prices and benefits;
20% indicated the need for information or more information on how the proportion of the premium
retained by the group is used, and said that accountability should be improved and managers should
be trained (see Figure 32).
Producer group managers indicated that training, the premium, better productivity and quality, access
to lower cost inputs and credit were the main advantages of certification (Figure 34). Farmers
reported advantages in terms of accessing finance, farm inputs, and monitoring and follow-up visits
(Figure 77). Producer group managers also indicated that they are generally satisfied with certification
but request that the level of the premium be increased. Other needs stated were:

70 | LEI Report 2014-016
1. More vehicles are required to transport beans.
2. Access to inputs has increased with certification but is still insufficient.
3. Services by producer groups: transport in the case of sickness, loans for healthcare, support in
building schools.
4. Incentives for farmers to join co-ops: premium, prompt payment.
5. Incentives for producer groups to be certified: financial gains/training.
6. For all producer groups, revenue has increased thanks to the application ofGAPs; and as farmers
have access to lower cost of inputs and credit.
7. Inspection is important to monitor the adoption of GAPs.
8. Successful farmers are those who diversify their sources of revenue.
Quotations 16 Sustainable practices rewarded by the market
Co-op manager: Yes the co-op has a good image. The fields of our farmers are clean, the yields are high
and the farmers are well trained. But it is difficult to transport cocoa from the fields to the to the
cooperative buying centre because we have too few vehicles.
Co-op manager: The advantages are: higher quality, increase in volume, self-financing of the producer
group, and improvement in living conditions. The programme gives me the opportunity to save money
and time.
Knowledge and implementation of GAPs increased
Sections 5.2 and 5.3 illustrate that in general, knowledge and the implementation of GAPs appear to
contribute to positive impacts on crops, incomes, the environment and lives. However, not all
knowledge acquired appears to have been implemented and in some areas, knowledge levels are
either low or show little difference to those of farmers prior to certification or to those in the control
group.
Box 9 Farmers’ and stakeholders’ perceptions of certification and training
The vast majority of farmers indicated their satisfaction with the programmes offered by traders and with
certification. They did, however, state that there is room for improvement in making specific GAPs easier
to implement and that they would value higher premiums, to compensate for what they see as additional
work.
6.3 Farmers’ and stakeholders’ perceptions of the process
and impacts of certification and training on their
livelihoods
The majority (95%) of farmers reported being satisfied with the trader programme they participated
in, 2% were neutral and 3% did not know. Most farmers were satisfied with the training offered
(especially on GAPs) and the resulting quality and productivity increases; the opportunity to obtain
a certification premium; because they could access inputs; and due to the creation of better and safer
working conditions.
Almost all (97%) of the 665 farmers participating in the UTZ Certified programme indicated they were
satisfied with the training on UTZ certification, whilst none were unsatisfied, 3% were neutral or did
not know (see Figure 31). The majority (94%) of UTZ programme participants indicated that there are
advantages to certification (see Figure 76). These included better knowledge of GAPs (40%) and the
premium (29%). However, 61% also mentioned disadvantages. Most (40%) mentioned the time and

71 | LEI Report 2014-016
effort needed to implement the GAPs; other disadvantages include difficulties accessing (correct)
inputs and implementing certain GAPs (such as composting, black pod removal, working without
support from children), and the low premium.
6.4 Unanticipated impacts of certification and training
Farmers and stakeholders believe that certification and the related activities have contributed to
a number of unanticipated effects. The following were mentioned by farmers and stakeholders in the
focus groups and verification meeting:
1. A massive increase in the membership of producer groups, resulting in a revitalisation of the
cooperative spirit and a focus on improving their institutions’ functioning and services.
2. Perceived increase in farmer livelihoods in general.
3. Accompanying projects on rehabilitating farms have occurred with perceived long-term and
far-reaching effects.
4. Increase in farmers’ perception that cocoa farming is viable.
5. Introduction of GAPs.
6. Contribute towards reforms of the sector and the Coffee Cocoa Council.
7. Increase in phytosanitary controls and training.
8. Higher volume of certified product produced sooner than expected.
9. Certification has created employment with a whole ‘industry’ of supporting services and
organisations, e.g. audits, service providers, NGOs, trainers, consultants and lead farmers.
10. Cocoa farming has increased in value and prestige and has become ‘valued’ again.
Negative, unanticipated impacts of the certification were also reported by farmers and stakeholders.
These include:
1. Lack of understanding at producer group level about the division of premiums and costs of
certification.
2. Market finds it difficult to absorb surplus certified beans that are not required/purchased by
traders.
3. Premium payments lead to corruption, especially because they are large amounts,
4. Decrease in the quality of GAP training for farmers since 2008.
5. The creation of fictive cooperatives.
6. Insufficient technical expertise in consultants, cabinets and in government to up-scale the services
provided as part of certification at same level.
7. Transparent system of setting premiums by traders.
8. Corruption in the auditing process (i.e. payments to obtain a positive audit result).
9. Difficulties for farmers to manage large sums of cash premiums paid out in one go.
10. Difficulties for both traders and producer groups in managing multiple systems of certification with
similar but slightly different demands.
11. Wide range of different certification systems and interventions implemented by traders and
cooperative but uncertainty about what works.

72 | LEI Report 2014-016
7 Conclusions
This section summarises the main conclusions from the preceding sections in order to answer the
three main research questions.
1. Is the CPQP cocoa programme in Côte d’Ivoire inclusive? What are the characteristics of certified
farmers?
2. How do certification, voluntary standards and the related activities of implementing partners
influence knowledge and related behaviour/practices of cocoa farmers in Côte d’Ivoire?
3. What is the added value for farmers of going through certification processes and being certified?
The findings in relation to the first objective are detailed in Chapters 4–6. This chapter focuses on
the second and third objectives. As explained in Chapter 1, the second objective was divided into
three main research questions about the inclusiveness of the UTZ Certified cocoa programme in
Côte d’Ivoire, about how certification and related activities have affected farmers’ knowledge and
implementation of good agricultural practices, social and environmental issues in line with the
UTZ Certified Code of Conduct and concerning the added value of certification. These questions are
reiterated and responded to below.
7.1 Inclusiveness of the CPQP and characteristics of
certified farmers
The CPQP appears inclusive in reaching a large number of farmers through the activities of its
partners, particularly certification, and through being involved in activities such as producer group
development support, training and assistance to become certified. However, women are under-
represented both as owners and particularly as workers. The proportion of female owners of cocoa
farms included in CIP programmes is a specific desired outcome of the CPQP. A much smaller
proportion of farmers have benefited from access to associated activities that improve crops – such as
access to crop protection products, fertilisers and seedlings – and that improve lives, such as
community and social programmes.
Women and youths have generally not been included in the partners’ activities or certification. This is
partly due to the nature of farm ownership in Côte d’Ivoire and farming customs. Generally, Ivorian
and Burkinabe women work on cocoa farms but do not own them. As activities have targeted
registered producer group members who own or sharecrop farms, female farmers and labourers have
not been explicitly included in certification related activities, although this appears to be changing with
a more recent focus on gender in the last year and several sector and country wide initiatives. Around
a third have been included indirectly as their male counterparts have passed on training, but the
extent to which the training is passed on is not known. In focus group discussions, women indicated
their lack of awareness of and involvement in support activities and certification. Women do benefit
from cocoa revenues: three quarters of the women in the focus group discussions reported receiving
a higher proportion of cocoa income from their husbands when cocoa income increases.
7.2 The influence of certification on knowledge and
practices
Certification appears to contribute to influencing the knowledge and implementation of good
agricultural practices. However, the levels of knowledge and practices of programme participants were
found to be relatively low, at around 24–25% of what could be expected of correct knowledge and/or
implementation of the standards contained in the UTZ Code of Conduct. Particular areas where

73 | LEI Report 2014-016
knowledge and practices can be improved are environmental aspects, children’s and labour rights,
personal protective equipment, waste management and composting. Reasons suggested by
stakeholders include the quality and quantity of training and trainers, particularly as certification has
been up-scaled, and an insufficient adaptation to farmers’ learning styles and preference for extension
and field-based learning, rather than classrooms.
Farmers’ knowledge levels were predicted in the impact logic to improve with training and increased
participation in the UTZ Certification and Rainforest Alliance certification. This baseline indicates that
knowledge and practices that could potentially be attributed to the certification programmes have
been acquired, as farmers who had been certified for longer had higher knowledge scores. Programme
participants and certified farmers have statistically significantly higher knowledge levels than farmers
in the control group and non-certified farmers. However, farmers participating for longer in the
programme did not have higher knowledge levels than those of later entrants. This may be because
farmers have different levels of knowledge prior to joining the programme. However, the levels of
knowledge and the practices of programme participants were found to be relatively low, at 25% of
what could be expected of correct knowledge of the standards contained in the UTZ Code of Conduct.
Surprisingly, there was a negative association between knowledge and participation in farmer field
schools and field apprenticeships: programme participants have a lower knowledge level than non-
participants. This finding is difficult to explain. Multiple certification was also found to affect knowledge
levels. Farmers who were also Rainforest Alliance certified have higher knowledge levels than non-
certified farmers. This is attributed to similar types of knowledge acquired and to repetition building
farmers’ knowledge.
Knowledge levels were also associated with other variables. Positive associations were found between
farm size and knowledge levels: the larger the main farm and the size of all farms, the higher the
knowledge level. Farmers in the excellent agro-ecological zone have higher knowledge levels than
farmers in the good or marginal zones. These two findings may be explained by the fact that farmers
have the possibility to apply knowledge and benefit from slight efficiencies in scale and a more
favourable environment for growing cocoa. Members of a producer group have higher knowledge
scores than farmers who are not members, which could be attributed to producer group membership
facilitating exchanges between members or to the fact that knowledgeable farmers are likely to be
members of a producer group .
The length of participation in the UTZ Certified programme is positively correlated with the overall
implementation of GAPs, record keeping and biodiversity conservation practices. Whether these effects
can be attributed to the UTZ certification programme or to other factors will only be apparent in
subsequent assessments. UTZ programme participants and UTZ Certified farmers also performed
better in implementing GAPs than farmers in the control group and farmers who are not UTZ Certified.
However, as with knowledge levels, farmers’ levels of implementation of GAPs are quite low, at 24%
of what could be expected with full implementation, despite increasing with the length of participation.
As the knowledge and implementation levels of farmers were not tested prior to their joining the
programme, it is not possible to attribute changes only to certification and related activities.
7.3 The added value for farmers of certification
Certification appears to contribute to farmers’ lives, incomes, crops and environment in different
measures. This initial assessment indicates that most of the impacts of certification are felt
economically and socially. This mirrors findings that Rainforest Alliance certified farmers in Côte
d’Ivoire have positive impacts on producer group management, strengthen commercial relationships
between cooperatives and parties, and have positive impacts on livelihoods by improving safety and
sanitary conditions, cocoa prices, and health and education (N’Dao 2012). Farmers are generally
satisfied with their lives and producer groups and the services they provide, as well as the traders
they sell to.
74 | LEI Report 2014-016
Certification may have an impact on incomes. Certified farmers tend to produce more efficiently and
have higher net cocoa-based incomes. Farmers indicated that implementing the GAPs, taught by the
programme leads to higher productivity and therefore higher incomes. Certified farmers indeed had
statistically significantly higher levels of productivity. CPQP and certified farmers have lower
production costs, but statistically significantly lower production costs per kilogram than control group
and uncertified farmers. These lower production costs per kilogram do not, however, translate into
statistically significant21
higher efficiency ratios. Certification and support activities have not reversed
the trend of cocoa being seen as an uninteresting economic activity for farmers in the future. Many
farmers are ‘stuck in cocoa farming’ and cannot easily change their means of earning an income and
have no or few other opportunities. However, certification and related activities appear to be offering
a ray of hope, focussing attention and revitalising the sector. Practices improving the environment,
particularly soil and water quality and conservation, appear to have a limited impact to date.
Furthermore, an added value of the CPQP focussing on different social and economically sustainable
outcomes is that farmers can access a wide range of services either through enhanced producer
groups, or direct from service providers and traders who contribute to market rewards in the form of
certification premiums.
The certification premium – the market reward for sustainable, responsible production – is one of the
most important motivations for farmers to become certified. Although the premium is an incentive for
farmers to become certified, particularly in the earlier stages of participation in the programme when
the expected productivity and quality increases have not yet become apparent, it is small,
representing only 7% of the total kilogram price. But the attention given to it, and as most producer
groups pay out premiums separately from the main payment for beans, this focuses an inordinate
amount of attention on the premium. Farmers and farmer groups expressed concerns that, if
payments of the premium were to be discontinued, one of the main added values of maintaining the
certified status for them would disappear.
Certification has supported and massively promoted collective action in the form of producer groups
such as cooperatives. By organising farmers into producer groups and aiding their professionalisation,
activities have been up- and out-scaled to over 44,000 farmers across the country. Activities
associated with certification, often provided by traders, have also contributed to professionalising
producer groups, by providing training, internal control systems, financial support and transport.
UTZ Certified farmers, who are members of a producer group, have access to traders and tend to sell
only to the traders who have provided them with support. For farmers, this adds value by responding
to the major needs.
For traders, this loyalty provides a secure source of certified, good quality bean supplies. These
relationships help secure market access for farmers and their groups, and increase access to support
services that aid production. They also allow access to other social and community activities, which
are prioritised lower but are still seen as priorities by farmers.
These partnerships appear critical channels that add value to certification for farmers. They may
possibly enhance their effectiveness and efficiency, as duplications of effort are avoided. The perceived
negative impact of multiple certification schemes for farmers, producer groups and traders is an
example of where collaboration and partnerships could help minimise or mitigate negative impacts.
The many different activities implemented by traders within the framework of or associated with
certification shown in Chapter 3, highlight that certification has an added value not only for farmers
but also for traders and for organisations running projects and programmes.
Certification has also had some unintended influences. It has added to farmers’ difficulties in
managing large, seasonal cash flows. The auditing process is perceived as open to corruption. The
premium setting process is not transparent and appears unlinked to actual costs at farmer, producer
21
See Annex 4

75 | LEI Report 2014-016
group or trader level. Multiple certification is complex and has been difficult for some traders and
producer groups to manage. The rapid up-scaling and out-scaling of certification related activities,
especially training, has resulted in perceptions of a variable quality and lack of minimum standards
which possibly influences farmers’ knowledge practices.
7.4 Was the impact logic correct?
Lessons learnt
The impact logic of the CPQP appears to be correct in assuming that certification and
associated activities will lead to better economic outcomes because a higher level of
knowledge is related to the improved implementation of good agricultural practices,
higher productivity, higher net income and higher satisfaction levels with regard to
farmer livelihoods.
Both higher knowledge levels and improved implementation of record keeping are positively related to
increases in productivity, net income and livelihoods. There was no relationship found between the
implementation of GAPs overall or the implementation of post-harvest practices and bean quality,
indicated by the rate of rejection. This may be affected by external factors, such as the institutional
reform of the cocoa sector by the Ivorian government in 2012. Overall, higher knowledge levels are
positively related to improved implementation of GAPs, confirming the impact logic.
However, this was not the case for specific agricultural practices (waste management, and soil, water
and biodiversity protection). To ensure that these outcomes are met, particularly with the later
entrants and possible new entrants to the programme who are have slightly different characteristics,
adjustments in how the programme is implemented are recommended. The social outcomes are only
partially met, as certified farmers report better and safer working conditions. Further actions need to
be taken to include female owners in the programme and to achieve certified child labour free cocoa
farming. The ecological outcomes appear also to be only partially met: whilst chemical use complies
with national recommendations indicators of farm rehabilitation and regeneration – such as access to
improved seedlings and acquiring grafting skills – are low.
Both higher knowledge levels and improved implementation of record keeping are positively related to
increases in productivity (Figure 7). There is no relationship between the implementation of GAPs
(overall) or the implementation of post-harvest practices and bean quality, indicated by the rate of
rejection. This may be affected by external factors, such as the recent reform, which included a
requirement to meet higher bean quality standards. In the verification meeting, participants indicated
that so far this requirement has been, apparently easily, met but that the 2013 mid-season harvest
has not produced sufficient quality, due to unfavourable weather conditions.
The CPQP logic also assumes that inputs will result in higher productivity. As a smaller number of
farmers have been involved in interventions to access to fertiliser (7%), credit (24%), seedlings
(11%) and pesticides (36%), testing that higher productivity has resulted from these interventions will
be only possible in a future impact evaluation.

76 | LEI Report 2014-016
Figure 7 Correlation between impact logic and outcomes.
The impact logic (shown in Figure 3) assumes that training and adherence to the code of conduct will
lead to better crops and better environment outcomes and knowledge is turned into practice. Figure 8
shows that overall, higher knowledge levels are positively related to improved implementation of
GAPs, confirming the impact logic. However, for specific agricultural practices (waste management,
soil management, water and biodiversity protection), this is not always the case. The correlations
between the specific indicators suggest that there is a general relationship between knowledge of and
implementation of GAPs.
Figure 8 Correlations between impact logic: knowledge and implementation of GAPs. Key: + significant positive correlation between indicators, - significant negative correlation between indicators, 0 no significant correlation between indicators.

77 | LEI Report 2014-016
Table 11 shows an overview of the impact indicators, with the results and conclustions summarised.
Table 11
Overview of impact indicators.
Conclusion Results
How inclusive is the CPQP?
All farmer groups which have been included in certification
activities had received training.
The CPQP and certification has reached a large number
of farmers
Only a few farmers benefitted from crop protection products,
fertilisers and seedlings, and community and social programmes.
Women and youths are underrepresented but are
critical in current and future farming – making it crucial
to involve them more
Activities have been targeted to registered producer group
members, which are typically male farm owners and share
croppers. The vast majority of farmers were old males with old
cocoa trees.
Farm workers, particularly women and youths, had less
opportunity to be included in certification and support activities.
Partners have started focussing more on women in a number of
training and empowerment activities on a small scale.
Social
Certification may contribute to improved levels of
knowledge and implementation of best practices.
Although certified farmers had higher knowledge levels, in
general, farmer’s level of knowledge and implementation
practices were relatively low, .
The frequency, quality and quantity of training and the
competences of trainers can be improved. Farmers
prefer extension and field-based learning over
classrooms teaching
programme participants and certified farmers have statistically
significantly higher knowledge levels than non-certified farmers.
Higher knowledge levels are positively related to improved
implementation of GAPs.
Knowledge and practices can be improved on: children’s and
labour rights, personal protective equipment, waste management
and composting, weeding, record keeping, shade trees, soil
conservation and field buffer zones, fertiliser and crop protection
use, pruning, and disease management.
Respect for labour rights should be improved Generally labour rights are not well respected by any farmers,
although certified and programme participants have better
performance than non-certified farmers.
Whilst the majority of all farmers did not make formal contracts
with their labourers, more certified and programme participants
did make contracts, suggesting that lessons learnt in the Code of
Conduct are being implemented.
There is limited awareness of workers’ rights and less than 22%
of farmers had contact with lead farmers on labour rights issues.
Respect for children’s rights should be improved Only 13% of farmers could state the minimum age for children
to work on cocoa farming activities.
Participants' knowledge of prohibited activities is low, but it is
statistically significantly higher than for non-programme
participants.
Programme participants and UTZ Certified farmers make
statistically significantly more use of children (in terms of hours
spent) than their counterparts.
Lack of teachers and of access to schools is a major bottleneck.
This may be one cause of children working on farms.
Generally living and working conditions are safe, but
could be improved in some areas
Farmers indicated that a number of GAPs contributed to better
working conditions, however access to improved health care is
still poor.
About 30% of farmers have had an accident or seen someone
else have an accident during cocoa production activities (UTZ
Certified farmers had statistically significantly fewer accidents
than non-certified farmers).
Economic
Livelihoods seem to improve with participation in the
programme
Farmers were satisfied with the impact of certification and
training on their livelihoods.
Farmers indicate that implementing the GAPs taught by the
programme, led to higher productivity, quality and therefore
income.
In turn, higher incomes led to a larger proportion of the cocoa
income given to their spouses and being used to meet basic
family needs, and children’s education.
Farmers require more support on access to healthcare,
schooling and infrastructure.
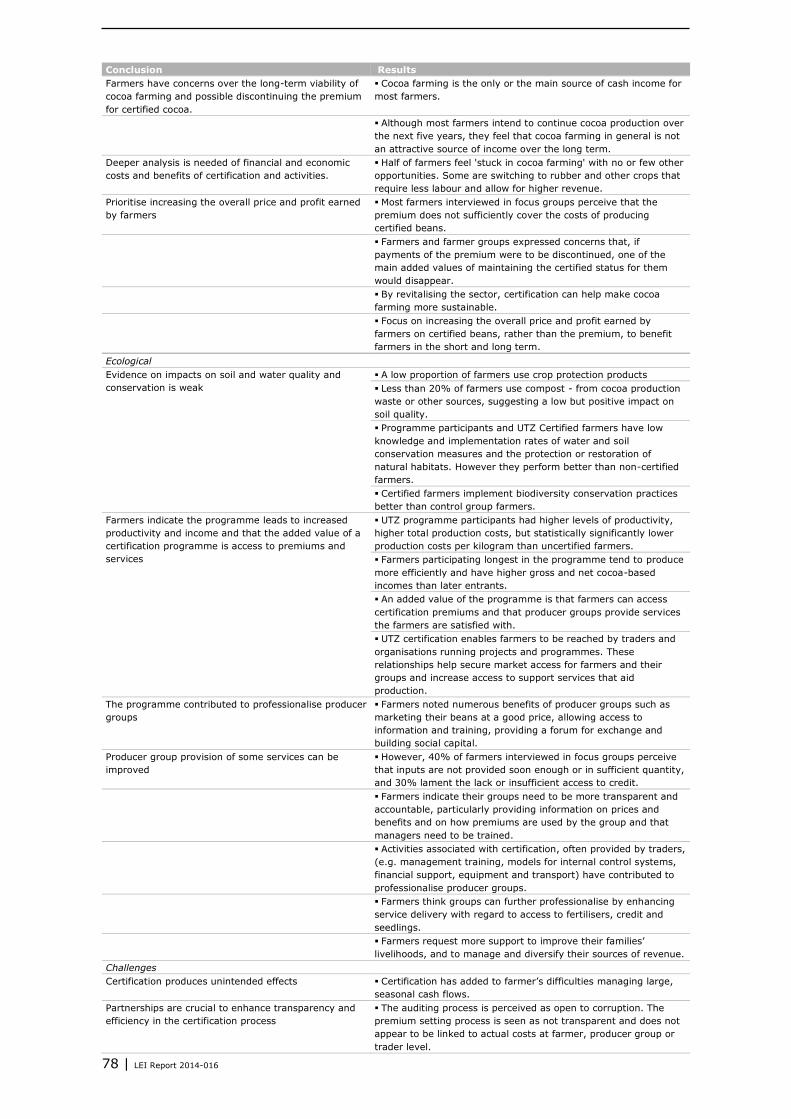
78 | LEI Report 2014-016
Conclusion Results
Farmers have concerns over the long-term viability of
cocoa farming and possible discontinuing the premium
for certified cocoa.
Cocoa farming is the only or the main source of cash income for
most farmers.
Although most farmers intend to continue cocoa production over
the next five years, they feel that cocoa farming in general is not
an attractive source of income over the long term.
Deeper analysis is needed of financial and economic
costs and benefits of certification and activities.
Half of farmers feel 'stuck in cocoa farming' with no or few other
opportunities. Some are switching to rubber and other crops that
require less labour and allow for higher revenue.
Prioritise increasing the overall price and profit earned
by farmers
Most farmers interviewed in focus groups perceive that the
premium does not sufficiently cover the costs of producing
certified beans.
Farmers and farmer groups expressed concerns that, if
payments of the premium were to be discontinued, one of the
main added values of maintaining the certified status for them
would disappear.
By revitalising the sector, certification can help make cocoa
farming more sustainable.
Focus on increasing the overall price and profit earned by
farmers on certified beans, rather than the premium, to benefit
farmers in the short and long term.
Ecological
Evidence on impacts on soil and water quality and
conservation is weak
A low proportion of farmers use crop protection products
Less than 20% of farmers use compost - from cocoa production
waste or other sources, suggesting a low but positive impact on
soil quality.
Programme participants and UTZ Certified farmers have low
knowledge and implementation rates of water and soil
conservation measures and the protection or restoration of
natural habitats. However they perform better than non-certified
farmers.
Certified farmers implement biodiversity conservation practices
better than control group farmers.
Farmers indicate the programme leads to increased
productivity and income and that the added value of a
certification programme is access to premiums and
services
UTZ programme participants had higher levels of productivity,
higher total production costs, but statistically significantly lower
production costs per kilogram than uncertified farmers.
Farmers participating longest in the programme tend to produce
more efficiently and have higher gross and net cocoa-based
incomes than later entrants.
An added value of the programme is that farmers can access
certification premiums and that producer groups provide services
the farmers are satisfied with.
UTZ certification enables farmers to be reached by traders and
organisations running projects and programmes. These
relationships help secure market access for farmers and their
groups and increase access to support services that aid
production.
The programme contributed to professionalise producer
groups
Farmers noted numerous benefits of producer groups such as
marketing their beans at a good price, allowing access to
information and training, providing a forum for exchange and
building social capital.
Producer group provision of some services can be
improved
However, 40% of farmers interviewed in focus groups perceive
that inputs are not provided soon enough or in sufficient quantity,
and 30% lament the lack or insufficient access to credit.
Farmers indicate their groups need to be more transparent and
accountable, particularly providing information on prices and
benefits and on how premiums are used by the group and that
managers need to be trained.
Activities associated with certification, often provided by traders,
(e.g. management training, models for internal control systems,
financial support, equipment and transport) have contributed to
professionalise producer groups.
Farmers think groups can further professionalise by enhancing
service delivery with regard to access to fertilisers, credit and
seedlings.
Farmers request more support to improve their families’
livelihoods, and to manage and diversify their sources of revenue.
Challenges
Certification produces unintended effects Certification has added to farmer’s difficulties managing large,
seasonal cash flows.
Partnerships are crucial to enhance transparency and
efficiency in the certification process
The auditing process is perceived as open to corruption. The
premium setting process is seen as not transparent and does not
appear to be linked to actual costs at farmer, producer group or
trader level.

79 | LEI Report 2014-016
Conclusion Results
Attribution of causality of CPQP and certification needs
testing and further investigation
Multiple certification is complex for farmers such that
rationalisation and simplifications where possible could be cost
effective .
Rapid up-scaling of certification and training may have led to
recent training of lesser quality and intensity, resulting in less
impact.
Partnerships with traders and NGOs and other certification
agencies could help minimise or mitigate such impacts.
Prior and multiple interventions and external factors, make
attribution to the CPQP at this stage difficult.
Key: + significant positive correlation between indicators, - significant negative correlation between indicators, 0 no significant correlation
between indicators.
80 | LEI Report 2014-016
8 Lessons learnt
This section summarises the main conclusions from the preceding sections. Preliminary evidence
suggests that in the last five years, the CPQP has contributed to improving the livelihoods of cocoa
farmers, their communities and their environment. Farmers and their cooperatives generally perceived
support activities as effective, relevant and adequate. However, the extent will only be apparent in
subsequent assessments. The contribution of the support activities is difficult to separate from
interventions prior to the programme and from parallel interventions. This assessment was conducted
to meet three objectives:
1. To obtain information about the baseline situation of the CPQP
2. To assess whether the activities/strategies lead to the desired outcomes (effectiveness)
3. To draw lessons learned so as to improve the quality of the programme.
And to answer three main questions:
1. Is the CPQP cocoa programme in Côte d’Ivoire inclusive? What are the characteristics of certified
farmers?
2. How do certification, voluntary standards and the related activities of implementing partners
influence knowledge and the related behaviour/practices of cocoa farmers in Côte d’Ivoire?
3. What is the added value for farmers of going through certification processes and being certified?
The findings in relation to the first objective have been detailed in Chapters 3–6. This chapter focuses
on the second and third objectives. As explained in Chapter 1, the second objective was divided into
three main research questions about the inclusiveness of the CPQP in Côte d’Ivoire, the inclusiveness
of the CPQP, about how activities have affected farmers’ knowledge and implementation of good
agricultural practices, social and environmental issues and the added value of certification. These
questions are reiterated and answered below. The recommendations are based on the interpretation of
the research team from the data gathered. Recommendations provided by the stakeholders are shown
in Box 10.
8.1 Is the CPQP in Côte d’Ivoire inclusive?
Lessons learnt
The CPQP has been inclusive in reaching all targeted farmers, but women are under-
represented. All the targeted farmers have been involved in activities such as cooperative
development support, training and assistance to become certified. A much smaller
proportion of farmers have benefited from access to associated activities that improve both
crops – such as access to crop protection products, fertilisers and seedlings – and lives,
such as community and social programmes.
Recommendations
Include workers and particularly women and youths in certification and GAP focussed
activities
Given the aging farmer population, pessimism about the future of cocoa farming, the characteristics of
both certified farmers and those who work on their farms, and how tenure is commonly organised in
Côte d’Ivoire, a change in inclusion strategy is recommended. A targeted and much broader inclusion
of female farmers and workers in certification activities could enable higher levels of implementation of
rights, as well as of good agricultural practices and adherence to the UTZ Code of Conduct. The
women farmers’ groups, nurseries and learning groups, supported by traders such as Cargill and
CEMOI and their partners, provide possible role models. They also provide opportunities for exchanges
between women’s groups about which activities and methods work best specifically targeting women.

81 | LEI Report 2014-016
8.2 How do certification and the related activities of
partners influence knowledge and the related
behaviour/practices of cocoa farmers in Côte d’Ivoire?
Lessons learnt
Certification appears to contribute to influencing the knowledge and implementation of
good agricultural practices. However, levels of knowledge and practices of programme
participants were relatively low compared to what could be expected of correct knowledge
of the standards contained in the UTZ Code of Conduct. Knowledge levels of other standards
were not measured, as these are not a focus of the CPQP. Particular areas where knowledge
and practices can be improved are environmental aspects, children's and labour rights,
personal protective equipment, waste management and composting. Stakeholders suggest
focusing on the quality and quantity of training and trainers, more adaptation to farmers
preferred learning styles of extension and field-based learning.
Recommendations
Address areas of low knowledge and implementation of good agricultural practices
Ensuring that training results in the desired knowledge and that is translated into practice is critical.
Although the certified and programme participants have a higher level of knowledge than the control
groups, the similar levels of knowledge between farmers participating in different phases indicates
that knowledge does not appear to increase over time. This is contrary to what could be logically
expected. This indicates there are possible issues to be addressed concerning how training is provided.
The main areas of low knowledge and implementation levels to focus on include:
Children’s rights and labour rights
Weeding
Record keeping
Shade trees, soil
Conservation and field buffer zones
Fertiliser and crop protection use
Pruning
Waste management
Disease management.
Stakeholders suggested that improvements could be made in the frequency, quality and quantity of
training and the competences of trainers, particularly as certification has been up-scaled. Training
could be better adapted to farmers’ learning styles, with extension and field-based learning preferred
over classroom teaching. A critical evaluation of the methods, intensity and frequency of training for
farmers at different stages of certification and participation in the programme is strongly
recommended.
Lessons learnt
CPQP support for UTZ Certification and sustainability related activities appears to contribute
to improving farmer's lives, incomes, crops and environment. This initial assessment
indicates that most impacts measureable to date have been felt on livelihoods, incomes and
productivity.

82 | LEI Report 2014-016
Recommendations
Address productivity and efficiency
Despite positive preliminary results on some indicators, many farmers indicated that although they
intend to continue producing cocoa as long as it is profitable, they do not see it as a viable future
commodity for their children. To meet this challenge and maintain high-quality production and
sustainable livelihoods, farmers’ and their producer groups’ recommendations and our conclusions
based on the study findings, are used to make recommendations on how activities could be adjusted
and improved to meet objectives.
Because of prior interventions regarding productivity and income, the multiple interventions and many
external factors, it is difficult to attribute productivity and efficiency changes to the CPQP or to any
one certification scheme. Further investigation is needed, with other types of measures used to assess
indicators. This finding mirrors N’dao’s (2012) study of Rainforest Alliance certification, which was
unable to prove that certification had had any impact on productivity increases.
Farmers’ knowledge needs to be supplemented with better and more targeted systems to increase
productivity in order to increase incomes and profits. Farmers and their producer groups need a better
understanding of their cost and benefit streams over time of participating in certification schemes,
given the signals and perceptions of farmers and producer groups about the costs of certification
costs. This reflects the results of other studies (KPMG 2012a). It implies that:
It is crucial to increase productivity and monitor progress to make cocoa farming more attractive for
farmers. The GAPs upon which UTZ Certification is based provide a good basis for helping to improve
agricultural education and adopting integrated farming systems, sustainable intensification and
renewing trees to increase productivity and incomes. These activities are sufficiently complementary
to be implemented in tandem with training and implementation of basic GAPs, demonstrated by
such activities being implemented on a project scale in Côte d’Ivoire. The knowledge and
implementation scores indicate that despite many farmers being trained in GAPs they do not
implement them, partly because cocoa production is not sufficiently profitable.
Up-scaling support to farmers to access disease-resistant tree varieties and associated farming
methods to improve soil fertility and reduce pest and diseases, could help to achieve higher
productivity.
Supporting access to appropriate, affordable inputs on a much wider scale, by working with partners
to provide access to credit and beans for inputs.
Increased and more regular in-field extension services, with farmer field schools to embed
knowledge and to ensure that the knowledge is translated into practice.
Training in improved cultivation techniques, particularly regular on-farm training followed up via
farmers’ groups. Certification and training have not bridged this gap to date, but other support
programmes have tentatively stepped in here. Certification provides a good channel to address this
collectively through continuing support, to make farmer groups responsive and proactive towards
their members’ needs. Membership of a farmer group is crucial, since farmer groups are pivotal in
providing services to their members. As the profile of the most recent participants is changing,
support activities need to adapt to farmers with larger farms in less productive regions who are less
accustomed to working in groups.
Refocus training and regular on-farm follow-ups to areas where poorer implementation scores are
apparent, particularly shade trees, fertiliser application, weeding methods, soil fertility
improvements and record keeping. This implies creatively tackling record keeping in the context of
low levels of literacy. Continue with the farmer field schools and apprenticeship with a higher quality
and regular training input; take cocoa as part of the whole farmer system approach.
Support and promotion of cocoa as a family business and as part of diversified agricultural systems,
to enable farmers to spread risks and obtain more regular income streams from different cash and
food crops.
With some adjustments and improvements, these initial impact and baseline results hint that the
UTZ Certification appears to have potential to have a positive impact on all the four themes aimed
for. On-going monitoring of impacts is essential if the sustainability of activities is to be ensured and
enhanced.

83 | LEI Report 2014-016
Address profitability
Because both farmers and their trees are old and have low (and very likely declining) rates of
productivity, and around half of farmers have no other incomes sources but cocoa, today’s cocoa
farmers do not see cocoa farming as a viable option for the next generation. Other crops and activities
are seen as more profitable, easier, less risky and providing more regular income streams. This
combination of factors may lead to decreasing production and incomes within a decade. Support
activities appear to contribute to prosperity, and the premium is valued – particularly in the first years
of certification – but the baseline evidence suggests that payback takes time. Although traders bear
many of the upfront costs of becoming certified, there is a need to close this gap to keep cocoa
farming attractive. This means increasing investment and ensuring that partnerships can continue to
support farmers, providing alternatives to create more diversified farms, and professionalising those
farmers with potential. This will involve changing farmer and producer group mind-sets from donor-
driven to business-driven and rolling out broad entrepreneurial support for those that demonstrate
interest. In particular, it is crucial to:
Support farmers and their workers – both male and female – to have sustainable, diversified
livelihoods from other subsistence and cash crops that complement cocoa, and to test new business
models, such as intensification and contract farming. This means engaging women farm labourers to
participate and working with women to explore how they can be empowered to have more say in
proportion with the effort they put into cocoa farming
Continue working with the private sector, civil society partners and the government, to ensure viable
livelihoods for farmers and their children and effective partnerships.
Maintain and increase the certification premium to enable certification to be fully covered for farmers
and for farmer groups in the future. In parallel, ways to increase the kilogram price for farmers
could be even more beneficial in increasing farmers’ additional income.
Support to cut the costs that are associated with activities related to multiple certification schemes –
for example, audit and record keeping costs for farmers and farmer groups.
Long-term strengthening and accompaniment of farmer group, especially those newly formed, to
keep them well-managed and continuing to meet their members’ needs by providing effective,
efficient, inclusive, professional services.
Training farmers to manage revenues and to farm more professionally.
Strengthen the business case for young entrepreneurs to farm cocoa, including diversification of
products and improvement in farm management.
Support pre-financing by farmer groups for cocoa purchases and/or support for farmer groups and
families to obtain credit.
Continued focus on addressing rights
Despite the training and awareness programmes, gaps still exist between practices and the rights of
the workers and children. Support activities that focus on the viability of cocoa farming in the long
term need to ensure that children learn the art of cocoa farming safely and responsibly.
Gaps and risks for the entire supply chain concern child labour, working conditions and labour rights.
Continuing actions are needed to ensure that the rights of children and workers are universally
known and respected.
This could include support for the provision of schools and day care, and continued training and
awareness raising about child labour and labour rights issues. As these problems are rooted in a
combination of factors, continued partnerships, including with the government, are ways to work
towards solutions.
Change the focus of training and regular on-farm follow-ups to areas where poorer knowledge and
implementation scores are apparent for labour rights and children’s work.
Monitoring and noncompliance-reporting mechanisms, as well as follow-up actions, can support this.
A more targeted and much broader inclusion of female farmers and workers in support activities
could enable higher levels of implementation of rights, as well as of good agricultural practices. The
women farmers’ groups, nurseries and learning groups – supported by Cargill and Solidaridad and
by other organisations – provide possible role models and opportunities for exchanges on which
activities and methods work best.

84 | LEI Report 2014-016
Partnerships to ensure transparency and dialogue and efficiency
Partnerships have been important in bringing in different and relevant expertise to meet the diverse
needs of the many farmers participating in the programme. Dialogue and harmonisation are essential,
with direct and indirect impacts considered prior to engaging partnerships and implementing diverse
support activities. A concerted dialogue – such as though platforms with other traders – with the
government, development agencies, civil society and NGOs is needed to address issues outside of
IDH, certification standards and other partners’ spheres of influence. Transparency in the programme
and in processes is important, given that corruption in auditing and the premium setting process are
highlighted as issues.
Address ecological improvement
This study shows that the main activity that aims to have environment impacts is certification. Levels
of knowledge and implementation of practices that will enhance environmental protection and
restoration are, however low, although they appear to increase the longer farmers participate in
certification schemes. However, both the findings from this study with its focus on UTZ certification,
and N’dao’s (2012) study of Rainforest Alliance certification, are unable to prove the causality and
impact of GAPs included in certification standards on the environmental performance indicators. Long-
term field measures are needed to establish impact and determine causality, given the high possibility
that other external factors affect many of the environmental indicators.
Address market rewards
The timescales of investment and benefit flows associated with switching to sustainable production
systems are only beginning to be understood. At the moment, the costs of sustainable, certified
production for farmers and producer groups do not appear to be fully rewarded by the market or
perceived as such by farmers. This is a burden they can ill afford.
Farmers and farmer groups need to be more aware and engaged in the debate about the equitable
distribution of costs and benefits though the supply chain, and about the timescales of the
anticipated flows of costs and benefits prior to engaging in activities. To date, costs are not well
understood, particularly at farmer and producer group level, and appear largely underestimated or
focused on net income rather than gross profitability. This is partly because different parties in
certification bear different costs, and farmers and producer groups are not aware of the full costs of
certification. Working with producer groups and farmers to calculate the costs and flows of benefits
over time is strongly recommended to allow all parties to make more informed decisions.
The continued stimulation of demand for sustainable cocoa and the willingness to pay for its costs is
essential to create truly sustainable supply chains and to secure demand.
Market rewards for sustainable production also need to consider what is sustainable from the
farmers’ perspective and not only from the perspectives of the industry and certification schemes.
There may be alternative paths to reward farmers for sustainable farming practices that also make
cocoa farming more attractive, also to address farmers’ problems of minimising the risks attached to
a globally traded cash crop.
It is essential to continue to stimulate demand for sustainable cocoa and the willingness to pay for
its costs to create truly sustainable supply chains and to secure demand.
8.3 What is the added value for farmers of going through
the certification processes and being certified?
Lessons learnt
Certification has provided a means to rapidly up-scale sustainable cocoa production and
allow farmers to access certified markets where they can benefit from premium prices that
reward sustainable production. Certification has promoted producer associations that
farmers perceive as providing a range of benefits.

85 | LEI Report 2014-016
By organising farmers into cooperatives and aiding their professionalisation, activities have been up-
scaled to over 44,000 UTZ Certified farmers and increased to an unknown number of Rainforest
Alliance certified farmers across the country.22
Partnerships thus appear critical channels that add
value to certification for farmers. They may possibly enhance their effectiveness and efficiency, as
duplications of effort are avoided. The perceived negative impact of multiple certification schemes
for farmers, cooperatives and traders is an example of where collaboration and partnerships could
help minimise or mitigate negative impacts. The many different activities implemented by traders in
the framework of the CPQP, certification and associated activities (see Tables 8 and 9 in Chapter 3),
highlight that certification has an added value not only for farmers but also for traders and for
organisations that run projects and programmes.
The premium price received by farmers for certified cocoa is perceived by farmers as one of the
important added values of certification. It is an important motivation for farmers to become
certified. Although the premium is an incentive for farmers to join certification, particularly in the
earlier stages of participation in the programme when the expected productivity and quality
increases have not yet become apparent, it is small, representing 7% of the total kilogram price. A
high level of attention is given to the premium, due to most cooperatives paying it out separately
from the main payment for beans. The premium is also used as means to create loyalty and
recognition between farmers, their cooperatives and traders. Farmers and cooperatives expressed
concerns that if payments of the premium were to be discontinued, one of the main added values of
maintaining the certified status would disappear.
Certification influences trading practices to produce a range of positive outcomes. UTZ Certified
farmers, as members of a cooperative, have access to traders and tend to sell only to the traders
who have provided them with support. For traders, this loyalty provides a secure source of certified,
good quality bean supplies. These relationships help secure market access for farmers and their
cooperatives and increase access to support services that aid production. They also allow access to
other social and community activities, which have lower priority but are still seen as important by
farmers.
Certification has supported and promoted collective action in the form of cooperatives. Farmers note
numerous benefits of collective action, such as marketing their beans at a good price, access to
information and training, providing a forum for exchange and building social capital. It has
contributed to some farmers believing that cocoa is a viable cash crop. Certification has aided access
to seedlings, crop protection products and credit. Activities associated with certification, often
provided by traders, have also contributed to professionalise cooperatives, by providing training,
internal control systems, financial support and transport.
Certification has also had some unintended consequences. It has added to farmers' difficulties in
managing large, seasonal cash flows. The auditing process is perceived as open to corruption. The
premium setting process is not transparent and appears unlinked to actual costs at farmer,
cooperative or trader level. Multiple certification is complex and has been difficult for some traders
and cooperatives to manage. The rapid up-scaling of certification related activities (especially
training) has led some partners and cooperatives to believe that the quality of training (and possibly
its impacts) has varied due to a lack of minimum quality standards.
22
The COSA (2012) summary indicates an increase of Rainforest Alliance farmers worldwide, but does not specify how many
are located in Côte d’Ivoire.
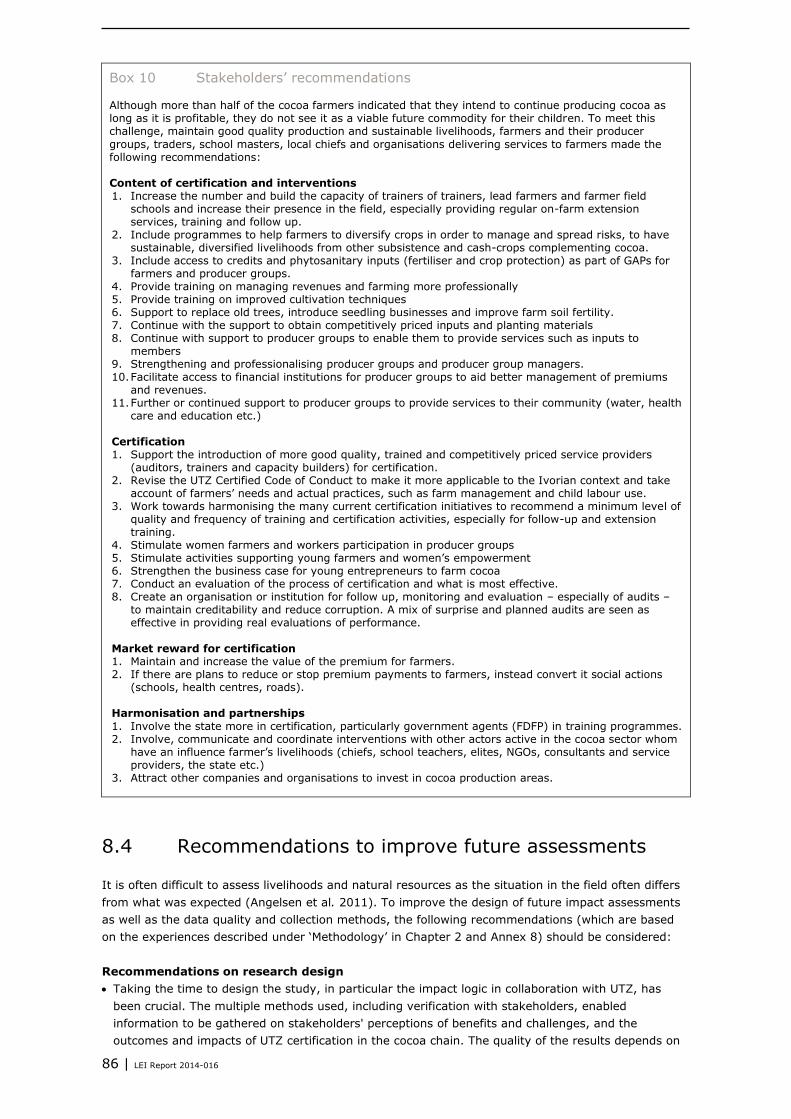
86 | LEI Report 2014-016
Box 10 Stakeholders’ recommendations Although more than half of the cocoa farmers indicated that they intend to continue producing cocoa as long as it is profitable, they do not see it as a viable future commodity for their children. To meet this challenge, maintain good quality production and sustainable livelihoods, farmers and their producer
groups, traders, school masters, local chiefs and organisations delivering services to farmers made the following recommendations: Content of certification and interventions 1. Increase the number and build the capacity of trainers of trainers, lead farmers and farmer field
schools and increase their presence in the field, especially providing regular on-farm extension services, training and follow up.
2. Include programmes to help farmers to diversify crops in order to manage and spread risks, to have sustainable, diversified livelihoods from other subsistence and cash-crops complementing cocoa.
3. Include access to credits and phytosanitary inputs (fertiliser and crop protection) as part of GAPs for farmers and producer groups.
4. Provide training on managing revenues and farming more professionally 5. Provide training on improved cultivation techniques 6. Support to replace old trees, introduce seedling businesses and improve farm soil fertility. 7. Continue with the support to obtain competitively priced inputs and planting materials 8. Continue with support to producer groups to enable them to provide services such as inputs to
members 9. Strengthening and professionalising producer groups and producer group managers. 10. Facilitate access to financial institutions for producer groups to aid better management of premiums
and revenues. 11. Further or continued support to producer groups to provide services to their community (water, health
care and education etc.) Certification 1. Support the introduction of more good quality, trained and competitively priced service providers
(auditors, trainers and capacity builders) for certification. 2. Revise the UTZ Certified Code of Conduct to make it more applicable to the Ivorian context and take
account of farmers’ needs and actual practices, such as farm management and child labour use. 3. Work towards harmonising the many current certification initiatives to recommend a minimum level of
quality and frequency of training and certification activities, especially for follow-up and extension training.
4. Stimulate women farmers and workers participation in producer groups 5. Stimulate activities supporting young farmers and women’s empowerment 6. Strengthen the business case for young entrepreneurs to farm cocoa 7. Conduct an evaluation of the process of certification and what is most effective. 8. Create an organisation or institution for follow up, monitoring and evaluation – especially of audits –
to maintain creditability and reduce corruption. A mix of surprise and planned audits are seen as effective in providing real evaluations of performance.
Market reward for certification 1. Maintain and increase the value of the premium for farmers. 2. If there are plans to reduce or stop premium payments to farmers, instead convert it social actions
(schools, health centres, roads). Harmonisation and partnerships
1. Involve the state more in certification, particularly government agents (FDFP) in training programmes. 2. Involve, communicate and coordinate interventions with other actors active in the cocoa sector whom
have an influence farmer’s livelihoods (chiefs, school teachers, elites, NGOs, consultants and service providers, the state etc.)
3. Attract other companies and organisations to invest in cocoa production areas.
8.4 Recommendations to improve future assessments
It is often difficult to assess livelihoods and natural resources as the situation in the field often differs
from what was expected (Angelsen et al. 2011). To improve the design of future impact assessments
as well as the data quality and collection methods, the following recommendations (which are based
on the experiences described under ‘Methodology’ in Chapter 2 and Annex 8) should be considered:
Recommendations on research design
Taking the time to design the study, in particular the impact logic in collaboration with UTZ, has
been crucial. The multiple methods used, including verification with stakeholders, enabled
information to be gathered on stakeholders' perceptions of benefits and challenges, and the
outcomes and impacts of UTZ certification in the cocoa chain. The quality of the results depends on

87 | LEI Report 2014-016
the combination of the design, timing, tools chosen and used and the capacities of the research
team. The capacities of the client to steer, clarify, deliver data and input also affect the result.
Finally, the context of the sector and in the country has an influence.
The impact logic (theory of change) proved an essential tool to define and clarify assumptions, and
predict unintended effects and external influences. It is recommended that the impact logic should
be reviewed at least every two years in order to reflect changes in the operation and aims of the
UTZ Certification programme.
Allocating a longer time period to discuss and budget the design and allowing the research questions
to determine the method, and not vice versa, is important. With hindsight, data on productivity and
environmental indicators could have been more effectively gathered using different methods
(structural in-field observations on implementation of practices, measurements of yields and
productivity, farmer logbooks for costs and incomes; audit, ICS and cooperative records;
environmental monitoring, satellite images). These methods, however, have cost and time
implications.
Combining the requirements of several clients (IDH, UTZ, Cargill/Solidaridad) turned out to be an
efficient and cost-effective way of implementing the research, as it created economies of scale and
enabled a large sample to be interviewed. In hindsight, logistical problems and delays in obtaining
data and accessing certain cooperatives had major repercussions for the time scale of data
collection, and caused delays in deliverables for all parties. It is recommended to carefully consider
the number of partnerships and implications for logistics of future studies’ planning and deliverables.
The general feeling among participants was that the validation workshop successfully achieved its
aims. Future studies are recommended to follow a similar approach, but to include other
stakeholders – such as farm workers and government representatives – and more service providers,
women and youths.
Recommendations on research methods
The difficulties in confirming the status of cooperatives and their affiliations with traders indicates
that more time should be taken to verify this in conjunction with UTZ, cooperatives and traders prior
to interviews in the field.
The male and female enumerators, their language skills, experience in the sector and training
resulted in a very low rejection rate of interviews, with only one respondent refusing an interview.
It is recommended to use the mix of one-on-one producer interviews and focus groups, and other
stakeholder interviews as the mix allowed more sensitive data to be verified and triangulated.
The use of most significant change story-telling accompanied by photos and video was not
successful in providing a large amount of qualitative and visual data due to the inexperience of the
team with this method. If future teams undergo the relevant training, this could be a useful method
to provide contextual and qualitatively rich data.
The GPS-based field measurements enabled the validation of farm sizes and confirmed that
significant over- and under-estimates of farm size by farmers occurs. It is recommended to continue
measuring a sample and to work more closely with traders and ANADER, who are conducting a
similar exercise, to obtain better insights into farmer productivity.
Data entry and checking should be done directly after the interviews and preferably by the
enumerators with a supervisor. Future assessments should consider possibilities to enter data
directly into an intermediate database (i.e. tablet-based and possibly online) before transferring to
a statistical software package, to save time and minimise errors.
If a larger amount of qualitative data is collected in future assessments, the use of specialist data
analysis programmes may be effective to code and analyse data. Due to the modest quantity of
qualitative data collected, the use of specific qualitative data analysis software was not considered to
be efficient. The use of Excel and Stata programmes to process quantitative data is recommended,
and will allow current and future datasets to be easily combined.
This study provides a baseline assessment and coordinated data on certification activities during and
prior to the programme period. It is recommended that these data be streamlined and included in
the UTZ Certified monitoring and evaluation system, to facilitate data collection of key impact
assessment indicators to be systematically and regularly gathered and analysed.

88 | LEI Report 2014-016
To interview the same farmers in subsequent monitoring and impact assessments, traders,
cooperatives and farmers need to be warned in advance to ensure their presence on their farm/in
the community on the day of the survey. This holds true especially for owners, who may not
necessarily be present on-farm.
The current study was based on periodic and one-off 'snapshot' data. By collecting longitudinal data,
data from a specific period can be better placed in context. For example, on-going monitoring of a
selected number of individuals and stakeholders could provide detailed histories of the impacts of
interventions and provides stories with a 'face', and using farmer logbooks could provide more
accurate data on livelihood impacts. A panel of farmer and worker households could provide
systematised gathering of perceptions. The rapid improvement in access to the internet and phone
networks and their decreasing cost in Côte d’Ivoire mean that methods using mobile and internet-
based data collection may be possible for some technology literate farmers and workers.
Adjustments to the audit and ICS may allow a limited amount of additional data to be periodically
collected.
Recommendations on the representativeness of the sample
Explicit efforts were made to interview women and youths during the stakeholder interviews.
However, the nature of the programme such that the focus is on certified farmers led to only a small
number of interviews with female farmers. It is recommended to include an additional target group
of workers to measure inclusiveness. A small, specific study would also enable a baseline to be set
that could complement the current study and allow a comprehensive mid-term impact evaluation.
These experiences suggest that future assessments should more systematically survey women and
young male workers on cocoa farms. The sampled population of certified farmers is believed to be
not representative of those working on cocoa farms, with a much higher proportion of older men
than indicated in the literature, by stakeholders and in the verification meeting. In future monitoring
and impact studies, it is recommended to sample both certified farmers and their farm workers, and
to include workers as a separate group of stakeholders, as outcomes and impacts are believed to be
different for farmers and different types of workers, as indicated by a study in Ghana (de Jong
2012).
Recommendations on data presentation
Although a large number of images were collected by the enumerators and study team, providing
images of impacts and activities, many are not of professional quality and provide a one-off
snapshot in time. A professional photographer and/or film team would provide images of a higher
quality to support the impact assessment and over time and during different stages of certification
and the study, such as the verification meeting. The visualisation of impacts through photo stories
and accompanying storytelling by stakeholders could also enhance data presentation.
Recommendations on indicators
Whether the observed improvements will continue needs to be verified in future assessments.
Continued monitoring of the fifteen indicators can help better understand how activities are leading
to outcomes and impacts. For future assessments, different questions may be asked, calling into
question whether the same indicators should be used or different indicators are needed. The time
and effort required to collect data on the large number of indicators and the limited effectiveness of
some indicators suggest that a smaller number of key indicators for regular monitoring and follow-
up assessment should be selected. The length of the survey could then also be shortened.
The indicators the research team believe most useful were (1) farmer characteristics, (2) farm
efficiency, (3) productivity, (5) profitability, (6) livelihood perceptions and needs, (7) labour rights,
(8) child labour, (9) working conditions, (11) inclusiveness, (14) cooperative services and (15)
sustainable practices and market rewards. For indicators 4 and 5, more accurate production costs
(based on data recorded by farmers) and measured farm sizes are needed. For indicators 7, 8 and
9, would be enhanced were it combined with audit results and unannounced audits. It may be
possible to use data produced by other government and NGFO initiatives monitoring child labour.
For indicator 11 (inclusiveness), better comparative data on the average Ivorian cocoa farmer and
worker would make the use of this indicator more robust, as would explicit targeting of specific
groups by the programme partners. Indicator 14 should be always complemented with cooperative
interviews to provide both sides of the story.

89 | LEI Report 2014-016
In retrospect, the following indicators were not so useful. Indicator 4 (on quality) is obsolete due to
the government reforms, which now set quality standards. If quality is to remain an indicator,
it should be measured by comparing traders’ data on rejections and quality, and cooperatives’ data.
The environmental indicators (13, 14 and 15) could be measured using field-based data using
different methods. For instance, GIS and satellite images of deforestation satellite to provide more
meaningful evidence of impacts.
Other tools could be used to gather both quantitative and qualitative data on indicators and using
other sources such as UTZ Certified ICs and audits, cooperatives and traders. This requires making
agreements about data sharing and confidentiality, and the use and publication of such results.
90 | LEI Report 2014-016
References and websites
Abbott, P., M. Wilcox and W. A. Muir (2005). ‘Corporate social responsibility in international cocoa
trade.’ Purdue University, West Lafayette.
ADM (2011). Our Commitment to Sustainable Cocoa, Archer Daniels Midland Company: 12.
Alonghi, T. (2011). ‘Côte d’Cocoa The Political and Social Effects of Côte d’Ivoire’s Cocoa Sector.’
Jackson School Focus 2(2): 62-.
Amoah, F. M. (2009). PUBLIC SECTOR POLICY ON SUSTAINABLE COCOA ECONOMY. 2nd Roundtable
(RSCE2). Abidjan, Côte d’Ivoire Roundtable for a Sustainable Cocoa Economy: 22.
Angelsen, A., H. Larsen, J. Lund, C. Smith-Hall and S. Wunder, Eds. (2011). Measuring livelihoods and
environmental dependence: methods for research and fieldwork. Edinburgh, UK, Earthscan.
Ayenor, G. K., N. Röling, A. v. Huis, B. Padi and D. Obeng-Ofori (2007). ‘Assessing the effectiveness of
a local agricultural research committee in diffusing sustainable cocoa production practices: the
case of capsid control in Ghana.’ International Journal of Agricultural Sustainability 5((2&3)): 109-
123.
Baah, F., V. Anchirinah and A. Badu-Yeboah (2009). ‘Perceptions of extension agents on information
exchange with cocoa farmers in the Eastern region of Ghana.’ Scientific Research and Essay 4(7):
694-699.
Benjamin, D. and A. Deaton (1993). ‘Household welfare and the price of coffee and cocoa in Ghana
and the Côte d’Ivoire. Lessons from the Living Standards Surveys.’ The World Bank Economic
Review 7(3): 293-318.
Blommer, P. (2011). ‘A Collaborative Approach to Cocoa Sustainability. The supply threat is real.
Aggregation of farmers remains the single biggest challenge to overcome.’ The manufacturing
confectioner (May): 19026.
Cargill (2011). Support for Cocoa-Producing Communities in Côte d’Ivoire: Improving livelihoods
through basic healthcare, increasing safe drinking water supplies and addressing child labor. Rural
Development Initiative: 2.
Cargill (2012a). The Cargill cocoa promise. Making a difference in Côte d’Ivoire, Cargill: 16.
Cargill (undated-a). Rural Development at Cargill. Rural Development Initiative: 3.
Cargill (undated-b). UTZ Certified chocolate. Excellent flavour, sustainably produced, independently
audited. Cargill Cocoa & Chocolate.
Cargill, C. (2012b). Support for cocoa-producing communities in Côte d’Ivoire: Improving livelihoods
through basic healthcare, increasing safe drinking water supplies and addressing child labor,
CARGILL: 2.
CEMOI. (undated). ‘Cocoa’s origins. The different origins of CEMOI cocoa.’ from
http://www.cemoi.fr/en/our-network/cocoa-origins/.
COSA (2012). Côte d’Ivoire Cocoa: COSA Survey of Rainforest Alliance Certified Farms - 2009-2011.
New York, Rainforest Alliance, COSA.
CTA (2012). Côte d’Ivoire’s cocoa sector reforms 2011–2012. Special Reports Agritrade. Wageningen,
The Netherlands, CTA, Technical Centre for Agricultural and Rural Cooperation 12.
Republique de Côte d'Ivoire. (2008). La Liste des Substances Actives de Pesticides qui peuvent etre
utilises dans La Cacaoculture a compter Du 1er Septembre 2008. Annexe 3A du Manuel
d’utilisation de pesticides dans la cacaoculture suivant le Règlement 149/2008/EEC de l’Union
Européenne. M. D. L’AGRICULTURE: 3.
de Jong, F. (2012). A realist evaluation approach for impact measurement. Case of UTZ certification of
cocoa in Ghana. MSc Development and Rural Innovation (MDR), Wageningen University.
Dormon, E. N. A., A. v. Huis, C. Leeuwis, D. Obeng-Ofori and O. Sakyi-Dawson (2004). ‘Causes of low
productivity of cocoa in Ghana: farmers' perspectives and insights from research and the socio-
political establishment.’ NJAS Wageningen journal of life sciences 52(3/4): 237-259.
Doss, C. R. (2002). ‘Men's Crops? Women's Crops? The Gender Patterns of Cropping in Ghana.’ World
Development 30(11): 1987–2000.
Eberhard Krain, E. M., Edmond Konan, Eric Servat (2011). Trade and Pro-Poor Growth: Introducing
Rainforest Alliance Certification to Cocoa Production in Côte d’Ivoire. Project, AfT category 2

91 | LEI Report 2014-016
(CRS code 25010). Eschborn, Germany, Deutsche Gesellschaft für Internationale Zusammenarbeit
(GIZ) GmbH.
FSG (2009). Managing Risk in Côte d’Ivoire’s Cocoa Sector. Boston, Geneva, San Francisco, Seattle,
World Bank: 19.
GBCG (2012). Étude sur les coûts, les avantages et les désavantages de la certification du cacao
(phase I). Abidjan, Global Business Consulting Group, ICCO.
Gbêhi, C. and C. Leeuwis (2012). ‘Fostering demand-oriented service delivery? A historical
reconstruction of first experiences with ‘private funding, public delivery’ extension in Benin.’
Knowledge Management for Development Journal 8(2-3): 105-127.
Global Witness (2007). Hot chocolate: How cocoa fuelled the conflict in Côte d’Ivoire. Washington DC,
Global Witness: 72.
Gockowski, J. and D. Sonwa (2008). Biodiversity and smallholder cocoa production systems in West
Africa. STCP Working Paper Series T. S. T. C. P. (STCP). Ghana/Cameroon, International Institute
of Tropical Agriculture (IITA). Issue 6: 21.
Gray, L. and M. Kevane (1999). ‘Diminished access, diverted exclusion: Women and land tenure in
sub-Saharan Africa.’ African Studies Review: 15-39.
Guesnet, L., M. Müller and J. Schure (2009). Natural Resources in Côte d’Ivoire: Fostering Crisis or
Peace? The Cocoa, Diamond, Gold and Oil Sectors. Bonn, Bonn International Centre for Conversion
BICC: 84.
Hainmueller, J., M. J. Hiscox and M. Tampe (2011). BASELINE SURVEY: PRELIMINARY REPORT
Sustainable Development for Cocoa Farmers in Ghana. Cambridge, MA, MIT and Harvard
University.
Hatløy, A., T. A. Kebede, P. J. Adeba and C. Elvis (2012). Towards Côte d’Ivoire Sustainable Cocoa
Initiative (CISCI) Baseline Study Report, FAFO.
ICCO (201`2). The World Cocoa Economy: Past and Present. EX/146/7. London, ICCO: 43.
ICCO (2013). ‘Cocoa year 2012/13.’ ICCO Quarterly Bulletin of Cocoa Statistics XXXIX(2): 1.
IDH (2012). CPQP. The Cocoa Productivity and Quality Program, IDH: 9.
IIPRI (2002). Empowering women. Cocoa and Land Rights in West Africa. Washington, DC,
International Food Policy Research Institute: 8.
IITA (2002). Summary of Findings from the Child Labor Surveys In the Cocoa Sector of West Africa:
Cameroon, Côte d’Ivoire, Ghana, and Nigeria 5.
IITA (2009). Baseline Constraints Analysis and Research Needs for Cocoa and Other Tree Systems
Planning Meeting of the Horticulture and Tree Crops Program, November 24, 2009: 13.
International Institute of Tropical Agriculture (2006). ‘Women Cocoa Farmers in Ghana Have
Something to Smile About!’ STCP Newsletter(15): 6.
Keladoué, F. (2010). Evaluation des efforts de formation des producteurs par le STCP Cöte d’Ivoire.
STCP,. Côte d’Ivoire, International Institute of Tropical Agriculture. Version provisoire:: 27.
Kessler, J. J., J. Brons, L. Braam, M. v. Kuijk and P. Pelders (2012). Social & Economic Effects of Value
Chains of Tropical Agro-commodities & Sustainability Initiatives. Final Report. Amsterdam,
Aidenvironment - Planbureau voor de Leefomgeving (PBL): 192.
Koning, N. B. J. and R. A. Jongeneel (2006). Food sovereignty and export crops: could ECOWAS create
an OPEC for sustainable cocoa? Forum Régional sur la Souveraineté Alimentaire, Ouagadougou,
ROPPA.
KPMG (2012a). Certification and biodiversity. Exploring improvements in the effectiveness of
certification schemes on biodiversity, KPMG Advisory: 60.
KPMG (2012b). Cocoa Certification A study on the costs, advantages and disadvantages of cocoa
certification The Netherlands, The International Cocoa Organization (ICCO): 99.
Läderach, P. (2011). Predicting the Impact of Climate Change on the Cocoa-Growing Regions in Ghana
and Côte d’Ivoire Final report. Decision and Policy Analyses (DAPA) programme at the
International Center for Tropical Agriculture (CIAT). Managua, Nicaragua, Climate Change
Agriculture and Food Security, International Centre for Tropical Agriculture CIAT: 35.
N’Dao, Y. (2012). Rationalités, changements de pratiques et impact des standards durables sur les
petits producteurs: le cas de Rainforest Alliance en Côte d’ivoire. Master Recherche 2 –
Agriculture, Alimentation et Développement Durable Master Recherche Universite Montpellier 1,
CIHEAM IAM Montpellier, Montpellier Superagro.
NATRA (2013). 2020 Commitment to Corporate Social Responsibility, NATRA E.S.: 16.
NCA (2012). ‘Cooperatives, Training Hold Key To Sustainable Cocoa.’ NCA Journal 32(Spring): 36.

92 | LEI Report 2014-016
Nestle (2012). Addressing Child Labor in Nestlé’s Cocoa Supply Chain. in Côte d’Ivoire Stakeholder
Consultation. November 26, 2012. Nestlé R&D Center, Yopougon, Abidjan
Noble Group. (2013a). ‘Cocoa.’ Retrieved 10 September 2013, 2013, from
http://www.thisisnoble.com/index.php?option=com_content&view=article&id=68&Itemid=92&lan
g=en&device=desktop.
Noble Group. (2013b). ‘Increasing the Income of Cocoa and Coffee Producers.’ Retrieved 10
September 2013, 2013, from
http://www.thisisnoble.com/index.php?option=com_content&view=article&id=1408&Itemid=667&
lang=en&device=desktop.
Noble Group (2013c). Sustainable cocoa 15.
Nyemeck, J., J. Gockowski and G. B. Nkamleu (2007). The role of credit access in improving cocoa
production in West African countries. AAAE Conference, Ghana, AAAE.
Ojo, A. D. and I. Sadiq (2010). ‘Effect of Climate Change on Cocoa Yield: a case of Cocoa Research
Institute (CRIN) farm, Oluyole local Government Ibadan Oyo State.’ Journal of Sustainable
Development in Africa 12(1).
Oxfam International (2009). Towards a Sustainable Cocoa Chain: Power and possibilities within the
cocoa and chocolate sector. Oxfam Research Report. Abidjan, Oxfam International: 24.
Oxfam International (2013). Behind the brands. Food justice and the ''Big 10‟ food and beverage
companies. Oxfam Briefing Paper 166: 52.
Paschall, M. and D. Seville (2012). Certified Cocoa: scaling up farmer participation in West Africa.
Case Study Series, New Business Models for Sustainable Trading Relationships: 28.
Rosenberg, D., Ecom, M. Eckstein, WWF, C. Brett and Olam (2009). Traders as agents of sustainability
in coffee and cocoa supply chains. Utrecht, IDH: 17.
Ruf, F. (2007). The cocoa sector. Expansion, or green and double green revolutions. London, ODI: 3.
Ruf, F. and J.-L. Agkpo (2008). Etude sur le revenu et les investissements des producteurs de café et
de cacao en Côte d’Ivoire Rapport final, Mai 2008, Cardno Agrisystems Limited – Lead Member of
Agrisystems Consortium: 118.
Ruf, F., Y. N'Dao and S. Lemeilleur (2013). Certification du cacao, stratégie à hauts risques. Inter-
Réseaux Developpment Rural: 1-7.
SAN (2010). Comparison of SAN standards vs. other voluntary agriculture standards. Agriculture
standard systems comparison SAN secretariat,: 5.
Sustainable Agriculture Network (2009). Interpretation Guidelines - Indicators for Sustainable Cocoa
Production in Côte d’Ivoire (Côte d’Ivoire) Rainforest Alliance: 19.
Ton, G., J. L. F. Hagelaar, A. Laven and S. Vellema (2008). Chain governance, sector policies and
economic sustainability in cocoa; A comparative analysis of Ghana, Côte d'Ivoire, and Ecuador.
Wageningen, Wageningen International: 40.
Ton, G., S. Vellema and M. de Ruyter de Wildt Lei (2011). ‘Development impacts of value chain
interventions: how to collect credible evidence and draw valid conclusions in impact evaluations?’
Journal on Chain and Network Science 11(1): 69-84.
UTZ Certified (2009a). UTZ CERTIFIED Good Inside - List of Definitions For Cocoa. Version 1.0 - April
2009. Amsterdam, UTZ Certified Foundation: 6.
UTZ Certified (2009b). UTZ CERTIFIED Good Inside Code of Conduct For Cocoa Version 1.0 - April
2009. Amsterdam, UTZ Certified Foundation: 33.
UTZ Certified (2009c). UTZ CERTIFIED Good Inside Code of Conduct For Cocoa. Annex: Guidance
Document. Version 1.0 - July 2009. Amsterdam, UTZ Certified Foundation: 18.
UTZ Certified (2010). UTZ CERTIFIED Good Inside Certification Protocol. Version 2.0 February 2010
(previously version March 2009). Amsterdam, UTZ Certified Foundation: 42.
UTZ Certified (2012a). UTZ CERTIFIED Good Inside List of Banned Crop Protection products.
Amsterdam, UTZ Certified: 8.
UTZ Certified (2012b). UTZ CERTIFIED Good Inside List of Banned Crop Protection products. Version
June 2012. Amsterdam, UTZ Certified Foundation: 8.
UTZ Certified and Solidaridad (2009). The role of certification and producer support in promoting
gender equality in cocoa production, UTZ CERTIFIED, Solidaridad-Certification Support Network,
Oxfam Novib: 43.
Vogel, C. and C. Schmitz-Hoffmann (2010). Comparison of Private-Sector Standards applicable to
Cocoa Production. Berlin, Deutsche Gesellschaft für Technische Zusammenarbeit (GTZ)
Programme Office on Social and Ecological Standards (4504): 27.

93 | LEI Report 2014-016
VOICE Network (2012). Cocoa Barometer. The Netherlands.
Waarts, Y., L. Ge, G. Ton and J. v. d. Mheen (2013). A touch of cocoa, Baseline study of six UTZ-
Solidaridad cocoa projects in Ghana. LEI report 2013-048. Wageningen, the Netherlands, LEI
Wageningen UR,.
WCF and IDH (2012). Fertilizer Workshop - minutes. Abidjan, Côte d’Ivoire, WCF, IDH: 5.
Zuidema, P. A., P. A. Leffelaar, W. Gerritsma, L. Mommer and N. P. R. Anten (2005). ‘A physiological
production model for cocoa (Theobroma cacao): model presentation, validation and application.’
Agricultural Systems 84(2): 195-225.
94 | LEI Report 2014-016
Work Plan Annex 1
Approach
The methodology will build upon that developed for the UTZ Ghana cocoa baseline assessment,
but will be enriched with more qualitative methods, revised indicators, pathways and outcomes, and
improved reporting format. Maintaining this method allows comparability between countries. The
process of conducting the assessment is conducted in the 10 main steps described below.
Activity 1: Review Theory of Change and indicators
The team will first refine the research questions, developing upon the research questions stated in
the discussions. LEI will have a separate session with the IDH cocoa team to get a full understanding
of the theory of change of the IDH CPQP programme.
Research questions
The following specific learning questions are proposed.
1. How do the certification and related activities of the Voluntary Standards and
implementing partners23
(Solidaridad, buyer-exporters, private training agencies, consultants
and the national rural development agency) influence knowledge (of GAPs, social and
environmental issues in line with the code of conduct) and related behaviour/practices of
cocoa farmers in Côte d’Ivoire? and what are the results of these in terms of people,
planet and profit?
2. Is the CPQP cocoa programme in Côte d’Ivoire inclusive? What are the characteristics of
certified farmers? Are certified farmers representative of Ivorian cocoa farm holders? (in terms
of incomes, gender, age, farm size and tenure and ethnic/migrant status)? Do knowledge and
benefits also reach others working/helping on certified farms (spouses, workers, tenants, children
etc.?)
3. What is the added value of going through certification processes and being certified for
farmers? What perceptions do farmers and stakeholders (groups, traders, traitants, exporters,
trainers) have of the process and impacts of certification and training on their livelihoods
(e.g. Benefits in terms of improved wellbeing, increased professionalism, increased trust and
communication between farmers and co-ops, how certification influences loyalty of members
towards a group and willingness to reinvest in cocoa farming) ? How do the interventions of
training and certification influence/strengthen each other?
These research questions are based on the IDH Theory of Change for sustainable cocoa in Côte
d’Ivoire (see separate document) and impact logic. Notable assumptions made by IDH underlying its
intervention logic include:
The main impact of certification and training is at a farmer, household level (Note that (individual
farmer certification has not yet occurred in Côte d’Ivoire and certification is on a group level.
Certified groups are currently mostly organised as cooperatives, but Certification of
traitants/pisteurs is occurring and is increasingly foreseen in future).
Certification provides in many- but not all cases - a price premium and direct economic benefit &I
improved market access
23
Within the Utz programme two types of training are conducted: 1. Training of master trainers on the Code of Conduct
requirements by UTZ to its partners (co-ops, consultants, exporters, NGOs) 2. Technical training by service providers
(training of trainers) to lead farmers, FFS, etc.

95 | LEI Report 2014-016
The direct economic benefit occurs mainly at certificate holder/group level. The premium and how it
is spent should be clearly communicated to individual producers. The premium should be invested or
distributed in a way that benefits all certified producers (in cash or in kind).
The certification process (including implementation of the code requirements, training, creating and
strengthening of farmer groups, setting up an ICS) provide indirect benefits by enabling farmers to
gain additional economic benefits (increased yields, better quality, efficient use of inputs, better
management practices) and social benefits (increased negotiating power, access to inputs and
services). These social and economic benefits lead to improved profitability (income) and contribute
to long-term economic viability and resiliency of farms.
Inspections and peer pressure contribute to implementation of sustainable practices as learned in
the training.
Professional farm management and risk management contributes to improved farm resilience
(reduced vulnerability for shocks)
Whilst group certification requires a registered group (with a functioning ICS), standards like UTZ
set no requirements for their democratic structure. Groups can be self-initiated
associations/cooperatives or externally initiated e.g. traders, traitants, NGOs etc. IDH, UTZ and
Solidaridad are in the process of understanding what form of organisation is most beneficial for
farmers, but does assume that stronger groups creating stable and secure trade conditions and
acting in the interest of its members are the most important conditions for groups to benefit
farmers. IDH does however assume that groups have a value (i.e. access to trainings, inputs,
markets), yet the experience is that that not everyone is or can be part of a good functioning group.
The phasing of activities to certify and then maintain certification and also the fact that different
practices lead to results at different moments means that different incentives and impacts on
farmers will occur at the different stages and thus farmers at different stages in a certification
programme (e.g. amount of training received, amount of time in the programme, year of
certification) will experience different impacts. This is not only related to the increased number of
criteria but also to how long farmers are participating in the programme (e.g. different practices
have different effects on productivity; some take more time)
The criteria in the programmes like UTZ and RA lead to planting of shade trees (towards correct
shade levels), more vegetation on farms and borders of water ways and less deforestation and
encroachment in protected areas.
Shade trees (and especially diverse and indigenous shade trees), as well as increased vegetation on
farms, reduced encroachment and deforestation, and protection of water streams contribute to
protection of natural habitats and biodiversity conservation,
IPM and controlled and informed use of crop protection products also contributes to improved
biodiversity conservation
The correct amount of shade trees (shade levels) also contributes to a reduced risk of pest problems
(contributing to reduce pesticide use) and to improved organic matter/soil structure and soil fertility.
Secondly, the Theory of Change (ToC) and indicators for Côte d’Ivoire will be further developed. This
will use insights from IDH’s general (ToC), the ToC and indicators from the Ghana study, and the
Solidaridad/Cargill TOC and indicators, and a ½ day meeting with IDH cocoa programme staff (to be
defined). This will be discussed and presented to IDH and partners. From the TOC indicators will be
developed that form the basis for creating the questionnaire and data collection tools. These will be
aligned with Cargill and Ghana study where possible. For each indicator it will be decided how data will
be collected (source and quantitative or qualitative method). This activity will be financed by the Top
Sector project. IDHs refinements relating to access and use of farm inputs will be incorporated.
Activity 2: Revise tools and methodology
The methodology builds on the Ghana study and takes into account the same DAC principles for
reliability, usefulness and independence, statistical, construct, external and internal validity
(causality). As IDH requires that the findings of the research should contribute to internal and external
communication purposes and provide more qualitative ‘’stories’’, the main change from the
methodology used in Ghana is the addition of qualitative data collection techniques. Also the length of
the questionnaire will be reduced, the research questions more focused and adaptations concerning
the sampling, learning from the Ghana study, will be taken into account.
96 | LEI Report 2014-016
Scope
The total number of respondents will be in total is 1,065 – this includes farmers and all the other
stakeholder interviews supported by the IDH, UTZ and Solidaridad-Cargill budgets. Of the farmer
population about 51% are working with multiple standards, in the current sampling 30% is multiple
standard and the control groups are ‘un-touched’ by any form of certification. With the additional add-
on of IDH (all the other traders, including Cemoi and ADM) to the UTZ and Solidaridad components we
have a sufficiently large sample (60) of farmers and stakeholders linked to all the traders active in
CdI.
Ideally, baseline data had been collected before farmers actively participate in the cocoa programme
to allow impacts to be assessed against a baseline. Since the CPQP Côte d’Ivoire programme is still
relatively recent and there is no baseline study, a comparison of the start and end situation, or the
before and after certification situation is not possible. However by comparing the indicators at farmer
and group level, insights can be gained into the impacts of the different certification approaches used
by buyers/traders and pisteurs. These can also be compared with the indicators for uncertified
farmers, to provide an indication of initial impacts and achievements. It is assumed that the different
approaches used by traders and pisteurs may result in different impacts for affiliated farmers (once
factors such as farm location in suitable or less suitable zones, length of time certified and number of
training are controlled for). Thus, knowing how the different traders implement certification and the
different types of delivery and implementation modes is an essential part of the research. This impact
assessment will reflect the situation from the programme initiation in 2009 and farmers and groups in
different phases of certification. The differences make it necessary to consider how long a farmer has
been trained at the time of conducting the survey, if they are certified and for how long. The use of
qualitative methods addresses some of the limitations by allowing farmers, cooperatives/groups and
stakeholders recall and perceptions of impact to be gathered and helps triangulate the quantitative
data. This study will therefore provide baseline which can be used for future impact assessment and
allows before and after assessment of impact. The case and desk study activities of the Top Sector
project also seek to find other data which can provide a comparative baseline and further help
triangulate findings.
After this study, it is understood that similar data will be collected for a midterm (after 1,5 - 2 years)
and final assessment (after 3 to 4 years). The impact of the CPQP programme can only then be fully
established using the changes observed in the selected indicators over the time period and changes
observed in the selected indicators between the treatment and comparison groups.
Sample
The impact assessment will use a Difference in Difference approach. This combines two types of
comparisons. The first comparison focuses on the change in the longitudinal data on farmers to
establish the effect of the intervention through the difference between the ‘before’ and ‘after’
intervention situations. A second comparison accounts for external factors that influence the
performance of participating farmers. For this the change in the indicators assessed between a
‘treatment’ (certified) and a ‘’comparison’’ or ‘’control’’ (uncertified) group are compared. Farmers in
the treatment group may be certified (or working towards certification) as a group and have links with
buyers (or not). Within a group, farmers can be in different stages of training and certification.
Farmers in the comparison group are not certified at the time of interview (and may become certified,
by UTZ, RA or other programmes in the future), but operate in comparable agro-economic
circumstances. Since external factors (agro-ecological suitability of the area for cocoa farming, farm
size, ownership, levels of conflict, other certifications) may determine the change in the indicators for
farmers that produce under the same circumstances but were not involved in certification, this
comparison group aims to account for the influence of external factors.
97 | LEI Report 2014-016
Taking into account the Ghana impact assessment experience, LEI proposes to select a stratified
sample of UTZ Certified groups in Côte d’Ivoire. The sample aims to be representative (and
generalisable) as possible for producer groups in Côte d’Ivoire24
. Factors we think are important to
take into account in selecting the sample of cocoa farmers are:
i. Trader to which the farmers linked (Note: Cargill groups and farmers will be covered by the
Solidaridad-Cargill study and so this study will only concern other traders: at least Barry
Callebaut and then a number of the other trades, and groups not linked to traders)
ii. Service provider used to train the farmers (ANADER, Akwacao, in house or cabinets such as
KDD and Trust Consulting)
iii. Type of certificate holder (coop/traitant/pisteur)
iv. Size of the group (large/small)
v. Location of the group (related to agro-ecological zones and their suitability for cocoa farming25
and therefore expected yields), thus samples will be selected from the ‘’excellent’’ zones and
from the marginal zones (notably the far western area and Bas Sassania area).
vi. Timescale in certification process; including groups soon to be certified, early groups from 2009
and recently certified groups. This variable allows a comparison and baseline setting for future
assessments.
vii. Other certifications (as 51% of groups have multiple certifications, it is important to take into
account the number of certifications per farmer/co-op and which was first).
viii. A control, ‘’non-treated’’ group of un-certified farmers will be interviewed. The costs for this will
be covered by the Top Sector Project. This control group is particular to this assessment and
may not be relevant in future assessments, as farmers in the control group may at any point in
time become (multiple) certified, requiring the new individuals to be included into future control
‘’non-treated’’ groups.
ix. Other factors (e.g. other support (e.g. philanthropic and social projects e.g. Cargill’s Family
Field Schools and social programme), areas where conflict has had more impact, problem cases
etc.).
The final sample and factors to be taken into account will be determined in this phase, drawing on
information supplied by IDH, UTZ, Solidaridad and partners.
Given this large number of criteria, the sample will not be random, but the selection of cooperatives,
communities and then individual farmers will be randomly selected using the random number
generation technique (outlined in the Ghana study). A sample of at least 60 farmers linked to each
‘’trader’’ is needed to make the study statistically valid. The exact number will be established in this
activity and will also be dependent upon the budget available. Data collected via the qualitative and
quantitative methods will aid triangulation; to check whether these enforce or contradict each other.
A smaller, purposive sample of farmers will be selected for qualitative data collection. The selection
criteria for the sample will be that male and female farmers, length of time they have been
participating in the programme, farm size (small and large farms), certified and uncertified, and those
linked to traders and serviced provided and with no links, length of certification, level of external
support and farmer diversification). The number of interviews that can be conducted within the budget
and timescale will be confirmed during this activity.
The sampling procedure for control group farmers differs. A control group was to be established for
each region (excellent and marginal cocoa farming regions) to enable comparisons between the
control and treatment groups in each region. Sampling control group farmers is expected to also be
difficult in Côte d’Ivoire, as in Ghana, as there was no list readily available with all cocoa farmers in
each of the study. Thus, we will ask IDH, UTZ, Solidaridad, WAFF to help pick out control group
communities on the basis of the following criteria:
24
Note that this sample may not be representative of Ivorian cocoa farmers however, for which a much wider range of
interviews would be necessary than resources allow. 25
Propose to use the classification of suitability developed by CIAT (see Annex 1).

98 | LEI Report 2014-016
1. Most villagers are involved in cocoa production
2. No training / certification has taken place for UTZ in the community
3. No training / certification has taken place for other certifications in the community (Rainforest
Alliance, Fair Trade / FLO).
4. The community is at least 10 kilometres from a project community.
To select the farmers in the control communities as randomly as possible, two strategies are
proposed. One is that enumerators go to the community and try to gather a group of farmers through
UTZ, Solidaridad, a trader or support organisations operating in the community. From this group,
farmers are randomly selected for interview. The second strategy is snowball sampling where
enumerators arrive in a selected community and find a cocoa farmer to be interviewed. This
respondent indicates another person to be interviewed (etcetera). When the respondent does not
know a person, or the indicated person is not present, the enumerator would randomly find a new
farmer to be interviewed.
A selection of stakeholders will also be interviewed. This will include group (cooperatives/associations)
managers, school teachers, village chiefs and notables and local authorities. The exact number will be
worked out in this phase and will be determined by the budget and time available and is estimated to
be around per 10 trader plus interviews with the traders and their training service providers associated
with certification, estimated around 30. This means the total number of stakeholder interviews is
between 110 to 120.
An inception report will be produced which includes the ToC and context, methodology, indicators,
research questions- submitted for approval prior to fieldwork, and a draft table of contents for the final
report and format for the executive summary for comments and approval.
Activity 3: Kick off and Training enumerators Côte d’Ivoire
To prepare the enumerators for data gathering, a four day training will be organised. This will focus on
introducing the survey team (enumerators and supervisors) to project, cross checking local names and
terminologies used by cocoa farmers with terms used by the study team, discuss and refine the
questionnaire by interpreting questions/items into Ivorian French and maybe local languages
(e.g. Baule) in which the interview will be conducted. Training in the methodological approaches such
as SSI, Most Significant Change stories, Focus group discussions, transects will be conducted. The
process of local language translation and role plays by enumerators will also assist in modifying the
questionnaire and techniques to be used to make them appropriate. The revised questionnaire can
then be tested in a nearby cocoa growing community by all enumerators and supervisor, discussed
and revised based on feedback.
During this kick off phase, meetings will also be held with IDH, Solidaridad, UTZ, WAFF and other
stakeholders (e.g. traders such as Cargill) to assist in clarifying and verifying the Theory of Change,
the context, the sample and provide knowledge on the training and interventions made by traders and
their support organisations or NGOs to achieve certification.
Activity 4: Data collection Côte d’Ivoire
The main bulk of data will be collected by enumerators from our local partner, A.C. et Vie, by visiting
individual farmers with the questionnaire and photographic equipment. Besides the questionnaires,
data on certification and internal control systems (ICS) and other related activities e.g. (e.g. GAPs,
social and philanthropic programmes, training) will be collected from associations/cooperatives.
Introductions to the unions will be assisted by introduction and contacts given by UTZ, WAFF,
Solidaridad and the traders with which the selected sample of groups are associated. Learning from
experiences in Ghana and other studies, the farmer interviews will aim to be 45 to 60 minutes long.
Data collection methods
Two main complementary methods will be used to collect data from farmers.
Quantitative primary data will be collected using a structured questionnaire. This is based on the
questionnaire developed in the Ghana study which will be revised to take into account the changes

99 | LEI Report 2014-016
from the ToC and indicators from Activity 1. This will be translated into French. A semi-structured
interview guide will be used to collected data from groups (e.g. cooperative managers), licensed
buyers and traders.
Secondary data provided by the Top Sector Project literature review. Farmer households are often
subject to evaluation studies and surveys, a number of which have occurred recently. To avoid over-
researching and to decrease the burden on farmers, this study seeks to make use as much as possible
of existing datasets i.e. databases at cooperative level and at the level of the traders (i.e. bean quality
data, volumes, certified versus non-certified volumes, suppliers etc.). These will be obtained from the
work of the Top Sector study.
Qualitative techniques will be used with a selected sample of groups or cooperatives and farmers to
conduct semi structured interviews and story-telling. This technique will be used to triangulate some
of the results of the quantitative analysis and get a better in depth understanding, reconstruct
baseline data, get information on more sensitive topics (e.g. child labour) or from vulnerable groups,
and a better understanding of contextual factors and unintended effects. This will be done a
participatory way by organising workshops with the target groups (taking into account gender, farm
sizes, level of intervention and previous support etc.). These will be supported with photographs26
.
Qualitative interviews will be conducted with selected individual farmers after the quantitative
interview. For the group oriented methods qualitative data will be conducted at appropriate times of
the day (probably early late afternoon/ evening or early morning) in the selected locations.
If UTZ or Solidaridad hire a professional film crew/photographer, the team will collaborate with them.
For example, conducting joint fieldwork such that interviews and focus groups can be filmed, and
indicating the farmers and associations which may be suitable for recording success stories and
significant changes.
Activity 5 and 6: Data entry and Data analysis
The quantitative survey data will be entered into an Excel database created by LEI by the A.C. et
Vie team, then checked, cleaned and exported to the statistical programme STATA for analysis. For
the indicators, descriptive statistics such as the mean, median and standard deviation will be
calculated, with maximum and minimum values when relevant. Key indicators of certified and control
groups will be compared taking into account cocoa farming region and farmer characteristics using
cross-tabulation, pairwise t-test and regression analysis. Certified groups can be compared according
to length of time of certification and types of certification interventions and pathways. Other relevant
comparisons will be assessed during this phase and draw on experiences from the qualitative
fieldwork, meetings with partners at the kick off period in Côte d’Ivoire and from Theory of Change
process.
The qualitative data will be analysed and the most significant change stories distilled (e.g. reporting
lessons learned on the process that led to specific quantitative outcome) using the relevant qualitative
indicators. The qualitative information will be cross checked with the results of the quantitative
surveys to ensure consistency of outcomes. This allows the results of be triangulated. The qualitative
analysis will complement quantitative data by providing lessons learned of successful (or problematic)
farmers. As illustrated in the research questions, the qualitative analysis will help understand the
perception of farmers about certification programmes in dimensions such as wellbeing, bargaining
power, professionalism, trust, attitude towards cocoa farming (exact variables will be based on
indicators from the ToC). In addition this technique can help capture unintended impacts and how
external factors affect farmers' performance. It also helps identifying how certification is valued by
farmers and groups, their needs and constraints related to the implementation of certification and
training Storylines will be developed which provide examples of the farmers corresponding to the main
selection criteria (male/female, large/small, certified/noncertified, good cocoa farming conditions/poor,
high external support/no support). Written, qualitative responses which help explain the research
26
The local research team will make photos and images for the report.

100 | LEI Report 2014-016
questions will also be provided. These will be supported by quotations. The results of the Top Sector
Desk Study of literature and Case Studies will be used to assess whether the research results in this
study reflect the general situation of Ivorian cocoa farmers.
Activity 7: Preliminary report
After the first data are analysed a draft report will be written presenting the main qualitative and
quantitative results of the research for the verification workshop in February 2013.
Activity 8: Results verification workshop in Côte d’Ivoire
The main results of the preliminary findings will be presented to invited stakeholders in a verification
workshop in Côte d’Ivoire for learning and feedback. These stakeholders may include WAFF,
Solidaridad, IDH, UTZ, traders and NGOs implementing the projects, cooperative managers, extension
agents, auditors, project farmers, CIRAD, relevant development/support organisations (e.g. GIZ),
government agencies, local and traditional authorities and research institutes. Suggestions will be
gathered from the Guidance team. Based on the discussions in the validation workshop, as well as
feedback, the analyses will be adapted and explanations given about the results. If possible, the
timing of the workshop will coincide with any other events to maximise participation and decrease
costs.
Activity 9: Reporting
After all data has been collected and analysed, and feedback from the verification workshop, a first
draft of the report will be provided for review by the Guidance team. The final, concise (less than
50 pages, excluding appendices) report incorporating feedback and comments from the guidance team
will be provided in English in Microsoft Word. It will be drawn up according to the approved table of
contents as part of the inception phase and fit for external purposes. It will contain an executive
summary in English and in French and respond to the research questions and sub-questions. Photos
will be included in the report and the unedited photos will provided with an explanation of their
content.
Activity 10: Presentation
A presentation of all the deliverables will be made at a meeting with UTZ, Solidaridad and IDH in
the Netherlands for learning and reflection.
Limitations of the approach
The budget and timescale proposed in the ToR do not allow major changes to be made to the
methodology to respond to recommendations made in the Ghana study. This means that changes in
the methodology to address the recommendations and provides limited opportunity to use methods
other than a one-off questionnaire (with its inherent problems of relying on poor recordkeeping, short
term memory recall, no measurement of farm size, recollection error and interpretation bias).
Alternative methods would involve longitudinal studies requiring visits to the farm and/or groups over
a longer period of time (e.g. one year) to obtain more reliable data.
Results
1. Baseline data
2. Increased knowledge of the indicative impact, based on qualitative and quantitative research,
of the IDH CPQP programme for sustainable cocoa in Côte d’Ivoire
3. Perceptions of farmers and stakeholders on the impact of Certification
4. Images, quotations and sounds of the perception of farmers and stakeholders on the impact on
the impact of certification.

101 | LEI Report 2014-016
The deliverables
The project will lead to the following deliverables, delivered according to the schedule in the time plan:
1. Provision of the visual documentary materials (pictures with explanatory titles).
2. The database (after cleaning) in Excel or Stata (to be agreed).
3. An inception report, which including the ToC and context, methodology, indicators, research
questions- submitted for approval prior to fieldwork, and a draft table of contents for the final
report and format for the executive summary for comments and approval.
4. A verification workshop of the preliminary findings with IDH, Solidaridad, UTZ, farmers and
stakeholders in Côte d’Ivoire for learning and feedback.
5. A draft report for review, followed by a concise final report incorporating feedback provided
within the agreed timescale (< 50 pages, excluding appendices) provided in Microsoft Word, fit for
external purposes:
6. In English, according to the approved table of contents as part of the inception phase.
7. Executive summary in English and in French.
8. The research questions and sub-questions will each be answered.
9. Presentation of the final report and documents to IDH, Solidaridad and UTZ (and other partners
as they see necessary) in the Netherlands for learning and reflection.

102 |
LEI R
eport 2
014-0
16
Indicators Annex 2
Study impact indicators
Research
questions
Outcome
Link to IDH
CPQP
indicator
Outcome Indicators Question numbers
Producer
questionnaire
(other questionnaires
used(in red)
Remark/
Comment
Issues for data analysis Source/methods
to obtain data
1.1.11.1.2
1.1.3
1.1.4
2.1.1
3.1.2.3.1.3
Farmer Characteristics
1.0 Name & telephone 6 General
demographic and
farm data –
Indicators as variables to
compare certified and
non-certified farmers.
Compare length time
certified, training and
other interventions,
ethnicity, migration and
effect of land
ownership/tenure
1.11:
Analyse tenure system in
Côte d’Ivoire
1.12:
Farmers reports on farm
size cross check co-ops
and baseline data, traders
& GPS
Farmers
Producer group
manager
GPS measures
1, 2, 3 1.1 Age 7
1.2 Gender 3
1.3 Participation in a project/sustainability programme
(certification, community based, productivity, farmer
/field schools etc.) (specify)
16, 44
1.4 Length time certified 16
1.5 participation in other certification programmes,
length time
16, 21
Producer group
1.6 Nationality 11
1.7 Native (ethnic group) of area 9, 11
1.8 Position in household & societal status 10, 13
1.9 Number of children 14
1.10 Number & type of training & support
interventions
38, 39
1.11 Farm tenure/ownership sharecropping/worker
status
13, 15, 16
1.12 farm size (measured or not?) 16, GPS measures
1.13 % contribution of cocoa to household income
(gender differentiated)
49, 50
1.14 Other sources of income (gender differentiated 50
1.15 No of years cocoa farming 16
1.16 Number of cocoa trees on all farms 16
1.17 Location (village/region) 4, 5
1.18 Member coop(s) 9
1, 3 Farm efficiency Input/output ratio (agronomic/economic) 29, 30, 36, 37 Cocoa farm
efficiency, not all
farming activities
Farmers
Co-op manager
Service providers
tree density in practice (vs. prescribed) 16, 82
defined (trained) spraying team with a manager
competent on dosages
Producer group

LEI R
eport 2
014-0
16| 1
03
1, 3 1.2.3
1.2.4
Increased productivity 3.1 Yield per tree and acre 16, 77, 69, 70 Cocoa farm
productivity only
Compare to other baseline
data
Farmers
Producer group
manager
Village chiefs
Local authorities
Service providers
Focus group
3.2 Annual production (last year’s harvest) 16
3.3 Production and practice change since
certification/participation in the programme
17 18, 19, 20, 26, 70
100,101, 102, 103, 104
3.4 Change in inputs, seedling distribution, planting
and maintenance and input access
33, 34
3.5 Proportion (%) sold to certified buyer(s) 18
3.6 Influence climatic factors or other external factors
(Political, economic, social)
26
Focus group
1, 3 1.2.5 Quality meets market
demand
4.1 Bean rejection rate 24
Trader
(Proxy) Triangulation data from
farmer - producer group
Farmers
Coop
Traders/exporters 4.2 Rate that requires re-drying 25
4.3 Post-harvest practices 77, 78, 79, 80, 110
2, 3 3.2.2 Increased profitability
and long-term viability
of farmers and groups
5.1 Increased income
Change in price, Frequency of payment, Part of the
premium directly to the producer in cash
17
41, 42
How do farmers
make decisions and
why do they take
decisions the way
they do
Farmers
Producer group
5.2 Record keeping/Use of records and other
information (e.g. provided by group/ICS) for decision
making
62
5.3 Knowledge: Is market information used for/in
decision making?
Producer group
5.4 What and how is premium distributed (individual
and group level)
41, 42
5.5 How is premium spent/invested? 51, 58
1,
2
3
Improved livelihoods 6.1 Perceived changes in livelihood (specify…)
Presence of schools or numbers of teachers or child
attendance or literacy programme.
access to healthcare or presence of medical staff or
number of clinics or pesticide sprayers health checks
or first aid training
Access to markets, credits / banks, other products
(seeds etc.)
access to decision-making groups (co-ops,
associations, etc.)
53, 54, 55, 56, 57, 59
Livelihood is defined
by: natural
resources,
technologies, skills,
knowledge and
capacity, health,
access to education,
sources of credit, or
networks of social
support.
Farmers
Coop
Focus group
Traders/exporters
Village chiefs
Local authorities
School masters
6.2 Perceived changes in needs (income, food, water,
status, health, education, other)
60
1,
2,
3
4.1.1 Respect for labour
rights
7.1 Knowledge: (certified vs. non-certified farmers) &
if member of association previously? Why/not??
9, 53, 63, 64
Additional
7.3: Check national laws
Farmer
Coop
Focus group
(Labourers / women)
7.2 Extent forced labour, discrimination & contracts
Wage levels paid for hired labour and differences
94, 95
7.3 Knowledge of national laws on wages, hours
worked
95
7.4 Contacts with local community representative for
labour rights
98

104 |
LEI R
eport 2
014-0
16
1, 3 1.2.6
4.1.1
Respect for Child
labour
8.1 Activities of children on cocoa farm (labour) 29 Assessing role of
children in cocoa
farming only (no
other farming
activities)
Farmers
School teachers
Producer group
manager
Focus group (youth /
children)
8.2 Knowledge: activities on cocoa farm that can be
executed by children?
44, 46, 97, 111
8.3 Extent of farmer’s children’s attendance at school 55, 59
School master
1, 3 4.1.1 Healthy and safe living
and working conditions
9.1 Number of injuries during cocoa farming (hired
labour, family labour, communal labour): cuts that
need stiches and fractures
37, 92, 99 Assumes training
leads to safer
practises and
decreases number
of accidents, if
accidents occur,
should be treated
properly
Farmer
Producer group
manager
Service providers
Focus group
Trader
9.3 Use of protective clothing 36, 37, 92, 108
observation
9.4 Impact of community development/social projects Focus group,
observation
1, 3 1.2.11.2.2
4.1.1
Maintained & improved
quality of water and
soil
10.1 Implementation of practices (pruning, mulching,
fertiliser use etc.)
100,101, 102, 103, 104
71, 72, 76, 77, 78, 79,
80, 81
observation
Proxy indicators
(water: water
streams protected
by vegetation, no
spraying next to
stream, pollution by
chemical waste)
Soil: correct
fertilisers used,
organic fertiliser,
soil organic matter
Farmer Q
Focus group
Traders/Traitants
ANADER 10.2 Use of inputs: agrochemicals, quality and type 73, 74, 75
observation
10.3 Protection & quality of water 86, 87
observation
10.4 perception soil quality 85
1, 3 4.1.1 Effective waste
management &
reduction
11.1 Implementation: if waste & how agrochemicals &
leftovers handled?
88, 89 , 90, 91, 93 (cocoa production related) Farmer Q
Focus group
11.2 Is compost used? Or sold? 31, 32
observation
1, 3 4.1.1 Protection restoration
of natural
habitats/biodiversity
12.1 Number of shade trees on cocoa farm
practice planting shade trees pre-certification
16, 81, 82, 83, 84
observation
(on/near farm) Farmers Q
Producer group
(audits)Traders
Traitants, ANADER
12.2 Preference shade tree (native) pre/post
certification
84
12.3 Land clearance for cocoa (pre/post cert) 28, 16 observation
2 1.1.1 Inclusive programme 13.1 Demographic information of questioned farmers
vs. ‘general’ cocoa farmers in Côte d’Ivoire.
3, 4 ,5, 7, 9, 10, 11, 12
,13 ,14
Focus group
Village chiefs
Coop 13.2 Percentage of lead farmers, internal inspectors,
executives, gender, youth in samples
43, 7, 3
1, 3 2.1.4
2.2.1
Stable producer
groups providing
better and reliable
services
14.1 Participation in group, number of years 9 Compared UTZ
Certified and non-
UTZ farmers
Compare certified and
non-certified
Compare farmers with
multiple Cargill projects
with those only via
certification
Farmers Q
Producer group
Focus group
Trader
Traitant
14.2 number of participating members Producer group
14.3 Membership growth? Producer group
14.4 Perception usefulness of the group 61, 62, 63, 64, 65, 66
14.5 Perception benefits/services of the group
14.6 Perception improvements possible 8

LEI R
eport 2
014-0
16| 1
05
14.7 perception transparency of ICS 62,65, 66 Compare length time of
Cargill projects
interventions &
certification and reported
impacts
Triangulation perceptions
of farmers, co-ops and
traders
14.9 Does group facilitate access to inputs? 33, 34, 51 Focus group
14.10 Does the group facilitate sales? Producer group, 35
14.11 (Sustainability of the group) ‘ perception of
existence after certification’
Producer group
14.12 extent price/market information provided to
farmers
62
14.13 member of other groups and sales to other
groups/traiteurs, why?
20
14.14 Selling beans to others (traitants, buyers)?
(loyalty)
18,19,20
14.15 (Likert) Perception if group well-managed/
financially healthy?
66
14.16 proportion payment to farmers on time 62
14.17 Perception of communication with members 62
14.18 Perception level of capacities 62
14.19 Perception level of bargaining power with
traders/traitants
59, 62, 66,
14.20 Perception effect of training, support and
interventions
45 Trader
14.21 how do interventions impact loyalty, what are
the benefits gained and how they are perceived ?
23
2, 3 2.1.5
2.2.2
Sustainable practises
rewarded by the
market
15.1 Better price / premium 47 Trader Compare UTZ, & non-
certified.
Price in future difficult to
use as indicator given
context IC and reforms,
can use for past
analysisAnalysis to
qualitative indicators
Farmers Q
Coop
Focus group
Trader
Traitant
Local authorities
15.2 Long-term buying commitments Focus
15.3 More potential buyers Focus
15.4 Less time needed before a buyer shows up? Focus
5.5 Receive additional inputs, or external support?
From who? level & type of services, inputs/support
21
Trader
15.6 Do you want your children to become cocoa
farmers?
67, Focus
15.7 Do you plan to continue cocoa
farming/intensify/diversify? (5 yr. timescale)
68
15.8 Factors determining becoming and/or staying
certified?
62, 63, 64, 65, 66 Focus
3.1.1 Partners involved in cocoa sector Literature review

106 |
LEI R
eport 2
014-0
16
CPQP Indicators not addressed by the study
2.1.1 No. of private institutions offering business services to groups/organisations – only for sample
2.1.2 No. of producer groups/organisations supported and functional– only for UTZ programme
2.1.3 No. of business partners committed to integrating sustainability into their value chains
2.2.1 Sales of certified cocoa from producer groups/organisations as a percentage of total authorised sales on certificate – only for farmer level, not producer group level
2.2.2 Volume (mt) of certified cocoa purchased by CPQP programme partners
1.2.3 Purchases (%) of certified cocoa, as a percentage of total cocoa purchases made by CPQP programme partners
1.2.4 Additional jobs created in targeted cocoa sector value chain
3.1.1 No. of non-private partners involved in the programme – only for cocoa sector in Côte d’Ivoire in general – and for selected traders - not specifically for the programme
3.1.2 No. of institutions/entities trained
3.1.3 No. of extension officers trained in producing countries – only for sample
3.2.1 No. of local CPQP programme partner implementation structures operational.
3.2.2 No. of trained extension officers sharing knowledge in workshops with global cocoa stakeholders – only for sample
4.2.1 No. of best practices shared in sector (through websites, events, etc.)
4.2.2 No. of regional cocoa forums established and recognised by the sector

LEI R
eport 2
014-0
16| 1
07
Table 12
Details of indicator measurements
Indicators Indicator measurement
Gross income from cocoa Yearly production of all cocoa farms multiplied by the average price per kg for cocoa paid to farmers
Labour costs of cocoa production All reported hours spent on cocoa production activities multiplied by the price of labour (2000 CFAF per day). Family labour costs are calculated using the
same price as for hired labour. Not included are costs and time spent by farmers on training, communal ‘shared’ labour gangs, as lead farmers, on internal
control systems and on auditing. Farmers indicating zero labour costs were not included in the calculations (n= xx)
Input costs of cocoa production Number of times a product is applied multiplied by unit multiplied by price per unit of input (fertilisers and crop protection products such as fungicide and
pesticide)
Time (opportunity costs) to become UTZ Certified and investing in PPE has not been taken into account in cost calculations
Total cocoa production costs Labour + input costs. Not included are costs of equipment and personal protective equipment, costs (in kind) of spraying gangs or communal ‘shared’
labour. Time (opportunity costs) to become UTZ Certified and investing in PPE has not been taken into account in cost calculations
Net income from cocoa Yearly production of cocoa from the main farm, minus total production costs for the main farm
Cocoa production efficiency Economic and agronomic input/output ratio
Productivity Yield per tree per hectare. Based on farmers report of their farm size.
An alternative productivity result is based on the margin of error (70% of farm sizes were estimated, with on average farm size 7% over estimated)
Knowledge of good agricultural practices (cocoa) Farmers were asked 12 multiple choice questions on good agricultural practices. Correctly answered questions correspond to the requirements of the UTZ
Code of Conduct. The more correct answers a farmer, the higher the score for the individual question. For each question a score was derived on a scale
between 1 and 10. The overall knowledge score was measured as an average of all scores for the individual scores.
Implementation of good agricultural practices
(cocoa)
Farmers were asked 24 multiple choice questions on good agricultural practices. Correctly answered questions correspond to the requirements of the UTZ
Code of Conduct. The answers were score related to the correctness of the answer. For each question a score was derived for each farmer on a scale
between 1 and 10. The overall score for the implementation of good agricultural practices was measured as an average of all scores for the individual
scores.
Satisfaction with livelihood Farmer perception, 5-point Likert scale
Changes in needs (income, food, water, status,
health, education, other)
Farmer perception based on open questions with qualitative answers possible.
Satisfaction with services of producer group Farmer perception, 3-point Likert scale
Satisfaction with interventions of traders
programmes
Farmer perception, 3-point Likert scale and open question

108 |
LEI R
eport 2
014-0
16
Indicators addressed by the stakeholder questionnaires .PImpact on livelihoods:
Perceived benefits by farmers and other stakeholders of UTZ certification (income, training, participation in producer groups, certification and related services).
Evolution of farmers’ and other stakeholders’ incentives, needs, and challenges at different stages of the programme.
Perceived changes in access to inputs (fertilisers, financing, becoming more creditworthy)
Perceived impact of the programmes on food security, child labour, education, health, safety and how increased income is used
Inclusiveness (are benefits reaching other member of the family?)
Unintended impacts and understanding of how external factors affect farmers' performance. (e.g. assessment of quality of road infrastructure, quality of village health
services and school attendance ratios, impact of cocoa reform).
Farming practices
Impact on knowledge and use of GAPs
Impact on quality, efficiency, business performance (market reward)
Perception of farmers and other actors of cocoa productivity increase / decrease due to inputs
Organisational capacity
Perception on professionalisation, bargaining power, ownership of the programme and interactions with government
Trust and communication flow
Perception of farmers’ loyalty to producer group or to trader
Perception of farmers satisfaction with producer group services, benefits of being a producer group member, how premiums are distributed and invested
Attitude toward cocoa farming and risk
Perception of farmers and other stakeholders of the opportunities for the future of the sector (e.g. will future generations continue cocoa farming?)

LEI R
eport 2
014-0
16| 1
09
IDH CPQP Indicators
Number Progress indicators
(output)
Baseline Overall
Programme
Target
(2012-15)
Year Target
(2012)
Cumulative
progress
(2012-15)
Definition of Indicator Means of Verification
1 Result Area 1. Tangible improvements in ecology socio-economic conditions of production
1.1 Progress indicators
(output)
Baseline Overall
Programme)
Year Target
(2012)
Cumulative
progress
(2012-15)
Definition of Indicator Means of Verification
1.1.1 No. of producers trained
in (GAP, GSP, GEP, GBP,
and/or ICS and
certification) modules
Producers represent only 1 member per household.
Each household is required to select only 1 member to
attend all the training modules.
Registration and tracking of
attendance in training modules
- Men To consider a producer trained, he must have an
attendance rate of at least ≥ 75% in at least one (1)
training module, with a minimum of at least five (5) full
days of training attended
Attendance lists
- Women Certificates of attendance
Training modules are: Good Agricultural Practices
(GAP), Good Social Practices (GSP), Good
Environmental Practices (GEP), or Good Business
Practices (GBP), and/or ICS and certification modules.
1.1.2 No. of full training days
attended by producers in
GAP, GSP, GEP, GBP,
and/or ICS and
certification modules.
No.. of training full days attended by producers, divided
by Male and Female in the following training modules:
Registration and tracking of
attendance in training modules.
Attendance lists.
- Men - GAP Certificates of attendance
- Women - GSP
- GEP
- GBP
- ICS/Certification
1.1.3 No. of producers certified Producers (individual cocoa farmer/household) apply
and comply with industry recognised certification
standards and are audited by independent/external
auditors
ICS reports
External certification audit report
Certificates
1.1.4 Area (ha) certified Number of hectares of all producers certified by industry
recognised certification standards and are audited by
independent/external auditors
ICS reports
- External certification audit report
- Certificates

110 |
LEI R
eport 2
014-0
16
Number Progress indicators
(output)
Baseline Overall
Programme
Target
(2012-15)
Year Target
(2012)
Cumulative
progress
(2012-15)
Definition of Indicator Means of Verification
1.2.1 Area (ha) of cocoa trees
rehabilitated
Number of hectares of cocoa trees
rehabilitated/regenerated through replanting, or
successful side- and/or chuppon grafting.
- Budwood distribution lists
- rehabilitated Assumption for calculation: 1 hectare = 800 trees. - Seedlings produced/distributed
- replanting Replanted: No. of ha where seedlings are planted as
replacements for old trees
- Farmer records
- regenerated Rehabilitated: No. of ha where old trees have had side
or chuppon grafting conducted to improve productivity
- Spot checks for a random stratified
sample of producers (programme
monitoring) for replanting,
rehabilitation, and using GAP criteria
questionnaires for regenerated areas.
Regenerated: No. of ha where cocoa GAP has been
successfully applied to improve productivity, this
includes:
1. Pruning conducted
2. Fertiliser applied
3. Regular harvesting
4. Sanitation practices applied
1.2.2 Average volume (kg/ha)
of fertiliser used per
hectare of land
The Average volume (kg/ha) of compost, organic and/or
inorganic fertiliser applied by producers per hectare of
their cocoa producing areas.
- Fertiliser distribution lists
- Compost - Compost (Kg/Ha) - Farmer records
- Organic Fertiliser - Organic Fertiliser ((Kg/Ha) - Spot checks for a random stratified
sample of producers (programme
monitoring)
- Inorganic Fertiliser - Inorganic Fertilisers (Kg/Ha)
1.2.3 Volume (mt) of cocoa
produced
- MT of cocoa produced by all producers certified by
industry recognised certification standards
- Producer farm monitoring data
- certified - MT of cocoa produced by all producers from non-
certified areas
- Spot checks for a random stratified
sample of producers (programme
monitoring)
- non-certified - ICS reports
- Certificates
- Trader and exporter data
1.2.4 Average yield
(kg/ha/year) per hectare
per year
Annual average calculation of kilograms of dried cocoa
beans per hectare produced
- The starting yields for each
producer is collected at the time they
join the programme (baseline)
- ICS data
- Spot checks for a random stratified
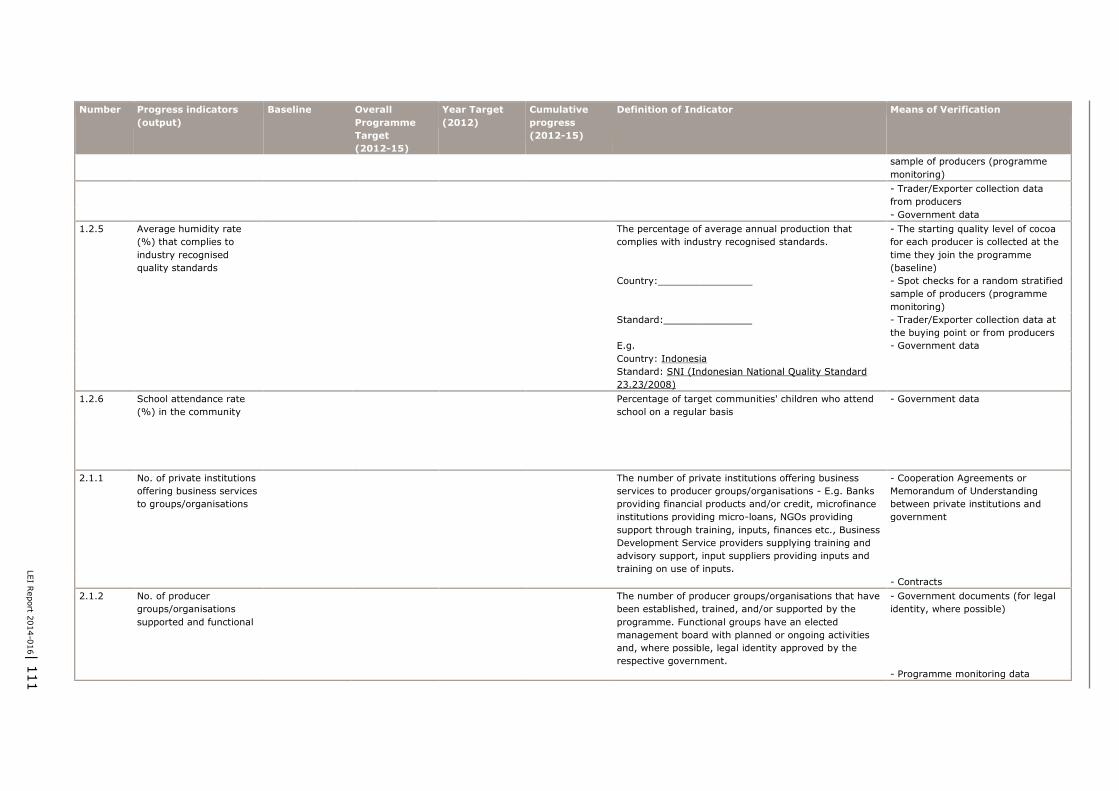
LEI R
eport 2
014-0
16| 1
11
Number Progress indicators
(output)
Baseline Overall
Programme
Target
(2012-15)
Year Target
(2012)
Cumulative
progress
(2012-15)
Definition of Indicator Means of Verification
sample of producers (programme
monitoring)
- Trader/Exporter collection data
from producers
- Government data
1.2.5 Average humidity rate
(%) that complies to
industry recognised
quality standards
The percentage of average annual production that
complies with industry recognised standards.
- The starting quality level of cocoa
for each producer is collected at the
time they join the programme
(baseline)
Country:________________ - Spot checks for a random stratified
sample of producers (programme
monitoring)
Standard:_______________ - Trader/Exporter collection data at
the buying point or from producers
E.g. - Government data
Country: Indonesia
Standard: SNI (Indonesian National Quality Standard
23.23/2008)
1.2.6 School attendance rate
(%) in the community
Percentage of target communities' children who attend
school on a regular basis
- Government data
2 Result Area 2. Tangible improvements in sustainable markets
2.1 Progress indicators
(outpu
Baseline Overall
Programme
Target
Year Target Definition of Indicator Means of Verification
2.1.1 No. of private institutions
offering business services
to groups/organisations
The number of private institutions offering business
services to producer groups/organisations - E.g. Banks
providing financial products and/or credit, microfinance
institutions providing micro-loans, NGOs providing
support through training, inputs, finances etc., Business
Development Service providers supplying training and
advisory support, input suppliers providing inputs and
training on use of inputs.
- Cooperation Agreements or
Memorandum of Understanding
between private institutions and
government
- Contracts
2.1.2 No. of producer
groups/organisations
supported and functional
The number of producer groups/organisations that have
been established, trained, and/or supported by the
programme. Functional groups have an elected
management board with planned or ongoing activities
and, where possible, legal identity approved by the
respective government.
- Government documents (for legal
identity, where possible)
- Programme monitoring data

112 |
LEI R
eport 2
014-0
16
Number Progress indicators
(output)
Baseline Overall
Programme
Target
(2012-15)
Year Target
(2012)
Cumulative
progress
(2012-15)
Definition of Indicator Means of Verification
Definitions:
Established: this includes technical assistance for start-
up, development and management of groups, and/or
provision of inputs and/or equipment.
Trained: As per training criteria for 1.1.1.
Supported: this includes technical assistance for group
management and/or provision of inputs and/or
equipment.
2.1.3 No. of business partners
committed to integrating
sustainability into their
value chains
Value chain business partners of the CPQP programme
partners, buying or supplying cocoa produced by the
programme supported producers to or from the CPQP
programme partners. I.e. small-holder cocoa
enterprises, traders, processors, exporters directly
involved in the CPQP partners' value chain.
- Cooperation Agreements
- Memorandum of Understanding
- Contracts
- Business partners purchasing
sustainable cocoa
- Business partners that have
indicated commitment to sustainable
production through purchase of
sustainable cocoa.
2.1.4 No. of producer
groups/organisations
selling certified cocoa to
CPQP programme
partners
The number of producer groups/organisations that sell
their certified cocoa directly or through
traders/exporters/processors to the CPQP programme
partners
- CPQP programme partners data
- Trader/exporter data
- Programme monitoring data
2.1.5 No. of producer
groups/organisations
receiving credit
The number of producer groups/organisations that
receive credit from traders/exporters, CPQP programme
partners, and/or financial institutions
- CPQP programme partners data
- Trader/exporter data
- Programme monitoring data
2.1.6 Value (USD) of financial
products provided to
producer
groups/organisations
Value (in USD) of loans, credit, and other financial
products provided by traders/exporters, CPQP
programme partners, and/or financial institutions to
producer groups/organisations
- Financial institution data
- CPQP programme partners data
- Trader/exporter data

LEI R
eport 2
014-0
16| 1
13
Number Progress indicators
(output)
Baseline Overall
Programme
Target
(2012-15)
Year Target
(2012)
Cumulative
progress
(2012-15)
Definition of Indicator Means of Verification
- Programme monitoring data
2.2 Change indicators
(outcome)
Baseline Overall
Programme
Target
Year Target Definition of Indicator Means of Verification
2.2.1 Sales of certified cocoa
from producer
groups/organisations as a
percentage of total
authorised sales on
certificate
What percentage of total certified cocoa sales in the
producing country (measured in MT) is from programme
supported producers to CPQP programme partners
- CPQP programme partners data
- ICS reports and certifier data
- Programme monitoring data
2.2.2 Volume (mt) of certified
cocoa purchased by CPQP
programme partners
Volume (mt) of certified cocoa purchased by CPQP
programme partners from programme supported
producers
- CPQP programme partners data
- ICS reports
- Programme monitoring data
2.2.3 Purchases (%) of certified
cocoa, as a percentage of
total cocoa purchases
made by CPQP
programme partners
Out of total cocoa purchases from programme
supported producers by CPQP programme partners,
what % is certified?
- CPQP programme partners data
- ICS reports
- Programme monitoring data
2.2.4 Additional jobs created in
targeted cocoa sector
value chain
Additional jobs created due to improvements in the
cocoa business climate, increased supply and/or
demand, improved productivity/quality, certification etc.
- At farm level: Survey conducted at
beginning (baseline) and end of
programme (impact)
- At farm level Additional jobs may be created in traders/exporters,
CPQP programme partners, producer
groups/organisations, input suppliers, farm labourers,
and financial institutions staff hired in relation to cocoa
financial products
- Business Level: Data collected on
an annual basis
- Seasonal - Traders/exporters data
- Full-time - CPQP programme partners data
- Business Level - Producer groups/organisations data
- Temporary/Part-time - Input suppliers data
- Full-time - Financial institutions data
- ICS reports
- Programme monitoring data
3 Result Area 3. Effective collaboration and institutionalisation at sector level

114 |
LEI R
eport 2
014-0
16
Number Progress indicators
(output)
Baseline Overall
Programme
Target
(2012-15)
Year Target
(2012)
Cumulative
progress
(2012-15)
Definition of Indicator Means of Verification
3.1.1 No. of non-private
partners involved in the
programme
Public universities, Government agencies, membership-
based non-private organisations/entities in the cocoa
sector
- Cooperation Agreements
- Memorandum of Understanding
- Contracts
3.1.2 No. of institutions/entities
trained
Public or private institutions/entities, not including
producer groups/organisations, trained in target areas.
To consider an institution/entity trained, they must
have received at least five (5) full days of training
- Registration and tracking of
attendance in training modules and
workshops
- public
institutions/entities
- Attendance lists
- private
institutions/entities
3.1.3 No. of extension officers
trained in producing
countries
No. of extension officers trained in producing countries. - Registration for workshops
- public
institutions/entities
- public institutions/entities - Attendance lists
- private
institutions/entities
- private institutions/entities
To consider a producer trained, they must have an
attendance rate of at least ≥ 75% in at least one (1)
training module, with a minimum of at least five (5) full
days of training attended
3.2 Change indicators (out Baseline Overall Programt Year Target Definition of Indicator Means of Verification
3.2.1 No. of local CPQP
programme partner
implementation
structures operational.
The number of locally based offices/structures that are
operational and used by CPQP programme partners to
facilitate field-level programme interventions and
promote on-the-ground activities to strengthen the
cocoa sector development. This could include district-
based offices, warehouses, processing centres etc.
- Verification of the use and support
of these structures will be conducted
on an annual basis through visitation
by the CPQP Coordinator, alongside
representatives from the relevant
CPQP programme partners
3.2.2 No. of trained extension
officers sharing
knowledge in workshops
with global cocoa
stakeholders
The number of extension officers, both public and
private sector, involved in cocoa sector development
who participated in knowledge-sharing workshops with
global cocoa stakeholders regarding Good Agricultural
Practices (GAP), Good Social Practices (GSP), Good
Environmental Practices (GEP), or Good Business
Practices (GBP), ICS and certification.
- Registration for workshops
- public
institutions/entities
- Attendance lists

LEI R
eport 2
014-0
16| 1
15
Number Progress indicators
(output)
Baseline Overall
Programme
Target
(2012-15)
Year Target
(2012)
Cumulative
progress
(2012-15)
Definition of Indicator Means of Verification
- private
institutions/entities
- Workshop reports
4 Result Area 4. Knowledge on sustainability, efficient and effective supply chain approaches developed and shared
4.1.1 No. of best practices
developed and
documented
The number of developed and documented best
practices for cocoa production, post-harvest processing
and storage, packaging, quality control, marketing,
access to finance, and other relevant cocoa sector
development issues
- Best practice documents
4.2 Change indicators (ou Bas Overall Progget Year Target Definition of Indicator Means of Verification
4.2.1 No. of best practices
shared in sector (through
websites, events, etc.)
The number of developed and documented best
practices for cocoa production, post-harvest processing
and storage, packaging, quality control, marketing,
access to finance, and other relevant cocoa sector
development issues shared with, and available to cocoa
sector actors
- Availability of best practice
documentation can be verified by
availability online (websites of CPQP
programme partners, as well as
forums and membership based
organisations) and availability of
documentation at conferences/events
4.2.2 No. of regional cocoa
forums established and
recognised by the sector
The number of cocoa forums established at regional
level to discuss and debate cocoa sector issues and
provide credible advocacy for improvements in the
enabling environment and enhance collaboration and
shared vision among stakeholders
- Attendance lists from forums and
documentation of the event results
- Documentation of forum results
shared with attendees and
recommendations for action passed
on to change agents, e.g. local
and/or central Government and other
major sector stakeholders

LEI Report 2014-016| 116
Table 13
Indicator measurement.
Indicators Indicator measurement
Gross income from cocoa Yearly production of all cocoa farms multiplied by the average price
per kg for cocoa paid to farmers
Labour costs of cocoa production All reported hours spent on cocoa production activities multiplied by
the price of labour (2000 CFAF per day). Family labour costs are
calculated using the same price as for hired labour.
Not included are costs and time spent by farmers on training,
communal 'shared' labour gangs, as lead farmers, on internal control
systems and on auditing
Farmers indicating zero labour costs were not included in the
calculations
Input costs of cocoa production Number of times a product is applied multiplied by unit multiplied by
price per unit of input (fertilisers and crop protection products such
as fungicide and pesticide)
Time (opportunity costs) to become UTZ Certified and investing in
PPE has not been taken into account in cost calculations
Total cocoa production costs Labour + input costs
Not included are costs of equipment and personal protective
equipment, costs (in kind) of spraying gangs or communal 'shared'
labour
Time (opportunity costs) to become UTZ Certified and investing in
PPE has not been taken into account in cost calculations
Net income from cocoa Yearly production of cocoa from the main farm, minus total
production costs for the main farm
Farm cocoa production efficiency Economic and agronomic input/output ratio
Productivity Yield per tree per hectare. Based on farmers report of their farm
size.
An alternative productivity result is based on the margin of error
(70% of farm sizes were estimated, with on average farm size 7%
over estimated)
Knowledge of good agricultural practices (cocoa) Farmers were asked 12 multiple choice questions on good
agricultural practices. Correctly answered questions correspond to
the requirements of the UTZ Code of Conduct. The more correct
answers a farmer, the higher the score for the individual question.
For each question a score was derived on a scale between 1 and 10.
The overall knowledge score was measured as an average of all
scores for the individual scores.
Implementation of good agricultural practices
(cocoa)
Farmers were asked 24 multiple choice questions on good
agricultural practices. Correctly answered questions correspond to
the requirements of the UTZ Code of Conduct. The answers were
score related to the correctness of the answer. For each question a
score was derived for each farmer on a scale between 1 and 10. The
overall score for the implementation of good agricultural practices
was measured as an average of all scores for the individual scores.
Satisfaction with livelihood Farmer perception, 5-point Likert scale
Changes in needs (income, food, water, status,
health, education, other)
Farmer perception based on open questions with qualitative answers
possible.
Satisfaction with services of producer group Farmer perception, 3-point Likert scale
Satisfaction with interventions of traders
programmes
Farmer perception, 3-point Likert scale and open question

LEI Report 2014-016| 117
Stakeholders interviewed Annex 3
Stakeholder type Organisation* Number of people
interviewed
Location
Traders ADM 1 Abidjan, Amsterdam & Geneva
Cocaf Ivoire (Noble) 1 Abidjan
CEMOI 1 Abidjan
OLAM (Outspan Ivoire) 1 Abidjan
NATRA 1 Phone/email
Zamacom 1 Abidjan
Barry Callebaut 1 Abidjan
Cargill 1 Abidjan & Amsterdam
Focus groups CACEP 32 Diegonefla
COOPADA 10 Dagadji (San-Pedro)
CAESA 12 Djangobo (Abengourou)
Coopagli 7 Gligbéadji
LCAG 12 Dioligbi (GUITRY)
Anouanzè de Duékoué 9 Bohoussoukro (DUEKOUE)
Allouata 9 Nizahon (GUIGLO)
Fiédifouê 10 Paulkro (DALOA)
C.A.E.T.H
(C.A.E.T.D)
10 BOWALY (DALOA)
ECOOPAD 10 Zébra (DALOA),
Producer Group managers COOPADA 1 Dagadji (San-Pedro)
C.A.E.T.H. 1 Bowaly (DALOA)
COOPAGLI 1 Gligbéadji
CAESA 1 Djangobo
LCAG 1 Guitry (Dioligbi)
Teachers & school directors CAESA 1 Djangobo
- 1 EPP MAHINO II
COOPAGLI 1 Epp Gligbeadji
LCAG 1 Dioligbi (GUIYTY
Village chiefs LCAG 1 Dioligbi (Guitry)
CAESA 1 Djangobo
Farmers (for most significant change
Stories)
LCAG 1 Guitry (Dioligbi)
Fiédifouê 1 Paulkro (DALOA)
Service providers ANADER 2 Abidjan
Solidaridad & REC/WAFF 5 Abidjan & Amsterdam
Anader 1 At co-op Allouata in Nizahon
(GUIGLO)
*NOTE: Names of individual interviewees have not been provided to maintain confidentiality.
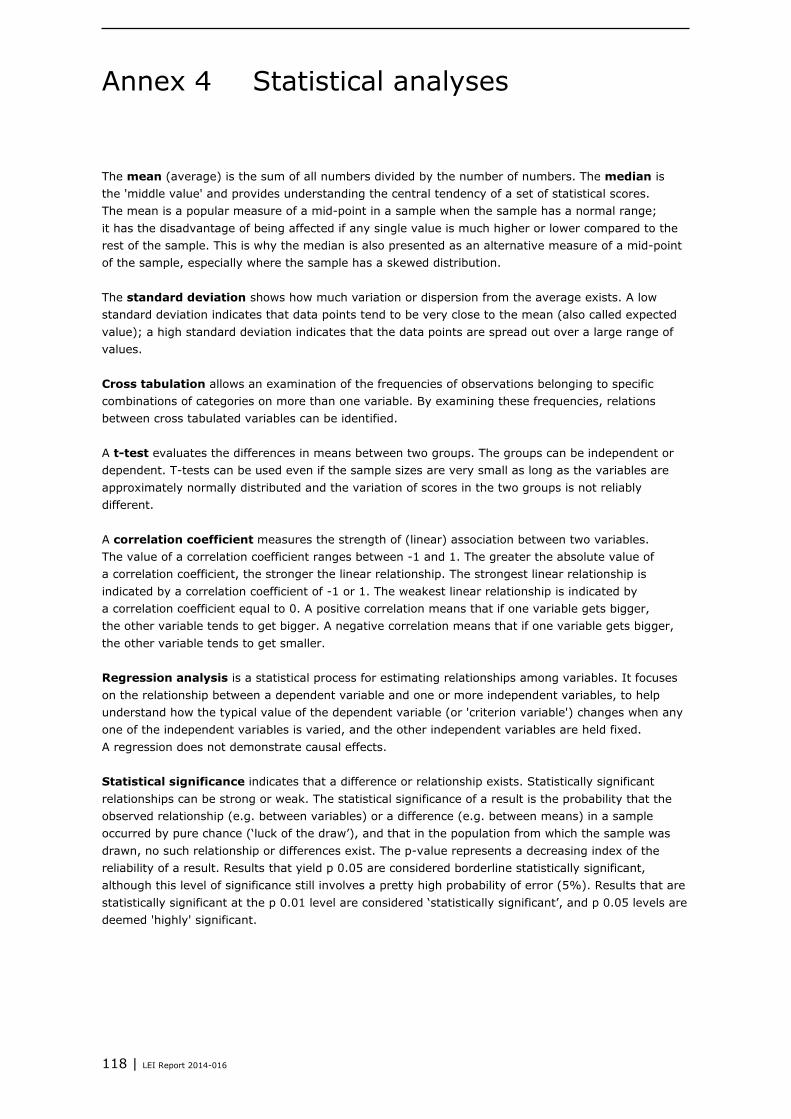
118 | LEI Report 2014-016
Statistical analyses Annex 4
The mean (average) is the sum of all numbers divided by the number of numbers. The median is
the 'middle value' and provides understanding the central tendency of a set of statistical scores.
The mean is a popular measure of a mid-point in a sample when the sample has a normal range;
it has the disadvantage of being affected if any single value is much higher or lower compared to the
rest of the sample. This is why the median is also presented as an alternative measure of a mid-point
of the sample, especially where the sample has a skewed distribution.
The standard deviation shows how much variation or dispersion from the average exists. A low
standard deviation indicates that data points tend to be very close to the mean (also called expected
value); a high standard deviation indicates that the data points are spread out over a large range of
values.
Cross tabulation allows an examination of the frequencies of observations belonging to specific
combinations of categories on more than one variable. By examining these frequencies, relations
between cross tabulated variables can be identified.
A t-test evaluates the differences in means between two groups. The groups can be independent or
dependent. T-tests can be used even if the sample sizes are very small as long as the variables are
approximately normally distributed and the variation of scores in the two groups is not reliably
different.
A correlation coefficient measures the strength of (linear) association between two variables.
The value of a correlation coefficient ranges between -1 and 1. The greater the absolute value of
a correlation coefficient, the stronger the linear relationship. The strongest linear relationship is
indicated by a correlation coefficient of -1 or 1. The weakest linear relationship is indicated by
a correlation coefficient equal to 0. A positive correlation means that if one variable gets bigger,
the other variable tends to get bigger. A negative correlation means that if one variable gets bigger,
the other variable tends to get smaller.
Regression analysis is a statistical process for estimating relationships among variables. It focuses
on the relationship between a dependent variable and one or more independent variables, to help
understand how the typical value of the dependent variable (or 'criterion variable') changes when any
one of the independent variables is varied, and the other independent variables are held fixed.
A regression does not demonstrate causal effects.
Statistical significance indicates that a difference or relationship exists. Statistically significant
relationships can be strong or weak. The statistical significance of a result is the probability that the
observed relationship (e.g. between variables) or a difference (e.g. between means) in a sample
occurred by pure chance (‘luck of the draw’), and that in the population from which the sample was
drawn, no such relationship or differences exist. The p-value represents a decreasing index of the
reliability of a result. Results that yield p 0.05 are considered borderline statistically significant,
although this level of significance still involves a pretty high probability of error (5%). Results that are
statistically significant at the p 0.01 level are considered ‘statistically significant’, and p 0.05 levels are
deemed 'highly' significant.

LEI Report 2014-016| 119
Key data correlations between Annex 5
length of UTZ programme
participation and outcome and
impact indicators
Table 14
Correlations between length of programme participation and economic outcome/impact indicators.
Indicator Significant correlation between length of UTZ
programme participation and outcome indicators
+ statistically significant positive correlation - statistically significant negative correlation 0 no statistically significant correlation
Cocoa production (main farm) 0
Total labour costs 0
Total input costs 0
Input costs (fertilisers) 0
Input costs (pesticides) 0
Input costs (fungicides) 0
Input costs (herbicides) 0
Input costs (planting material) 0
Total production costs 0
Productivity (main farm) 0
Productivity (all farms) 0
Cocoa production efficiency +
Gross income from cocoa (main farm) +
Gross income from cocoa (all farms) 0
Net cocoa income (main farm) +
Gross income from other sources 0
Gross total household income 0
Cocoa quality 0
Satisfaction with livelihood 0

120 | LEI Report 2014-016
Table 15
Correlations between length of programme participation and knowledge and implementation of GAPs.
Indicator Significant correlation between length of UTZ
programme participation and outcome indicators
+ statistically significant positive correlation - statistically significant negative correlation 0 no statistically significant correlation
Overall knowledge level 0
Overall level of implementation of GAPs +
Record keeping +
Knowledge of child labour issues 0
Implementation of child labour practices (children assisting in
12 cocoa production practices)
0
Knowledge on soil conservation practices 0
Implementation of soil conservation practices 0
Knowledge on water conservation practices 0
Implementation of water conservation practices 0
Knowledge on cocoa production practices 0
Implementation of cocoa production practices 0
Knowledge on health related practices (PPE use) 0
Implementation of health related practices (PPE) 0
Implementation of waste management practices 0
Implementation of biodiversity conservation practices +
Implementation of post-harvest practices 0

LEI Report 2014-016| 121
Questionnaires Annex 6
Survey instruments
1. Semi-structured Interviews with different stakeholders in the chain (see list indicated earlier)
The enumerator explained the aim of the research, the feedback mechanisms in the form of a
verification meeting, reports and farmer info sheet. Photos, when permitted, were taken and
notable quotations written up. Compared to the farmers’ questionnaire, questions in the semi-
structured interviews were open-ended and tailored to the particular relationship between the
respondent and UTZ certification. The objective of semi‐structured interview was to gain a range of
insights on both quantitative and qualitative information from a sample of respondents, and
following up with probes to get in‐depth information. The enumerator sought to confirm what was
already known from secondary research, and to fill in information gaps. The information obtained
from these interviews was not just to provide answers, but also the reasons for the answers. The
semi-structured interviews allowed to develop direct and indirect approaches to address sensitive
labour issues, gathering data on workers on farms, school attendance, social interaction, perceived
benefits and challenges. The semi-structured interview guide detailed a clear set of instructions for
the enumerators in order to provide reliable, comparable qualitative data. The average length of
the individual interviews was 1.5 hour. An example is provided below.
http://edepot.wur.nl/313480
2. Focus group meetings with different stakeholders
The purpose of focus group meeting was primarily to explore and understand how inclusive the
UTZ Certified cocoa programme in Côte d’Ivoire is, what future opportunities are, and the extent
that knowledge and benefits reach others (family members, workers etc.) on certified farms. The
average time taken to conduct a focus group was 1.5 hour. An example of focus group semi-
structured questionnaire is provided below.
3. Story harvesting, ‘change story’ technique
Only a very small number of farmers participated in change story interviews. Selection was upon a
random basis and voluntary for farmers. Farmers were asked which were the most major changes
experienced. This was supported by photos. The average length of the interview was 1 hour.
4. Observation of the context
The survey also uses data from direct and photographic observations recorded by the survey team
on the living environment (road access and quality, housing, surrounding environment (forests,
fields, degraded land), village schools, general health of farmers, observed child labour, cocoa
fields (farm work and presence of shade trees) and processing activities.

122 | LEI Report 2014-016
Databases Annex 7
Digital version in excel.
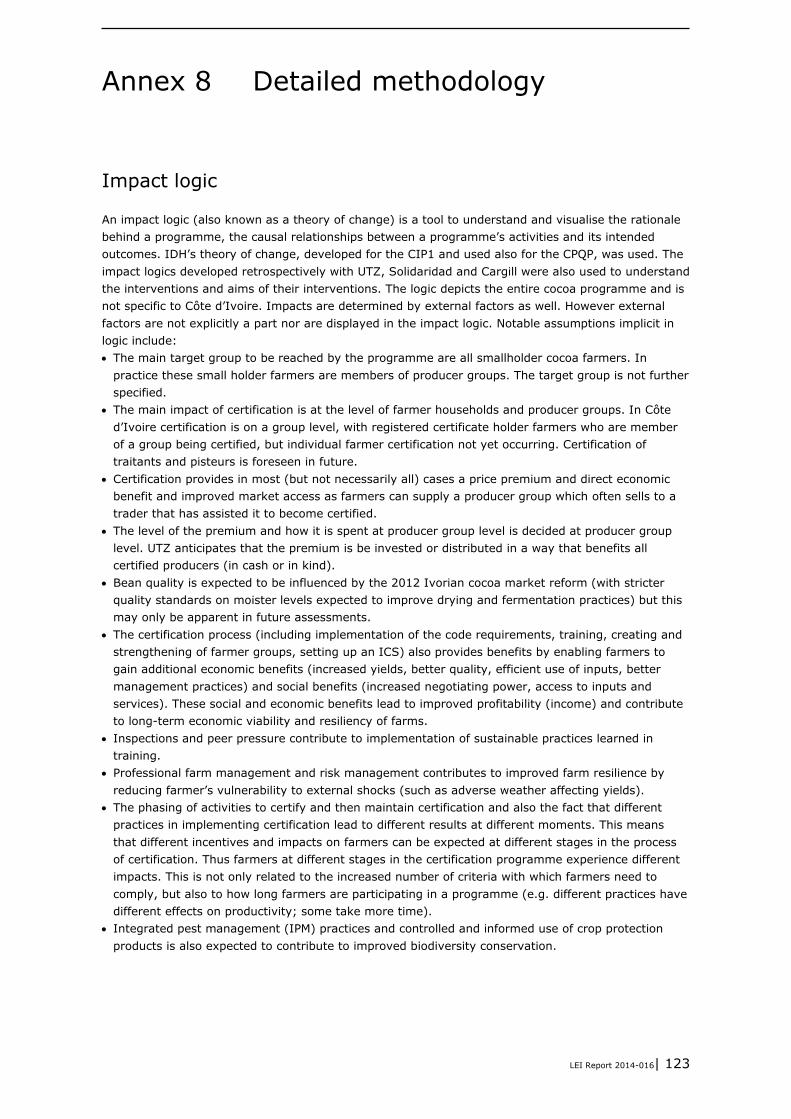
LEI Report 2014-016| 123
Detailed methodology Annex 8
Impact logic
An impact logic (also known as a theory of change) is a tool to understand and visualise the rationale
behind a programme, the causal relationships between a programme’s activities and its intended
outcomes. IDH’s theory of change, developed for the CIP1 and used also for the CPQP, was used. The
impact logics developed retrospectively with UTZ, Solidaridad and Cargill were also used to understand
the interventions and aims of their interventions. The logic depicts the entire cocoa programme and is
not specific to Côte d’Ivoire. Impacts are determined by external factors as well. However external
factors are not explicitly a part nor are displayed in the impact logic. Notable assumptions implicit in
logic include:
The main target group to be reached by the programme are all smallholder cocoa farmers. In
practice these small holder farmers are members of producer groups. The target group is not further
specified.
The main impact of certification is at the level of farmer households and producer groups. In Côte
d’Ivoire certification is on a group level, with registered certificate holder farmers who are member
of a group being certified, but individual farmer certification not yet occurring. Certification of
traitants and pisteurs is foreseen in future.
Certification provides in most (but not necessarily all) cases a price premium and direct economic
benefit and improved market access as farmers can supply a producer group which often sells to a
trader that has assisted it to become certified.
The level of the premium and how it is spent at producer group level is decided at producer group
level. UTZ anticipates that the premium is be invested or distributed in a way that benefits all
certified producers (in cash or in kind).
Bean quality is expected to be influenced by the 2012 Ivorian cocoa market reform (with stricter
quality standards on moister levels expected to improve drying and fermentation practices) but this
may only be apparent in future assessments.
The certification process (including implementation of the code requirements, training, creating and
strengthening of farmer groups, setting up an ICS) also provides benefits by enabling farmers to
gain additional economic benefits (increased yields, better quality, efficient use of inputs, better
management practices) and social benefits (increased negotiating power, access to inputs and
services). These social and economic benefits lead to improved profitability (income) and contribute
to long-term economic viability and resiliency of farms.
Inspections and peer pressure contribute to implementation of sustainable practices learned in
training.
Professional farm management and risk management contributes to improved farm resilience by
reducing farmer’s vulnerability to external shocks (such as adverse weather affecting yields).
The phasing of activities to certify and then maintain certification and also the fact that different
practices in implementing certification lead to different results at different moments. This means
that different incentives and impacts on farmers can be expected at different stages in the process
of certification. Thus farmers at different stages in the certification programme experience different
impacts. This is not only related to the increased number of criteria with which farmers need to
comply, but also to how long farmers are participating in a programme (e.g. different practices have
different effects on productivity; some take more time).
Integrated pest management (IPM) practices and controlled and informed use of crop protection
products is also expected to contribute to improved biodiversity conservation.

124 | LEI Report 2014-016
Expected outcomes and impacts
The main impacts expected are economic, social and ecological. These are:
Economic
Due to training and certification, good agricultural practices and meeting the criteria leading to
increased productivity, with a better crop leading to better prospects for men, women and children
Improved crops, lead to increased production, leads to increase of income
Training leads to farmers being better business people
Increased income is invested in the farm (production) and/or improving the standard of living
(housing, sanitation, healthcare, education, etc.)
Improved farmer profitability, together with improved farmer resilience, contributes to improved
long-term economic viability of farms.
Social
Better working conditions and respect for workers and children’s rights contribute to a better
livelihood and improved standard of living.
Better income, leads to better life, assuming that income is divided by gender in a more equal way.
Training and awareness rising, peer pressure and inspections mean that labour rights are respected
and prevent child labour, in line with ILO standards (such that children are not conducting hazardous
or heavy work, or working during school hours etc.). These factors -together with improved income-
contribute to children’s school attendance.
Training and criteria on safe practices and safe handling and storage of agrochemicals and
agrochemical waste lead to healthy and safe working and living conditions. Together with better
access to emergency and primary healthcare (for specifics please see code requirements), this
contributes to improved health.
Ecological
Training, good agricultural practices and criteria on safe practices and safe handling and storage of
agrochemicals and agrochemical waste, cocoa waste management and reduction lead to less
environmental impacts than conventional production and a better environment, where the quality of
water and soil is maintained and improved and natural habitats and biodiversity on and near farm is
protected and restored.
Improved productivity and efficiency contribute to reduced pressure on land and reduced GHG
emissions per unit of produce.
Methodological strengths, weaknesses and limitations
As the main primary data collection method has strengths and weaknesses in terms of the validity of
conclusions that can be drawn, four criteria were used to assess this method (Ton et al. 2011). The
strengths and weaknesses, and resulting methods proposed to countervail weaknesses are presented
in Annex 8. In section 1 or Chapter 8, recommendations are developed for improvement of this type of
research.

LEI R
eport 2
014-0
16| 1
25
Threats to validity of
conclusions
Study ambition Strengths Assessment of method regarding validity
of resulting conclusions
Additional methods to countervail weakness
Construct validity: how
generalisations are made from
the categories used in the
evaluation to broader units of
representation.
Representativeness of the
intervention group
Implies that comparable
knowledge of Ivorian cocoa
farmers is available to enable a
comparison.
Sampling is robust and sample size is
sufficiently large to allow statistical
analysis of target groups by regions,
phases and control group.
Other stakeholders included in the
focus groups
Moderate
Limited and inconsistent data is available for
the main farmer characterises and some other
environmental indicators (perceptions rather
than field based measurements of soil and
water quality for which casual perception
which may be inaccurate and for which
changes or impacts only may be perceptible
after longer time periods.
Literature review and benchmarking to compare
target, intervention group
Verification meeting with traders and farmers to
obtain their feedback on findings and if/how the
farmers are different form their experience, also to
source additional data.
Internal validity: the way
causality is attributed in the
evaluation. This refers to the
logic behind the observed links
and explains why and how
interventions contribute to the
observed change.
The impact logic was developed to
make explicit how economic, social
and environmental outcomes were
expected to result from
interventions made as part of the
UTZ Certification programme.
Approach captures perception of
farmers and stakeholders on
Indicators of change, causality and
attribution.
Moderate
Lack of baseline and multiple interventions
(outside of certification) to target group make
attribution of causality difficult.
Many similar interventions to those made
during certification were also made prior to
certification, of which the impacts have long
time scales to occur (e.g. impact of tree
regeneration) making very causality difficult
to attribute.
Traders interviews to obtain data on their and
other interventions
Literature review to obtain data on external
influences and interventions which may influence
indicators.
Literature review and benchmarking to compare
target, intervention group
This study will act as a baseline for future impact
assessments. It should allow a better
interpretation of causality and testing of impact
logic.
Statistical conclusion validity:
the way inferences about links
are made in data-set
observations. This emphasises
the need to comply with proven
methods to estimate
association or correlation
between variables.
Representative sample group of
farmers from each trader and
control group. Minimal risk of
spillover and contamination due to
selection criteria. If occurred,
would be captured in the
questionnaire.
The triangulation between qualitative
and quantitative data confirms and
helps explain conclusions reached
from the statistical analysis.
Good
Sufficient size sample of farmers for each
trader, control group and farmers in each
agro-ecological zone.
Differences in affiliation than indicated on the
UTZ list resulted in some changes in number
of interviews per trader, however each trader,
control group and agro-ecological zone are
sufficiently covered.
IDH provided additional funds to ensure that a
statistically valid sample size of producer groups
linked to all traders was interviewed.
External validity: the way that
findings are generalisable to
other persons, times and
contexts. This requires being
precise about the settings,
subjects, and contexts.
Study would be generalisable to all
UTZ Certified farmers.
Note: the results are not intended
to be generalisable to other
certification schemes or to all non-
certified farmers in Côte d’Ivoire.
The large sample size and
methodology means that the results
should be generalisable to other UTZ
Certified producers and producer
groups.
The focus groups provided insights
into if the individual farmer data was
generalisable to other farmers in a
community.
Good Literature review specifically sought results of
other certification schemes in Côte d’Ivoire to
verify external validity.

LEI Report 2014-016| 126
Limitations of the study include:
1. That the budget and timescale indicated in the work plan (see Annex 1) did not allow major
changes to be made to the methodology to respond to recommendations made by WUR for the
UTZ Ghana study or based on similar experiences e.g. COSA and the Ghana MIT study
(Hainmueller et al. 2011). Thus the basis of the study remains a one-off questionnaire to farmers.
This method has inherent problems as it relies on short-term memory recall by farmers and
possible recollection error, no or poor recordkeeping, interpretation bias and perceptions,
particularly of environmental changes which often occur at different timescales compared to
livelihood changes (Angelsen et al. 2011). This means the data are subject to recollection error
and interpretation bias. Alternative methods are generally more costly and require longer time
periods (i.e. one to two years) and continued agreement with respondents to participate.
2. The tight time schedule in setting up the survey, which didn’t allow all project groups to be well
informed before the survey;
3. IDH came late into the arrangements with UTZ and Solidaridad, leaving no time to adjust the
indicators and methods to incorporate all the CPQP indicators.
4. Despite informing traders and cooperatives of the survey and its aims in advance, problems with
obtaining permission to interview producer groups and details of members for the farmer survey
were encountered at trader and cooperative level, causing substantial delays of around two
months and additional travel costs and areas were revisited once permission had been obtained.
5. The recentness of the last phase of certification, making it difficult for farmers to accurately
respond about changes;
6. Selection of producer groups and farmers for the control group was problematic. Even after
checking at the commencement of the interview if the farmer was not certified, some farmers
indicated later in the questionnaire that they had had training associated with certification. This
concerned farmers in groups which had initially started working with traders on certification but
did not continue in the programme and/or their group was no longer affiliated to the specific
trader.
7. The long questionnaire due to large number of indicators covered. This occasionally fatigued
farmers as well as took their valuable time.
8. The limited time and opportunity to build the skills of the enumerators to conduct the stakeholder
and focus group questionnaires resulted in a lower level of understanding and ability to collect
some of the stakeholder data. This combined with logistical problems resulted in fewer stakeholder
interviews than planned.
9. Inconsistency in the dataset can shed doubts on the trustworthiness of the answers given. For
example, some questions were supposed to be skipped after the respondent gave a certain answer
to the previous question, but in the dataset the respondent did answer the question.
10. Farmers occasionally appeared confused about their status of receiving training for UTZ
certification, being UTZ Certified, or being in the process of becoming UTZ Certified. With effort
and assistance from UTZ and the enumerators, farmers were assigned into the correct categories.
11. Farmers also indicated differences between data provided by UTZ and traders and their actual
links. Four producer groups indicated that they had disagreements with traders with whom they
originally started certification and training and some had commenced selling to other traders.
Data collection and analysis methods
To respond to the terms of reference (ToR), the research was organised using different data collection
tools. To prepare the enumerators for data gathering, a practical week long training was organised.
This focussed on introducing the survey team (nine enumerators and two supervisors) to the study,
the IDH and UTZ Certified programme in Côte d’Ivoire and the tools to be used. This ensured common
comprehension on the local names and terminologies used by cocoa farmers, types of tenure, the
activities that cocoa farmers typically go through to produce cocoa, and the equipment and tools used
in cocoa production. The enumerators were introduced to the different survey instruments and trained
on interviewing techniques, ensuring sensitivity to the local context and confidentiality. The
questionnaires were discussed and refined. During the discussion, enumerators were trained to
interpret the questions into local languages in which the interview was to be conducted. This process

LEI Report 2014-016| 127
of translation, together with role plays carried out by the enumerators was instrumental in the
extensive revision and reduction of the length of the questionnaires. The enumerators were also
trained on data entry and photography skills. Following the workshop, the revised questionnaires were
tested with farmers and a producer group manager in a cocoa growing community near Soubré in Bas
Sassandra region. All enumerators and supervisors participated in the test. Afterwards, the group
discussed the interviews and commented upon the process of interview, farmer selection,
questionnaire structure, and the arrangement of questions. WUR finalised the questionnaires based on
the comments of the survey team. The questionnaires are provided in Annex 6.
The main methods of collecting quantitative and qualitative data (i.e. farmers and other stakeholder’s
perceptions of impacts) was through interviews using semi structured questionnaires with farmers and
other stakeholder’s in the UTZ Certified programme, combined with on-farm and village observations,
and quantitative data made available by traders and UTZ Certified. The vast majority of the data was
collected in Côte d’Ivoire by nine enumerators guided by Roger Tanoh and Abel Galo of A & CV in Côte
d’Ivoire in between November 2012 and July 2013. Additional interviews were held by phone and with
traders in Abidjan and in the Netherlands by the WUR team in the same period. The enumerators
visited the individual farmers with a structured ‘’producer’’ questionnaire to gather data on the general
characteristics of farmers, their farms and households; cocoa production; productivity and efficiency;
production costs; certification; working conditions; environmental aspects; knowledge and
implementation of practices; revenues and livelihoods; and profits and rewards.
The interviews with other stakeholders aimed to gather their perceptions of benefits and challenges
with respect to the impact of the UTZ certification, and any available quantitative data. Shown in
indicated in Table 4, these semi-structured interviews were conducted using dedicated questionnaires
for producer group managers, traders, school masters, village chiefs, training and service providers
and local authorities, and change story telling with selected farmers. The mix of techniques was used
to triangulate some of the results of the producer interviews and to obtain a more in-depth
understanding of perceived changes, particularly on sensitive topics (such as income and child labour)
and potential groups, the contextual factors and unintended effects. The focus groups in villages also
provided perceptions of people in cocoa communities who are not necessarily cocoa farmers. This
qualitative analysis complements the more quantitative data from producers, provides lessons learned
and distils change stories. It is also the source of illustrative quotations presented in the report.
Observations were made during all interviews. Photos were made at producer group locations and on
farms. These have been provided digitally with a small selection included for illustration in the report.
Literature on the UTZ Certification programme in Côte d’Ivoire was gathered, this includes the UTZ
Code of Conduct (UTZ Certified 2009b; UTZ Certified 2009c; UTZ Certified 2010), definitions (UTZ
Certified 2009a), and banned crop protection products (D’IVOIRE 2008; UTZ Certified 2012b). Data on
trader’s activities was further sourced via the internet to complement the trader interviews. Further
literature was reviewed to assess the possibility of retrospectively providing a baseline and
benchmarking the selected indicators. This data was used to assess whether the research results in
this study reflect the general situation of Ivorian cocoa farmers. The references are provided in
the text and in the references in chapter 9. An overview of the benchmarking documents is provided in
Annex 10.
The 99 farmer cocoa fields were measured using a GPS together with the farmer following the
producer interview and were then compared to the farm size previously stated in the interview.
The detailed results are presented in Annex 9.
The producer survey data were first entered into Excel and then exported to the statistical programme
STATA27 for analysis. For the indicators, descriptive statistics such as the mean, median and standard
deviation are presented, explained in Annex 4. Where relevant, descriptive statistics also show
27
StataCorp, 2007. Stata Statistical Software: Release 10. College Station, TX: StataCorp LP.
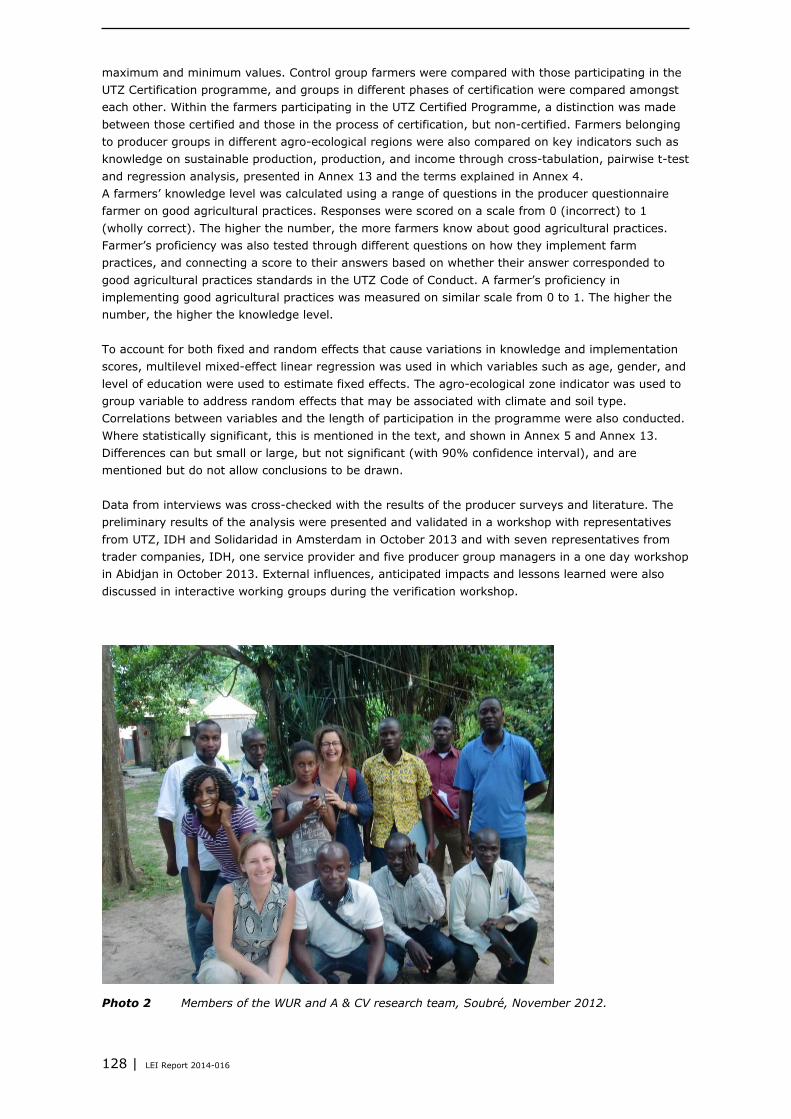
128 | LEI Report 2014-016
maximum and minimum values. Control group farmers were compared with those participating in the
UTZ Certification programme, and groups in different phases of certification were compared amongst
each other. Within the farmers participating in the UTZ Certified Programme, a distinction was made
between those certified and those in the process of certification, but non-certified. Farmers belonging
to producer groups in different agro-ecological regions were also compared on key indicators such as
knowledge on sustainable production, production, and income through cross-tabulation, pairwise t-test
and regression analysis, presented in Annex 13 and the terms explained in Annex 4.
A farmers’ knowledge level was calculated using a range of questions in the producer questionnaire
farmer on good agricultural practices. Responses were scored on a scale from 0 (incorrect) to 1
(wholly correct). The higher the number, the more farmers know about good agricultural practices.
Farmer’s proficiency was also tested through different questions on how they implement farm
practices, and connecting a score to their answers based on whether their answer corresponded to
good agricultural practices standards in the UTZ Code of Conduct. A farmer’s proficiency in
implementing good agricultural practices was measured on similar scale from 0 to 1. The higher the
number, the higher the knowledge level.
To account for both fixed and random effects that cause variations in knowledge and implementation
scores, multilevel mixed-effect linear regression was used in which variables such as age, gender, and
level of education were used to estimate fixed effects. The agro-ecological zone indicator was used to
group variable to address random effects that may be associated with climate and soil type.
Correlations between variables and the length of participation in the programme were also conducted.
Where statistically significant, this is mentioned in the text, and shown in Annex 5 and Annex 13.
Differences can but small or large, but not significant (with 90% confidence interval), and are
mentioned but do not allow conclusions to be drawn.
Data from interviews was cross-checked with the results of the producer surveys and literature. The
preliminary results of the analysis were presented and validated in a workshop with representatives
from UTZ, IDH and Solidaridad in Amsterdam in October 2013 and with seven representatives from
trader companies, IDH, one service provider and five producer group managers in a one day workshop
in Abidjan in October 2013. External influences, anticipated impacts and lessons learned were also
discussed in interactive working groups during the verification workshop.
Photo 2 Members of the WUR and A & CV research team, Soubré, November 2012.

LEI Report 2014-016| 129
Photo 3 Data collection: interview using the producer questionnaire.
External, influencing factors
The CPQP is not implemented in isolation. Many of the initiatives implemented by traders participating
in the CPQP have similar aims intended impacts, which could influence CPQP activities There are also
influencing factors over which IDH and partners have little or no control. The following factors have
been shown in literature, and were reiterated in the verification meeting and in trader interviews, to
influence farmers' productivity, incomes, and livelihoods:
A farmer's age, gender, and education level, which influences knowledge and skills, and ability to
participate in and benefit from training and support activities (Waarts et al. 2013)
Difficulties in accessing credit, experienced by all farmers and farmer groups (Nyemeck et al. 2007).
The weather, which can strongly positively or negatively affect crop disease, productivity and
product quality (Eberhard Krain 2011; Läderach 2011).
Differences in the suitability of soil, altitude and climate across Côte d’Ivoire (Läderach 2011).
The availability and quality of government extension services (Ayenor et al. 2007; Baah et al. 2009;
Gbêhi and Leeuwis 2012; Paschall and Seville 2012).
The lack of physical infrastructure, which makes access to markets difficult (Kessler et al. 2012).
Land and crop tenure arrangements can dissuade farm managers from investing in planting trees
and limit farmer's access to expand their farm or to acquire new land (Gray and Kevane 1999;
Dormon et al. 2004).
The 2010-2011 crisis in Côte d’Ivoire, which led to migration and in some cases abandonment of
cocoa farms in conflict areas (Guesnet et al. 2009).
The 2012 Ivorian government reform that fixed farm-gate and export prices of cocoa (CTA 2012).
Global demand and fluctuating world market prices for cocoa and other cash crops grown by
farmers, such as rubber, oil palm, and coffee, affecting their investment in cocoa (Koning and
Jongeneel 2006).
These factors were taken into account in the interpretation of the results of the study to help explain
impacts found and possible causal links.

130 | LEI Report 2014-016
Indicator measurement
Indicators Indicator measurement
Gross income from cocoa Yearly production of all cocoa farms multiplied by the average price
per kg for cocoa paid to farmers
Labour costs of cocoa production All reported hours spent on cocoa production activities multiplied by
the price of labour (2000 CFAF per day). Family labour costs are
calculated using the same price as for hired labour.
Not included are costs and time spent by farmers on training,
communal 'shared' labour gangs, as lead farmers, on internal control
systems and on auditing
Farmers indicating zero labour costs were not included in the
calculations.
Input costs of cocoa production Number of times a product is applied multiplied by unit multiplied by
price per unit of input (fertilisers and crop protection products such as
fungicide and pesticide)
Time (opportunity costs) to become UTZ Certified and investing in PPE
has not been taken into account in cost calculations
Total cocoa production costs Labour + input costs.
Not included are costs of equipment and personal protective
equipment, costs (in kind) of spraying gangs or communal 'shared'
labour.
Time (opportunity costs) to become UTZ Certified and investing in PPE
have not been taken into account in cost calculations.
Net income from cocoa Yearly production of cocoa from the main farm, minus total production
costs for the main farm
Cocoa production efficiency Economic and agronomic input/output ratio
Productivity Yield per tree per hectare. Based on farmers reports of their farm size.
An alternative productivity result was not presented in the report but
could be used, Only 30% of farmers had measured their farm size, the
remaining 70% were estimates. On average farmers over estimated
their farm size by 7%.
Knowledge of good agricultural practices (cocoa) Farmers were asked 12 multiple choice questions on GAPs. Correctly
answered questions correspond to the requirements of the UTZ Code
of Conduct. The more correct answers a farmer, the higher the score
for the individual question. For each question a score was derived on a
scale between 1 and 10. The overall knowledge score was measured
as an average of all scores for the individual scores.
Implementation of good agricultural practices
(cocoa)
Farmers were asked 24 multiple choice questions on GAPs. Correctly
answered questions correspond to the requirements of the UTZ Code
of Conduct. The answers were score related to the correctness of the
answer. For each question a score was derived for each farmer on a
scale between 1 and 10. The overall score for the implementation of
good agricultural practices was measured as an average of all scores
for the individual scores.
Satisfaction with livelihood Farmer perception, 5-point Likert scale
Changes in needs (income, food, water, status,
health, education, other)
Farmer perception based on open questions with qualitative answers
possible.
Satisfaction with services of cooperative Farmer perception, 3-point Likert scale
Satisfaction with interventions of traders
programmes
Farmer perception, 3-point Likert scale and open question
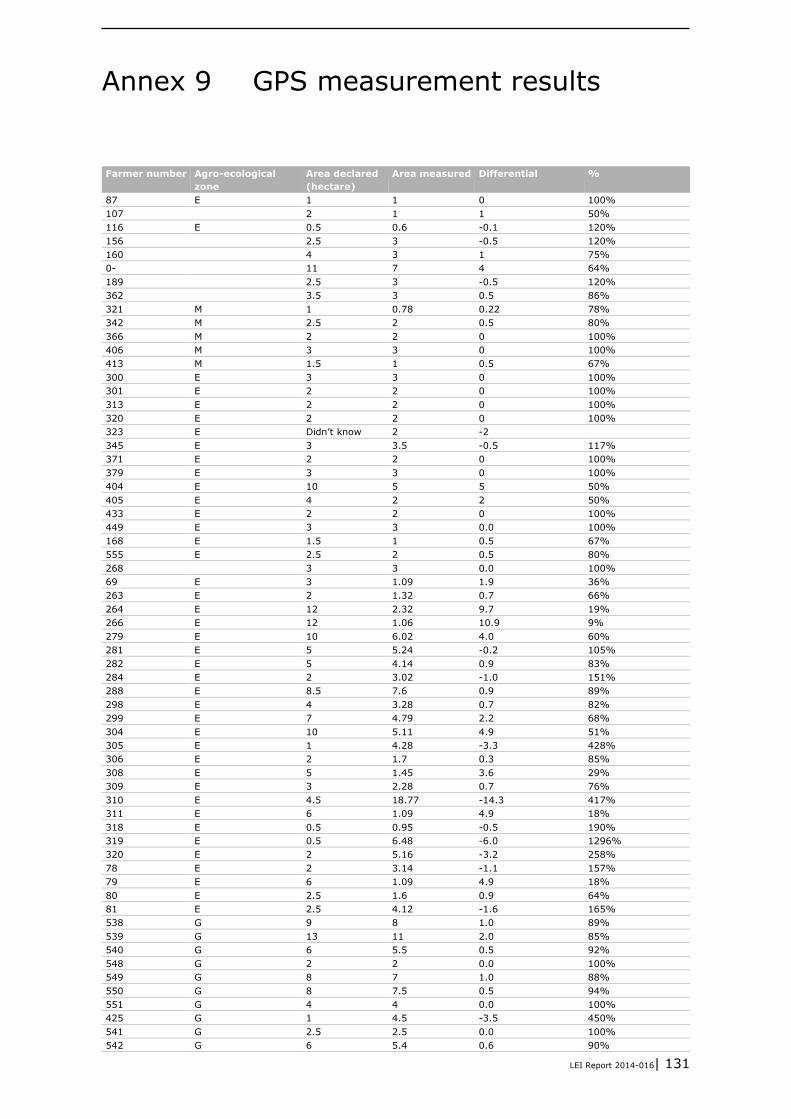
LEI Report 2014-016| 131
GPS measurement results Annex 9
Farmer number Agro-ecological
zone
Area declared
(hectare)
Area measured Differential %
87 E 1 1 0 100%
107 2 1 1 50%
116 E 0.5 0.6 -0.1 120%
156 2.5 3 -0.5 120%
160 4 3 1 75%
0- 11 7 4 64%
189 2.5 3 -0.5 120%
362 3.5 3 0.5 86%
321 M 1 0.78 0.22 78%
342 M 2.5 2 0.5 80%
366 M 2 2 0 100%
406 M 3 3 0 100%
413 M 1.5 1 0.5 67%
300 E 3 3 0 100%
301 E 2 2 0 100%
313 E 2 2 0 100%
320 E 2 2 0 100%
323 E Didn’t know 2 -2
345 E 3 3.5 -0.5 117%
371 E 2 2 0 100%
379 E 3 3 0 100%
404 E 10 5 5 50%
405 E 4 2 2 50%
433 E 2 2 0 100%
449 E 3 3 0.0 100%
168 E 1.5 1 0.5 67%
555 E 2.5 2 0.5 80%
268 3 3 0.0 100%
69 E 3 1.09 1.9 36%
263 E 2 1.32 0.7 66%
264 E 12 2.32 9.7 19%
266 E 12 1.06 10.9 9%
279 E 10 6.02 4.0 60%
281 E 5 5.24 -0.2 105%
282 E 5 4.14 0.9 83%
284 E 2 3.02 -1.0 151%
288 E 8.5 7.6 0.9 89%
298 E 4 3.28 0.7 82%
299 E 7 4.79 2.2 68%
304 E 10 5.11 4.9 51%
305 E 1 4.28 -3.3 428%
306 E 2 1.7 0.3 85%
308 E 5 1.45 3.6 29%
309 E 3 2.28 0.7 76%
310 E 4.5 18.77 -14.3 417%
311 E 6 1.09 4.9 18%
318 E 0.5 0.95 -0.5 190%
319 E 0.5 6.48 -6.0 1296%
320 E 2 5.16 -3.2 258%
78 E 2 3.14 -1.1 157%
79 E 6 1.09 4.9 18%
80 E 2.5 1.6 0.9 64%
81 E 2.5 4.12 -1.6 165%
538 G 9 8 1.0 89%
539 G 13 11 2.0 85%
540 G 6 5.5 0.5 92%
548 G 2 2 0.0 100%
549 G 8 7 1.0 88%
550 G 8 7.5 0.5 94%
551 G 4 4 0.0 100%
425 G 1 4.5 -3.5 450%
541 G 2.5 2.5 0.0 100%
542 G 6 5.4 0.6 90%

132 | LEI Report 2014-016
Farmer number Agro-ecological
zone
Area declared
(hectare)
Area measured Differential %
543 G 15 12 3.0 80%
544 G 4.5 4.5 0.0 100%
545 G 5 5 0.0 100%
546 G 2.5 2.5 0.0 100%
547 G 4 4 0.0 100%
5 10 11 -1.0 110%
48 4.8 6 -1.2 125%
211 0.6 1.5 -0.9 250%
216 3.45 3.5 0.0 101%
217 3.5 3.5 0.0 100%
223 5.18 7 -1.8 135%
224 1.3 10 -8.7 769%
228 4.46 6 -1.5 135%
231 4 4 0.0 100%
83 1 2 -1.0 200%
94 2 5 -3.0 250%
111 2 2 0.0 100%
118 2 2 0.0 100%
150 E 2 2 0.0 100%
188 5 4 1.0 80%
191 4 3.5 0.5 88%
247 0.55 1 -0.5 182%
262 E 3 2.5 0.5 83%
269 2 1.89 0.1 95%
303 2 2 0.0 100%
314 2 3 -1.0 150%
54 E 6 5.16 0.8 86%
55 E 6.5 6 0.5 92%
56 E 2 1.11 0.9 56%
57 E 4.5 4.94 -0.4 110%
58 E 1 3.19 -2.2 319%
59 E 2 2.6 -0.6 130%
118 E 3 3 0.0 100%
120 E 6.5 2.86 3.6 44%
561 E 1.8 1.9 -0.1 106%
562 E 2 1.8 0.2 90%
Total 99 E=
G=
M=
Area declared Area measured Differential %
Average 3.97 3.70 0.23 93%
% 107%
median 3 3 0 1
std dev 3.2 2.9 3.0 1

LEI Report 2014-016| 133
Overview of benchmarking data Annex 10
Study name
Gockwiski & Sonwa, 2008 (date of survey 2001-2002) (Gockowski and Sonwa 2008)
Biodiversity conservation and smallholder cocoa production systems in West Africa with particular reference to the Western
Region of Ghana and the Bas Sassandra region of Côte d’Ivoire. West Africa with particular reference to the Western
Region of Ghana and the Bas Sassandra region of Côte d’Ivoire
Indicators Results
Countries 4
Cameroon, Ghana, Côte d’Ivoire, Nigeria
# villages 337
# Household heads 4426
# Household heads producing cocoa 4034
Côte d’Ivoire t
Average harvested per household (ha) 5.27
Yield (kg/ha) 352
fungicide cost (USD/ha) 4.05
insecticide cost (USD/ha) 42.4
fertiliser cost (USD/ha) 5.21
seed garden hybrids (%) 12
local unimproved varieties 88
mix of local and seed garden hybrids n/a
Shade levels by country and region
Ghana 2
45.2
52.7
Côte d’Ivoire 24.4
48.1
27.5
Study name
KPMG cost benefit analysis (GBCG 2012; KPMG 2012b)
Indicators Results
Analysis of 3 certification initiatives Fairtrade, UTZ and Rainforest Alliance
In our model, certification is represented as an intervention on the farmer/co-op profit and loss account (P&L) for an
archetypal farmer/co-op, representing a particular segment of producers, which provides us with information for our base
model. The base model was developed and populated with data from interviews with stakeholders in Ghana, Côte d’Ivoire
and Europe, a previous study from KPMG (2011) for IDH. The Sustainable Trade Initiative and literature research that has
been issued since the model inception (Ruf et al., 2012) This means a business case for certification exists, even when
productivity improvement is not attributed to certification.
Base Yield kg/ha
Yield increase with fertiliser use over 3 year period from Ruf et al, 2012.
yield in final year kg/ha
farm size ha
group chum % farmers leaving group per year
retroactive certification # of years
grant funding $ per certified ton
grant funding period # of years
cost of pesticide $/ha/year
cost of fertiliser $/ha/year
labour day-rate $/day
work done by farmer % of total amount of work
initial farmer time investments hours
farmer time for ICS hours per week
farm gate price % of export price
market price $/1000kg
time of selling certified cocoa after first
investment
# of years
group size # of group members
group forming $/group
Base Yield kg/ha
Yield increase with fertiliser use over 3 year period from Ruf
et al, 2012.
89% G, 101% CdI
yield in final year kg/ha
farm size ha
group chum % farmers leaving group per year
retroactive certification # of years
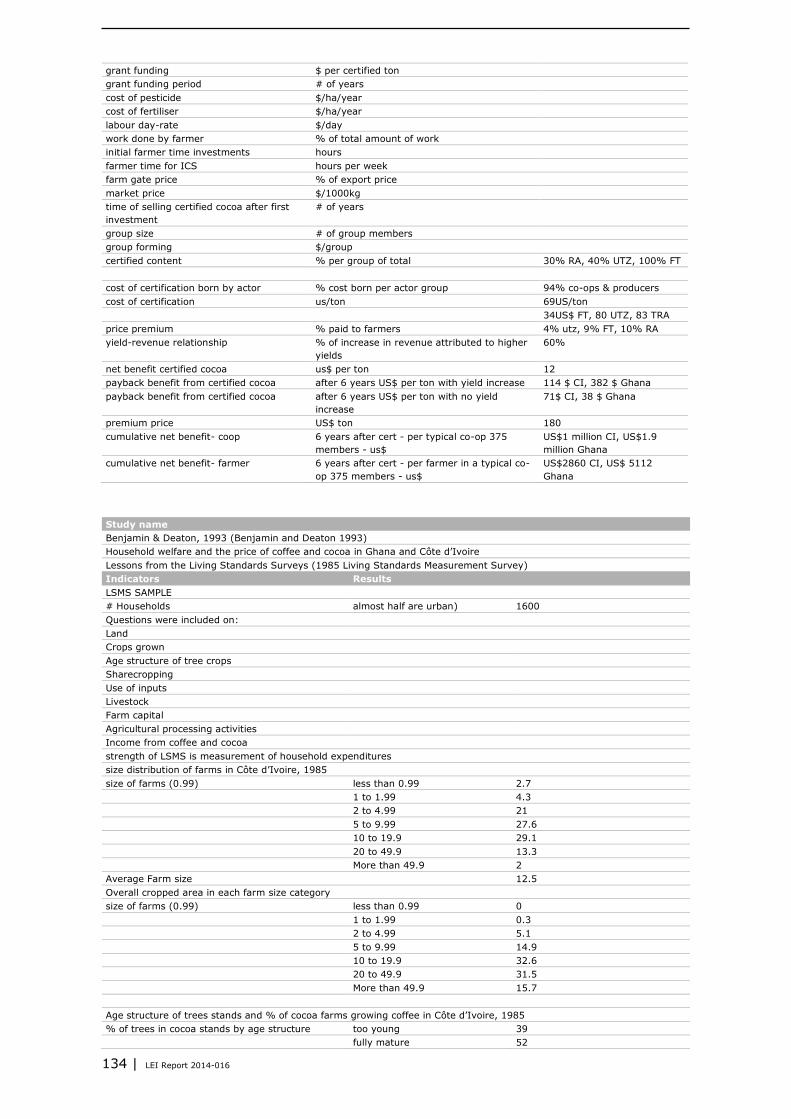
134 | LEI Report 2014-016
grant funding $ per certified ton
grant funding period # of years
cost of pesticide $/ha/year
cost of fertiliser $/ha/year
labour day-rate $/day
work done by farmer % of total amount of work
initial farmer time investments hours
farmer time for ICS hours per week
farm gate price % of export price
market price $/1000kg
time of selling certified cocoa after first
investment
# of years
group size # of group members
group forming $/group
certified content % per group of total 30% RA, 40% UTZ, 100% FT
cost of certification born by actor % cost born per actor group 94% co-ops & producers
cost of certification us/ton 69US/ton
34US$ FT, 80 UTZ, 83 TRA
price premium % paid to farmers 4% utz, 9% FT, 10% RA
yield-revenue relationship % of increase in revenue attributed to higher
yields
60%
net benefit certified cocoa us$ per ton 12
payback benefit from certified cocoa after 6 years US$ per ton with yield increase 114 $ CI, 382 $ Ghana
payback benefit from certified cocoa after 6 years US$ per ton with no yield
increase
71$ CI, 38 $ Ghana
premium price US$ ton 180
cumulative net benefit- coop 6 years after cert - per typical co-op 375
members - us$
US$1 million CI, US$1.9
million Ghana
cumulative net benefit- farmer 6 years after cert - per farmer in a typical co-
op 375 members - us$
US$2860 CI, US$ 5112
Ghana
Study name
Benjamin & Deaton, 1993 (Benjamin and Deaton 1993)
Household welfare and the price of coffee and cocoa in Ghana and Côte d’Ivoire
Lessons from the Living Standards Surveys (1985 Living Standards Measurement Survey)
Indicators Results
LSMS SAMPLE
# Households almost half are urban) 1600
Questions were included on:
Land
Crops grown
Age structure of tree crops
Sharecropping
Use of inputs
Livestock
Farm capital
Agricultural processing activities
Income from coffee and cocoa
strength of LSMS is measurement of household expenditures
size distribution of farms in Côte d’Ivoire, 1985
size of farms (0.99) less than 0.99 2.7
1 to 1.99 4.3
2 to 4.99 21
5 to 9.99 27.6
10 to 19.9 29.1
20 to 49.9 13.3
More than 49.9 2
Average Farm size 12.5
Overall cropped area in each farm size category
size of farms (0.99) less than 0.99 0
1 to 1.99 0.3
2 to 4.99 5.1
5 to 9.99 14.9
10 to 19.9 32.6
20 to 49.9 31.5
More than 49.9 15.7
Age structure of trees stands and % of cocoa farms growing coffee in Côte d’Ivoire, 1985
% of trees in cocoa stands by age structure too young 39
fully mature 52

LEI Report 2014-016| 135
near end 9
% of cocoa farms growing coffee 78
% of trees in coffee stands by age structure too young 18
fully mature 67
near end 15
% of coffee farms growing cocoa 67
Average household income and expenditure data
Cocoa All households All farm households
Sales
Less non-labour inputs
less monteyage (labour costs)
net cocoa income 110 166
Coffee
Sales
Less non-labour inputs
less monteyage (labour costs)
net coffee income 56 85
home-produced food 203 307
net other agricultural income 118 178
total agricultural income 487 736
Non-agricultural income
Wages 533 133
Self-employment 306 162
other income 236 115
total non-agricultural income 1074 410
Total income 1562 1146
Household expenditure 1638 1161
Per capita expenditure 264 153
Sample Size 1559 1033
Average yield per hectare coffee
Average yield per hectare cocoa
Metayeurs (hired labour)
income
cuts in cocoa and coffee prices that have taken place are unlikely to have had a dramatic effect on the distribution of
income, essentially because cocoa and coffee farmers are well scattered through the population
Study name
FAFO 2012 (Hatløy et al. 2012)
Baseline Study Report, Towards Côte d Ívoire Sustainable Cocoa Initiative (CISCI)
Indicators Results
Method
conducted by team of 4 people (2 FAFO researchers, 2 Ivorian consultants)
work carried out July-August 2012
Most information collected from Abidjan
various stakeholders interviewed: List in Annex 3
Annex 4: complete list of cocoa sector programme and projects
Section 1.2 Cocoa in Côte dÍvoire
600 000 cocoa farms
4 million of country's 22 million inhabitants
average farm size 3 ha
yield kg/ha = 450
cocoa primary source of income for more than 75% of population
income is limited with farmers receiving not more than 40% of the CIF price
43% of population remain below poverty line
72% of farming communities have no health centre and other basic services
60% have no access to drinking water
Chapter 4: constraints for sustainable cocoa sector page 22
social constraints
child labour specifically worst forms of child labour
access to basic infrastructure
ageing of farmers
HIV/AIDS and malaria prevention
farmer safety
Economic
access to finance
access to agricultural inputs
cooperative organisation
ageing of cocoa trees
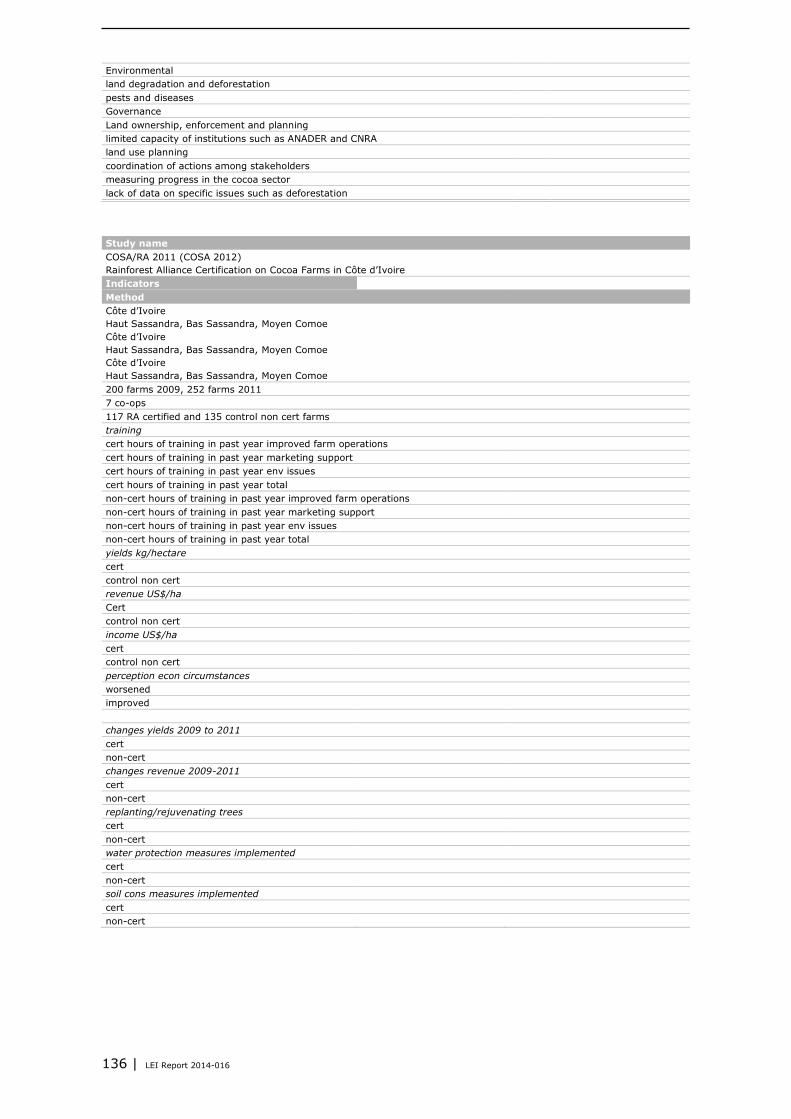
136 | LEI Report 2014-016
Environmental
land degradation and deforestation
pests and diseases
Governance
Land ownership, enforcement and planning
limited capacity of institutions such as ANADER and CNRA
land use planning
coordination of actions among stakeholders
measuring progress in the cocoa sector
lack of data on specific issues such as deforestation
Study name
COSA/RA 2011 (COSA 2012)
Rainforest Alliance Certification on Cocoa Farms in Côte d’Ivoire
Indicators RESULTS
Method
Côte d’Ivoire
Haut Sassandra, Bas Sassandra, Moyen Comoe
Côte d’Ivoire
Haut Sassandra, Bas Sassandra, Moyen Comoe
Côte d’Ivoire
Haut Sassandra, Bas Sassandra, Moyen Comoe
200 farms 2009, 252 farms 2011
7 co-ops
117 RA certified and 135 control non cert farms
training econ
cert hours of training in past year improved farm operations 5.5
cert hours of training in past year marketing support 0.5
cert hours of training in past year env issues 4.7
cert hours of training in past year total 20.8
non-cert hours of training in past year improved farm operations 0.8
non-cert hours of training in past year marketing support 0
non-cert hours of training in past year env issues 0.6
non-cert hours of training in past year total 3.6
yields kg/hectare econ
cert 576
control non cert 334
revenue US$/ha
Cert 922
control non cert 542
income US$/ha
cert 403
control non cert 113
perception econ circumstances
worsened cert 33%
improved cert 67%
non cert 26%
changes yields 2009 to 2011
cert 7%
non-cert 115%
changes revenue 2009-2011
cert 39%
non-cert 201%
replanting/rejuvenating trees
cert 63%
non-cert 27%
water protection measures implemented
cert 80%
non-cert 17%
soil cons measures implemented
cert 35%
non-cert 4%
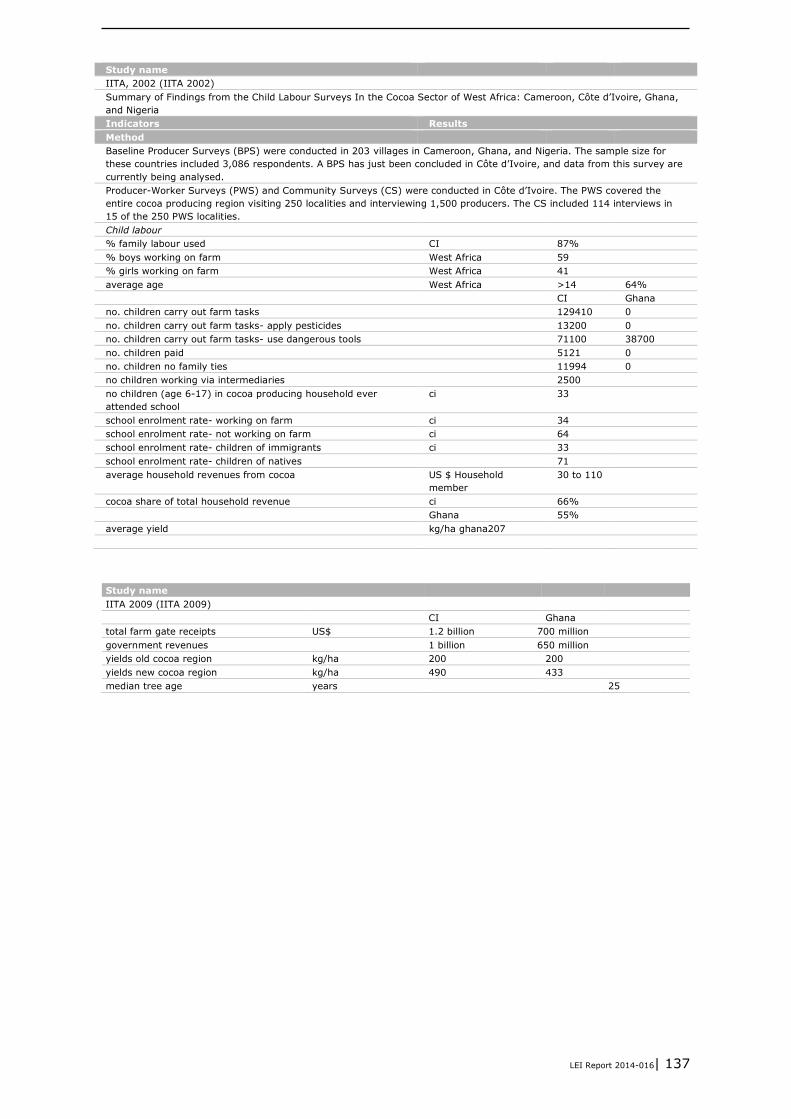
LEI Report 2014-016| 137
Study name
IITA, 2002 (IITA 2002)
Summary of Findings from the Child Labour Surveys In the Cocoa Sector of West Africa: Cameroon, Côte d’Ivoire, Ghana,
and Nigeria
Indicators Results
Method
Baseline Producer Surveys (BPS) were conducted in 203 villages in Cameroon, Ghana, and Nigeria. The sample size for
these countries included 3,086 respondents. A BPS has just been concluded in Côte d’Ivoire, and data from this survey are
currently being analysed.
Producer-Worker Surveys (PWS) and Community Surveys (CS) were conducted in Côte d’Ivoire. The PWS covered the
entire cocoa producing region visiting 250 localities and interviewing 1,500 producers. The CS included 114 interviews in
15 of the 250 PWS localities.
Child labour
% family labour used CI 87%
% boys working on farm West Africa 59
% girls working on farm West Africa 41
average age West Africa >14 64%
CI Ghana
no. children carry out farm tasks 129410 0
no. children carry out farm tasks- apply pesticides 13200 0
no. children carry out farm tasks- use dangerous tools 71100 38700
no. children paid 5121 0
no. children no family ties 11994 0
no children working via intermediaries 2500
no children (age 6-17) in cocoa producing household ever
attended school
ci 33
school enrolment rate- working on farm ci 34
school enrolment rate- not working on farm ci 64
school enrolment rate- children of immigrants ci 33
school enrolment rate- children of natives 71
average household revenues from cocoa US $ Household
member
30 to 110
cocoa share of total household revenue ci 66%
Ghana 55%
average yield kg/ha ghana207
Study name
IITA 2009 (IITA 2009)
CI Ghana
total farm gate receipts US$ 1.2 billion 700 million
government revenues 1 billion 650 million
yields old cocoa region kg/ha 200 200
yields new cocoa region kg/ha 490 433
median tree age years 25

138 | LEI Report 2014-016
Overview of inputs used by Annex 11
cocoa farmers
Type pesticide product % respondents
N= 376
45SC 0%
ACCELAM 2%
ACTARA 2%
ALM 0%
ALPHA 0%
ATIKPA 1%
BASUDINE 2%
BIOCAO 0%
BORADYNE 7%
BOREX 6%
BOREXNA 0%
BOSSE PLUS 0%
CABOSSE 18 MOIS 0%
CABOSSE PLUS 5%
CACAO SUPER 0%
CACAO VITESSE 1%
CAHOMONIAC 0%
CALFAN 5%
CALIFAN 0%
CALIVOIRE 1%
CAO SUPER 0%
CAODAN 0%
CAOFORCE 16%
CAOMIDAX 0%
CAONET 1%
CAOTIMAN 0%
CAOVITESSE 0%
CATAPULTE 1%
COLIDOR 0%
CROBITEX 0%
ENGEO 0%
ENGES 0%
ENJO 0%
GAWA 2%
GLYPADAIRE 0%
GRAMOXONE 0%
GROSUDINE 2%
HUMIDOR 0%
IMIDOR 1%
IRAN 0%
KAFANE SUPER 1%
KOLINOR 1%
MIRADOR 0%
MIRIDENT 0%
MORèS 0%
ONEX 0%
PARACAO 1%
PROTEK 1%
SOFITAN 0%
SUPER GRO 0%
TERMINUS 0%
THIODAN 13%
THIOSULFAN 11%
THIONEX 1%
TIMA SUPER 0%
TROPICAO 1%
TROPINEX 0%
TURBO ACTION 0%

LEI Report 2014-016| 139
Herbicide
Type herbicide % respondent
N= 121
ADWUMAWURA 1.7%
BINFAGA 1.7%
KALACH 3.3%
DABA 0.8%
DESTRUCTOR 360 SL 0.8%
FANGA 1.7%
Glyphadaire 10.7%
GRAMOKATE 0.8%
GRAMOXONE 34.7%
HERBESTRA 3.3%
HERCULE 1.7%
PLYPHADèR 0.8%
Round Up 37.2%
GRIFADEL 0.8%
Note- some farmers indicate the same products for both herbicide and fungicidal use
Fungicide
Type fungicide % respondent
N= 65
AGRICAO 1.6%
BASF 1.6%
CALLOMILE 6.3%
CAOFORCE 1.6%
CONSICAO 1.6%
FONGICAO 14.3%
FORUM 3.2%
GLIPHADER 7.9%
RIDOMIL 49.2%
RIDOMIN 0.0%
RUDOMINE 1.6%
Round Up 6.3%
TROPICAL 3.2%
unknown 1.6%
Fertilisers
Type of fertiliser %
N= 80
23 NPK 61.3%
COMPOST 7.5%
DECHET DE MOUTON 1.3%
DECHET DE POULET 6.3%
EK 18 1.3%
HURE 1.3%
Fertiliser (unknown name) 1.3%
HYDROCAO 2.5%
MARZOUZA 1.3%
ROUND-UP 1.3%
STPC 1.3%
SUPERCAO 10.0%
SUPERGRO 1.3%
VITA PLUS 1.3%
éLéPHANT 1.3%
Cocoa plant materials
Local name for plant material Unit Total costs in CFAF
18 months 100 seedlings sufficient for 1 hectare 25000 CFAF to CENERA
BRESIL 100 seedlings sufficient for 1 hectare 100 for 25000 pay to CENERA
GHANA Per seedling Purchase or exchanged with other farmers
MERCEDES Per seedling Purchase or exchanged with other farmers
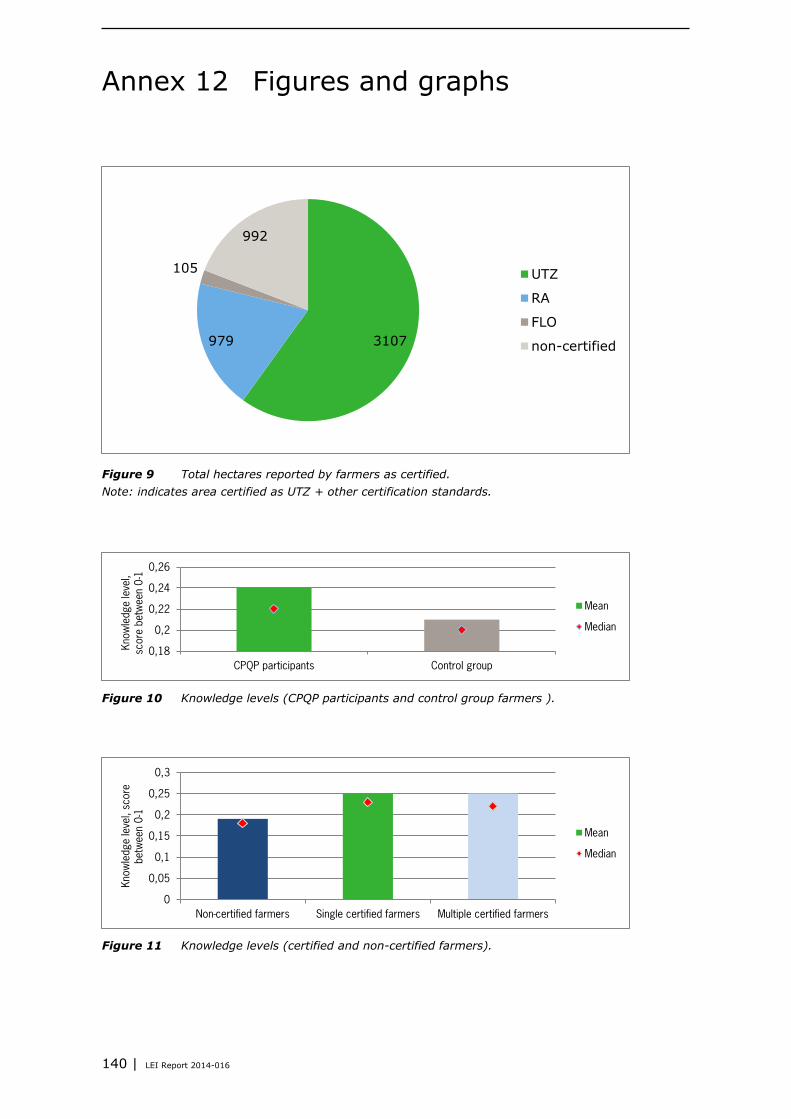
140 | LEI Report 2014-016
Figures and graphs Annex 12
Figure 9 Total hectares reported by farmers as certified.
Note: indicates area certified as UTZ + other certification standards.
Figure 10 Knowledge levels (CPQP participants and control group farmers ).
Figure 11 Knowledge levels (certified and non-certified farmers).
3107 979
105
992
UTZ
RA
FLO
non-certified
0,18
0,2
0,22
0,24
0,26
CPQP participants Control group
Kno
wle
dge le
vel,
score
betw
een
0-1
Mean
Median
0
0,05
0,1
0,15
0,2
0,25
0,3
Non-certified farmers Single certified farmers Multiple certified farmers
Kno
wle
dge le
vel,
score
betw
een
0-1
Mean
Median

LEI Report 2014-016| 141
Figure 12 Implementation levels (CPQP participants and control group farmers).
Figure 13 Implementation levels (certified and non-certified farmers).
Figure 14 Farmers’ perceptions of increased knowledge on GAPs.
Source: Focus Group (121 participants).
Figure 15 Farmers’ satisfaction with livelihoods (CPQP farmers and control group).
0,22
0,23
0,24
CPQP participants Control group
Leve
l of
imple
ment
ation
of
GAPS
, sc
ore
betw
een
0-1
Mean
Median
0,21
0,215
0,22
0,225
0,23
0,235
0,24
0,245
Non-certified farmers Single certified farmers Multiple certified farmers
Leve
l of im
ple
ment
ation
of
GAPs,
score
betw
een
0-1
Mean
Median
26%
26% 16%
21%
11% weeding
Techniques de tailles
Recolte Phytosanitaire
traitements phytosanitaire
bonnes pratiques de récolte,de fermentation et deséchage
3,1
3,2
3,3
3,4
3,5
3,6
CPQP participants Control group
Satisfa
ction w
ith
livelihood , s
core
betw
een 0
-5
Mean
Median

142 | LEI Report 2014-016
Figure 16 Farmers’ satisfaction with livelihoods (non-certified and certified farmers).
Figure 17 Farmers’ satisfaction with different aspects of livelihoods (CPQP farmers and
control group). Key: 0 = unsatisfied 2.5= neutral 5 = very satisfied.
Figure 18 Farmers’ satisfaction with producer groups services. Dissatisfaction – red satisfaction – blue Source: Focus group (121 participants).
0
1
2
3
4
Non-certified farmers Single certified farmers Multiple certified farmers
Satisf
action
with
livelih
ood, sc
ore
betw
een
0-5
Mean
Median
0 5
Access to empowerment activities
State of house, access to water, electricity etc.
Competences and leadership
Type and number of income sources
Access to information on agricultural product prices
Household income
Family health
Children's education is improving
Knowledge on good agricultural practices
Control group CPQP
37 30
10 14
5 1 2
5 5 6
5 16
12 10
5 2
0 10 20 30 40
Premium
credit for schooling
trasparence distribution prime
pepinieres
prompt payment
premium insufficient
no credit
high social contribution

LEI Report 2014-016| 143
Figure 19 Use of cocoa revenues by farmers.
Source: Focus Group (121 participants)
Figure 20 Perceptions of changes in living conditions since participation in a certification
programme.
(N = 200)
Figure 21 Changes in children’s schooling in the last two years.
(N = 249)
Figure 22 Changes in access to health care in the last two years.
(N = 327)
18%
49%
6%
6%
12%
3% 6% family needs
children schooling
Purchase machettes
Purchase clothes
Purchase inputs
Unforseen events
0
50
100
No change Positive change Negative change I don't know
Per
cent
CPQP participants
0
10
20
30
40
50
60
No change Positive change Negative change I don't know
Per
cent
CPQP participants
Control group
0
10
20
30
40
50
60
No change Positive change Negative change I don't know
Per
cent
CPQP participants
Control group

144 | LEI Report 2014-016
Figure 23 Changes in access to inputs in the last two years ago.
(N = 906)
Figure 24 Percentage of farmers sharing benefits with other parties.
(N = 844)
Figure 25 Premium price received per kg cocoa by farmers.
Figure 26 Farmer satisfaction with producer group services (CPQP farmers and control group).
Key: 2 = neutral, 3 = satisfied.
0
20
40
60
80
No change Positive change I do not know
Per
cent
CPQP participants
Control group
9%
77%
2%
20%
5%
53%
1% 9%
0%
20%
40%
60%
80%
100%
None Family Manager Labourers
Per
cent
CPQP participants
Control group
47
45
42
44
46
48
50
52
Single certified farmers Multiple certified farmers
Pre
miu
m p
er
kg
cocoa (C
FAF)
Mean
Median
2,05
2,1
2,15
2,2
2,25
2,3
2,35
2,4
CPQP participants Control group
Satisf
action
with
coopera
tive
, sc
ore
betw
een
1-3
Mean
Median

LEI Report 2014-016| 145
Figure 27 Farmer satisfaction with producer group services (non-certified and certified farmers.
Key: 2 = neutral, 3 = satisfied.
Figure 28 Farmer satisfaction with services offered by their producer group.
Figure 29 Farmer satisfaction with services offered by their producer group (continued).
1,97
2,12 2,14
1,8
1,9
2
2,1
2,2
2,3
Non-certified farmers Single certified farmers Multiple certified farmers
Satisf
action
with
coopera
tive
, sc
ore
betw
een
1-3
Mean
Median
0
10
20
30
40
50
60
70
80
90
Per
cent
Not applicable
Not satisfied
Neutral
Satisfied
0
10
20
30
40
50
60
Per
cent
Not applicable
Not satisfied
Neutral
Satisfied

146 | LEI Report 2014-016
Figure 30 Advantages of being member of a producer group.
(N = 477)
Figure 31 Farmers’ satisfaction with functioning of producer groups.
Figure 32 Farmers’ satisfaction with UTZ training programme.
55%
31% 20%
66%
6% Better social relations with otherfarmers
Knowledge exchange between themembers
Certain commmunal problems arediscussed during group meetings
I am delighted to be a member ofthe producer organisation
Other
0%
10%
20%
30%
40%
50%
60%
70%
80%
I feel represented bythe officials
I think that I have aninfluence in the
nomination/electionof officials
When an officialdoes not play his
role he/she will bereplaced
When I complainabout something ,
action is undertaken
I agree
Neutral
I do not agree
I do not know
0% 2%
97%
1%
Not satisfied
Neutral
Satisfied
I do not know

LEI Report 2014-016| 147
Figure 33 Suggested improvements for producer group by UTZ programme participants.
(N=717, multiple responses possible).
Figure 34 Farmers’ perceptions of the disadvantages of certification.
(N=48 multiple response possible).
Figure 35 Farmers’ perceptions of the advantages of certification.
(N=441 multiple response possible).
27%
17%
18%
31%
21%
31%
No improvements recommended
Training of managers
Improving accountability
Being transparent on information onprices and benefits
Giving information on how thepremiums are used
Other recommendations
0%
5%
10%
15%
20%
25%
30%
35%
40%
45%
GAP takes
time andeffort
Difficult to
compost
No access to
healthservices
Difficult to get
rid of blackpods
Poor access to
inputs andequipment
no support
group
Low premium Old cocoa
trees
Prohibiting
child labourcauses
diffculties
0%
5%
10%
15%
20%
25%
30%
35%
40%
45%
Better knowledge of GAP Betetr access to inputs Increase production Better bean quality do not know Community support
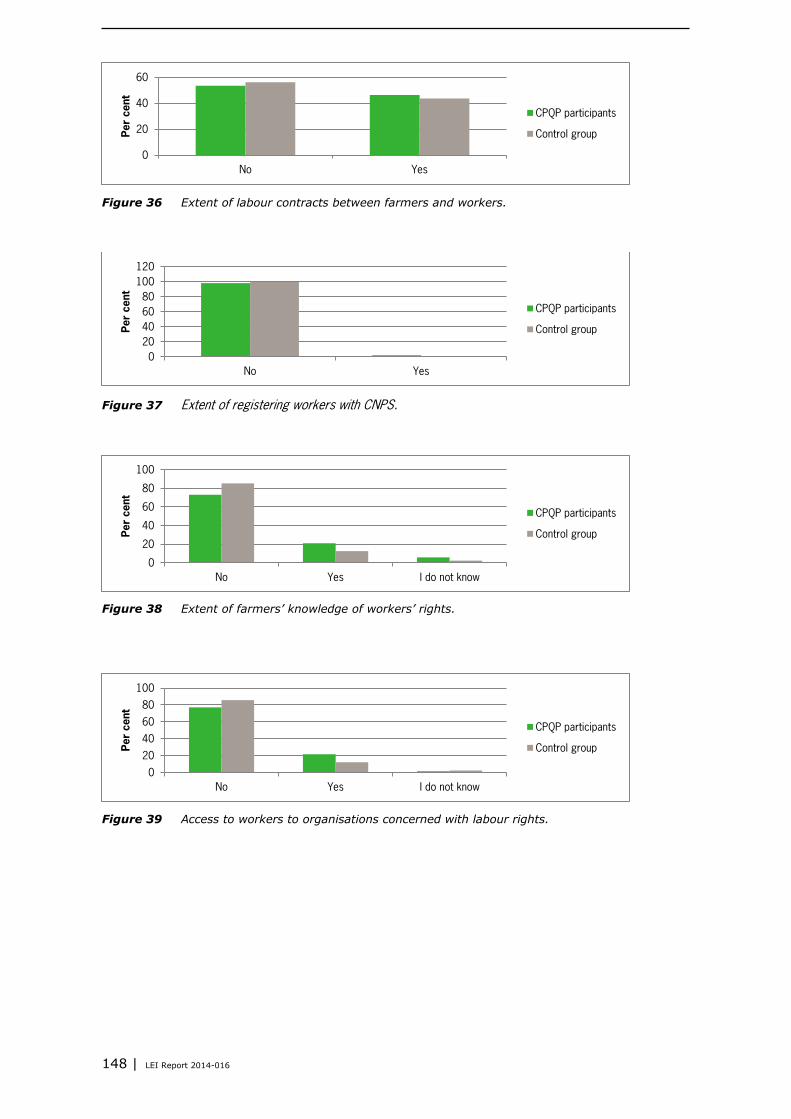
148 | LEI Report 2014-016
Figure 36 Extent of labour contracts between farmers and workers.
Figure 37 Extent of registering workers with CNPS.
Figure 38 Extent of farmers’ knowledge of workers’ rights.
Figure 39 Access to workers to organisations concerned with labour rights.
0
20
40
60
No Yes
Per
cent
CPQP participants
Control group
0
20
40
60
80
100
120
No Yes
Per
cent
CPQP participants
Control group
0
20
40
60
80
100
No Yes I do not know
Per
cent
CPQP participants
Control group
0
20
40
60
80
100
No Yes I do not know
Per
cent
CPQP participants
Control group

LEI Report 2014-016| 149
Figure 40 Average hours spent by children on cocoa production activities in 2012.
Key: * hazardous activities for children
Table 16
Average number of hours spent by children on cocoa production activities in 2012.
Activities hazardous for children* CPQP participants Control group
Pruning 5.23 3.31
Fertiliser application 0.4 0.6
Insecticide treatment 0.43 0.54
Fungicide pod treatment 0.31 0.57
Pod opening 2.61 2.04
*based on UTZ Code of Conduct
Figure 41 Activities associated with children’s rights noted by farmers.
Figure 42 Average knowledge score concerning the use of PPE.
Figure 43 Average implementation score concerning the use of PPE.
0,00
2,00
4,00
6,00
8,00
10,00
12,00
CPQP participants
Control group
0 0,5 1 1,5 2 2,5 3 3,5 4 4,5
no programs for women
no communitary program
construction of schools
provision of school furniture
rehabilitation of housesfor evening courses
oral sensibilisation on schooling
0,27 0,22
0
0,1
0,2
0,3
CPQP participants Control group
0,33 0,26
0
0,1
0,2
0,3
0,4
CPQP participants Control group

150 | LEI Report 2014-016
Figure 44 Changes in working conditions and healthcare.
Figure 45 Accidents during cocoa production activities in the last year. (N = 918)
Figure 46 Changes in access to credit compared to two years ago. (N = 263)
4
3
8
2
2
2
3
3
0 2 4 6 8 10
we do not spray anymore there are applicators
we do not spray on the cocoa plants next to the water
we do not re-use bottles of the Phyto products
insufficient distribution of pesticides
not enough spray and phyto applicators
no health centre
no first aid kits
Nothing has changed
0
0,1
0,2
0,3
0,4
CPQP participants Control group
0
5
10
15
20
25
CPQP participants Control group
Per
cent
No, nothing has changed
No, it is more difficult to obtaincredit now than two years ago
Yes (all positive statementscombined)
Yes, because I became a memberof a producer group
Yes, because our cocoa productionincreased
Yes, because my passbook showsmy production and costs
Yes, because project staff assistsus to access credit
Yes, because I participate in acertification programme
Yes, because other reasons
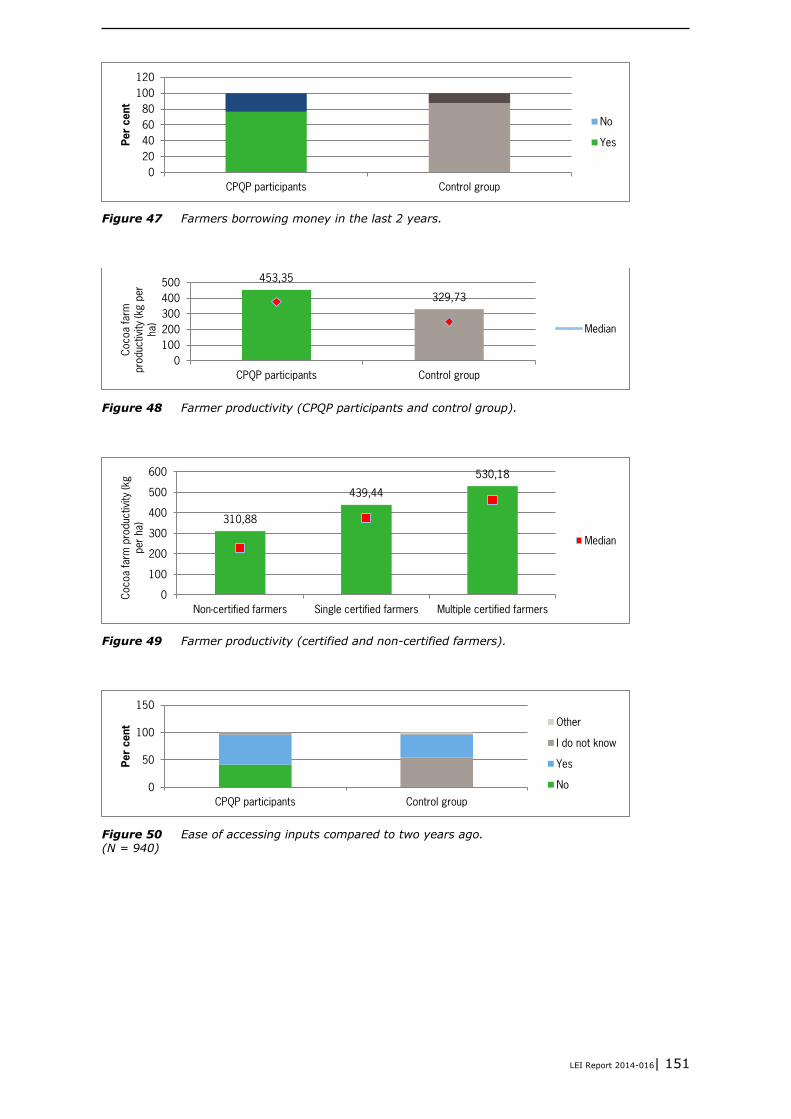
LEI Report 2014-016| 151
Figure 47 Farmers borrowing money in the last 2 years.
Figure 48 Farmer productivity (CPQP participants and control group).
Figure 49 Farmer productivity (certified and non-certified farmers).
Figure 50 Ease of accessing inputs compared to two years ago. (N = 940)
0
20
40
60
80
100
120
CPQP participants Control group
Per
cent
No
Yes
453,35
329,73
0
100
200
300
400
500
CPQP participants Control group
Cocoa farm
pro
duc
tivi
ty (kg
per
ha)
Median
310,88
439,44
530,18
0
100
200
300
400
500
600
Non-certified farmers Single certified farmers Multiple certified farmers
Cocoa farm
pro
duc
tivi
ty (kg
per
ha)
Median
0
50
100
150
CPQP participants Control group
Per
cent
Other
I do not know
Yes
No
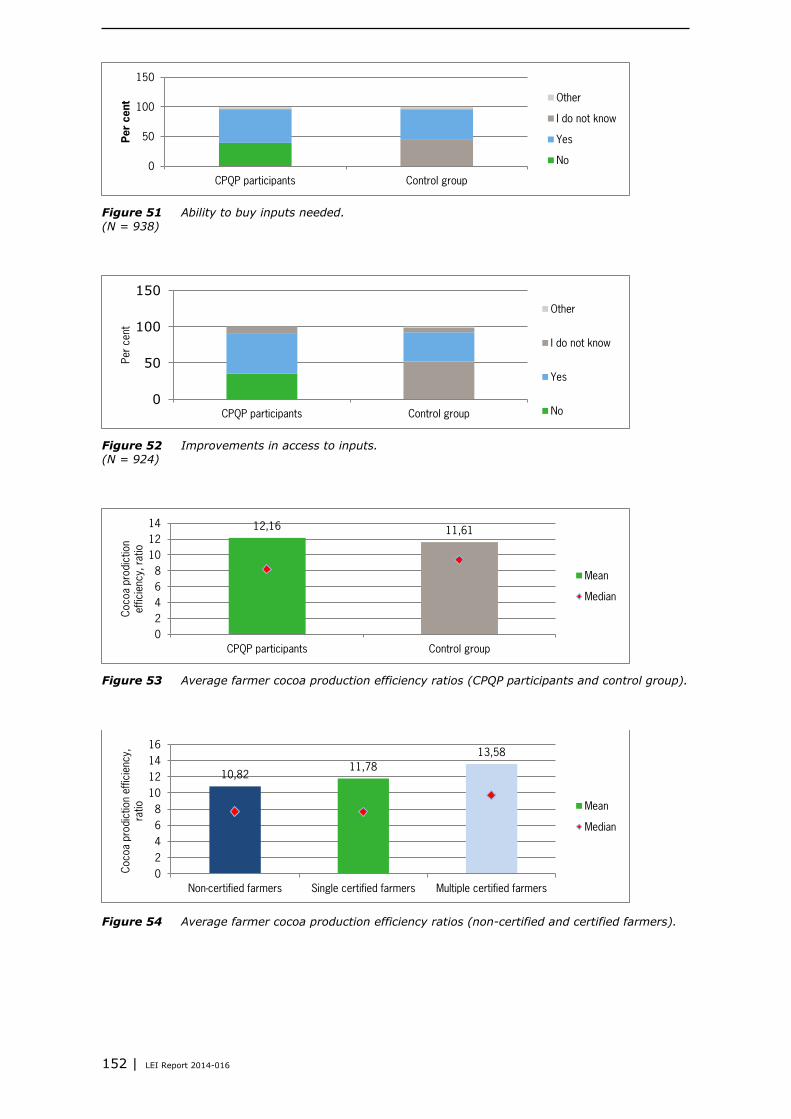
152 | LEI Report 2014-016
Figure 51 Ability to buy inputs needed.
(N = 938)
Figure 52 Improvements in access to inputs. (N = 924)
Figure 53 Average farmer cocoa production efficiency ratios (CPQP participants and control group).
Figure 54 Average farmer cocoa production efficiency ratios (non-certified and certified farmers).
0
50
100
150
CPQP participants Control group
Per
cent
Other
I do not know
Yes
No
0
50
100
150
CPQP participants Control group
Per
cent
Other
I do not know
Yes
No
12,16 11,61
0
2
4
6
8
10
12
14
CPQP participants Control group
Cocoa p
rodic
tion
effic
ienc
y, r
atio
Mean
Median
10,82 11,78
13,58
0
2
4
6
8
10
12
14
16
Non-certified farmers Single certified farmers Multiple certified farmers
Cocoa p
rodic
tion
effic
ienc
y,
ratio
Mean
Median

LEI Report 2014-016| 153
Figure 55 Average total cocoa production costs (CPQP participants and control group).
Figure 56 Average total cocoa production costs (non-certified and certified farmers).
Figure 57 Average cocoa production costs per kilogram (CPQP participants and control group).
157,275
129,625
0
20,000
40,000
60,000
80,000
100,000
120,000
140,000
160,000
180,000
CPQP participants Control group
Tota
l cocoa p
rduc
tion
cost
s (C
FAF)
Mean
Median
116,918
167,163
150,397
0
20,000
40,000
60,000
80,000
100,000
120,000
140,000
160,000
180,000
Non-certified farmers Single certified farmers Multiple certified farmers
Tota
l cocoa p
rduc
tion
cost
s (C
FAF)
Mean
Median
176,96
460,44
0
50
100
150
200
250
300
350
400
450
500
CPQP participants Control group
Tota
l pro
duc
tion
cost
per
kg
(CFA
F)
Mean
Median

154 | LEI Report 2014-016
Figure 58 Average cocoa production costs per kilogram (certified farmers).
Figure 59 Average net income from cocoa (CPQP participants and control group farmers).
Figure 60 Average net income from cocoa.
442,2
201,79
107,45
0
100
200
300
400
500
Non-certified farmers Single certified farmers Multiple certified farmers
Tota
l pro
duc
tion
cost
per
kg
(CFA
F)
Mean
Median
1,461,073 1,667,281
0
500,000
1,000,000
1,500,000
2,000,000
CPQP participants Control group
Net
incom
e fro
m c
ocoa
(main
farm
, C
FAF)
Mean
Median
1,239,098
1,520,312 1,602,950
0
200,000
400,000
600,000
800,000
1,000,000
1,200,000
1,400,000
1,600,000
1,800,000
Non-certified farmers Single certified farmers Multiple certified farmers
Net
incom
e fro
m c
ocoa (m
ain
farm
, C
FAF)
Mean
Median

LEI Report 2014-016| 155
Figure 61 Percentage of farmers with other income sources (multiple responses possible).
Figure 62 Average gross income from other sources (CFAF).
Figure 63 Average gross household income.
0%
5%
10%
15%
20%
25%
CPQP participants
Control group
0
500,000
1,000,000
1,500,000
2,000,000
2,500,000
3,000,000
CPQP participants (mean)
CPQP participants (median)
Control group (mean)
Control group (median)
2,345,894 2,174,637
0
500,000
1,000,000
1,500,000
2,000,000
2,500,000
CPQP participants Control group
Gro
ss h
ous
eho
ld in
com
e
(CFA
F)
Mean
Median

156 | LEI Report 2014-016
Figure 64 Average gross household income.
Figure 65 Farmers uses of cocoa income. (max N is 937 multiple response possible)
Figure 66 Percentage of farmers sharing benefits with other parties. (N = 844)
Figure 67 Farmers wish for their children to continue cocoa farming.
1,716,771
2,636,739
2,157,654
0
500,000
1,000,000
1,500,000
2,000,000
2,500,000
3,000,000
Non-certified farmers Single certified farmers Multiple certified farmers
Gro
ss h
ous
eho
ld in
com
e
(CFA
F)
Mean
Median
0%
10%
20%
30%
40%
50%
60%
70%
80%
90%
100%
Per
cent
CPQP participants
Control group
0%
10%
20%
30%
40%
50%
60%
70%
80%
90%
None Family Manager Labourers
Per
cent
CPQP participants
Control group
67% 64%
0%
20%
40%
60%
80%
CPQP participants Control group
No
Yes

LEI Report 2014-016| 157
Figure 68 Farmers expectation of continuing in cocoa farming.
Figure 69 Farmer’s perceptions of agricultural practices which protect the environment.
Figure 70 Farmers’ knowledge and implementation levels on water conservation measures.
Farmers knowledge levels Farmers implementation levels
Figure 71 Farmers’ knowledge and implementation levels of soil conservation measures.
24% 32%
76% 68%
0%
20%
40%
60%
80%
100%
120%
CPQP participants Control group
Yes
No
3
3
1
3
8
7
3
1
0 1 2 3 4 5 6 7 8 9
do not spray to cocoa plants next to water flow
bury cocoa waste in a hole
do not spray on vegetation
weeding every quarter
spraying only 2 ou 3 times per year
bury the empty bottles
remove loranthus
pruning
0,27
0,24
0,22
0,23
0,24
0,25
0,26
0,27
0,28
CPQP participants Control group
0,2
0,22
0,19
0,2
0,21
0,22
0,23
CPQP participants Control group
0,17
0,15
0,14
0,15
0,16
0,17
0,18
CPQP participants Control group
0,18 0,19
0
0,05
0,1
0,15
0,2
CPQP participants Control group
Farmers knowledge levels Farmers implementation levels

158 | LEI Report 2014-016
Figure 72 Farmers’ implementation levels of biodiversity conservation practices.
Figure 73 Farmers’ implementation levels of waste management practices.
Figure 74 Land use prior to cocoa farming. (N = 953 due to multiple responses)
Figure 75 Traders buying from producer groups according to members (2010-2011-2012).
0,17
0,13
0
0,05
0,1
0,15
0,2
CPQP participants Control group
0,12 0,12
0
0,1
0,2
CPQP participants Control group
0%
10%
20%
30%
40%
50%
60%
70%
Primary forest Secondaryforest
Fallow Other cultures Others
Per
cent
CPQP participants
Control group
0
5
10
15
20
25
30
35
40
45
Carg
ill
Arm
ajaro
Barr
y C
alle
baut
Natr
a
Zam
acom
Ola
m
CocafIv
oire(N
oble
)
AD
M
Lud
wig
Cem
oi
Nest
le
Mars
Hedw
ig
GG
T
Tout
on
Oth
ers
I do n
ot
know
Pis
teur
Per
cent
2010
2011
2012

LEI Report 2014-016| 159
Figure 76 Reasons why producer organisations sell to specific traders.
(Note: multiple responses possible)
Figure 77 Advantages for producer groups of participating in a certification programme.
Figure 78 Farmers’ changes in access to inputs and services since the start of certification.
05
101520253035404550
Price provide creditprovide inputs(free/oncredit)
Providetraining
Offer otherservices
I do not know Other reasons
Perc
ent
of
farm
er
resp
ondents
17%
17%
14% 7%
17%
17%
11%
Premium
training to producers
reduction of costs of inputs (distribution of phytoproducts)
distribution of vehicles
better cocoa fields
higher production
self financing of coop
0 1 2 3
School/magazine construction
prefinance
material/phyto products
training
act as intermediary/warrant to obtain credit
Periodic visit/ICS to monitor services
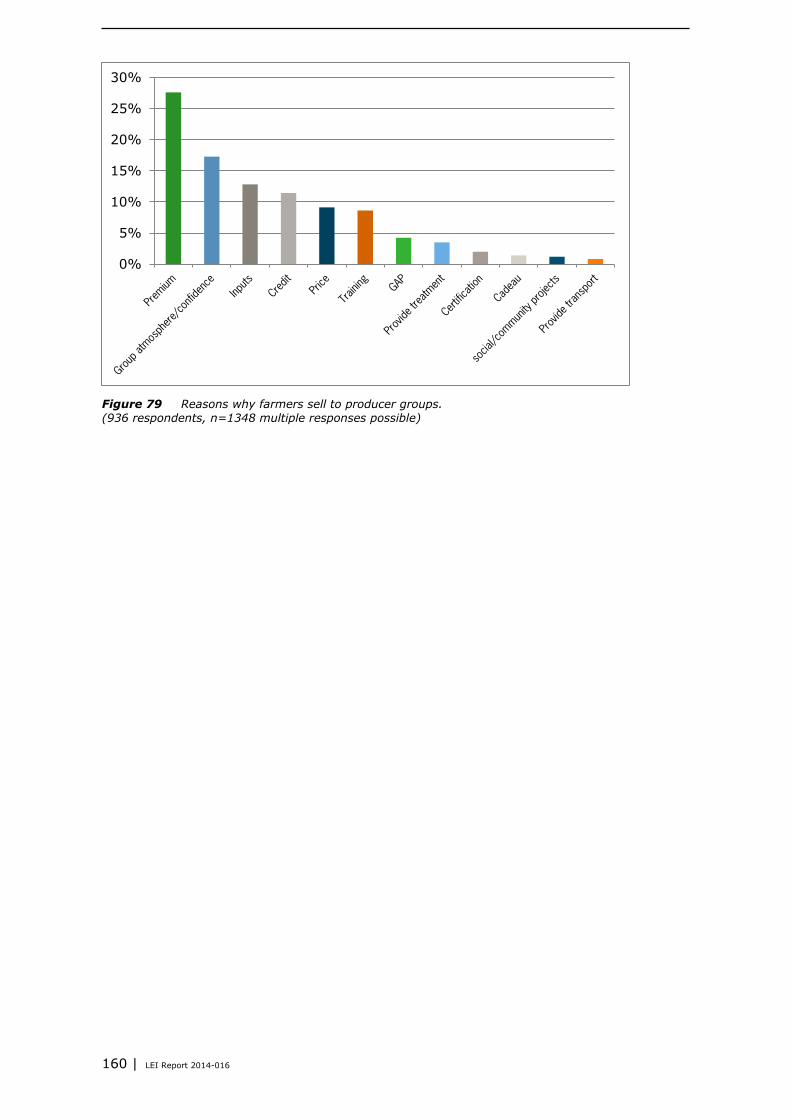
160 | LEI Report 2014-016
Figure 79 Reasons why farmers sell to producer groups.
(936 respondents, n=1348 multiple responses possible)
0%
5%
10%
15%
20%
25%
30%

LEI Report 2014-016| 161
Table 17
Farmers’ knowledge and implementation scores.
Question
number (farmer
questionnaire)
Level of GAP knowledge UTZ programme
participants
Control group Total
101 Production and practice :: weeding 4% 12% 6%
105 Production and practice :: record keeping 11% 7% 10%
103 Production and practice :: soil conservation 16% 12% 15%
104 Production and practice :: fertiliser use 17% 17% 17%
106 Production and practice :: filed buffer zone 19% 18% 19%
100 Production and practice :: crop protection products 21% 15% 20%
102 Production and practice ; pruning 30% 22% 28%
110 Production and practice: bean quality 31% 25% 30%
108 Personal protective equipment PPP 33% 26% 31%
107 Production and practice ; agro chemical use 34% 31% 33%
111 Child labour 35% 28% 33%
109 Production and practice ; cocoa production 39% 34% 38%
Levels of implementation UTZ programme
participants
Control
group
Total
93 Waste management 3% 5% 4%
89 Waste management 5% 4% 5%
76 Production and practice; black pod 6% 3% 5%
73 Production and practice :: inputs 8% 13% 9%
69 Productivity 10% 5% 9%
81 Production and practice shade trees 11% 9% 11%
72 Production and practice; pruning 18% 19% 18%
91 Waste 19% 38% 23%
86 Soil & water management 20% 15% 19%
87 Soil water management 22% 13% 20%
75 Input use 23% 15% 21%
83 Production and practice shade trees 23% 16% 21%
88 Waste management 27% 27% 27%
92 PPP 27% 22% 26%
80 Production and practice ; drying 28% 34% 29%
74 Input use 30% 27% 30%
79 Production and practice fermentation 38% 30% 36%
78 Production and practice fermentation 41% 38% 41%
71 Production and practice weeding 42% 47% 43%
90 Waste management 42% 38% 41%
77 Production and practice ; harvesting pods 61% 63% 61%
Key 0% =low 100% = correct & high.

162 | LEI Report 2014-016
Figure 80 Significant correlations between knowledge levels and implementation of GAPs &
participation in UTZ Certification programme.
Figure 81 Accidents during cocoa production activities for farmers in different phases of
participation.
Figure 82 Use of waste from cocoa production activities.
(N = 938)
negative
no
positiv
e
0
10
20
30
40
50
60
70
80
90
100
UTZ programme
participants
Control group Certified (UTZ) Non-certified(UTZ)
Per c
en
t
No
For forage
As compost
Other uses
0
20
40
60
80
100
0 years 1 year 2 years 3 years 4 years 5 years
Per
cent
No
Yes

LEI Report 2014-016| 163
Figure 83 Farmers perceptions of functioning of producer groups.
0%
10%
20%
30%
40%
50%
60%
70%
80%
I feel represented bythe officials
I think that I have aninfluence in the
nomination/electionof officials
When an official doesnot play his rolehe/she will be
replaced
When I complainabout something ,
action is undertaken
I agree
Neutral
I do not agree
I do not know

164 | LEI Report 2014-016
Regression analyses Annex 13
Regression methodology
To account for both fixed and random effects that may cause variations in knowledge and
implementation scores, multilevel mixed-effect linear regression was used in which variables such as
age, gender, and level of education were used to estimate fixed effects and explore similarities
between the different groups, also to see whether there are selection bias. A separate indicator, the
agro-ecological zone, was used to group variables to address effects that may be associated with
climate and soil type. Correlations between variables and the length of participation in the programme
were also conducted.
The stratified sampling procedure (agro-ecological zones, length of time participating in the
programme and certified/non-certified, traders. This allows similarities in some characteristics to be
taken account into the analysis. Propensity score matching (PSM) was not used as it would be
extremely difficult given the many different treatments, and would require a much larger number of
farmers to be interviewed to secure enough similar farmers for comparison (going beyond the time
and budget constraints of this study. Also, as this is largely a baseline study with indications for
impact, a PSM is not appropriate at this stage but may be possible with a subsequent impact
assessment.
Indicator Unit of measurement
Knowledge level Score 0-1
Level of implementation of GAPs Score 0-1
Productivity Kg/ha
Farm efficiency Economic input-output ratio
Quality % rejects
Net income / continue/ follower Net income, %, %
Livelihood Satisfaction level
Labour rights Compliance with Code of Conduct
Child labour (knowledge) Knowledge score
Healthy and safe living and working conditions Scores knowledge and implementation of practices
Maintained & improved quality of water and soil Scores knowledge and implementation of practices
Effective waste management & reduction (cocoa production
related)
Scores knowledge and implementation of practices
Protection restoration of natural habitats/biodiversity Scores knowledge and implementation of practices
Inclusive programme NONE
Stable producer groups providing better and reliable
services
Satisfaction level with services
Sustainable practises rewarded by the market Price premium
Regressions conducted
Explanatory variables taken into account in regression analysis:
1. age of the farmer
2. household size
3. farm ownership (creator, heir, manager, other)
4. knowledge score
5. score for implementation of practices
6. agro-ecological zone
7. duration of UTZ programme participation
8. whether farmers are UTZ Certified or not
9. whether farmers are RA certified or not
10. whether farmers are Fairtrade certified or not
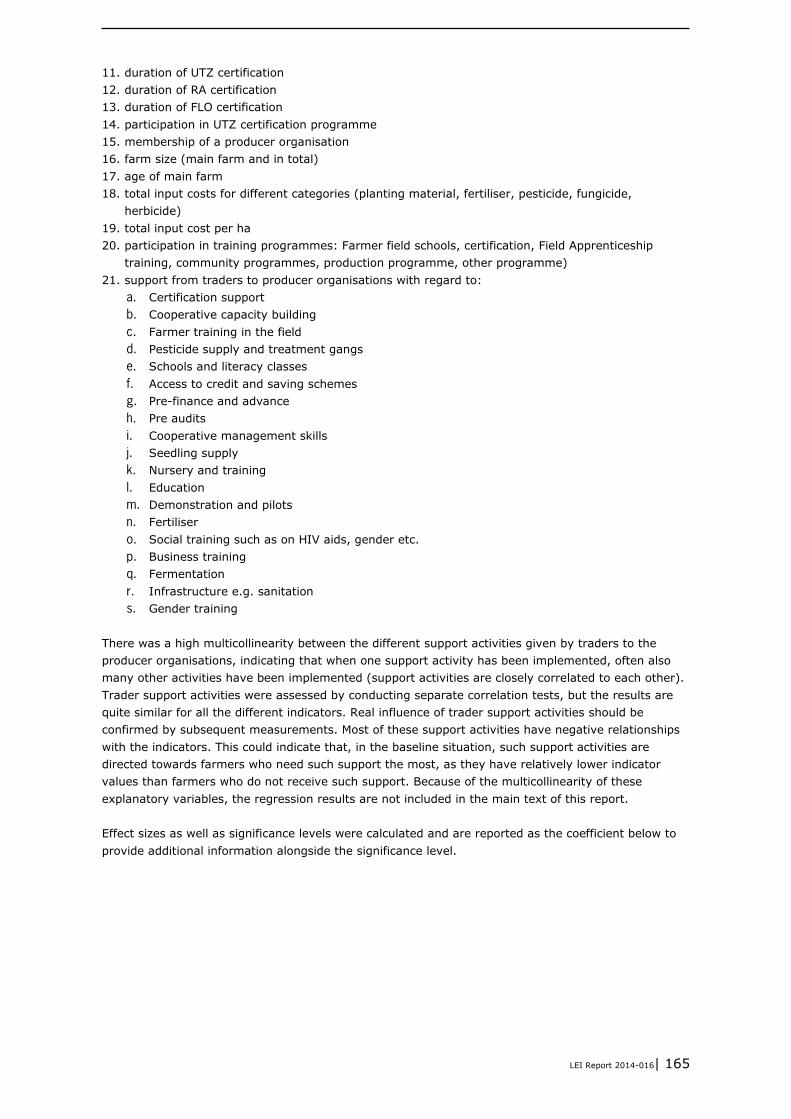
LEI Report 2014-016| 165
11. duration of UTZ certification
12. duration of RA certification
13. duration of FLO certification
14. participation in UTZ certification programme
15. membership of a producer organisation
16. farm size (main farm and in total)
17. age of main farm
18. total input costs for different categories (planting material, fertiliser, pesticide, fungicide,
herbicide)
19. total input cost per ha
20. participation in training programmes: Farmer field schools, certification, Field Apprenticeship
training, community programmes, production programme, other programme)
21. support from traders to producer organisations with regard to:
a. Certification support
b. Cooperative capacity building
c. Farmer training in the field
d. Pesticide supply and treatment gangs
e. Schools and literacy classes
f. Access to credit and saving schemes
g. Pre-finance and advance
h. Pre audits
i. Cooperative management skills
j. Seedling supply
k. Nursery and training
l. Education
m. Demonstration and pilots
n. Fertiliser
o. Social training such as on HIV aids, gender etc.
p. Business training
q. Fermentation
r. Infrastructure e.g. sanitation
s. Gender training
There was a high multicollinearity between the different support activities given by traders to the
producer organisations, indicating that when one support activity has been implemented, often also
many other activities have been implemented (support activities are closely correlated to each other).
Trader support activities were assessed by conducting separate correlation tests, but the results are
quite similar for all the different indicators. Real influence of trader support activities should be
confirmed by subsequent measurements. Most of these support activities have negative relationships
with the indicators. This could indicate that, in the baseline situation, such support activities are
directed towards farmers who need such support the most, as they have relatively lower indicator
values than farmers who do not receive such support. Because of the multicollinearity of these
explanatory variables, the regression results are not included in the main text of this report.
Effect sizes as well as significance levels were calculated and are reported as the coefficient below to
provide additional information alongside the significance level.

166 | LEI Report 2014-016
Regression results28
:
Indicator Positive relationships Negative relationships
Knowledge level - Area main farm (positive, 0.004): the larger
the main farm the higher the knowledge level
(but very small effect 1 ha adds up to 0,004
higher knowledge score)
- Total area all farms (positive, 0.0015): idem
(related to above)
- UTZ Certified (positive, 0.062). UTZ Certified
farmers have higher knowledge level than
non-certified farmers (knowledge score is
0.062 higher for UTZ than for non-UTZ
Certified farmers)
- Duration of UTZ certification (positive 0.012):
the longer a farmer is certified, the higher his
knowledge score (one year extra leads to
0.012 higher knowledge score)
- RA certified (positive 0.024). RA certified
farmers have higher knowledge level than
non-certified farmers (knowledge score is
0.024 higher for RA than for non-RA certified
farmers)
- Membership of a producer group (positive
0.076). Members of a producer group have a
higher knowledge score than farmers who are
not a member.
- Agro-ecological zone (positive 0.017) Farmers
in the excellent zone have a higher knowledge
level than farmers who are not situated in the
excellent zone
- Assistance to producer organisation with
gender training
- Assistance to producer organisation with
fertilisers
- FFS participation (negative, -0.037): FFS
participants have lower knowledge level
than non-participants.
- Participation in Field Apprenticeship
training (negative, -0.027): participants
of Field Apprenticeship training have
lower knowledge level than non-
participants.
- Assistance to producer organisation with
pre-audits
- Assistance to producer organisation with
cooperative management skills
- Assistance to producer organisation with
cooperative capacity building
- Assistance to producer organisation with
pre-financing
Level of implementation
of GAPs - Knowledge (positive 0.054) the higher the
knowledge score, the higher the
implementation score
- Length of UTZ programme participation
(positive, 0.007). the longer a farmer
participates, the higher the score. Small
effect!
- Certification programme (positive 0.013):
participants of a certification programme
score better than non-participants).
- participation in other programme (positive
0.027): participants of ‘other programme’
score better than non-participants.
- UTZ certification (positive 0.021): UTZ
Certified farmers score better than non-UTZ
- UTZ programme participation (negative -
0.012). UTZ programme participants
have a lower implementation score than
the control group.
- Assistance to producer organisation with
cooperative management skills
28
Results of the regression analysis, indicating correlations between different indicators. The coefficient (0.005 e.g.)
indicates the size of the effect. Only significant effects are included based on ‘when other variables remain equal’. See
Chapter 3 on the methodology.

LEI Report 2014-016| 167
Certified farmers.
- Duration of UTZ certification (positive 0.01):
the longer a farmer is certified, the higher his
implementation score (one year extra leads to
0.01 higher knowledge score)
- Membership of a producer group (positive
0.037). Members of a producer group have a
higher implementation score than farmers
who are not a member.
- Ownership (positive 0.019). Managers have a
higher implementation score than respondents
who are not managers
- Agro-ecological zone (positive 0.007) Farmers
in the excellent zone have a higher
implementation level than farmers who are
not situated in the excellent zone
Productivity - Number of persons in household (positive
4.94): the more people in the household, the
higher the productivity
- Age of the main farm (positive 3.24): the
older the age of the main farm, the higher the
productivity, this may also be linked to
approx. 1/3 of farmers replacing old trees29.
Producer group members renewed their trees
more often than non-group members.
- RA certification (positive 118.19); RA certified
farmers have higher productivity than non-RA
certified farmers
- UTZ certification: (positive 151.93) UTZ
Certified farmers have higher productivity
than non-UTZ Certified farmers
- zone: farmers in the excellent zone have a
higher productivity than farmers who are not
situated in the excellent zone.
- Creators of the cocoa farms have a higher
productivity than other types of owners
combined.
- Producer group membership: members have a
higher productivity than farmers who are not
a member.
- Age of the farmer (negative -4.097): the
lower the age of the farmers, the higher
the productivity
- Area of the main farm (negative -12.65):
the smaller the main farm, the higher the
productivity
- Marginal zone (negative -195.49):
Farmers situated in a marginal zone,
farmers have lower productivity than
farmers who are not situated in a
marginal zone.
- Field Apprenticeship training (negative -
81.74). Participants in Field
Apprenticeship training have lower
productivity than non-participants.
- Farmers in marginal zone have a lower
productivity than farmers in other zones.
- Farmers in the good zone have a lower
productivity than farmers in other zones.
- Heirs have a lower productivity than the
other types of owners combined
- Assistance to producer organisation with
cooperative management skills
- Assistance to producer organisation with
training farmers in the field
- Assistance to producer organisation with
pesticide supply / treatment gangs
- Assistance to producer organisation with
pre-financing
- Assistance to producer organisation with
credit and savings schemes
- Assistance to producer organisation with
schools/literacy classes
Farm efficiency - Size of main farm (positive, 1.49); positive
correlation, with the larger the size of the
main farm, the higher the efficiency
- Field Apprenticeship training (negative -
3.67). Participants of Field Apprenticeship
training have lower productivity than non-
29
325 of the 944 farmers indicated renewed their trees in the last 2 years. This may be linked to training and replanting and
rejuvenation programmes by traders and government agencies.

168 | LEI Report 2014-016
- Duration of UTZ programme participation
(positive 0.967): the longer a farmer
participates in the programme the higher his
efficiency
- Size of the total farm (positive 1.11): the
larger the size of the total cocoa farm, the
higher the efficiency
- RA certification (positive 2.37): RA certified
farmers have a higher efficiency than farmers
who are not RA certified.
participants.
- Assistance to producer organisation with
pre-audits
- Assistance to producer organisation with
cooperative management skills
- Assistance to producer organisation with
training farmers in the field
- Assistance to producer organisation with
business training
- Assistance to producer organisation with
pesticide supply / treatment gangs
- Assistance to producer organisation with
pre-financing
- Assistance to producer organisation with
schools/literacy classes
- Assistance to producer organisation with
seedling supply
- Assistance to producer organisation with
infrastructure, e.g. sanitation
Net income from cocoa
production (main farm) - size of main farm: (positive 257946); the
larger the main farm, the higher the net-
income
- Implementation score: the higher the score,
the higher the net income from cocoa.
- size of total cocoa farm: (positive 195031):
the larger the size of the total cocoa farm, the
higher the net income
- productivity (positive 2363); the higher the
productivity, the higher the net income
- heirs have a higher net-income than other
types of owners combined.
- the longer a farmer is certified, the higher his
net-income is.
- age of the farmer (negative – 14800) the
older the farmer, the lower the net
income
- Field Apprenticeship training (negative -
310819): Participants of Field
Apprenticeship training have lower net
incomes than non-participants.
- Assistance to producer organisation with
pre-audits
- Assistance to producer organisation with
cooperative management skills
- Assistance to producer organisation with
pesticide supply / treatment gangs
- Assistance to producer organisation with
pre-financing
- Assistance to producer organisation with
access to credit and saving schemes
- Assistance to producer organisation with
infrastructure, e.g. sanitation
- Assistance to producer organisation with
schools/literacy classes
- Assistance to producer organisation with
seedling supply
Livelihood (score for
satisfaction level) - knowledge (positive 0.86); the higher the
knowledge score, the more a farmer is
satisfied with his livelihood
- Farmers in excellent zone: higher satisfaction
than farmers in other zones combined
- Area total (positive 0.016) the larger the size
of the total cocoa farm, the higher the
satisfaction level.
- Productivity (positive but very small effect
0.0001). the higher the productivity, the
higher the satisfaction level.
- RA (positive 0.11) RA certified farmers are
more satisfied than non-RA certified farmers
- UTZ (positive 0.45) UTZ Certified farmers are
more satisfied than non-utz certified farmers
- No. of people in household (negative,
very small effect -0.0055): the more
people in household, the lower
satisfaction with livelihood)
- Farmers in good zone: lower satisfaction
score than farmers in other zones
combined
- Certification programme (negative -0.15)
participants of certification programme
have lower satisfaction than non-
participants.
- Other programme: (negative -0.301):
participants of other programme have
lower satisfaction than non-participants.
- Assistance to producer organisation with

LEI Report 2014-016| 169
cooperative management skills
- Assistance to producer organisation with
cooperative capacity building
- Assistance to producer organisation with
nursery training
- Assistance to producer organisation with
business training
- Assistance to producer organisation with
pre-financing
- Assistance to producer organisation with
access to credit and saving schemes
- Assistance to producer organisation with
social training
- Assistance to producer organisation with
schools/literacy classes
- Assistance to producer organisation with
seedling supply
Stable producer groups
providing better and
reliable services
- knowledge level (positive 0.63) the higher the
knowledge level, the more satisfied with their
producer group. Members of producer groups
also have statistically significantly higher
knowledge levels than non-members! It is not
possible to indicate which variable influences
each other.
- participation in community programme
(positive 0.22): participants of a community
programme are more satisfied with producer
group than non-participants.
- whether farmers replanted trees (positive
0.12): farmers who replanted their trees are
more satisfied than farmers who did not. BUT:
producer group members also renewed their
trees more often than non-members! It is
unclear what influences satisfaction. Farmers
in the programme may have had better
access to trees.
- UTZ certification (positive 0.11): UTZ Certified
farmers are more satisfied with the services of
their producer group than non-certified
farmers.
- farmers in the excellent zone have higher
satisfaction levels than farmers in other zones
combined.
- Assistance to producer organisation with
pre-audits
- Assistance to producer organisation with
certification support
- Assistance to producer organisation with
cooperative management skills
- Assistance to producer organisation with
cooperative capacity building
- Assistance to producer organisation with
farmer training in the field.
- Assistance to producer organisation with
pre-financing
- Assistance to producer organisation with
access to credit and saving schemes
- Assistance to producer organisation with
fermentation
Notes
A regression does not demonstrate causal effects.

170 | LEI Report 2014-016
Farm ownership and revenue Annex 14
sharing models in Côte d’Ivoire
Six broad categories of farm ownership, responsibility and revenue sharing are found in Côte d’Ivoire:
1. Ownership (founder) (fondeur)
This implies ownership of both land and crops (i.e. cocoa, rubber, coffee, oil palm, etc.). Both
Ivorian’s and Burkinabe can own land and crops.
2. Manager (Gestionnaire)
A manager of a field(s), which generally belongs to someone in their extended family i.e. father or
mother or be managed after a parent’s death while the family sorts out inheritance. Informally the
manager receives one third of the revenue. Generally higher amount of revenue is obtained when
managed on behalf of a father than a mother, due to cultural norms of respect and tendency not
to negotiate with one’s mother.
3. Inheritance or inheritance with ownership (Héritier, propriétaire)
After division of land form inheritance, ownership is complete. Depending upon the region, women
as well as men may inherit. In the South and South West of Côte d’Ivoire women inherit more
frequently, whereas in other areas only men tend to inherit. Burkinabe women generally have no
inheritance rights. Whilst Burkinabe have purchased land in Côte d’Ivoire, generally this is
customary and they do not have officially registered land title deeds.
4. Worker with 33% revenue share (Abusan main d’oeuvre en remuneration de 33%)
Workers on productive land with no ownership rights or claims. They receive 1/3 of revenues from
the owner of the land worked, the owner keeps 2/3. The majority of workers are male. It is
estimated that only a very small proportion of women work as abusan.
5. Worker with 50% share of revenue (Abunun main d’oevre en renumeration de 50% utilisation de
terre)
Workers on productive land with no ownership rights or claims. They receive 1/2 of revenues from
the owner of the land worked, the owner receives 50%. If the land is ‘’bad fields’’ abunun works
with 50% of revenues and abunun also with 50%.
6. Under guarantee (Prise en garantie – garantie)
This is an arrangement either between two farmers, between farmer and buyer or between farmer
and somebody with financial resources, where the land and crop is used as a guarantee for a loan.
The person who has received the farm as guarantee may use abusan workers to farm the land.
Income from the land and crop is the property of the person who has the land in guarantee. Land
under guarantee can become the property of the lender in the case of a long-term loan and when
an agreement is reached between the two parties. It is also possible that the owner works in the
field and has no abusan.
Classified forest (foret classée)
Classified forest is the property of the state and if cocoa is farmed in classified forest it is effectively
illegal. In some cases is hoped that in time the state will declassify and the farmer becomes the
owner.

LEI Report 2014-016| 171
Overview of certification and Annex 15
activities in the cocoa sector in
Côte d’Ivoire
Table 18
Overview of certification and activities in the cocoa sector in Côte d’Ivoire 2008 to 2013.
Main implementing
organisation(s)
Project, programme or activities
International organisation’s
World Cocoa Foundation (WCF) Livelihood programme
Cocoa Link30
WCF Empowering Cocoa Households with Opportunities and Education Solutions
(ECHOES)
WCF African Cocoa Initiative (WCF/ACI) is a public-private partnership, bringing
together WCF, cocoa industry members, the Sustainable Trade Initiative (IDH) and
U.S. Agency for International Development through its Global Development Alliance
Certification Capacity Enhancement (CCE) project African Cocoa Initiative (ACI)
African Cocoa Initiative (ACI)
International Cocoa Organisation
(ICCO)
Capacity Building Programme on Pesticides Residues and other
Harmful Substances in Cocoa in Africa
Cocoa productivity and quality improvement: a participatory approach
Analysis of the value chain in cocoa producing countries
Cocoa germplasm utilisation and conservation: a global approach
Improvement of cocoa marketing and trade in liberalising cocoa producing countries
Supply chain management for total quality cocoa: pilot phase
Pilot Project on Price risk management for cocoa farmers
Preventing and managing the spread of cocoa pests and pathogens: lessons from the
witches' broom disease
Capacity building programme on pesticide residues and other harmful substances in
cocoa in Africa
Cocoa of Excellence: promoting diverse high quality cocoa origins
SPS capacity building in Africa to mitigate the harmful effects of pesticide residues in
cocoa and to maintain market access
United Nations Development Fund
(UNDP)
Green Commodities Facility, Côte D´Ivoire Sustainable Cocoa Initiative NORAD,
World Cocoa Foundation (WCF), International Cocoa Initiative (ICI), Echoes – Youth
Education and Livelihoods Programme, UNDP and the Associations of Chocolate
Manufacturers from Denmark, Finland, Norway and Sweden
USAID Towards Child Labour Free Cocoa Growing Communities in Côte d'Ivoire and. Ghana
through an Integrated Area Based Approach
ILO International Cocoa Initiative
German Technical Cooperation
(GIZ)
PRODEMIR – Programme de Développement Economique en Milieu Rural
GIZ, USAID, ANADER, STCP, Kraft,
Armajaro
Market-oriented promotion of certified sustainable cocoa production Côte d‘Ivoire
(2005-2009)
Certification schemes
UTZ + Solidaridad Certification
With private sector partnerships and NGOs
RA + GIZ
Fairtrade + Agro Eco Louis Bolk
Institute & Rabobank, the Dutch
structure Control Union for organic
certification and FAIR TRADE
Organic + Agro Eco Louis Bolk
Institute
Private sector
Cargill, ADM, Barry Callebaut,
Armajaro-CI, Outspan, Ecom,
CEMOI & farmers
Corporate programmes with consultants, cabinets, ANADER
Olam International and Blommer Alliance between cocoa farmers in Côte d’Ivoire, Olam International and Blommer
30
http://www.nestlecocoaplan.com/nestle-joins-cocoalink-in-the-cote-divoire/

172 | LEI Report 2014-016
Main implementing
organisation(s)
Project, programme or activities
Chocolate& farmers Chocolate
Mondelez (Cadbury), Conseil du
Café Cacao (CCC), CARE farmers
Cocoa Life programme to help farmers increase sustainable cocoa production and
create thriving communities
Nestlé & farmers Cocoa Plan, Action plan responsible sourcing
CNRA under the initiative of creating added value
Kraft Foods and Hans Neumann
Stiftung& farmers
Sustainability alliance with Rainforest Alliance
Market Oriented Promotion of Certified Sustainable Cocoa
Mars& farmers Sustainable Cocoa Initiative (Cocoa Development Centers (CDC) and Cocoa Village
Clinics (CVC): rehabilitation of old and aging farms with good planting material, soil
fertility management, solid agricultural practices including pest and disease control
IMPACT project with Government of CI, ICI, AIECA, AFRICARE, SOCODEVi, STCP,
RAINFOREST ALLIANCE, IFESH, INADES, BFCD
ADM, Barry Callebaut, Cargill,
Ferrero, The Hershey Company,
Kraft Foods, Mars Incorporated,
and Nestlé& farmers
Framework of Action: Harkin-Engel Protocol (Responsible cocoa) and industry
partnership and Public Certification: development of a public certification process.
National Confectioners Association,
CAOBISCO, ECA& farmers
Regional Trade Associations and their memberships
Partnerships
Sustainable Trade Initiative (IDH) &
private sector partners
Cocoa Improvement Programme 1 (CIP1) & CPQP
BlommerLOMMER, Petra Foods /
Delfi brand, CEMOI and Mars
2012 Memorandum of Understanding confirming their commitment to sustainable
cocoa farming in Côte d’Ivoire combining 209 PACTS (Processor Alliance for Cocoa
Traceability and Sustainability) and MARS, Vision For Change via Cocoa Development
Centres and PACTS Centres.
Signatories include governments
and representatives of the cocoa
industry and witnesses include
social activists, NGOs and labour
unions
International Cocoa Initiative (ICI) to eliminate the worst forms of child labour and
forced labour and the Harkin Engel Protocol
Mars Incorporated, Hershey
Company, Kraft Foods and
Armajaro Trading
Agriculture Development Programme (CAADP)
Institut Européen de Coopération et
Développement lECD/Cargill/M AH,
Dutch Ministry of Agriculture,
ANADER IECD, PEFACI; Ministry of
Agriculture, Department of Animal
Production, Ministry of Education,
Plate-forme des Ecoles Familiales
Agricoles de Côte d'Ivoire (PEFACI)
Projet Ecoles Familiales Agricoles (EFA)
Research
International Institute for tropical
Agriculture (IITA) + USAID,
Primature, MINAGRI, CGFCC,
FIRCA, GEPEX, ANADER, CNRA
ONG, BFCG, INADES, SOCODEVI,
Rainforest Alliance, BFCD; GTZ,
Technoserve
STCP (Sustainable Tree Crop Programme)
CIRAD & CEMOI Creation of the cocoa centre of fermentation and sun drying
ICRAF (World Agroforestry Center) Vision for change Farmer training programme
Tulson Payson Center Annual Survey of Child Labor in the Cocoa-Growing Areas of Côte d'Ivoire and
Ghana.
FAFO
Research Programme on Trafficking and Child Labour. Child labour and cocoa
production in West Africa
Côte d’Ivoire Sustainable Cocoa Initiative (CISCI)
Government Côte d’Ivoire
Côte d'Ivoire Exportation
Professional Association (APEXCI),
Cocoa & Coffee Interprofessional
Board (CICC), Raw Materials
Interministerial Board (CIMP),
CAISTAB
Implements National Development Plan and regulate all activities of coffee-cocoa
sectors
Ministry of Agriculture (MINAGRI) Fonds Interprofessionnel pour la Recherche et le Conseil Agricole (FIRCA)
Cocoa and coffee management
Council/
Conseil du Café Cacao (CCC)
Côte d’Ivoire quality cocoa control programme
National Programme of Fight against disease of the Cocoa Swollen Shoot
Centre National de Recherche
Agronomique (CNRA)
National agricultural centre conducting agronomical research
SOCODEVI, ANADER; NGOs;
producer groups
Mutual and cooperative partnership programme (PPCM)
National Agency for Rural
Development (ANADER)
Extension services, promotion of farmer’s skills and entrepreneurship by designing
and implementing appropriate tools and conducting agricultural extension services.

LEI Report 2014-016| 173
Main implementing
organisation(s)
Project, programme or activities
Fight against disease Swollen Shoot (Pilot Project)
Project certified sustainable cocoa production
Information Programme on the
Cocoa and Coffee Markets
(PRIMAC).
Programme for the intensification of local processing 50% of the overall cocoa
production in the year 2005, etc.
Ministry of Agriculture (MINAGRI) Master Plan for Agricultural Development 1992-2015 (PDDA)
Comité de gestion de la filière Café
Cacao (CGFCC)
Cocoa-related institutions
Government, Ministry of Agriculture
(MINAGRI)
Member of COPAL (Alliance of Cocoa Producing Countries) COPAL activities
NGOs
Oxfam Behind the Brands - Cocoa Case Studies
World Vision Anti-Child labour campaigns
Solidaridad Cocoa Improvement Program

174 | LEI Report 2014-016
Photos Annex 16
Photo 4 A cocoa (Theobroma cacao) pod and beans.
Photo 5 Members of the WUR and A & CV research team, Soubré, November 2012.

LEI Report 2014-016| 175
Photo 6 Data collection: interview using the producer questionnaire.
Photo 7 Multiple partnership activities at CAYAWA, an UTZ Certified producer group.

176 | LEI Report 2014-016
Photo 8 ANADER training at COOPAGNY cooperative.
Photo 9 Multiple certification.

177 | LEI Report XXXX
Photo 10 Inclusive practices; a lead farmer passing on training at the cooperative (COOPAGNY).
Photo 11 Influencing factors; multiple projects.

178 | LEI Report 2014-016
Photo 12 Influencing factors; proximity and ease of accessing markets.
Photo 13 A female cocoa farmer.

LEI Report 2014-016 | 179
Photo 14 Implementation of GAP: A waste pit.
Photo 15 Knowledge about GAP, at producer group level.

180 | LEI Report 2014-016
Photo 16 Implementation of GAP: shade trees.
Photo 17 Good agricultural practices enshrined in the Code of Conduct.
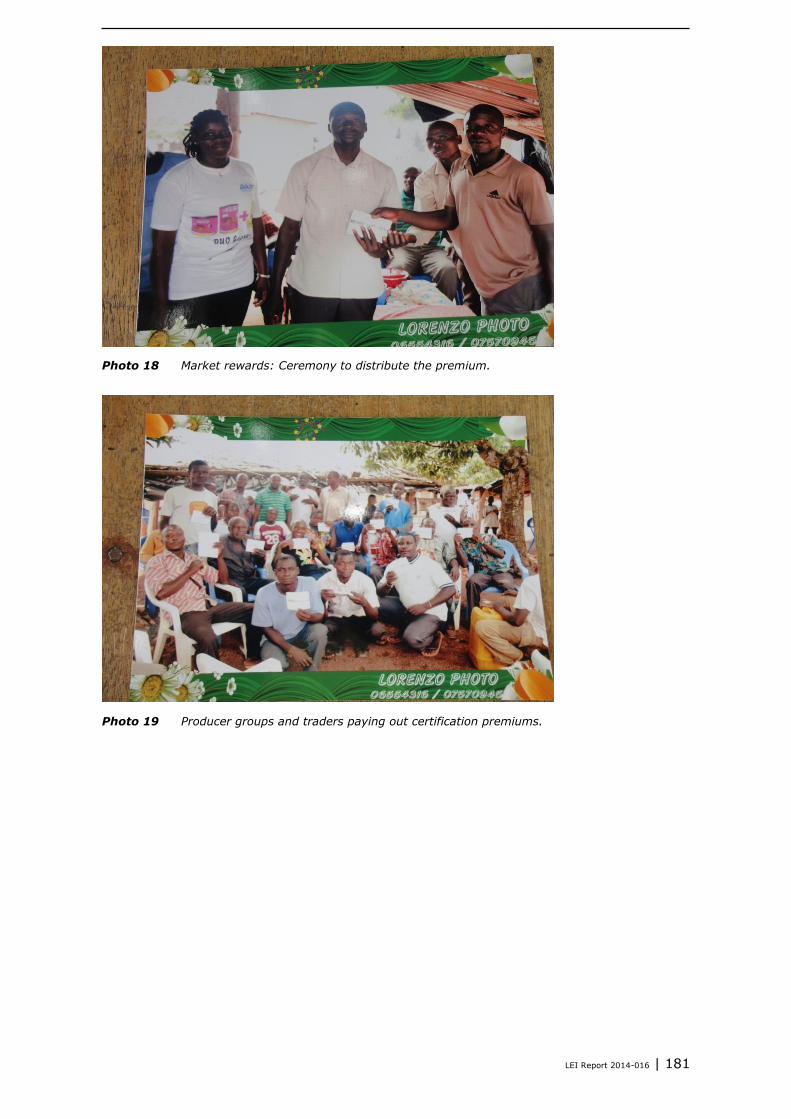
LEI Report 2014-016 | 181
Photo 18 Market rewards: Ceremony to distribute the premium.
Photo 19 Producer groups and traders paying out certification premiums.

182 | LEI Report 2014-016
Photo 20 Producer group services: Careja cooperative nursery.
Photo 21 Producer group services: School financed by Coopaga cooperative from UTZ premiums.

LEI Report 2014-016 | 183
Photo 22 Child labour: Prohibited activities at CEPO cooperative.
Photo 23 Healthy and safe working conditions: COOPAGA cooperative health centre.
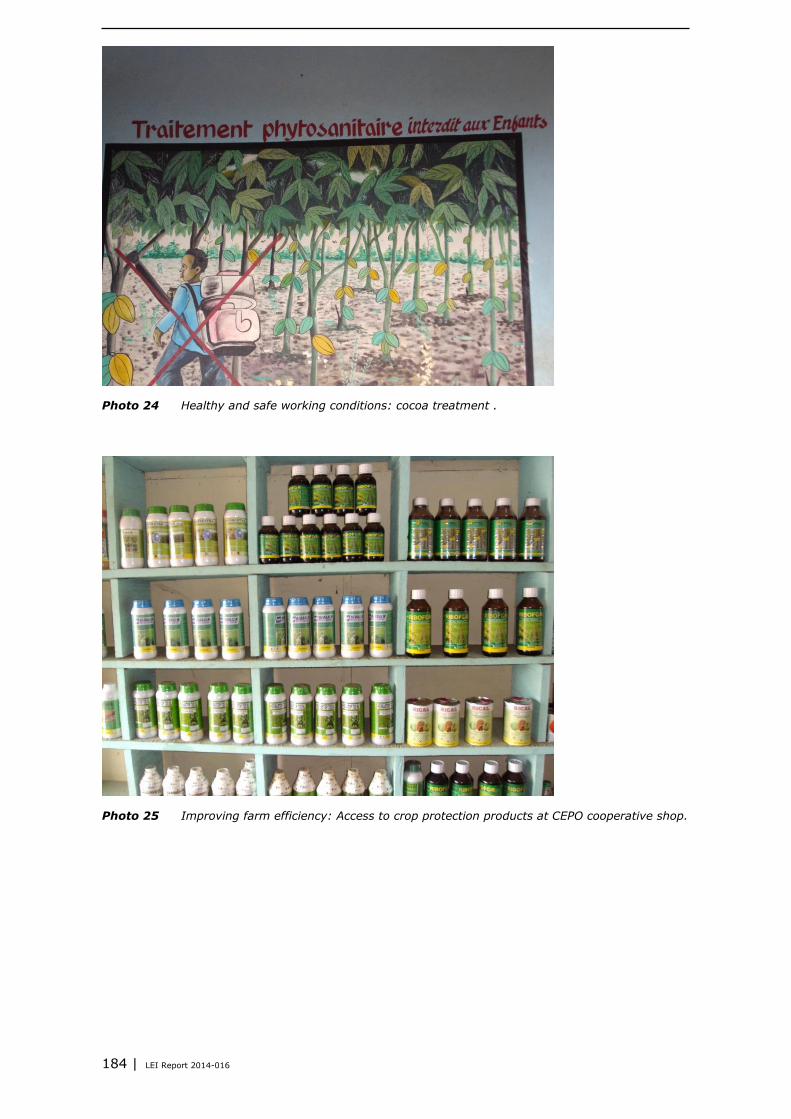
184 | LEI Report 2014-016
Photo 24 Healthy and safe working conditions: cocoa treatment .
Photo 25 Improving farm efficiency: Access to crop protection products at CEPO cooperative shop.

LEI Report 2014-016 | 185
Photo 26 Quality: Drying beans.
Photo 27 Profitability; making the balance.

186 | LEI Report 2014-016
Photo 28 Access to markets: COOPAGNIPI cooperative truck.
Photo 29 Maintaining soil quality: COOPAGANY fertiliser shop.
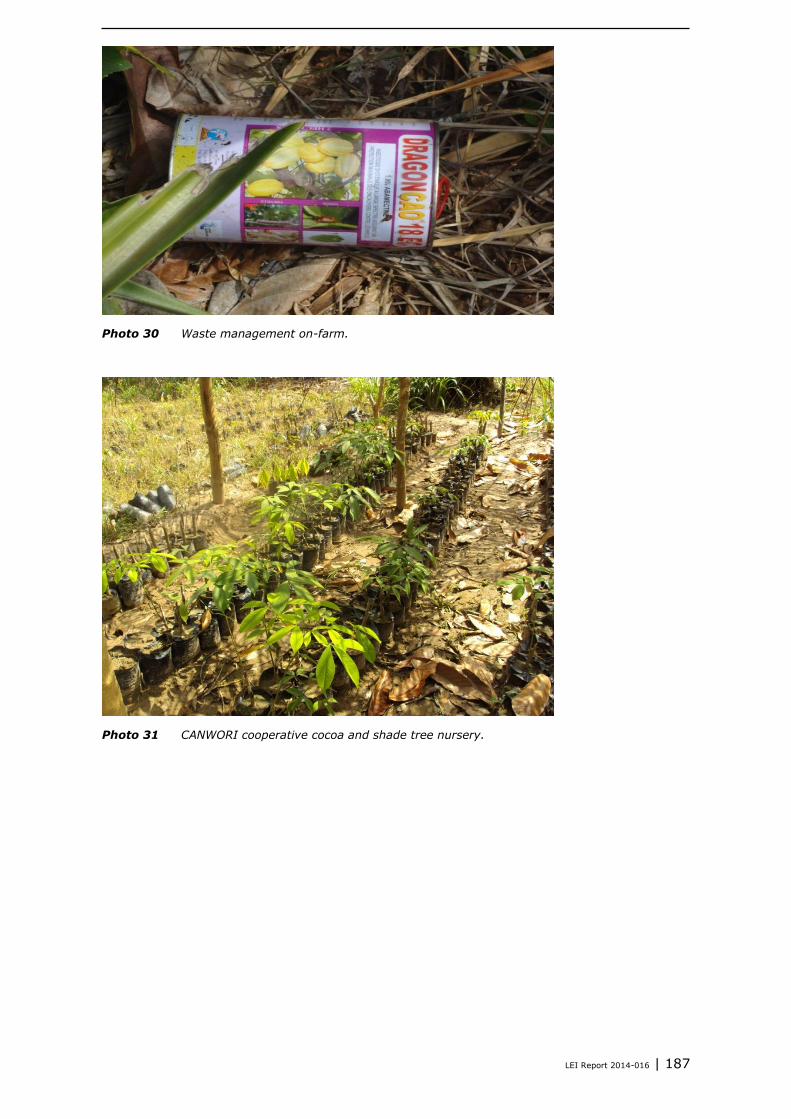
LEI Report 2014-016 | 187
Photo 30 Waste management on-farm.
Photo 31 CANWORI cooperative cocoa and shade tree nursery.

188 | LEI Report 2014-016
Photo 32 Workers at COOPAGRO cooperative.
Photo 33 Cocoa pods.

LEI Report 2014-016 | 189

LEI Wageningen UR
P.O. Box 29703
2502 LS Den Haag
The Netherlands
T +31 (0)70 335 83 30
www.wageningenUR.nl/en/lei
LEI Report 2014-016
LEI Wageningen UR carries out socio-economic research and is the strategic
partner for governments and the business community in the field of
sustainable economic development within the domain of food and the living
environment. LEI is part of Wageningen UR (University and Research centre),
forming the Social Sciences Group together with the Department of Social
Sciences and Wageningen UR Centre for Development Innovation.
The mission of Wageningen UR (University & Research centre) is ‘To explore
the potential of nature to improve the quality of life’. Within Wageningen UR,
nine specialised research institutes of the DLO Foundation have joined forces
with Wageningen University to help answer the most important questions in
the domain of healthy food and living environment. With approximately 30
locations, 6,000 members of staff and 9,000 students, Wageningen UR is one
of the leading organisations in its domain worldwide. The integral approach
to problems and the cooperation between the various disciplines are at the
heart of the unique Wageningen Approach.

LEI Wageningen UR carries out socio-economic research and is the strategic partner for governments and the business community in the field of sustainable economic development within the domain of food and the living environment. LEI is part of Wageningen UR (University and Research centre), forming the Social Sciences Group together with the Department of Social Sciences and Wageningen UR Centre for Development Innovation.
The mission of Wageningen UR (University & Research centre) is ‘To explore the potential of nature to improve the quality of life’. Within Wageningen UR, nine specialised research institutes of the DLO Foundation have joined forces with Wageningen University to help answer the most important questions in the domain of healthy food and living environment. With approximately 30 locations, 6,000 members of staff and 9,000 students, Wageningen UR is one of the leading organisations in its domain worldwide. The integral approach to problems and the cooperation between the various disciplines are at the heart of the unique Wageningen Approach.
Verina Ingram, Yuca Waarts, Lan Ge, Simone van Vugt, Lucia Wegner, Linda Puister-Jansen, Francois Ruf and Roger Tanoh
Impact assessment framework and baseline
The IDH Cocoa Productivity and Quality Programme (CPQP) in Côte d’Ivoire
LEI Wageningen URP.O. Box 297032502 LS Den HaagThe NetherlandsE [email protected]/lei
LEI Report 2014-016ISBN 978 90 8615 679