Brewing and Craft Beer - MDPI
142
Brewing and Craſt Beer Luis F. Guido www.mdpi.com/journal/beverages Edited by Printed Edition of the Special Issue Published in Beverages beverages
-
Upload
khangminh22 -
Category
Documents
-
view
6 -
download
0
Transcript of Brewing and Craft Beer - MDPI
Brewing and Craft Beer
Luis F. Guido
www.mdpi.com/journal/beverages
Edited by
Printed Edition of the Special Issue Published in Beverages
beverages

Brewing and Craft Beer


Brewing and Craft Beer
Special Issue Editor
Luıs Ferreira Guido
MDPI • Basel • Beijing • Wuhan • Barcelona • Belgrade
Special Issue Editor
Luıs Ferreira Guido
University of Porto
Portugal
Editorial Office
MDPI
St. Alban-Anlage 66
4052 Basel, Switzerland
This is a reprint of articles from the Special Issue published online in the open access journal Beverages
(ISSN 2306-5710) from 2018 to 2019 (available at: https://www.mdpi.com/journal/beverages/
special issues/Craft Beer)
For citation purposes, cite each article independently as indicated on the article page online and as
indicated below:
LastName, A.A.; LastName, B.B.; LastName, C.C. Article Title. Journal Name Year, Article Number,
Page Range.
ISBN 978-3-03921-489-1 (Pbk)
ISBN 978-3-03921-490-7 (PDF)
c© 2019 by the authors. Articles in this book are Open Access and distributed under the Creative
Commons Attribution (CC BY) license, which allows users to download, copy and build upon
published articles, as long as the author and publisher are properly credited, which ensures maximum
dissemination and a wider impact of our publications.
The book as a whole is distributed by MDPI under the terms and conditions of the Creative Commons
license CC BY-NC-ND.
Contents
About the Special Issue Editor . . . . . . . . . . . . . . . . . . . . . . . . . . . . . . . . . . . . . . vii
Preface to ”Brewing and Craft Beer” . . . . . . . . . . . . . . . . . . . . . . . . . . . . . . . . . . . ix
Luis F. Guido
Brewing and Craft BeerReprinted from: beverages 2019, 5, 51, doi:10.3390/beverages5030051 . . . . . . . . . . . . . . . . . 1
Steven R. Miller, J. Robert Sirrine, Ashley McFarland, Philip H. Howard and Trey Malone
Craft Beer as a Means of Economic Development: An Economic Impact Analysis of theMichigan Value ChainReprinted from: beverages 2019, 5, 35, doi:10.3390/beverages5020035 . . . . . . . . . . . . . . . . . 3
Fali Mbeh. Harry, Desobgo Zangue Steve Carly and Nso Emmanuel Jong
Sorghum Coffee–Lactose Stout Production and Its Physico-Chemical CharacterizationReprinted from: beverages 2019, 5, 20, doi:10.3390/beverages5010020 . . . . . . . . . . . . . . . . . 16
Carmelita da Costa Jardim, Daiana de Souza, Isabel Cristina Kasper Machado, Laura Massochin Nunes Pinto, Renata Cristina de Souza Ramos and Juliano Garavaglia
Sensory Profile, Consumer Preference and Chemical Composition of Craft Beers from BrazilReprinted from: beverages 2018, 4, 106, doi:10.3390/beverages4040106 . . . . . . . . . . . . . . . . 37
Felipe Pereira de Moura and Thiago Rocha dos Santos Mathias
A Comparative Study of Dry and Wet Milling of Barley Malt and Its Influence on Granulometryand Wort CompositionReprinted from: beverages 2018, 4, 51, doi:10.3390/beverages4030051 . . . . . . . . . . . . . . . . . 49
Jasmina Lukinac, Kristina Mastanjevic, Kresimir Mastanjevic, Gjore Nakov and Marko Jukic
Computer Vision Method in Beer Quality Evaluation—A ReviewReprinted from: beverages 2019, 5, 38, doi:10.3390/beverages5020038 . . . . . . . . . . . . . . . . . 57
Claudia Gonzalez Viejo, Damir D. Torrico, Frank R. Dunshea and Sigfredo Fuentes
Development of Artificial Neural Network Models to Assess Beer Acceptability Based onSensory Properties Using a Robotic Pourer: A Comparative Model Approach to Achieve anArtificial Intelligence SystemReprinted from: beverages 2019, 5, 33, doi:10.3390/beverages5020033 . . . . . . . . . . . . . . . . . 78
Claudia Gonzalez Viejo, Sigfredo Fuentes, Damir D. Torrico, Mei Huii Lee, Yue Qin Hu,
Sanjit Chakraborty and Frank R. Dunshea
The Effect of Soundwaves on Foamability Properties and Sensory of Beers with a MachineLearning Modeling ApproachReprinted from: beverages 2018, 4, 53, doi:10.3390/beverages4030053 . . . . . . . . . . . . . . . . . 88
Deepak Kumar, Anna-Sophie Hager, Alberto Sun, Winok Debyser, Bruno Javier Guagliano
and Vijay Singh
Improving Fermentation Rate during Use of Corn Grits in Beverage Alcohol ProductionReprinted from: beverages 2019, 5, 5, doi:10.3390/beverages5010005 . . . . . . . . . . . . . . . . . 103
Carlos Silva Ferreira, Etienne Bodart and Sonia Collin
Why Craft Brewers Should Be Advised to Use Bottle Refermentation to Improve Late-HoppedBeer StabilityReprinted from: beverages 2019, 5, 39, doi:10.3390/beverages5020039 . . . . . . . . . . . . . . . . . 115
v

About the Special Issue Editor
Luıs Ferreira Guido is currently an Assistant Professor in the Department of Chemistry and
Biochemistry at University of Porto. He completed a M.Sc. in Biochemistry (1995) and a Ph.D.
in Analytical Chemistry (2004) at University of Porto. He has published about 50 papers in SCI
indexed journals and 2 book chapters. He is the co-author of one European Patent and Editorial Board
Member of several journals. He has supervised 5 Ph.D. theses and 30 M.Sc. theses. His main research
interests are divided into analytical chemistry (mass spectrometry, chromatography and bioanalytical
techniques) and brewing chemistry (beer flavor, beer stability, antioxidants, and polyphenols).
vii


Preface to ”Brewing and Craft Beer”
Beer is a beverage with more than 8000 years of history, and the process of brewing has not
changed much over the centuries. However, important technical advances have allowed us to
produce beer in a more sophisticated and efficient way. The proliferation of specialty hop varieties has
been behind the popularity of craft beers seen in the past few years around the world. Craft brewers
interpret historic beer with unique styles. Craft beers are undergoing an unprecedented period of
growth, and more than 150 beer styles are currently recognized. While many studies have suggested
the beer value chain might be a vehicle for economic growth, few have estimated the economic
impacts of craft beer to a geographical region. Craft Beer as a Means of Economic Development: An
Economic Impact Analysis of the Michigan Value Chain is a very interesting study in this Special Issue
suggesting that state governments might generate economic growth by creating a business climate
that is conducive to the growth of the instate beer value chain [1].
This Special Issue, Brewing and Craft Beer, comprises nine different works by researchers from
five continents (North America, South America, Europe, Africa, and Oceania). This Special Issue
reflects thus a broad perspective on the most important questions that concern the researchers in
different parts of the world. One such problem is the difficulty to cultivate barley on the African
continent. Barley is a temperate cereal, and the African climate is unsuitable for its cultivation.
The process of brewing lager beer with cereals other than barley is growing to be a common practice,
especially in non-barley-producing countries. Mbeh Harry et al. demonstrate how sorghum can be
well and efficiently utilized industrially in Cameroon for producing beer [2].
Hops are a very important component for the success of craft beer. The aroma and flavor of hops
in strongly hopped and often in dry hopped beers are particularly responsible for the character of
such beers. The work of da Costa Jardim et al. [3] advances the understanding and complexity of
the sensory profile of different styles of craft beers from Southern Brazil. They report that the beer
with the lowest bitterness had a higher preference among consumers, showing bitterness as a key
factor that influences beer preference and leads to a decline in consumer preference. Also from Brazil,
a comparative study of dry and wet milling of barley is presented by Pereira de Moura et al. [4].
Their results indicate the best milling conditions to obtain a good mashing yield in order to increase
competitiveness of the microbreweries sector, as well as to improve product quality and to promote
the reduction of production costs.
The main quality characteristics of beer are appearance, aroma, flavor, and mouthfeel.
Computer vision is a non-destructive technique which has been applied in automated inspection
and measurement. Lukinac et al. present an overview of the applications and the latest achievements
of computer vision methods in determining the quality attributes of beer [5]. The use of machine
learning algorithms, especially artificial neural networks (ANN), has become more popular in recent
years, as they aid in increasing accuracy and reducing time and cost through analytical and sensory
methods to assess the quality and acceptability of beverages. These models may be used as a
cost-effective method for the fast-screening of beers during processing to assess the acceptability
more efficiently, as reported by Gonzalez Viejo et al. [6]. The same team uses a machine learning
modelling approach to study the effect of soundwaves on foamability properties and sensory of beers
[7]. They show that the use of soundwaves is a potential treatment in brewing to improve beer quality
by increasing the number of small bubbles and the foamability without disrupting yeast or modifying
the aroma and flavor profile.
ix

In the brewing process, the efficiency of fermentation and the character and quality of the
final product are intimately linked. Two papers are published in this Special Issue addressing the
fermentation step. Firstly, Kumar et al. showed that the use of water obtained from the soaking of
corn germ resulted in a shortening of the fermentation time [8]. The addition of germ water, rich in
micronutrients and soluble proteins, increased the free amino nitrogen levels and Zn concentration
in the wort, enhancing its economic value. Then, last but certainly not least, Silva Ferreira et al.
answer the question why craft brewers should be advised to use bottle refermentation to improve
late-hopped beer stability [9]. As bottle refermentation is widely used in Belgian craft beers, the aim
of their work is to assess how this practice might impact their flavor. It was with great pleasure that
I carried out the coordination of this Special Issue of Beverages on the topic Brewing and Craft Beer.
I firmly believe that this research field will hold a very important place in the strategy of Beverages.
I am especially thankful to all authors who have generously shared their scientific knowledge and
experience with others through their contribution to this Special Issue. I wish to extend my thanks to
the Editorial Office of Beverages, in particular to Ms. Tina Tian.
Conflicts of Interest: The author declares no conflict of interest.
References
1. Miller, S.R.; Sirrine, J.R.; McFarland, A.; Howard, P.H.; Malone, T. Craft Beer as a Means of
Economic Development: An Economic Impact Analysis of the Michigan Value Chain. Beverages 2019,
5, 35.
2. Mbeh. Harry, F.; Zangue Steve Carly, D.; Emmanuel Jong, N. Sorghum Coffee–Lactose Stout
Production and Its Physico-Chemical Characterization. Beverages 2019, 5, 20.
3. da Costa Jardim, C.; de Souza, D.; Cristina Kasper Machado, I.; Massochin Nunes Pinto, L.;
de Souza Ramos, R.; Garavaglia, J. Sensory Profile, Consumer Preference and Chemical Composition
of Craft Beers from Brazil. Beverages 2018, 4, 106.
4. Pereira de Moura, F.; Rocha dos Santos Mathias, T. A Comparative Study of Dry and Wet Milling
of Barley Malt and Its Influence on Granulometry and Wort Composition. Beverages 2018, 4, 51.
5. Lukinac, J.; Mastanjevic, K.; Mastanjevic, K.; Nakov, G.; Jukic, M. Computer Vision Method in Beer
Quality Evaluation—A Review. Beverages 2019, 5, 38.
6. Viejo, C.G.; Torrico, D.D.; Dunshea, F.R.; Fuentes, S. Development of Artificial Neural Network
Models to Assess Beer Acceptability Based on Sensory Properties Using a Robotic Pourer: A
Comparative Model Approach to Achieve an Artificial Intelligence System. Beverages 2019, 5, 33.
7. Gonzalez Viejo, C.; Fuentes, S.; Torrico, D.; Lee, M.; Hu, Y.; Chakraborty, S.; Dunshea, F. The Effect
of Soundwaves on Foamability Properties and Sensory of Beers with a Machine Learning Modeling
Approach. Beverages 2018, 4, 53.
8. Kumar, D.; Hager, A.S.; Sun, A.; Debyser, W.; Javier Guagliano, B.; Singh, V. Improving
Fermentation Rate during Use of Corn Grits in Beverage Alcohol Production. Beverages 2019, 5, 5.
9. Silva Ferreira, C.; Bodart, E.; Collin, S. Why Craft Brewers Should Be Advised to Use Bottle
Refermentation to Improve Late-Hopped Beer Stability. Beverages 2019, 5, 39.
Luıs Ferreira Guido
Special Issue Editor
x


beverages
Editorial
Brewing and Craft Beer
Luis F. Guido
Department of Chemistry and Biochemistry, Faculty of Sciences, University of Porto, 4169-007 Porto, Portugal;[email protected]; Tel.: +351220402644
Received: 3 August 2019; Accepted: 12 August 2019; Published: 16 August 2019
Beer is a beverage with more than 8000 years of history, and the process of brewing has notchanged much over the centuries. However, important technical advances have allowed us to producebeer in a more sophisticated and efficient way. The proliferation of specialty hop varieties has beenbehind the popularity of craft beers seen in the past few years around the world. Craft brewersinterpret historic beer with unique styles. Craft beers are undergoing an unprecedented period ofgrowth, and more than 150 beer styles are currently recognized. While many studies have suggestedthe beer value chain might be a vehicle for economic growth, few have estimated the economic impactsof craft beer to a geographical region. Craft Beer as a Means of Economic Development: An Economic ImpactAnalysis of the Michigan Value Chain is a very interesting study in this Special Issue suggesting that stategovernments might generate economic growth by creating a business climate that is conducive to thegrowth of the instate beer value chain [1].
This Special Issue, Brewing and Craft Beer, comprises nine different works by researchers from fivecontinents (North America, South America, Europe, Africa, and Oceania). This Special Issue reflectsthus a broad perspective on the most important questions that concern the researchers in differentparts of the world. One such problem is the difficulty to cultivate barley on the African continent.Barley is a temperate cereal, and the African climate is unsuitable for its cultivation. The processof brewing lager beer with cereals other than barley is growing to be a common practice, especiallyin non-barley-producing countries. Mbeh Harry et al. demonstrate how sorghum can be well andefficiently utilized industrially in Cameroon for producing beer [2].
Hops are a very important component for the success of craft beer. The aroma and flavor of hopsin strongly hopped and often in dry hopped beers are particularly responsible for the character of suchbeers. The work of da Costa Jardim et al. [3] advances the understanding and complexity of the sensoryprofile of different styles of craft beers from Southern Brazil. They report that the beer with the lowestbitterness had a higher preference among consumers, showing bitterness as a key factor that influencesbeer preference and leads to a decline in consumer preference. Also from Brazil, a comparative studyof dry and wet milling of barley is presented by Pereira de Moura et al. [4]. Their results indicatethe best milling conditions to obtain a good mashing yield in order to increase competitiveness ofthe microbreweries sector, as well as to improve product quality and to promote the reduction ofproduction costs.
The main quality characteristics of beer are appearance, aroma, flavor, and mouthfeel. Computervision is a non-destructive technique which has been applied in automated inspection and measurement.Lukinac et al. present an overview of the applications and the latest achievements of computer visionmethods in determining the quality attributes of beer [5]. The use of machine learning algorithms,especially artificial neural networks (ANN), has become more popular in recent years, as they aid inincreasing accuracy and reducing time and cost through analytical and sensory methods to assess thequality and acceptability of beverages. These models may be used as a cost-effective method for thefast-screening of beers during processing to assess the acceptability more efficiently, as reported byGonzalez Viejo et al. [6]. The same team uses a machine learning modelling approach to study theeffect of soundwaves on foamability properties and sensory of beers [7]. They show that the use of
Beverages 2019, 5, 51; doi:10.3390/beverages5030051 www.mdpi.com/journal/beverages1

Beverages 2019, 5, 51
soundwaves is a potential treatment in brewing to improve beer quality by increasing the number ofsmall bubbles and the foamability without disrupting yeast or modifying the aroma and flavor profile.
In the brewing process, the efficiency of fermentation and the character and quality of thefinal product are intimately linked. Two papers are published in this Special Issue addressing thefermentation step. Firstly, Kumar et al. showed that the use of water obtained from the soaking ofcorn germ resulted in a shortening of the fermentation time [8]. The addition of germ water, rich inmicronutrients and soluble proteins, increased the free amino nitrogen levels and Zn concentration inthe wort, enhancing its economic value. Then, last but certainly not least, Silva Ferreira et al. answerthe question why craft brewers should be advised to use bottle refermentation to improve late-hoppedbeer stability [9]. As bottle refermentation is widely used in Belgian craft beers, the aim of their workis to assess how this practice might impact their flavor.
It was with great pleasure that I carried out the coordination of this Special Issue of Beverages onthe topic Brewing and Craft Beer. I firmly believe that this research field will hold a very important placein the strategy of Beverages. I am especially thankful to all authors who have generously shared theirscientific knowledge and experience with others through their contribution to this Special Issue. I wishto extend my thanks to the Editorial Office of Beverages, in particular to Ms. Tina Tian.
Conflicts of Interest: The author declares no conflict of interest.
References
1. Miller, S.R.; Sirrine, J.R.; McFarland, A.; Howard, P.H.; Malone, T. Craft Beer as a Means of EconomicDevelopment: An Economic Impact Analysis of the Michigan Value Chain. Beverages 2019, 5, 35. [CrossRef]
2. Zangué Steve Carly, D.; Emmanuel Jong, N. Sorghum Coffee–Lactose Stout Production and ItsPhysico-Chemical Characterization. Beverages 2019, 5, 20. [CrossRef]
3. da Costa Jardim, C.; de Souza, D.; Cristina Kasper Machado, I.; Massochin Nunes Pinto, L.; de SouzaRamos, R.; Garavaglia, J. Sensory Profile, Consumer Preference and Chemical Composition of Craft Beersfrom Brazil. Beverages 2018, 4, 106. [CrossRef]
4. Pereira de Moura, F.; Rocha dos Santos Mathias, T. A Comparative Study of Dry and Wet Milling of BarleyMalt and Its Influence on Granulometry and Wort Composition. Beverages 2018, 4, 51. [CrossRef]
5. Lukinac, J.; Mastanjevic, K.; Mastanjevic, K.; Nakov, G.; Jukic, M. Computer Vision Method in Beer QualityEvaluation—A Review. Beverages 2019, 5, 38. [CrossRef]
6. Viejo, C.G.; Torrico, D.D.; Dunshea, F.R.; Fuentes, S. Development of Artificial Neural Network Modelsto Assess Beer Acceptability Based on Sensory Properties Using a Robotic Pourer: A Comparative ModelApproach to Achieve an Artificial Intelligence System. Beverages 2019, 5, 33. [CrossRef]
7. Gonzalez Viejo, C.; Fuentes, S.; Torrico, D.; Lee, M.; Hu, Y.; Chakraborty, S.; Dunshea, F. The Effect ofSoundwaves on Foamability Properties and Sensory of Beers with a Machine Learning Modeling Approach.Beverages 2018, 4, 53. [CrossRef]
8. Kumar, D.; Hager, A.S.; Sun, A.; Debyser, W.; Javier Guagliano, B.; Singh, V. Improving Fermentation Rateduring Use of Corn Grits in Beverage Alcohol Production. Beverages 2019, 5, 5. [CrossRef]
9. Silva Ferreira, C.; Bodart, E.; Collin, S. Why Craft Brewers Should Be Advised to Use Bottle Refermentationto Improve Late-Hopped Beer Stability. Beverages 2019, 5, 39. [CrossRef]
© 2019 by the author. Licensee MDPI, Basel, Switzerland. This article is an open accessarticle distributed under the terms and conditions of the Creative Commons Attribution(CC BY) license (http://creativecommons.org/licenses/by/4.0/).
2

beverages
Article
Craft Beer as a Means of Economic Development:An Economic Impact Analysis of the MichiganValue Chain
Steven R. Miller 1, J. Robert Sirrine 2, Ashley McFarland 3, Philip H. Howard 4 and Trey Malone 1,*
1 Department of Agricultural, Food and Resource Economics, Michigan State University,East Lansing, MI 48824, USA; [email protected]
2 Community, Food & Environment Institute, Michigan State University Extension,East Lansing, MI 48824, USA; [email protected]
3 Business and Industry Liaison, Minnesota Sea Grant, Duluth, MN 55812, USA; [email protected] Department of Community Sustainability, Michigan State University, East Lansing, MI 48824, USA;
[email protected]* Correspondence: [email protected]
Received: 26 February 2019; Accepted: 15 April 2019; Published: 2 May 2019
Abstract: While many studies have suggested the beer value chain might be a vehicle for economicgrowth, few have estimated the economic impacts of craft beer to a geographic region. As such, thisstudy uses modified input/output analysis to identify the economic contributions of instate beerproduction to the Michigan economy. We find that the beer value chain generated nearly $500 millionin Gross State Product in 2016, contributing nearly $1 billion as well as 9738 jobs in total aggregateeconomic contributions. The results suggest that state governments might generate economic growthby creating a business climate that is conducive to the growth of the instate beer value chain.
Keywords: craft beer; local value chain; economic contribution analysis
1. Introduction
Where past economic development efforts focused on attracting new industries to create jobs,economists now recognize the value of import substitution as a possible method for developing regionaleconomies [1]. The “Buy Local” movement is one key embodiment of import substitution, as increasingpurchases within one’s own region reduces leakages within an economic value chain, while simultaneouslyincreasing producer surplus [2]. Corresponding with the entry of a younger generation of consumers,the notion of “consumer-driven growth” has also entered the economic development lexicon [3,4].Consumer-driven growth is increasingly important, as many consumers desire a proliferation of high-statusoptions [5]. The economic theories of import substitution and consumer-driven growth converge perfectlyin the craft beer value chain. Many consumers are willing to pay higher prices for more unique craft beervarieties, signaling that state governments might create a business climate that is conducive to economicgrowth via the beer value chain [6]. This is especially important as governments have sweeping power toregulate the production, importation and sale of beer [7].
It follows that policymakers would benefit from understanding the economic contributions ofthe craft beer value chain. Sometimes state legislation can impede the formation of local and regionalbreweries, thereby impeding its entrepreneurial activity [6,8]. In response to increased consumerinterests in craft beer, many states have recently provided further opportunities for the growth oflocal and regional craft beer by restructuring their beer laws [9]. A thriving local craft beer industrycan contribute to local and regional economic development [10]. It is in this light that we assess theeconomic contributions of Michigan’s growing beer sector.
Beverages 2019, 5, 35; doi:10.3390/beverages5020035 www.mdpi.com/journal/beverages3

Beverages 2019, 5, 35
This article provides an estimate of the economic impacts associated with a regionally exclusivebeer value chain, largely made up by craft beer. The Michigan beer value chain makes an ideal casestudy for our analysis as it ranks fourth in the nation in terms of craft breweries and 11th overall interms of craft beer production [11]. What started as three microbreweries in the state in 1993 has nowgrown to over 330, with expectations for future growth. Michigan’s long history of beer productionincludes a similar history in the production of key inputs, including malting barley and hops [12].In response to brewery demand, Michigan agricultural producers have been rapidly increasing theamount of farmed malting barley and hop acres, where Michigan is developing a regional reputationfor quality beer inputs. Specifically, hops grown in Michigan have clear attributes that differentiatevarieties from those grown in other hop producing states, namely Washington, Idaho, and Oregon.Michigan’s brewers are interested in sourcing barley and hops from local sources and generating agenuinely Michigan made product [12]. In addition, a cadre of specialty malt producers has developedto help meet in-state demand. In addition to yeast harvesting and cultivation, wheat and rye are alsogrown in Michigan, which provides additional potential for a nearly complete local agricultural supplychain for beer production.
We contribute to the literature in two ways. First, we fill a gap in the economic developmentliterature by generating an estimate of the economic contributions of a local food system that might beaccessible to all states. By focusing on the beer value chain, we contribute to the literature in a secondway. The craft beer market has been identified as a vehicle for economic development, but studieson the value chain economic contributions of state-level beer production are lacking. The remainderof this article is organized as follows: First, we provide a brief background of the beer value chain.Second, we describe the conceptual framework of input-output analysis, which utilizes a sequenceof interlinking production functions to estimate the total (direct, indirect and induced) economicimpacts of the beer value chain in Michigan. Following the conceptual framework, we explain ourapplication of input-output analysis to the Michigan beer value chain. We then describe the results ofour model, which suggest that the beer value chain contributed nearly $500 million to the Gross StateProduct in 2016. The final section concludes with a discussion of the implications and limitations ofthe current study.
1.1. Background
The industrial organization of the U.S. beer industry has an incredible history [13]. In 1873,4131 breweries operated in the United States. Industry consolidation reduced the number of breweriesto 100 in 1978, operated by only 50 firms, as brewers tended toward flavors with the broadest consumerappeal [14]. This developed a marketplace where brand loyalty is fierce even though most consumerscannot distinguish between leading brands [15]. The beer market changed significantly in 1979 whenchanges in federal laws freed states to allow for homebrewing [13]. Over the next few decades, manyof those hobbyists set out to commercialize their homebrews, planting the seeds of a burgeoning craftbeer market [16].
The Brewers Association defines craft breweries as independently owned and producing less than6 million barrels a year [17]. They further define Microbreweries as producing less than 15,000 barrelsa year, with at least 75 percent of sales off-premise—though Michigan law defines microbreweries asthose producing less than 60,000 barrels per year. Brewpubs sell more than 25 percent or more of itsbeer on site. Today, over 7000 breweries operate in the U.S., but market share is still concentrated witha few national firms. There are about 15.5 breweries per million residents today compared to 96.1 permillion in 1873. The six largest firms make up about 84.5 percent of the total market of beer sales,led by Anheuser-Busch InBev, with 40.2 percent of the market [18]. Craft beer consumers largely fallinto one of five categories: Traditional beer drinkers, mavens, locavores, premium beer drinkers anduninformed beer drinkers [19].
Brewers compete in one of three markets: (1) Local, (2) regional or (3) national. As most brewersstart out small and with a local footprint, they start out in a local market. Upon developing a following
4
Beverages 2019, 5, 35
in their local market and depending on the span of this market, some expand regionally and selloutside of the state. Reaching this level requires a level of distribution resources that are usuallyreserved for the top tier national brands. However, the obstacles to reaching new markets are gettingsmaller through information technologies and wholesalers that can take a product to a national marketwith little up-front costs to the brewer. Conversely, a brand can reach a national audience throughacquisition by a national supplier. Acquisitions have become common in the craft beverage industry,although beer labeling is not always clear about the transition of ownership. This is due in large part tothe value beer drinkers place on independently owned breweries [20]. For a more thorough discussionof mergers and acquisitions in the U.S. beer market, see Howard [21].
1.2. Conceptual Framework
Input-output (I-O) models have become staple economic impact models for regional analysis andare often used in generating economic impact estimates of publicly-funded projects [22,23]. Because I-Omodels trace transactions across industries and institutions, they are instrumental in understandinghow changes in one sector of a region’s economy can affect all other economic sectors within theregion [24]. They have been especially popular in estimating the economic impacts of local foodsystems [25–30]. Their applicability to a myriad of questions has resulted in I-O models being the mostapplied economic modeling approach used in economic analysis [31].
Input-output models generalize linear transactions in a set of multipliers that capture the full extentof transactions associated with any changes in the level of production in an industry. Mathematically,the total effect of this change can be specified as:
Total Effect = Direct Effect + Indirect Effect + Induced Effect (1)
The I-O model takes changes in demand (the “direct” effect) and relates them to overall economicimpact (the “total” effect) through a set of mathematical equations. The indirect effect is the value ofsecondary inter-industry transactions in response to direct effects. The “induced” effect is the value oftransactions resulting from changes in income in response to direct effects. Because the relationshipsare linear, the direct, indirect and induced effects can be specified as multiples of the direct effect,so Equation (1) can be restated as:
Total Effect = (1 + k1 + k2) · Direct Effect (2)
where k1 and k2 are greater than or equal to zero and represent the multiplicative response of indirectand induced transactions, respectively. For simplicity, we restate Equation (2) as:
Total Effect = k · Direct Effect (3)
where k = (1 + k1 + k2). Equation (2) suggests that the economy-wide impact, the total effect, is somemultiple of the direct effect, where the multiplier takes a positive value that is equal to or greaterthan one. Consider the minimum value the multiplier can take: One. This value reflects the intuitiveresult that if the economy’s output of agricultural products expands by $1 million dollars, for example,the economy will expand at least by $1 million dollars. If the indirect and induced effects are not equalto zero (i.e., not imported), this $1 million increase in output will spur other industries to expand theiroutput of goods and services and will generate household income that will be applied to the purchaseof goods and services in the economy, generating a total economic impact greater than the initial $1million expansion. It follows that the economic multiplier is specified as a ratio of the total to directeffects. Rearranging Equation (3) provides:
k = (Total Effect)/(Direct Effect) (4)
5
Beverages 2019, 5, 35
where the multiplier, k, encompasses all the direct, indirect and induced effects for a given industry anddenotes the impact of a change in direct effects on the total economic system. Each industry in a regionis characterized by its own value of multiplier k. Industries with expansive localized production chainswill tend to have higher multipliers than industries that rely on suppliers outside of the modelingregion. When there is adequate supply within the region, the region has more potential to retainthe total effects of the industry. However, when producers depend on supplies outside the region,leakage occurs, and part of the total effect is lost.
All versions of I-O models require several common restrictive assumptions. First, the modelimposes constant returns to scale, such that a doubling of output requires a doubling of all inputs.Second, technology is fixed with no substitution. Combined, these two assumptions mean an increasein industry output requires an equal and proportionate increase in all inputs. Additionally, supply isassumed to be perfectly elastic such that there are no supply constraints. This final assumption alsoasserts that all prices are fixed, such that an increase in demand for any commodity will not resultin a price change for that industry. Input-output models have been criticized on the grounds thatsome of these assumptions are overly restrictive and that the magnitude of the bias generated bythese assumptions is greater when the industry direct effects are larger, relative the overall size of theindustry [32]. Despite this criticism, I-O models have become a standard by which economic impactassessment is generated.
2. Methods
We used a value chain assessment to estimate the economic contribution of the beer value chainin Michigan. A contribution analysis is similar to an economic impact assessment [33], but asserting aneconomic impact to an industry’s presence posits some challenges. In an economic impact assessment,the generally accepted counterfactual state is that not all direct expenditures will exist in the absence ofthe measured industry or business. This assumption may be applicable for assessing the economicimpact of a new factory that exports to other regions but is overly restrictive for assessing the economicsof a visceral industry. For example, when measuring the economic impact of a new automobile panelstamping plant, it may make sense to assume that the transactions arising from that plant wouldnot exist in the local economy in the absence of the plant. However, when measuring the economicimpact of a dispersed industry like beer production, it is very likely that many of the transactionsarising from the value chain would exist in the absence of beer production. Consumers will still buybeer, but it would be imported to the region. Farmers would still produce cash crops, but it wouldlikely not be barley for malting. Rather than asserting that the value of all associated transactionswould cease to exist, as in an economic impact assessment, an economic contribution study is silenton the counterfactual state of the economy in the absence of the measured industry. The associatedcontribution estimates suggest the extent to which the industry contributes to the overall size ofthe economy.
We used the IMPLAN Pro 3.1 economic input-output modeling software with the Michigantransactions data in this assessment. The IMPLAN Pro model is widely used in economic impact andindustry contribution simulations and has become a standard resource for regional economists [27].A Michigan-calibrated IMPLAN economic impact assessment model was used to estimate thecontributions that would arise through secondary transactions. Of the commercial input-outputmodels used in economic simulations, IMPLAN is one of the most referenced in the literature.Transactions are adopted from the Bureau of Economic Analysis’s benchmark input-output tables,meaning that it traces transactions across industries, households and government units and uses thesemeasures to estimate secondary transactions arising from a given set of industry transactions [34].In this assessment, industry transactions include the set of estimated transactions along the valuechain for producing Michigan beer. Secondary transactions are those transactions not directly madeby industries making up the Michigan supply chain, but rather are generated for the provisions ofintermediate goods and services inputs into the supply chain as indirect effects, and expenditures
6

Beverages 2019, 5, 35
from earnings by workers, proprietors and government (through fees and taxes) as induced effects.The total contributions, estimated as the sum of direct and secondary effects, generally exceed theinitial infusion of economic activity, generating what is commonly referred to as a multiplier effect.That is, once accounting for secondary transactions, the total contribution is larger than the direct valueof economic activities along the value chain, as predicated by economic theory [35].
The IMPLAN model is driven by the dollar value of transactions, and therefore, the resultingcontributions were measured in the value of total transactions. However, estimates of employment,labor income and contributions to gross state product were made via fixed ratios to industry output.The fixed ratios are industry averages. While IMPLAN provides a high degree of industry granularity,with 528 distinct industries, barley and hops production is included in industry aggregates of grainfarming and fruit farming, respectively. Additionally, brewpubs are represented in the full-servicerestaurants industry. Only breweries are uniquely categorized within the 528 distinct industry categories.Hence, industry aggregates may not be suitably representative of the actual transactions associatedwith Michigan brewing. Consequently, we modified the industry purchases, as described by Miller [12],to better represent the industries under this study.
The direct economic contribution of Michigan’s brewing industry is measured through brewingactivities, including the transportation costs of the final output. However, in a separate measure, weincluded the economic contribution beyond brewing to include retail and food accommodation salesof Michigan-brewed beer as a separate measure, netting out the production of the beer sales in ourfinal estimates. In this, we recognize two downstream channels from brewing by which economicvalue is generated.
We assumed brewery sales follow two channels to consumption: Onsite consumption,which includes own- and third-party sales, or through off-premise retail sales. For on-premiseconsumption, own sales command higher seller margins per unit of sale since sales are not required topass through the three-tier trade system [36], entailing a licensed wholesale distributor. All off-premiseconsumption is channeled through the three-tier trade system, entailing the wholesale and retail tradesectors. Only margins earned at the point of sale are captured, and those through food and drinkingplaces account only for beer sales components. Beer that is brewed and distributed in Michigangenerates value all the way to final sale for consumption, while beer that is brewed in Michigan andshipped out of state stops contributing value for the state at the state borders. The structural relationshipof the modeling frame is represented in Figure 1, where exports along the value chain are impliedalong the value chain, as that share that does traverse downstream along the instate value chain.
Figure 1. Michigan beer value chain.
2.1. Calculating Direct Contributions
Because all but one of Michigan’s breweries were classified as craft breweries in 2016, and becausethe Brewers Association (BA) tracks commercial craft beer production, estimates of the productionof craft beer by volume were provided by the BA statistics to be 846,029 barrels [11]. The volume of
7

Beverages 2019, 5, 35
production from the one non-craft beer brewery was added to get the total volume of beer producedin-state. This beer may be packaged in barrel form for draft sales or may be packaged in bottles andcans. Using national statistics, about 61 percent of beer purchases are in the form of kegs, while theremaining 39 percent is sold by the bottle or can [37]. Additionally, the market research firm Mintelprovides an estimate of where consumers purchase beer based on household surveys, showing that79 percent of beer is consumed away from home [18]. Applying estimated sales values to volumeallowed us to isolate estimates of the economic contributions of on-premise and off-premise saleschannels. Assuming equitable combinations of inputs, except for beer packaging, in the brewingprocess and all associated agricultural inputs, the remainder of the up-stream value chain can beestimated in the aggregate based on the volume of in-state production.
Through discussions with growers and maltsters, it was determined that malting barley productionlargely follows standard winter and spring grain production processes, by which the IMPLAN softwareis readily sufficient for estimating. Similarly, as craft beer production differs from that of national brands,which are largely represented in the IMPLAN transactions table, the standard IMPLAN productionfunction for beer brewing was modified to account for added barley and hops. More specifically, whilebarley use per barrel of beer is typically higher for craft beer over conventional beers [12], much of thisrepresents a substitution of rice for barley. However, rice and barley are grouped into a single categoryin IMPLAN under the category of grain farming. Since barley is produced in-state while rice is not, thesubstitution of barley for rice represents a reduction of the intermediate imports of rice, which is notgrown in Michigan, with more barley, which is grown instate. Additionally, separate accounting forwheat beers is not necessary in the IMPLAN software, as wheat and barley represent similar inputs byvolume [12] under IMPLAN’s grain farming sector. As both malting wheat and barley are grown inMichigan, substituting barley with wheat does not represent a shift in import shares. Finally, hop useis also heavier in craft beer, but as hops make up a minute input by volume, the overall change of hopshares in the baseline production function is minute. Hops are vegetables and therefore reflect addedvegetable inputs into the production process, which falls into the IMPLAN category “vegetables andmelon farming”.
Under this approach, estimates exclude the contribution of imported beers into the state, whereimports include domestic and foreign beers produced outside of but imported into Michigan. Hence,the estimated contributions reflect that of the beer production value chain in Michigan, but not theentirety of the economic contribution of the beer industry as a whole. One can argue that food salesthrough brewpubs should be included in economic contribution estimates, as food sales complementbeer sales from these venues. Rather than asserting that food sold through brewpubs contributes toMichigan’s beer value chain, we opted to separate the two and focus only on contributions directlyarising from the production and sale of Michigan-produced beer. To be sure, on-premise sales canaccrue through food and drinking establishments, but may also entail hotels, casinos, sporting andcommunity event venues, and other recreation outlets, outside of food and drinking establishmentswhere beer is typically sold. However, we modelled on-premise sales as if taking place in food anddrinking establishments, as the underlying production functions likely better represent the actual foodand drink value chains of these alternative venues. This is also a simplifying assumption, freeing usfrom sorting out the values of different on-premise venues that beer is sold through.
As IMPLAN is driven on sales values, not volume of production, we must convert the volumeof production into actual sales values. To do this, we broke out volume into three categories:(1) On-premise drafts, (2) on-premise bottled/canned and (3) off-premise bottled/canned. Each wereassigned an average price per volume, as described below. Because the IMPLAN production functionfor brewing beer is dominated by larger, national brand processors, the production functions weremodified based on industry interviews discussed by Miller [38]. These modifications emphasize deeperties to local supply chains of barley and hops and deemphasize rice imports through modified regionalpurchase coefficients. Similarly, the trade sector retail and wholesale shares of local supply frombreweries is increased, as well as that for food sector inputs.
8
Beverages 2019, 5, 35
2.2. Estimating Final Sales Direct Effects
Estimates of direct effects start at the brewery level, where estimates exist for the total volume ofbeer produced in the state. Production direct effects are dollar-values based on the volume of beerproduced in Michigan. Total volume of brewery sales comes from the Brewers Association’s 2016estimate for Michigan [11]. However, since the Brewers Association only tracks craft beer sales, andbecause Michigan’s Founders Brewery does not fall into the Brewers’ Association definition of craftbeer, estimates for the Founders Brewery production must be added to the total in-state brewery output.Estimates for Founders Brewery production in 2016 were based on direct contact with the brewery [39].Accordingly, the in-state production of beer totaled 846,688 barrels.
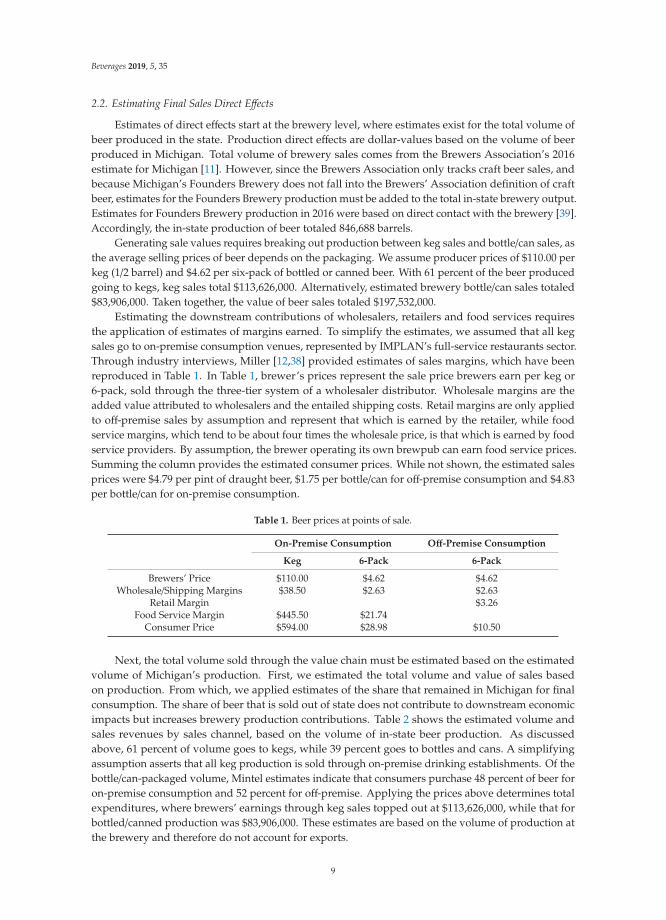
Generating sale values requires breaking out production between keg sales and bottle/can sales, asthe average selling prices of beer depends on the packaging. We assume producer prices of $110.00 perkeg (1/2 barrel) and $4.62 per six-pack of bottled or canned beer. With 61 percent of the beer producedgoing to kegs, keg sales total $113,626,000. Alternatively, estimated brewery bottle/can sales totaled$83,906,000. Taken together, the value of beer sales totaled $197,532,000.
Estimating the downstream contributions of wholesalers, retailers and food services requiresthe application of estimates of margins earned. To simplify the estimates, we assumed that all kegsales go to on-premise consumption venues, represented by IMPLAN’s full-service restaurants sector.Through industry interviews, Miller [12,38] provided estimates of sales margins, which have beenreproduced in Table 1. In Table 1, brewer’s prices represent the sale price brewers earn per keg or6-pack, sold through the three-tier system of a wholesaler distributor. Wholesale margins are theadded value attributed to wholesalers and the entailed shipping costs. Retail margins are only appliedto off-premise sales by assumption and represent that which is earned by the retailer, while foodservice margins, which tend to be about four times the wholesale price, is that which is earned by foodservice providers. By assumption, the brewer operating its own brewpub can earn food service prices.Summing the column provides the estimated consumer prices. While not shown, the estimated salesprices were $4.79 per pint of draught beer, $1.75 per bottle/can for off-premise consumption and $4.83per bottle/can for on-premise consumption.
Table 1. Beer prices at points of sale.
On-Premise Consumption Off-Premise Consumption
Keg 6-Pack 6-Pack
Brewers’ Price $110.00 $4.62 $4.62Wholesale/Shipping Margins $38.50 $2.63 $2.63
Retail Margin $3.26Food Service Margin $445.50 $21.74
Consumer Price $594.00 $28.98 $10.50
Next, the total volume sold through the value chain must be estimated based on the estimatedvolume of Michigan’s production. First, we estimated the total volume and value of sales basedon production. From which, we applied estimates of the share that remained in Michigan for finalconsumption. The share of beer that is sold out of state does not contribute to downstream economicimpacts but increases brewery production contributions. Table 2 shows the estimated volume andsales revenues by sales channel, based on the volume of in-state beer production. As discussedabove, 61 percent of volume goes to kegs, while 39 percent goes to bottles and cans. A simplifyingassumption asserts that all keg production is sold through on-premise drinking establishments. Of thebottle/can-packaged volume, Mintel estimates indicate that consumers purchase 48 percent of beer foron-premise consumption and 52 percent for off-premise. Applying the prices above determines totalexpenditures, where brewers’ earnings through keg sales topped out at $113,626,000, while that forbottled/canned production was $83,906,000. These estimates are based on the volume of production atthe brewery and therefore do not account for exports.
9
Beverages 2019, 5, 35
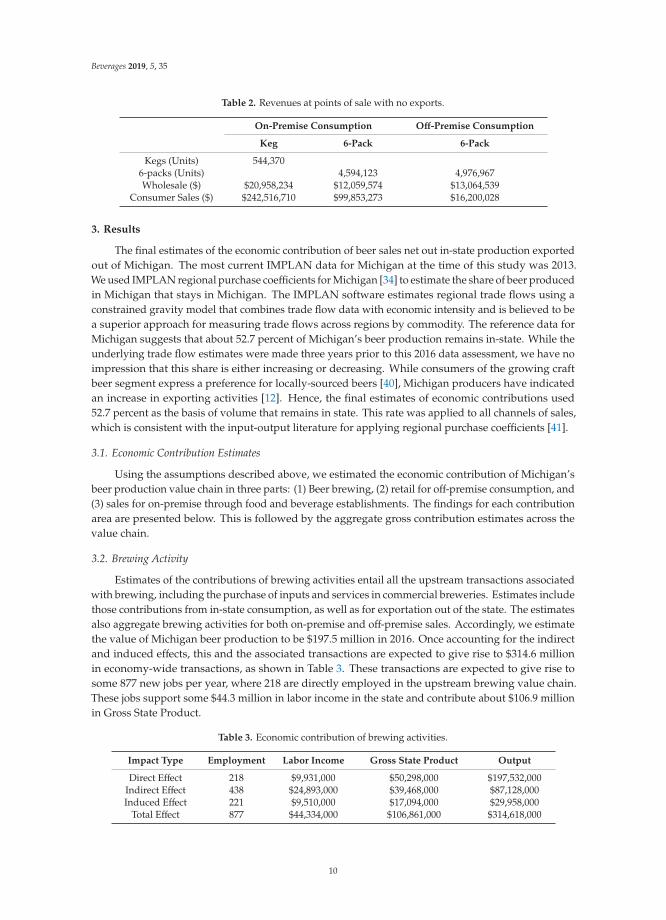
Table 2. Revenues at points of sale with no exports.
On-Premise Consumption Off-Premise Consumption
Keg 6-Pack 6-Pack
Kegs (Units) 544,3706-packs (Units) 4,594,123 4,976,967Wholesale ($) $20,958,234 $12,059,574 $13,064,539
Consumer Sales ($) $242,516,710 $99,853,273 $16,200,028
3. Results
The final estimates of the economic contribution of beer sales net out in-state production exportedout of Michigan. The most current IMPLAN data for Michigan at the time of this study was 2013.We used IMPLAN regional purchase coefficients for Michigan [34] to estimate the share of beer producedin Michigan that stays in Michigan. The IMPLAN software estimates regional trade flows using aconstrained gravity model that combines trade flow data with economic intensity and is believed to bea superior approach for measuring trade flows across regions by commodity. The reference data forMichigan suggests that about 52.7 percent of Michigan’s beer production remains in-state. While theunderlying trade flow estimates were made three years prior to this 2016 data assessment, we have noimpression that this share is either increasing or decreasing. While consumers of the growing craftbeer segment express a preference for locally-sourced beers [40], Michigan producers have indicatedan increase in exporting activities [12]. Hence, the final estimates of economic contributions used52.7 percent as the basis of volume that remains in state. This rate was applied to all channels of sales,which is consistent with the input-output literature for applying regional purchase coefficients [41].
3.1. Economic Contribution Estimates
Using the assumptions described above, we estimated the economic contribution of Michigan’sbeer production value chain in three parts: (1) Beer brewing, (2) retail for off-premise consumption, and(3) sales for on-premise through food and beverage establishments. The findings for each contributionarea are presented below. This is followed by the aggregate gross contribution estimates across thevalue chain.
3.2. Brewing Activity
Estimates of the contributions of brewing activities entail all the upstream transactions associatedwith brewing, including the purchase of inputs and services in commercial breweries. Estimates includethose contributions from in-state consumption, as well as for exportation out of the state. The estimatesalso aggregate brewing activities for both on-premise and off-premise sales. Accordingly, we estimatethe value of Michigan beer production to be $197.5 million in 2016. Once accounting for the indirectand induced effects, this and the associated transactions are expected to give rise to $314.6 millionin economy-wide transactions, as shown in Table 3. These transactions are expected to give rise tosome 877 new jobs per year, where 218 are directly employed in the upstream brewing value chain.These jobs support some $44.3 million in labor income in the state and contribute about $106.9 millionin Gross State Product.
Table 3. Economic contribution of brewing activities.
Impact Type Employment Labor Income Gross State Product Output
Direct Effect 218 $9,931,000 $50,298,000 $197,532,000Indirect Effect 438 $24,893,000 $39,468,000 $87,128,000Induced Effect 221 $9,510,000 $17,094,000 $29,958,000
Total Effect 877 $44,334,000 $106,861,000 $314,618,000
10
Beverages 2019, 5, 35
3.3. Off-Premise Consumption Sales
The impacts of sales for off-premise consumption include only those sales that remain in Michigan.The estimates include both retail and wholesale sales, where only margins (markup earned by retailersand wholesalers) are used as a basis of impacts. Because of the nature of the model, the purchases ofbeer from brewers and wholesalers cannot be easily subtracted from the estimates. Hence, the estimatedsecondary effects include the expected purchases of beer through conventional channels and may notrepresent the true expected extent to which final transactions take place. A correction is provided inthe aggregate contribution estimates below.
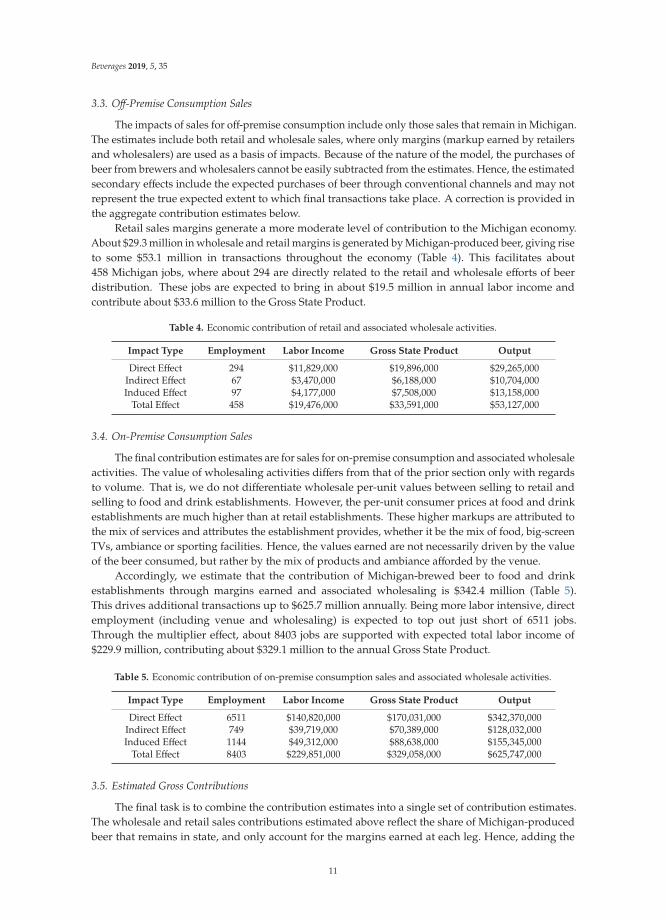
Retail sales margins generate a more moderate level of contribution to the Michigan economy.About $29.3 million in wholesale and retail margins is generated by Michigan-produced beer, giving riseto some $53.1 million in transactions throughout the economy (Table 4). This facilitates about458 Michigan jobs, where about 294 are directly related to the retail and wholesale efforts of beerdistribution. These jobs are expected to bring in about $19.5 million in annual labor income andcontribute about $33.6 million to the Gross State Product.
Table 4. Economic contribution of retail and associated wholesale activities.
Impact Type Employment Labor Income Gross State Product Output
Direct Effect 294 $11,829,000 $19,896,000 $29,265,000Indirect Effect 67 $3,470,000 $6,188,000 $10,704,000Induced Effect 97 $4,177,000 $7,508,000 $13,158,000
Total Effect 458 $19,476,000 $33,591,000 $53,127,000
3.4. On-Premise Consumption Sales
The final contribution estimates are for sales for on-premise consumption and associated wholesaleactivities. The value of wholesaling activities differs from that of the prior section only with regardsto volume. That is, we do not differentiate wholesale per-unit values between selling to retail andselling to food and drink establishments. However, the per-unit consumer prices at food and drinkestablishments are much higher than at retail establishments. These higher markups are attributed tothe mix of services and attributes the establishment provides, whether it be the mix of food, big-screenTVs, ambiance or sporting facilities. Hence, the values earned are not necessarily driven by the valueof the beer consumed, but rather by the mix of products and ambiance afforded by the venue.
Accordingly, we estimate that the contribution of Michigan-brewed beer to food and drinkestablishments through margins earned and associated wholesaling is $342.4 million (Table 5).This drives additional transactions up to $625.7 million annually. Being more labor intensive, directemployment (including venue and wholesaling) is expected to top out just short of 6511 jobs.Through the multiplier effect, about 8403 jobs are supported with expected total labor income of$229.9 million, contributing about $329.1 million to the annual Gross State Product.
Table 5. Economic contribution of on-premise consumption sales and associated wholesale activities.
Impact Type Employment Labor Income Gross State Product Output
Direct Effect 6511 $140,820,000 $170,031,000 $342,370,000Indirect Effect 749 $39,719,000 $70,389,000 $128,032,000Induced Effect 1144 $49,312,000 $88,638,000 $155,345,000
Total Effect 8403 $229,851,000 $329,058,000 $625,747,000
3.5. Estimated Gross Contributions
The final task is to combine the contribution estimates into a single set of contribution estimates.The wholesale and retail sales contributions estimated above reflect the share of Michigan-producedbeer that remains in state, and only account for the margins earned at each leg. Hence, adding the
11

Beverages 2019, 5, 35
retail and wholesale margin contributions to that of brewing contributions avoids double counting.When combining the direct effects of sales, we assert that Michigan consumers spent about$569.17 million on Michigan-produced beer. According to the statistics reporting portal Statistica [42],per-capita expenditures on beer average about $229.40 nationally. Given Michigan’s population of 9.951million in 2016 [43], our estimates suggest that Michigan’s per capita expenditure on Michigan-producedbeer was $57.19, or about 24.0 percent of the national average total expenditure on beer. A Mintelsurvey of beer drinkers found that 19 percent of beer drinkers associate with purchasing craft beer [44].Our findings’ close proximity suggests an appropriate estimate, while the fact that our findings suggesta higher proportion of sales to craft can be attributed to the higher price points of locally-sourced beers.
The resulting gross contribution estimates are shown in Table 6. In this, the expected contributionof Michigan’s craft beer value chain, including the Founders Brewery, totals $993.5 million, wherethe direct value chain transactions amount to about $569.2 million of that value. In total, just over9700 jobs can be linked back to Michigan-produced beer, where about 7023 are directly tied to brewing,moving, selling and serving beer. The largest bulk of this is in the food and drink service industry.Total labor income is expected to be about $293.7 million, making up average annual job earningsof around $30,156. Finally, our estimates suggest that Michigan’s craft beer sector contributes some$469.5 million to the annual Gross State Product.
Table 6. Aggregate economic contribution of Michigan’s brewery value chain.
Impact Type Employment Labor Income Gross State Product Output
Direct Effect 7023 $162,580,000 $240,225,000 $569,166,000Indirect Effect 1254 $68,082,000 $116,046,000 $225,864,000Induced Effect 1461 $62,999,000 $113,240,000 $198,462,000
Total Effect 9738 $293,661,000 $469,511,000 $993,492,000
4. Conclusions
The U.S. beer industry is undergoing a significant, consumer-driven restructuring as portionsof the national alcohol landscape are shifting to localized supply chains. This study estimated theeconomic contributions of Michigan’s beer industry. The distinction of measuring the economiccontribution from economic impacts is important, as an economic impact estimate would assert achange in economic activity in the absence of Michigan’s brewing value chains. Rather than focus onsuch hypothetical scenarios, our measures detail the contributions of Michigan’s beer production valuechains to existing economic activities. Our findings suggest that Michigan-produced beers generate asizeable contribution to the state economy, contributing just under $500 million to the annual GrossState Product (a measure of total income generated in the state), or alternatively, 8.4 percent of thevalue of Michigan’s food and beverage and tobacco products manufacturing sector’s annual GrossState Product [45].
Some limitations remain. These estimates omit some sources of contribution along Michigan’sbeer-production value chain. Namely, Michigan’s agricultural producers of malting grains andhops have found markets outside of Michigan, making raw ingredient inputs an export industry forMichigan. Michigan entrepreneurs are also experimenting with specialty malting operations, with aspecific focus on supplying in-state breweries, but with the potential for extending the export optionsalong Michigan’s beer production value chains. Miller [38] estimates that Michigan’s agriculturalinputs and malting operations contributed $8.9 million in annual transactions in 2016. Much of thisvalue is captured in our estimates, though the value attributed to exports is not. Furthermore, not allstates are likely to have as significant an economic impact from their beer value chain, as few statesare as well prepared to foster the development of the industry along the extent of the value chain.Michigan is a state with a long history of growing beer inputs such as malting barley and hops, so thepotential for economic impact can be relatively large.
12
Beverages 2019, 5, 35
The findings of this study highlight the ubiquitous nature of Michigan’s brewing industry fromthat which is produced for consumption in the state and that which is produced for export to othermarkets. While largely comprised of small producers, in the aggregate, it comprises a measurably largecomponent of the Michigan economy. Interest in consuming locally-sourced beer and craft beers isincreasing and we believe that the industry will continue to grow, relative to the 2016 numbers used inthis estimate. There are a surprisingly large number of jobs that can be tied to Michigan-sourced beer,but most of these jobs are tied to the food and drink service sector. While beer production has long beenregulated at the federal and state levels, recent changes in federal law have relaxed federal oversightand increased the authority of state regulations over beer production. Recognizing that regulation is acollective choice for managing the affairs of society, regulation without a full understanding of theeconomic contributions can result in money and opportunities left on the table.
Author Contributions: Conceptualization, J.R.S., A.M. and S.R.M.; Data Curation, J.R.S., A.M. and S.R.M.;Formal Analysis, S.R.M., T.M. and P.H.H.; Funding acquisition, A.M., J.R.S., and S.R.M.; Project administration,A.M. Methodology, S.R.M., A.M. and J.R.S.; Writing original draft, S.R.M. and T.M.; Writing—review & editing,S.R.M., T.M., P.H.H., A.M. and J.R.S. Visualization, P.H.H.
Funding: This research was funded by a 2016 Value Add and Regional Food System Grant provided by theMichigan Department of Agriculture and Rural Development.
Acknowledgments: The authors wish to acknowledge the Michigan Department of Agricultura and RuralDevelopment for funding this research and the Michigan Brewers’ Guild for their assistance in collecting andlocating the relevant information that was key to this study and for their assistance in securing funding for thisproject. Further, appreciation is extended to three anonymous referees, whose comments and insights greatlyimproved this manuscript.
Conflicts of Interest: The authors declare no conflict of interest.
References
1. Cooke, S.C.; Watson, P. A comparison of regional export enhancement and import substitution economicdevelopment strategies. J. Reg. Anal. Policy 2011, 41, 1–15.
2. Winfree, J.; Watson, P. The Welfare Economics of Buy Local. Am. J. Agric. Econ. 2017, 99, 971–987. [CrossRef]3. Glaeser, E.L.; Gottlieb, J.D. Urban resurgence and the consumer city. Urban Stud. 2006, 43, 1275–1299.
[CrossRef]4. Glaeser, E.L.; Kolko, J.; Saiz, A. Consumer city. J. Econ. Geogr. 2001, 1, 27–50. [CrossRef]5. Malone, T.; Lusk, J.L. Mitigating Choice Overload: An Experiment in the U.S. Beer Market. J. Wine Econ.
2019, 1–23. [CrossRef]6. Malone, T.; Lusk, J.L. Brewing up entrepreneurship: Government intervention in beer. J. Entrep. Public Policy
2016, 5, 325–342. [CrossRef]7. Malone, T.; Chambers, D. Quantifying Federal Regulatory Burdens in the Beer Value Chain. Agribus. Int. J.
2017, 33, 466–471. [CrossRef]8. Gohmann, S.F. Why Are There so Few Breweries in the South? Entrep. Theory Pract. 2016, 40, 1071–1092.
[CrossRef]9. Malone, T.; Hall, J.C. Can Liberalization of Local Food Marketing Channels Influence Local Economies?
A Case Study of West Virginia’s Craft Beer Distribution Laws. Econ. Bus. Lett. 2017, 6, 1–5. [CrossRef]10. Malone, T.; Stack, M. What Do Beer Laws Mean for Economic Growth? Choices 2017, 32, 1–7.11. Brewers Association. Michigan Craft Beer Sales Statistics; Brewers Association: Boulder, CO, USA, 2017;
Available online: https://www.brewersassociation.org/statistics/by-state/ (accessed on 18 February 2019).12. Miller, S.R. Michigan Craft Beer: An Economic Impact Assessment of the Locally Sourced Supply Chain;
Michigan State University, Center for Economic Analysis: East Lansing, MI, USA, 2017.13. Elzinga, K.G.; Tremblay, C.H.; Tremblay, V.J. Craft beer in the United States: History, numbers, and geography.
J. Wine Econ. 2015, 10, 242–274. [CrossRef]14. Choi, D.Y.; Stack, M.H. The all-American beer: A case of inferior standard (taste) prevailing? Bus. Horiz.
2005, 48, 79–86. [CrossRef]15. Almenberg, J.; Dreber, A.; Goldstein, R. Hide the Label, Hide the Difference? Working Paper No. 165;
American Association of Wine Economists: New York, NY, USA, 2014.
13

Beverages 2019, 5, 35
16. McCullough, M.; Berning, J.; Hanson, J.L. Learning by Brewing: Homebrewing Legalization and The BrewingIndustry. Contemp. Econ. Policy 2019, 37, 25–39. [CrossRef]
17. Brewers Association. Craft Brewer Defined; Brewers Association: Boulder, CO, USA, 2017; Available online:https://www.brewersassociation.org/statistics/craft-brewer-defined/ (accessed on 29 August 2017).
18. Mintel. Beer: US, January 2016; Mintel Group Ltd.: London, UK, 2016.19. Malone, T.; Lusk, J.L. If you brew it, who will come? Market segments in the US beer market. Agribus. Int. J.
2018, 34, 204–221. [CrossRef]20. Hart, J. Drink Beer for Science: An Experiment on Consumer Preferences for Local Craft Beer. J. Wine Econ.
2018, 13, 1–13. [CrossRef]21. Howard, P. Craftwashing in the U.S. Beer Industry. Beverages 2018, 4, 1–13. [CrossRef]22. Vandermeulen, V.; Verspecht, A.; Vermeire, B.; Van Huylenbroeck, G.; Gellynck, X. The use of economic
valuation to create public support for green infrastructure investments in urban areas. Landsc. Urban Plan.2011, 103, 198–206. [CrossRef]
23. Bess, R.; Ambargis, Z.O. Input-output models for impact analysis: Suggestions for practitioners usingRIMS II multipliers. In Proceedings of the 50th Southern Regional Science Association Conference,New Orleans, LA, USA, 24–26 March 2011.
24. Caskie, P.; Davis, J.; Moss, J.E. The economic impact of BSE: A regional perspective. Appl. Econ. 1999, 31,1623–1630. [CrossRef]
25. Henneberry, S.R.; Whitacre, B.E.; Agustini, H.N. An evaluation of the economic impacts of Oklahoma farmersmarkets. J. Food Distrib. Res. 2009, 40, 64–78.
26. Jablonski, B.B.; Schmit, T.M.; Kay, D. Assessing the economic impacts of food hubs on regional economies:A framework that includes opportunity cost. Agric. Resour. Econ. Rev. 2016, 45, 143–172. [CrossRef]
27. Lillywhite, J.M.; Crawford, T.L.; Libbin, J.; Peach, J. New Mexico’s Pecan Industry: Estimated Impacts on theState’s Economy; New Mexico State University, Agricultural Experiment Station: Las Cruces, NM, USA, 2007.
28. Miller, S.R.; Mann, J.; Barry, J.; Kalchik, T.; Pirog, R.; Hamm, M.W. A replicable model for valuing local foodsystems. J. Agric. Appl. Econ. 2015, 47, 441–461. [CrossRef]
29. Rossi, J.D.; Johnson, T.G.; Hendrickson, M. The economic impacts of local and conventional food sales.J. Agric. Appl. Econ. 2017, 49, 555–570. [CrossRef]
30. Watson, P.; Cooke, S.; Kay, D.; Alward, G.; Morales, A. A method for evaluating the economic contribution ofa local food system. J. Agric. Resour. Econ. 2017, 42, 180–194.
31. Baumol, W.J. Leontief’s great leap forward: Beyond Quesnay, Marx and von Bortkiewicz. Econ. Syst. Res.2000, 12, 141–152. [CrossRef]
32. Coughlin, C.C.; Mandelbaum, T.B. A consumer’s guide to regional economic multipliers. Fed. Reserve BankSt. Louis Rev. 1991, 73. [CrossRef]
33. Watson, P.; Wilson, J.; Thilmany, D.D.; Winter, S. Determining economic contributions and impacts: What isthe difference and why do we care. J. Reg. Anal. Policy 2007, 37, 140–146.
34. IMPLAN Group Llc. Implan Version 3.0 Trade Flow Estimation; IMPLAN Group Llc: Huntersville, NC, USA, 2012.35. Ramey, V.A. Can government purchases stimulate the economy? J. Econ. Lit. 2011, 49, 673–685. [CrossRef]36. Sorini, M. Understanding the Three-Tier System: Its Impacts on U.S. Craft Beer and You. CraftBeer.com.
2017. Available online: https://www.craftbeer.com/craft-beer-muses/three-tier-system-impacts-craft-beer(accessed on 30 January 2019).
37. Turnwall, A. A Year of Data Reveals Trends in the Orders of American Barroom Patrons . . . . Bevspot.2017. Available online: https://www.bevspot.com/2017/04/26/draft-vs-bottle-a-breakdown-of-beer-ordering-habits/ (accessed on 1 September 2017).
38. Miller, S.R. Michigan Beer: An Economic Contribution Assessment of Michigan’s Value Chain; Michigan StateUniversity, Center for Economic Analysis: East Lansing, MI, USA, 2017.
39. Sirrine, R.; Suttons Bay, MI, USA. Personal Communications, 2016.40. Malone, T.; Lusk, J.L. An Instrumental Variable Approach to Distinguishing Perceptions from Preferences for
Beer Brands. Manag. Decis. Econ. 2018, 39, 403–417. [CrossRef]41. Jackson, R.W. Regionalizing National Commodity-by-Industry Accounts. Econ. Syst. Res. 1998, 10, 223–238.
[CrossRef]42. Statistica. The Countires Spending the Most on Beer. 2018. Available online: https://www.statista.com/chart/
12508/the-countries-spending-the-most-on-beer/ (accessed on 5 February 2019).
14

Beverages 2019, 5, 35
43. U.S. Census Bureau. Annual Estimates of the Resident Population for the United States, Regions, States, andPuerto Rico: April 1, 2010 to July 1, 2018. Available online: https://www.census.gov/data/tables/time-series/demo/popest/2010s-state-total.html#par_textimage_1574439295 (accessed on 5 February 2019).
44. Mintel. Craft Beer: US, October 2016; Mintel Group Ltd.: London, UK, 2016.45. Bureau of Economic Analysis. Table SAGDP2N. 2019. Available online: https://www.bea.gov/data/economic-
accounts/regional (accessed on 11 March 2019).
© 2019 by the authors. Licensee MDPI, Basel, Switzerland. This article is an open accessarticle distributed under the terms and conditions of the Creative Commons Attribution(CC BY) license (http://creativecommons.org/licenses/by/4.0/).
15
beverages
Article
Sorghum Coffee–Lactose Stout Production and ItsPhysico-Chemical Characterization
Fali Mbeh. Harry 1, Desobgo Zangué Steve Carly 2,* and Nso Emmanuel Jong 1
1 Department of Process Engineering, National School of Agro-Industrial Sciences (ENSAI) of the Universityof Ngaoundere, P.O. Box 455 ENSAI, Ngaoundere, Cameroon; [email protected] (F.M.H.);[email protected] (N.E.J.)
2 Department of Food Processing and Quality Control, University Institute of Technology (UIT), University ofNgaoundere, P.O. Box 455 UIT, Ngaoundere, Cameroon
* Correspondence: [email protected]; Tel.: +237-697-16-00-04
Received: 23 June 2018; Accepted: 2 February 2019; Published: 1 March 2019
Abstract: Sorghum (Safrari) was valorized into sorghum coffee-lactose stouts using Vernoniaamygdalina as a bittering ingredient. These sorghum grains and subsequent sorghum pale malt weretested for their acceptability in the brewing field. Results obtained were the germinative capacity of99.29 ± 0.58%, a germinative energy of 98.56 ± 1.79%, a thousand corns weight 48.08 ± 0.02 g for thegrains, and a diastatic power of 187.44 ± 7.89 WK for sorghum malt. The worts and beers producedwere characterized and were found suitable. Moreover, alcohol content in stout beers obtained wasbetween 8.8% and 9.4% ABV. Sensory evaluation was implemented on beers using 30 panellists andthe best combination was the one using 50% lactose (250 g) and 50% coffee (250 g) in 5 L of wortduring wort boiling.
Keywords: Safrari; coffee; lactose; stout beer; sensory evaluation
1. Introduction
Sorghum is Africa’s fourth most important crop in terms of tonnage after maize, rice, and wheat [1].In certain parts of Africa and India, sorghum grain has traditionally been used in the production ofporridge, alcoholic beverages, and for bread making [2]. More than 300 million people in developingcountries rely on sorghum as an energy source [3–5]. This is the case in Cameroon where sorghum isthe largest energy source in the northern part [6–8] with a significant annual production of 1,102,000tons [1]. Given the competition of multinational enterprises, sorghum appears to be the best alternativeto lager beer production [8]. Barley has become the basic raw material for brewing for both barleyand non-barley-producing countries like Cameroon. The process of brewing lager beer with cerealsother than barley is growing to be a common practice, especially in non-barley-producing countriesdue to various drawbacks related to barley. Barley is a temperate cereal and the African climate isunsuitable for its cultivation. This presents a major problem; barley grain or barley malt must beimported, hence there are skyrocketing prices due to strong global demand and high shipping costs,meaning some valuable foreign exchange and increasing the price of the beer beyond the reach ofmost Africans. Importation also disadvantages local farmers as it denies them potential markets [9].This occurs in Cameroon and these force a re-think by industries to invest in other cereals as a maltingsubstitute. Sorghum can be well and efficiently utilized industrially in Cameroon for producingbeer. The chemical composition of sorghum reassures it as an alternative cereal to barley in lagerstyle beer production. It was previously believed that beer could not be produced without barley.However, it has been well-documented that cereals like sorghum have the potential to be an alternatesubstrate for conventional beer brewing. Research studies into sorghum are progressing rapidly andmaking a significant impact in brewing despite the earlier misunderstanding that malted sorghum
Beverages 2019, 5, 20; doi:10.3390/beverages5010020 www.mdpi.com/journal/beverages16
Beverages 2019, 5, 20
developed insufficient hydrolytic enzymes [6–10]. Differences in malting and mashing temperaturesemployed in studies of sorghum in the past were an important contributory factor and complicated ourunderstanding of the physiological behavior of sorghum during processing [6–10]. In recent times, thelarge body of work carried out on sorghum to understand the physiological behavior of sorghum hasled to improved malting and mashing processes amongst other findings, such as improved varietiesof sorghum suitable for beer brewing, which contributes in producing commercially acceptablesorghum beers both lager and stout [6,7,11–15]. Nigeria, South Africa, Uganda, Tanzania, Zambia,and Zimbabwe successfully brew commercial sorghum lager and stout beer [16]. The utilization ofa locally grown crops as a brewing material is cost effective and can potentially boost the regionaleconomy of Cameroon. It would benefit sorghum farmers with guaranteed income and thus reduceunemployment. In addition, the use of a native crop would reduce logistical costs for manufacturersresulting in reduced beer retail prices [17]. Manufacturers would be able to negotiate lower taxes withthe government on sorghum-based beer, which would contribute to another significant cost reductionof particular benefit to the consumer. It would help create affordable lager beer for consumers forwhom this type of beer is unaffordable. These factors would thus lead to an increased growth in thebrewing industry [17]. Sorghum beer is gluten-free and can be used by celiacs [18,19]. In order tovalorize sorghum, we came up with producing a coffee–lactose sorghum stout. The choice of coffeeand lactose is not trivial. Beer customers showed interest in such a beer as they showed interest togive their impression. Bitter leaf (Vernonia amygdalina) was used as a substitute for hop. Bitter leaf hassuccessfully served as a substitute to hop in lager beer. Its properties render it suitable for use [20–24].We were interested in this paper to present how the production of the coffee–lactose stout from themalting process through and fermentation was undertaken. Thereafter, the results of the analysesconducted on worts and beers are discussed, ending up with discussing the sensory evaluation ofthe beers.
2. Materials and Methods
2.1. Acquisition of Materials
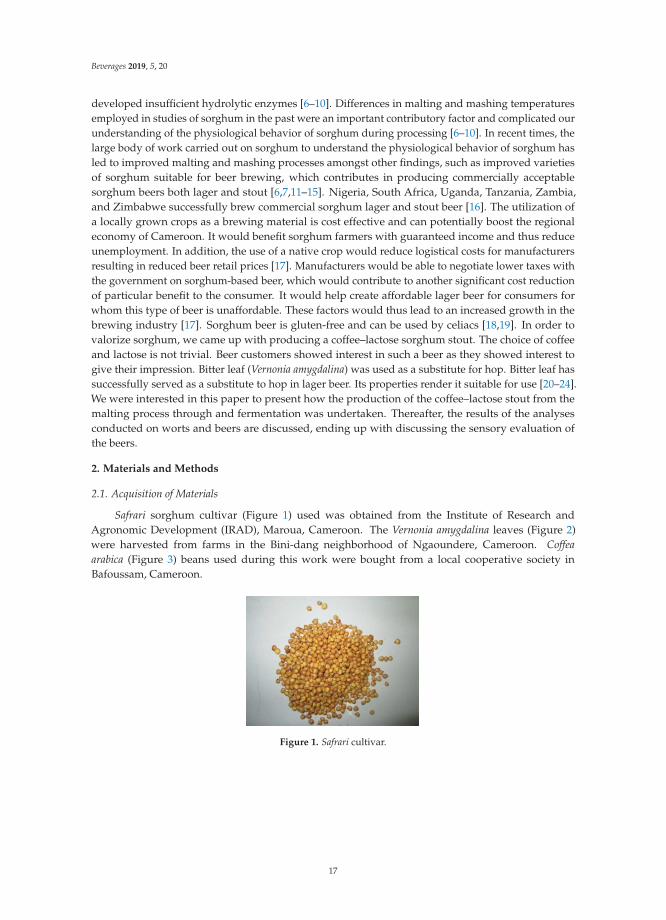
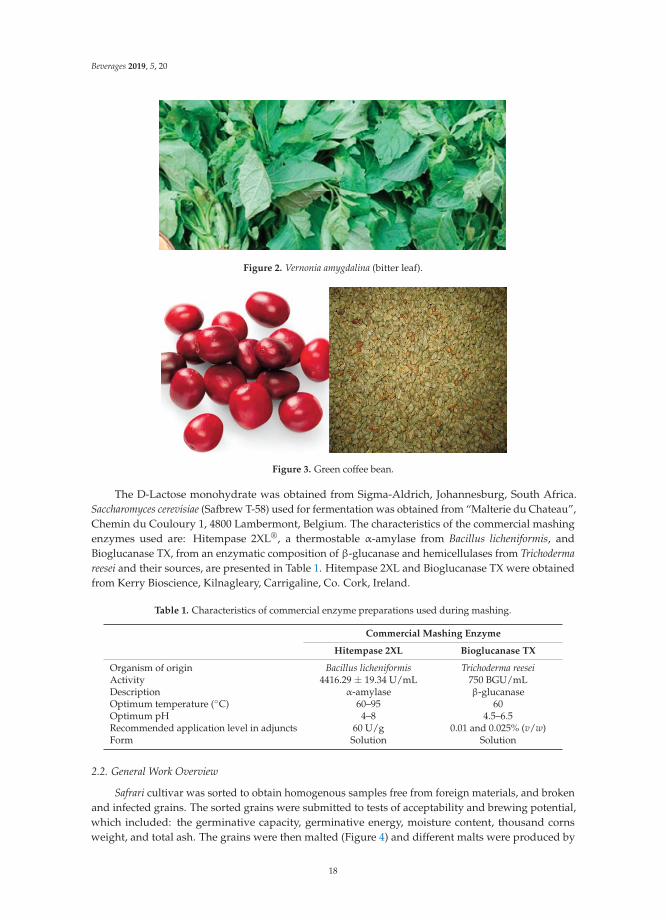
Safrari sorghum cultivar (Figure 1) used was obtained from the Institute of Research andAgronomic Development (IRAD), Maroua, Cameroon. The Vernonia amygdalina leaves (Figure 2)were harvested from farms in the Bini-dang neighborhood of Ngaoundere, Cameroon. Coffeaarabica (Figure 3) beans used during this work were bought from a local cooperative society inBafoussam, Cameroon.
Figure 1. Safrari cultivar.
17
Beverages 2019, 5, 20
Figure 2. Vernonia amygdalina (bitter leaf).
Figure 3. Green coffee bean.
The D-Lactose monohydrate was obtained from Sigma-Aldrich, Johannesburg, South Africa.Saccharomyces cerevisiae (Safbrew T-58) used for fermentation was obtained from “Malterie du Chateau”,Chemin du Couloury 1, 4800 Lambermont, Belgium. The characteristics of the commercial mashingenzymes used are: Hitempase 2XL®, a thermostable α-amylase from Bacillus licheniformis, andBioglucanase TX, from an enzymatic composition of β-glucanase and hemicellulases from Trichodermareesei and their sources, are presented in Table 1. Hitempase 2XL and Bioglucanase TX were obtainedfrom Kerry Bioscience, Kilnagleary, Carrigaline, Co. Cork, Ireland.
Table 1. Characteristics of commercial enzyme preparations used during mashing.
Commercial Mashing Enzyme
Hitempase 2XL Bioglucanase TX
Organism of origin Bacillus licheniformis Trichoderma reeseiActivity 4416.29 ± 19.34 U/mL 750 BGU/mLDescription α-amylase β-glucanaseOptimum temperature (◦C) 60–95 60Optimum pH 4–8 4.5–6.5Recommended application level in adjuncts 60 U/g 0.01 and 0.025% (v/w)Form Solution Solution
2.2. General Work Overview
Safrari cultivar was sorted to obtain homogenous samples free from foreign materials, and brokenand infected grains. The sorted grains were submitted to tests of acceptability and brewing potential,which included: the germinative capacity, germinative energy, moisture content, thousand cornsweight, and total ash. The grains were then malted (Figure 4) and different malts were produced by
18
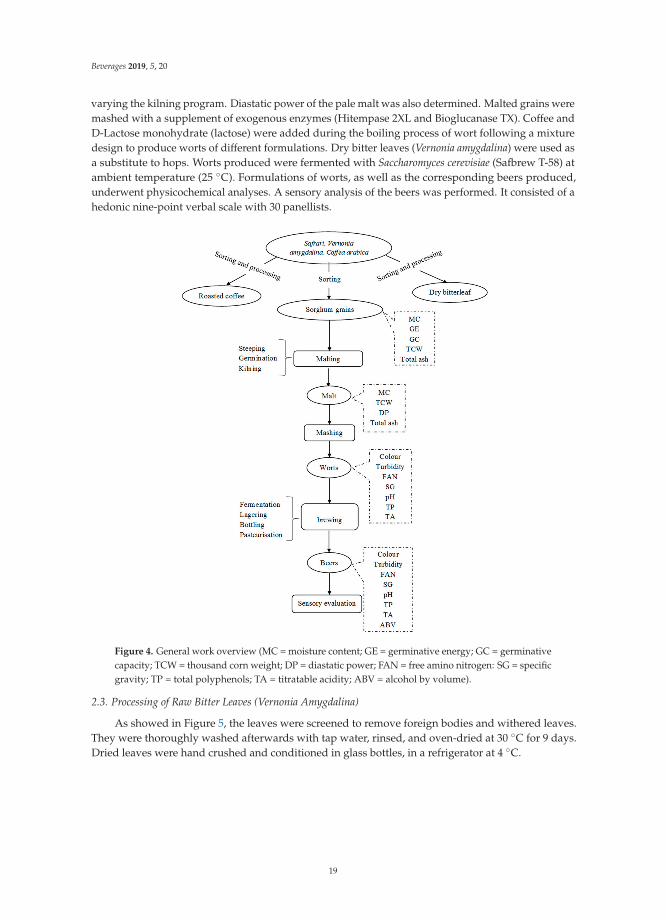
Beverages 2019, 5, 20
varying the kilning program. Diastatic power of the pale malt was also determined. Malted grains weremashed with a supplement of exogenous enzymes (Hitempase 2XL and Bioglucanase TX). Coffee andD-Lactose monohydrate (lactose) were added during the boiling process of wort following a mixturedesign to produce worts of different formulations. Dry bitter leaves (Vernonia amygdalina) were used asa substitute to hops. Worts produced were fermented with Saccharomyces cerevisiae (Safbrew T-58) atambient temperature (25 ◦C). Formulations of worts, as well as the corresponding beers produced,underwent physicochemical analyses. A sensory analysis of the beers was performed. It consisted of ahedonic nine-point verbal scale with 30 panellists.
Figure 4. General work overview (MC = moisture content; GE = germinative energy; GC = germinativecapacity; TCW = thousand corn weight; DP = diastatic power; FAN = free amino nitrogen: SG = specificgravity; TP = total polyphenols; TA = titratable acidity; ABV = alcohol by volume).
2.3. Processing of Raw Bitter Leaves (Vernonia Amygdalina)
As showed in Figure 5, the leaves were screened to remove foreign bodies and withered leaves.They were thoroughly washed afterwards with tap water, rinsed, and oven-dried at 30 ◦C for 9 days.Dried leaves were hand crushed and conditioned in glass bottles, in a refrigerator at 4 ◦C.
19

Beverages 2019, 5, 20
Figure 5. Processing of Vernonia amygdalina leaves.
2.4. Processing of Coffee Beans
The coffee beans were bought with their parchment. They were thus dehulled manually to obtainthe green beans. The green beans were roasted at 200 ◦C for 20 min in a Memmert ventilated oven(ULM/SLM 400–800), Germany. They were subsequently cooled before being ground and conditionedin glass bottles. Figure 6 depicts the process used.
2.5. Preparation of Sorghum Grains
Sorghum grains were cleaned by first manually sorting to remove deformed, small, broken, andimmature kernels, dust, sand, stones, and other foreign materials.
20

Beverages 2019, 5, 20
Figure 6. Processing of coffee beans.
2.6. Analysis of Sorghum Grain
2.6.1. Determination of the Germinative Energy of Sorghum
Two filter papers were placed at the bottom of two Petri dishes. A total of 4 mL and 8 mL ofdistilled water were accurately added [25].
Two lots of 100 corns were placed on the paper so that each made good contact without drowningthe embryo by ensuring that the ventral side only touched the paper. After which, the dish was coveredto prevent moisture loss, and placed in a dark cupboard. Chitted corns were removed after 24, 48,and 72 h from the beginning of steeping, thus avoiding excessive moisture uptake by those corns thatgerminated early. The germinative energy was calculated using the formula:
GE = 100 − Nng (1)
where GE is the germinative energy (%) and Nng is the number of grains that had not chitted.
2.6.2. Determination of the Germinative Capacity of Sorghum
Three lots of 200 corns were obtained after removing foreign matter and half of the corns out ofeach of the lots of 200 corns was steeped in 200 mL of fresh H2O2 solution at a concentration of 7.5 g/Lat room temperature (22–25 ◦C) for 2 days. After a day, the steep liquor was drained off and replacedwith 200 mL of fresh H2O2 solution at room temperature. After 2 days of steeping the steep liquor was
21
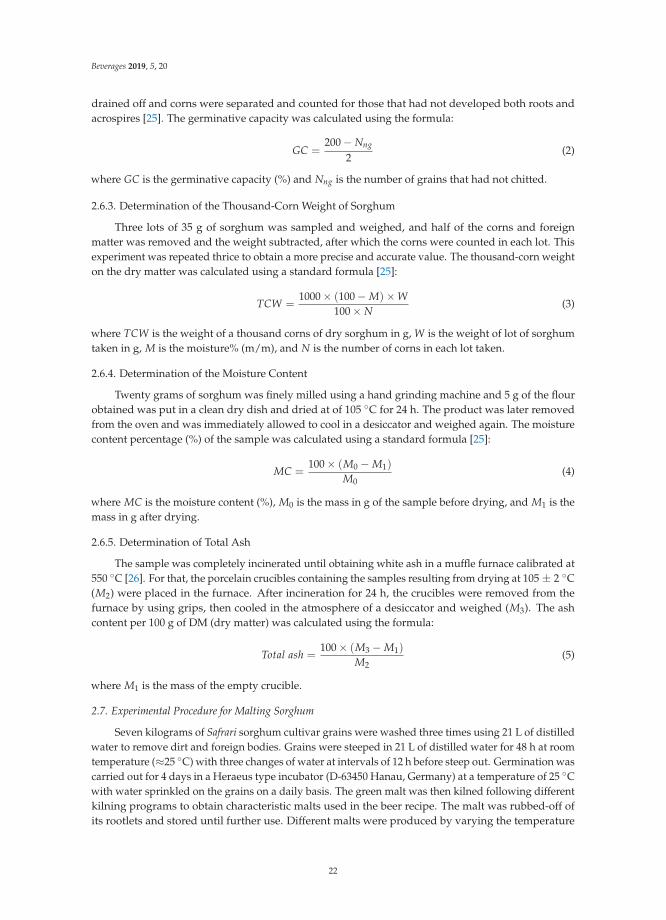
Beverages 2019, 5, 20
drained off and corns were separated and counted for those that had not developed both roots andacrospires [25]. The germinative capacity was calculated using the formula:
GC =200 − Nng
2(2)
where GC is the germinative capacity (%) and Nng is the number of grains that had not chitted.
2.6.3. Determination of the Thousand-Corn Weight of Sorghum
Three lots of 35 g of sorghum was sampled and weighed, and half of the corns and foreignmatter was removed and the weight subtracted, after which the corns were counted in each lot. Thisexperiment was repeated thrice to obtain a more precise and accurate value. The thousand-corn weighton the dry matter was calculated using a standard formula [25]:
TCW =1000 × (100 − M)× W
100 × N(3)
where TCW is the weight of a thousand corns of dry sorghum in g, W is the weight of lot of sorghumtaken in g, M is the moisture% (m/m), and N is the number of corns in each lot taken.
2.6.4. Determination of the Moisture Content
Twenty grams of sorghum was finely milled using a hand grinding machine and 5 g of the flourobtained was put in a clean dry dish and dried at of 105 ◦C for 24 h. The product was later removedfrom the oven and was immediately allowed to cool in a desiccator and weighed again. The moisturecontent percentage (%) of the sample was calculated using a standard formula [25]:
MC =100 × (M0 − M1)
M0(4)
where MC is the moisture content (%), M0 is the mass in g of the sample before drying, and M1 is themass in g after drying.
2.6.5. Determination of Total Ash
The sample was completely incinerated until obtaining white ash in a muffle furnace calibrated at550 ◦C [26]. For that, the porcelain crucibles containing the samples resulting from drying at 105 ± 2 ◦C(M2) were placed in the furnace. After incineration for 24 h, the crucibles were removed from thefurnace by using grips, then cooled in the atmosphere of a desiccator and weighed (M3). The ashcontent per 100 g of DM (dry matter) was calculated using the formula:
Total ash =100 × (M3 − M1)
M2(5)
where M1 is the mass of the empty crucible.
2.7. Experimental Procedure for Malting Sorghum
Seven kilograms of Safrari sorghum cultivar grains were washed three times using 21 L of distilledwater to remove dirt and foreign bodies. Grains were steeped in 21 L of distilled water for 48 h at roomtemperature (≈25 ◦C) with three changes of water at intervals of 12 h before steep out. Germination wascarried out for 4 days in a Heraeus type incubator (D-63450 Hanau, Germany) at a temperature of 25 ◦Cwith water sprinkled on the grains on a daily basis. The green malt was then kilned following differentkilning programs to obtain characteristic malts used in the beer recipe. The malt was rubbed-off ofits rootlets and stored until further use. Different malts were produced by varying the temperature
22

Beverages 2019, 5, 20
and time for kilning the green malt [27]. Four malts were used in the course of this work: base malt,caramel malt, toasted malt, and roasted malt. Figure 7 shows the malting process.
Figure 7. Sorghum malting process.
2.8. Determination of the Diastatic Power of Pale Malt
For the enzyme extraction, a water bath was first set at 40 ◦C. Ten grams of flour was measuredinto a beaker and 480 mL of water added. The mixture was mixed to avoid balling. The beaker wasplaced in the water bath and mashed for 1 h while stirring continuously. The extraction solutionwas cooled to room temperature. The beaker contents were adjusted to 510 g. The contents of thebeaker were stirred and transferred onto a filter. The first 200 mL were discarded and the next 50 mLimmediately used for analysis. A hundred mililiters of starch solution was pipetted into a 200 mLvolumetric flask. Five milliliters of sodium acetate buffer was added and the flask placed in the waterbath at 20 ◦C and allowed to stand for 20 min. Five mililiters of the flour extract was added usinga pipette, then the contents of the flask was shaken thoroughly and replaced in the bath for 30 min.Sodium hydroxide (4 mL) was added to the mix to inactivate the enzymes. The volume was made up to200 mL with water and mixed well. The alkalinity of the solution was verified using a thymolphthaleinsolution. The blank was prepared by pipetting 100 mL of starch solution into a 200 mL volumetric flask.NaOH solution (2.35 mL) was then added and mixed thoroughly. The malt extract (5 mL) was thenadded and the volume made up to 200 mL. The alkalinity was also checked using the thymolphthaleinsolution. The determination of the reducing sugars was done by transferring a 50 mL aliquot of thedigest into a 150 mL Erlenmeyer flask. Into this flask was added 25 mL of iodine solution and 3 mL ofsodium hydroxide, and was shaken. The flask was stoppered and allowed to stand for 15 min. Sulfuric
23
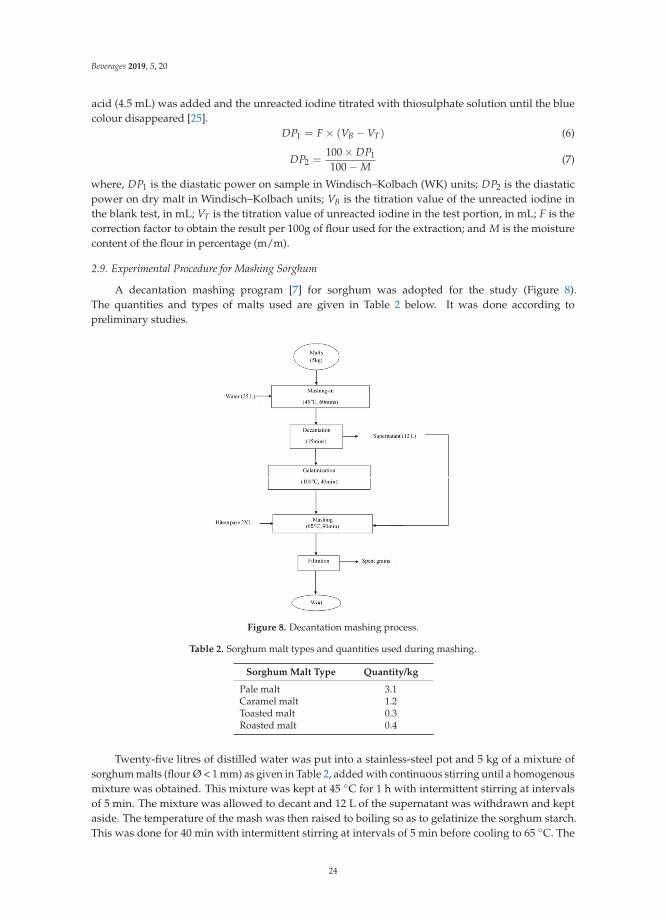
Beverages 2019, 5, 20
acid (4.5 mL) was added and the unreacted iodine titrated with thiosulphate solution until the bluecolour disappeared [25].
DP1 = F × (VB − VT) (6)
DP2 =100 × DP1
100 − M(7)
where, DP1 is the diastatic power on sample in Windisch–Kolbach (WK) units; DP2 is the diastaticpower on dry malt in Windisch–Kolbach units; VB is the titration value of the unreacted iodine inthe blank test, in mL; VT is the titration value of unreacted iodine in the test portion, in mL; F is thecorrection factor to obtain the result per 100g of flour used for the extraction; and M is the moisturecontent of the flour in percentage (m/m).
2.9. Experimental Procedure for Mashing Sorghum
A decantation mashing program [7] for sorghum was adopted for the study (Figure 8).The quantities and types of malts used are given in Table 2 below. It was done according topreliminary studies.
Figure 8. Decantation mashing process.
Table 2. Sorghum malt types and quantities used during mashing.
Sorghum Malt Type Quantity/kg
Pale malt 3.1Caramel malt 1.2Toasted malt 0.3Roasted malt 0.4
Twenty-five litres of distilled water was put into a stainless-steel pot and 5 kg of a mixture ofsorghum malts (flour Ø < 1 mm) as given in Table 2, added with continuous stirring until a homogenousmixture was obtained. This mixture was kept at 45 ◦C for 1 h with intermittent stirring at intervalsof 5 min. The mixture was allowed to decant and 12 L of the supernatant was withdrawn and keptaside. The temperature of the mash was then raised to boiling so as to gelatinize the sorghum starch.This was done for 40 min with intermittent stirring at intervals of 5 min before cooling to 65 ◦C. The
24
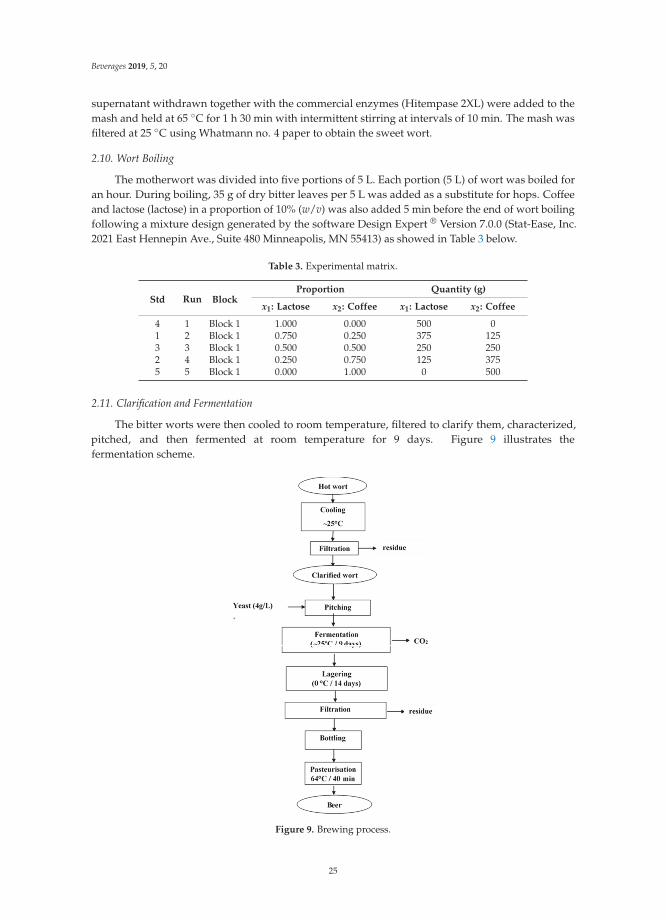
Beverages 2019, 5, 20
supernatant withdrawn together with the commercial enzymes (Hitempase 2XL) were added to themash and held at 65 ◦C for 1 h 30 min with intermittent stirring at intervals of 10 min. The mash wasfiltered at 25 ◦C using Whatmann no. 4 paper to obtain the sweet wort.
2.10. Wort Boiling
The motherwort was divided into five portions of 5 L. Each portion (5 L) of wort was boiled foran hour. During boiling, 35 g of dry bitter leaves per 5 L was added as a substitute for hops. Coffeeand lactose (lactose) in a proportion of 10% (w/v) was also added 5 min before the end of wort boilingfollowing a mixture design generated by the software Design Expert ® Version 7.0.0 (Stat-Ease, Inc.2021 East Hennepin Ave., Suite 480 Minneapolis, MN 55413) as showed in Table 3 below.
Table 3. Experimental matrix.
Std Run BlockProportion Quantity (g)
x1: Lactose x2: Coffee x1: Lactose x2: Coffee
4 1 Block 1 1.000 0.000 500 01 2 Block 1 0.750 0.250 375 1253 3 Block 1 0.500 0.500 250 2502 4 Block 1 0.250 0.750 125 3755 5 Block 1 0.000 1.000 0 500
2.11. Clarification and Fermentation
The bitter worts were then cooled to room temperature, filtered to clarify them, characterized,pitched, and then fermented at room temperature for 9 days. Figure 9 illustrates thefermentation scheme.
Figure 9. Brewing process.
25

Beverages 2019, 5, 20
2.12. Physicochemical Analyses of Worts and Beers
2.12.1. Determination of Specific Gravity (Analytica-EBC, 1998)
A thoroughly cleaned pycnometer was washed and rinsed with distilled water. It was then driedin an oven set at 105 ◦C for 5 min and then cooled in a desiccator. The initial mass of the pycnometerwas weighed and then filled with the sample (wort, beer). The difference in mass between the emptypycnometer and when it was filled with the sample was evaluated. This mass was used to calculatethe specific gravity by dividing the value obtained by 25 mL, which corresponds to the volume of thecalibrated pycnometer. The specific gravity thus calculated was checked across an extract table for thecorresponding concentration in ◦Brix and ◦Plato. Results from tables are expressed as ◦Plato using theGoldiner and Klemann table.
2.12.2. Determination of Color Using Spectrophotometric Method
The wavelength was set at 430 nm. The cell was filled with water and the absorbance set to read0.00. The cell was then rinsed and filled with the sample (wort and beer) and the absorbance read [25].
Color (EBC) = A × d × 25 (8)
where A is the absorbance at 430 nm in 10mm cell and d is the dilution factor
2.12.3. Determination of pH
The electrode of the pH-meter was immersed into the wort and beer samples and the pH wasread. The beer was degassed before the pH was read.
2.12.4. Determination of Turbidity
The tube was filled with the sample and wiped carefully and thoroughly. It was then placed inthe turbidimeter, closed, and read immediately. Results are expressed in NTU (nephelometric turbidityunit).
2.12.5. Determination of Free Amino Nitrogen (FAN) Content
The samples (wort and beer) were diluted to 1% (v/v); 2 mL of the diluted sample was placed in atest tube into which was added 1 mL of coloured reagent. Tubes were stoppered with aluminium foil,thoroughly homogenized, and placed in a water bath (95 ◦C) for exactly 16 min and then cooled incold water (20 ◦C) for 20 min. After this time, 5 mL of dilution solution was added, mixed, and theabsorbance was read at 570 nm against a reference sample prepared from the reagents plus 2 mL ofdistilled water in place of diluted wort and beer [25]. The free amino nitrogen (FAN) was calculatedaccording to the relation:
FAN (mg/L) =A1 × 2 × d
A2(9)
where A1 is the absorbance of test solution at 570 nm, A2 is the mean absorbance of standard solutionsat 570 nm, and d is the dilution factor.
2.12.6. Determination of Titratable Acidity
Titratable acidity was determined according to the standardized method, i.e., AFNOR (1982), with0.1 N sodium hydroxide (NaOH) in the presence of phenolphthalein indicator. Ten milliliters of thesample was pipetted into a conical flask and 0.1 mL of phenolphthalein (0.05%) was added. Titration
26
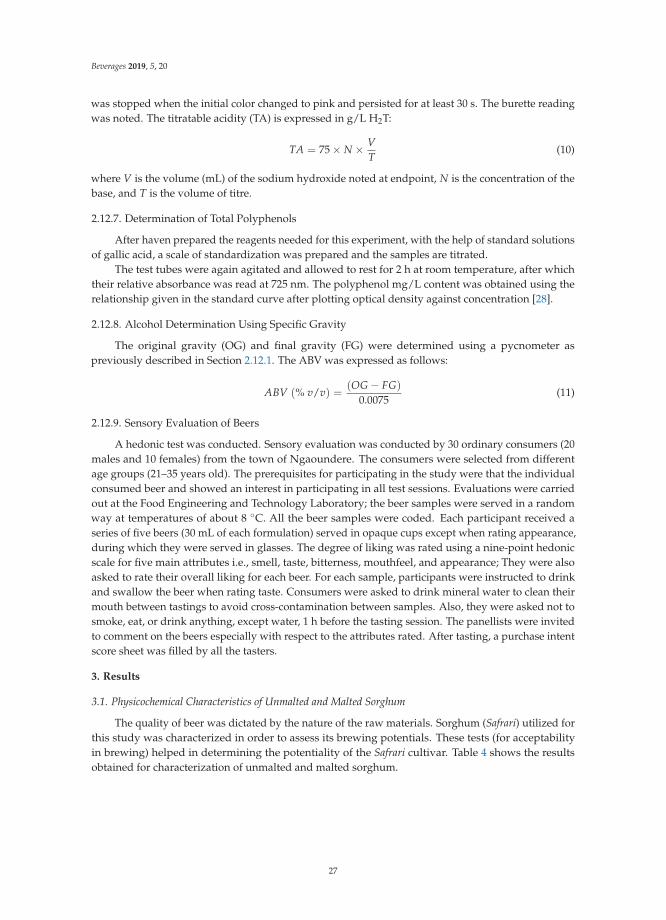
Beverages 2019, 5, 20
was stopped when the initial color changed to pink and persisted for at least 30 s. The burette readingwas noted. The titratable acidity (TA) is expressed in g/L H2T:
TA = 75 × N × VT
(10)
where V is the volume (mL) of the sodium hydroxide noted at endpoint, N is the concentration of thebase, and T is the volume of titre.
2.12.7. Determination of Total Polyphenols
After haven prepared the reagents needed for this experiment, with the help of standard solutionsof gallic acid, a scale of standardization was prepared and the samples are titrated.
The test tubes were again agitated and allowed to rest for 2 h at room temperature, after whichtheir relative absorbance was read at 725 nm. The polyphenol mg/L content was obtained using therelationship given in the standard curve after plotting optical density against concentration [28].
2.12.8. Alcohol Determination Using Specific Gravity
The original gravity (OG) and final gravity (FG) were determined using a pycnometer aspreviously described in Section 2.12.1. The ABV was expressed as follows:
ABV (% v/v) =(OG − FG)
0.0075(11)
2.12.9. Sensory Evaluation of Beers
A hedonic test was conducted. Sensory evaluation was conducted by 30 ordinary consumers (20males and 10 females) from the town of Ngaoundere. The consumers were selected from differentage groups (21–35 years old). The prerequisites for participating in the study were that the individualconsumed beer and showed an interest in participating in all test sessions. Evaluations were carriedout at the Food Engineering and Technology Laboratory; the beer samples were served in a randomway at temperatures of about 8 ◦C. All the beer samples were coded. Each participant received aseries of five beers (30 mL of each formulation) served in opaque cups except when rating appearance,during which they were served in glasses. The degree of liking was rated using a nine-point hedonicscale for five main attributes i.e., smell, taste, bitterness, mouthfeel, and appearance; They were alsoasked to rate their overall liking for each beer. For each sample, participants were instructed to drinkand swallow the beer when rating taste. Consumers were asked to drink mineral water to clean theirmouth between tastings to avoid cross-contamination between samples. Also, they were asked not tosmoke, eat, or drink anything, except water, 1 h before the tasting session. The panellists were invitedto comment on the beers especially with respect to the attributes rated. After tasting, a purchase intentscore sheet was filled by all the tasters.
3. Results
3.1. Physicochemical Characteristics of Unmalted and Malted Sorghum
The quality of beer was dictated by the nature of the raw materials. Sorghum (Safrari) utilized forthis study was characterized in order to assess its brewing potentials. These tests (for acceptabilityin brewing) helped in determining the potentiality of the Safrari cultivar. Table 4 shows the resultsobtained for characterization of unmalted and malted sorghum.
27
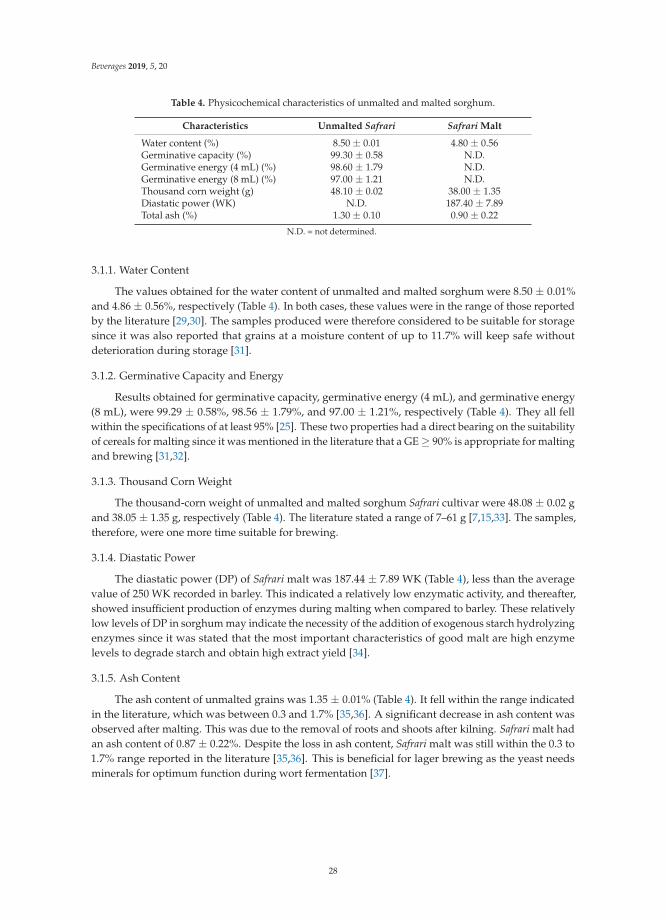
Beverages 2019, 5, 20
Table 4. Physicochemical characteristics of unmalted and malted sorghum.
Characteristics Unmalted Safrari Safrari Malt
Water content (%) 8.50 ± 0.01 4.80 ± 0.56Germinative capacity (%) 99.30 ± 0.58 N.D.Germinative energy (4 mL) (%) 98.60 ± 1.79 N.D.Germinative energy (8 mL) (%) 97.00 ± 1.21 N.D.Thousand corn weight (g) 48.10 ± 0.02 38.00 ± 1.35Diastatic power (WK) N.D. 187.40 ± 7.89Total ash (%) 1.30 ± 0.10 0.90 ± 0.22
N.D. = not determined.
3.1.1. Water Content
The values obtained for the water content of unmalted and malted sorghum were 8.50 ± 0.01%and 4.86 ± 0.56%, respectively (Table 4). In both cases, these values were in the range of those reportedby the literature [29,30]. The samples produced were therefore considered to be suitable for storagesince it was also reported that grains at a moisture content of up to 11.7% will keep safe withoutdeterioration during storage [31].
3.1.2. Germinative Capacity and Energy
Results obtained for germinative capacity, germinative energy (4 mL), and germinative energy(8 mL), were 99.29 ± 0.58%, 98.56 ± 1.79%, and 97.00 ± 1.21%, respectively (Table 4). They all fellwithin the specifications of at least 95% [25]. These two properties had a direct bearing on the suitabilityof cereals for malting since it was mentioned in the literature that a GE ≥ 90% is appropriate for maltingand brewing [31,32].
3.1.3. Thousand Corn Weight
The thousand-corn weight of unmalted and malted sorghum Safrari cultivar were 48.08 ± 0.02 gand 38.05 ± 1.35 g, respectively (Table 4). The literature stated a range of 7–61 g [7,15,33]. The samples,therefore, were one more time suitable for brewing.
3.1.4. Diastatic Power
The diastatic power (DP) of Safrari malt was 187.44 ± 7.89 WK (Table 4), less than the averagevalue of 250 WK recorded in barley. This indicated a relatively low enzymatic activity, and thereafter,showed insufficient production of enzymes during malting when compared to barley. These relativelylow levels of DP in sorghum may indicate the necessity of the addition of exogenous starch hydrolyzingenzymes since it was stated that the most important characteristics of good malt are high enzymelevels to degrade starch and obtain high extract yield [34].
3.1.5. Ash Content
The ash content of unmalted grains was 1.35 ± 0.01% (Table 4). It fell within the range indicatedin the literature, which was between 0.3 and 1.7% [35,36]. A significant decrease in ash content wasobserved after malting. This was due to the removal of roots and shoots after kilning. Safrari malt hadan ash content of 0.87 ± 0.22%. Despite the loss in ash content, Safrari malt was still within the 0.3 to1.7% range reported in the literature [35,36]. This is beneficial for lager brewing as the yeast needsminerals for optimum function during wort fermentation [37].
28

Beverages 2019, 5, 20
3.2. Analysis of Worts and Beers
3.2.1. Specific Gravities
The specific gravity of the worts produced a range between 1.0508 and 1.0748 (Table 5). Thesevalues fall within the range as recorded in the literature [9,10,24]. The lowest value recorded wasthat of the motherwort. This increase could be explained, amongst other reasons, by the evaporationof water taking place during the boiling process. This evaporation should have contributed to wortconcentration; thus, specific gravity increased in the boiled wort [18]. In the beer, specific gravitybetween 0.9923 and 1.0040 was obtained (Table 6). The lower final gravity could be explained by thefact that sugars were used up by yeast to convert the wort into beer; hence, the final gravity will bemuch lower as yeasts have consumed much of the sugar, which is denser than water, and have leftalcohol in its place, which is less dense than water [18].
3.2.2. pH
The pH of all the worts studied was within the range 5.41 ± 0.00 to 5.79 ± 0.01 (Table 5). All theboiled wort had pH values higher than 5.41 ± 0.00, which was that of the motherwort. This increasecould be explained by the fact that the pH of wort was dependent on the residual alkalinity of thewater [37]. According to the literature, sorghum wort pH should range between 5.3–6.0 for optimumbrewing [3,4,38]. All the worts produced were within this range. Equally, in the beer, pH rangedbetween 4.47 ± 0.02 and 4.68 ± 0.03 (Table 6). The lower pH values obtained in the beers could beexplained by the fact that during fermentation, the pH continued to drop as a result of the yeastcells taking in ammonium ions (which are strongly basic) and excreting organic acids including lacticacid [37].
3.2.3. Turbidity
The proportion of lactose and coffee impacted the turbidity of wort by increasing it (Table 5). Thiscould be due to the fact that coffee contains proteins, polyphenols, and carbohydrates [39], amongstother components that induce the formation of haze [7,8]. High turbidity values were recorded forall wort samples. The wort containing 100% coffee recorded a turbidity value of 91.00 ± 0.00 NTU(Table 5). A turbidity value of 606.00 ± 0.82 NTU was obtained in the sample containing 100% lactose(Table 5). Together with polyphenols, proteins are thought to cause haze formation during wort boiling(hot break) and wort cooling (cold break). The trub in both cases was as a result of the interactionbetween proteins and polyphenols which forms some complex that clumps. At the end of the boil,as the wort cooled it got more and more cloudy. The clumps of polyphenol and protein in the coldbreak were much smaller than the hot break. Therefore, they tended to stay in suspension longer,causing the wort to be turbid [7,8]. The lower turbidity values obtained in the beer (Table 6) couldbe explained by the fact that during maturation, clarification of the beer took place. This was due tonatural sedimentation in the cold (lagering at 0 ◦C) of protein and polyphenol complexes. This ensuredthat turbidity owing to chemical precipitation or growth of microorganisms did not occur or, in thecase of chemical precipitation, did not recur when the beer was clear and stable [7,8].
29
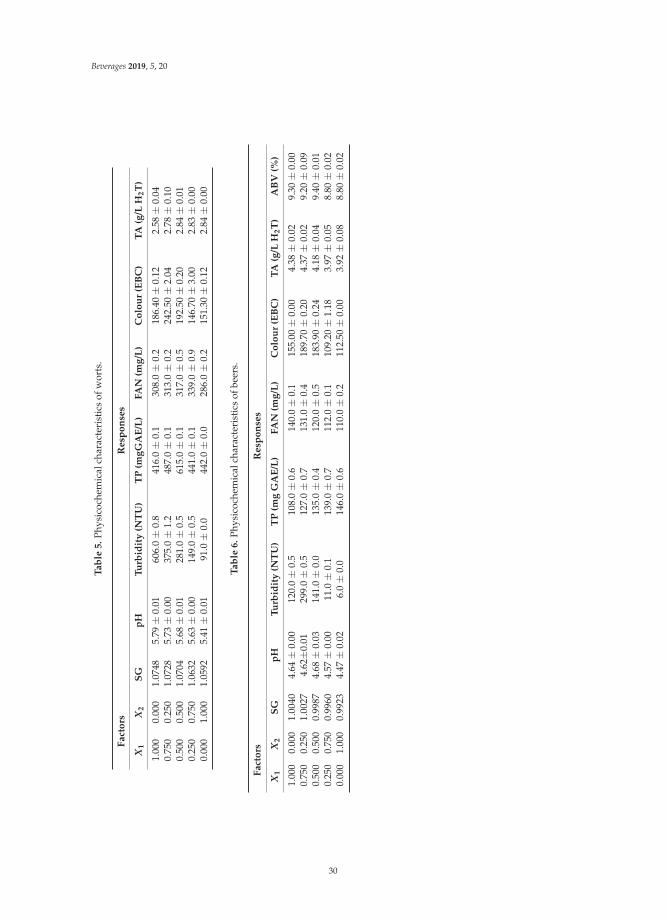
Beverages 2019, 5, 20
Tab
le5.
Phys
icoc
hem
ical
char
acte
rist
ics
ofw
orts
.
Fact
ors
Resp
on
ses
X1
X2
SG
pH
Tu
rbid
ity
(NT
U)
TP
(mg
GA
E/L
)F
AN
(mg
/L)
Co
lou
r(E
BC
)T
A(g
/LH
2T
)
1.00
00.
000
1.07
485.
79±
0.01
606.
0±
0.8
416.
0±
0.1
308.
0±
0.2
186.
40±
0.12
2.58
±0.
040.
750
0.25
01.
0728
5.73
±0.
0037
5.0±
1.2
487.
0±
0.1
313.
0±
0.2
242.
50±
2.04
2.78
±0.
100.
500
0.50
01.
0704
5.68
±0.
0128
1.0±
0.5
615.
0±
0.1
317.
0±
0.5
192.
50±
0.20
2.84
±0.
010.
250
0.75
01.
0632
5.63
±0.
0014
9.0±
0.5
441.
0±
0.1
339.
0±
0.9
146.
70±
3.00
2.83
±0.
000.
000
1.00
01.
0592
5.41
±0.
0191
.0±
0.0
442.
0±
0.0
286.
0±
0.2
151.
30±
0.12
2.84
±0.
00
Tab
le6.
Phys
icoc
hem
ical
char
acte
rist
ics
ofbe
ers.
Fact
ors
Resp
on
ses
X1
X2
SG
pH
Tu
rbid
ity
(NT
U)
TP
(mg
GA
E/L
)F
AN
(mg
/L)
Co
lou
r(E
BC
)T
A(g
/LH
2T
)A
BV
(%)
1.00
00.
000
1.00
404.
64±
0.00
120.
0±
0.5
108.
0±
0.6
140.
0±
0.1
155.
00±
0.00
4.38
±0.
029.
30±
0.00
0.75
00.
250
1.00
274.
62±0
.01
299.
0±
0.5
127.
0±
0.7
131.
0±
0.4
189.
70±
0.20
4.37
±0.
029.
20±
0.09
0.50
00.
500
0.99
874.
68±
0.03
141.
0±
0.0
135.
0±
0.4
120.
0±
0.5
183.
90±
0.24
4.18
±0.
049.
40±
0.01
0.25
00.
750
0.99
604.
57±
0.00
11.0±
0.1
139.
0±
0.7
112.
0±
0.1
109.
20±
1.18
3.97
±0.
058.
80±
0.02
0.00
01.
000
0.99
234.
47±
0.02
6.0±
0.0
146.
0±
0.6
110.
0±
0.2
112.
50±
0.00
3.92
±0.
088.
80±
0.02
30

Beverages 2019, 5, 20
3.2.4. Total Polyphenols
Total polyphenols ranged between 416.00 ± 0.13 and 615.00 ± 0.06 mg GAE/L (Table 5). Thesevalues were higher than the 150 mg/L to 300 mg/L range from the literature [27,33,40]. The proportionof lactose and coffee impacted the total polyphenols of beer. This could be accounted for by thefact that coffee contains polyphenols in their composition [41,42]. Total polyphenols between 108 to146 mg GAE/L were obtained in the beer (Table 6). Before the end of fermentation and maturation, alarge amount of the polyphenolic material and protein had been removed by adhesion and coagulation,and it had then sunk to the bottom of the fermenter, hence the drop in total polyphenols of beer.However, they were still present in the final beer where they contributed in determining its qualitysince polyphenols contribute to flavor, astringency, the perception of bitterness, haze, oxidative effects,and antioxidative effects [43–45].
3.2.5. Free Amino Nitrogen (FAN)
The FAN of wort varied from 308.00 ± 0.23 mg/L to 339.00 ± 0.93 mg/L (Table 5). This could beexplained by coffee, which contains proteins [41,42]. These proteins were broken down by proteases toFAN during mashing. It has been generally agreed that at least 120 mg/L of FAN is required to supportproper yeast growth during brewing, though with the high gravity brewing processes employed inmost modern breweries, recommended levels are at about 150 mg/L [46]. In beers, the FAN variedfrom 110.00 ± 0.23 mg/L to 140.00 ± 0.14 mg/L (Table 6). During fermentation, FAN providednutritional support to the yeast, enabling the optimal yeast growth and efficient fermentation necessaryfor good head retention and foam quality. This further explained the decrease in FAN recordedcompared to wort [47,48].
3.2.6. Color
The color values of the worts produced were within the range 146.75 ± 3.00 EBC to242.50 ± 2.04 EBC (Table 5). This could be due to the fact that color depends on the grain usedas raw materials and bitter leaf, as well as on the processes during the brewing. Color componentswere produced partly in the Maillard and caramelization reactions, and partly by the oxidation ofpolyphenols [7,49]. The color of beer ranged between 112.50 to 242.50 EBC (Table 6). The valuesobtained indicated that the beer produced was in the range of stout given that the appellation ofstout with reference to colour starts as from 69 EBC as indicated on the beer colour chart based on thestandard reference method.
3.2.7. Titratable Acidity (TA)
The proportion of lactose and that of coffee impact on the TA of beer. This could be accounted forby the fact that both lactose and coffee contained titratable acids in their composition as reported byFox et al. (2015) and Wang and Ho (2009), respectively. Titratable acidity varied slightly comparativelyin the formulation: between 2.58 ± 0.04 and 2.84 ± 0.01 g/L H2T (Table 5). Values of the TA of beerranged between 3.92 to 4.38 g/L tartaric acid (Table 6).
3.2.8. Alcohol by Volume (ABV) Content of Beer
The ABV of the five beers were very high (Table 6). Three of beer formulations had ABV above9%. They include formulations 1 to 3. A formulation with higher ABV means more fermentablesugars have been converted into ethanol during fermentation. Beers can contain up to about 12.5%ABV [10,24,37,50,51].
3.3. Sensory Evaluation Results
For beer 1 containing 100% lactose, all attributes had the majority of votes located in “the likingpart” of the hedonic scale (Figure 10). Mouthfeel had the highest number of votes. Smell, taste, and
31

Beverages 2019, 5, 20
bitterness scored high too. This could be the reason for the high score recorded for the overall liking.However, for this beer, some panellists commented on the appearance, saying it was hazy, makingit less attractive. Some also mentioned that the colour was not bad but the haziness gave a poorappearance. They suggested that the beer be more brilliant.
Figure 10. Hedonic nine-point scale grading for beer 1 (100% lactose and 0% coffee).
The bitterness and overall liking scored the highest in beer 2. Likewise for beer 1, for beer 2containing 75% lactose and 25% coffee, all attributes had the majority of votes located in “the likingpart” of the hedonic diagram (Figure 11). Similar comments were made by the panellists with respectto appearance being hazy. According to them, the beer lacked brilliance. They also mentioned that thecolour was not bad but the haziness gave a poor appearance. They suggested that the haziness shouldbe removed to make the beer more attractive.
Figure 11. Hedonic nine-point scale grading for beer 2 (75% lactose and 25% coffee).
32
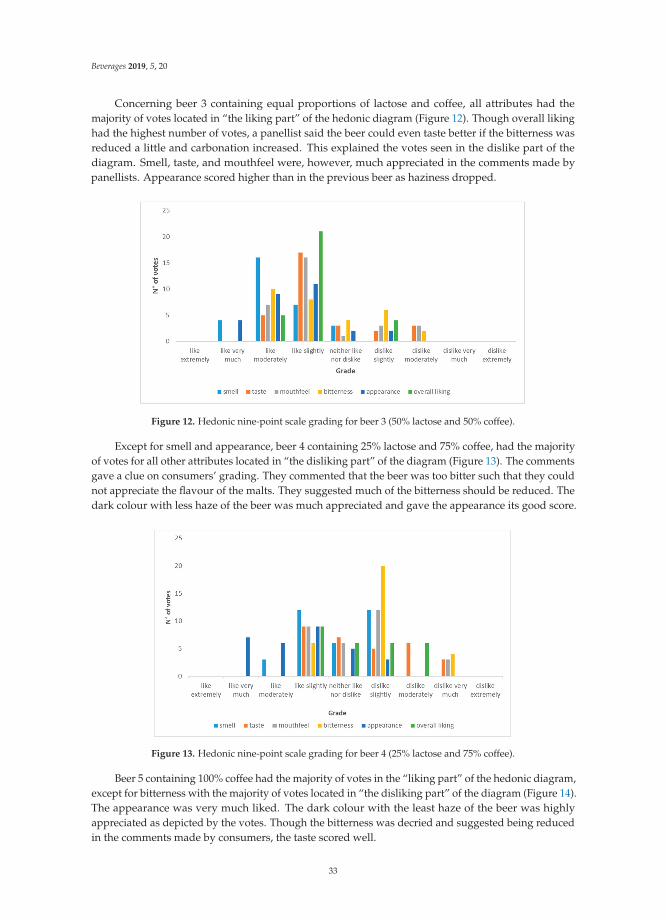
Beverages 2019, 5, 20
Concerning beer 3 containing equal proportions of lactose and coffee, all attributes had themajority of votes located in “the liking part” of the hedonic diagram (Figure 12). Though overall likinghad the highest number of votes, a panellist said the beer could even taste better if the bitterness wasreduced a little and carbonation increased. This explained the votes seen in the dislike part of thediagram. Smell, taste, and mouthfeel were, however, much appreciated in the comments made bypanellists. Appearance scored higher than in the previous beer as haziness dropped.
Figure 12. Hedonic nine-point scale grading for beer 3 (50% lactose and 50% coffee).
Except for smell and appearance, beer 4 containing 25% lactose and 75% coffee, had the majorityof votes for all other attributes located in “the disliking part” of the diagram (Figure 13). The commentsgave a clue on consumers’ grading. They commented that the beer was too bitter such that they couldnot appreciate the flavour of the malts. They suggested much of the bitterness should be reduced. Thedark colour with less haze of the beer was much appreciated and gave the appearance its good score.
Figure 13. Hedonic nine-point scale grading for beer 4 (25% lactose and 75% coffee).
Beer 5 containing 100% coffee had the majority of votes in the “liking part” of the hedonic diagram,except for bitterness with the majority of votes located in “the disliking part” of the diagram (Figure 14).The appearance was very much liked. The dark colour with the least haze of the beer was highlyappreciated as depicted by the votes. Though the bitterness was decried and suggested being reducedin the comments made by consumers, the taste scored well.
33

Beverages 2019, 5, 20
Figure 14. Hedonic nine-point scale grading for beer 5 (0% lactose and 100% coffee).
4. Conclusions
Studies on the physicochemical characterization of a beer stout using coffee and lactose asingredients and Vernonia amygdalina as bittering were made. It emerged from this study after havingcarried out a mixing plan having given five different beers that the physicochemical characteristics ofmusts and beers were comparable to the values obtained in the literature. The sensory analysis of thesebeers revealed those which are appreciated by the panellists during a hedonic test. It is therefore at theend of this work, plausible to consider a feasibility study for a pilot production of this type of beer.
Author Contributions: F.M.H. Performed the experiments. D.Z.S.C. Analyzed the data; Contributedreagents/materials/analysis tools; Wrote the paper. N.E.J. Contributed reagents/materials/analysis tools;Supervised the laboratory work and the paper.
Funding: This research received no external funding.
Acknowledgments: The authors gratefully acknowledge the Departments of Process Engineering of the NationalSchool of Agro-Industrial Sciences (ENSAI), The University of Ngaoundere (Cameroon) for providing necessaryfacilities for the successful completion of this research work.
Conflicts of Interest: The authors declare no conflict of interest.
References
1. Food and Agriculture Organization of the United Nations (FAO). Faostat Database Collections; Food andAgriculture Organization of the United Nations: Rome, Italy, 2014.
2. Agu, R.C.; Palmer, G.H. Enzymic modification of endosperm of barley and sorghum of similar total nitrogen.Brew. Dig. 1998, 73, 30–35.
3. Bajomo, M.F.; Young, T.W. The properties, composition and fermentabilities of worts made from 100% rawsorghum and commercial enzymes. J. Inst. Brew. 1993, 99, 153–158. [CrossRef]
4. Bajomo, M.F.; Young, T.W. Fermentation of worts made form 100% raw sorghum and enzymes. J. Inst. Brew.1994, 100, 79–84. [CrossRef]
5. Taylor, J.R.N.; Robbins, D. Factors affecting beta-amylase activity in sorghum malt. J. Inst. Brew. 1993, 99,413–416. [CrossRef]
6. Nso, E.J.; Nanadoum, M.; Palmer, G.H. The effect of formaldehyde on enzyme development in sorghummalts. Tech. Q. Master Brew. Assoc. Am. 2006, 43, 177–182.
34
Beverages 2019, 5, 20
7. Desobgo, Z.S.C.; Nso, E.J.; Tenin, D.; Kayem, G.J. Modelling and optimizing of mashing enzymes-effect onyield of filtrate of unmalted sorghum by use of response surface methodology. J. Inst. Brew. 2010, 116, 62–69.[CrossRef]
8. Desobgo, Z.S.C. Modélisation de L’action des Hydrolases sur Quelques Caractéristiques Physico-Chimiques desMoûts de Deux Cultivars de Sorgho; Université de Ngaoundéré Ngaoundéré: Ngaoundéré, Cameroon, 2012.
9. Bubacz, M.; Philip, T.; McCreanor, P.T.; Jenkins, H.E. Engineering of beer: Hard work or too much fun?In 2013 American Society for Engineering Education Southeast Conference; American Society for EngineeringEducation: Cookeville, TN, USA, 2013; pp. 1–10.
10. Owuama, C.I. Brewing beer with sorghum. J. Inst. Brew. 1999, 105, 23–34. [CrossRef]11. Desobgo, Z.S.C.; Nso, E.J.; Tenin, D. The response surface methodology as a reliable tool for evaluating
the need of commercial mashing enzymes for alleviating the levels of reducing sugars of worts of maltedsorghum: Case of the Safrari cultivar. J. Brew. Distill. 2011, 2, 5–15.
12. Desobgo, Z.S.C.; Nso, E.J.; Tenin, D. Use of response surface methodology for optimizing the action ofmashing enzymes on wort reducing sugars of the madjeru sorghum cultivar. Af. J. Food Sci. 2011, 5, 91–99.
13. Desobgo, Z.S.C.; Nso, E.J.; Tenin, D. Modeling the action of technical mashing enzymes on extracts andfree-amino nitrogen yields of the madjeru sorghum cultivar. J. Brew. Distill. 2011, 2, 29–44.
14. Desobgo, Z.S.C.; Nso, E.J.; Tenin, D. Optimisation of the action of commercial mashing enzymes on wortextracts and free amino nitrogen of the Safrari sorghum cultivar. Tech. Q. Master Brew. Assoc. Am. 2011, 48,77–86.
15. Nso, E.J.; Ajebesone, P.E.; Mbofung, C.M.; Palmer, G.H. Properties of three sorghum cultivars used for theproduction of bili-bili beverage in northern cameroon. J. Inst. Brew. 2003, 109, 245–250. [CrossRef]
16. Wolgang, K. Technology Brewing and Malting, 5th ed.; VLB: Berlin, Germany, 2014; p. 960.17. Mackintosh, I.; Higgins, B. The development of a sorghum-based lager beer in uganda: A model of
co-operating between industry and government in the development of local ingredients for the productionof quality lager beer and consequential benefits for the parties involved. Asp. Appl. Biol. 2004, 72, 235–245.
18. Taylor, J.R.N.; Schober, J.T.; Bean, S.R. Novel food and non-food uses for sorghum and millets. J. Cereal Sci.2006, 44, 252–271. [CrossRef]
19. Veith, K.N. Evaluation of four Sorghum Hybrids through the Development of Glutenfree Beer; Master of Science;Kansas State University: Manhattan, AR, USA, 2007.
20. Ajebesone, P.E.; Aina, J.O. Potential african substitutes for hops in tropical beer brewing. J. Food Technol. Afr.2004, 9, 13–16.
21. Desobgo, Z.S.C.; Naponni, F.Y.; Nso, E.J. Characterization of Safrari sorghum worts and beers hopped withVernonia amygdalina and nauclea diderrichii. Int. J. Innov. Appl. Stud. 2013, 2, 83–91.
22. Okafor, N. Prospects and challenges of the use of local cereals and starchy subtrates in brewing. In NationalSymposium on the Brewing Industry, Now and the 21st Century; Owerri, Nigeria, 1985; pp. 22–25.
23. Okafor, N.; Aniche, G.N. West african hop substitute for sorghum lager. Brew. Distill. Int. 1983, 13, 200–204.24. Owuama, C.I.; Okafor, N. Use of unmalted sorghum as a brewing adjunct. World J. Microbiol. Biotechnol.
1990, 6, 318–322. [CrossRef] [PubMed]25. Analytica-EBC. European Brewery Convention; Fachverlag Hans Carl: Nürnberg, Germany, 1998.26. AFNOR. Association française de normalisation. In Recueil des Normes Françaises des Produits Dérivés des
Fruits et Légumes. Jus de Fruits, 1st ed.; AFNOR: Paris, France, 1982.27. Briggs, D.E. Malts and Malting, 1st ed.; Blackie Academic & Professional: London, UK, 1998.28. Marigo, G. Méthode de fractionnement et d’estimation des composés phénoliques chez les végétaux. Analysis
1973, 2, 106–110.29. Ogu, E.; Odibo, F.; Agu, R.C.; Palmer, G.H. Malting studies of some selected brewing sorghum varieties.
MBAA TQ 2004, 41, 386–389.30. Okon, E.U.; Uwaifo, A.O. Evaluation of malting sorghum i: The malting potentials of nigerian varieties of
sorghum. Brew. Dig. 1985, 60, 24–27.31. Agu, R.C.; Palmer, G.H. A reassessment of sorghum for lager-beer brewing. Bioresour. Technol. 1998, 66,
253–261. [CrossRef]32. Agu, R.C.; Palmer, G.H. Effect of mashing with commercial enzymes on the properties of sorghum worts.
World J. Micro-Biol. Biotechnol. 1998, 14, 43–48. [CrossRef]
35
Beverages 2019, 5, 20
33. Briggs, D.E.; Boulton, C.A.; Brookes, P.A.; Stevens, R. Brewing Science and Practice; Woodhead PublishingLimited: Cambridge, UK; CRC Press LLC: Boca Raton, FL, USA, 2004.
34. Gupta, M.; Abu-Ghannam, N.; Gallaghar, E. Barley for brewing: Characteristic changes during malting,brewing and applications of its by-products. Compr. Rev. Food Sci. Food Saf. 2010, 9, 318–328. [CrossRef]
35. Pontieri, P.; Di-Maro, A.; Tamburino, R.; De-Stefano, M.; Tilley, M.; Bean, S.R.; Roemer, E.; De-Vita, P.;Alifano, P.; Del-Giudice, L.; et al. Chemical composition of selected food-grade sorghum varieties grownunder typical mediterranean conditions. Maydica 2010, 55, 139–143.
36. Pontieri, P.; De-Vita, P.; Boffa, A.; Tuinstra, M.R.; Bean, S.R.; Krishnamoorthy, G.; Miller, C.; Roemer, E.;Alifano, P.; Pignone, D.; et al. Yield and morpho-agronomical evaluation of food-grade white sorghumhybrids grown in southern italy. J. Plant Interact. 2012, 7, 341–347. [CrossRef]
37. Bamforth, C.W. Brewing: New Technologies; Woodhead Publishing: Cambridge, UK, 2006; p. 500.38. Bajomo, M.F.; Young, T.W. Development of a mashing profile for the use of microbial enzymes in brewing
with raw sorghum (80%) and malted barley or sorghum malt (20%). J. Inst. Brew. 1992, 98, 515–523.[CrossRef]
39. Walstra, P.; Wouters, J.; Geurts, T. Dairy Science and Technology; CRC Press: Boca Raton, FL, USA, 2006.40. Briggs, D.E.; Hough, J.S. Malting and Brewing Science, 2nd ed.; Chapman and Hall: London, UK, 1981.41. Fox, P.F.; Uniacke-Lowe, T.; McSweeney, P.L.H.; O’Mahony, J.A. Dairy Chemistry and Biochemistry, 2nd ed.;
Springer International Publishing: Basel, Switzerland, 2015; p. 584.42. Wang, Y.; Ho, C.-T. Polyphenolic chemistry of tea and coffee: A century of progress. J. Agric. Food Chem.
2009, 57, 8109–8114. [CrossRef] [PubMed]43. Kondo, K.; Kurihara, M.; Miyata, N.; Suzuki, T.; Toyoda, M. Scavenging mechanisms of (-)-epigallocatechin
gallate and (-)-epicatechin gallate on peroxyl radicals and formation of superoxide during the inhibitoryaction. Free Radic. Biol. Med. 1999, 27, 855–863. [CrossRef]
44. Liu, Z.; Ma, L.P.; Zhou, B.; Yang, L.; Liu, Z.L. Antioxidative effects of green tea polyphenols on free radicalinitiated and photosensitized peroxidation of human low density lipoprotein. Chem. Phys. Lipids 2000, 106,53–63. [CrossRef]
45. Yilmaz, Y.; Toledo, R.T. Major flavonoids in grape seeds and skins: Antioxidant capacity of catechin,epicatechin, and gallic acid. J. Agric. Food Chem. 2004, 52, 255–260. [CrossRef] [PubMed]
46. Beckerich, R.P.; Denault, L.J. Enzymes in the preparation of beer and fuel alcohol. In Enzymes and Their Rolein Cereal Technology; Kruger, J.E., Lineback, D., Stauffer, C.E., Eds.; American Association of Cereal Chemists:St. Paul, MN, USA, 1987; pp. 335–354.
47. Lekkas, C.; Hill, A.; Taidi, B.; Hodgson, J.; Stewart, G. The role of small wort peptides in brewingfermentations. J. Inst. Brew. 2009, 115, 134–139. [CrossRef]
48. Lekkas, C.; Stewart, G.; Hill, A.; Taidi, B.; Hodgson, J. The importance of free amino nitrogen in wort andbeer. Tech. Q.-Master Brew. Assoc. Am. 2005, 42, 113.
49. Shellhammer, T.H. Beer color. In Beer: A Quality Perspective; Bamforth, C.W., Russell, I., Stewart, G.G., Eds.;Academic Press: London, UK, 2008; pp. 221–226.
50. Bamforth, C.W. Beer, carbohydrates and diet. J. Inst. Brew. 2005, 111, 259–264. [CrossRef]51. Bamforth, C.W. Chemistry of Brewing; Elsevier Science Ltd.: Amsterdam, The Netherlands, 2003.
© 2019 by the authors. Licensee MDPI, Basel, Switzerland. This article is an open accessarticle distributed under the terms and conditions of the Creative Commons Attribution(CC BY) license (http://creativecommons.org/licenses/by/4.0/).
36
beverages
Article
Sensory Profile, Consumer Preference and ChemicalComposition of Craft Beers from Brazil
Carmelita da Costa Jardim 1, Daiana de Souza 1, Isabel Cristina Kasper Machado 1,2,
Laura Massochin Nunes Pinto 1, Renata Cristina de Souza Ramos 1 and Juliano Garavaglia 1,2,*
1 Institute of Technology in Food for Health, University of Vale do Rio dos Sinos, Av. Unisinos, 950,São Leopoldo 93022-000, Brazil; [email protected] (C.d.C.J.); [email protected] (D.d.S.);[email protected] (I.C.K.M.); [email protected] (L.M.N.P.); [email protected] (R.C.d.S.R.)
2 Department of Nutrition, Federal University of Health Sciences of Porto Alegre, Rua Sarmento Leite, 245,Porto Alegre 90050-170, Brazil
* Correspondence: [email protected]; Tel.: +55-51-3590-8842; Fax: +55-51-3590-8122
Received: 17 October 2018; Accepted: 14 December 2018; Published: 19 December 2018
Abstract: Craft beers are known for their distinct flavor, brew, and regional distribution. They aremade using top-fermenting (ale) yeast, bottom-fermenting (lager) yeast, or through spontaneousfermentation. Craft beers are consumed and produced in Brazil in large quantities. However,they present a high level of polyphenols, which affects consumer preference as they may yield ataste of bitterness to beers. In this study, we analyzed the relationship between polyphenols andbitterness as well as the composition of the main styles of craft beers and consumer preference forthem. Six different styles were analyzed according to their polyphenol content, bitterness, chemicalcomposition, sensory profile, and preference. For preference, a panel of 62 untrained assessors wasused. For sensory profile, quantitative descriptive analysis was performed using expert assessors(n = 8). The most preferred style was classic American pilsner, and the least preferred was standardAmerican lager. The most preferred style showed less bitterness (9.52) and lower polyphenol content(0.61 mg EAG/mL), total solids (6.75 ◦Brix), and turbidity (7.27 NTU). This beer also exhibitedreduced sensory notes of malty, fruity, smoked, hoppy, and phenolic but a higher perception offloral, sweet, and yeast notes; the bitterness attribute had a reduced perception. This study advancesthe understanding and complexity of the sensory profile of different styles of craft beers fromSouthern Brazil.
Keywords: craft beer; polyphenols; bitterness; preference; sensory attributes
1. Introduction
Beer can be defined as a product of cereal fermentation process, and it consists of more than 90%water in addition to carbohydrates, minerals, and alcohol (on average 3.5–10%) [1]. Last year, Brazilproduced 13.9 billion liters and consumed 1.25 billion liters of beer, representing 7.0% and 6.6% ofthe global beer market, respectively [2]. Beers are primarily classified according to the fermentationprocess [3]. Lagers, the most consumed type of beer, are produced by low fermentation, which is usuallycarried out between 6 and 15 ◦C [2]. In contrast, ale type beers are produced by high fermentation,occurring between 16 and 24 ◦C after which yeast cells rise to the surface of the fermentation media,forming a thick film that is not generally removed completely [2]. Indeed, the transformation of wortinto beer essentially represents the yeast-driven conversion of sugars into ethanol, CO2, and manyother secondary products that provide specific aromas and flavors [4].
Craft beer can be defined as a distinctively flavored and brewed variety that is distributedregionally. Their popularity has benefited from innovation, creativity, typicality, and authenticity,which typifies craft beer as an experience that offers pleasure, enjoyment, sense of identity and
Beverages 2018, 4, 106; doi:10.3390/beverages4040106 www.mdpi.com/journal/beverages37
Beverages 2018, 4, 106
belonging, self-fulfillment, social recognition, and sustainability [5]. In recent years, there has been abig increase in the Brazilian market for craft beer consumption and production. In addition, craft beeris generally unfiltered, unpasteurized, and without additional nitrogen or carbon dioxide pressure [3].Unlike commercial beers, craft beers are mainly produced in microbreweries following the basicbrewing principles and using specific recipes according to the preference of consumers. At the sametime, like commercial beers, they can be brewed using different adjuncts and yeast types [6].
It is well known that many compounds affect the sensory properties of craft beers, such as sugars,organic acids, hop bitter acids, polyphenols, and carbonyl compounds [6]. The fermentation processesthrough the inoculated yeast (i.e., first fermentation and refermentation in craft beers) are fundamentalto the aromatic profile of the final beer produced [4]. Polyphenols are important compounds for beerquality as they can contribute to bitterness, color, body, and astringency and can therefore influencetheir acceptance [7,8]. Almost 67 different polyphenols have been detected in beers, both from barleyand hop [9]. The most abundant phenolic acid is ferulic acid, which is found in different beer styles,especially in pilsner and weissbier [10]. Polyphenols have a key impact on the sensory quality of beers,with a higher number of polyphenols leading to better aroma and flavor of the final product [11].
Beer polyphenols come from barley malt [12] and hop [8], and their content depends on the typeof beer and the quantity of hops added during its production. The brewing process and fermentationare also important factors as some chemical changes can occur during these processes [12]. Threepolyphenol groups—flavan-3-ol, flavonols, and phenolic acids—are found in beers and contribute totheir flavor, aroma, and chemical stability [9]. Some polyphenols act as antioxidants and prevent theoxidative degradation of beers. In addition, they provide potential benefits for human health as theyinhibit mutagenic and carcinogenic agents [8].
Consumers choose craft beers because they have a variety of flavors, such as malted barley,chestnut, and honey, which increases the probability of perceiving craft beers to be of a higherquality [13]. Moreover, their consumption has become, in a qualitative approach, experienced-basedand emerging from a desire for identity and distinction. The goal toward consumption is not functionalbut rather symbolic. [5]. Moreover, Brazilian consumers choose craft beers because they have anindividual quality value and distinct sensory attributes [14]. Indeed, there has been a worldwideincrease in the popularity of craft beers in recent times, particularly traditional ales, lagers, and evenstyles that do not fit in any of the two main types [3].
In the present study, the relationship between polyphenols and bitterness of the main styles of craftbeers brewed in Southern Brazil was analyzed, along with the preference of consumers. In addition,each style of craft beer was characterized according to its chemical composition, polyphenol content,and sensory attributes. As far as we know, few researches have been conducted with the sensorialdescription and composition of Brazilian artisanal beer styles, evidencing the importance of this work.
2. Material and Methods
2.1. Craft Beers and Styles
Six different styles of beer were used: standard American lager (SAL), classic American pilsner(CAP), weissbier (WSB), American India pale ale (IPA), Irish red ale (IRA), and robust porter (RPO).Table 1 shows the characteristics and packaging specifications of the different craft beers. Thesestyles were selected so that each specific beer showed different levels of color, bitterness, and ethanolcontent. All beer sample styles were defined according to sensory characteristics and brewing processas determined by the Beer Judge Certification Program (BJCP) [15]. The beer samples were purchasedfrom the market and were brewed in different localities of Rio Grande do Sul State in Southern Brazil(Table 1).
38

Beverages 2018, 4, 106
Table 1. Characteristics of each craft beer samples regarding their production and packaging type.Classic American pilsner (CAP), standard American lager (SAL), weissbier (WSB), American Indiapale ale (IPA), Irish red ale (IRA), and robust porter (RPO).
BeerSamples
Type Beer Color PackingPacking
Volume (mL)Production City Purchase Place
CAP Lager Yellow Bottle 1000 Porto Alegre Specialty storeSAL Lager Yellow Can 473 Caxias do Sul SupermarketWSB Lager Yellow Bottle 1000 Porto Alegre Specialty storeIPA Ale Red Bottle 500 Campo Bom Specialty storeIRA Ale Red Bottle 600 Porto Alegre Specialty storeRPO Ale Brown Bottle 600 Gramado Specialty store
2.2. Chemical Composition of Craft Beers
For all the beer parameters analyzed, the samples were decarbonated in an ultrasonic bath (UltraSonic Cleaner, Unique, São Paulo, Brazil) (30 min and at 80 kHz) until the foam disappeared, indicatingthat the beer did not contain CO2 [16]. The turbidity was measured in a turbidity meter (TU-2016,Lutron Electronic, Taipei, Taiwan) and expressed in nephelometric turbidity units (NTU). The pH wasdirectly measured using a calibrated pH meter (AZ 86505, AZ Instruments, Taichung City, Taiwan).The total solids were measured by refractometric method using a refractometer (Fisher Scientific,Waltham, MA, USA) and expressed in ◦Brix.
Dry extract was determined using an aliquot of 25 mL into metallic capsules (weighed before),evaporated in water bath for approximately 30 min, and expressed in g/L. The acidity was measuredby titration with a 0.1 M NaOH solution in the presence of phenolphthalein as the indicator until theappearance of pale pink color that persisted for 1 min. The content of reducing sugar was measuredusing the 3,5-dinitrosalicylic acid method [17]. All procedures were carried out in triplicate, andsamples were collected from the same production lot.
2.3. Beer Color
The color of craft beers was determined by colorimetric method [18,19]. The color of the beersamples was determined by HunterLAB software and a colorimeter (UltraScan PRO, Hunterlab,Reston, VA, USA) using D65 illuminating standard source, which was calibrated in the ultravioletregion for an accurate measurement of whitening agents. Aliquot of 2 mL of each craft beer was placedin a glass cell with a thickness of 2 mm. The parameters analyzed were luminosity (L*); a* (green tonegative value and red to positive value); b* (blue to negative value and yellow to positive value);chroma (C*), which indicates the color purity; and angle measurement (h*), which shows the hue ofthe samples’ color. The C* was calculated by the equation C* = (a*2 + b*2)1/2); the h* was measuredby the equation h* = tg−1(b*/a*). Moreover, the absorbance of beer was measured at a wavelength of430 nm in a 10-mm cuvette, and the color in European Brewing Convention (EBC) units was obtainedby multiplying the absorbance by a given factor [15]. All determinations were carried out in triplicate.
2.4. Polyphenols and Antioxidant Analysis
The total phenolic content was determined using the Folin–Ciocalteu method [20]. Briefly,in 500 μL of beer samples or standard solutions, 2.5 mL of 0.2 M Folin–Ciocalteu reagent (Sigma-Aldrich,St Louis, MO, USA) and 2 mL of sodium carbonate (Sigma-Aldrich) solution (75 g/L) were added andmixed. After incubation (2 h), the absorbance was measured at 760 nm. The phenolic content wascalculated from the calibration curve of Gallic acid (Sigma-Aldrich) standard solutions and expressedas millimoles of Gallic acid equivalent (GAE) per mL of craft beer. All determinations were carried outin triplicate.
The antioxidant activity was determined by 2,2-diphenyl-1-picrylhydrazyl (DPPH) radical-scavengingactivity [21]. A 0.1 mL aliquot of methanolic extract was added to 3.9 mL of a 6 × 10⁻⁵ mol/L DPPHradical (Sigma-Aldrich), and the absorbance was measured at 515 nm. Quantification was performed
39
Beverages 2018, 4, 106
using a calibration curve prepared with Trolox standard (6-hydroxy-2,5,7,8-tetramethylchroman-2-carboxylic acid) (Sigma-Aldrich). The results of DPPH radical-scavenging activity were expressed asμmol of Trolox per mL of beer, and all determinations were carried out in triplicate.
2.5. Determination of Bitterness
Craft beer samples were decarbonated, and bitter substances were extracted with iso-octane [16]using 10 mL of sample, 1 mL of hydrochloric acid, and 20 mL iso-octane. After this, the sample wasagitated for 5 min at room temperature and then centrifuged for 15 min at 4000 rpm. The iso-octanephase was decanted and drained; the sample tube was covered and left to stand in the dark for at least30 min before measuring the absorption at 275 nm. Results were expressed as International BitteringUnits (IBU), and the average values of three determinations were used.
2.6. Sensory Analysis of Craft Beers
Ethical approval for the sensory tests of this investigation was obtained from the University ofVale do Rio dos Sinos Committee (number 12247636), and all participants gave written informedconsent to participate in the study. Two different sensory tests—the ranking preference test andquantitative descriptive analysis (QDA)—was performed for each beer style.
For the ranking preference test, a hedonic panel test composed of 62 assessors who were notexperienced and aged 20–56 years old was used. The selection criteria were availability and motivationto participate on all days of the experiments and the panelists being regular beer consumers. Initially,these participants answered questions about the habits of beer consumption, such as the frequency;the type, style, and brand consumed; factors that influence consumption (prize, packaging, place ofconsumption, etc.); sensory characteristics they appreciate the most in craft beers (aroma, flavor, color,taste, foam, etc.); and food pairing with beers. The preference was evaluated by the ranking preferencetest [22,23]. The test was carried out in individual cabins under white light. In each session, the beersamples were served at refrigeration temperature ranging from 6 ◦C to 8 ◦C. About 30 mL of each beerwas served in transparent, glass cups without assessors having prior knowledge regarding the brandof the beer being evaluated. The samples were served randomly at the same time, and the assessorswere requested to order the least preferred to the most preferred craft beers. The preference tests werecarried out in four different sessions with intervals of at least eight hours between sessions to avoidsensory fatigue of the consumers. The results were submitted to Friedman test at a significance level of5% after which the least significant difference value between the sums of the scores obtained with allanalyses was calculated.
For the QDA, the flavor attributes of Southern Brazilian craft beers were analyzed [22,23]. TheQDA was carried out by an experienced panel (n = 8) to outline the qualitative aspects of beers. Fifteenattributes, derived from literature, panelists perception, and from the attribute list used by the “beertaster association” [15], were included in the evaluation process. Seven of the attributes were relatedto flavor (malty, fruity aroma, floral notes, hoppy, phenolic aroma, smoked and yeast odor), twowere visual attributes (foam persistency and color), five were gustatory traits (overall intensity, sweet,bitter, alcoholic, residual flavor), and one concerned the texture (level of carbonation). Industrial beerswere used in pretesting panel-test sessions to let the assessors familiarize with the products underinvestigation and the related terminology. These sessions were also used to standardize the panel’sattribute definitions according to literature and the panelists’ perceptions.
The sensory attributes were assessed using an unstructured 9-point scale anchored at the leftend with “absent” and at the right end with “high”. The samples were identified with a code of threedifferent random digits, where each panelist received 50 mL of each beer sample, monadically andrandomly. In all sensory analysis sessions, the panelists received mineral water and dry unsaltedbreadsticks for palate cleansing between samples to avoid carry-over effects.
40
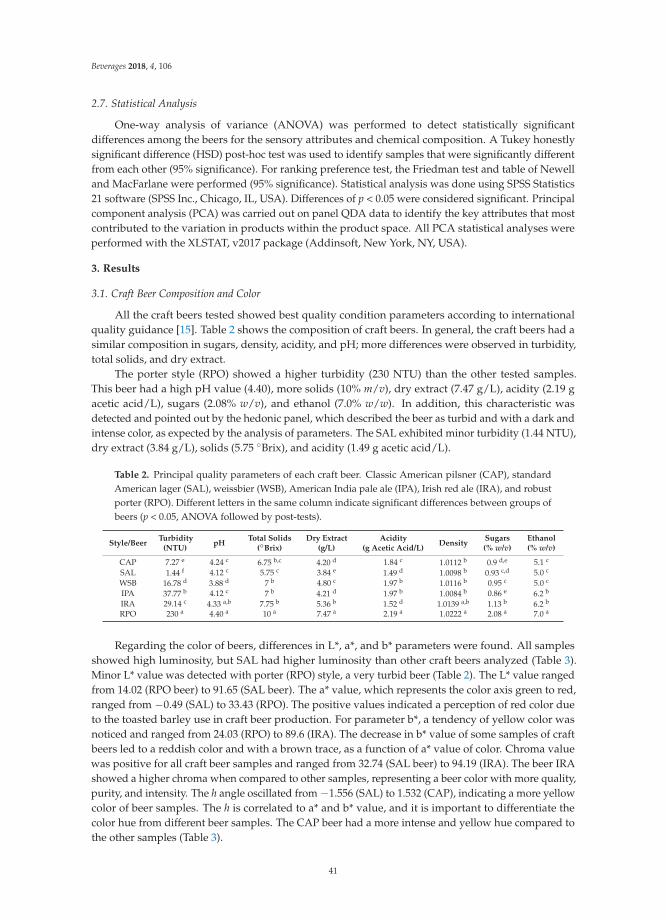
Beverages 2018, 4, 106
2.7. Statistical Analysis
One-way analysis of variance (ANOVA) was performed to detect statistically significantdifferences among the beers for the sensory attributes and chemical composition. A Tukey honestlysignificant difference (HSD) post-hoc test was used to identify samples that were significantly differentfrom each other (95% significance). For ranking preference test, the Friedman test and table of Newelland MacFarlane were performed (95% significance). Statistical analysis was done using SPSS Statistics21 software (SPSS Inc., Chicago, IL, USA). Differences of p < 0.05 were considered significant. Principalcomponent analysis (PCA) was carried out on panel QDA data to identify the key attributes that mostcontributed to the variation in products within the product space. All PCA statistical analyses wereperformed with the XLSTAT, v2017 package (Addinsoft, New York, NY, USA).
3. Results
3.1. Craft Beer Composition and Color
All the craft beers tested showed best quality condition parameters according to internationalquality guidance [15]. Table 2 shows the composition of craft beers. In general, the craft beers had asimilar composition in sugars, density, acidity, and pH; more differences were observed in turbidity,total solids, and dry extract.
The porter style (RPO) showed a higher turbidity (230 NTU) than the other tested samples.This beer had a high pH value (4.40), more solids (10% m/v), dry extract (7.47 g/L), acidity (2.19 gacetic acid/L), sugars (2.08% w/v), and ethanol (7.0% w/w). In addition, this characteristic wasdetected and pointed out by the hedonic panel, which described the beer as turbid and with a dark andintense color, as expected by the analysis of parameters. The SAL exhibited minor turbidity (1.44 NTU),dry extract (3.84 g/L), solids (5.75 ◦Brix), and acidity (1.49 g acetic acid/L).
Table 2. Principal quality parameters of each craft beer. Classic American pilsner (CAP), standardAmerican lager (SAL), weissbier (WSB), American India pale ale (IPA), Irish red ale (IRA), and robustporter (RPO). Different letters in the same column indicate significant differences between groups ofbeers (p < 0.05, ANOVA followed by post-tests).
Style/BeerTurbidity
(NTU)pH
Total Solids(◦Brix)
Dry Extract(g/L)
Acidity(g Acetic Acid/L)
DensitySugars(% w/v)
Ethanol(% w/v)
CAP 7.27 e 4.24 c 6.75 b,c 4.20 d 1.84 c 1.0112 b 0.9 d,e 5.1 c
SAL 1.44 f 4.12 c 5.75 c 3.84 e 1.49 d 1.0098 b 0.93 c,d 5.0 c
WSB 16.78 d 3.88 d 7 b 4.80 c 1.97 b 1.0116 b 0.95 c 5.0 c
IPA 37.77 b 4.12 c 7 b 4.21 d 1.97 b 1.0084 b 0.86 e 6.2 b
IRA 29.14 c 4.33 a,b 7.75 b 5.36 b 1.52 d 1.0139 a,b 1.13 b 6.2 b
RPO 230 a 4.40 a 10 a 7.47 a 2.19 a 1.0222 a 2.08 a 7.0 a
Regarding the color of beers, differences in L*, a*, and b* parameters were found. All samplesshowed high luminosity, but SAL had higher luminosity than other craft beers analyzed (Table 3).Minor L* value was detected with porter (RPO) style, a very turbid beer (Table 2). The L* value rangedfrom 14.02 (RPO beer) to 91.65 (SAL beer). The a* value, which represents the color axis green to red,ranged from −0.49 (SAL) to 33.43 (RPO). The positive values indicated a perception of red color dueto the toasted barley use in craft beer production. For parameter b*, a tendency of yellow color wasnoticed and ranged from 24.03 (RPO) to 89.6 (IRA). The decrease in b* value of some samples of craftbeers led to a reddish color and with a brown trace, as a function of a* value of color. Chroma valuewas positive for all craft beer samples and ranged from 32.74 (SAL beer) to 94.19 (IRA). The beer IRAshowed a higher chroma when compared to other samples, representing a beer color with more quality,purity, and intensity. The h angle oscillated from −1.556 (SAL) to 1.532 (CAP), indicating a more yellowcolor of beer samples. The h is correlated to a* and b* value, and it is important to differentiate thecolor hue from different beer samples. The CAP beer had a more intense and yellow hue compared tothe other samples (Table 3).
41

Beverages 2018, 4, 106
Table 3. Color parameters of craft beers. L* (luminosity), C* (chroma), h* (hue) and EBC (EuropeanBrewery Convention) units. Classic American pilsner (CAP), standard American lager (SAL), weissbier(WSB), American India pale ale (IPA), Irish red ale (IRA), and robust porter (RPO). Different letters inthe same column indicate significant differences between groups of beers (p < 0.05, ANOVA followedby post-tests).
Style/Beer L* a* b* C* h* EBC Units
CAP 87.21 c 1.82 d 47.39 c 47.43 c 1.532 a 13.37 d
SAL 91.65 a −0.49 f 32.73 e 32.74 e −1.556 e 7.50 e
WSB 89.90 b 1.01 e 40.87 d 40.89 d 1.546a 9.75 e
IPA 77.12 d 12.13 c 71.72 b 72.74 b 1.403 b 16.75 c
IRA 62.46 e 29.06 b 89.60 a 94.19 a 1.257 c 44.75 b
RPO 14.02 f 33.43 a 24.03 f 41.17 d 0.623 d 157.0 a
The color expressed in EBC units varied from 7.50 (SAL) to 157 (RPO). The beer with higherEBC index (RPO: 157) showed lower luminosity (14.02), and the least intense EBC color had moreluminosity (91.65).
3.2. Bitterness, Antioxidant Activity, and Polyphenols
The polyphenol content in beer is an important factor to analyze as it can improve the quality andacceptance of craft beers. Table 4 shows the content of polyphenols, antioxidant activity, and bitternessof each craft beer sample. The beers with higher level of polyphenols were RPO (1.62 mg EAG/mL),IRA (0.95 mg EAG/mL), and WSB (1.68 mg/EAL/mL). The SAL craft beer showed lower polyphenolscontent (0.35 mg EAG/L) compared with other samples. In Table 4, it can be seen that the beers thatpresented higher content of total polyphenols were also the ones with greater antioxidant activity.
The antioxidant activity was maximal (5.58 μmol Trolox/mL) with the weissbier beer (WSB)using the DPPH method. In general, the antioxidant activity of the tested beers varied from 1.74 μmolTrolox/mL (SAL) to 5.58 μmol Trolox/mL (WSB). The beer bitterness was maximal in IPA beer(46.15 EBU), and the lowest value of bitterness was 9.52 EBU (CAP) (Table 4). The bitterness EBC valuevaried depending on the content of bitter compounds and polyphenols in the beers. In this case, thecraft beer with higher content of total polyphenols did not show a higher bitterness value.
Table 4. Total polyphenols content, antioxidant activity (2,2-diphenyl-1-picrylhydrazyl (DPPH)method), and bitterness value of different craft beers. Classic American pilsner (CAP), standardAmerican lager (SAL), weissbier (WSB), American India pale ale (IPA), Irish red ale (IRA), and robustporter (RPO). Different letters in the same column indicate significant differences between groups ofbeers (p < 0.05, ANOVA followed by post-tests).
Style/Beer Total Polyphenols (mg EAG/mL) DPPH (μmol Trolox/mL) Bitterness (IBU)
CAP 0.61 d 3.24 b 9.52 f
SAL 0.35 e 1.74 e 11.57 e
WSB 1.68 a 5.58 a 12.55 d
IPA 0.8 c 2.30 c 46.15 a
IRA 0.95 b 2.05 d 33.45 b
RPO 1.62 a 3.14 b 24.72 c
3.3. Sensory Analysis of Beers
For the hedonic test of beers, 62 panelists were recruited to evaluate six different styles. This panelwas composed of 57.4% females and 42.6% males. The average consumer age was 32.09 ± 10.6 yearsold and ranged from 20 to 56 years old. Regarding the frequency of beer consumption, 81.5% of panelreported frequently drinking beer every day and only occasionally consuming it on a weekly basis.They also consumed both commercial and craft beer brands; the most consumed craft beers were localbeers, followed by the international brands of craft beers available.
42
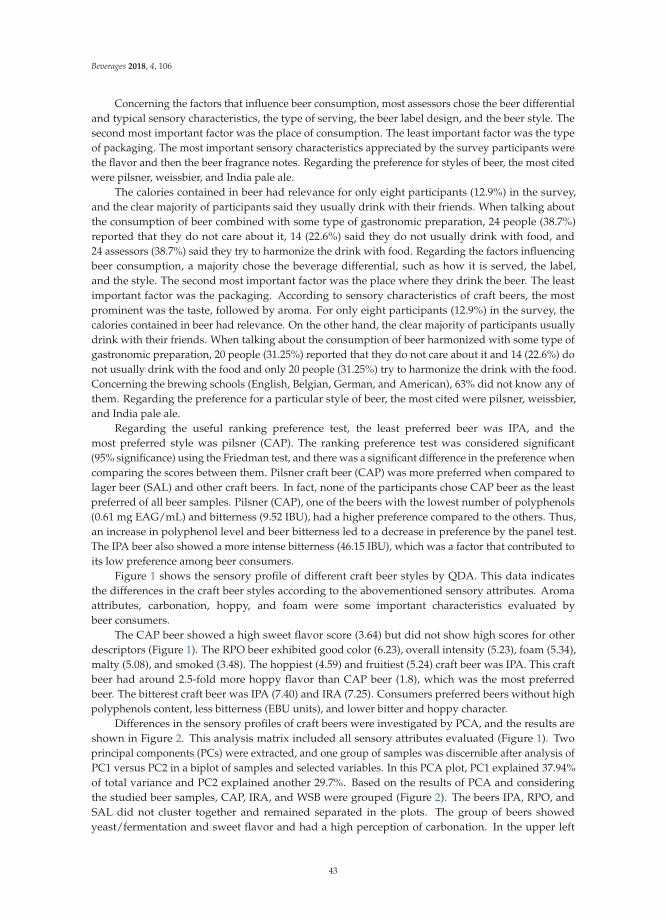
Beverages 2018, 4, 106
Concerning the factors that influence beer consumption, most assessors chose the beer differentialand typical sensory characteristics, the type of serving, the beer label design, and the beer style. Thesecond most important factor was the place of consumption. The least important factor was the typeof packaging. The most important sensory characteristics appreciated by the survey participants werethe flavor and then the beer fragrance notes. Regarding the preference for styles of beer, the most citedwere pilsner, weissbier, and India pale ale.
The calories contained in beer had relevance for only eight participants (12.9%) in the survey,and the clear majority of participants said they usually drink with their friends. When talking aboutthe consumption of beer combined with some type of gastronomic preparation, 24 people (38.7%)reported that they do not care about it, 14 (22.6%) said they do not usually drink with food, and24 assessors (38.7%) said they try to harmonize the drink with food. Regarding the factors influencingbeer consumption, a majority chose the beverage differential, such as how it is served, the label,and the style. The second most important factor was the place where they drink the beer. The leastimportant factor was the packaging. According to sensory characteristics of craft beers, the mostprominent was the taste, followed by aroma. For only eight participants (12.9%) in the survey, thecalories contained in beer had relevance. On the other hand, the clear majority of participants usuallydrink with their friends. When talking about the consumption of beer harmonized with some type ofgastronomic preparation, 20 people (31.25%) reported that they do not care about it and 14 (22.6%) donot usually drink with the food and only 20 people (31.25%) try to harmonize the drink with the food.Concerning the brewing schools (English, Belgian, German, and American), 63% did not know any ofthem. Regarding the preference for a particular style of beer, the most cited were pilsner, weissbier,and India pale ale.
Regarding the useful ranking preference test, the least preferred beer was IPA, and themost preferred style was pilsner (CAP). The ranking preference test was considered significant(95% significance) using the Friedman test, and there was a significant difference in the preference whencomparing the scores between them. Pilsner craft beer (CAP) was more preferred when compared tolager beer (SAL) and other craft beers. In fact, none of the participants chose CAP beer as the leastpreferred of all beer samples. Pilsner (CAP), one of the beers with the lowest number of polyphenols(0.61 mg EAG/mL) and bitterness (9.52 IBU), had a higher preference compared to the others. Thus,an increase in polyphenol level and beer bitterness led to a decrease in preference by the panel test.The IPA beer also showed a more intense bitterness (46.15 IBU), which was a factor that contributed toits low preference among beer consumers.
Figure 1 shows the sensory profile of different craft beer styles by QDA. This data indicatesthe differences in the craft beer styles according to the abovementioned sensory attributes. Aromaattributes, carbonation, hoppy, and foam were some important characteristics evaluated bybeer consumers.
The CAP beer showed a high sweet flavor score (3.64) but did not show high scores for otherdescriptors (Figure 1). The RPO beer exhibited good color (6.23), overall intensity (5.23), foam (5.34),malty (5.08), and smoked (3.48). The hoppiest (4.59) and fruitiest (5.24) craft beer was IPA. This craftbeer had around 2.5-fold more hoppy flavor than CAP beer (1.8), which was the most preferredbeer. The bitterest craft beer was IPA (7.40) and IRA (7.25). Consumers preferred beers without highpolyphenols content, less bitterness (EBU units), and lower bitter and hoppy character.
Differences in the sensory profiles of craft beers were investigated by PCA, and the results areshown in Figure 2. This analysis matrix included all sensory attributes evaluated (Figure 1). Twoprincipal components (PCs) were extracted, and one group of samples was discernible after analysis ofPC1 versus PC2 in a biplot of samples and selected variables. In this PCA plot, PC1 explained 37.94%of total variance and PC2 explained another 29.7%. Based on the results of PCA and consideringthe studied beer samples, CAP, IRA, and WSB were grouped (Figure 2). The beers IPA, RPO, andSAL did not cluster together and remained separated in the plots. The group of beers showedyeast/fermentation and sweet flavor and had a high perception of carbonation. In the upper left
43
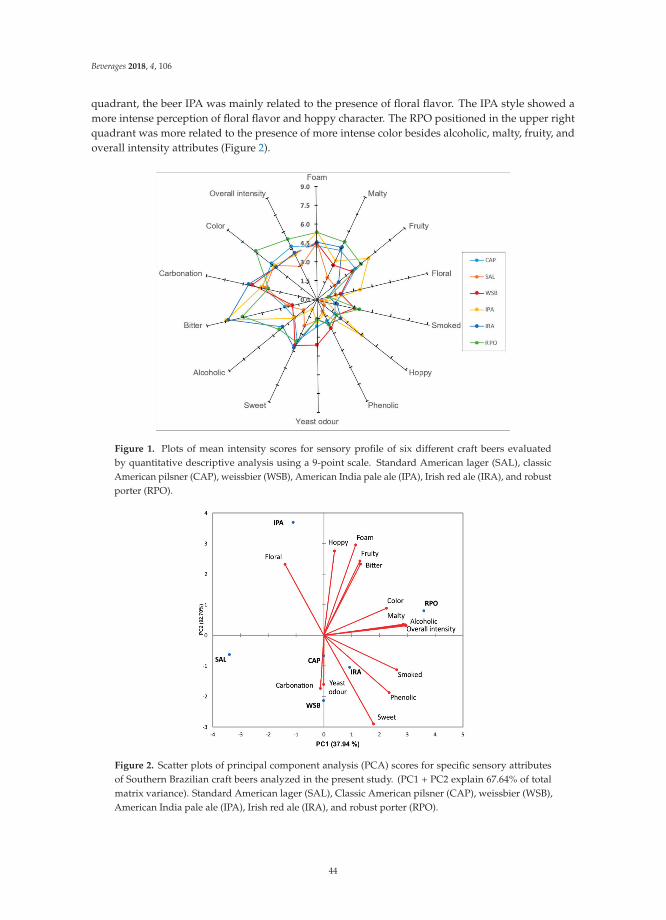
Beverages 2018, 4, 106
quadrant, the beer IPA was mainly related to the presence of floral flavor. The IPA style showed amore intense perception of floral flavor and hoppy character. The RPO positioned in the upper rightquadrant was more related to the presence of more intense color besides alcoholic, malty, fruity, andoverall intensity attributes (Figure 2).
Figure 1. Plots of mean intensity scores for sensory profile of six different craft beers evaluatedby quantitative descriptive analysis using a 9-point scale. Standard American lager (SAL), classicAmerican pilsner (CAP), weissbier (WSB), American India pale ale (IPA), Irish red ale (IRA), and robustporter (RPO).
Figure 2. Scatter plots of principal component analysis (PCA) scores for specific sensory attributesof Southern Brazilian craft beers analyzed in the present study. (PC1 + PC2 explain 67.64% of totalmatrix variance). Standard American lager (SAL), Classic American pilsner (CAP), weissbier (WSB),American India pale ale (IPA), Irish red ale (IRA), and robust porter (RPO).
44
Beverages 2018, 4, 106
4. Discussion
Beer is a very complex mixture, and its chemical composition varies considerably [24], as shownin Table 2. To bring more light into the differences found in craft beer consumption, the objective of thiswork was to explore the impact of polyphenol content and bitterness of Southern Brazilian craft beerson consumer preference. As craft beers have different flavors, aromas, etc. than the usual well-knowncommercial brands, their preference is increasing among consumers [13].
These differences in craft beer flavors come from the ingredients used as well as the brewingprocess [16]. The yeast strains used have a key impact on the final craft beer quality, either in the aromacompound production or in the interaction of some beer components, such as polyphenols [4]. Whileseveral yeast strains are commercially accessible, the availability of new starter strains could be animportant differentiating factor among craft beers produced in different microbreweries [25]. The mainingredients used in beer production are barley, hops, water, and yeast [26], with each ingredientplaying a crucial role in the quality and composition of beers. The porter style beer, for example,is characterized as a substantial, malty dark beer with a complex and flavorful dark malt character [15].This beer showed high scores in composition parameters compared to other beers tested in this study.Nevertheless, in general, the tested craft beers were similar in analytical factors to the styles describedin the BJCP guide [15].
In addition, craft beers have distinctive and pleasant flavor characteristics, and these attributesare easily perceived by consumers [27]. Today, consumer preferences appear to be connected to thediscovery of new beer flavors [13], which can increase the consumption of craft beers. Brazilianconsumers have followed the same trend as they search for beers with high sensorial quality anddifferentiated and characteristic flavor and aroma, as verified in this study. The main factor that affectsBrazilian beer consumers is the sensory attributes, as pointed out by other studies [13,27,28]. Themost preferred craft beer in our study was the CAP style, which mainly shows a fruity and sweetnote. Additionally, consumers have a predilection to drink with friends and consider the flavor andfragrances of beer.
It must be noted, however, that this study had some limitations, in particular the few numberof craft beer samples that were evaluated for each style of beer. Even so, the sensory attributesand craft beer styles selected in this study for their consumer relevance spanned a wide range ofbeer characteristics.
Moreover, studying consumer behavior can have great value for the beer industry as it can showhow consumers represent the beer category, the associations linked to them, and the proximityacross different types of beer [27]. In addition, studies about consumer preferences can assistbrewers to understand consumer attitude and translate consumer needs, wants, and expectationsinto manufacturing design to produce the best, most cost-competitive, and widely accepted productpossible in a relatively short period [29].
Beers are rich in polyphenols, which are mostly acquired from barley and hop [8], and theywere found in the six styles of beers evaluated in this study. For example, xanthohumol is the mostcommon phenol in hop [30]. Investigating the Brazilian beers, we found that the contents of phenoliccompounds, as well as the antioxidant capacity, were like those of beers produced elsewhere in theworld [2]. Polyphenols are already extracted in the initial phase of the fermentation process, i.e., duringthe wort production [9]. This study showed that polyphenols, especially the bitterness associated withit, have an important relationship with the preference of different beers among Brazilian consumers.The most preferred beer showed the lowest bitterness (Table 4, Figure 1) of all styles tested and thesecond lowest level of polyphenols (0.61 mg EAG/mL). This same relationship with bitterness wasverified when analyzing consumer acceptance of craft beers and commercial brands in the Brazilianmarket [31]. Understanding the sensory characteristic of bitterness in beers and how that relates totheir content of polyphenols has a significant value for understanding consumer response as well asoptimizing production processes [8].
45

Beverages 2018, 4, 106
The malt kilning process determines the color parameter, and it is quite an important processas it can improve the acceptance of beers [26]. The luminosity (L* value) also has a great importancebecause beers with higher L* value (high luminosity) show a more vivid and intense color [19]. Thelager beers show high L* values [19].The darker and more turbid beers show big scores in fruity,floral, and malty flavors, but they still have a low preference among consumers. Beer appearanceprovides substantial opportunities for product differentiation, and even beers of the same type havethe potential to deliver on rather different usage contexts [32].
The most popular beer style in Brazil is the Germany-style pilsner, which is very light andclear [31]. This beer style is very common in the Brazilian market and has a great familiarity toconsumers. Familiar beers would be more often cited as appropriate in most of usage contexts, andthat familiar and novel products would be associated with different usage contexts [32]. Consumersperceive familiar beers to be more interesting and tasty [32], which can increase their preference,as verified in this study. The preference order obtained from this study came from the sensoryproprieties perceived by non-trained assessors because the beer samples were analyzed at the sametime and were not assigned different styles.
From the sensory characterization of Brazilian beer styles, it is possible to attest that the evaluatedconsumers could differentiate and prefer the most aromatic and fruity beers. In addition, this distinctcharacter is a motivation to choose and buy craft beers instead of other beer brands [29]. In thiscontext, the use of S. cerevisiae strains isolated from food matrices can represent a valid approach forthe selection of starters for brewing to obtain craft beers with more complex flavors [25]. A studywith Italian consumers found similar preference to beers brewed from moderately kilned/roastedmalts with a milder flavor and less intense mouthfeel perceptions [28]. More complex craft beers withremarkably increased flavors would lead to an improvement of consumer preference [29].
The IPA was the lowest preferred beer and showed a higher level of bitterness attributeperception by the panel test. According to international definitions, the IPA style is a hop-forward,bitter, dryish beer with good drinkability. However, the excessive harshness and heaviness of IPAare typical faults that result from the strong flavor clashes between the hops and other specialtyingredients [15]. Furthermore, IPA beer was differentiated by PCA (Figure 2) from other styles becauseof its characteristic floral note.
Bitterness is a very important quality parameter in beer production [16]. Nearly four out of tenconsumers report that they highly appreciate sweet and fruity samples but dislike primarily bitter,burnt, and roasted notes and hoppy resinousness of beer [28]. The bitter foods are generally dislikeddue to the instinctive rejection of the bitter taste [33]. Variations in liking and the willingness toconsume bitter foods can be triggered by motivational states in humans [33]. In this study, the beerwith the lowest bitterness had a higher preference among consumers. This shows bitterness is a keyfactor that influences beer preference and leads to a decline in consumer preference.
5. Conclusions
In this study, we found that the polyphenol content and bitterness determine the preference ofcraft beers among Southern Brazilian as consumers can perceive their complex sensory attributes.The research also showed the influence of polyphenols in terms of consumer preference as beers withless polyphenol content and bitterness (CAP beer) were more preferred than other craft beer types.Brazilian craft beers with high antioxidant activity, polyphenols, and bitterness were the porter style(RPO), red ale (IRA) and India pale ale (IPA). The craft beers showed complex aromatic notes andflavors, which were described as floral, fruity, yeast, and malty. There were, however, some limitationsin this study as it was only exploratory. Therefore, additional work with a larger craft beer sample thatis representative of Brazilian craft beers is needed to strengthen our conclusion.
Considering these study findings, it is possible to describe some craft beers and point to theadverse effect of polyphenols and bitterness on consumer preferences. These preliminary results will
46
Beverages 2018, 4, 106
be important in stimulating the production of more appreciable craft beers for Southern Brazilianconsumers who want to improve their drinking experience and hedonic aspects.
Author Contributions: Study conception and design: All; Acquisition of data: C.d.C.J., D.d.S. and L.M.N.P.;Analysis and interpretation of data: All; Drafting of manuscript: C.d.C.J., R.C.d.S.R. and J.G.
Funding: This research was funded by Financiadora de Estudos e Projetos (FINEP) of the Brazilian Government,grant number 0110051002. Additional support was provided by Institute of Technology in Food for Health,University of Vale do Rio dos Sinos.
Acknowledgments: The authors thank the Financiadora de Estudos e Projetos (FINEP) of the BrazilianGovernment for financial support.
Conflicts of Interest: The authors declare no conflict of interest.
References
1. Gaetano, G.; Costanzo, S.; Di Castelnuovo, A.; Badimon, L.; Bejko, D.; Alkerwi, A.; Chiva-Blanch, G.;Estruch, R.; La Vecchia, C.; Panico, S.; et al. Effect of moderate beer consumption on health and disease: Aconsensus document. Nutr. Metab. Cardiovas. 2016, 26, 443–467. [CrossRef] [PubMed]
2. Moura-Nunes, N.; Brito, T.C.; Fonseca, N.D.; de Aguiar, P.F.; Monteiro, M.; Perrone, D.; Torres, A.G. Phenoliccompounds of Brazilian beers from different types and styles and application of chemometrics for modelingantioxidant capacity. Food Chem. 2016, 199, 105–113. [CrossRef] [PubMed]
3. Capece, A.; Romaniello, R.; Pietrafesa, A.; Siesto, G.; Pietrafesa, R.; Zambuto, M.; Romano, P. Use ofSaccharomyces cerevisiae var. boulardii in co-fermentations with S. cerevisiae for the production of craft beerswith potential healthy value-added. Int. J. Food Microbiol. 2018, 284, 22–30. [CrossRef]
4. Budroni, M.; Zara, G.; Ciani, M.; Comitini, F. Saccharomyces and Non-Saccharomyces Starter Yeasts. In BrewingTechnology; Kanauchi, M., Ed.; Intechopen: London, UK, 2017; pp. 81–100.
5. Gómez-Corona, C.; Lelievre-Desmas, M.; Buendía, H.E.B.; Chollet, S.; Valentin, D. Craft beer representationamongst men in two different cultures. Food Qual. Preferences 2016, 53, 19–28. [CrossRef]
6. Estela-Escalante, W.D.; Rosales-Mendoza, S.; Moscosa-Santillán, M.; González-Ramírez, J.E. Evaluation ofthe fermentative potential of Candida zemplinina yeasts for craft beer fermentation. J. Inst. Brew. 2016, 122,530–535. [CrossRef]
7. Giacalone, D.; Ribeiro, L.M.; Frost, M.B. Perception and description of premium beers by panels withdifferent degrees of product expertise. Beverages 2016, 2, 5. [CrossRef]
8. Oladokun, O.; Tarrega, A.; James, S.; Smart, K.; Hort, J.; Cook, D. The impact of hop bitter acid andpolyphenol profiles on the perceived bitterness of beer. Food Chem. 2016, 205, 212–220. [CrossRef] [PubMed]
9. Juric, A.; Coric, N.; Odak, A.; Herceg, Z.; Tisma, M. Analysis of total polyphenols, bitterness and haze inpale and dark lager beers produced under different mashing and boiling conditions. J. Inst. Brew. 2015, 121,541–547. [CrossRef]
10. Piazzon, A.; Forte, M.; Nardini, M. Characterization of phenolics content and antioxidant activity of differentbeer types. J. Agric. Food Chem. 2010, 58, 10677–10683. [CrossRef]
11. Zhao, H.; Li, H.; Sun, G.; Yang, B.; Zhao, M. Assessment of endogenous antioxidative compounds andantioxidant activities of lager beers. J. Sci. Food Agric. 2013, 93, 910–917. [CrossRef]
12. Quifer-Rada, P.; Vallverdú-Queralt, A.; Martínez-Huélamo, M.; Chiva-Blanch, G.; Jáuregui, O.; Estruch, R.;Lamuela-Raventós, R. A comprehensive characterisation of beer polyphenols by high-resolution massspectrometry (LC-ESI-LTQ-Orbitrap-MS). Food Chem. 2015, 169, 336–343. [CrossRef] [PubMed]
13. Aquilani, B.; Laureti, T.; Poponi, S.; Secondi, L. Beer choice and consumption determinants when craft beersare tasted: An exploratory study of consumer preferences. Food Qual. Preferencs 2015, 41, 214–224. [CrossRef]
14. Ferreira, R.H.; Vasconcelos, R.L.; Judice, V.M.M.; Neves, J.T.R. Inovação na fabricação de cervejas especiaisna região de Belo Horizonte. Perspect. Ciênc. Inf. 2011, 16, 171–191. [CrossRef]
15. Beer Judge Certification Program (BJCP). 2015 Style Guidelines: Beer Style Guidelines. 2015. Availableonline: https://www.bjcp.org/docs/2015_Guidelines_Beer.pdf (accessed on 8 November 2018).
16. Popescu, V.; Soceanu, A.; Dobrinas, S.; Stanicu, G. A study of beer bitterness loss during the various stagesof the Romanian beer production process. J. Inst. Brew. 2013, 119, 111–115. [CrossRef]
47
Beverages 2018, 4, 106
17. Miller, G.L. Use of dinitrosalicylic acid reagent for determination of reducing sugar. Anal. Chem. 1959, 31,426–428. [CrossRef]
18. Mamede, M.; Monica, S.; Maria, J.; Cruz, J.; Oliveira, L. Avaliação sensorial e colorimétrica de néctar de uva.Braz. J. Food Nutr. 2013, 24, 65–72.
19. Smedley, S.M. Discrimination between beers with small colour differences using the CIELAB colour space.J. Inst. Brew. 1995, 1, 195–201. [CrossRef]
20. Meda, A.; Lamien, C.; Romito, M.; Millogo, J.; Nacoulma, O. Determination of the total phenolic, flavonoidand proline contents in Burkina Fasan honey, as well as their radical scavenging activity. Food Chem. 2005,91, 571–577. [CrossRef]
21. Brand-Williams, W.; Cuvelier, M.E.; Berset, C. Use of a free radical method to evaluate antioxidant activity.Food Sci.Technol. 1995, 28, 25–30. [CrossRef]
22. Dutcosky, S.D. Análise Sensorial de Alimentos, 3rd ed.; Editora Champagnat: Curitiba, Brazil, 2013; Chapter 4;p. 356.
23. Lawless, H.T.; Heymann, H. Sensory Evaluation of Food: Principles and Practices, 2nd ed.; Springer: New York,NY, USA, 2010; Chapter 4, p. 596.
24. Silva, G.C.; Abner, A.S.; Silva, L.S.N.; Godoy, R.L.O.; Nogueira, L.C.; Quitério, S.L.; Raices, R.S.L. Methoddevelopment by GC–ECD and HS-SPME–GC–MS for beer volatile analysis. Food Chem. 2015, 167, 71–77.[CrossRef]
25. Marongiu, A.; Zara, G.; Legras, J.; Del Caro, A.; Mascia, I.; Fadda, C.; Budroni, M. Novel starters for oldprocesses: Use of Saccharomyces cerevisiae strains isolated from artisanal sourdough for craft beer productionat a brewery scale. J. Ind. Microbiol. Biotechnol. 2015, 42, 85–92. [CrossRef] [PubMed]
26. Han, H.; Kim, J.; Choi, E.; Ahn, E.; Kim, W.J. Characteristics of beer produced from Korean six-row barleywith the addition of adjuncts. J. Inst. Brew. 2016, 122, 500–507. [CrossRef]
27. Gómez-Corona, C.; Valentin, D.; Escalona-Buendía, H.B.; Chollet, S. The role of gender and productconsumption in the mental representation of industrial and craft beers: An exploratory study with Mexicanconsumers. Food Qual. Preferences 2017, 60, 31–39. [CrossRef]
28. Donadini, G.; Fumi, M.D.; Newby-Clark, I.R. Consumer’s preference and sensory profile of bottom fermentedred beers of the Italian market. Food Res. Int. 2014, 58, 69–80. [CrossRef]
29. Donadini, G.; Porretta, S. Uncovering patterns of consumers’ interest for beer: A case study with craft beers.Food Res. Int. 2017, 91, 183–198. [CrossRef] [PubMed]
30. Stevens, J.F.; Page, J.E. Xanthohumol and related prenylflavonoids from hops and beer: To your good health!Phytochemistry 2004, 65, 1317–1330. [CrossRef]
31. Araújo, F.B.; Silva, P.H.A.; Minim, V.P.R. Perfil sensorial e composição físico-química de cervejas provenientesde dois segmentos do mercado brasileiro. Food Sci. Technol. 2003, 23, 121–128. [CrossRef]
32. Giacalone, D.; Frost, M.B.; Bredie, W.L.P.; Pineau, B.; Hunter, D.C.; Paisley, A.G.; Beresford, M.K.; Jaeger, S.R.Situational appropriateness of beer is influenced by product familiarity. Food Qual. Preferences 2015, 39, 16–27.[CrossRef]
33. Garcia-Burgos, D.; Zamora, M.C. Exploring the hedonic and incentive properties in preferences for bitterfoods via self-reports, facial expressions and instrumental behaviours. Food Qual. Preferences 2015, 39, 73–81.[CrossRef]
© 2018 by the authors. Licensee MDPI, Basel, Switzerland. This article is an open accessarticle distributed under the terms and conditions of the Creative Commons Attribution(CC BY) license (http://creativecommons.org/licenses/by/4.0/).
48
beverages
Article
A Comparative Study of Dry and Wet Milling ofBarley Malt and Its Influence on Granulometry andWort Composition
Felipe Pereira de Moura and Thiago Rocha dos Santos Mathias *
Laboratory of Fermentation Technology, Federal Institute of Education, Science and Technology of Rio de Janeiro,Rio de Janeiro 20270-021, Brazil; [email protected]* Correspondence: [email protected]; Tel.: +55-21-2566-7772
Received: 5 June 2018; Accepted: 19 July 2018; Published: 20 July 2018
Abstract: Beer is a fermented drink produced from a wort comprised of barley malt, hops, andwater in combination with activity from the yeast strains of the genus Saccharomyces. The beverage isconsumed around the world and has a global market controlled by several multinational companies.However, in recent years, it has been possible to note an increase in the number of microbreweriesand homebrewers, necessitating additional research both to develop and increase competitiveness ofthis market sector as well as to improve product quality and promote the reduction of productioncosts. The process of milling barley malt is often not considered relevant to these goals; however, thisoperation is influential with regard to, for example, mashing yield, the concentration of polyphenolsin beer, and the quality of wort clarification. Therefore, this work evaluates the wet (10%, 20%, 30%,40%, and 50% moisture content) and dry barley malt milling process as well as analyzes particle sizedistribution and the mean diameter of particles. The milled grains were submitted to a mashingprocess to evaluate how particle size contributes to the conversion of starch to sugars and theavailability of polyphenols on sweet wort. The results indicate the best milling conditions to obtain agood mashing yield while preserving as much malt husk as possible to facilitate wort clarification.
Keywords: barley milling; wet milling; brewing technology; granulometry; beer wort
1. Introduction
Beer is produced by the alcoholic fermentation of wort, which is prepared with barley malt andwater, hop addition, and yeast action (Saccharomyces genus) [1,2]. The process can be divided intothe following steps: malting, milling, mashing, boiling, cooling, fermentation, filtration, carbonation,microbiological stabilization, and packaging.
Milling has an important role in the process both in the professional beverage industry andin homebrew production because, in this step, the barley husk breaks down, exposing the starchyendosperm and the content of the embryo (predominantly enzymatic) [3,4]. If the grains are notproperly milled, this will influence the rest of the brewing process, notably the wort composition.The presence of intact grains or large fragments result in non-exposure of internal grain fractions,promoting low conversion of starch to fermentable sugars and, consequently, low final yields of themashing stage [5]. On the other hand, excessive milling promotes the extraction and solubilizationof compounds whose presence causes the increase of undesirable characteristics to wort and beer,e.g., sensory properties such as an excessive bitterness or viscosity. Undesirable compounds includephenolic compounds, which, if present in large quantities, cause problems such as excessive bitterness,color changes, and excessive formation of trub [6,7]. Approximately 70–80% of the total polyphenolcontent of beer comes from the malt husk; its transfer to the wort is influenced by cereal milling [8].The preservation of grain husk integrity also plays an important role in the formation of the filter cake
Beverages 2018, 4, 51; doi:10.3390/beverages4030051 www.mdpi.com/journal/beverages49

Beverages 2018, 4, 51
in the clarification stage of sweet wort [5]. The more intact the husks, the easier and more efficient theclarification step will be.
The milling step can be conducted in either dry or wet form [9]. Dry milling increases graincomminution, which increases the yield of the brewer wort production; however, dry milling canmake wort clarification more difficult [4]. Wet milling occurs in the presence of excess water (up to45%) and promotes greater grain elasticity. Generally, wet milling is used to obtain advantages suchas reduction of energy expenditures, elimination of dust (particulate material), transport facilitation,and the reduction of damage to mills (increased durability) [4,10]. However, wet milling can lead toproblems, such as greater adhesion of starchy semolina on husk fraction, decreasing the yield. In thecase of malt milling, another advantage of wet operation is that the moisture makes the husk moreresistant and flexible, which reduces the probability of breakage [2,11,12].
Dry milling is most frequently used by the brewing industry; however, wet milling has recentlybecome another popular method. Currently, wet milling is used industrially for corn and wheat,but it could also be successfully applied to other cereals, such as sorghum, barley, oats, or rice [13].Wet milling is very common in Africa and Asia but not, for example, in the United States [14] or Brazil.When using non-malted barley as an adjunct to the brewing process, wet milling is the most indicateddue to the toughness of this grain [15].
In this context, the objective of this work was to compare the milling process of malt grains withdifferent moisture content to evaluate parameters such as final grain size, availability of starch forconversion to fermentable sugars, and overall content of phenolic compounds. Accordingly, it willbe possible to stipulate the best conditions for the milling of barley grains to optimize the brewingprocess with regard to the mashing yield and the quality of the sweet wort.
2. Materials and Methods
2.1. Materials
Pilsen malt (Agrária®, Paraná, Brazil) was used because it is the base malt for most beerformulations. The malt grain, provided in dry form by the producer (<5%), was obtained in 5 kg sacksand kept dry and sealed throughout the development of the work. The malt specifications were asfollows: extract of fine milling (81.5%), diastatic power (292 WK), and protein (11%).
The water used for grain humidification and mashing was potable water from the state’s supplysystem (CEDAE, Rio de Janeiro, Brazil). It was filtered on activated charcoal to remove the free chlorineions, which result from its chemical treatment.
2.2. Humidification Limit
The water saturation limit was defined to establish the highest moisture percentage used in grainmilling. Water was added to a small amount of malt grains (50 g) and the water saturation limit wasstipulated as the concentration in which the water was no longer absorbed by the grain and remainedat the Becher bottom. This analysis was strictly visual, and the procedure was executed in ambientconditions (25 ◦C) with constant manual homogenization.
2.3. Milling and Granulometric Analysis
After determining the maximum water absorbed by the grains (Item 2.2), six samples with 50 gof barley malt were prepared in quadruplicate. One sample was kept dry (sample A) and the otherswere humidified in consideration of the results of the previous analysis, resulting in five sampleswith the following relation of water/grain: 10%, 20%, 30%, 40%, and 50% (samples B, C, D, E, and F,respectively).
The dry and wet samples were milled in duplicate in cereal disc mill (Guzzo®, Rio Grande doSul, Brazil), adjusted to 1.0 mm disk spacing. The wet samples were collected and dried in oven at40 ◦C until constant mass to avoid contamination and to allow particle size analysis. A mechanical
50

Beverages 2018, 4, 51
agitator and sequential sieves (SOLOTEST®, Rio de Janeiro, Brazil), with meshes of 2.00 (sieve 1),1.84 (2), 1.54 (3), 1.20 (4), 0.86 (5), 0.51 (6), and 0.30 mm (7) were used to perform the granulometricanalysis [16] of the grains after milling. Previously, the initial quantities were weighed and the massesretained on each sieve were determined as well as the fraction inferior to 0.30 mm, which allowed for acalculation of their respective fractions and to determine the granulometric profile. The mean diameterwas calculated from the Sauter mean diameter equation (Equation (1)).
dp =1
∑ xidpi
(1)
where:
dp = Sauter mean diameterXi = mass fraction in sieve idpi = particle diameter in sieve i
These results were expressed in bar graphs with particle size distribution profiles and the meandiameter was present with respective deviation. In addition, a linear correlation graph between meandiameter and moisture content for milling was obtained.
2.4. Extraction of Soluble Material and Mashing Milled Grains
Milled grains from each of the six different moisture conditions (dry, 10%, 20%, 30%, 40%, and 50%moisture) were submitted to water-soluble material analysis by simple extraction. For this analysis,the milled grain was washed with excess water (400 mL) at ambient conditions (25 ◦C) and underwentsimple homogenization for 30 min. These samples are called “soluble fraction”.
The remaining milled samples of each moisture condition (dry, 10%, 20%, 30%, 40%, and 50%moisture) was reserved for the mashing procedure, following compilation data from the brewingprocess literature: addition of water (2:1, water to malt ratio) and conduction of the following mashprofile curve: 35 ◦C/10 min (solubilization step), 45 ◦C/15 min (proteolytic step), 55 ◦C/15 min(proteolytic step), 66 ◦C/40 min (β-amylase step), 72 ◦C/5 min (α-amylase step), and 78 ◦C/5 min(inactivation step) [1,3,17,18]. These samples were called “sweet wort”.
2.5. Analytical Determinations
Subsequently, all “soluble fraction” and “sweet wort” samples obtained in the previous Item(Item 2.3) were centrifuged at 3500 RPM for 3 min under controlled temperature (4 ◦C) (FANEM®,model 280R, Rio de Janeiro, Brazil). Soluble fractions and sweet worts produced were analyzedby determination of ◦Plato (by refractometry) [16,19], total reduction of sugar content (by DNSmethod) [20] and total phenolic compounds content (by Follin–Ciocalteu method) [20], as describedbelow. The chemical analyzes were performed in triplicate and the standard deviation calculated.
For the DNS method, diluted samples were submitted to reaction with DNS reagent(100 ◦C/10 min) and the resulting product had its absorbance read at 540 nm (BioChrom®, model LibraS-21, Cambridge, UK). The reduced sugar concentration was calculated using a glucose standardcurve. For the Follin–Ciocalteu method, diluted samples were reacted with Follin reagent (0.2 N),and Na2CO3 4% (50 ◦C/20 min) and the resulting product had its absorbance read at 740 nm(BioChrom®, model Libra S-21, Cambridge, UK). The total phenolic compounds content was calculatedin gallic acid equivalents using a standard curve.
The variation of the parameters before and after mashing was calculated by simple subtracting ofthe obtained values and was named Δ (delta).
51
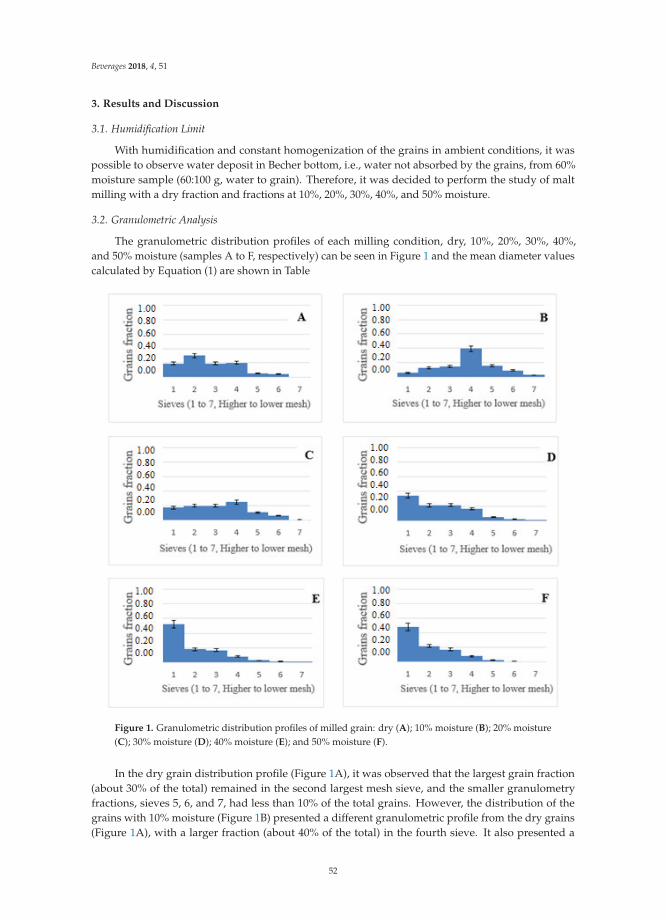
Beverages 2018, 4, 51
3. Results and Discussion
3.1. Humidification Limit
With humidification and constant homogenization of the grains in ambient conditions, it waspossible to observe water deposit in Becher bottom, i.e., water not absorbed by the grains, from 60%moisture sample (60:100 g, water to grain). Therefore, it was decided to perform the study of maltmilling with a dry fraction and fractions at 10%, 20%, 30%, 40%, and 50% moisture.
3.2. Granulometric Analysis
The granulometric distribution profiles of each milling condition, dry, 10%, 20%, 30%, 40%,and 50% moisture (samples A to F, respectively) can be seen in Figure 1 and the mean diameter valuescalculated by Equation (1) are shown in Table
Figure 1. Granulometric distribution profiles of milled grain: dry (A); 10% moisture (B); 20% moisture(C); 30% moisture (D); 40% moisture (E); and 50% moisture (F).
In the dry grain distribution profile (Figure 1A), it was observed that the largest grain fraction(about 30% of the total) remained in the second largest mesh sieve, and the smaller granulometryfractions, sieves 5, 6, and 7, had less than 10% of the total grains. However, the distribution of thegrains with 10% moisture (Figure 1B) presented a different granulometric profile from the dry grains(Figure 1A), with a larger fraction (about 40% of the total) in the fourth sieve. It also presented a
52

Beverages 2018, 4, 51
considerable increase in the mass of particles in the smaller sieves, which determined a reduction in itsmean granulometry, as observed by the calculation of the mean diameter (Table 1).
Table 1. Sauter mean diameter (mm) and deviation for each moisture (%) milling condition.
Sample Moisture Mean Diameter (mm) *
A 0% (dry) 1.35 ± 0.15B 10% 1.02 ± 0.20
C 20% 1.24 ± 0.16D 30% 1.50 ± 0.13E 40% 1.66 ± 0.12F 50% 1.66 ± 0.13
* Calculated by Equation (1).
For the samples in the moisture range between 20% and 40% (Figure 1C–F), an increase tendencyof accumulated grains in larger sieves was observed. Consequently, the mean diameter of the grainsalso increased (Table 1). The grain sample with 20% moisture (Figure 1C) showed this tendency,but the largest grain fraction was accumulated in sieve 4, similar to the 10% moisture sample (Figure 1B).For the 30% and 40% moisture (Figure 1D,E), respectively, the largest grain fraction was accumulatedin sieve 1.
When the grains with 50% moisture were milled (Figure 1F), the tendency for an increase ingrain size was interrupted, and the mean diameter was the same as in the previous sample, with 40%moisture (Table 1). This fact corroborates the hypothesis of water saturation by the grains observed inthe previous analysis.
From the calculated mean diameters, the relationship between the mean diameter and the moisturecontent of the grains was estimated by simple linear regression of the points, excluding the dry andthe 50% moisture samples. The results can be seen in Figure 2.
Figure 2. Correlation graph of moisture content (%) for milling with mean grain diameter.
Figure 2 shows a good linear regression (R2 = 0.9907) for the tendency for an increase in meangrain diameter with increasing moisture content between 10% and 40% moisture. The dry samplealso had a superior diameter to the samples with 10% and 20% moisture and inferior to the others.The reduction of the granulometry in the 10% moisture sample when compared to dry sample may
53
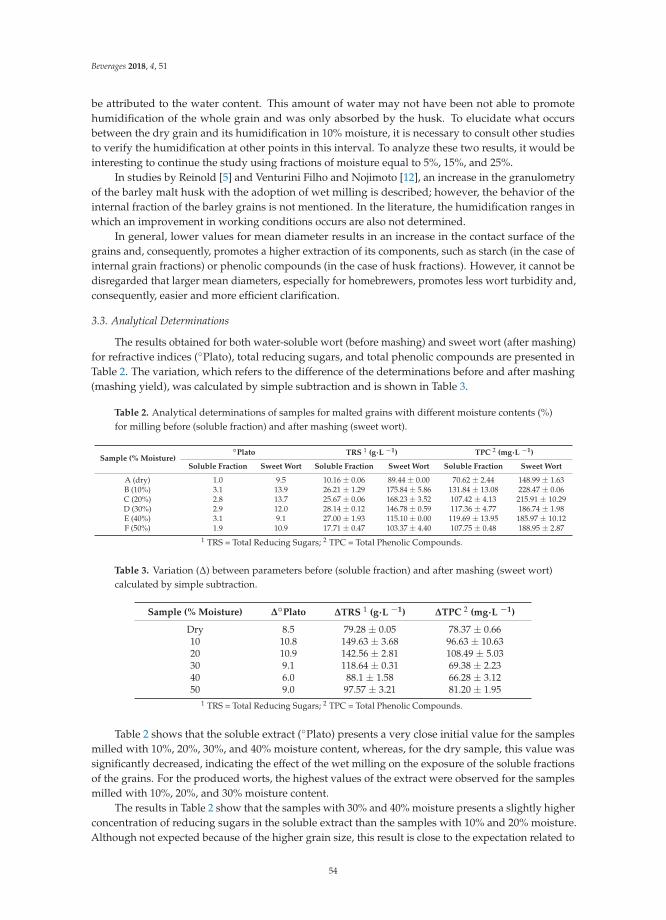
Beverages 2018, 4, 51
be attributed to the water content. This amount of water may not have been not able to promotehumidification of the whole grain and was only absorbed by the husk. To elucidate what occursbetween the dry grain and its humidification in 10% moisture, it is necessary to consult other studiesto verify the humidification at other points in this interval. To analyze these two results, it would beinteresting to continue the study using fractions of moisture equal to 5%, 15%, and 25%.
In studies by Reinold [5] and Venturini Filho and Nojimoto [12], an increase in the granulometryof the barley malt husk with the adoption of wet milling is described; however, the behavior of theinternal fraction of the barley grains is not mentioned. In the literature, the humidification ranges inwhich an improvement in working conditions occurs are also not determined.
In general, lower values for mean diameter results in an increase in the contact surface of thegrains and, consequently, promotes a higher extraction of its components, such as starch (in the case ofinternal grain fractions) or phenolic compounds (in the case of husk fractions). However, it cannot bedisregarded that larger mean diameters, especially for homebrewers, promotes less wort turbidity and,consequently, easier and more efficient clarification.
3.3. Analytical Determinations
The results obtained for both water-soluble wort (before mashing) and sweet wort (after mashing)for refractive indices (◦Plato), total reducing sugars, and total phenolic compounds are presented inTable 2. The variation, which refers to the difference of the determinations before and after mashing(mashing yield), was calculated by simple subtraction and is shown in Table 3.
Table 2. Analytical determinations of samples for malted grains with different moisture contents (%)for milling before (soluble fraction) and after mashing (sweet wort).
Sample (% Moisture)◦Plato TRS 1 (g·L −1) TPC 2 (mg·L −1)
Soluble Fraction Sweet Wort Soluble Fraction Sweet Wort Soluble Fraction Sweet Wort
A (dry) 1.0 9.5 10.16 ± 0.06 89.44 ± 0.00 70.62 ± 2.44 148.99 ± 1.63B (10%) 3.1 13.9 26.21 ± 1.29 175.84 ± 5.86 131.84 ± 13.08 228.47 ± 0.06C (20%) 2.8 13.7 25.67 ± 0.06 168.23 ± 3.52 107.42 ± 4.13 215.91 ± 10.29D (30%) 2.9 12.0 28.14 ± 0.12 146.78 ± 0.59 117.36 ± 4.77 186.74 ± 1.98E (40%) 3.1 9.1 27.00 ± 1.93 115.10 ± 0.00 119.69 ± 13.95 185.97 ± 10.12F (50%) 1.9 10.9 17.71 ± 0.47 103.37 ± 4.40 107.75 ± 0.48 188.95 ± 2.87
1 TRS = Total Reducing Sugars; 2 TPC = Total Phenolic Compounds.
Table 3. Variation (Δ) between parameters before (soluble fraction) and after mashing (sweet wort)calculated by simple subtraction.
Sample (% Moisture) Δ◦Plato ΔTRS 1 (g·L −1) ΔTPC 2 (mg·L −1)
Dry 8.5 79.28 ± 0.05 78.37 ± 0.6610 10.8 149.63 ± 3.68 96.63 ± 10.6320 10.9 142.56 ± 2.81 108.49 ± 5.0330 9.1 118.64 ± 0.31 69.38 ± 2.2340 6.0 88.1 ± 1.58 66.28 ± 3.1250 9.0 97.57 ± 3.21 81.20 ± 1.95
1 TRS = Total Reducing Sugars; 2 TPC = Total Phenolic Compounds.
Table 2 shows that the soluble extract (◦Plato) presents a very close initial value for the samplesmilled with 10%, 20%, 30%, and 40% moisture content, whereas, for the dry sample, this value wassignificantly decreased, indicating the effect of the wet milling on the exposure of the soluble fractionsof the grains. For the produced worts, the highest values of the extract were observed for the samplesmilled with 10%, 20%, and 30% moisture content.
The results in Table 2 show that the samples with 30% and 40% moisture presents a slightly higherconcentration of reducing sugars in the soluble extract than the samples with 10% and 20% moisture.Although not expected because of the higher grain size, this result is close to the expectation related to
54

Beverages 2018, 4, 51
the determination of ◦Plato, for which the results of the soluble extract samples with 10%, 20%, 30%,and 40% moisture were very close. After mashing, the highest values of total reducing sugars wereobserved for the samples milled with 10% and 20% moisture, as these being the smallest particle size,and were according to expected result. The high total values of reducing sugars are very favorable tothe process because they guarantee more substrate for the yeast activity and, in turn, allow for theaddition of more water in the process, which can maintain an ideal concentration of sugars, leading toa higher overall production of beer with the same initial malt mass. Again, these results indicate thatthe humidification of the malt provided greater exposure of the grain fractions, allowing the enzymeto be more efficient with the hydrolysis of macromolecules and the liberation of fermentable sugars inthe wort.
The results of Table 3 indicate that the higher starch conversion (mashing yield), which canbe directly related to the presence of sugars and to soluble solids concentration, is calculated forthe samples of 10% and 20% moisture content, which were the samples of smaller particle size.As such, larger deltas of conversion for reducing sugar content of these samples were also calculated.This result was expected because the high contact surface leaves the starchy fraction more availablefor conversion to sugars via enzyme action. This result indicates that wet milling, using up to 30%moisture, increased the extraction of soluble solids of the grains during mashing.
Szwajgier [21] evaluated the milling (in roller mills) and mashing on an industrial scale of dryand wet malts (12–15%) and observed that there was no difference in the final concentration of sugars(glucose and maltose). However, it was verified that the extraction of these compounds from the grainoccurred more rapidly, which may have resulted in a reduction of the mashing duration. Haros andSuarez [22] evaluated corn milling and observed a greater chemical recovery of the starch in wet grains.
Unlike other parameters, in phenols analysis, it is not generally interesting to compare the resultswith granulometry, given that the contribution of phenols coming from the malt is exclusively fromhusks, as observed in Broderick et al. [23]. Therefore, a higher concentration of phenols was expectedin the samples in which the husks were more comminuted, with no relation to the conservation statusof the starchy fraction. Unlike total reducing sugars, the concentration of phenols during mashing isnot increased by enzymatic conversion. The increase in the concentration on the stage occurs purely byextraction due to the prolonged contact of the husks with the water and elevation of the temperature.
The ‘delta’ of extraction exposed in Table 3 suggests that the greatest variation for phenols withmashing occurred in the 10% and 20% moisture samples. The highest result in variations of the sampleof 50% moisture as well as in the other parameters analyzed in the present study; again, this resultwas not expected, as it was necessary to study the behavior of barley malt grains against samples withhigher humidification than their moisture saturation. Szwajgier [21] observed that, for total phenoliccompounds content, there was a prevention of its extraction from malt husk due to the humidificationof the grains.
In conclusion, faster sugar conversion during mashing occurs with wet milling, as confirmedby Szwajgier [21]. Concurrently, greater chemical recovery of the starch occurs for wet barley malts,as confirmed by Haros and Suarez [22] with regard to corn grains milling. To optimize the mashingconditions with an increase in starch conversion to reducing sugars, wet malt milling with 10 or 20%moisture is recommended.
Author Contributions: The experiments were carried out by F.P.d.M. and were supervised by T.R.d.S.M.
Funding: This research received no external funding.
Conflicts of Interest: The authors declare no conflict of interest.
References
1. Briggs, D.E.; Boulton, C.A.; Brookes, P.A.; Stevens, R. Brewing Science and Practice; Woodhead Publishing:Cambridge, UK; CRC Press LLC: Boca Raton, FL, USA, 2004; p. 881, ISBN 0-8493-2547-1.
55

Beverages 2018, 4, 51
2. Lewis, M.J.; Young, T.W. Brewing, 2nd ed.; Aspen Publishers Inc.: New York, NY, USA, 2001; p. 398,ISBN 978-0306472749.
3. Kunze, W. Technology Brewing and Malting, 2nd ed.; VLB: Berlin, Germany, 1999; p. 726, ISBN 978-3-921690-77-2.4. Mallet, J. Malt: A Practical Guide from Field to Brewhouse; Brewers Publications: Boulder, CO, USA, 2014; p. 300,
ISBN 193846916X.5. Reinold, M.R. Manual Prático de Cervejaria, 1st ed.; Aden: São Paulo, Brasil, 1997; p. 149, ISBN 85-86395-01-3.6. Siebert, KJ. Haze Formation in Beverages. LWT-Food Sci. Technol. 2006, 39, 987–994. [CrossRef]7. Markovi, R.S.; Grujic, O.S.; Pejin, J.D. Conventional and alternative principles for stabilization of protein and
polyphenol fractions in beer. Acta Period. Technol. 2003, 34, 3–12. [CrossRef]8. Siqueira, P.B.; Bolini, H.M.A.; Macedo, G.A. O processo de fabricação de cerveja e seus efeitos na presença
de polifenóis. Alim. Nutr. Araraquara 2008, 19, 491–498.9. Venturi, W.G. Cerveja. Tecnologia de Bebidas, 1st ed.; Edgard Blücher: São Paulo, Brazil, 2005; p. 412,
ISBN 9788521204930.10. Cassola, M.S.; Moraes, S.L.; Albertin, E. Desgaste na mineração: O caso dos corpos moedores. Rev. Esc. Minas
2006, 59, 173–178. [CrossRef]11. Hough, J.S. Biotecnología de la Cerveza y de la Malta; Editora Acribia: Zaragoza, Espana, 1990; p. 208,
ISBN 9788420006819.12. Venturini-Filho, W.G.; Nojimoto, T. Aproveitamento da água de umidificação de malte da moagem úmida
como matéria prima na fabricação de cerveja. Food Sci. Technol. 1999, 19, 174–178. [CrossRef]13. Wronkowska, M. Wet-milling of cereals. J. Food Process. Preserv. 2016, 40, 572–580. [CrossRef]14. Goldammer, T. The Brewer’s Handbook, a Complete Book to Brewing Beer; Apex Publishers: Herndon, VA, USA,
2008; p. 496, ISBN (13) 978-0-9675212-3-3.15. Bogdan, P.; Kordialik-Bogacka, E. Alternatives to malt in brewing. Trends Food Sci. Technol. 2017, 65, 1–9.
[CrossRef]16. American Society of Brewing Chemists (ASBC). Methods of Analysis; ASBC: St. Paul, MN, USA, 1976.17. BARNES, Z.C. Brewing Process Control. In Handbook of Brewing; Priest, F.G., Stewart, G.G., Eds.; CRC Press
and Taylor & Francis Group: Boca Raton, FL, USA, 2006; pp. 447–486.18. Bamforth, C.W. Beer: Tap into the Art and Science of Brewing, 2nd ed.; Oxford University Press: Oxford, UK,
2003; p. 233, ISBN 978-0195305425.19. European Brewery Convention (EBC). Analytica-EBC, 7th ed.; Fachverlag Hans Carl: Nuremberg,
Germany, 2008.20. AOAC International. AOAC Official Methods of Analysis; AOAC International: Rockville, MD, USA, 1990.21. Szwajgier, D. Dry and Wet Milling of Malt. A Preliminary Study Comparing Fermentable Sugar, Total
Protein, Total Phenolics and the Ferulic Acid Content in Non-Hopped Worts. J. Inst. Brew. 2011, 117, 569–577.[CrossRef]
22. Haros, M.; Suarez, C. Effect of drying, initial moisture and variety in corn wet milling. J. Food Eng. 1997,34, 473–481. [CrossRef]
23. Broderick, H.M.; Canales, A.M.; Coors, J.H. El Cervecero en la Practica: Un Manual para la Industria Cervecera,2nd ed.; Associacón de Maestros Cerveceros de las Américas: Provincia Panama, Panama, 1949; p. 230,ISBN 9780971825505.
© 2018 by the authors. Licensee MDPI, Basel, Switzerland. This article is an open accessarticle distributed under the terms and conditions of the Creative Commons Attribution(CC BY) license (http://creativecommons.org/licenses/by/4.0/).
56
beverages
Review
Computer Vision Method in Beer QualityEvaluation—A Review
Jasmina Lukinac 1, Kristina Mastanjevic 1,*, Krešimir Mastanjevic 1, Gjore Nakov 2 and
Marko Jukic 1
1 Faculty of Food Technology Osijek, Josip Juraj Strossmayer University of Osijek, Franje Kuhaca 20,31000 Osijek, Croatia; [email protected] (J.L.); [email protected] (K.M.);[email protected] (M.J.)
2 Department of Biotechnology and Food Technology, University of Ruse Angel Kanchev, Branch Razgrad,Aprilsko vastanie Blvd. 47, Razgrad 7200, Bulgaria; [email protected]
* Correspondence: [email protected]; Tel.: +385-3122-4356
Received: 8 April 2019; Accepted: 16 May 2019; Published: 1 June 2019
Abstract: Beers are differentiated mainly according to their visual appearance and their fermentationprocess. The main quality characteristics of beer are appearance, aroma, flavor, and mouthfeel.Important visual attributes of beer are foam appearance (volume and persistence), as well as thecolor and clarity. To replace manual inspection, automatic, objective, rapid and repeatable externalquality inspection systems, such as computer vision, are becoming very important and necessary.Computer vision is a non-contact optical technique, suitable for the non-destructive evaluation ofthe food product quality. Currently, the main application of computer vision occurs in automatedinspection and measurement, allowing manufacturers to keep control of product quality. This paperpresents an overview of the applications and the latest achievements of the computer vision methodsin determining the external quality attributes of beer.
Keywords: beer; computer vision; image analysis; quality
1. Introduction
Beer is one of the oldest (low) alcoholic beverages in the world and the third most widely-consumeddrink (after water and tea). Today, besides industrial commercial beers, craft beer has gained greatpopularity among consumers [1]. Beer is produced in a brewing process from malt, water, brewer’syeast, and hops. The basic quality characteristics of beer are divided into visual and sensory attributes.Appearance is the first attribute that consumer experiences (and evaluates) when he/she gets a glass ofbeer. Important visual characteristics of beer are foam appearance (volume and persistence), as well ascolor and clarity of the beer. Perception and acceptability of beer are also determined by otherproperties e.g., the alcohol content (expressed as Alcohol by volume, ABV or Alcohol by weight, ABW),carbon dioxide content, the presence/absence of off-flavors in bottled beer [2–4], aroma, mouthfeel andbitterness (listed in International Bitterness Units, or IBUs).
The main collections of the standard methods of beer analysis used worldwide are methods of theInstitute of Brewing and Distilling (IBD), American Society of Brewing Chemists (ASBC), EuropeanBrewery Convention (EBC), and Central European Commission for Brewing Analysis (MEBAK).Beers are differentiated mainly according to their visual appearance (depends on its color and turbidity)and their fermentation process. Regarding the yeast used and the fermentation temperature, beercan be categorized in the three main categories: top-fermented (ale), bottom-fermented (lager), andnaturally fermented beer. Beer classification can be done regarding the color during the productionprocess. Beer color is determined by the malt color that develops during the Maillard reactions andcaramelization in the malting and roasting process [5]. Therefore, it is possible to distinguish bright,
Beverages 2019, 5, 38; doi:10.3390/beverages5020038 www.mdpi.com/journal/beverages57
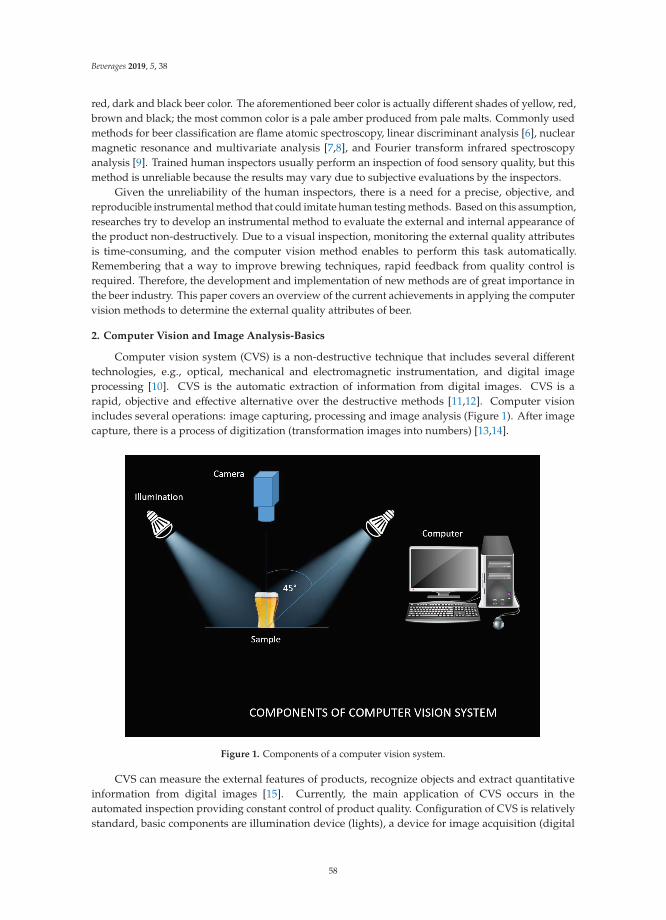
Beverages 2019, 5, 38
red, dark and black beer color. The aforementioned beer color is actually different shades of yellow, red,brown and black; the most common color is a pale amber produced from pale malts. Commonly usedmethods for beer classification are flame atomic spectroscopy, linear discriminant analysis [6], nuclearmagnetic resonance and multivariate analysis [7,8], and Fourier transform infrared spectroscopyanalysis [9]. Trained human inspectors usually perform an inspection of food sensory quality, but thismethod is unreliable because the results may vary due to subjective evaluations by the inspectors.
Given the unreliability of the human inspectors, there is a need for a precise, objective, andreproducible instrumental method that could imitate human testing methods. Based on this assumption,researches try to develop an instrumental method to evaluate the external and internal appearance ofthe product non-destructively. Due to a visual inspection, monitoring the external quality attributesis time-consuming, and the computer vision method enables to perform this task automatically.Remembering that a way to improve brewing techniques, rapid feedback from quality control isrequired. Therefore, the development and implementation of new methods are of great importance inthe beer industry. This paper covers an overview of the current achievements in applying the computervision methods to determine the external quality attributes of beer.
2. Computer Vision and Image Analysis-Basics
Computer vision system (CVS) is a non-destructive technique that includes several differenttechnologies, e.g., optical, mechanical and electromagnetic instrumentation, and digital imageprocessing [10]. CVS is the automatic extraction of information from digital images. CVS is arapid, objective and effective alternative over the destructive methods [11,12]. Computer visionincludes several operations: image capturing, processing and image analysis (Figure 1). After imagecapture, there is a process of digitization (transformation images into numbers) [13,14].
Figure 1. Components of a computer vision system.
CVS can measure the external features of products, recognize objects and extract quantitativeinformation from digital images [15]. Currently, the main application of CVS occurs in theautomated inspection providing constant control of product quality. Configuration of CVS is relativelystandard, basic components are illumination device (lights), a device for image acquisition (digital
58

Beverages 2019, 5, 38
camera/scanner), frame grabber (in the case of an analog camera), and computer hardware and software(algorithms for image analyzing and pre-processing) [16,17].
2.1. Illumination
With the camera, one of the most important elements of the CVS system is the illumination.The illumination device is used for object illumination under test. There are many properties ofillumination (light angle of incidence, light source color, direct/diffuse light technique), which mustbe selected in such a way to reduce disturbances (shadows, reflections, noise) or enhance imagecontrast [14,18,19]. Suitable illumination increases the quality of captured images and improves theaccuracy of the analysis. There are several simple rules and good practices that can help select theproper illumination and improve the image quality:
• maximizing the contrast of the features that must be inspected or measured• minimizing the contrast of the features of no interest• getting rid of unwanted variations caused by ambient light and differences between items that are
non-relevant to the inspection task.
To view an object, it is necessary for it to be illuminated by a light source. The color perceptionof an object depends on the color of the light source and the color of the surface. Considering thecolor, we distinguish these light colors: red, green, blue, white with particular color temperature,infrared, and ultraviolet. Light sources may be either natural (sunlight) or artificial (incandescent,halogen, fluorescent, compact fluorescent, LED, metal halide, Xenon, High Pressure Sodium, lasers,and infrared lamps) [20–23]. The most suitable illumination is defined by its position, sources type,geometry and color [14,19]. The term “light source” implies any object that emits energy in thevisible spectrum (380–750 nm). Sunlight is one example of the light source, but is not suitable forcolorimetric characterization because its quality and energy may vary during the day. To providereliable colorimetric characterization CIE establishes illuminants upon binding standards (relativeenergy versus wavelength).
All illuminants are compared against the color temperature, which is described as the spectralenergy distribution of the ideal blackbody radiator that radiates light with a specific color at definedtemperatures in kelvin (K). Color temperature for an incandescent lamp (~100 W) is 2800 K, for halogenlamp 3000–3200 K, for the fluorescent lamp (cold white) 4000 K, for Xenon and metal halide lamp4500–5000 K, for warm white LED lamp is 2700–3000 K, and cold white LED lamp 5000–5500 K [20,24].
According to the CIE, we distinguish several illuminants like:
• daylight illuminants lamps (illuminants that represent daylight conditions): C lamp, D50 lampand D65 lamp
• incandescent/tungsten lamps: A lamp• fluorescent lamps: F2 lamp (cool white fluorescent), F7 lamp, and F11 lamp• special light sources.
Several parameters should be considered when deciding on a selection of illuminant source:characteristic of the object surface (whether the object is absorptive, transmissive or reflective), theobject geometry (curved of flat), and object/background contrast (translucent objects are usuallyilluminated with backlight). When an object is illuminated, the incident light is partly (Figure 2):
• reflected and/or• transmitted and/or• absorbed and/or• strayed.
Type of the effect that will occur, depends on the object surface (opaque, semi-transparent ortranslucent, glossy or matt). Because of that, the position of a light source is very important. When the
59

Beverages 2019, 5, 38
object surface is glossy, the light is reflected from the object surface at an angle of incidence. If surfaceis opaque, semi-transparent or translucent, the light is transmitted (penetrates through the object) or itcan be polarized or diffracted at the object surface. Usually one of these effects never appears alone,but it is always a combination of several effects.
Due to a different object geometry, there are the three common lighting geometries: the pointlighting for flat objects, the diffuse lighting for challenging reflective 3-D objects, and collimatedlighting (laser light) [10,22].
Figure 2. Different types of effects that can occur when the object is illuminated.
Regarding the angle of incidence of the illumination (angle between light source, object andcamera), there are several illumination techniques [14]:
• direct incident light (front light)
� vertical illumination from above,� ring illumination,� angular illumination;
• incident lighting with a diffuser
� flat,� coaxial,� dome-shaped;
• lateral light at angles—at angles from one side or all around;• shallowly—illumination at a shallow angle from all sides: dark field illumination (usually uses a
low angle ring light that is mounted very close to the object where the light rays from the lightsource are not reflected into the camera lens, but only a proportion of light that is scattered by anuneven surface);
• backlighting—transmitted light from the opposite side of the object (backlit image);• collimated lighting—laser light (Figures 3–8).
60

Beverages 2019, 5, 38
Figure 3. Direct lighting techniques—point and ring lighting.
Figure 4. Diffuse lighting techniques—flat diffuse and dome shaped illumination.
61
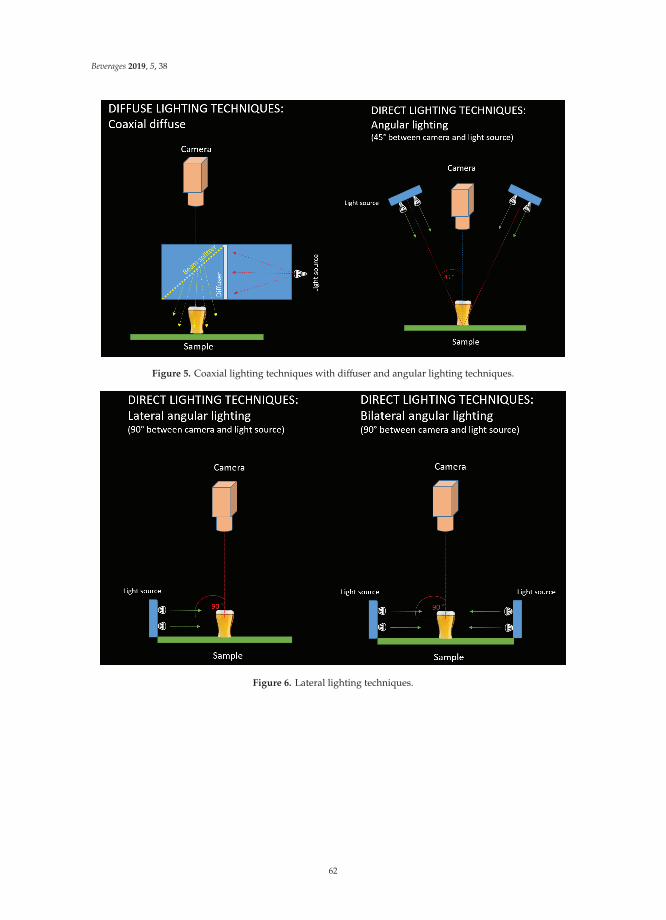
Beverages 2019, 5, 38
Figure 5. Coaxial lighting techniques with diffuser and angular lighting techniques.
Figure 6. Lateral lighting techniques.
62
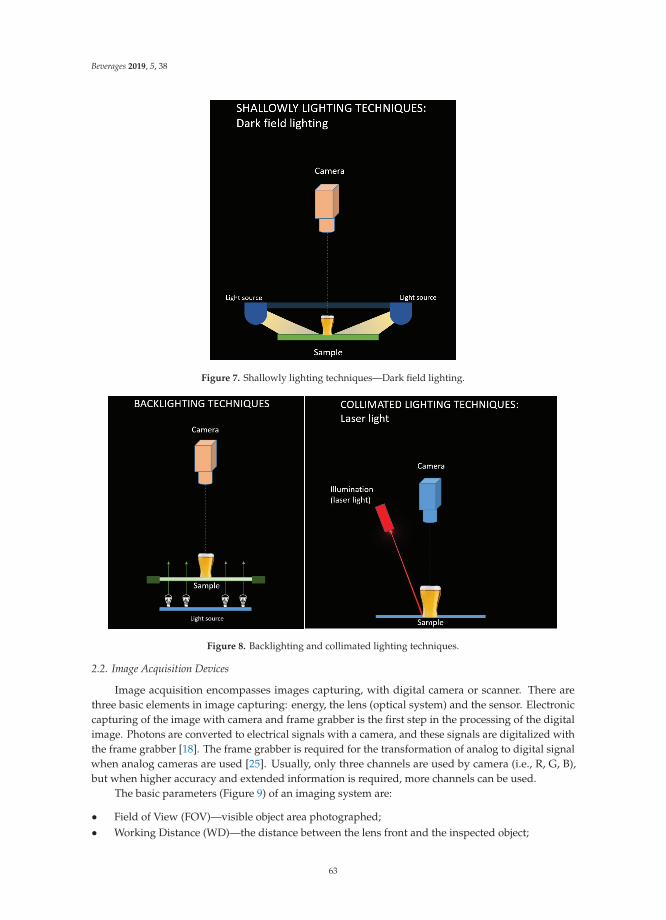
Beverages 2019, 5, 38
Figure 7. Shallowly lighting techniques—Dark field lighting.
Figure 8. Backlighting and collimated lighting techniques.
2.2. Image Acquisition Devices
Image acquisition encompasses images capturing, with digital camera or scanner. There arethree basic elements in image capturing: energy, the lens (optical system) and the sensor. Electroniccapturing of the image with camera and frame grabber is the first step in the processing of the digitalimage. Photons are converted to electrical signals with a camera, and these signals are digitalized withthe frame grabber [18]. The frame grabber is required for the transformation of analog to digital signalwhen analog cameras are used [25]. Usually, only three channels are used by camera (i.e., R, G, B),but when higher accuracy and extended information is required, more channels can be used.
The basic parameters (Figure 9) of an imaging system are:
• Field of View (FOV)—visible object area photographed;• Working Distance (WD)—the distance between the lens front and the inspected object;
63

Beverages 2019, 5, 38
• Resolution—number of pixels or number of minimal parts of the object that can be distinguishedby digital imaging;
• Depth of Field (DOF)—the maximum depth tenable in acceptable focus;• Sensor Size—the active area size of the camera sensor;• Camera.
Figure 9. Basic parameters of an Imaging System.
There are a wide range of digital camera capabilities, and consequently, of sizes and prices (Table 1).The most commonly used camera sensors are charged coupled device (CCD) and complementarymetal-oxide semiconductor (CMOS) [26]. In a CCD camera, radiation energy (proportional to lightexposure) is converted to an electrical signal using of mass photodiodes. These cameras provide goodsystem differentiation and flexibility for various applications (industrial imaging, digital photography,scientific and medical research, etc.). A CMOS camera is more sensitive than a CCD camera, and hasa greater dynamic range with very fast signal transferring. They are suitable for industrial use foron-line product inspection, and for all other applications where there is no need for high image quality(wireless video devices, video conferencing, toys, bar-code scanners, etc.) [26].
Scanners are usually used for specialized tasks and specific use (extreme resolution, large numbersof output channels or extreme wavelengths). Qualifying specification parameters for a scanner are bit(color) depth, resolution, and dynamic range. The scanner’s bit-depth defines the amount of colorinformation in the image. Accuracy increases with higher depths (4-bit with 16, 8-bit with 256, 24-bitwith almost 17 million tones, etc.). Resolution is expressed in dots per inch (dpi) and determines thenumber of details in the image. Dynamic range is a measure of scanner ability to distinguish imagecolors and tones. It is similar to image depth and it ranges from perfect white (0.0) to black (4.0) [20].
64
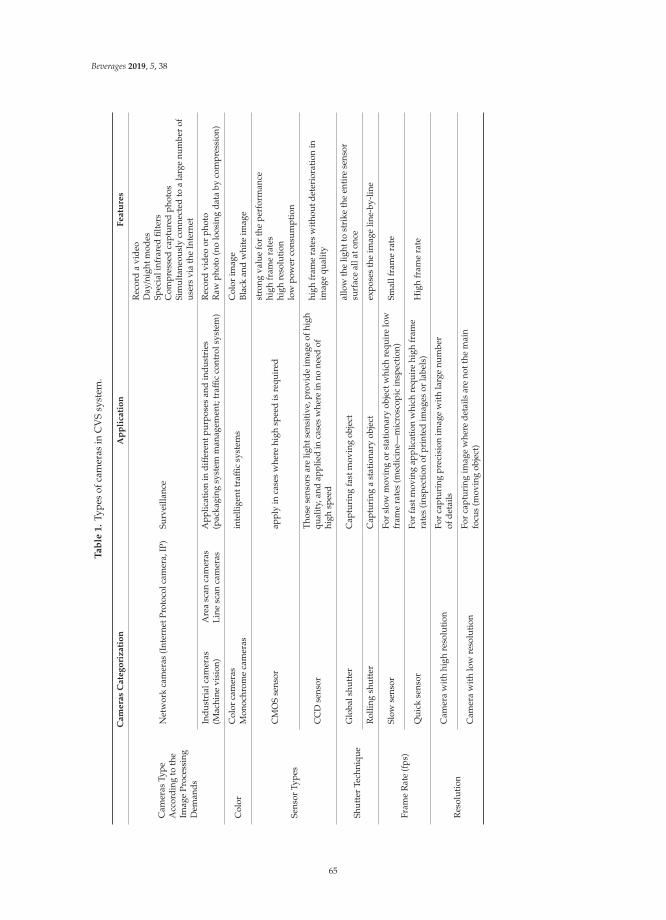
Beverages 2019, 5, 38
Tab
le1.
Type
sof
cam
eras
inC
VS
syst
em.
Ca
me
ras
Ca
teg
ori
za
tio
nA
pp
lica
tio
nF
ea
ture
s
Cam
eras
Type
Acc
ordi
ngto
the
Imag
ePr
oces
sing
Dem
ands
Net
wor
kca
mer
as(I
nter
netP
roto
colc
amer
a,IP
)Su
rvei
llanc
e
Rec
ord
avi
deo
Day/n
ight
mod
esSp
ecia
linf
rare
dfil
ters
Com
pres
sed
capt
ured
phot
osSi
mul
tane
ousl
yco
nnec
ted
toa
larg
enu
mbe
rof
user
svi
ath
eIn
tern
et
Indu
stri
alca
mer
as(M
achi
nevi
sion
)A
rea
scan
cam
eras
App
licat
ion
indiff
eren
tpur
pose
san
din
dust
ries
(pac
kagi
ngsy
stem
man
agem
ent;
traffi
cco
ntro
lsys
tem
)R
ecor
dvi
deo
orph
oto
Raw
phot
o(n
olo
osin
gda
taby
com
pres
sion
)Li
nesc
anca
mer
as
Col
orC
olor
cam
eras
inte
llige
nttr
affic
syst
ems
Col
orim
age
Mon
ochr
ome
cam
eras
Blac
kan
dw
hite
imag
e
Sens
orTy
pes
CM
OS
sens
orap
ply
inca
ses
whe
rehi
ghsp
eed
isre
quir
ed
stro
ngva
lue
for
the
perf
orm
ance
high
fram
era
tes
high
reso
luti
onlo
wpo
wer
cons
umpt
ion
CC
Dse
nsor
Thos
ese
nsor
sar
elig
htse
nsit
ive,
prov
ide
imag
eof
high
qual
ity,
and
appl
ied
inca
ses
whe
rein
none
edof
high
spee
d
high
fram
era
tes
wit
hout
dete
rior
atio
nin
imag
equ
alit
y
Shut
ter
Tech
niqu
eG
loba
lshu
tter
Cap
turi
ngfa
stm
ovin
gob
ject
allo
wth
elig
htto
stri
keth
een
tire
sens
orsu
rfac
eal
lato
nce
Rol
ling
shut
ter
Cap
turi
nga
stat
iona
ryob
ject
expo
ses
the
imag
elin
e-by
-lin
e
Fram
eR
ate
(fps
)Sl
owse
nsor
For
slow
mov
ing
orst
atio
nary
obje
ctw
hich
requ
ire
low
fram
era
tes
(med
icin
e—m
icro
scop
icin
spec
tion
)Sm
allf
ram
era
te
Qui
ckse
nsor
For
fast
mov
ing
appl
icat
ion
whi
chre
quir
ehi
ghfr
ame
rate
s(i
nspe
ctio
nof
prin
ted
imag
esor
labe
ls)
Hig
hfr
ame
rate
Res
olut
ion
Cam
era
wit
hhi
ghre
solu
tion
For
capt
urin
gpr
ecis
ion
imag
ew
ith
larg
enu
mbe
rof
deta
ils
Cam
era
wit
hlo
wre
solu
tion
For
capt
urin
gim
age
whe
rede
tails
are
nott
hem
ain
focu
s(m
ovin
gob
ject
)
65

Beverages 2019, 5, 38
2.3. Hardware and Supplied Software
Furthermore, important components of CSV are computer hardware and software, providingstorage space for images and computing capacity with specific software applications. Visualization ofimages and results of the image analysis process, are enhanced by high-resolution monitors [16,27–29].
3. Digital Image Analysis
Image capturing (acquisition), processing and analysis are operations included in the computervision system (Figure 10). The role of image processing is to obtain an image with enhanced quality andto decrease various defects such as noise, distortion, improper lighting and focus, and errors causedby camera movement. Image analysis separates the region of interest (ROI) from the background isthen used to obtain quantitative information about the analyzed object. There are several steps inimage processing and analysis. The first step is image acquisition and pre-processing of the imageto improve its quality (correction of contrast, blur, distortions etc.). Second processing step includesimage segmentation (thresholding), representation and description [28]. In the last step, differentstatistical tools are used to recognize and interpret information obtained from the object image [30].
Figure 10. Steps in digital image analysis.
4. Perception and Measuring of Beer Color
Each beer style has a range of acceptable colors. The actual color of each beer is nothing more thangradations of a brown tone, which decreases in concentration through red, copper, and amber colors,through to golden yellow and light yellow. The brewer’s ability to predict and control beer color,as one of the three visual attributes which influence beer appearance, is very important. Consumershave a habit associating the beer color with the flavor, and according to the color, to determine whichtype it belongs, to lager, ale or stout [31]. Consumers expect consistently high-quality standards offoods and beverages, and color loss will be perceived as a sign of quality reduction. They have highrequirements in terms of external product quality (appearance, shape, color), so the food industry hasthe task of providing efficient systems for continuous monitoring of the product’s color during theproduction and storage [12].
The color of the beer comes from malted barley, and wort production. Substances responsiblefor beer color (melanoidin, polyphenols, trace metals like copper and iron, riboflavin, caramel) areformed during several different chemical reactions [32–34]. Melanoidins are water soluble pigments
66

Beverages 2019, 5, 38
whose color changes from initially yellow to dark brown [35]. During the kilning process, when thetemperature is greater than 95 ◦C, a Maillard reaction takes place and produces color and aromacomponents from sugars and amino acids. Caramelization reactions take place at temperatures above120 ◦C, and are affected by pH and the type of sugar [36]. At the temperature above 200 ◦C, pyrolysisreaction occurs and black pigments are produced in the brewing process.
Through history, numerous techniques of color determination of malt and beer have beendeveloped. Grading techniques are based on a comparison of the color standards with the productcolor. The color is expressed using several scales according to Lovibond (◦L), European BreweryConvention color scheme (EBC) [37] or Standard Reference Method (SRM) (Figure 11). A scale forthe beer color expression is determined by the used method of color measurement. The first methodused to determine the color of beer was the visual comparison method, where beer color is expressedin degrees Lovibond. J.W. Lovibond developed this method in 1893, which was then adopted byBishop in 1950. The method is quantitative and based on subjective estimation of beer color by visualcomparison of beer samples with colored glass discs references. After improving, the EuropeanBrewery convention accepted the visual comparison method and the color of malt, wort and beer areexpressed in EBC units [31]. In the US, the color of malt is commonly expressed in ◦L while SRMscale is used for estimation of the beer color. However, visual comparison method ha weaknesses,because it is subjective (based on visual comparison of color sample and reference with the humaneye). Because of this disadvantage, new instrumental methods for beer color assessment are developed(spectrophotometric and tristimulus method). That group of methods is independent of the observers,and allow an objective assessment of beer color. In the tristimulus method, light reflected from thesample is separated through the filters into three color channels corresponding to the human eye visionand captured by sensors. Several color systems have been proposed to describe a color as a tristimulusvalue of individual intensities of red, green and blue [38]. There are many different color systems likeLovibond RYBN color, The Munsell Scale, CIE color system (CIELab, CIELCh, CIEXYZ), RGB colorsystem. The spectrophotometric method uses multiple sensors to measure spectral transmittance orreflectance in a visible light spectrum range (380–740 nm).
Currently, the color of beer and wort is expressed in EBC scale, and North America is an exceptionwhere the color is expressed in a SRM scale. The American Society of Brewing Chemists (ASBC) hasdeveloped a method for beer color determination by spectrophotometer, called the Standard ReferenceMethod (SRM). The SRM method is based on an absorbance measurement, where the beer color isexpressed as a quantity of absorbed light at a wavelength of 430 nm in a 10 mm quartz cuvette againstwater as a reference [39].
A430·D·12.7 = SRM (1)
where, D = dilution factor of the sample and A430 = the light absorbance at 430 nm in a 1 cm cuvette.Based on spectrophotometry, the European Brewing Convention (EBC) system has developed a
similar method in Europe. The simple equation is used to calculate beer color in EBC units:
A430·D·25 = EBC (2)
where, D present dilution factor of the sample, A430 present absorbance of the beer at a wavelength of430 nm in a 1 cm cuvette.
Since EBC and ASBC measurements are based on absorbance at 430 nm, conversion can be made bysimply adjusting for the differences in path length and multiplicative factors by the following equation:
EBC = 1.97·SRM (3)
SRM =EBC1.97
(4)
For both methods, it is important that the beer sample have no turbidity during color measurement.Otherwise, if turbidity is greater than 1 EBC unit, the sample needs to be filtered or centrifuged.
67

Beverages 2019, 5, 38
The values of the EBC color scale are approximately 2 times higher than the values of the SRMscale. There are also darker beers whose color is out of the scale and difficult to detect; such sampleshave to be diluted when measuring [40].
Figure 11. European Brewery Convention (EBC) and Standard Reference Method (SRM) color valuesof various beer types.
Photometry can be used for color determination of beer and malt [9], and color can be expressedwith a tristimulus CIELab color model, were L is the lightness component, a refers to the degree ofthe red and green, and b to the degree of the blue and yellow color. Lightness (L value) is stronglycorrelated with the conventional EBC scores [41]. To replace the conventional visual color assessmenta novel, computer vision system (CVS) has been developed [24]. CVS enables the non-destructive,contactless, fast, automated, objective, and repeatable color measurement of different food products.It is based on the analysis of each pixel on a captured photo (covering the entire sample), which makesit objective and precise as a method [42,43].
Various methods have been developed for the characterization of different beer types.Silva et al. [44] investigated computer vision method and digital image analysis as an alternativemethod for color classification of Brazilian pale lager beers. Beer samples are scanned in Petri dishes,and digital image analysis was applied for pattern recognition of beers. After applying digital imageanalysis, results were presented as color histograms in RGB color space for each brand of Brazilianpale lager beer. Along with conventional analytical methods of color determination, digital imageanalysis has been demonstrated to be a suitable method for classifying beer of the same type or category.Nikolova et al. [45] reported the use of digital image analysis and spectrophotometer for beer typeclassification according to their color. For this purpose, several beer samples were chosen to obtaindigital images: light beer, dark beer, a beer with lemon and beer with fruits. Cluster analysis wasapplied to a group of similar beer samples. Beer samples were photographed with a CCD camera in aBMP format. After pre-processing of the image, obtained results were presented as RGB values, andlater transformed into the CIELab values. The beer color determined by the image analysis correspondsto the color results measured by the spectrophotometer. Therefore, computer vision and digital imageanalysis proved capable color-based method in classifying beer.
68
Beverages 2019, 5, 38
5. Bubble Size Distribution and Nucleation in Beer
Bubble haze arises in the beer during dispensing beer into the glass (creating an illusion of haze),as a result of a large number of microbubbles which are formed during bubble nucleation. Formedmicrobubbles do not go immediately to its surface, thus contributing to the effect of the beer bubblehaze, and are responsible for the formation of the foam ring on the top of the liquid surface. Bubblehaze is an important beer quality parameter and can be preferred by the consumers. For the brewingindustry, it is essential to measure beer bubble haze during beer dispense, as one of the product qualityindicators. Furthermore, it is very important to determine and control the bubble size in beer hazebecause their size directly affects the distribution of flavor and taste of beer. Bubbles collect at the top ofthe glass in a foam called “head”. A beer perceived as flat showed little nucleation activity (bubbling)in the glass, regardless of its normal CO2 content. Also, active bubbling regenerates the head [46–48].
Several methods can measure the frequency of bubble formation, their size and distribution insupersaturated beer liquid. Saxena et al. [49] categorized these methods into three groups:
• Image (photographic) analysis methods—analysis of the captured images of bubbles;• Optical probe methods—analysis of the bubble penetration length in the area of intensive
bubbles migration;• Electrical conductivity (resistivity) probe methods—analysis of the bubble volume with
ultrasound/isokinetic sampling probes.
A digital balance can be used for the estimation of gas loss (measuring the mass loss of the beerglass) over time, to quantify the degree of nucleation activity. The nucleation activity also can beperformed visually, observing the reduction in the number of bubbles occurring in beer glass over time.This method is one of the first to be reported for observing the nucleation activity in beer. This methodhas many faults, is long-lasting, requires a lot of time and is not precise and objective [50]. Lubetkinand Blackwell [51] developed a method for quantification of the nucleation activity using sound datarecorded with a microphone and computer at the surface of the liquid. After recording, the sound datawere analyzed and the frequency of the bubble rupturing is determined. In this method, the nucleationactivity is observed by measuring the sound of rupturing bubbles. This method also has limitations inthe application since the beer is the system with foam-forming nature. Image analysis method canalso be used for measuring the bubble rate formation in beer. This method is based on image analysisof the photographed bubbles in beer glass during the time. Liger-Belair et al. [52] reported the useof an image analysis method for investigation of the bubble formation in Champagne. They usedstroboscopic light and digital camera for image capturing. In this study, the authors reported that theimage analysis method could be used to measure numerous parameters of bubble formation: bubbleformation frequency, growth rates, and bubbles rising velocities in the liquid.
Hepworth et al. [53–55] made several studies of using computer vision method and image analysisto monitor bubble haze in beer and to investigate the influence of numerous process parameters onbubble haze formation and distribution in beer glass during beer dispense. Hepworth et al. [55] triedto explain the phenomenon of bubble haze in beer more closely in the general aim to predict theirpresence or absence, and to understand how process parameters affect the bubble haze. They examinedthe influence of changing the dissolved nitrogen and carbon dioxide content on the stability of thebubble haze in beer. Furthermore, they observed the influence of beer flow rate from the tap andapplying a sparkler (a thin plastic disk) in the tap on the stability of the bubble haze. Stability of beerbubble haze was monitored by measuring surge time (the period of the haze disappearing), hazevelocity (velocity increase of bubbles), and bubble size distribution (diameter and number of bubbles)in beer. Experiments were carried out using the high-speed video camera and a CCD camera forimage acquisition, followed by the image analysis method. Experimental results indicate a positivecorrelation between the surge time and beer flow rate, sparkler application and supplied nitrogencontent. Besides, the size and number of bubbles are crucial factors for the prediction of bubble hazelifetime, and they can be affected by varying the process condition [55].
69

Beverages 2019, 5, 38
Hepworth et al. [54] also developed another experimental procedure for monitoring the bubblenucleation (measuring bubble production rate and bubble size) during beer dispense. In this study,they investigated the influence of liquid motion, gas composition, and beer flow rate on the bubblenucleation in beer using computer vision and mathematical modeling. The image analysis wasperformed on images captured with a CCD camera to determine the bubble diameters and bubbledistribution. They adopted the classical mathematical model for predicting bubble nucleation byincluding liquid motion as a new variable. According to the result, the proposed mathematicalmodel can be suitable for predicting the bubble production rate and size, considering liquid motion.When the flow rate increases, the bubble nucleation rate in beer also increases. The nitrogen contentin the gas headspace has an opposite effect on the bubble nucleation (greater nitrogen content, thelower nucleation rate). Hepworth et al. [53] developed and adapted the image analysis methodfor measuring bubble distribution in beer (measuring bubble production rate and size). For thispurpose, they captured images of bubbles in beer, and after image capturing, they applied an imageprocessing to extract valuable data from the captured image like bubble size (diameter) and bubblevelocities (distribution and position of bubbles in the observed tank during the time) (Figure 12).In order to ignore the influence of errors and limitations during image capturing (distortion from thecurved glass, the distance between the camera lens and glass, focusing problems), they constructedflat-bottomed beer tank with the camera in a very close position. Thus, distortions were avoideddue to this positioning method. The proposed method has shown as a good tool for predicting thebubble nucleation rate, bubble growth, and motion under various experimental conditions. The greatadvantage of this technique is that is designed to be simple to use and relatively portable.
Figure 12. Bubble size determination in beer using digital image analysis method.
70
Beverages 2019, 5, 38
Zabulis et al. [56] reported the method for bubbles detection and their size determination indense dispersions with digital image technique. In this study, they developed software for bubbledetection, which is easy to use without any need for additional intervention during application.The method is objective and effective in determination of the bubble distribution, and bubble size inbeer. This method provides a good tool to control and monitor foam decay through measurement ofbubble size distribution. The method is based on monitoring of visual appearance (appearance-basedapproach) of beer samples with a digital camera in a single image. The proposed approach utilizestemplates to increase robustness and an image scale-space to detect bubbles independently of theirsize. Furthermore, algorithmic optimizations for the proposed approach that target the reduction ofcomputational complexity and user-intervention are proposed and compiled into a software application.
6. Foam Stability (Head Retention)
Beer external quality is characterized by foam stability and visual appearance. Therefore, forbeer having a long-lasting head of foam and strong foam, some say that beer is of good quality and isdesirable among consumers Features of a good foam are quantity and stability, cling or lacing (adhesionto the glass), density or creaminess, whiteness, and strength. Methods for foam quality evaluation arebased on the different foam physical characteristics. Most methods measure foam collapse or the riseof the liquid/foam surface (drainage). Drainage is the liquid flow from a wet foam fraction to the liquidunderneath and, in the first stages of the foam decay (collapse), it is the dominant process contributingto foam collapse. However, rearrangement of the foam bubbles during time is an equally importantfactor when measuring foam stability. Furthermore, some other phenomena also must be consideredwhen beer foam kinetics is studied, e.g., creaming, which represents the rise of the bubbles to the topof the system [57].
Many research activities have been focused on detecting the main components and reactionmechanisms that influence beer foam quality (both positive and negative effects). Stability of beerfoam mainly depends on the presence of the hydrophobic surface-active proteins (polypeptides) ofalbumin class, primarily protein Z (40 kDa) and lipid transfer protein LTP1 (9.7 kDa). Among theproteins mentioned above, the stability of beer foam is also influenced by an iso-α-acids from hops,metal cations, hordein-derived (poly) peptides, polyphenols and non-starch polysaccharides (β-glucanand arabinoxylan). Contrary to substances that promote foam stability, destabilization substancesare lipids, some amino acids and increased ethanol content [47,48,56–61]. The beer foam stabilitycan be improved by using nitrogen gas, the way of pouring beer into a glass (pouring from a certainheight which can increase the foam in the glass), or by using the beer dispensing system. In addition,the shape of a beer glass plays an important role in beer foam stability. Beer glasses with a largerdiameters at the top have a larger exposed surface area of foam in relation to volume ratio, which iswhy the stability of the foam is disturbed.
The assessment of beer foam quality depends both on the foam generation method, and on foamcollapse/drainage measurement procedure. Techniques to generate beer foam can be divided intoartificial (foaming devices) and natural categories (pouring). Standard methods for determination ofbeer foam stability are based on measurements of the weight or volume of the liquid collapse from thefoam, visual assessment of foam volume decrease or conductometric assessment of foam/air interface.Some traditional methods for the foam quality assessment are Rudin head retention, Ross and Clarkprocedure, NIBEM, Sigma head value (SHV), ASBC sigma method [62]. Those traditional (standard)methods can produce errors due to some experimental conditions, e.g., non-reproducible and irregularway of foam generation. Evaluation of the foam stability is much more commonly determined bymeasuring the liquid drainage rate from the foam due to an inconsistent foam-air boundary, which isdifficult to define precisely. Additionally, the beer temperature of 20 ◦C is greater than one used whenbeer is served to the customer; foam stability is directly related to temperature (the foam quality differsat lower and higher temperatures).
71

Beverages 2019, 5, 38
In contrast to standard methods, new devices like digital cameras and image analysis softwarehave been developed for the assessment of the beer foam stability [59]. Methods using such devicesare automated, low-cost, contactless and non-destructive, and measures the foam collapse overtime. The method is based on photographing a glass in which a known volume of beers is poured.This method can be used to monitor two parameters simultaneously: beer foam collapse or beer liquidheight increase in the glass over the time. The beer poured into a glass and is photographed over time,photos are processed using appropriate image analysis software, and obtained results describe thedecrease of the beer foam height and increase of the beer liquid phase height over time. Constant [63]investigated the beer foam collapsing by photographing the foam collapse during a 5 min period.After applied image analysis method on photographed beer samples, he observed two separatedparameters on photography: total beer height (which includes foam, and liquid together), and liquidheight separated from the foam (beer beneath the foam). Yasui et al. [64] investigated foam stability(foam collapse over time, FTC) using image analysis method. Total foam stability over the time ismeasured using images captured with CCD camera, and beer samples are poured into a beer glassdirectly from a beer bottle. This method is based on simulation of the foam formation in realisticconditions (the consumer pours beer directly from the bottle into the beer glass). After images arecaptured, they are analyzed by the image analysis software. The results of the image analysis method(captured foam collapse during the time) are foam height, FTC and foam stability. They confirmed thatimage analysis is suitable as a method to monitor foam stability by measuring FTC values. Further, ithas been found that monitoring FTC values may replace the usual visual impression of foam stability.
Wallin et al. [65] reported a comparison of three methods for the assessment of foam stability.To measure foam stability of nine different beer, they use NIBEM (foam collapse assessment), Steinfurth(foam drainage assessment) and image analysis technique (monitoring foam stability during time)(Figure 13). The main difference between those methods is a way that foam is generated. In the NIBEMand Steinfurth method, foam is generated artificially (under pressure); meanwhile, for the purpose ofthe image analysis, foam is generated in a natural pour. The result showed a significant correlationbetween three different methods for assessing foam stability and good reproducibility, and better foamstability of ale beers over lagers.
Figure 13. Image analysis of beer foam stability (original images and images with applied thresholdsegmentation; and graphical parameters presentation of the beer foam stability).
72

Beverages 2019, 5, 38
Recently, to analyze some foam properties like foamability, foam stability, and structure,the Dynamic Foam Analyzer (DFA100) has been introduced. This apparatus is based on the principleof the image analysis method. In KRÜSS GmbH study report [66] samples of degassed clear wheat beer,Pils and Kolch were analyzed to determine the influence of the surfactants in the beer independentlyof the CO2 content and its impact on the foam behavior. Removal of CO2 before analyses providesa better insight into the influence of other foam-forming substances (e.g., proteins). The equipmentuses a vacuum pump to remove CO2 from the sample and, after degassing, foaming is conductedin controlled conditions by computer-regulated air pumping through the beer sample. Samples areilluminated with the LED panel and changes in foam height is captured with photodetector of a videocamera. During the analysis, the device records the formed foam in a column and simultaneouslyprovides data on the foamability and foam stability. Furthermore, this equipment measures changes infoam structure during the time (size and number of foam bubbles).
Sauerbrei et al. [67] conducted a computer-aided image processing research of redistributionand size of the foam bubbles during the beer foam decay. They used CCD camera, diffuse coaxialillumination to record photographs of the foam collapse, and foam bubble structure over time (5 sinterval). The use of the ultrasonic device accomplished foaming. They have successfully implementedimage analyses to measure the foam bubble size and area of the liquid fraction in the foam. Immediatelyafter foaming bubbles were very small and uniformly distributed. Over time, coalescence occurs dueto rupture of the bubble surface and some of the bubbles merge, forming larger bubbles (Figure 14).Remaining smaller bubbles fill the remaining space between the larger bubbles. The authors havecompared the resulting pattern to a known mathematical structure called the Apollonian gasket.They also concluded that beer foam does not follow simple exponential decay but more complex higherorder kinetics.
Figure 14. Different bubble size and distribution in the beer foam (10, 60 and 120 s after pouring).
Cimini et al. [68] presented an inexpensive, automated and flexible image analysis method insteadof the standard foam head retention method (developed by Rudin [69]). The standard Rudin’s methodis improved by using three different systems for automatic data collection: tracking software formouse movement; Accurate Image Analysis system (AIA) and low-cost image analysis (LCIA) system.The main difference between AIA system and LCIA system is that AIA used CCD camera and scriptwritten in MATLAB, while LCIA system used a Raspberry Pi single-board computer and a cameramodule. Authors reported that the LCIA system could be successfully used for analyzing beer foamattributes, such as the number of bubbles in the beer, their distribution, diameter and size.
73
Beverages 2019, 5, 38
7. Conclusions
The computer vision system (CVS) represents an efficient and non-destructive inspection techniquefor evaluating the external attributes of food products. It is an effective alternative to human vision,enabling rapid and objective analyses of food quality properties. Lately, digital image analysis isincreasingly used in the study of various beer quality parameters (color, bubble size and distribution,foam stability, etc.). The strongest arguments for deploying CVS in evaluating external quality attributesof beer are the reliability and reproducibility of the obtained results. Although more and more progressis being made on the development of image analysis devices, there is still no available equipmentthat will simultaneously cover the determination of all quality features, due to the complexity andbroad spectrum of beer quality parameters. Despite the fact that CVS is, in any case more, precise thanvisual methods, algorithms used for image representation and interpretation may be the source of theerrors, resulting in the improper extraction and analysis of the obtained data. Therefore, additionalefforts must be made in the development of more sophisticated equipment and algorithms that willfurther enhance measuring precision. One way of improving algorithms is the use of the informationcollected with the chemometric methods, using a wide set of various statistical tools which are capableof providing useful information by the analysis and modeling large quantities of data.
Author Contributions: Conceptualization, J.L., K.M. (Kristina Mastanjevic) and M.J.; Investigation, J.L., K.M.(Kristina Mastanjevic), K.M. (Krešimir Mastanjevic), G.N. and M.J.; Writing—Original Draft Preparation, J.L., K.M.(Kristina Mastanjevic) and M.J.; Writing—Review & Editing, J.L., K.M. (Kristina Mastanjevic), K.M. (KrešimirMastanjevic), G.N. and M.J.; Visualization, J.L. and M.J.; Supervision, J.L.
Funding: This research received no external funding.
Conflicts of Interest: The authors declare no conflict of interest. All images shown in this paper are the result ofunpublished research of authors of this review paper.
References
1. Mastanjevic, K.; Krstanovic, V.; Lukinac, J.; Jukic, M.; Lucan, M.; Mastanjevic, K. Craft brewing—Is it reallyabout the sensory revolution? Kvas. Prum. 2019, 65, 13–16. [CrossRef]
2. Gonzalez-Viejo, C.; Fuentes, S.; Li, G.J.; Collmann, R.; Conde, B.; Torrico, D. Development of a roboticpourer constructed with ubiquitous materials, open hardware and sensors to assess beer foam quality usingcomputer vision and pattern recognition algorithms: RoboBEER. Food Res. Int. 2016, 89, 504–513. [CrossRef][PubMed]
3. Baert, J.J.; De Clippeleer, J.; Hughes, P.S.; De Cooman, L.; Aerts, G. On the origin of free and bound stalingaldehydes in beer. J. Agric. Food Chem. 2012, 60, 11449–11472. [CrossRef] [PubMed]
4. Cooper, D.J.; Husband, F.A.; Mills, E.N.C.; Wilde, P.J. Role of beer lipid-binding proteins in preventing lipiddestabilization of foam. J. Agric. Food Chem. 2002, 50, 7645–7650. [CrossRef] [PubMed]
5. Ebienfa, P.; Grudanov, V.; Ermakov, A.; Pozdniakov, V. Improving the process of roasting malt with intensivestirring machine. Ukr. Food J. 2015, 4, 95–108.
6. Bellido-Milla, D.; Moreno-Perez, J.M.; Hernández-Artiga, M.P. Differentiation and classification of beerswith flame atomic spectrometry and molecular absorption spectrometry and sample preparation assisted bymicrowaves. Spectrochim. Acta Part B 2000, 55, 855–864. [CrossRef]
7. Duarte, I.F.; Barros, A.; Almeida, C.; Spraul, M.; Gil, A.M. Multivariate analysis of NMR and FTIR data as apotential tool for the quality control of beer. J. Agric. Food Chem. 2004, 52, 1031–1038. [CrossRef]
8. Lachenmeier, D.W.; Frank, W.; Humpfer, E.; Schäfer, H.; Keller, S.; Mörtter, M. Quality control of beer usinghigh-resolution nuclear magnetic resonance spectroscopy and multivariate analysis. Eur. Food Res. Technol.2005, 220, 215–221. [CrossRef]
9. Lachenmeier, D.W. Rapid quality control of spirit drinks and beer using multivariate data analysis of Fouriertransform infrared spectra. Food Chem. 2007, 101, 825–832. [CrossRef]
10. Patel, K.K.; Kar, A.; Jha, S.N.; Khan, M.A. Machine vision system: A tool for quality inspection of food andagricultural products. J. Food Sci. Technol. 2012, 49, 123–141. [CrossRef]
11. Lukinac, J.; Jukic, M.; Mastanjevic, K.; Lucan, M. Application of computer vision and image analysis methodin cheese-quality evaluation: A review. Ukr. Food J. 2018, 7, 192–214. [CrossRef]
74

Beverages 2019, 5, 38
12. Wu, D.; Sun, D.W. Food colour measurement using computer vision. In Instrumental Assessment of FoodSensory Quality, 1st ed.; Kilcast, D., Ed.; Woodhead Publishing Ltd.: Cambridge, UK, 2013; pp. 165–189.
13. Abdullah, M.Z. Image Acquisition System. In Computer Vision Technology for Food Quality Evaluation, 2nd ed.;Sun, D.-W., Ed.; Academic Press: San Diego, CA, USA, 2016; pp. 3–43.
14. Brosnan, T.; Sun, D.-W. Improving quality inspection of food products by computer vision—A review.J. Food Eng. 2004, 61, 3–16. [CrossRef]
15. Sun, D.-W. Computer Vision Technology for Food Quality Evaluation, 1st ed.; Sun, D.-W., Ed.; Academic Press:San Diego, CA, USA, 2008.
16. Davies, E.R. Computer and Machine Vision, Theory, Algorithms, Practicalities, 4th ed.; Mirmehdi, M., Ed.;Academic Press: Oxford, UK, 2012.
17. Wang, H.-H.; Sun, D.-W. Correlation between cheese meltability determined with a computer vision methodand with Arnott and Schreiber. J. Food Sci. 2002, 67, 745–749. [CrossRef]
18. Moeslund, T.B. Image acquisition. In Introduction to Video and Image Processing. Building Real Systems andApplications, 1st ed.; Moeslund, T.B., Ed.; Springer London Ltd.: London, UK, 2012; pp. 7–24.
19. Gunasekaran, S. Computer vision technology for food quality assurance. Trends Food Sci. Technol. 1996,7, 245–256. [CrossRef]
20. Batchelor, B.G. Machine Vision Handbook, 1st ed.; Batchelor, B.G., Ed.; Springer London Ltd.: London, UK, 2012.21. Pedreschi, F.; Leon, J.; Mery, D.; Moyano, P. Development of a computer vision system to measure the color
of potato chips. Food Res. Int. 2006, 39, 1092–1098. [CrossRef]22. Zuech, N. Machine Vision and Lighting. Machine Vision on Line. 2004. Available online: https://www.visiononline.
org/vision-resources-details.cfm/vision-resources/Machine-Vision-and-Lighting/content_id/1269 (accessed on 25January 2019).
23. Abdullah, M.Z.; Abdul-Aziz, S.; Dos-Mohamed, A.M. Quality inspection of bakery products usingcolour-based machine vision system. J. Food Qual. 2000, 23, 39–50. [CrossRef]
24. Choudhury, A.K.R. Colour measurement instruments. In Principles of Colour and Appearance Volume 1: ObjectAppearance, Colour Perception and Instrumental Measurement, 1st ed.; Choudhury, A.K.R., Ed.; WoodheadPublishing: Cambridge, UK, 2014; pp. 221–269.
25. Sliwinska, M.; Wisniewska, P.; Dymerski, T.; Namiesnik, J.; Wardenki, W. Food analysis using artificial senses.J. Agric. Food Chem. 2014, 62, 1423–1448. [CrossRef] [PubMed]
26. Waltham, N. CCD and CMOS sensors. In Observing Photons in Space. A Guide to Experimental Space Astronomy,2nd ed.; Huber, M.C.E., Pauluhn, A., Culhane, J.L., Timothy, J.G., Wilhelm, K., Zehnder, A., Eds.; Springer:New York, NY, USA, 2013; pp. 443–453.
27. Zhang, B.; Huang, W.; Li, J.; Zhao, C.; Fan, S.; Wu, J.; Liu, C. Principles, developments and applicationsof computer vision for external quality inspection of fruits and vegetables, A review. Food Res. Int. 2014,62, 326–343. [CrossRef]
28. Sun, D.W. Inspecting pizza topping percentage and distribution by a computer vision method. J. Food Eng.2000, 44, 245–249. [CrossRef]
29. Sun, D.-W. Computer vision-an objective, rapid and non-contact quality evaluation tool for the food industry.J. Food Eng. 2004, 61, 1–2. [CrossRef]
30. Ying, Y.; Jing, H.; Tao, Y.; Zhang, N. Detecting stem and shape of pears using fourier transformation and anartificial neural network. Trans. ASAE 2003, 46, 157–162. [CrossRef]
31. Hughes, P.S.; Baxter, E.D. Beer: Quality, Safety and Nutritional Aspects; Righelato, R., Ed.; Royal Society ofChemistry: Cambridge, UK, 2001.
32. De Schutter, D.P.; Saison, D.; Delvaux, F.; Derdelinckx, G.; Delvaux, F.R. The chemistry of aging beer. In Beerin Health and Disease Prevention, 1st ed.; Preedy, V.R., Ed.; Academic Press Inc.: New York, NY, USA, 2008;pp. 375–388.
33. Lewis, M.J.; Bamforth, C.W. Essays in Brewing Science, 1st ed.; Lewis, M.J., Bamforth, C.W., Eds.; Springer:New York, NY, USA, 2006; pp. 20–27.
34. Pozdrik, R.; Roddick, F.A.; Rogers, P.J.; Nguyen, T. Spectrophotometric method for exploring3-methyl-2-butene-1-thiol (MBT) Formation in Lager. J. Agric. Food Chem. 2006, 5, 6123–6129. [CrossRef]
35. Nursten, H.E. The Maillard Reaction, Chemistry, Biochemistry and Implication, 1st ed.; Baynes, J.W., Ed.; The RoyalSociety of Chemistry: Cambridge, UK, 2005.
75
Beverages 2019, 5, 38
36. Park, C.W.; Kang, K.O.; Kim, W.J. Effects of reaction conditions for improvement of caramelization rate.Korean J. Food Sci. Technol. 1998, 30, 983–987.
37. Committee of the EBC. Analytica EBC; Schweizer Brauerei-Rundschau: Zurich, Switzerland, 1975.38. Smedley, S.M. Colour determination of beer using tristimulus values. J. Inst. Brew. 1992, 98, 497–504.
[CrossRef]39. De Lange, A.J. Color. In Brewing Materials and Processes. A Practical Approach to Beer Excellence, 1st ed.;
Bamforth, C.W., Ed.; Academic Press Elsevier: London, UK, 2016; pp. 199–249.40. De Lange, A.J. The standard reference method of beer color specification as the basis for a new method of
beer color reporting. J. Am. Soc. Brew. Chem. 2008, 66, 143–150.41. Davies, N.L. Perception of color and flavor in malt. MBAA Tech. Q. 2010, 474, 12–16. [CrossRef]42. Yagiz, Y.; Balaban, M.O.; Kristinsson, H.G.; Welt, B.A.; Marshall, M.R. Comparison of Minolta colorimeter
and machine vision system in measuring colour of irradiated Atlantic salmon. J. Sci. Food Agric. 2009, 89,728–730. [CrossRef]
43. Leon, K.; Mery, D.; Pedreschi, F.; Leon, J. Color measurement in L*a*b* units from RGB digital images.Food Res. Int. 2006, 39, 1084–1091. [CrossRef]
44. Silva, T.C.O.; Godinho, M.S.; De Oliveira, A.E. Identification of pale lager beers via image analysis. Lat. Am.Appl. Res. 2011, 41, 141–145.
45. Nikolova, K.T.; Gabrova, R.; Boyadzhiev, D.; Pisanova, E.S.; Ruseva, J.; Yanakiev, D. Classification of differenttypes of beer according to their colour characteristics. J. Phys. Conf. Ser. 2017, 794, 1742–6596. [CrossRef]
46. Mastanjevic, K.; Krstanovic, V.; Lukinac, J.; Jukic, M.; Vulin, Z.; Mastanjevic, K. Beer–The Importance ofcolloidal stability (non-biological haze). Fermentation 2018, 4, 91. [CrossRef]
47. Bamforth, C.W. The relative significance of physics and chemistry for beer foam excellence: Theory andpractice. J. Inst. Brew. 2004, 110, 259–266. [CrossRef]
48. Bamforth, C.W. The foaming properties of beer. J. Inst. Brew. 1985, 91, 370–383. [CrossRef]49. Saxena, S.C.; Patel, D.; Smith, D.N.; Ruether, J.A. An assessment of experimental techniques for the
measurement of bubble size in a bubble slurry reactor as applied to indirect coal liquefaction. Chem. Eng.Commun. 1988, 63, 87–127. [CrossRef]
50. Shafer, N.E.; Zare, R.N. Through a beer glass darkly. Phys. Today 1991, 44, 48–52. [CrossRef]51. Lubetkin, S.; Blackwell, B. The nucleation of bubbles in supersaturated solutions. J. Colloids Interface Sci.
1988, 26, 610–615. [CrossRef]52. Liger-Belair, G.; Marchal, R.; Robillard, B.; Vignes-Adler, M.; Maujean, A.; Jeandet, P. Study of effervescence
in a glass of champagne: Frequencies of bubble formation, growth rates, and velocities of rising bubbles.Am. J. Enol. Vitic. 1999, 50, 317–323.
53. Hepworth, N.J.; Hammond, J.R.M.; Varley, J. Novel application of computer vision to determine bubble sizedistributions in beer. J. Food Eng. 2004, 61, 119–124. [CrossRef]
54. Hepworth, N.J.; Boyd, J.W.R.; Hammond, J.R.M.; Varley, J. Modelling the effect of liquid motion on bubblenucleation during beer dispense. Chem. Eng. Sci. 2003, 58, 4071–4084. [CrossRef]
55. Hepworth, N.J.; Varley, J.; Hind, A. Characterizing gas bubble dispersions in beer. Food Bioprod. Process. 2001,79, 13–20. [CrossRef]
56. Zabulis, X.; Papara, M.; Chatziargyriou, A.; Karapantsios, T.D. Detection of densely dispersed sphericalbubbles in digital images based on a template matching technique—Application to wet foams. Colloids Surf.A Physicochem. Eng. Asp. 2007, 309, 96–106. [CrossRef]
57. Evans, D.E.; Bamforth, C.W. Beer foam: Achieving a suitable head. In Beer: A Quality Perspective, 1st ed.;Bamforth, C.W., Ed.; Academic Press: Burlington, NJ, USA, 2009; pp. 1–60.
58. Asano, K.; Hashimoto, N. Isolation and characterization of foaming proteins of beer. J. Am. Soc. Brew. Chem.1980, 38, 129–137. [CrossRef]
59. Evans, D.E.; Sheehan, M.C. Do not be fobbed off, the substance of beer foam, a review. J. Am. Soc. Brew. Chem.2002, 60, 47–57.
60. Kunimune, T. Foam Enhancing Properties of Hop Bitter Acids and Propylene Glycol Alginate. Master’sThesis, Oregon State University, Corvallis, OR, USA, 14 January 2007.
61. Hao, J.L.Q.; Dong, J.; Yu, J.; Fan, W.; Chen, J. Identification of the major proteins in beer foam by massspectometry following sodium dodecyl sulphatepolyacrylamide gel electrophoresis. J. Am. Soc. Brew. Chem.2006, 64, 166–174.
76

Beverages 2019, 5, 38
62. Evans, E.D.; Surrel, A.; Sheehly, M.; Stewart, D.C.; Robinson, L.H. Comparison of foam quality and theinfluence of hop alpha-acids and proteins using five foam analysis methods. J. Am. Soc. Brew. Chem. 2008,66, 1–10.
63. Constant, M. A practical method for characterizing poured beer foam. J. Am. Soc. Brew. Chem. 1992, 50, 37–47.[CrossRef]
64. Yasui, K.; Yakoi, S.; Shigyo, T.; Tamaki, T.; Shinotsuka, K.A. Customer-orientated approach to the developmentof a visual and statistical foam analysis. J. Am. Soc. Brew. Chem. 1998, 56, 152–158.
65. Wallin, C.E.; Di Pietro, M.B.; Schwarz, R.W.; Bamforth, C.W. A comparison of three methods for the assessmentof foam stability of beer. J. Inst. Brew. 1992, 116, 78–80. [CrossRef]
66. Kruss Application Report: Comparison of The Foam Behaviour of Different Types of Beer Independently ofCO2 Content. (Kruss, AR275). Available online: https://www.kruss-scientific.com/fileadmin/user_upload/website/literature/kruss-ar275-en.pdf (accessed on 25 January 2019).
67. Sauerbrei, S.; Haß, E.C.; Plath, P.J. The Apollonian decay of beer foam bubble size distribution and thelattices of young diagrams and their correlated mixing functions. Discret. Dyn. Nat. Soc. 2006, 2006, 79717.[CrossRef]
68. Cimini, A.; Pallottino, F.; Menesatti, P.; Moresi, M. A low-cost image analysis system to upgrade the rudinbeer foam head retention meter. Food Bioprocess. Technol. 2016, 9, 1587–1597. [CrossRef]
69. Rudin, A.D. Measurement of the foam stability of beers. J. Inst. Brew. 1957, 63, 506–509. [CrossRef]
© 2019 by the authors. Licensee MDPI, Basel, Switzerland. This article is an open accessarticle distributed under the terms and conditions of the Creative Commons Attribution(CC BY) license (http://creativecommons.org/licenses/by/4.0/).
77
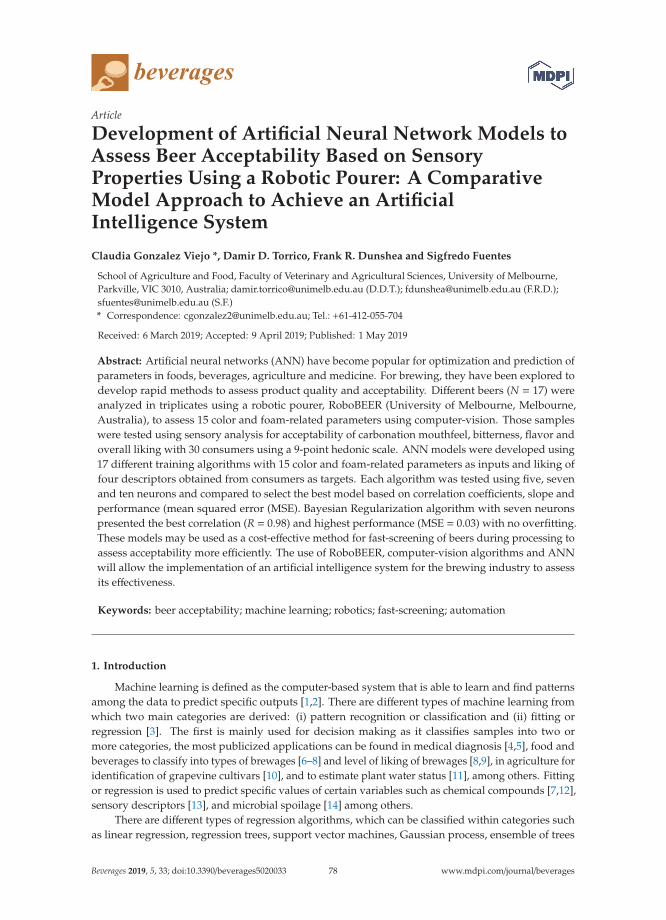
beverages
Article
Development of Artificial Neural Network Models toAssess Beer Acceptability Based on SensoryProperties Using a Robotic Pourer: A ComparativeModel Approach to Achieve an ArtificialIntelligence System
Claudia Gonzalez Viejo *, Damir D. Torrico, Frank R. Dunshea and Sigfredo Fuentes
School of Agriculture and Food, Faculty of Veterinary and Agricultural Sciences, University of Melbourne,Parkville, VIC 3010, Australia; [email protected] (D.D.T.); [email protected] (F.R.D.);[email protected] (S.F.)* Correspondence: [email protected]; Tel.: +61-412-055-704
Received: 6 March 2019; Accepted: 9 April 2019; Published: 1 May 2019
Abstract: Artificial neural networks (ANN) have become popular for optimization and prediction ofparameters in foods, beverages, agriculture and medicine. For brewing, they have been explored todevelop rapid methods to assess product quality and acceptability. Different beers (N = 17) wereanalyzed in triplicates using a robotic pourer, RoboBEER (University of Melbourne, Melbourne,Australia), to assess 15 color and foam-related parameters using computer-vision. Those sampleswere tested using sensory analysis for acceptability of carbonation mouthfeel, bitterness, flavor andoverall liking with 30 consumers using a 9-point hedonic scale. ANN models were developed using17 different training algorithms with 15 color and foam-related parameters as inputs and liking offour descriptors obtained from consumers as targets. Each algorithm was tested using five, sevenand ten neurons and compared to select the best model based on correlation coefficients, slope andperformance (mean squared error (MSE). Bayesian Regularization algorithm with seven neuronspresented the best correlation (R = 0.98) and highest performance (MSE = 0.03) with no overfitting.These models may be used as a cost-effective method for fast-screening of beers during processing toassess acceptability more efficiently. The use of RoboBEER, computer-vision algorithms and ANNwill allow the implementation of an artificial intelligence system for the brewing industry to assessits effectiveness.
Keywords: beer acceptability; machine learning; robotics; fast-screening; automation
1. Introduction
Machine learning is defined as the computer-based system that is able to learn and find patternsamong the data to predict specific outputs [1,2]. There are different types of machine learning fromwhich two main categories are derived: (i) pattern recognition or classification and (ii) fitting orregression [3]. The first is mainly used for decision making as it classifies samples into two ormore categories, the most publicized applications can be found in medical diagnosis [4,5], food andbeverages to classify into types of brewages [6–8] and level of liking of brewages [8,9], in agriculture foridentification of grapevine cultivars [10], and to estimate plant water status [11], among others. Fittingor regression is used to predict specific values of certain variables such as chemical compounds [7,12],sensory descriptors [13], and microbial spoilage [14] among others.
There are different types of regression algorithms, which can be classified within categories suchas linear regression, regression trees, support vector machines, Gaussian process, ensemble of trees
Beverages 2019, 5, 33; doi:10.3390/beverages5020033 www.mdpi.com/journal/beverages78
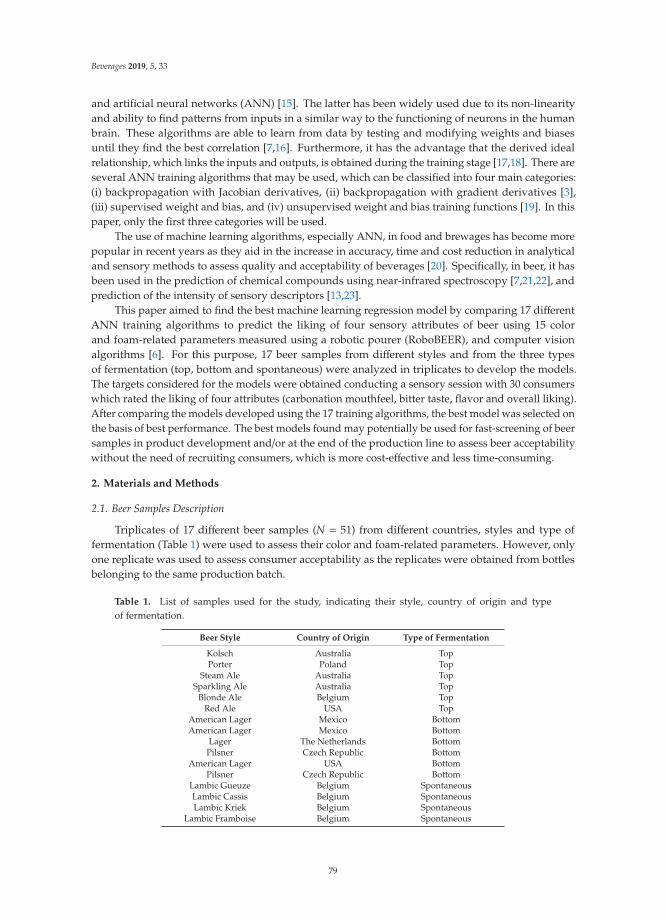
Beverages 2019, 5, 33
and artificial neural networks (ANN) [15]. The latter has been widely used due to its non-linearityand ability to find patterns from inputs in a similar way to the functioning of neurons in the humanbrain. These algorithms are able to learn from data by testing and modifying weights and biasesuntil they find the best correlation [7,16]. Furthermore, it has the advantage that the derived idealrelationship, which links the inputs and outputs, is obtained during the training stage [17,18]. There areseveral ANN training algorithms that may be used, which can be classified into four main categories:(i) backpropagation with Jacobian derivatives, (ii) backpropagation with gradient derivatives [3],(iii) supervised weight and bias, and (iv) unsupervised weight and bias training functions [19]. In thispaper, only the first three categories will be used.
The use of machine learning algorithms, especially ANN, in food and brewages has become morepopular in recent years as they aid in the increase in accuracy, time and cost reduction in analyticaland sensory methods to assess quality and acceptability of beverages [20]. Specifically, in beer, it hasbeen used in the prediction of chemical compounds using near-infrared spectroscopy [7,21,22], andprediction of the intensity of sensory descriptors [13,23].
This paper aimed to find the best machine learning regression model by comparing 17 differentANN training algorithms to predict the liking of four sensory attributes of beer using 15 colorand foam-related parameters measured using a robotic pourer (RoboBEER), and computer visionalgorithms [6]. For this purpose, 17 beer samples from different styles and from the three typesof fermentation (top, bottom and spontaneous) were analyzed in triplicates to develop the models.The targets considered for the models were obtained conducting a sensory session with 30 consumerswhich rated the liking of four attributes (carbonation mouthfeel, bitter taste, flavor and overall liking).After comparing the models developed using the 17 training algorithms, the best model was selected onthe basis of best performance. The best models found may potentially be used for fast-screening of beersamples in product development and/or at the end of the production line to assess beer acceptabilitywithout the need of recruiting consumers, which is more cost-effective and less time-consuming.
2. Materials and Methods
2.1. Beer Samples Description
Triplicates of 17 different beer samples (N = 51) from different countries, styles and type offermentation (Table 1) were used to assess their color and foam-related parameters. However, onlyone replicate was used to assess consumer acceptability as the replicates were obtained from bottlesbelonging to the same production batch.
Table 1. List of samples used for the study, indicating their style, country of origin and typeof fermentation.
Beer Style Country of Origin Type of Fermentation
Kolsch Australia TopPorter Poland Top
Steam Ale Australia TopSparkling Ale Australia Top
Blonde Ale Belgium TopRed Ale USA Top
American Lager Mexico BottomAmerican Lager Mexico Bottom
Lager The Netherlands BottomPilsner Czech Republic Bottom
American Lager USA BottomPilsner Czech Republic Bottom
Lambic Gueuze Belgium SpontaneousLambic Cassis Belgium SpontaneousLambic Kriek Belgium Spontaneous
Lambic Framboise Belgium Spontaneous
79
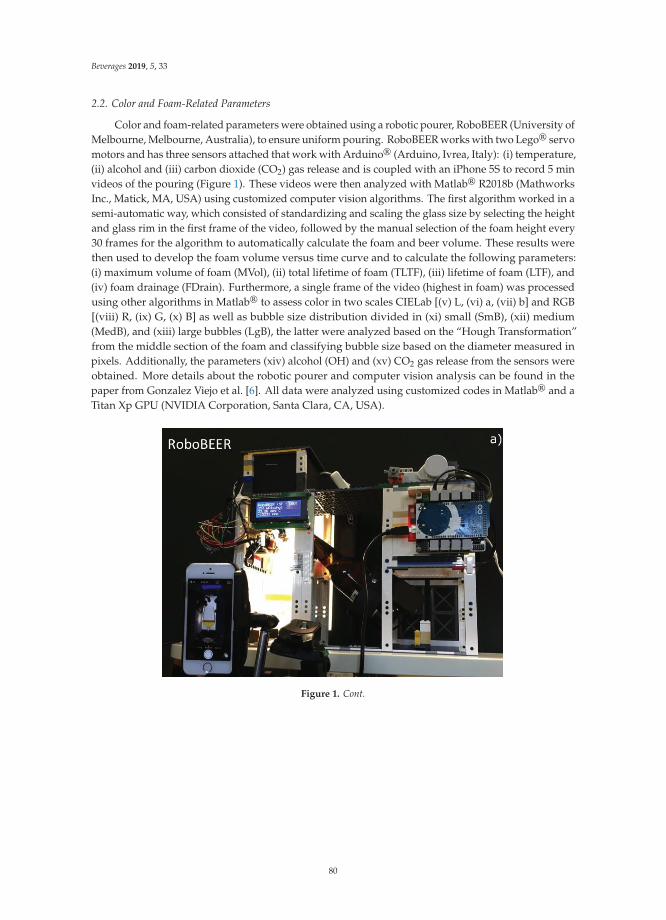
Beverages 2019, 5, 33
2.2. Color and Foam-Related Parameters
Color and foam-related parameters were obtained using a robotic pourer, RoboBEER (University ofMelbourne, Melbourne, Australia), to ensure uniform pouring. RoboBEER works with two Lego® servomotors and has three sensors attached that work with Arduino® (Arduino, Ivrea, Italy): (i) temperature,(ii) alcohol and (iii) carbon dioxide (CO2) gas release and is coupled with an iPhone 5S to record 5 minvideos of the pouring (Figure 1). These videos were then analyzed with Matlab® R2018b (MathworksInc., Matick, MA, USA) using customized computer vision algorithms. The first algorithm worked in asemi-automatic way, which consisted of standardizing and scaling the glass size by selecting the heightand glass rim in the first frame of the video, followed by the manual selection of the foam height every30 frames for the algorithm to automatically calculate the foam and beer volume. These results werethen used to develop the foam volume versus time curve and to calculate the following parameters:(i) maximum volume of foam (MVol), (ii) total lifetime of foam (TLTF), (iii) lifetime of foam (LTF), and(iv) foam drainage (FDrain). Furthermore, a single frame of the video (highest in foam) was processedusing other algorithms in Matlab® to assess color in two scales CIELab [(v) L, (vi) a, (vii) b] and RGB[(viii) R, (ix) G, (x) B] as well as bubble size distribution divided in (xi) small (SmB), (xii) medium(MedB), and (xiii) large bubbles (LgB), the latter were analyzed based on the “Hough Transformation”from the middle section of the foam and classifying bubble size based on the diameter measured inpixels. Additionally, the parameters (xiv) alcohol (OH) and (xv) CO2 gas release from the sensors wereobtained. More details about the robotic pourer and computer vision analysis can be found in thepaper from Gonzalez Viejo et al. [6]. All data were analyzed using customized codes in Matlab® and aTitan Xp GPU (NVIDIA Corporation, Santa Clara, CA, USA).
Figure 1. Cont.
80
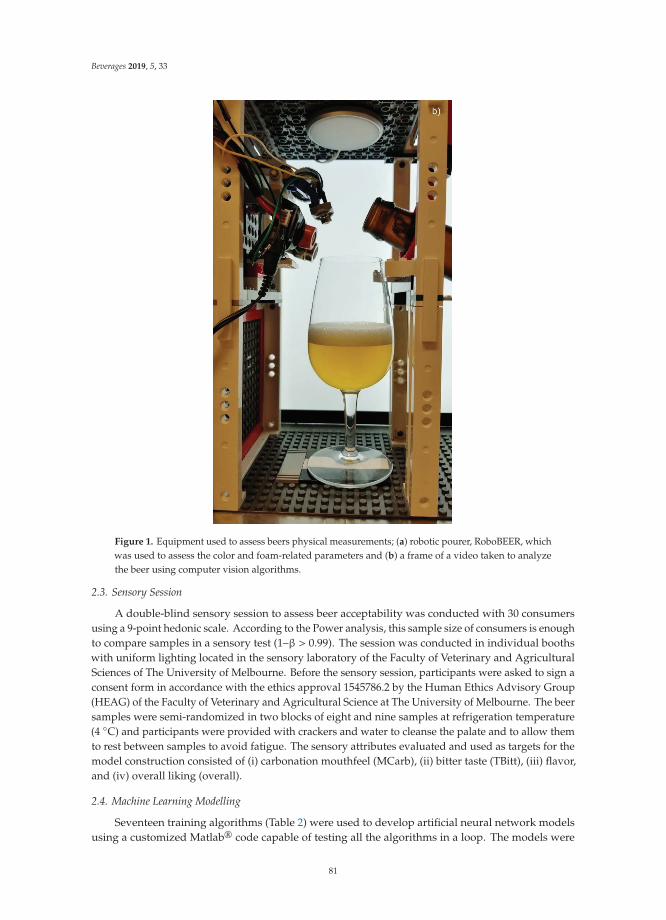
Beverages 2019, 5, 33
Figure 1. Equipment used to assess beers physical measurements; (a) robotic pourer, RoboBEER, whichwas used to assess the color and foam-related parameters and (b) a frame of a video taken to analyzethe beer using computer vision algorithms.
2.3. Sensory Session
A double-blind sensory session to assess beer acceptability was conducted with 30 consumersusing a 9-point hedonic scale. According to the Power analysis, this sample size of consumers is enoughto compare samples in a sensory test (1–β > 0.99). The session was conducted in individual boothswith uniform lighting located in the sensory laboratory of the Faculty of Veterinary and AgriculturalSciences of The University of Melbourne. Before the sensory session, participants were asked to sign aconsent form in accordance with the ethics approval 1545786.2 by the Human Ethics Advisory Group(HEAG) of the Faculty of Veterinary and Agricultural Science at The University of Melbourne. The beersamples were semi-randomized in two blocks of eight and nine samples at refrigeration temperature(4 ◦C) and participants were provided with crackers and water to cleanse the palate and to allow themto rest between samples to avoid fatigue. The sensory attributes evaluated and used as targets for themodel construction consisted of (i) carbonation mouthfeel (MCarb), (ii) bitter taste (TBitt), (iii) flavor,and (iv) overall liking (overall).
2.4. Machine Learning Modelling
Seventeen training algorithms (Table 2) were used to develop artificial neural network modelsusing a customized Matlab® code capable of testing all the algorithms in a loop. The models were
81
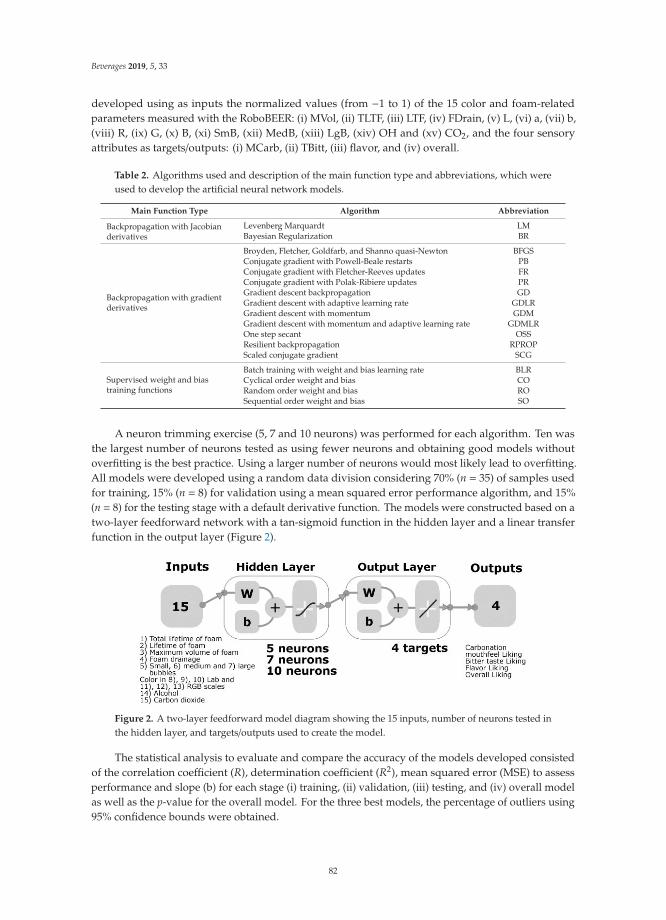
Beverages 2019, 5, 33
developed using as inputs the normalized values (from −1 to 1) of the 15 color and foam-relatedparameters measured with the RoboBEER: (i) MVol, (ii) TLTF, (iii) LTF, (iv) FDrain, (v) L, (vi) a, (vii) b,(viii) R, (ix) G, (x) B, (xi) SmB, (xii) MedB, (xiii) LgB, (xiv) OH and (xv) CO2, and the four sensoryattributes as targets/outputs: (i) MCarb, (ii) TBitt, (iii) flavor, and (iv) overall.
Table 2. Algorithms used and description of the main function type and abbreviations, which wereused to develop the artificial neural network models.
Main Function Type Algorithm Abbreviation
Backpropagation with Jacobianderivatives
Levenberg Marquardt LMBayesian Regularization BR
Backpropagation with gradientderivatives
Broyden, Fletcher, Goldfarb, and Shanno quasi-Newton BFGSConjugate gradient with Powell-Beale restarts PBConjugate gradient with Fletcher-Reeves updates FRConjugate gradient with Polak-Ribiere updates PRGradient descent backpropagation GDGradient descent with adaptive learning rate GDLRGradient descent with momentum GDMGradient descent with momentum and adaptive learning rate GDMLROne step secant OSSResilient backpropagation RPROPScaled conjugate gradient SCG
Supervised weight and biastraining functions
Batch training with weight and bias learning rate BLRCyclical order weight and bias CORandom order weight and bias ROSequential order weight and bias SO
A neuron trimming exercise (5, 7 and 10 neurons) was performed for each algorithm. Ten wasthe largest number of neurons tested as using fewer neurons and obtaining good models withoutoverfitting is the best practice. Using a larger number of neurons would most likely lead to overfitting.All models were developed using a random data division considering 70% (n = 35) of samples usedfor training, 15% (n = 8) for validation using a mean squared error performance algorithm, and 15%(n = 8) for the testing stage with a default derivative function. The models were constructed based on atwo-layer feedforward network with a tan-sigmoid function in the hidden layer and a linear transferfunction in the output layer (Figure 2).
Figure 2. A two-layer feedforward model diagram showing the 15 inputs, number of neurons tested inthe hidden layer, and targets/outputs used to create the model.
The statistical analysis to evaluate and compare the accuracy of the models developed consistedof the correlation coefficient (R), determination coefficient (R2), mean squared error (MSE) to assessperformance and slope (b) for each stage (i) training, (ii) validation, (iii) testing, and (iv) overall modelas well as the p-value for the overall model. For the three best models, the percentage of outliers using95% confidence bounds were obtained.
82

Beverages 2019, 5, 33
3. Results
Table 3 shows the statistical data of the best and worse models developed from each group oftraining algorithms. For the backpropagation with Jacobian derivatives algorithm, there was no worsemodel as those from both algorithms within the group produced two of the best models. Tables S1–S3in Supplementary Material show the statistical data of the models developed using the 17 trainingalgorithms. Correlations from all models were significant with a p-value < 0.0001. It can be observedthat the algorithms with the lowest R and R2 were from the gradient descent backpropagation with fiveand seven neurons (Table 3; Table S1), the batch training with weight and bias learning rate with sevenneurons (Table 3) and the sequential order weight and bias with five neurons (Table S3). On the otherhand, the models with the highest R and R2 were with those developed using seven neurons from bothalgorithms belonging to the backpropagation with Jacobian derivatives function (LM and BR) and theRPROP with R values consistently over 0.90 for all stages (Table 3). Furthermore, the slope from thesethree best models was close to unity (b ~ 1) for all stages, with the RPROP having the lowest slopevalues with a b = 0.90 for the overall model (Table 3; Figure 3). On the other hand, the three modelshad low MSE values (≤0.06) for the three stages and overall model. Table 3 also shows the best modelfrom the supervised weight and bias algorithms; however, this still had some signs of overfitting as thevalidation and testing performances were not as close (MSE = 0.10 and 0.06, respectively) and the Rvalues were lower than the three best models.
Table 3. Statistical results of the best and worse models developed using the algorithms from the threedifferent groups. Numbers in bold represent the models with the highest correlation and determinationcoefficients from each group of algorithms.
Algorithm Neurons Stage R R2 b MSE
Backpropagation with Jacobian derivatives algorithm
Levenberg Marquardt 7
Training 0.96 0.92 0.94 0.02
Validation 0.95 0.90 1.00 0.06
Testing 0.95 0.90 1.10 0.05
Overall 0.95 0.90 0.98 0.03
Bayesian Regularization 7
Training 0.99 0.98 0.97 0.01
Validation - - - -
Testing 0.97 0.94 1.1 0.03
Overall 0.98 0.96 1.0 0.01
Backpropagation with gradient derivative algorithms
Gradient descent backpropagation 5
Training 0.83 0.69 0.60 0.04Validation 0.67 0.45 0.39 0.07Testing 0.65 0.42 0.57 0.11Overall 0.77 0.59 0.56 0.06
Resilient backpropagation 7
Training 0.95 0.90 0.90 0.02
Validation 0.95 0.90 0.91 0.04
Testing 0.93 0.86 0.97 0.04
Overall 0.95 0.90 0.90 0.03
Supervised weight and bias algorithms
Batch training with weight and biaslearning rate 7
Training 0.80 0.64 0.59 0.10Validation 0.67 0.45 0.49 0.13Testing 0.76 0.58 0.57 0.11Overall 0.76 0.58 0.57 0.06
Random order weight and bias 10
Training 0.89 0.79 0.82 0.06
Validation 0.84 0.71 0.74 0.10
Testing 0.88 0.77 1.10 0.06
Overall 0.87 0.76 0.83 0.06
Figure 3 shows the training, validation, testing and overall models of the three best algorithmsdeveloped using 7 neurons. Model 1 (Figure 3a), which was developed with the Levenberg-Marquardtalgorithm, had a training R = 0.96, and validation, testing and overall R = 0.95, furthermore, the overallmodel had 6.86% of outliers according to the 95% confidence bounds. Figure 3b shows Model 2 with
83

Beverages 2019, 5, 33
the Bayesian regularization algorithm with R = 0.99 for the training stage, R = 0.98 for testing andoverall model with R = 0.98 and 5.88% outliers, this algorithm does not use a validation stage. On theother hand, Figure 3c depicts Model 3 developed using the RPROP algorithm, which also had a highR = 0.95 for training and validation stages, R = 0.93 for testing and an overall model with R = 0.95 anda low percentage of outliers (4.90%). It can be observed that in the overall models, some predictedvalues are >1 or < −1, this is because the targets were normalized based on the range of data obtainedin the study (3–7); however, the liking hedonic scale is within the 1–9 range, therefore, a value <−1or >1, will still fit within the 1–9 scale when reversing the normalization.
Figure 3. Models showing the three stages (training, validation and testing) as well as overall modelof the three best algorithms found to assess liking of beer from morpho-colorimetric parametersfrom beer and beer foam: (a) Levenberg Marquardt, (b) Bayesian Regularization and (c) ResilientBackpropagation, showing the correlation coefficient (R) and 95% confidence bounds. In all graphs, thex-axis represents the observed data and y-axis the predicted or estimated values. N/A = not applicable.
4. Discussion
According to Beale, et al. [24], an indicator of a good model with no overfitting is when thevalidation correlation coefficient is close to the value from the training stage, which was met by thethree best models found in this paper (Table 3 and Figure 3). The Bayesian regularization model(Model 2) does not have a validation stage; however, the R values of the other three stages are high andsimilar. Furthermore, an indication of a model with no overfitting is that the training performance(MSE) must be lower than the other stages, and the gap between the validation and testing MSE mustbe small [3,24]. This was also met by the best models found in this paper (Table 3).
The Levenberg-Marquardt algorithm (Model 1) is a backpropagation function, which works bycalculating the second derivatives of a cost function. The advantages of this algorithm are: (i) thatit is capable of giving a solution even though its start-point is far from the final minimum, (ii) itsprocessing time is one of the lowest compared to other algorithms, (iii) the training algorithm stopswhen it finds the maximum epoch and (iv) the best performance value is achieved, or when it finds
84

Beverages 2019, 5, 33
that the gradient value is lower than its minimum [25]. However, some disadvantages include: (i) itmay not always secure a global optimum for an unrestrained optimization issue and ii) it may requirehigher memory usage [26]. On the other hand, the Bayesian regularization algorithm (Model 2) worksusing the same principles of Levenberg Marquardt but updating the weights and biases accordingto the optimization. The main advantages of this algorithm include: (i) lower memory usage, (ii) ithas a good generalization for noisy or small datasets, (iii) it avoids overfitting effectively and (iv) itdoes not require a validation stage [17,25,27]. The RPROP (Model 3) works through an adaptationof the weight values according to the information of the local gradient, based only on the sign of thederivative. Its purpose is to avoid the negative effects of the small magnitude of partial derivativeswhich often result in small or null changes in weights and biases. The training stops when it reachesthe maximum number of epochs or time, or when the best performance has been reached [28,29].Some of the advantages of RPROP are: (i) the performance is better than other techniques used foradaptation [30] and (ii) it has fast convergence and low memory usage [31].
Based on the results from the three best models found to assess beer liking and acceptability byconsumers, and considering the advantages and disadvantages of the algorithms, it can be said thatModel 2 is the most appropriate for the prediction of beer liking using beer color and foam-relatedparameters. This is based on the highest correlation coefficient (R = 0.98), best performance, good fitwithin the confidence bounds with a low number of outliers, overall slope b = 1 and, therefore, no signsof overfitting. Furthermore, the dataset used met the small database requirements (N = 51), which isappropriate for the Bayesian Regularization.
The implementation of the models presented in this paper would allow a reduction in time andcosts for the brewers when developing new products. It may also be used to do a fast-screening of anynew developments without the need to conduct large sensory tests with consumers, which requirestime for preparation, data gathering and analysis as well as financial resources for sampling andrecruiting of consumers. This model allows accurate prediction of the liking of carbonation mouthfeel,flavor, bitterness, and overall liking using the physical parameters related to color and foam, this beingpossible because consumers are able to judge beer quality and acceptability based only on the visualattributes which give the first impression [8,9,32]. Furthermore, there is a relationship between thefoam and color-related parameters, and bitterness as the iso-α-acids derived from hops are responsiblefor bitterness, but also contribute to foamability and foam stability due to their tensio-active properties.Furthermore, hops contribute to the development of aromas and flavors in beer, and foam aids in therelease of aromas and flavors when bubbles burst [8,13,33,34].
Since the models are based on an automated data gathering process by using the RoboBEER andvideo analysis of pouring using computer vision algorithms, an artificial intelligence (AI) applicationmay be implemented. This will offer to the beer industry a completely automated process to predictliking and acceptability of different beers by consumers.
5. Conclusions
The comparison of different artificial neural network algorithms aids in the selection of the bestmodel making sure that it has no overfitting and it has the best performance. However, it is alsoimportant to consider the advantages and disadvantages of the algorithms in accordance with thedataset details and intended application to make the best choice. The best algorithm for the specificmodel presented in this paper was the Bayesian Regularization with very high accuracy (R = 0.98), andit would aid in the optimization of costs and time for breweries to assess beer acceptability withoutthe need of recruiting consumers and running sensory sessions, being able to get the results withinminutes. This is important, especially when having a large number of prototypes when developingnew beer products. The use of the RoboBEER, computer vision algorithms and the ANN algorithmsfound in this research will allow the implementation of an AI system for the brewing industry to assessthe effectiveness of beer making in terms of quality and acceptability of consumers.
85

Beverages 2019, 5, 33
Supplementary Materials: The following are available online at http://www.mdpi.com/2306-5710/5/2/33/s1,Table S1: Statistical results of the models developed using the backpropagation with Jacobian derivativesalgorithm. Numbers in green and bold represent the models with the highest correlation and determinationcoefficients. Table S2: Statistical results of the models developed using the backpropagation with gradient derivativealgorithms. Numbers in red and italics represent the models with the lowest correlation and determinationcoefficients, while those in green and bold represent the highest values. Table S3: Statistical results of the modelsdeveloped using the supervised weight and bias algorithms. Numbers in red and italics represent the modelswith the lowest correlation and determination coefficients.
Author Contributions: Conceptualization, C.G.V., D.D.T. and S.F.; Formal analysis, C.G.V. and S.F.; Methodology,C.G.V. and S.F.; Supervision, D.D.T., F.R.D. and S.F.; Validation, C.G.V. and S.F.; Writing—original draft, C.G.V.;Writing—review & editing, D.D.T., F.R.D. and S.F.
Funding: This research received no external funding.
Acknowledgments: We gratefully acknowledge the support of NVIDIA Corporation with the donation of theTitan Xp GPU used for this research. This research was supported by the Australian Government through theAustralian Research Council [Grant number IH120100053] “Unlocking the Food Value Chain: Australian industrytransformation for ASEAN markets”. C.G.V. is supported by the Melbourne Research Scholarship from theUniversity of Melbourne.
Conflicts of Interest: The authors declare no conflict of interest.
References
1. Michalski, R.S.; Carbonell, J.G.; Mitchell, T.M. Machine Learning: An Artificial Intelligence Approach; ElsevierScience: Amsterdam, The Netherlands, 2014.
2. Bell, J. Machine Learning: Hands-On for Developers and Technical Professionals; Wiley: Hoboken, NJ, USA, 2014.3. Goodfellow, I.; Bengio, Y.; Courville, A. Deep Learning; MIT Press: Cambridge, MA, USA, 2016.4. Guyon, I.; Weston, J.; Barnhill, S.; Vapnik, V. Gene selection for cancer classification using support vector
machines. Mach. Learn. 2002, 46, 389–422. [CrossRef]5. Polat, K.; Günes, S. Breast cancer diagnosis using least square support vector machine. Digit. Signal Process.
2007, 17, 694–701. [CrossRef]6. Gonzalez Viejo, C.; Fuentes, S.; Li, G.; Collmann, R.; Condé, B.; Torrico, D. Development of a robotic
pourer constructed with ubiquitous materials, open hardware and sensors to assess beer foam quality usingcomputer vision and pattern recognition algorithms: RoboBEER. Food Res. Int. 2016, 89, 504–513. [CrossRef]
7. Gonzalez Viejo, C.; Fuentes, S.; Torrico, D.; Howell, K.; Dunshea, F.R. Assessment of beer quality based onfoamability and chemical composition using computer vision algorithms, near infrared spectroscopy andmachine learning algorithms. J. Sci. Food Agric. 2018, 98, 618–627. [CrossRef] [PubMed]
8. Gonzalez Viejo, C.; Fuentes, S.; Howell, K.; Torrico, D.D.; Dunshea, F.R. Integration of non-invasive biometricswith sensory analysis techniques to assess acceptability of beer by consumers. Physiol. Behav. 2019, 200,139–147. [CrossRef]
9. Gonzalez Viejo, C.; Fuentes, S.; Howell, K.; Torrico, D.; Dunshea, F.R. Robotics and computer visiontechniques combined with non-invasive consumer biometrics to assess quality traits from beer foamabilityusing machine learning: A potential for artificial intelligence applications. Food Control 2018, 92, 72–79.[CrossRef]
10. Fuentes, S.; Hernández-Montes, E.; Escalona, J.; Bota, J.; Gonzalez Viejo, C.; Poblete-Echeverría, C.;Tongson, E.; Medrano, H. Automated grapevine cultivar classification based on machine learning using leafmorpho-colorimetry, fractal dimension and near-infrared spectroscopy parameters. Comput. Electron. Agric.2018, 151, 311–318. [CrossRef]
11. Romero, M.; Luo, Y.; Su, B.; Fuentes, S. Vineyard water status estimation using multispectral imagery froman UAV platform and machine learning algorithms for irrigation scheduling management. Comput. Electron.Agric. 2018, 147, 109–117. [CrossRef]
12. Yu, H.Y.; Niu, X.Y.; Lin, H.J.; Ying, Y.B.; Li, B.B.; Pan, X.X. A feasibility study on on-line determination of ricewine composition by Vis–NIR spectroscopy and least-squares support vector machines. Food Chem. 2009,113, 291–296. [CrossRef]
13. Gonzalez Viejo, C.; Fuentes, S.; Torrico, D.D.; Howell, K.; Dunshea, F.R. Assessment of Beer Quality Based ona Robotic Pourer, Computer Vision, and Machine Learning Algorithms Using Commercial Beers. J. Food Sci.2018, 83, 1381–1388. [CrossRef] [PubMed]
86
Beverages 2019, 5, 33
14. Ellis, D.I.; Broadhurst, D.; Kell, D.B.; Rowland, J.J.; Goodacre, R. Rapid and quantitative detection of themicrobial spoilage of meat by Fourier transform infrared spectroscopy and machine learning. Appl. Environ.Microbiol. 2002, 68, 2822–2828. [CrossRef]
15. Mathworks Inc. Mastering Machine Learning: A Step-by-Step Guide with MATLAB; Mathworks Inc.: Sherborn,MA, USA, 2018.
16. Lin, M.-I.B.; Groves, W.A.; Freivalds, A.; Lee, E.G.; Harper, M. Comparison of artificial neural network (ANN)and partial least squares (PLS) regression models for predicting respiratory ventilation: An exploratorystudy. Eur. J. Appl. Physiol. 2012, 112, 1603–1611. [CrossRef] [PubMed]
17. Amini, M.; Abbaspour, K.C.; Khademi, H.; Fathianpour, N.; Afyuni, M.; Schulin, R. Neural network modelsto predict cation exchange capacity in arid regions of Iran. Eur. J. Soil Sci. 2005, 56, 551–559. [CrossRef]
18. Schaap, M.G.; Leij, F.J.; Van Genuchten, M.T. Neural network analysis for hierarchical prediction of soilhydraulic properties. Soil Sci. Soc. Am. J. 1998, 62, 847–855. [CrossRef]
19. Ogunoiki, A.; Olatunbosun, O. Artificial Road Load Generation Using Artificial Neural Networks; 0148-7191; SAETechnical Paper; SAE: Warrendale, PA, USA, 2015.
20. Buss, D. Food Companies Get Smart About Artificial Intelligence. Food Technol. 2018, 72, 26–41.21. Cajka, T.; Riddellova, K.; Tomaniova, M.; Hajslova, J. Recognition of beer brand based on multivariate
analysis of volatile fingerprint. J. Chromatogr. A 2010, 1217, 4195–4203. [CrossRef]22. Iñón, F.A.; Garrigues, S.; de la Guardia, M. Combination of mid-and near-infrared spectroscopy for the
determination of the quality properties of beers. Anal. Chim. Acta 2006, 571, 167–174. [CrossRef]23. Gonzalez Viejo, C.; Fuentes, S.; Torrico, D.; Lee, M.; Hu, Y.; Chakraborty, S.; Dunshea, F. The Effect of
Soundwaves on Foamability Properties and Sensory of Beers with a Machine Learning Modeling Approach.Beverages 2018, 4, 53. [CrossRef]
24. Beale, M.H.; Hagan, M.T.; Demuth, H.B. Deep Learning Toolbox User’s Guide; Mathworks Inc.: Sherborn, MA,USA, 2018.
25. Markopoulos, A.P.; Georgiopoulos, S.; Manolakos, D.E. On the use of back propagation and radial basisfunction neural networks in surface roughness prediction. J. Ind. Eng. Int. 2016, 12, 389–400. [CrossRef]
26. Saduf, M.A.W. Comparative study of back propagation learning algorithms for neural networks. Int. J. Adv.Res. Comput. Sci. Softw. Eng. 2013, 3, 1151–1156.
27. Kayri, M. Predictive abilities of bayesian regularization and Levenberg–Marquardt algorithms in artificialneural networks: A comparative empirical study on social data. Math. Comput. Appl. 2016, 21, 20. [CrossRef]
28. Riedmiller, M.; Braun, H. A Direct Adaptive Method for Faster Backpropagation Learning: The RPROPAlgorithm. In Proceedings of the IEEE International Conference on Neural Networks, San Francisco, CA,USA, 28 March–1 April 1993; pp. 586–591.
29. Mathworks Inc. Resilient Backpropagation. Available online: https://au.mathworks.com/help/deeplearning/ref/trainrp.html (accessed on 1 October 2018).
30. Patnaik, L.M.; Rajan, K. Target detection through image processing and resilient propagation algorithms.Neurocomputing 2000, 35, 123–135. [CrossRef]
31. Pajchrowski, T.; Zawirski, K.; Nowopolski, K. Neural speed controller trained online by means of modifiedRPROP algorithm. IEEE Trans. Ind. Inform. 2015, 11, 560–568. [CrossRef]
32. Bamforth, C. Perceptions of beer foam. J. Inst. Brew. 2000, 106, 229–238. [CrossRef]33. De Keukeleire, D. Fundamentals of beer and hop chemistry. Quim. Nova 2000, 23, 108–112. [CrossRef]34. Liger-Belair, G.; Cilindre, C.; Gougeon, R.D.; Lucio, M.; Gebefügi, I.; Jeandet, P.; Schmitt-Kopplin, P.
Unraveling different chemical fingerprints between a champagne wine and its aerosols. Proc. Natl. Acad.Sci. USA 2009, 106, 16545–16549. [CrossRef]
© 2019 by the authors. Licensee MDPI, Basel, Switzerland. This article is an open accessarticle distributed under the terms and conditions of the Creative Commons Attribution(CC BY) license (http://creativecommons.org/licenses/by/4.0/).
87
beverages
Article
The Effect of Soundwaves on Foamability Propertiesand Sensory of Beers with a Machine LearningModeling Approach
Claudia Gonzalez Viejo, Sigfredo Fuentes *, Damir D. Torrico, Mei Huii Lee, Yue Qin Hu,
Sanjit Chakraborty and Frank R. Dunshea
School of Agriculture and Food, Faculty of Veterinary and Agricultural Sciences, University of Melbourne,Melbourne, VIC 3010, Australia; [email protected] (C.G.V.); [email protected] (D.D.T.);[email protected] (M.H.L.); [email protected] (Y.Q.H.);[email protected] (S.C.); [email protected] (F.R.D.)* Correspondence: [email protected]; Tel.: +61-3-9035-9670
Received: 10 July 2018; Accepted: 25 July 2018; Published: 26 July 2018
Abstract: The use of ultrasounds has been implemented to increase yeast viability, de-foaming,and cavitation in foods and beverages. However, the application of low frequency audible sound todecrease bubble size and improve foamability has not been explored. In this study, three treatmentsusing India Pale Ale beers were tested, which include (1) a control, (2) the application of audiblesound during fermentation, and (3) the application of audible sound during natural carbonation.Five different audible frequencies (20 Hz, 30 Hz, 45 Hz, 55 Hz, and 75 Hz) were applied daily forone minute each (starting from the lowest frequency) during fermentation (11 days, treatment 2) andcarbonation (22 days, treatment 3). Samples were measured in triplicates using the RoboBEER toassess color and foam-related parameters. A trained panel (n = 10) evaluated the intensity of sensorydescriptors. Results showed that samples with sonication treatment had significant differences in thenumber of small bubbles, alcohol, and viscosity compared to the control. Furthermore, except forfoam texture, foam height, and viscosity, there were non-significant differences in the intensity of anysensory descriptor, according to the rating from the trained sensory panel. The use of soundwaves isa potential treatment for brewing to improve beer quality by increasing the number of small bubblesand foamability without disrupting yeast or modifying the aroma and flavor profile.
Keywords: foamability; audible sound; brewing; carbonation; fermentation
1. Introduction
Sound consists of a mechanical longitudinal wave, which propagates through gas and liquidmedia such as air and water but may also do so through solid materials [1]. Furthermore,frequency is defined as the number of complete oscillations per second and is expressed in Hertz [2,3].The wavelength is the distance between the peaks of the sound signal [4] and is calculated usingthe following equation: V = λF, where “V” is the speed of sound, λ is the wavelength, and “F”is the frequency [5]. The wavelength depends on the velocity. Therefore, the medium affects thewavelength since the density and elasticity of the medium will change the velocity of sound [6].Soundwaves are divided in three different classes according to their frequency range including(i) infrasound, which are those below 20 Hz and not audible by the human ear but may be detected bymeasuring the variation in pressure and vibrations. This type of soundwaves is naturally produced byearthquakes, volcanic eruptions, among others. A second class of soundwaves includes (ii) audiblesound, which is produced within 20 Hz and 2000 Hz and, as its name implies, it can be perceived bythe human ear and (iii) ultrasound that is above 2000 Hz and cannot be heard by humans. However,
Beverages 2018, 4, 53; doi:10.3390/beverages4030053 www.mdpi.com/journal/beverages88
Beverages 2018, 4, 53
some animals are able to hear it [7–9]. In food-related products, infrasound has been used to reducemembrane fouling in beer and wine filtration [10] while audible sound has been used to increaseEscherichia coli growth [11], in the control of insects in stored products such as grains [12], and toincrease yeast cells growth rate [13] among others. However, ultrasound has been the most appliedfrequency range in food and beverages to increase the retention of nutritional compounds in fruitbeverages [14], to increase production capacity and promote lightness of juices, and to aid in theirpreservation by the inactivation of enzymes [15] for the degassing of liquids [16] among others.
The amount and stability of foam and bubbles are essential in carbonated beverages such as beersince they comprise the most important factors that consumers consider when assessing the qualityof beer. According to previous studies, consumers have a preference for beers with a medium levelof foam height and consider the low foam as non-desirable with the lowest liking, lowest perceivedquality scores, and highest penalty scores [17–21]. Therefore, it is important to explore methods suchas sonication during its production process to increase foam in beer. However, the application ofsoundwave frequencies in beer has been limited to infra-sound or ultrasound with other purposessuch as the aforementioned reduction of membrane fouling during filtration [10], to measure density ofbeer during fermentation [22], hops extraction [23], to increase yeast viability, and to increase alcoholconcentration applying ultrasound during fermentation [24] among others.
The use of soundwaves to modify bubble size has been narrowed to the purpose of degassing,de-foaming [16], and to produce cavitation, which is the effect of forming bubbles that increase theirsize and cause their implosion [25]. Nevertheless, there are no studies that had assessed the effectsof audible sound in bubbles and foam quality in carbonated beverages. Some breweries such asPhiladelphia’s Dock Street Brewery, Mikkeller craft brewery, and Garage Project have applied musicduring the fermentation stage of the brewing process by claiming that music improves beers sensorycharacteristics and increases yeast activity [26–28]. However, music has a mix of different frequenciesand soundwaves, which does not allow us to isolate the effects of the specific frequency levels. This canpotentially have a higher, lower, or no effect on beer characteristics such as foaming and bubble size.
This paper aims to present the results from the assessment of the effects of audible soundwaveson beer bubbles and foam quality during fermentation and natural carbonation stages of the brewingprocess. The study was conducted using triplicates of three different treatments including (i) a controlusing the usual brewing process, (ii) the application of frequencies during fermentation, and (iii)the application of frequencies during the carbonation stage. Five different frequency levels (20 Hz,30 Hz, 45 Hz, 55 Hz, and 75 Hz) were used for the treatments. These were applied using twospeakers including an amplifier and an iPhone application Audio Function Generator (Thomas Gruber,Forchenstein, Austria). The samples were analyzed using a robotic pourer RoboBEER and Matlab®
R2018b (Mathworks, Inc., Matick, MA, USA) to assess foam and color-related parameters and througha trained sensory panel (n = 10) to assess significant differences between the treatments in their sensorydescriptors. Lastly, two machine learning models previously developed by Gonzalez Viejo et al. [29,30]were tested by feeding the inputs from the RoboBEER of the triplicates of the three treatments to (i)predict the type of fermentation and (ii) to predict the intensities of sensory descriptors by obtaininghigh accuracy in the testing.
2. Materials and Methods
2.1. Beer Samples Description and Processing
English style India Pale Ale (IPA, Berlin IPA, BrewBaker, Berlin, Germany) samples were selectedfor this study since breweries who have used music for brewing have done it using this style ofbeer [26,28]. The samples were brewed using the PicoBrew S (PicoBrew, Seattle, WA, USA). The samplescame in special containers specific for the PicoBrew, which included the malted barley and differenttypes of hops (Perle, Polaris, Tettnanger, Smaragd, and Cascade). As shown in Figure 1, for the controland the other two treatments (soundwaves during fermentation = SWF and soundwaves during
89

Beverages 2018, 4, 53
carbonation = SWC), the container including the ingredients was inserted in the PicoBrew machineand followed the default formula in the machine for the specified IPA sample (Bitterness = 65 IBU).The first part of the brewing process for the control and two treatments lasted 2.5 h and consistedof heating, doughing, mash 1, mash 2, mash out, boiling to a maximum temperature of 114 ◦C, andholding at 94 ◦C for 1 h with the addition of four different types of hops at the start, the middle, and theend of the boiling process (Figure 1 (1)). Following the first part of the process, the yeast (Saccharomycescerevisiae; strain 1056; Safale US-05, Belgium) was added to the three treatments in the same way.Then the hermetically sealed kegs for the control and SWC were left at room temperature (25 ◦C) in thesame place for 11 days while the SWF, which was also hermetically sealed, was treated with audiblesoundwaves daily by applying frequencies of 20 Hz, 30 Hz, 45 Hz, 55 Hz, and 75 Hz at −4 dB for 1 mineach during 11 days of fermentation. The soundwaves were applied using two speakers, an amplifier,an iPhone 5s (Apple Inc., Cupertino, CA, USA), and an Audio Function Generator application (ThomasGruber) (Figure 1 (2)). To make sure the fermentation was completed, the CO2 from the keg wasreleased once and then tried again 1 h later to make sure there was no more gas production. The lastpart of the process consisted of bottling the samples in brown bottles and adding one sugar drop forthe natural carbonation process in which all the samples were left at 25 ◦C for 22 days. The control andSWF were left in the sample place during this stage of the process while the SWC were treated withaudible soundwaves every day by applying frequencies of 20 Hz, 30 Hz, 45 Hz, 55 Hz, and 75 Hz at−4 dB for 1 min each for 22 days (Figure 1 (3)).
Figure 1. Diagram representing the brewing process and soundwave treatments applied to the differentbeer samples such as Control, SWF = soundwaves application at fermentation, and SWC = soundwavesapplied in the carbonation process. Where (1) brewing process, (2) fermentation, and (3) bottling andnatural carbonation.
90

Beverages 2018, 4, 53
The specific frequencies were selected by recording videos of the application of different levels(20–100 Hz) at −4 dB of amplitude to milk and dry thyme leaves in a Petri dish (Figure 2) and werefurther magnified using the Eulerian Magnification Algorithm [31] in Matlab® R2018b (Mathworks,Inc., Matick, MA, USA). Those frequencies that produced movements of the thyme in differentdirections such as grouping particles, separating them, and vibrating in the same position wereselected (20 Hz, 30 Hz, 45 Hz, 55 Hz, and 75 Hz). Dry thyme and milk were used due to the lack ofsolubility and to ease the magnification and visibility of particle movement.
Figure 2. Diagram representing the setup of the testing of different audible sound frequencies to selectthe most appropriate ones for the treatments.
2.2. Color and Foam-Related Parameters
All samples were analyzed in triplicates using computer vision algorithms written in Matlab®
R2018b (Mathworks, Inc., Matick, MA, USA) to analyze 5-min videos recorded while using theautomatic robotic pourer RoboBEER to obtain 15 color and foam-related parameters including:(i) maximum volume of foam (MaxVol), (ii) total lifetime of foam (TLTF), (iii) lifetime of foam (LTF),(iv) foam drainage (FDrain), color in two scales (v ), (vi), (vii) CIELab and (viii), (ix), (x) RGB andbubble size distribution of (xi) small (SmBubb), (xii) medium (MedBubb), and (xiii) large bubbles(LgBubb) as well as (xiv) alcohol gas (OH) and (xv) carbon dioxide (CO2) release. The samples werepoured in the same International Standard Wine Tasting Glass Luigi Bormioli to avoid differencesdue to the glass. Details about the procedure of the RoboBEER can be found in the paper publishedby Gonzalez Viejo et al. [29]. The three parameters from the RGB color scale were converted to acolor index using Equations (1)–(4). The samples were also analyzed for alcohol content in the liquid(Alcohol) using an Alcolyzer Wine M alcohol-meter (Anton Paar GmbH, Graz, Austria). Additionally,pH was measured using a pH-meter Benchtop pH/mV meter 860031 (Sper scientific direct, Scottsdale,AZ, USA) with 50 mL of the sample at an ambient temperature (25 ◦C). Furthermore, viscosity (Visc)was measured with a Brookfield viscometer DV-II+ (AMETEK Brookfield, Middleborough, MA, USA)using 150 mL of the sample and an RV02 spindle at 50 rpm for 20 s.
RGB Intensity ratio(I) = R + G + B (1)
Red intensity ratio (RI) =RI
(2)
Green intensity ratio (GI) =GI
(3)
Blue intensity ratio (BI) =BI
(4)
91
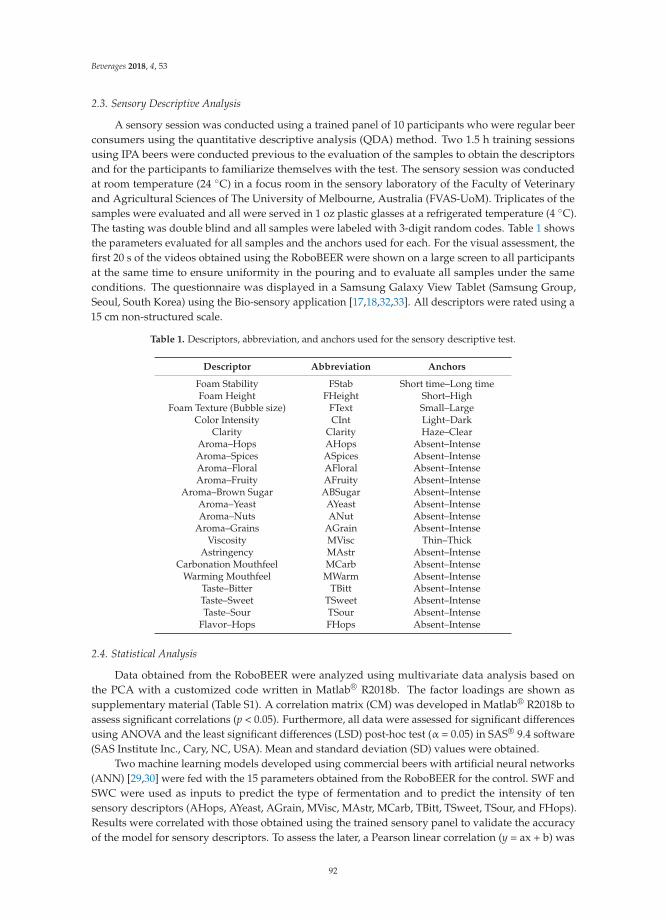
Beverages 2018, 4, 53
2.3. Sensory Descriptive Analysis
A sensory session was conducted using a trained panel of 10 participants who were regular beerconsumers using the quantitative descriptive analysis (QDA) method. Two 1.5 h training sessionsusing IPA beers were conducted previous to the evaluation of the samples to obtain the descriptorsand for the participants to familiarize themselves with the test. The sensory session was conductedat room temperature (24 ◦C) in a focus room in the sensory laboratory of the Faculty of Veterinaryand Agricultural Sciences of The University of Melbourne, Australia (FVAS-UoM). Triplicates of thesamples were evaluated and all were served in 1 oz plastic glasses at a refrigerated temperature (4 ◦C).The tasting was double blind and all samples were labeled with 3-digit random codes. Table 1 showsthe parameters evaluated for all samples and the anchors used for each. For the visual assessment, thefirst 20 s of the videos obtained using the RoboBEER were shown on a large screen to all participantsat the same time to ensure uniformity in the pouring and to evaluate all samples under the sameconditions. The questionnaire was displayed in a Samsung Galaxy View Tablet (Samsung Group,Seoul, South Korea) using the Bio-sensory application [17,18,32,33]. All descriptors were rated using a15 cm non-structured scale.
Table 1. Descriptors, abbreviation, and anchors used for the sensory descriptive test.
Descriptor Abbreviation Anchors
Foam Stability FStab Short time–Long timeFoam Height FHeight Short–High
Foam Texture (Bubble size) FText Small–LargeColor Intensity CInt Light–Dark
Clarity Clarity Haze–ClearAroma–Hops AHops Absent–IntenseAroma–Spices ASpices Absent–IntenseAroma–Floral AFloral Absent–IntenseAroma–Fruity AFruity Absent–Intense
Aroma–Brown Sugar ABSugar Absent–IntenseAroma–Yeast AYeast Absent–IntenseAroma–Nuts ANut Absent–Intense
Aroma–Grains AGrain Absent–IntenseViscosity MVisc Thin–Thick
Astringency MAstr Absent–IntenseCarbonation Mouthfeel MCarb Absent–Intense
Warming Mouthfeel MWarm Absent–IntenseTaste–Bitter TBitt Absent–IntenseTaste–Sweet TSweet Absent–IntenseTaste–Sour TSour Absent–Intense
Flavor–Hops FHops Absent–Intense
2.4. Statistical Analysis
Data obtained from the RoboBEER were analyzed using multivariate data analysis based onthe PCA with a customized code written in Matlab® R2018b. The factor loadings are shown assupplementary material (Table S1). A correlation matrix (CM) was developed in Matlab® R2018b toassess significant correlations (p < 0.05). Furthermore, all data were assessed for significant differencesusing ANOVA and the least significant differences (LSD) post-hoc test (α = 0.05) in SAS® 9.4 software(SAS Institute Inc., Cary, NC, USA). Mean and standard deviation (SD) values were obtained.
Two machine learning models developed using commercial beers with artificial neural networks(ANN) [29,30] were fed with the 15 parameters obtained from the RoboBEER for the control. SWF andSWC were used as inputs to predict the type of fermentation and to predict the intensity of tensensory descriptors (AHops, AYeast, AGrain, MVisc, MAstr, MCarb, TBitt, TSweet, TSour, and FHops).Results were correlated with those obtained using the trained sensory panel to validate the accuracyof the model for sensory descriptors. To assess the later, a Pearson linear correlation (y = ax + b) was
92

Beverages 2018, 4, 53
developed, Statistical data such as the correlation coefficient (R), determination coefficient (R2), andslope were obtained.
3. Results
3.1. Color and Foam-Related Parameters
Figure 3a shows the principal components analysis (PCA) of the foam and color-relatedparameters and CO2 and alcohol gas release were obtained using the RoboBEER. It can be observed thatthe principal component one (PC1) represented 50.73% of data variability while principal componenttwo (PC2) accounted for 21.05% with the PCA explaining a total of 71.78%. According to the factorloadings (Table S1), the PC1 was mainly represented by the TLTF, MaxVol, LTF, and color parametera in the positive side and by GI and L on the negative side of the axis. On the other hand, the PC2was primarily represented by BI and L on the positive side and by RI and a color parameter b on thenegative side of the axis. It is shown that the control samples were more represented by the FDrainand green and yellow colors (GI and b) while two of the replicates of SWC had more GI, L, and BI.The third replicate was more characterized by small, medium, and large bubbles and a red color (a andRI). The SWF samples were more represented by the foam-related parameters such as MaxVol, LTF,TLTF, SmBubb, LgBubb, MedBubb, and CO2.
(a)
Figure 3. Cont.
93

Beverages 2018, 4, 53
(b)
Figure 3. Results from multivariate data analysis showing: (a) principal component analysis where thex-axis represents the principal component one (PC1) and y-axis represents the principal componenttwo (PC2), samples in blue and triangles represent the control, those in green, and circles the treatmentof soundwaves during fermentation (SWF) and the purple squares the soundwaves during carbonation(SWC), and (b) the correlation matrix shows only the significant correlations (p < 0.05) where the colorbar depicts the positive (blue) and negative (yellow) correlations between the different descriptors.The values inside the boxes are the correlation coefficients (R). Abbreviations: MaxVol = maximumvolume of foam, TLTF = total lifetime of foam, LTF = lifetime of foam, FDrain = foam drainage,L, a, b = color in CIELab scale, RI, GI, and BI indices of color in the RGB scale. SmBubb = smallbubbles. MedBubb = medium bubbles. LgBubb = large bubbles. OH = alcohol gas and CO2 = carbondioxide release.
Figure 3b shows the CM in which MaxVol had positive and significant correlation with TLTF(R = 0.93), TLF (R = 0.89), LgBubb (0.71), and a negative correlation with FDrain (R = −0.74).Furthermore, TLTF had a positive correlation with SmBubb (R = 0.70). Yet, as expected, the redcolor from the RGB scale (RI) had a positive correlation with a red color (a) from the Lab scale(R = 0.86). Likewise, there was a negative correlation between the blue color (BI) from the RGB scaleand b from the Lab scale (R = −0.81).
Table 2 shows the results of the ANOVA for the foam-related parameters measured with theRoboBEER. It can be observed that there were significant differences in the number of small bubbles inthe foam with SWC being the highest and significantly different from the control. While there wereno significant differences for the other foam-related parameters, the MaxVol had a p-value of 0.055,
94
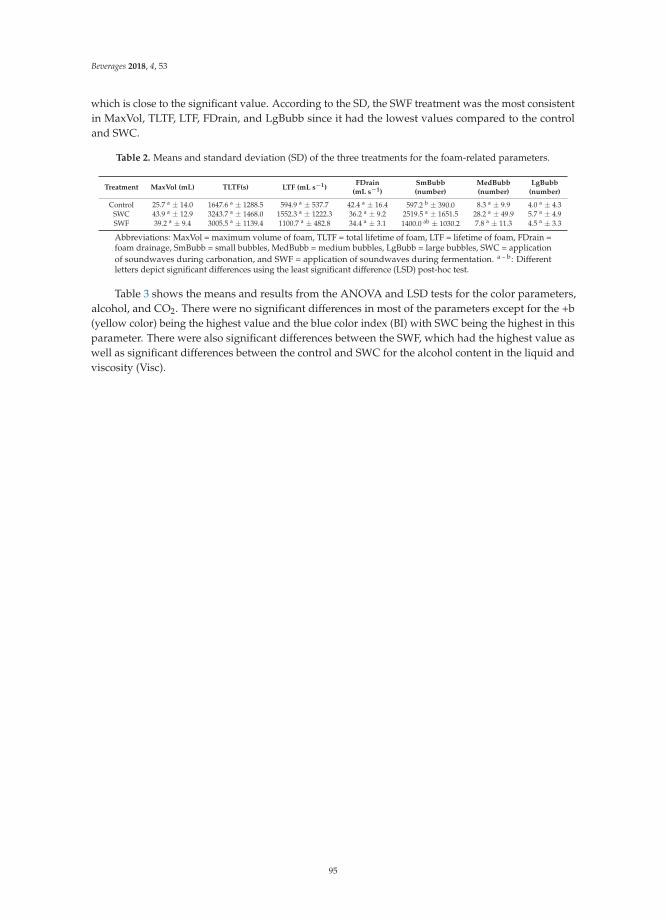
Beverages 2018, 4, 53
which is close to the significant value. According to the SD, the SWF treatment was the most consistentin MaxVol, TLTF, LTF, FDrain, and LgBubb since it had the lowest values compared to the controland SWC.
Table 2. Means and standard deviation (SD) of the three treatments for the foam-related parameters.
Treatment MaxVol (mL) TLTF(s) LTF (mL s−1)FDrain
(mL s−1)SmBubb(number)
MedBubb(number)
LgBubb(number)
Control 25.7 a ± 14.0 1647.6 a ± 1288.5 594.9 a ± 537.7 42.4 a ± 16.4 597.2 b ± 390.0 8.3 a ± 9.9 4.0 a ± 4.3SWC 43.9 a ± 12.9 3243.7 a ± 1468.0 1552.3 a ± 1222.3 36.2 a ± 9.2 2519.5 a ± 1651.5 28.2 a ± 49.9 5.7 a ± 4.9SWF 39.2 a ± 9.4 3005.5 a ± 1139.4 1100.7 a ± 482.8 34.4 a ± 3.1 1400.0 ab ± 1030.2 7.8 a ± 11.3 4.5 a ± 3.3
Abbreviations: MaxVol = maximum volume of foam, TLTF = total lifetime of foam, LTF = lifetime of foam, FDrain =foam drainage, SmBubb = small bubbles, MedBubb = medium bubbles, LgBubb = large bubbles, SWC = applicationof soundwaves during carbonation, and SWF = application of soundwaves during fermentation. a – b: Differentletters depict significant differences using the least significant difference (LSD) post-hoc test.
Table 3 shows the means and results from the ANOVA and LSD tests for the color parameters,alcohol, and CO2. There were no significant differences in most of the parameters except for the +b(yellow color) being the highest value and the blue color index (BI) with SWC being the highest in thisparameter. There were also significant differences between the SWF, which had the highest value aswell as significant differences between the control and SWC for the alcohol content in the liquid andviscosity (Visc).
95
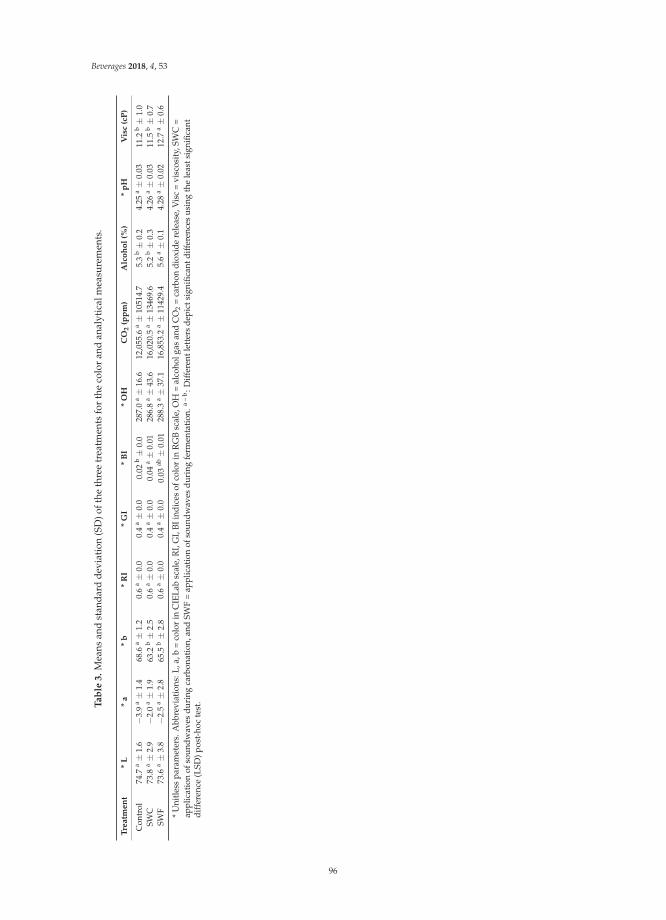
Beverages 2018, 4, 53
Tab
le3.
Mea
nsan
dst
anda
rdde
viat
ion
(SD
)oft
heth
ree
trea
tmen
tsfo
rth
eco
lor
and
anal
ytic
alm
easu
rem
ents
.
Tre
atm
en
t*
L*
a*
b*
RI
*G
I*
BI
*O
HC
O2
(pp
m)
Alc
oh
ol
(%)
*p
HV
isc
(cP
)
Con
trol
74.7
a±
1.6
−3.9
a±
1.4
68.6
a±
1.2
0.6
a±
0.0
0.4
a±
0.0
0.02
b±
0.0
287.
0a±
16.6
12,0
55.6
a±
1051
4.7
5.3
b±
0.2
4.25
a±
0.03
11.2
b±
1.0
SWC
73.8
a±
2.9
−2.0
a±
1.9
63.2
b±
2.5
0.6
a±
0.0
0.4
a±
0.0
0.04
a±
0.01
286.
8a±
43.6
16,0
20.5
a±
1346
9.6
5.2
b±
0.3
4.26
a±
0.03
11.5
b±
0.7
SWF
73.6
a±
3.8
−2.5
a±
2.8
65.5
b±
2.8
0.6
a±
0.0
0.4
a±
0.0
0.03
ab±
0.01
288.
3a±
37.1
16,8
53.2
a±
1142
9.4
5.6
a±
0.1
4.28
a±
0.02
12.7
a±
0.6
*U
nitle
sspa
ram
eter
s.A
bbre
viat
ions
:L,a
,b=
colo
rin
CIE
Lab
scal
e,R
I,G
I,BI
indi
ces
ofco
lor
inR
GB
scal
e,O
H=
alco
holg
asan
dC
O2
=ca
rbon
diox
ide
rele
ase,
Vis
c=
visc
osity
,SW
C=
appl
icat
ion
ofso
undw
aves
duri
ngca
rbon
atio
n,an
dSW
F=
appl
icat
ion
ofso
undw
aves
duri
ngfe
rmen
tatio
n.a
–b:D
iffer
entl
ette
rsde
pict
sign
ifica
ntdi
ffer
ence
sus
ing
the
leas
tsig
nific
ant
diff
eren
ce(L
SD)p
ost-
hoc
test
.
96
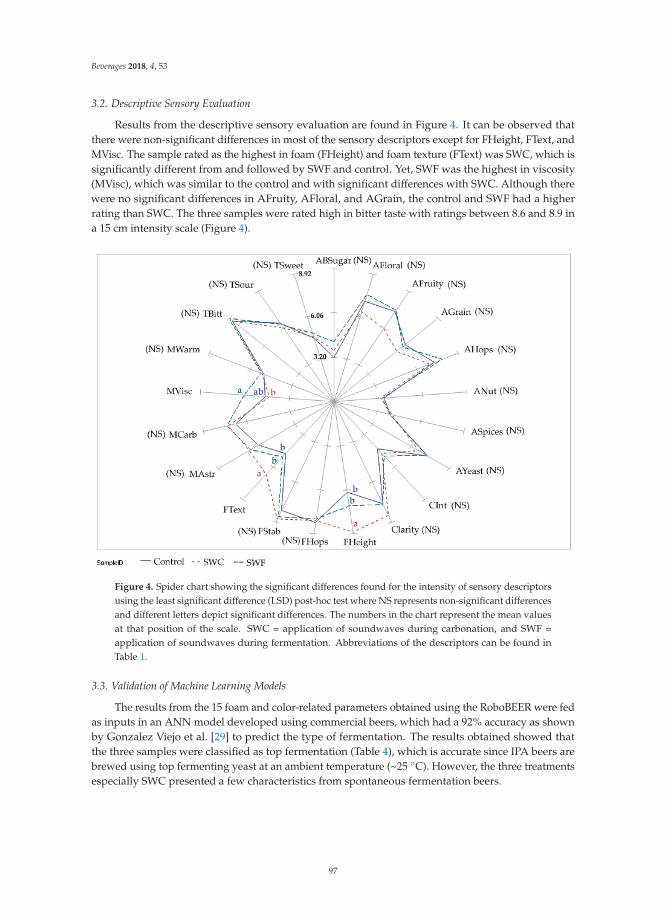
Beverages 2018, 4, 53
3.2. Descriptive Sensory Evaluation
Results from the descriptive sensory evaluation are found in Figure 4. It can be observed thatthere were non-significant differences in most of the sensory descriptors except for FHeight, FText, andMVisc. The sample rated as the highest in foam (FHeight) and foam texture (FText) was SWC, which issignificantly different from and followed by SWF and control. Yet, SWF was the highest in viscosity(MVisc), which was similar to the control and with significant differences with SWC. Although therewere no significant differences in AFruity, AFloral, and AGrain, the control and SWF had a higherrating than SWC. The three samples were rated high in bitter taste with ratings between 8.6 and 8.9 ina 15 cm intensity scale (Figure 4).
Figure 4. Spider chart showing the significant differences found for the intensity of sensory descriptorsusing the least significant difference (LSD) post-hoc test where NS represents non-significant differencesand different letters depict significant differences. The numbers in the chart represent the mean valuesat that position of the scale. SWC = application of soundwaves during carbonation, and SWF =application of soundwaves during fermentation. Abbreviations of the descriptors can be found inTable 1.
3.3. Validation of Machine Learning Models
The results from the 15 foam and color-related parameters obtained using the RoboBEER were fedas inputs in an ANN model developed using commercial beers, which had a 92% accuracy as shownby Gonzalez Viejo et al. [29] to predict the type of fermentation. The results obtained showed thatthe three samples were classified as top fermentation (Table 4), which is accurate since IPA beers arebrewed using top fermenting yeast at an ambient temperature (~25 ◦C). However, the three treatmentsespecially SWC presented a few characteristics from spontaneous fermentation beers.
97

Beverages 2018, 4, 53
Table 4. Results from the classification of the type of fermentation using an artificial neural networkmodel was developed using the color and foam-related parameters.
Treatment Top Bottom Spontaneous
Control 0.996 0.000 0.004SWF 0.997 0.000 0.003SWC 0.994 0.000 0.006
Abbreviations: SWC = application of soundwaves during carbonation and SWF = application of soundwavesduring fermentation.
Figure 5 shows the results from the validation of the second ANN model, which was also fedusing the 15 foam and color-related parameters obtained using the RoboBEER to predict 10 of thesensory descriptors (AHops, AYeast, AGrain, MVisc, MAstr, MCarb, TBitt, TSweet, TSour, and FHops).The model used to predict the values had a correlation of R = 0.91 and a determination coefficientR2 = 0.83. It can be found from Gonzalez Viejo et al. [30]. For the samples developed in this study, thecorrelation between the observed values obtained with the trained sensory panel and the predictedvalues using the model was R = 0.85 with a determination coefficient R2 = 0.72 and a slope of 1.09.
y = 1.09xR² = 0.72R = 0.85
2
3
4
5
6
7
8
9
10
11
2 3 4 5 6 7 8 9 10 11
Sens
ory
desc
ript
ors
inte
nsity
(Pre
dict
ed)
Sensory descriptors intensity (Observed)
Figure 5. Correlation of the observed values (x-axis) of 10 sensory descriptors (AHops, AYeast, AGrain,MVisc, MAstr, MCarb, TBitt, TSweet, TSour, and FHops) obtained using the trained sensory panel andthe predicted values (y-axis) using an artificial neural network model developed using the color andfoam-related parameters.
4. Discussion
4.1. Color and Foam-Related Parameters
The negative correlation found between MaxVol and FDrain (Figure 3b) was expected sincethe FDrain is the excess of liquid drained by gravity from the wet foam to produce dry foam [34].Therefore, the volume of foam decreases and the liquid volume increases [29]. In the PCA (Figure 3a),
98
Beverages 2018, 4, 53
it was observed that there was a separation of the triplicates since one bottle of each had differentcharacteristics. However, for the SWF, the separation of the triplicates in the PCA and the SD of themeans (Tables 2 and 3) for most of the parameters was lower than the other treatments. Therefore, thismight be due to the soundwaves treatment applied during the fermentation process, which could makethe sample more uniform. According to Choi et al. [24], there is an increase in yeast viability whenapplying ultrasound during the fermentation process and, therefore, an increase in alcohol contentin the beer. A similar effect was found in the present study, but, using audible sound, higher andsignificantly different values were found between the SWF and the other treatments in alcohol contentin the liquid. Although non-significant, the MaxVol, TLTF, LTF, and SmBubb tended to be higher forthe SWC and SWF when compared to the control. Significant differences were found for viscositywith SWF being the different treatment with the highest value followed by SWC. The viscosity of beer,which is mainly defined by the amount of surfactant substances such as proteins and carbohydrates,is directly linked with foam stability [35,36]. According to previous research, an ultrasound hasbeen used for de-foaming since it causes the foam to collapse as the ultra-high frequencies provokethe coalescence of the bubbles, which causes bubbles breakage [37]. Another effect of ultrasoundis to increase bubble size until it implodes (cavitation) [25]. Therefore, according to the findingsin the present study, the effects of audible sound in foam and bubbles are opposite to those foundusing ultrasound.
In beer, color is defined due to the Maillard reaction that occurs when malted barley is exposedto high temperatures during the kilning process [38]. The yellow color is produced by melanoidinsbefore turning brown. However, a yellow color is maintained when the kilning process is mild.During fermentation, the pH drops and produces a lighter color [35]. Results showed the control had aslightly lighter color (L) and was significantly higher in yellow color (b) than SWF and SWC. However,although non-significant, pH tended to be lower for the control (Table 3). Further studies are neededto assess the cause of the difference in yellow color when applying audible sound to beer processing.
4.2. Descriptive Sensory Evaluation
The trained sensory panel was able to perceive significant differences in FHeight between thethree treatments (Figure 4). Similar to the data obtained using the RoboBEER for MaxVol, SWC wasrated as the highest in foam height followed by SWF and control. Significant differences were alsofound for FText, which had SWC rated as the highest and the control as the lowest. The significantdifferences found using the trained panel in MVisc coincide with those found using the viscometerwith SWF rated as the highest in viscosity. This shows that the panel had an appropriate trainingsince they were able to detect differences similar to the more objective measurements. There wereno significant differences found in any of the tastes, aromas, and flavors, which was desired since itshows that there was no modification in the sensory profile that could be indicative that there was nobreakage of yeast cells with the use of audible sound. Authors such as Martin et al. [39] have found ahigh yeast cell disruption when applying ultrasound to wine. Therefore, although further researchusing different types of beer is needed, results from this study showed that using lower frequencies(20–75 Hz) have an effect in foam and bubbles without disturbing the yeast cells, which is a potentialtreatment that might be applied to beer processing to improve beer quality.
4.3. Validation and Testing of Machine Learning Models
The slightly lower value obtained for SWC from top fermentation and slightly higher value forspontaneous fermentation are mainly due to the higher foam volume and stability, which are twoof the main characteristics from spontaneous fermentation beers. However, despite this, the threetreatments were classified as top fermentation with a very high accuracy (~99%). This shows that theuse of audible sound in beer processing either during fermentation or carbonation stages, even thoughit improves the beer foamability and bubble size distribution, does not drastically change the natureof the style of beer. Yet, the results obtained from the validation of the ANN model to predict the
99

Beverages 2018, 4, 53
intensity of sensory descriptors showed that the use of the RoboBEER along with machine learningmodeling are potential tools to assess beer quality at the end of the production process to sample everysingle batch as well as for new products or processing techniques testing in a more objective, effective,and rapid manner when compared to traditional methods.
5. Conclusions
The use of audible sound is a potential treatment to implement in beer processing during thefermentation or carbonation stages to improve the products’ quality by increasing the number of smallbubbles and increasing foamability and foam stability without modifying the aroma and flavor profileof the specific beer style. However, further research is required to assess the effects of the applicationof audible sound during both the fermentation and carbonation stages and to find the possible causesfor the significant differences in the color. Furthermore, in further research, it would be important toassess the microbiological aspects to analyze yeast viability. The use of the robotic pourer, RoboBEER,the computing vision algorithms and machine learning algorithms are accurate, objective, affordable,and rapid. Tools are used to assess the beer quality in terms of its physical and sensory descriptors forall existing products, new products, and processing techniques.
Supplementary Materials: The following are available online at http://www.mdpi.com/2306-5710/4/3/53/s1,Table S1: Factor loadings of each descriptor in the principal components analysis for the principal componentsone and two (PC1 and PC2).
Author Contributions: C.G.V. and S.F. contributed equally in the experiment design, data analysis, and paperwriting. M.H.L., Y.Q.H., and S.C. contributed in the experiment layout, beer making, and data acquisition. D.T.and F.R.D. contributed to the experiment design and paper writing.
Funding: This research received no external funding.
Acknowledgments: We gratefully acknowledge the support of NVIDIA Corporation with the donation of theTitan Xp GPU used for this research. This research was supported by the Australian Government through theAustralian Research Council [Grant number IH120100053] ‘Unlocking the Food Value Chain: Australian industrytransformation for ASEAN markets.’
Conflicts of Interest: The authors declare no conflict of interest.
References
1. Cromer, A.H.; Vázquez, J.C. Física Para Las Ciencias de la Vida; Reverté: Barcelona, Spain, 1981.2. Serrano Vida, M.; Gil Corral, J. Musica. Volumen III. Profesores de Educacion Secundaria. Temario Para la
Preparacion de Oposiciones; Ebook; MAD-Eduforma: Sevilla, Spain, 2003.3. Figura, L.O.; Teixeira, A.A. Acoustical properties. In Food Physics: Physical Properties—Measurement and
Applications; Springer: Berlin, Germany, 2007.4. Glasscock, M.E.; Gulya, A.J.; Shambaugh, G.E. Glasscock-Shambaugh Surgery of the Ear; BC Decker: Hamilton,
ON, Canada, 2003.5. Vining, W.; Day, R.; Botch, B. General Chemistry: Atoms First; Cengage Learning: Boston, MA, USA, 2017.6. Hassani, S.N.; Bard, R.L. Real Time Opthalmic Ultrasonography; Springer: New York, NY, USA, 2012.7. Malik, H.K.; Singh, A.K. Engineering Physics; Tata McGraw Hill Education Private Ltd.: New Delhi,
India, 2010.8. Ferrer, J.F.; Carrera, M.P. Iniciación a la Física; Reverté: Barcelona, Spain, 1981.9. Hassanien, R.H.; Hou, T.-Z.; Li, Y.-F.; Li, B.-M. Advances in effects of sound waves on plants. J. Integr. Agric.
2014, 13, 335–348. [CrossRef]10. Czekaj, P.; López, F.; Güell, C. Membrane fouling by turbidity constituents of beer and wine: Characterization
and prevention by means of infrasonic pulsing. J. Food Eng. 2001, 49, 25–36. [CrossRef]11. Ying, J.C.L.; Dayou, J.; Phin, C.K. Experimental investigation on the effects of audible sound to the growth of
Escherichia coli. Mod. Appl. Sci. 2009, 3. [CrossRef]12. Jasmine, K.R.; Manohar Das, S.S. Studies on the changes induced by audible sound waves in the total body
protein profile of corcyra cephalonica (stainton). J. Scott Res. Forum 2008, 2–4, 32–39.
100
Beverages 2018, 4, 53
13. Aggio, R.B.M.; Obolonkin, V.; Villas-Bôas, S.G. Sonic vibration affects the metabolism of yeast cells growingin liquid culture: A metabolomic study. Metabolomics 2012, 8, 670–678. [CrossRef]
14. Morales-de la Peña, M.; Welti-Chanes, J.; Martín-Belloso, O. Application of novel processing methods forgreater retention of functional compounds in fruit-based beverages. Beverages 2016, 2, 14. [CrossRef]
15. Abdullah, N.; Chin, N.L. Application of thermosonication treatment in processing and production of highquality and safe-to-drink fruit juices. Agric. Agric. Sci. Procedia 2014, 2, 320–327. [CrossRef]
16. de Sousa, D.P. Application of Ultrasounds for Transformation Processes of Agroalimentary Products; Universitéd’Avignon: Avignon, France, 2012.
17. Viejo, C.G.; Fuentes, S.; Howell, K.; Torrico, D.; Dunshea, F.R. Robotics and computer vision techniquescombined with non-invasive consumer biometrics to assess quality traits from beer foamability usingmachine learning: A potential for artificial intelligence applications. Food Control 2018, 92, 72–79. [CrossRef]
18. Viejo, C.G.; Fuentes, S.; Howell, K.; Torrico, D.D.; Dunshea, F.R. Integration of non-invasive biometrics withsensory analysis techniques to assess acceptability of beer by consumers. Physiol. Behav. 2018. [CrossRef]
19. Bamforth, C. Perceptions of beer foam. J. Inst. Brew. 2000, 106, 229–238. [CrossRef]20. Donadini, G.; Fumi, M.D.; Faveri, M. How foam appearance influences the Italian consumer’s beer perception
and preference. J. Inst. Brew. 2011, 117, 523–533. [CrossRef]21. Smythe, J.E.; Bamforth, C.W. The path analysis method of eliminating preferred stimuli (PAMEPS) as
a means to determine foam preferences for lagers in European judges based upon image assessment.Food Qual. Preference 2003, 14, 567–572. [CrossRef]
22. Becker, T.; Mitzscherling, M.; Delgado, A. Ultrasonic velocity—A noninvasive method for the determinationof density during beer fermentation. Eng. Life Sci. 2001, 1, 61–67. [CrossRef]
23. Hoggan, J. Ultrasonic hop extraction. Ultrasonics 1968, 6, 217–219. [CrossRef]24. Choi, E.J.; Ahn, H.; Kim, M.; Han, H.; Kim, W.J. Effect of ultrasonication on fermentation kinetics of beer
using six-row barley cultivated in Korea. J. Inst. Brew. 2015, 121, 510–517. [CrossRef]25. Flint, E.B.; Suslick, K.S. The Temperature of cavitation. Science 1991, 253, 1397–1399. [CrossRef] [PubMed]26. Galuszka, J. Universities Receive $1 Million to Study Impact of Sound on Fermenting Beer. Available
online: https://www.stuff.co.nz/national/education/97068212/universities-receive-1-million-to-study-impact-of-sound-on-fermenting-beer (accessed on 26 June 2018).
27. Fowle, Z. Good Vibrations: Brewers Use Music to Ferment Their Beers. Available online: http://draftmag.com/brewers-ferment-beer-with-music/ (accessed on 26 June 2018).
28. Boxall, A. Does Music Affect the Taste of Beer? Try B&O Play’s Beobrew to Find Out. Available online:https://www.digitaltrends.com/home-theater/beoplay-beobrew-music-infused-beer-news/ (accessed on4 July 2018).
29. Gonzalez Viejo, C.; Fuentes, S.; Li, G.; Collmann, R.; Condé, B.; Torrico, D. Development of a roboticpourer constructed with ubiquitous materials, open hardware and sensors to assess beer foam quality usingcomputer vision and pattern recognition algorithms: RoboBEER. Food Res. Int. 2016, 89, 504–513. [CrossRef][PubMed]
30. Gonzalez Viejo, C.; Fuentes, S.; Torrico, D.D.; Howell, K.; Dunshea, F.R. Assessment of beer quality basedon a robotic pourer, computer vision, and machine learning algorithms using commercial beers. J. Food Sci.2018, 83, 1381–1388. [CrossRef] [PubMed]
31. Wu, H.-Y.; Rubinstein, M.; Shih, E.; Guttag, J.; Durand, F.; Freeman, W. Eulerian video magnification forrevealing subtle changes in the world. Video Magnif. 2012. [CrossRef]
32. Torrico, D.D.; Fuentes, S.; Gonzalez Viejo, C.; Ashman, H.; Gunaratne, N.M.; Gunaratne, T.M.; Dunshea, F.R.Images and chocolate stimuli affect physiological and affective responses of consumers: A cross-culturalstudy. Food Qual. Preference 2018, 65, 60–71. [CrossRef]
33. Torrico, D.D.; Fuentes, S.; Viejo, C.G.; Ashman, H.; Gurr, P.A.; Dunshea, F.R. Analysis of thermochromiclabel elements and colour transitions using sensory acceptability and eye tracking techniques. LWT FoodSci. Technol. 2018, 89, 475–481. [CrossRef]
34. Bamforth, C.; Russell, I.; Stewart, G. Beer: A Quality Perspective; Elsevier Science: Cambridge, MA, USA, 2011.35. Badui Dergal, S.; Cejudo Gómez, H.R.T. Química de los Alimentos; Pearson Educación: Naucalpan de Juárez,
Estado de Mexico, Mexico, 2006.36. Delcour, J.A.; Hoseney, R.C. Principles of Cereal Science and Technology; AACC International: St. Paul, MN,
USA, 2010.
101
Beverages 2018, 4, 53
37. Gallego-Juárez, J.; Rodríguez, G.; Riera, E.; Cardoni, A. Ultrasonic defoaming and debubbling in foodprocessing and other applications. In Power Ultrasonics; Elsevier: New York, NY, USA, 2015; pp. 793–814.[CrossRef]
38. Piggott, J. Alcoholic Beverages: Sensory Evaluation and Consumer Research; Elsevier: Philadelphia, PA, USA,2011.
39. Martín, J.F.G.; Guillemet, L.; Feng, C.; Sun, D.-W. Cell viability and proteins release duringultrasound-assisted yeast lysis of light lees in model wine. Food Chem. 2013, 141, 934–939. [CrossRef][PubMed]
© 2018 by the authors. Licensee MDPI, Basel, Switzerland. This article is an open accessarticle distributed under the terms and conditions of the Creative Commons Attribution(CC BY) license (http://creativecommons.org/licenses/by/4.0/).
102
beverages
Article
Improving Fermentation Rate during Use of CornGrits in Beverage Alcohol Production
Deepak Kumar 1, Anna-Sophie Hager 2, Alberto Sun 2, Winok Debyser 2,
Bruno Javier Guagliano 2 and Vijay Singh 1,*
1 Agricultural and Biological Engineering, University of Illinois at Urbana-Champaign, Urbana, IL 61801,USA; [email protected]
2 Anheuser-Busch InBev nv/sa, Brouwerijplein 1, 3000 Leuven, Belgium;[email protected] (A.-S.H.); [email protected] (A.S.);[email protected] (W.D.); [email protected] (B.J.G.)
* Correspondence: [email protected]; Tel.: +1-217-333-9510
Received: 12 December 2018; Accepted: 29 December 2018; Published: 11 January 2019
Abstract: Corn grits are commonly used adjuncts in the brewing industry in the United States,especially for lager beers. The major challenge of using a high amount of adjuncts in the brewingprocess is reduced levels of nutrients available to yeast during fermentation, which negatively affectsthe growth and functioning of yeast, and results in sluggish fermentation. The problem is usuallyaddressed by adding external nutrition. The objective of this work was to assess the suitability ofcorn components other than brewer’s grits to improve the fermentation rates. Water obtained aftersoaking of corn germ, a vital source of lipids and soluble proteins, was investigated as a source ofnutrient during brewing of 40:60 (w/w) corn grits and malt mixture. Performance of water-solublenutrients from germ of two corn verities, yellow dent corn and flint corn, was investigated. Germsoak water was added during corn grits slurry formation before mashing. The addition of germ waterincreased the free amino nitrogen levels by 37% and Zn concentrations by 3.6 times in the wort, whichresulted in up to a 28% higher fermentation rate (between 48 to 72 h of fermentation) and shortenedthe fermentation time from 120 to 96 h. The use of water obtained from the soaking of flint corn germresulted in a similar shortening of fermentation time. In another approach, nutrient-rich concentratedgerm soak water was directly added into the wort, which also resulted in similar improvements inthe fermentation rate as those from adding germ soak water during slurry formation. Due to leachingof micronutrients and soluble proteins, the oil concentrations in the germ increased by more than30%, enhancing its economic value.
Keywords: beer; adjuncts; fermentation rate; germ; nutrient; FAN
1. Introduction
Beer is the oldest and the most popular alcoholic beverage in the world. Since ancient times,barley has been the most common raw material used for beer brewing. The use of barley providesadvantages of easy germination, high starch content, moderate protein content, high amylolyticactivity, and wort filtration assistance from husk [1,2]. However, due to increasing demands of sensorymodification and specialty beers, and cost optimization, brewing industries are increasing the useof locally available less expensive unmalted grains, known as adjunct grains, in the beer brewingprocess [3–5]. The use of locally available grains as adjuncts in the brewing process reduces the needfor importing malt, provides tax benefits (avoidance of malt tax in some countries), reduces the carbonfootprint, and supports local farmers [6]. Corn, wheat, rice, unmalted barley, oats, and sorghumare some of the major adjunct grains used. High amounts of adjuncts are used to produce specialtybeers. A type of beer known as “happoshu” is produced in Japan that contains more than 75% rice as
Beverages 2019, 5, 5; doi:10.3390/beverages5010005 www.mdpi.com/journal/beverages103
Beverages 2019, 5, 5
adjuncts [6]. The use of adjuncts also provides advantages of increased foam stability, various color andflavor options, and health benefits (e.g., reduced gluten levels). The potential cost savings are highlydependent on the type of adjunct used, local prices of adjunct grains, malt availability, and other costsof productions [4]. Although the benefits of adjuncts have been realized and highlighted in the lastfew years only, the use of adjuncts is as old as beer itself. For example, the Sumerians (Mesopotamia;Lady Pu-Abi Queen of Ur (2600BC)) had a beer that was made from barley and emmer (ancient wheat).Raw wheat has been used as an adjunct in the production of lambic (a type of spontaneous fermentedbeer), in Belgium for centuries. Currently, 85% to 90% of all of the beer in the world is produced withadjuncts used in the process [5].
Due to large availability, corn grits are the most commonly used adjuncts in the United States,especially for lager beers. The use of 30% corn grits as adjuncts can reduce brewing costs by about8% [4]. In addition to ready availability and lower cost, the use of corn adjuncts provides benefits inthe form of color adjustments and sweet and fuller flavor profile. The profile of fermentable sugarsand dextrins from enzymatic conversion corn-based adjuncts is similar to that of malt [2]. In 2017,about 150 million bushels of corn were used in beverage alcohol production in the United States [7].
The use of adjuncts in brewing also has several disadvantages, including the need of a cerealcooker, low enzymatic power, and reduced levels of nutrients for yeast. A cereal cooker is neededfor starch gelatinization and commercial enzymes are often used to overcome the limitation of loweramylolytic activity [4]. The major limitation that use of adjuncts in the brewing process leads to is thereduced levels of nutrients available to yeast during fermentation. Most of the adjuncts used in theindustry have relatively low protein levels, and replacement of malt with these adjuncts decreasesthe concentrations of nitrogen-containing substances during fermentation, also known as proteindilution in wort [5]. Nitrogen is an essential element required for yeast growth and synthesis of cellularproteins and other cell compounds. Individual amino acids, small peptides, and some ammoniumions produced from the proteolysis of proteins in barley malt are the main nitrogen sources for yeastmetabolism in wort [8]. Free amino nitrogen (FAN) level, collectively accounting for individual aminoacids and small peptides (dipeptides and tripeptides), are commonly monitored to ensure efficient yeastcell growth in order to achieve a desirable fermentation performance [8]. Poreda et al. (2013) reportedthat even with similar protein content in malt and corn grits, FAN concentration in wort obtained withthe addition of 20% grits was 7% lower (223 ppm vs. 240 ppm) compared to pure malt wort [4]. It hasbeen reported that proteins in adjuncts do not get hydrolyzed as efficiently as malt protein and resultin a deficiency of total soluble nitrogen in wort [4,9]. Partially hydrolyzed proteins remain insolubleand are separated along with spent grains during filtration [5]. Other than reduced free nitrogenlevels, the use of high amounts of adjuncts also decreases the concentrations of other nutrients, such asinorganic ions and vitamins, which required for efficient yeast growth [10]. The nitrogen limitationand deficiency of micronutrients results in poor yeast viability, which leads to retarded or sluggishfermentation [5,11]. To overcome this issue, the wort obtained during the use of high percentage ofadjuncts is usually supplemented with external nutrients in order to achieve an efficient fermentation.The challenge of inefficient fermentation due to lack of yeast nutrition has also been reported inthe form of the use of dry-fractionated corn for fuel ethanol production [12,13]. During whole cornfermentation, germ is a vital source of lipids and water-soluble proteins, which help in maintaining themembrane integrity and yeast performance. However, flaking grits and brewer grits, obtained fromthe dry-fractionation of corn, do not contain the germ fraction and have a relatively small amount ofprotein, oil, and other micronutrients, compared to whole corn, which causes nutrient deficiency toyeast during fermentation. The addition of yeast extract, lipid supplementation, and leaving somegerm (minimum 20%) behind, are some successful reported approaches to improving fermentationof dry-fractionated corn during fuel ethanol production [12–14]. However, due to concerns of thenegative effects of lipids on beer flavor and foam, these approaches cannot be applied in the beveragealcohol production process. One approach that could have potential application in the brewing processis the extraction of soluble nutrients from corn germ by soaking and the use of that water in the process.
104

Beverages 2019, 5, 5
The water would contain only soluble proteins and micronutrients but not lipids. Murthy et al. (2006)reported that the use of germ soak water (2 h soaking) in the dry grind process resulted in higher finalethanol concentrations (14.7% vs. 12.3% (v/v)) with a relatively small amount of residual glucose [14].Juneja et al. (2018) reported that the use of water from germ soaked for a longer time (12 h insteadof 2 h) can result in complete fermentation (no residual glucose) and achieve a fermentation profilesimilar to that obtained with the addition of excess B vitamins or protease enzymes [15]. Both ofthese studies only reported the fermentation improvements but did not determine the actual nutritionenhancement with the addition of germ soak water.
The objective of this study was to investigate the feasibility of using corn germ soak water toimprove yeast nutrition and fermentation rates in the brewing process using 40% corn grits adjuncts.Performance of water-soluble nutrients from germ of two corn verities, yellow dent corn and flint corn,was investigated. In addition to a new process development, individual amino acids, total FAN levels,and other important nutrients (e.g., Zn concentrations) in the germ water and wort were determinedto enhance the understanding of the potential benefits of implementing this approach.
2. Materials and Methods
2.1. Materials
Degermed yellow brewing grits and corn germ (from yellow dent corn) samples were obtainedfrom a commercial corn dry milling plant (Bunge, Danville, IL, USA). Malt and flint corn samples wereobtained from a commercial brewing company (Anheuser-Busch InBev, Brouwerijplein 1, 3000 Leuven,Belgium). Germ from the flint corn was separated using a 1 kg laboratory scale protocol outlined byRausch et al. (2009) [16]. All materials were stored at 4 ◦C in refrigerator until use.
Active dry brewing yeast Saflager S-189 yeast, used for the fermentation in the current study, wasobtained from the Fermentis-Lesaffre Yeast Corporation (Milwaukee, WI, USA). Novozymes (Bagsvaerd,Denmark) generously donated Termamyl 120 L, Type L, a thermostable bacterial α-amylase preparation.
2.2. Corn Grits and Germ Composition
Starch content in the ground corn grits was determined by the modified acid hydrolysis method [17]and was found to be 79.64%. About 1 g of ground corn grits were mixed with 50 mL of 0.4N HCl in100-mL autoclavable glass bottles. After mixing, the slurry was autoclaved for 1 h at 126 ◦C in a laboratoryscale autoclave (Napco Model 9000D, Thermo Fisher 157 Scientific, Waltham, MA, USA). Glucose recoveryfactors were determined using pure glucose and starch samples. After cooling, 1-mL aliquot sampleswere withdrawn and centrifuged at 1500× g for 5 min (Model 5415 D, Brinkmann–Eppendorf, Hamburg,Germany). The supernatants were analyzed in the HPLC for glucose concentration determination.
Germ (before and after soaking) samples were analyzed for oil (AOAC method 920.39) content bya commercial analytical laboratory (Illinois crop improvement association, Champaign, IL, USA) [18].All analyses were conducted in duplicates.
2.3. Brewing Process
A simple schematic of the lab-scale process used for the beverage alcohol production is shown inFigure 1. Corn grits and malt samples were ground in a hammer mill (model MHM4, Glen Mills, 126Clifton, NJ, USA) equipped with a 1.0-mm sieve. The moisture contents of the ground samples weredetermined by drying flour at 135 ◦C for 2 h (Approved Method 44-19, AACC International 2000).
105
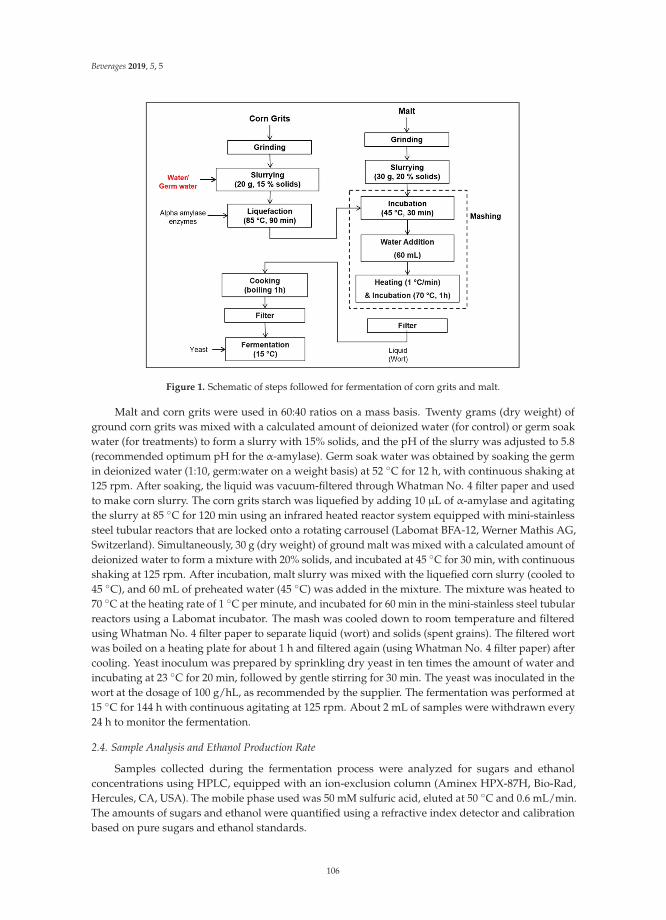
Beverages 2019, 5, 5
Figure 1. Schematic of steps followed for fermentation of corn grits and malt.
Malt and corn grits were used in 60:40 ratios on a mass basis. Twenty grams (dry weight) ofground corn grits was mixed with a calculated amount of deionized water (for control) or germ soakwater (for treatments) to form a slurry with 15% solids, and the pH of the slurry was adjusted to 5.8(recommended optimum pH for the α-amylase). Germ soak water was obtained by soaking the germin deionized water (1:10, germ:water on a weight basis) at 52 ◦C for 12 h, with continuous shaking at125 rpm. After soaking, the liquid was vacuum-filtered through Whatman No. 4 filter paper and usedto make corn slurry. The corn grits starch was liquefied by adding 10 μL of α-amylase and agitatingthe slurry at 85 ◦C for 120 min using an infrared heated reactor system equipped with mini-stainlesssteel tubular reactors that are locked onto a rotating carrousel (Labomat BFA-12, Werner Mathis AG,Switzerland). Simultaneously, 30 g (dry weight) of ground malt was mixed with a calculated amount ofdeionized water to form a mixture with 20% solids, and incubated at 45 ◦C for 30 min, with continuousshaking at 125 rpm. After incubation, malt slurry was mixed with the liquefied corn slurry (cooled to45 ◦C), and 60 mL of preheated water (45 ◦C) was added in the mixture. The mixture was heated to70 ◦C at the heating rate of 1 ◦C per minute, and incubated for 60 min in the mini-stainless steel tubularreactors using a Labomat incubator. The mash was cooled down to room temperature and filteredusing Whatman No. 4 filter paper to separate liquid (wort) and solids (spent grains). The filtered wortwas boiled on a heating plate for about 1 h and filtered again (using Whatman No. 4 filter paper) aftercooling. Yeast inoculum was prepared by sprinkling dry yeast in ten times the amount of water andincubating at 23 ◦C for 20 min, followed by gentle stirring for 30 min. The yeast was inoculated in thewort at the dosage of 100 g/hL, as recommended by the supplier. The fermentation was performed at15 ◦C for 144 h with continuous agitating at 125 rpm. About 2 mL of samples were withdrawn every24 h to monitor the fermentation.
2.4. Sample Analysis and Ethanol Production Rate
Samples collected during the fermentation process were analyzed for sugars and ethanolconcentrations using HPLC, equipped with an ion-exclusion column (Aminex HPX-87H, Bio-Rad,Hercules, CA, USA). The mobile phase used was 50 mM sulfuric acid, eluted at 50 ◦C and 0.6 mL/min.The amounts of sugars and ethanol were quantified using a refractive index detector and calibrationbased on pure sugars and ethanol standards.
106
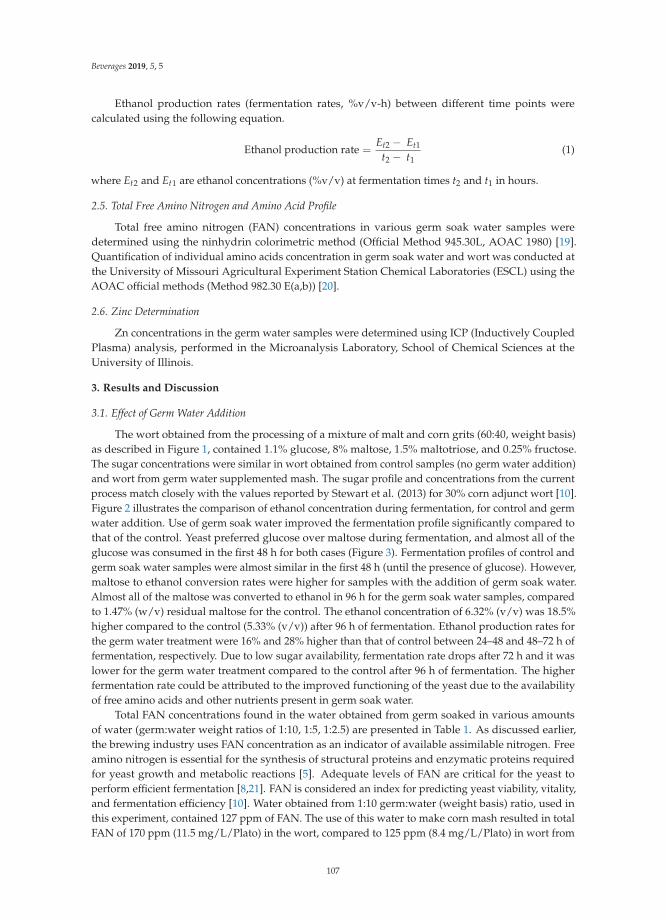
Beverages 2019, 5, 5
Ethanol production rates (fermentation rates, %v/v-h) between different time points werecalculated using the following equation.
Ethanol production rate =Et2 − Et1
t2 − t1(1)
where Et2 and Et1 are ethanol concentrations (%v/v) at fermentation times t2 and t1 in hours.
2.5. Total Free Amino Nitrogen and Amino Acid Profile
Total free amino nitrogen (FAN) concentrations in various germ soak water samples weredetermined using the ninhydrin colorimetric method (Official Method 945.30L, AOAC 1980) [19].Quantification of individual amino acids concentration in germ soak water and wort was conducted atthe University of Missouri Agricultural Experiment Station Chemical Laboratories (ESCL) using theAOAC official methods (Method 982.30 E(a,b)) [20].
2.6. Zinc Determination
Zn concentrations in the germ water samples were determined using ICP (Inductively CoupledPlasma) analysis, performed in the Microanalysis Laboratory, School of Chemical Sciences at theUniversity of Illinois.
3. Results and Discussion
3.1. Effect of Germ Water Addition
The wort obtained from the processing of a mixture of malt and corn grits (60:40, weight basis)as described in Figure 1, contained 1.1% glucose, 8% maltose, 1.5% maltotriose, and 0.25% fructose.The sugar concentrations were similar in wort obtained from control samples (no germ water addition)and wort from germ water supplemented mash. The sugar profile and concentrations from the currentprocess match closely with the values reported by Stewart et al. (2013) for 30% corn adjunct wort [10].Figure 2 illustrates the comparison of ethanol concentration during fermentation, for control and germwater addition. Use of germ soak water improved the fermentation profile significantly compared tothat of the control. Yeast preferred glucose over maltose during fermentation, and almost all of theglucose was consumed in the first 48 h for both cases (Figure 3). Fermentation profiles of control andgerm soak water samples were almost similar in the first 48 h (until the presence of glucose). However,maltose to ethanol conversion rates were higher for samples with the addition of germ soak water.Almost all of the maltose was converted to ethanol in 96 h for the germ soak water samples, comparedto 1.47% (w/v) residual maltose for the control. The ethanol concentration of 6.32% (v/v) was 18.5%higher compared to the control (5.33% (v/v)) after 96 h of fermentation. Ethanol production rates forthe germ water treatment were 16% and 28% higher than that of control between 24–48 and 48–72 h offermentation, respectively. Due to low sugar availability, fermentation rate drops after 72 h and it waslower for the germ water treatment compared to the control after 96 h of fermentation. The higherfermentation rate could be attributed to the improved functioning of the yeast due to the availabilityof free amino acids and other nutrients present in germ soak water.
Total FAN concentrations found in the water obtained from germ soaked in various amountsof water (germ:water weight ratios of 1:10, 1:5, 1:2.5) are presented in Table 1. As discussed earlier,the brewing industry uses FAN concentration as an indicator of available assimilable nitrogen. Freeamino nitrogen is essential for the synthesis of structural proteins and enzymatic proteins requiredfor yeast growth and metabolic reactions [5]. Adequate levels of FAN are critical for the yeast toperform efficient fermentation [8,21]. FAN is considered an index for predicting yeast viability, vitality,and fermentation efficiency [10]. Water obtained from 1:10 germ:water (weight basis) ratio, used inthis experiment, contained 127 ppm of FAN. The use of this water to make corn mash resulted in totalFAN of 170 ppm (11.5 mg/L/Plato) in the wort, compared to 125 ppm (8.4 mg/L/Plato) in wort from
107
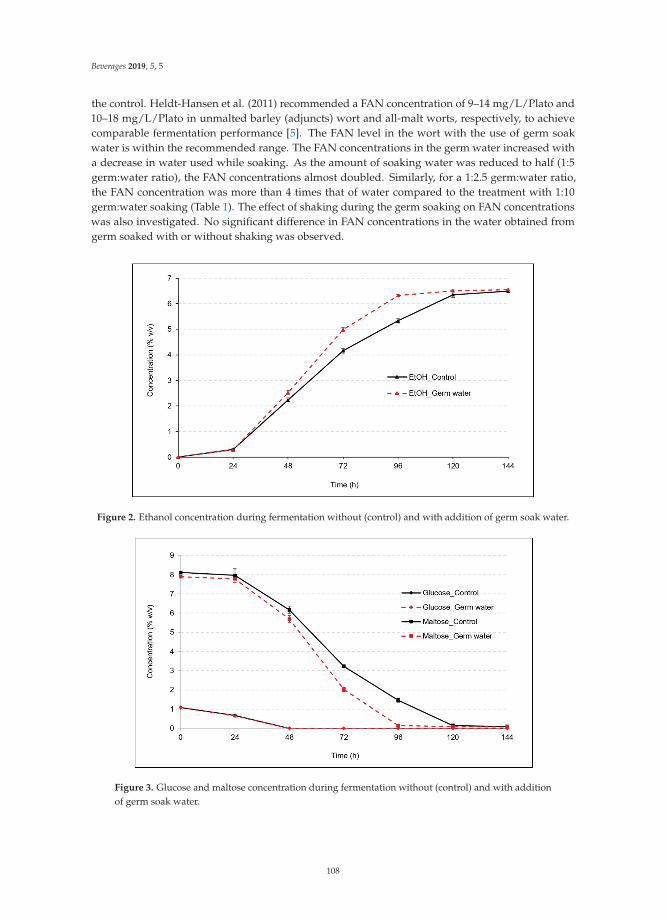
Beverages 2019, 5, 5
the control. Heldt-Hansen et al. (2011) recommended a FAN concentration of 9–14 mg/L/Plato and10–18 mg/L/Plato in unmalted barley (adjuncts) wort and all-malt worts, respectively, to achievecomparable fermentation performance [5]. The FAN level in the wort with the use of germ soakwater is within the recommended range. The FAN concentrations in the germ water increased witha decrease in water used while soaking. As the amount of soaking water was reduced to half (1:5germ:water ratio), the FAN concentrations almost doubled. Similarly, for a 1:2.5 germ:water ratio,the FAN concentration was more than 4 times that of water compared to the treatment with 1:10germ:water soaking (Table 1). The effect of shaking during the germ soaking on FAN concentrationswas also investigated. No significant difference in FAN concentrations in the water obtained fromgerm soaked with or without shaking was observed.
Figure 2. Ethanol concentration during fermentation without (control) and with addition of germ soak water.
Figure 3. Glucose and maltose concentration during fermentation without (control) and with additionof germ soak water.
108
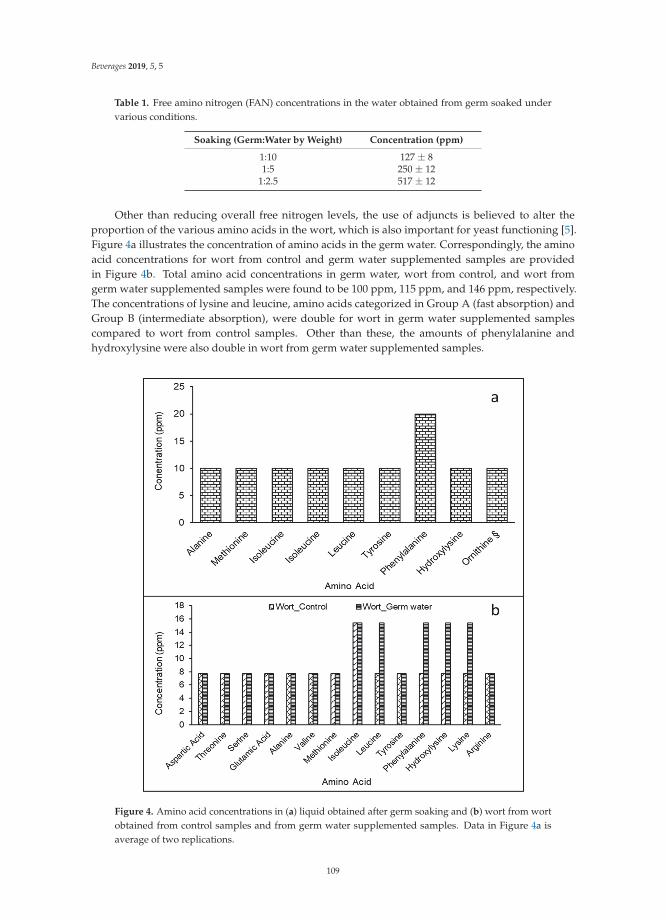
Beverages 2019, 5, 5
Table 1. Free amino nitrogen (FAN) concentrations in the water obtained from germ soaked undervarious conditions.
Soaking (Germ:Water by Weight) Concentration (ppm)
1:10 127 ± 81:5 250 ± 12
1:2.5 517 ± 12
Other than reducing overall free nitrogen levels, the use of adjuncts is believed to alter theproportion of the various amino acids in the wort, which is also important for yeast functioning [5].Figure 4a illustrates the concentration of amino acids in the germ water. Correspondingly, the aminoacid concentrations for wort from control and germ water supplemented samples are providedin Figure 4b. Total amino acid concentrations in germ water, wort from control, and wort fromgerm water supplemented samples were found to be 100 ppm, 115 ppm, and 146 ppm, respectively.The concentrations of lysine and leucine, amino acids categorized in Group A (fast absorption) andGroup B (intermediate absorption), were double for wort in germ water supplemented samplescompared to wort from control samples. Other than these, the amounts of phenylalanine andhydroxylysine were also double in wort from germ water supplemented samples.
Figure 4. Amino acid concentrations in (a) liquid obtained after germ soaking and (b) wort from wortobtained from control samples and from germ water supplemented samples. Data in Figure 4a isaverage of two replications.
109
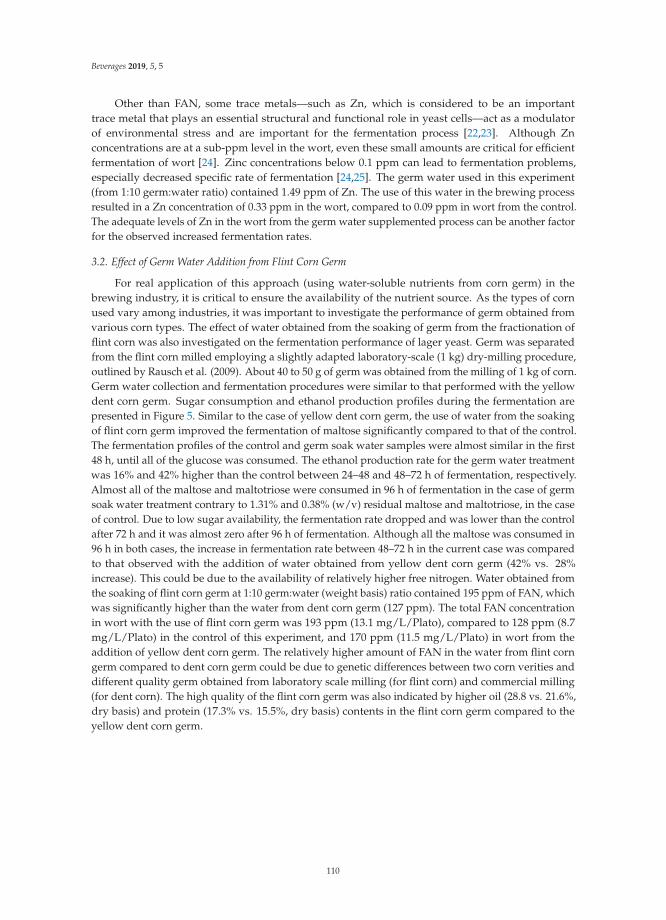
Beverages 2019, 5, 5
Other than FAN, some trace metals—such as Zn, which is considered to be an importanttrace metal that plays an essential structural and functional role in yeast cells—act as a modulatorof environmental stress and are important for the fermentation process [22,23]. Although Znconcentrations are at a sub-ppm level in the wort, even these small amounts are critical for efficientfermentation of wort [24]. Zinc concentrations below 0.1 ppm can lead to fermentation problems,especially decreased specific rate of fermentation [24,25]. The germ water used in this experiment(from 1:10 germ:water ratio) contained 1.49 ppm of Zn. The use of this water in the brewing processresulted in a Zn concentration of 0.33 ppm in the wort, compared to 0.09 ppm in wort from the control.The adequate levels of Zn in the wort from the germ water supplemented process can be another factorfor the observed increased fermentation rates.
3.2. Effect of Germ Water Addition from Flint Corn Germ
For real application of this approach (using water-soluble nutrients from corn germ) in thebrewing industry, it is critical to ensure the availability of the nutrient source. As the types of cornused vary among industries, it was important to investigate the performance of germ obtained fromvarious corn types. The effect of water obtained from the soaking of germ from the fractionation offlint corn was also investigated on the fermentation performance of lager yeast. Germ was separatedfrom the flint corn milled employing a slightly adapted laboratory-scale (1 kg) dry-milling procedure,outlined by Rausch et al. (2009). About 40 to 50 g of germ was obtained from the milling of 1 kg of corn.Germ water collection and fermentation procedures were similar to that performed with the yellowdent corn germ. Sugar consumption and ethanol production profiles during the fermentation arepresented in Figure 5. Similar to the case of yellow dent corn germ, the use of water from the soakingof flint corn germ improved the fermentation of maltose significantly compared to that of the control.The fermentation profiles of the control and germ soak water samples were almost similar in the first48 h, until all of the glucose was consumed. The ethanol production rate for the germ water treatmentwas 16% and 42% higher than the control between 24–48 and 48–72 h of fermentation, respectively.Almost all of the maltose and maltotriose were consumed in 96 h of fermentation in the case of germsoak water treatment contrary to 1.31% and 0.38% (w/v) residual maltose and maltotriose, in the caseof control. Due to low sugar availability, the fermentation rate dropped and was lower than the controlafter 72 h and it was almost zero after 96 h of fermentation. Although all the maltose was consumed in96 h in both cases, the increase in fermentation rate between 48–72 h in the current case was comparedto that observed with the addition of water obtained from yellow dent corn germ (42% vs. 28%increase). This could be due to the availability of relatively higher free nitrogen. Water obtained fromthe soaking of flint corn germ at 1:10 germ:water (weight basis) ratio contained 195 ppm of FAN, whichwas significantly higher than the water from dent corn germ (127 ppm). The total FAN concentrationin wort with the use of flint corn germ was 193 ppm (13.1 mg/L/Plato), compared to 128 ppm (8.7mg/L/Plato) in the control of this experiment, and 170 ppm (11.5 mg/L/Plato) in wort from theaddition of yellow dent corn germ. The relatively higher amount of FAN in the water from flint corngerm compared to dent corn germ could be due to genetic differences between two corn verities anddifferent quality germ obtained from laboratory scale milling (for flint corn) and commercial milling(for dent corn). The high quality of the flint corn germ was also indicated by higher oil (28.8 vs. 21.6%,dry basis) and protein (17.3% vs. 15.5%, dry basis) contents in the flint corn germ compared to theyellow dent corn germ.
110

Beverages 2019, 5, 5
Figure 5. Ethanol (% v/v), glucose (% w/v), and maltose (% w/v) concentrations during fermentationwithout (control) and with the addition of flint corn germ soak water.
3.3. Use of Concentrated Germ Water in Wort
In the previous experiments, germ water was added during the slurry formation before mashing(Figure 1). To explore the possibility of using these water-soluble nutrients without making manychanges in the currently used brewing process, another approach of adding germ water directly inthe wort was also investigated. However, the addition of germ water in wort would result in dilution.To provide the same amount of nutrients (as in previous experiments), the addition of germ water(1:10 germ to water ratio soaking) would result in about 40% dilution. This problem was addressedby using germ soak water containing a higher concentration of nutrients. The total FAN in the waterobtained from 1:2.5 germ to water ratio (referred as 4X water in the manuscript) was a little more than4 times the FAN concentration in water from 1:10 germ to water ratio (referred as 1X water in themanuscript) during soaking (Table 1). Due to the high amount of FAN, a relatively small amount ofthis water would be required to be added to the wort, which would reduce the dilution (only 10%).Further concentration (using less than 2.5 times water) was not possible due to insufficient wateravailable to soak all of the germ. Germ (from yellow dent corn) was soaked in water (1:2.5 germ towater ratio, mass basis) and incubated at 52 ◦C for 12 h with continuous shaking at 125 rpm. In thisexperiment, 27 mL of this water was mixed in 265 mL wort, before the boiling step. The rest of thesteps were similar to the previous process, as explained in Figure 1. In addition to the current treatment(adding 4X water in wort) and control (no germ water), another treatment (1X water) following theoriginal process (adding germ water from 1:10 germ to water ratio to make corn mash) was alsoconducted for comparison purposes. To keep the wort concentrations similar in all three cases, 27 mLof deionized water was added in the wort before boiling for control and 1X water. All treatments wereconducted in replication.
Figure 6 illustrates the ethanol production rate comparison for three cases: (i) control, (ii) useof germ soak water to make corn mash (1X water), (iii) use of concentrated (4X) germ soak waterin the wort. The addition of concentrated germ soak water in wort increased the fermentation ratecompared to the control. Both treatments (the addition of 4X water in wort or making corn slurry withgerm water) were equally efficient in increasing the fermentation speed. The ethanol concentrationwas almost the same for both treatments at all the time points. Less than 0.1% (w/v) maltose wasobserved after 96 h of fermentation, compared to 0.73% (w/v) for the control, for which the maltoseconcentration was found to be 0.1% after 120 h of fermentation. The fermentation rate was 30% higher
111

Beverages 2019, 5, 5
than the control between 48 and 72 h of fermentation. These results indicate that germ water can beconcentrated and added to the wort to fasten the fermentation.
Figure 6. Rate of ethanol production during fermentation for three cases: (i) control, (ii) use of germsoak water in corn mash, (iii) use of concentrated germ soak water in wort. Data in the graphs is theaverage of two replications.
3.4. Change in Composition of Germ
Corn germ is valuable for its oil content, which directly decides its market value [26].The extraction of soluble protein and other micronutrients during soaking would increase the oilcontent in germ and improve its economic value. The oil content of soaked dent corn germ increasedby 33% (21.6% to 28.7%, dry basis) compared to raw germ. The increase in oil content of flint corn germwas found to be 29%. Due to increased oil content, the germ would have a higher market price, whichcould compensate the cost required for soaking and filtration to make germ soak water. The proteincontent in soaked dent corn germ (14.7%) was 5% less compared to raw germ (15.5%). This reductionin protein content further indicates that soluble proteins were extracted during germ soaking, whichenhanced the yeast functioning and fermentation speed.
4. Conclusions
Due to low protein content, the use of high amounts of corn grits as adjuncts causes nutrientdeficiency to yeast during fermentation and leads to sluggish fermentation. This work developedeconomical process strategies to improve the fermentation rate by providing these nutrients fromcereal-based origin. Water obtained from the soaking of corn germ was used as a nutrient source toimprove yeast performance during the brewing process using 40% corn grits as adjuncts. The additionof germ water improved the FAN levels in the wort, which enhanced yeast functioning and shortenedthe fermentation time from 120 to 96 h. The water obtained from flint corn germ had higher amounts ofFAN compared to dent corn germ, however, the total maltose consumption time was 96 h in both cases.The study also demonstrated that the nutrients can be concentrated up to 4 times by proportionallydecreasing the degree of dilution during the soaking process, and the concentrated water can be addeddirectly to the wort to improve fermentation speed. Soaking of germ increased oil content by 33% inthe germ, improving its market value.
112
Beverages 2019, 5, 5
Author Contributions: D.K. performed experiments, analyzed data, and wrote the manuscript. D.K., V.S., and A.-S.H.designed the study and reviewed results. B.J.G. helped with data analysis and the design of experiments. A.-S.H. andW.D. reviewed and edited the manuscript. All authors read and approved the manuscript.
Funding: Partial funding for this study was provided by Anheuser Busch InBev.
Conflicts of Interest: Some of the coauthors (Anna-Sophie Hager, Alberto Sun, Winok Debyser, Bruno Guagliano)are current and former employees of Anheuser Busch InBev. However, in this study a new process wasdeveloped and no Anheuser Bush InBev products or processes were evaluated or compared with any othercompany’s products.
References
1. Li, Q.; Wang, J.; Liu, C. Beers. In Current Developments in Biotechnology and Bioengineering; Elsevier: New York,NY, USA, 2017; pp. 305–351. Available online: https://www.sciencedirect.com/book/9780444636669/current-developments-in-biotechnology-and-bioengineering (accessed on 11 January 2019).
2. Bravi, E.; Sensidoni, M.; Floridi, S.; Perretti, G. Fatty Acids Composition Differences between Beers Made WithAll-Malt and Brewer’s Corn Grits and Malt; Technical quarterly; Food and Agriculture Organization (FAO):Rome, Italy, 2009.
3. Zhuang, S.; Shetty, R.; Hansen, M.; Fromberg, A.; Hansen, P.B.; Hobley, T.J. Brewing with 100% UnmaltedGrains: Barley, Wheat, Oat and Rye. Eur. Food Res. Technol. 2017, 243, 447–454. [CrossRef]
4. Poreda, A.; Czarnik, A.; Zdaniewicz, M.; Jakubowski, M.; Antkiewicz, P. Corn grist adjunct–application andinfluence on the brewing process and beer quality. J. Inst. Brew. 2014, 120, 77–81. [CrossRef]
5. Bogdan, P.; Kordialik-Bogacka, E. Alternatives to malt in brewing. Trends Food Sci. Technol. 2017, 65, 1–9.[CrossRef]
6. Cooper, C.; Evans, D.; Yousif, A.; Metz, N.; Koutoulis, A. Comparison of the impact on the performance ofsmall-scale mashing with different proportions of unmalted barley, Ondea Pro®, malt and rice. J. Inst. Brew.2016, 122, 218–227. [CrossRef]
7. USDA-NAAS. Grain Crushings and CoProducts Production 2017 Summary; United States Department of Agriculture:Washington, DC, USA, 2018.
8. Lekkas, C.; Stewart, G.; Hill, A.; Taidi, B.; Hodgson, J. The importance of free amino nitrogen in wort andbeer. Tech. Q.-Master Brew. Assoc. Am. 2005, 42, 113.
9. Zembold-Gula, A.; Blazewicz, J.; Wojewodzka, K. Protein Compounds in Brewing Worts Produced with Additionof Naked Barley Grain; Zywnosc Nauka Technologia Jakosc (Poland); Food and Agriculture Organization(FAO): Rome, Italy, 2008.
10. Stewart, G.G.; Hill, A.E.; Russell, I. 125th anniversary review: Developments in brewing and distilling yeaststrains. J. Inst. Brew. 2013, 119, 202–220. [CrossRef]
11. Yano, M.; Tsuda, H.; Imai, T.; Ogawa, Y.; Ohkochi, M. The effect of barley adjuncts on free amino nitrogencontents in wort. J. Inst. Brew. 2008, 114, 230–238. [CrossRef]
12. Murthy, G.S.; Singh, V.; Johnston, D.B.; Rausch, K.D.; Tumbleson, M. Improvement in fermentation characteristicsof degermed ground corn by lipid supplementation. J. Ind. Microbiol. Biotechnol. 2006, 33, 655–660. [CrossRef][PubMed]
13. Ramchandran, D.; Wang, P.; Dien, B.; Liu, W.; Cotta, M.A.; Singh, V. Improvement of Dry-FractionationEthanol Fermentation by Partial Germ Supplementation. Cereal Chem. 2015, 92, 218–223. [CrossRef]
14. Murthy, G.S.; Singh, V.; Johnston, D.B.; Rausch, K.D.; Tumbleson, M. Evaluation and strategies to improvefermentation characteristics of modified dry-grind corn processes. Cereal Chem. 2006, 83, 455–459. [CrossRef]
15. Juneja, A.; Kumar, D.; Singh, V. Germ soak water as nutrient source to improve fermentation of corn gritsfrom modified corn dry grind process. Bioresour. Bioprocess. 2017, 4, 38. [CrossRef] [PubMed]
16. Rausch, K.D.; Pruiett, L.E.; Wang, P.; Xu, L.; Belyea, R.L.; Tumbleson, M. Laboratory Measurement of Yieldand Composition of Dry-Milled Corn Fractions Using a Shortened, Single-Stage Tempering Procedure.Cereal Chem. 2009, 86, 434–438. [CrossRef]
17. Vidal, B.C., Jr.; Rausch, K.D.; Tumbleson, M.; Singh, V. Protease treatment to improve ethanol fermentationin modified dry grind corn processes. Cereal Chem. 2009, 86, 323–328. [CrossRef]
18. AOAC. Official Methods of the Association of Official Analytical Chemists Washington, DC; Vol. Methods 920.39,924.05, 973.18, 990.03; AOAC: Rockville, MD, USA, 2003.
113
Beverages 2019, 5, 5
19. Vidal, B.C., Jr.; Johnston, D.B.; Rausch, K.D.; Tumbleson, M.; Singh, V. Germ-derived FAN as nitrogen sourcefor corn endosperm fermentation. Cereal Chem. 2011, 88, 328–332. [CrossRef]
20. AOAC. Official Methods of Analysis of AOAC International: Arlington, VA.; Vol. Method 982.30 E(a, b, c) chp.45.3.05; AOAC: Rockville, MD, USA, 2006.
21. Lekkas, C.; Stewart, G.; Hill, A.; Taidi, B.; Hodgson, J. Elucidation of the role of nitrogenous wort componentsin yeast fermentation. J. Inst. Brew. 2007, 113, 3–8. [CrossRef]
22. Rowell, J.L. Exploring Fermentation Rate in Beer and Hard Cider Brewing; Western Carolina University:Cullowhee, NC, USA, 2015.
23. Walker, G.M. Metals in yeast fermentation processes. Adv. Appl. Microbiol. 2004, 54, 197–230. [PubMed]24. De Nicola, R.; Walker, G.M. Accumulation and cellular distribution of zinc by brewing yeast. Enzyme Microb.
Technol. 2009, 44, 210–216. [CrossRef]25. Bromberg, S.K.; Bower, P.A.; Duncombe, G.; Fehring, J.; Gerber, L.; Lau, V.K.; Tata, M. Requirements for zinc,
manganese, calcium, and magnesium in wort. J. Am. Soc. Brew. Chem. 1997, 55, 123–128. [CrossRef]26. Johnston, D.B.; McAloon, A.J.; Moreau, R.A.; Hicks, K.B.; Singh, V. Composition and economic comparison
of germ fractions from modified corn processing technologies. J. Am. Oil Chem. Soc. 2005, 82, 603–608.[CrossRef]
© 2019 by the authors. Licensee MDPI, Basel, Switzerland. This article is an open accessarticle distributed under the terms and conditions of the Creative Commons Attribution(CC BY) license (http://creativecommons.org/licenses/by/4.0/).
114

beverages
Article
Why Craft Brewers Should Be Advised to Use BottleRefermentation to Improve Late-HoppedBeer Stability
Carlos Silva Ferreira, Etienne Bodart and Sonia Collin *
Earth and Life Institute ELIM, Université catholique de Louvain, Croix du Sud, 2 box L7.05.07,B-1348 Louvain-la-Neuve, Belgium; [email protected] (C.S.F.); [email protected] (E.B.)* Correspondence: [email protected]; Tel.: +32-10472913
Received: 28 February 2019; Accepted: 13 May 2019; Published: 4 June 2019
Abstract: The aromatic complexity of craft beers, together with some particular practices (use ofsmall vessels, dry hopping, etc.), can cause more oxidation associated with pre-maturated colloidalinstability, Madeira off-flavors, bitterness decrease, and aroma loss. As bottle refermentation is widelyused in Belgian craft beers, the aim of the present work is to assess how this practice might impact theirflavor. In fresh beers, key flavors were evidenced by four complementary techniques: short-chainfatty acids determination, esters analysis, XAD-2 extract olfactometry, and overall sensory analysis.In almost all of the fresh beers, isovaleric acid was the sole fatty acid found above its sensory threshold.Selected samples were further analyzed through natural aging at 20 ◦C. The presence of yeast in thebottle minimized the trans-2-nonenal released from Schiff bases and proved less deleterious thansuggested by previous studies with regard to fatty acid release and ester decrease through aging.Furthermore, according to the yeast species selected, some interesting terpenols and phenols wereproduced from glucosides during storage.
Keywords: craft beer; bottle refermentation; AEDA; short-chain fatty acids; beer aging
1. Introduction
Worldwide, over the last few decades, the production of craft beers has grown significantly,with new commercial products launched onto the market every day. Craftsmen can bring distinctiveflavors to their beers by working with special malts, dual-purpose hop varieties (with or withoutdry hopping), spices, and/or specialty yeasts. These are known to impart fruity esters [1,2] and, insome cases, typical phenolic flavors [3] (e.g., 4-vinylguaiacol brought by phenolic off-flavor (POF(+))yeasts). In addition, odorous heterocyclic compounds can be issued from colored malts [4,5], while hopterpenols and polyfunctional thiols bring pleasant citrus and exotic flavors to late- and dry-hoppedbeers [6–8]. Unfortunately, the use of small vessels and craftsmanship, by definition, lead to a higherrisk of oxidation and shelf-life decrease.
Beer aging has been the focus of much interest for decades, with the development of worldwidebeverage exchanges. The Dalgliesh plot [9] describes aromatic changes occurring in lager beersduring storage. A linear decrease in bitterness (degradation of isohumulones and/or humulinones)coincides with an increase in sweet aroma and toffee flavor, together with the well-known cardboardtaint (caused by trans-2-nonenal) [10–13] and ribes off-flavor (a catty smell linked to the presence of3-sulfanyl-3-methylbutyl formate) [14,15]. Aging of specialty beers is even more complex, with defectssuch as Madeira off-flavor [16], phenolic perception [17], a change in hoppy aromas [18], and a detectedether taint [19].
Bottle refermentation has been widely used by Belgian craft brewers for its carbonation effect,giving beer the desired effervescence, and also for the associated oxygen consumption, which limits
Beverages 2019, 5, 39; doi:10.3390/beverages5020039 www.mdpi.com/journal/beverages115

Beverages 2019, 5, 39
oxidation and the development of related off-flavors [20–22]. About half a million yeast cells per mLare pitched into the beer before bottling, in the presence of added fermentable sugars. The beer is thenkept in a warm room (20–28 ◦C) from two to four weeks.
According to Saison et al. [23], however, refermentation can be damageable, causing loss offlowery, fruity, and ester notes that are highly appreciated by consumers. Long storage can lead toyeast autolysis with release of esterases (deleterious to fruity esters) and to excretion of amino acids,peptides, and short-chain fatty acids [24–28]. When Brettanomyces strains are present in the bottle,production of isovaleric, hexanoic, and octanoic acids is especially promoted [29–31].
The aim of the present paper was to assess how bottle refermentation impacts the flavorproperties of Belgian craft beers. As bottle refermentation was already known to significantlyimprove the release of free-hop thiols from cysteine and glutathione conjugates [22], we decided toinvestigate only non-dry-hopped commercial samples. First, short-chain fatty acids were investigatedin 16 bottle-refermented and two unrefermented Belgian craft beers to determine whether they werepresent above their sensory threshold. In a few selected samples, more flavors were then analyzedthrough natural aging at 20 ◦C in the dark. Esters (isoamyl acetate, ethyl hexanoate, and ethyl octanoate)were quantitated by headspace-GC-FID, and most trace aromas were monitored by GC-olfactometryafter XAD-2 aroma extraction. Lastly, some cardboard defects (trans-2-nonenal) and a few otherchanges in aroma were evidenced by overall sensory analysis.
2. Materials and Methods
2.1. Materials
Isoamyl acetate (99%), ethyl hexanoate (99%), ethyl octanoate (99%), 2-pentanol (98%), isovalericacid (99%), hexanoic acid (≥98%), octanoic acid (≥98%), nonanoic acid (99%), and decanoic acidwere purchased from Sigma Aldrich GmbH (Bornem, Belgium); n-hexanol from Acros Organics(Geel, Belgium); ethanol (99.8%) from Merck (Darmstadt, Germany); XAD-2 resin from Supelco Inc.(Bellefonte, United States of America); and sodium chloride, copper sulfate (II), and diethyl ether fromVWR International (Leuven, Belgium). Authentic standard flavor compounds for olfactometry were ofpure grade (purity >98%) from Sigma-Aldrich. Milli-Q water was used (Millipore, Bedford, MA, USA).
2.2. Beer Samples and Aging Procedure
A total of 18 commercial, top-fermented, late-hopped beers (here listed as A–R for reasons ofconfidentiality) were kindly supplied by Belgian craft brewers. All were bottle-refermented, exceptbeers A and B. Six representative samples (A–F), same lot as above, were further selected for morein-depth investigations through natural aging (20 ◦C in the dark). The main characteristics of thesebeers are depicted in Table 1.
Table 1. Main characteristics of the six selected craft beers.
BeerAlcohol(% vol)
Real Extract(◦P)
pHBitterness
(BU)Color(EBC)
Sensorial Characteristics
A 6.5 4.6 4.2 15 12.5 Butter, apple, hop, greenB 12.3 6.6 4.4 20 25 Alcohol, banana, cheese, phenols
C * 7.9 5.1 4.5 21 16.5 Butter, sulfur, hopD * 8.8 5.8 4.4 14 66 Malt, sulfur, greenE * 8.1 4.2 4.4 29 14.5 Lemon, banana, apple, spicy, phenolsF * 7.5 3.7 4.5 24 15.5 Orange, pineapple, spicy, phenols
*: with bottle refermentation.
116
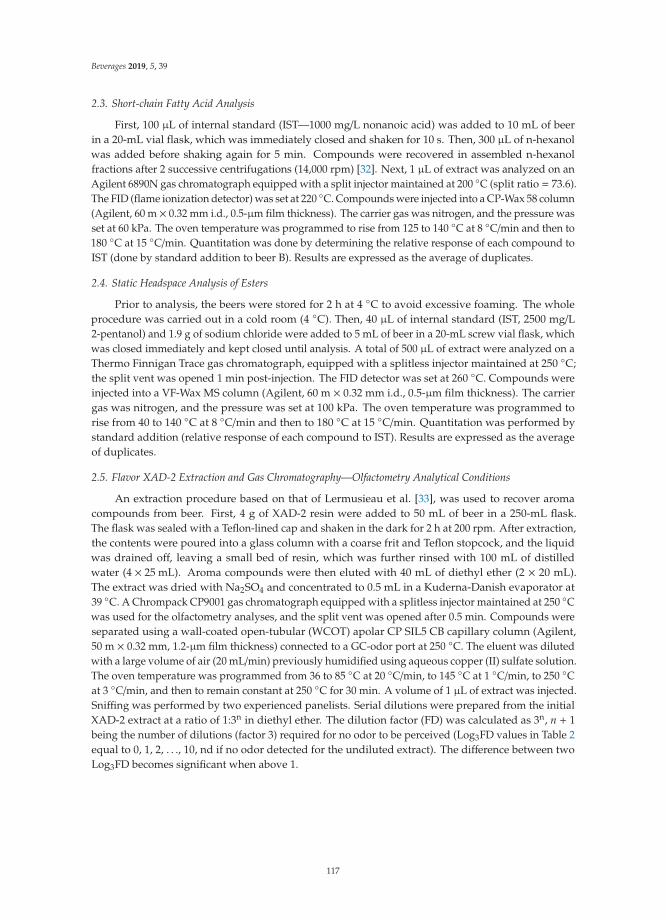
Beverages 2019, 5, 39
2.3. Short-chain Fatty Acid Analysis
First, 100 μL of internal standard (IST—1000 mg/L nonanoic acid) was added to 10 mL of beerin a 20-mL vial flask, which was immediately closed and shaken for 10 s. Then, 300 μL of n-hexanolwas added before shaking again for 5 min. Compounds were recovered in assembled n-hexanolfractions after 2 successive centrifugations (14,000 rpm) [32]. Next, 1 μL of extract was analyzed on anAgilent 6890N gas chromatograph equipped with a split injector maintained at 200 ◦C (split ratio = 73.6).The FID (flame ionization detector) was set at 220 ◦C. Compounds were injected into a CP-Wax 58 column(Agilent, 60 m × 0.32 mm i.d., 0.5-μm film thickness). The carrier gas was nitrogen, and the pressure wasset at 60 kPa. The oven temperature was programmed to rise from 125 to 140 ◦C at 8 ◦C/min and then to180 ◦C at 15 ◦C/min. Quantitation was done by determining the relative response of each compound toIST (done by standard addition to beer B). Results are expressed as the average of duplicates.
2.4. Static Headspace Analysis of Esters
Prior to analysis, the beers were stored for 2 h at 4 ◦C to avoid excessive foaming. The wholeprocedure was carried out in a cold room (4 ◦C). Then, 40 μL of internal standard (IST, 2500 mg/L2-pentanol) and 1.9 g of sodium chloride were added to 5 mL of beer in a 20-mL screw vial flask, whichwas closed immediately and kept closed until analysis. A total of 500 μL of extract were analyzed on aThermo Finnigan Trace gas chromatograph, equipped with a splitless injector maintained at 250 ◦C;the split vent was opened 1 min post-injection. The FID detector was set at 260 ◦C. Compounds wereinjected into a VF-Wax MS column (Agilent, 60 m × 0.32 mm i.d., 0.5-μm film thickness). The carriergas was nitrogen, and the pressure was set at 100 kPa. The oven temperature was programmed torise from 40 to 140 ◦C at 8 ◦C/min and then to 180 ◦C at 15 ◦C/min. Quantitation was performed bystandard addition (relative response of each compound to IST). Results are expressed as the averageof duplicates.
2.5. Flavor XAD-2 Extraction and Gas Chromatography—Olfactometry Analytical Conditions
An extraction procedure based on that of Lermusieau et al. [33], was used to recover aromacompounds from beer. First, 4 g of XAD-2 resin were added to 50 mL of beer in a 250-mL flask.The flask was sealed with a Teflon-lined cap and shaken in the dark for 2 h at 200 rpm. After extraction,the contents were poured into a glass column with a coarse frit and Teflon stopcock, and the liquidwas drained off, leaving a small bed of resin, which was further rinsed with 100 mL of distilledwater (4 × 25 mL). Aroma compounds were then eluted with 40 mL of diethyl ether (2 × 20 mL).The extract was dried with Na2SO4 and concentrated to 0.5 mL in a Kuderna-Danish evaporator at39 ◦C. A Chrompack CP9001 gas chromatograph equipped with a splitless injector maintained at 250 ◦Cwas used for the olfactometry analyses, and the split vent was opened after 0.5 min. Compounds wereseparated using a wall-coated open-tubular (WCOT) apolar CP SIL5 CB capillary column (Agilent,50 m × 0.32 mm, 1.2-μm film thickness) connected to a GC-odor port at 250 ◦C. The eluent was dilutedwith a large volume of air (20 mL/min) previously humidified using aqueous copper (II) sulfate solution.The oven temperature was programmed from 36 to 85 ◦C at 20 ◦C/min, to 145 ◦C at 1 ◦C/min, to 250 ◦Cat 3 ◦C/min, and then to remain constant at 250 ◦C for 30 min. A volume of 1 μL of extract was injected.Sniffing was performed by two experienced panelists. Serial dilutions were prepared from the initialXAD-2 extract at a ratio of 1:3n in diethyl ether. The dilution factor (FD) was calculated as 3n, n + 1being the number of dilutions (factor 3) required for no odor to be perceived (Log3FD values in Table 2equal to 0, 1, 2, . . ., 10, nd if no odor detected for the undiluted extract). The difference between twoLog3FD becomes significant when above 1.
117

Beverages 2019, 5, 39
Table 2. GC-olfactometric analysis of XAD-2 extracts issued from beers A, C, E, and F (fresh and after 6months of storage at 20 ◦C). RI: retention index; nd: not detected.
Log3FD
A C E F
Compound RI Odor Fresh Aged Fresh Aged Fresh Aged Fresh Aged
Ethyl butyrate 778 Red fruits 1 1 4 6 nd 3 3 4
3-Methyl-2-buten-1-thiol 809 Garlic, hoppy 7 8 7 8 10 10 10 10
Isovaleric acid 811 Sweat, rancid 2 2 2 2 4 5 5 5
2-Methylbutanoicacid 828 Sweat 2 2 2 2 4 5 3 6
2-Methyl-3-furanthiol 850 Broth 5 7 5 2 10 10 10 10
Isoamyl acetate 854 Fruity, banana 1 1 2 2 nd nd nd nd
Ethyl hexanoate 979 Fruity, candy 2 2 4 4 3 4 4 4
Furaneol 1037 Cotton candy 4 5 6 7 5 5 4 7
Linalool 1089 Flowery,coriander 7 6 6 7 nd nd 5 2
trans-2-Nonenal 1127 Cardboard nd 6 nd 5 3 4 4 5
Citronellol 1216 Fruity, flowery nd nd 1 4 3 2 nd 8
4-Vinylguaiacol 1294 Clove 3 4 4 4 5 6 4 6
γ-Nonalactone 1327 Coconut nd 3 0 4 1 2 3 5
Vanillin 1365 Vanilla 0 nd 6 7 nd 4 1 5
β-Damascenone 1374 Fruity, apricot 2 3 4 5 4 4 3 6
4-Vinylsyringol 1543 Clove 3 3 0 3 2 3 5 5
2.6. Sensory Analyses
A group of 10 panelists (all trained scientists, non-smokers, and regular consumers of craft beers,including three women and seven men aged 23–55 years) scored four aging attributes on a scale of0–4: cardboard, bread, cooked fruit, and dried fruit. A score of 0 meant the panelist did not detect thearoma, whereas a score of 4 meant the aroma was strongly perceived.
3. Results and Discussion
3.1. Short-Chain Fatty Acids
GC analyses revealed considerable variability of short-chain fatty acid profiles among freshBelgian craft beers (Figure 1). Most samples contained isovaleric acid (Figure 1a) at a concentrationabove its threshold (1 mg/L) [34]. In all cases, on the other hand, hexanoic (Figure 1b), octanoic(Figure 1c), and decanoic acids (Figure 1d) were below their sensory thresholds (10, 10, and 5 mg/L,respectively [35]). A good correlation (R2 = 0.72) was found, as expected, between the concentrationsof hexanoic acid and octanoic acid (Figure 2).
118
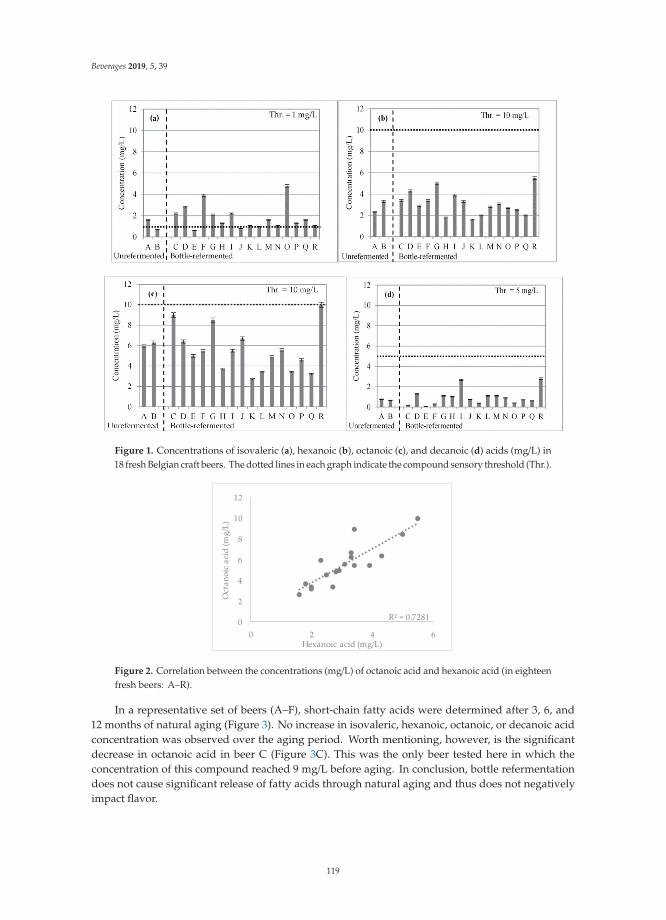
Beverages 2019, 5, 39
Figure 1. Concentrations of isovaleric (a), hexanoic (b), octanoic (c), and decanoic (d) acids (mg/L) in18 fresh Belgian craft beers. The dotted lines in each graph indicate the compound sensory threshold (Thr.).
R² = 0.72810
2
4
6
8
10
12
0 2 4 6
Oct
anoi
c ac
id (m
g/L)
Hexanoic acid (mg/L)
Figure 2. Correlation between the concentrations (mg/L) of octanoic acid and hexanoic acid (in eighteenfresh beers: A–R).
In a representative set of beers (A–F), short-chain fatty acids were determined after 3, 6, and12 months of natural aging (Figure 3). No increase in isovaleric, hexanoic, octanoic, or decanoic acidconcentration was observed over the aging period. Worth mentioning, however, is the significantdecrease in octanoic acid in beer C (Figure 3C). This was the only beer tested here in which theconcentration of this compound reached 9 mg/L before aging. In conclusion, bottle refermentationdoes not cause significant release of fatty acids through natural aging and thus does not negativelyimpact flavor.
119

Beverages 2019, 5, 39
Unrefermented
Bottle-refermented
0
2
4
6
8
10
Fresh 3 months 6 months 12 months
Conc
entr
atio
n (m
g/L)
A Isovaleric acidHexanoic acidOctanoic acidDecanoic acid
0
2
4
6
8
10
Fresh 3 months 6 months 12 months
Con
cent
rati
on (m
g/L)
B
0
2
4
6
8
10
Fresh 3 months 6 months 12 months
Con
cent
rati
on (m
g/L)
C
0
2
4
6
8
10
Fresh 3 months 6 months 12 months
Con
cen
trat
ion
(mg/
L) D
0
2
4
6
8
10
Fresh 3 months 6 months 12 months
Con
cent
rati
on (m
g/L)
E
0
2
4
6
8
10
Fresh 3 months 6 months 12 months
Con
cent
rati
on (m
g/L)
F
Figure 3. Concentrations (mg/L) of isovaleric acid (�), hexanoic acid (�), octanoic acid (�), and decanoicacid (�) in fresh beers (A–F) and their evolution during natural aging (3, 6, and 12 months). Variationcoefficients under 5%.
3.2. Esters
Esters were determined on the same sampling of craft beers (A–F) in the course of one year ofnatural aging (Figure 4). For fresh beers, a strong correlation (R2 = 0.86) was again observed betweenthe concentrations of ethyl hexanoate and ethyl octanoate (Figure 5a), although these ester levels did notcorrelate well with the hexanoic and octanoic acids concentrations (Figure 5b,c). Ethyl hexanoate andethyl octanoate, were found very close to their sensory thresholds (0.2 and 0.9 mg/L, respectively [36])in all fresh samples and remained relatively stable during aging, with no significant difference betweenthe unrefermented (A and B) and bottle-refermented (C–F) samples. On the other hand, the fruitybanana-like isoamyl acetate was found to be partially degraded throughout the year of storage in allbeers except B (characterized by a much higher level of ethanol, Table 1). The similar trend observed inA and C–F confirms that esters can be broken down even without the release of esterases upon yeastautolysis. In all of the beers, the isoamyl acetate concentration remained above the sensory threshold(0.5 mg/L [37]) after one year.
120

Beverages 2019, 5, 39
Unrefermented
Bottle-refermented
0.0
1.5
3.0
4.5
6.0
Fresh 3 months 6 months 12 months
Con
cent
rati
on (m
g/L) A Isoamyl acetate
Ethyl hexanoateEthyl octanoate
0.0
1.5
3.0
4.5
6.0
Fresh 3 months 6 months 12 months
Con
cent
rati
on (m
g/L) B
0.0
1.5
3.0
4.5
6.0
Fresh 3 months 6 months 12 months
Con
cent
rati
on (m
g/L) C
0.0
1.5
3.0
4.5
6.0
Fresh 3 months 6 months 12 months
Con
cen
trat
ion
(mg/
L) D
0.0
1.5
3.0
4.5
6.0
Fresh 3 months 6 months 12 months
Con
cent
rati
on (m
g/L) E
0.0
1.5
3.0
4.5
6.0
Fresh 3 months 6 months 12 months
Con
cen
trat
ion
(mg/
L) F
Figure 4. Concentrations (mg/L) of isoamyl acetate (�), ethyl hexanoate (�), and ethyl octanoate (�) infresh beers (A–F) and their evolution during natural aging (3, 6, and 12 months). Variation coefficientsunder 5%.
121
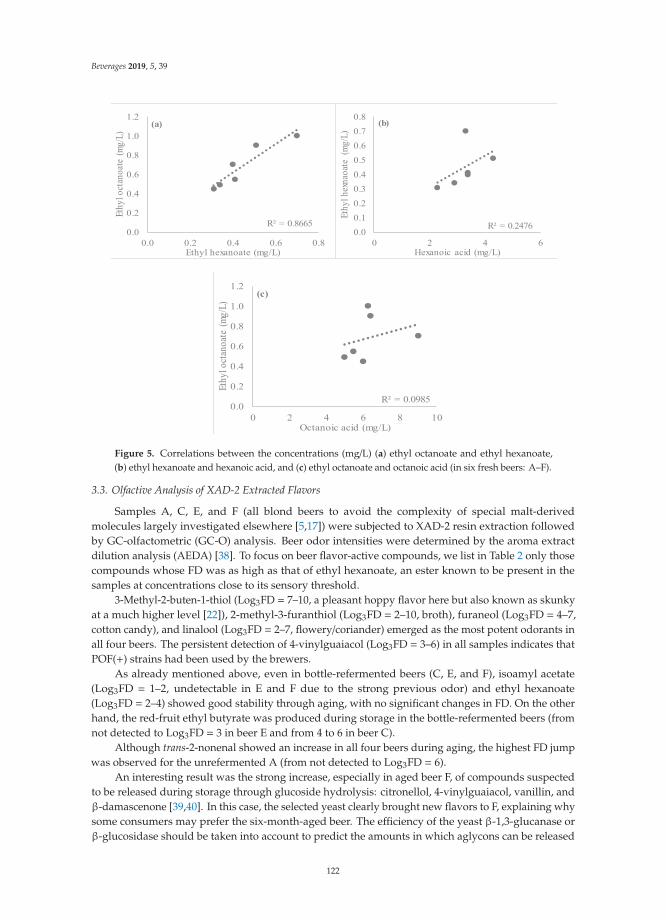
Beverages 2019, 5, 39
Figure 5. Correlations between the concentrations (mg/L) (a) ethyl octanoate and ethyl hexanoate,(b) ethyl hexanoate and hexanoic acid, and (c) ethyl octanoate and octanoic acid (in six fresh beers: A–F).
3.3. Olfactive Analysis of XAD-2 Extracted Flavors
Samples A, C, E, and F (all blond beers to avoid the complexity of special malt-derivedmolecules largely investigated elsewhere [5,17]) were subjected to XAD-2 resin extraction followedby GC-olfactometric (GC-O) analysis. Beer odor intensities were determined by the aroma extractdilution analysis (AEDA) [38]. To focus on beer flavor-active compounds, we list in Table 2 only thosecompounds whose FD was as high as that of ethyl hexanoate, an ester known to be present in thesamples at concentrations close to its sensory threshold.
3-Methyl-2-buten-1-thiol (Log3FD = 7–10, a pleasant hoppy flavor here but also known as skunkyat a much higher level [22]), 2-methyl-3-furanthiol (Log3FD = 2–10, broth), furaneol (Log3FD = 4–7,cotton candy), and linalool (Log3FD = 2–7, flowery/coriander) emerged as the most potent odorants inall four beers. The persistent detection of 4-vinylguaiacol (Log3FD = 3–6) in all samples indicates thatPOF(+) strains had been used by the brewers.
As already mentioned above, even in bottle-refermented beers (C, E, and F), isoamyl acetate(Log3FD = 1–2, undetectable in E and F due to the strong previous odor) and ethyl hexanoate(Log3FD = 2–4) showed good stability through aging, with no significant changes in FD. On the otherhand, the red-fruit ethyl butyrate was produced during storage in the bottle-refermented beers (fromnot detected to Log3FD = 3 in beer E and from 4 to 6 in beer C).
Although trans-2-nonenal showed an increase in all four beers during aging, the highest FD jumpwas observed for the unrefermented A (from not detected to Log3FD = 6).
An interesting result was the strong increase, especially in aged beer F, of compounds suspectedto be released during storage through glucoside hydrolysis: citronellol, 4-vinylguaiacol, vanillin, andβ-damascenone [39,40]. In this case, the selected yeast clearly brought new flavors to F, explaining whysome consumers may prefer the six-month-aged beer. The efficiency of the yeast β-1,3-glucanase orβ-glucosidase should be taken into account to predict the amounts in which aglycons can be released
122
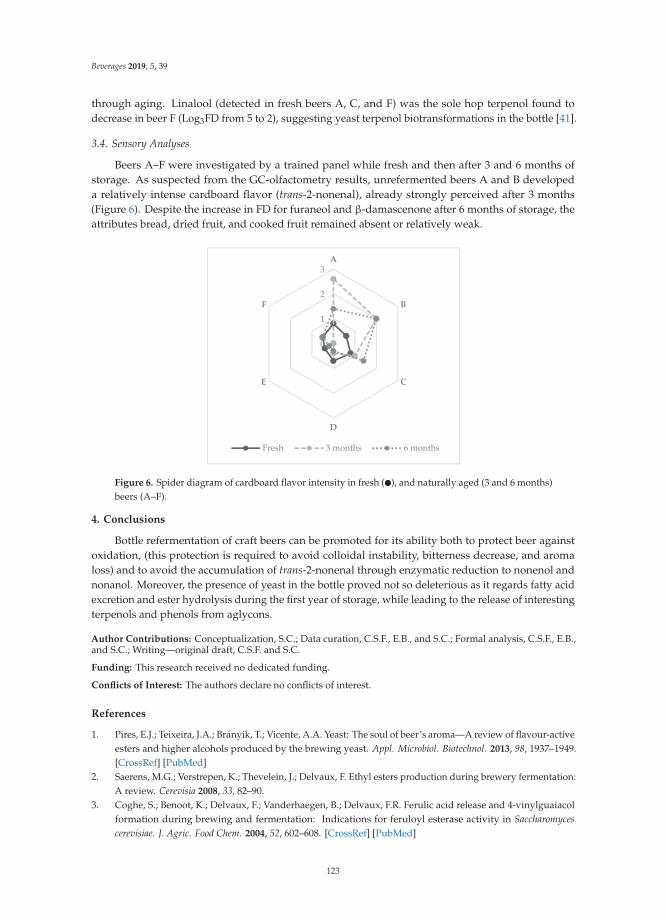
Beverages 2019, 5, 39
through aging. Linalool (detected in fresh beers A, C, and F) was the sole hop terpenol found todecrease in beer F (Log3FD from 5 to 2), suggesting yeast terpenol biotransformations in the bottle [41].
3.4. Sensory Analyses
Beers A–F were investigated by a trained panel while fresh and then after 3 and 6 months ofstorage. As suspected from the GC-olfactometry results, unrefermented beers A and B developeda relatively intense cardboard flavor (trans-2-nonenal), already strongly perceived after 3 months(Figure 6). Despite the increase in FD for furaneol and β-damascenone after 6 months of storage, theattributes bread, dried fruit, and cooked fruit remained absent or relatively weak.
0
1
2
3A
B
C
D
E
F
Fresh 3 months 6 months
Figure 6. Spider diagram of cardboard flavor intensity in fresh (�), and naturally aged (3 and 6 months)beers (A–F).
4. Conclusions
Bottle refermentation of craft beers can be promoted for its ability both to protect beer againstoxidation, (this protection is required to avoid colloidal instability, bitterness decrease, and aromaloss) and to avoid the accumulation of trans-2-nonenal through enzymatic reduction to nonenol andnonanol. Moreover, the presence of yeast in the bottle proved not so deleterious as it regards fatty acidexcretion and ester hydrolysis during the first year of storage, while leading to the release of interestingterpenols and phenols from aglycons.
Author Contributions: Conceptualization, S.C.; Data curation, C.S.F., E.B., and S.C.; Formal analysis, C.S.F., E.B.,and S.C.; Writing—original draft, C.S.F. and S.C.
Funding: This research received no dedicated funding.
Conflicts of Interest: The authors declare no conflicts of interest.
References
1. Pires, E.J.; Teixeira, J.A.; Brányik, T.; Vicente, A.A. Yeast: The soul of beer’s aroma—A review of flavour-activeesters and higher alcohols produced by the brewing yeast. Appl. Microbiol. Biotechnol. 2013, 98, 1937–1949.[CrossRef] [PubMed]
2. Saerens, M.G.; Verstrepen, K.; Thevelein, J.; Delvaux, F. Ethyl esters production during brewery fermentation:A review. Cerevisia 2008, 33, 82–90.
3. Coghe, S.; Benoot, K.; Delvaux, F.; Vanderhaegen, B.; Delvaux, F.R. Ferulic acid release and 4-vinylguaiacolformation during brewing and fermentation: Indications for feruloyl esterase activity in Saccharomycescerevisiae. J. Agric. Food Chem. 2004, 52, 602–608. [CrossRef] [PubMed]
123
Beverages 2019, 5, 39
4. Coghe, S.; Martens, E.; D’Hollander, H.; Dirinck, P.J.; Delvaux, F. Sensory and instrumental flavour analysisof wort brewed with dark specialty malts. J. Inst. Brew. 2004, 110, 94–103. [CrossRef]
5. Vandecan, S.M.G.; Daems, N.; Schouppe, N.; Saison, D.; Delvaux, F. Formation of flavor, color, and reducingpower during the production process of dark specialty malts. J. Am. Soc. Brew. Chem. 2011, 69, 150–157.[CrossRef]
6. Gros, J.; Peeters, F.; Collin, S. Occurrence of odorant polyfunctional thiols in beers hopped with differentcultivars. First evidence of an S-cysteine conjugate in hop (Humulus lupulus L.). J. Agric. Food Chem. 2012, 60,7805–7816. [CrossRef]
7. Kankolongo Cibaka, M.-L.; Ferreira, C.S.; Decourrière, L.; Lorenzo-Alonso, C.-J.; Bodart, E.; Collin, S. Dryhopping with the dual-purpose varieties Amarillo, Citra, Hallertau Blanc, Mosaic, and Sorachi Ace: minorcontribution of hop terpenol glucosides to beer flavors. J. Am. Soc. Brew. Chem. 2017, 75, 122–129.
8. Kankolongo Cibaka, M.-L.; Decourrière, L.; Lorenzo-Alonso, C.-J.; Bodart, E.; Robiette, R.; Collin, S.3-Sulfanyl-4-methylpentan-1-ol in dry-hopped beers: first evidence of glutathione S-Conjugates in hop(Humulus lupulus L.). J. Agric. Food Chem. 2016, 64, 8572–8582. [CrossRef]
9. Dalgliesh, C.E. Flavour stability. In Proceedings of the European Brewery Convention: Proceedings of the16th Congress, Amsterdam, The Netherlands, 1977; pp. 623–659.
10. Noël, S.; Liegeois, C.; Lermusieau, G.; Bodart, E.; Badot, C.; Collin, S. Release of deuterated nonenal duringbeer aging from labeled precursors synthesized in the boiling kettle. J. Agric. Food Chem. 1999, 47, 4323–4326.[CrossRef]
11. Lermusieau, G.; Noël, S.; Liegeois, C.; Collin, S. Nonoxidative mechanism for development of trans-2-nonenalin beer. J. Am. Soc. Brew. Chem. 1999, 57, 29–33. [CrossRef]
12. Zufall, C.; Racioppi, G.; Gasparri, M.; Franquiz, J. Flavour stability and ageing characteristics of light stablebeers. In Proceedings of the European Brewery Convention Congress, Prague, Czech Republic, 2–5 October2005; p. 30.
13. Silva Ferreira, C.; Thibault de Chanvalon, E.; Bodart, E.; Collin, S. Why humulinones are key bitter constituentsonly after dry hopping: comparison with other Belgian styles. J. Am. Soc. Brew. Chem. 2018, 76, 236–246.[CrossRef]
14. Clapperton, J.F. Ribes flavor in beer. J. Inst. Brew. 1976, 82, 175–176. [CrossRef]15. Thi Thu, H.T.; Nizet, S.; Gros, J.; Collin, S. Occurrence of the ribes odorant 3-sulfanyl-3-methylbutyl formate
in aged beers. Flavour Fragr. J. 2013, 28, 147–179.16. Scholtes, C.; Nizet, S.; Collin, S. How sotolon can impart a Madeira off-flavor to aged beers. J. Agric.
Food Chem. 2015, 63, 2886–2892. [CrossRef] [PubMed]17. Scholtes, C.; Nizet, S.; Collin, S. Guaiacol and 4-methylphenol as specific markers of torrefied malts. Fate
of volatile phenols in special beers through aging. J. Agric. Food Chem. 2014, 62, 9522–9528. [CrossRef][PubMed]
18. Thi Thu, H.T.; Kankolongo Cibaka, M.-L.; Collin, S. Polyfunctional thiols in fresh and aged Belgian specialbeers: fate of hop S-cysteine conjugates. J. Am. Soc. Brew. Chem. 2015, 73, 61–70.
19. Vanderhaegen, B.; Neven, H.; Daenen, L.; Verstrepen, K.J.; Verachtert, H.; Derdelinckx, G. Furfuryl ethylether: important aging flavor and a new marker for the storage conditions of beer. J. Agric. Food Chem. 2004,52, 1661–1668. [CrossRef]
20. Derdelinckx, G.; Vanderhasselt, B.; Maudoux, M.; Dufour, J.P. Refermentation in bottles and kegs: A rigorousapproach. Brauwelt Int. 1992, 2, 156–164.
21. Vanderhaegen, B.; Neven, H.; Coghe, S.; Verstrepen, K.J.; Verachtert, H.; Derdelinckx, G. Evolution ofchemical and sensory properties during aging of top-fermented beer. J. Agric. Food Chem. 2003, 51, 6782–6790.[CrossRef]
22. Nizet, S.; Gros, J.; Peeters, F.; Chaumont, S.; Robiette, R.; Collin, S. First evidence of the production of odorantpolyfunctional thiols by bottle refermentation. J. Am. Soc. Brew. Chem. 2013, 71, 15–22. [CrossRef]
23. Saison, D.; De Schutter, D.P.; Vanbeneden, N.; Daenen, L.; Delvaux, F.; Delvaux, F.R. Decrease of aged beeraroma by the reducing activity of brewing yeast. J. Agric. Food Chem. 2010, 58, 3107–3115. [CrossRef][PubMed]
24. Ernest, C.-H.; Chen, A.; Jamieson, A.M.; Van Gheluwe, G. The release of fatty acids as a consequence of yeastautolysis. J. Am. Soc. Brew. Chem. 1980, 38, 13–17.
124
Beverages 2019, 5, 39
25. Leroy, M.J.; Charpentier, M.; Duteurtre, B.; Feuillat, M.; Charpentier, C. Yeast autolysis during Champagneaging. Am. J. Enol. Vitic. 1990, 41, 21–28.
26. Masschelein, C.A. The biochemistry of maturation. J. Inst. Brew. 1986, 92, 213–219. [CrossRef]27. Ormrod, I.H.L.; Lalor, E.F.; Sharpe, F.R. The release of yeast proteolytic enzymes into beer. J. Inst. Brew. 1991,
97, 441–443. [CrossRef]28. Neven, H.; Delvaux, F.; Derdelinckx, G. Flavor evolution of top fermented beers. MBAA Tech. Q. 1997, 34,
115–118.29. Gassenmeier, K.; Schieberle, P. Potent aromatic compounds in the crumb of wheat bread (French-type)-
influence of pre-ferments and studies on the formation of key odorants during dough processing. Z. Lebensm.Unters. Forsch. 1995, 201, 241–248. [CrossRef]
30. Olsen, E. Brettanomyces: Occurrence, flavour effects and control. In Proceedings of the 23rd Annual NewYork Wine Industry Workshop, New York, NY, USA, 23–24 March 1994.
31. Fugelsang, K.C. Wine Microbiology; The Chapman & Hall Enology Library: New York, NY, USA, 1997.32. Alvarez., P.; Malcorps, P.; Sa Almeida, A.; Ferreira, A.; Meyer, A.M.; Dufour, J.P. Analysis of free fatty acids,
fusel alcohols, and esters in beer: an alternative to CS2 extraction. J. Am. Soc. Brew. Chem. 1994, 52, 127–134.[CrossRef]
33. Lermusieau, G.; Bulens, M.; Collin, S. Use of GC−Olfactometry to identify the hop aromatic compounds inbeer. J. Agric. Food Chem. 2001, 49, 3867–3874. [CrossRef]
34. Licker, J.L.; Acree, T.E.; Henick-Kling, T. What is “Brett” (Brettanomyces) flavour? A preliminary investigation.In Chemistry of Wine Flavour; ACS Symposium Series; American Chemical Society: Washington, DC, USA,1998; pp. 96–115.
35. Meilgaard, M. Flavor and threshold of beer volatiles. MBAA Tech. Q. 1974, 11, 87–89.36. Engan, S. Organoleptic threshold of some alcohols and esters in beer. J. Inst. Brew. 1971, 78, 33–36. [CrossRef]37. Saison, D.; De Schutter, D.P.; Uyttenhove, B.; Delvaux, F.; Delvaux, F.R. Contribution of staling sompounds to
the aged flavor of lager beer by studying their flavor thresholds. Food Chem. 2009, 114, 1206–1215. [CrossRef]38. Ullrich, F.; Grosch, W. Identification of the most intensive volatile flavour compounds formed during
autoxidation of linoleic acid. Z. Lebensm. Unters. Forsch. 1987, 184, 277–282. [CrossRef]39. Callemien, D.; Dasnoy, S.; Collin, S. Identification of a stale-beer-like odorant in extracts of naturally aged
beer. J. Agric. Food Chem. 2006, 54, 1409–1413. [CrossRef] [PubMed]40. Chevance, F.; Guyot, C.; Dupont, J.; Collin, S. Investigation of the β-damascenone in fresh and aged
commercial beers. J. Agric. Food Chem. 2002, 50, 3818–3821. [CrossRef] [PubMed]41. King, A.J.; Dickinson, J.R. Biotransformation of hop aroma terpenoids by ale and lager yeasts. FEMS Yeast Res.
2003, 3, 53–62. [CrossRef] [PubMed]
© 2019 by the authors. Licensee MDPI, Basel, Switzerland. This article is an open accessarticle distributed under the terms and conditions of the Creative Commons Attribution(CC BY) license (http://creativecommons.org/licenses/by/4.0/).
125

MDPISt. Alban-Anlage 66
4052 BaselSwitzerland
Tel. +41 61 683 77 34Fax +41 61 302 89 18
www.mdpi.com
Beverages Editorial OfficeE-mail: [email protected]
www.mdpi.com/journal/beverages


MDPI St. Alban-Anlage 66 4052 Basel Switzerland
Tel: +41 61 683 77 34 Fax: +41 61 302 89 18
www.mdpi.com ISBN 978-3-03921-490-7