Analysis of the Partial Molar Excess Entropy of Dilute ...
24
Analysis of the partial molar excess entropy of dilute hydrogen in liquid metals and its change at the solid-liquid transition The MIT Faculty has made this article openly available. Please share how this access benefits you. Your story matters. Citation Caldwell, Andrew H. and Antoine Allanore. "Analysis of the partial molar excess entropy of dilute hydrogen in liquid metals and its change at the solid-liquid transition." Acta Materialia 173 (July 2019): 1-8. As Published http://dx.doi.org/10.1016/j.actamat.2019.02.016 Publisher Elsevier BV Version Original manuscript Citable link https://hdl.handle.net/1721.1/131149 Terms of Use Creative Commons Attribution-NonCommercial-NoDerivs License Detailed Terms http://creativecommons.org/licenses/by-nc-nd/4.0/
-
Upload
khangminh22 -
Category
Documents
-
view
2 -
download
0
Transcript of Analysis of the Partial Molar Excess Entropy of Dilute ...

Analysis of the partial molar excess entropy of dilute hydrogenin liquid metals and its change at the solid-liquid transition
The MIT Faculty has made this article openly available. Please share how this access benefits you. Your story matters.
Citation Caldwell, Andrew H. and Antoine Allanore. "Analysis of the partialmolar excess entropy of dilute hydrogen in liquid metals and itschange at the solid-liquid transition." Acta Materialia 173 (July2019): 1-8.
As Published http://dx.doi.org/10.1016/j.actamat.2019.02.016
Publisher Elsevier BV
Version Original manuscript
Citable link https://hdl.handle.net/1721.1/131149
Terms of Use Creative Commons Attribution-NonCommercial-NoDerivs License
Detailed Terms http://creativecommons.org/licenses/by-nc-nd/4.0/

Analysis of the Partial Molar Excess Entropy of DiluteHydrogen in Liquid Metals and Its Change at the
Solid-Liquid Transition
Andrew H. Caldwella, Antoine Allanorea,∗
aDepartment of Materials Science and Engineering, Massachusetts Institute of Technology,77 Massachusetts Avenue, Cambridge, MA, 02139
Abstract
A systematic change in the partial molar enthalpy of mixing (∆hmixH ) and partial
molar excess entropy (∆sexH ) for dilute hydrogen-metal systems at the solid-
liquid transition is reported. Expressions for ∆hmixH and ∆sexH are derived from
the Fowler model of hydrogen solubility, and the change in ∆sexH at melting
is bounded. The theoretical bound is in agreement with measured data. A
connection is made between the change in ∆sexH and short range order in the
metal-hydrogen system.
Keywords: Liquids, Hydrogen, Solubility, Statistical mechanics,
Thermodynamics
1. Introduction1
Metals processing invariably requires the handling of metals in the liquid2
state. Such operations rarely occur in inert atmospheres. The mole fraction3
of dissolved gases, in particular hydrogen (H), are typically in the range of4
10−6 to 10−2 for liquid metals, and therefore degassing procedures are routinely5
employed in process metallurgy. This is done to prevent degradation of the6
mechanical properties of the solidified product, and such effects are well-studied7
[1, 2]. The severity of these effects depends on the concentration of H in the8
metal M, which can be determined from the solution thermodynamics of the M-9
H system. Calculating and predicting H solubility, defined here as its equilibrium10
∗Corresponding authorEmail address: [email protected] (Antoine Allanore)
Preprint submitted to Elsevier January 25, 2019

concentration in the metal, is therefore of considerable importance for metals11
processing.12
Prior reports have compiled existing data on the solubility of H in liquid13
metals, along with dissolved oxygen, sulfur, and nitrogen [3, 4, 5]. These data14
reveal a correlation between the two key quantities describing the mixing ther-15
modynamics: the partial molar excess entropy (∆sexX ) and the partial molar16
enthalpy of mixing (∆hmixX ). ∆hmix
X is defined as17
∆hmixX = hX − 1
2h0X2
(1)
where hX is the partial molar enthalpy, and 12h
0X2
is the standard state enthalpy18
of X2(g). ∆sexX is the defined as19
∆sexX = sX − 12s
0X2− sidX (2)
where sX is the partial molar entropy, s0X2is the standard state entropy of X2(g),20
and sidX is the ideal partial molar entropy of mixing. The correlation between the21
partial molar excess entropy (∆sexX ) and the partial molar enthalpy of mixing22
(∆hmixX ) for the liquid state can be rationalized from the chemical reactivity of23
the metal-gas system, by considering the relative strength of the solute-metal24
chemical bonding.25
In the present work, specific attention is drawn to the solution behavior26
of H in solid and liquid metals near Tfus and its statistical thermodynamic27
description. Statistical thermodynamic treatments of H dissolved in a metal are28
reported by a number of investigators[6, 7, 8, 9, 10, 11, 12, 13, 14, 15, 16, 17].29
These studies derive ∆hmixH and ∆sexH from the principles of statistical mechanics.30
Together, these quantities define the activity coefficient (γH) as a function of31
temperature and consequently the hydrogen concentration that is at equilibrium32
with a given partial pressure of H2 gas:33
xH =p
12
H2
γH= p
12
H2exp
[−∆hmix
H
RT+
∆sexHR
]. (3)
Eq. 3 is one form of what is referred to as Sieverts’ law [18], which states that34
the concentration of a gas solute X in a metal is proportional to the square-root35
of the partial pressure of X2 above the metal. Sieverts’ law is valid in the dilute36
2

limit and is generally observed for many M-H systems for PH2≤ 1 atm, in both37
the solid and liquid state. In Eq. 3, the proportionality constant is γH. In this38
analysis, γH, and by extension ∆hmixH and ∆sexH , are defined according to the39
following criteria:40
1. The concentration coordinate for the system of a gas solute H in liquid41
metal M is the mole fraction, defined as xH ≡ nH/(nM + nH).42
2. The standard state for the dissolved gas H is the pure diatomic gas 12H243
at 1 atm pressure.44
3. The solution thermodynamics are treated in the limit of infinite dilution.45
These criteria yield the definition shown in Eq. 3. The analysis presented46
herein restricts itself to the concentration and temperature regimes in which47
Eq. 3 is true1. Thus, this analysis focuses on the dilute solution behavior of H48
in liquid metals, as this is the concentration regime most frequently encountered49
in metallurgical processes. “Dilute” here refers to concentrations for which H50
solute self-interaction is a negligible contribution to the H activity coefficient.51
In this paper, we propose to compare H solubility data in liquid and solid52
metals near Tfus. Specifically, we report on a systematic shift in ∆hmixH and53
∆sexH at melting for a number of M-H systems. While not universal, the shift54
is sufficiently compelling as to suggest a common mechanism for the change55
in solution behavior that may be used to quantitatively predict the solution56
properties of H in liquid metals from solid-state data. A connection is made57
between the change in ∆sexH at melting and short range order in the liquid58
through a derivation of ∆hmixH and ∆sexH from the proton gas model of Fowler59
and Smithells [6].60
1At approximately 2500 K (2227 C) the equilibrium partial pressure of monatomic hy-
drogen gas H(g) is on the order of a few percent and is therefore non-negligible. Above this
temperature, H dissolution is no longer completely described by Eq. 3. Since the melting
temperatures of the majority of elemental metals are less than 2500 K, Eq. 3 suffices for our
discussion of the solution thermodynamics presented herein. Note, then, that for refractory
metals (e.g., W, Mo) in the vicinity of Tfus there will necessarily be some error in the use of
Eq. 3. For a perspective on H(g) dissolution, see Gedeon and Eagar [19].
3

2. Change in ∆hmixH and ∆sexH at the Solid-Liquid Transition61
∆hmixH and ∆sexH are the change in the partial molar enthalpy of mixing62
and partial molar excess entropy, respectively. A partial molar property is the63
change in the integral property per addition of one atom of, for example, H to64
a liquid M-H solution. At the equilibrium solid-liquid transition we define the65
quantities ∆∆hmixH and ∆∆sexH :66
∆∆hmixH = ∆hmix
H,liq −∆hmixH,sol (4)
∆∆sexH = ∆sexH,liq −∆sexH,sol (5)
The values of ∆hmixH and ∆sexH for M-H systems for which solid- and liquid-67
state data exist are listed in Table 1. For each M-H system in Table 1 a quantity68
Tsol/Tliq is defined to be the ratio of the maximum temperature for which the69
values ∆hmixH,sol and ∆sexH,sol are valid to the minimum valid temperature for70
∆hmixH,liq and ∆sexH,liq. For most of the M-H systems, Tsol/Tliq is close to unity, in-71
dicating that ∆∆hmixH and ∆∆sexH solely reflect changes in the solution behavior72
of dissolved H due to melting. It is important to recognize that, as a result of73
the weak temperature dependence of both ∆hmixH and ∆sexH [20], the tempera-74
ture range over which reported values of these properties quantitatively describe75
the solution behavior is usually several hundreds of degrees Celsius. Thus, it is76
reasonable to treat ∆∆hmixH and ∆∆sexH as capturing the change in ∆hmix
H and77
∆sexH across the solid-liquid transition for systems with Tsol/Tliq close to unity.78
For systems with Tsol/Tliq far from unity, there is greater uncertainty with this79
assumption.80
Table 1: Values of ∆hmixH and ∆sexH for H in elemental metals
∆hmixH ∆sexH
System kJ (mol H)−1 J K−1 (mol H)−1 Tsol/Tliq References
Ag(l) 76.3 −29.5 [21]
Ag(s) 62.1 −48.5 0.98 [21]
Ag(2)
(s) 68.9 −42.5 1.0 [22], see also: [4]
Continued on next page
4

∆hmixH ∆sexH
System kJ (mol H)−1 J K−1 (mol H)−1 Tsol/Tliq References
Al(l) 51.5 −36.2 [23]
Al(s) 58.2 −56.7 1.0 [23]
Al(2)
(s) 56.8 −54.0 1.0 [24]
Co(l) 41.0 −33.9 [4], see also: [25]
Co(s) 32.2 −45.7 1.0 [4]
Cu(l) 43.5 −35.3 [26], [25]
Cu(s) 34.5 −46.2 0.94 [26]
Cu(2)
(s) 49.0 −41.0 1.0 [22]
Fe(l) 36.4 −35.3 [25]
Feα 22.2 −53.6 0.65 [26], see also: [27]
Fe(2)α 24.3 −53.6 0.65 [22], see also: [27]
Feγ 27.0 −46.7 0.92 [26], see also: [27]
Fe(2)γ 29.9 −45.6 0.92 [22], see also: [27]
Feδ 28.8 −46.4 1.0 [22], see also: [27]
Mg(l) 29.6 −26.2 [28]
Mg(s) 19.3 −40.4 0.70 [28]
Mn(l) 24.9 −32.4 [29]
Mnα 11.3 −46.9 0.65 [30]
Mnδ 13.4 −42.5 1.0 [30]
Nb(l) −31.0 −47.3 [4]
Nb(s) −36.1 −49.6 0.18 [31]
Nb(2)
(s) −39.6 −65.3 0.18 [22]
Nb(3)
(s) −35.3 −58.0 0.37 [32]
Ni(l) 20.0 −39.7 [25]
Ni(s) 16.6 −48.7 0.88 [33]
Pd(l) −16.4 −48.2 [34]
Pd(s) −14.1 −53.8 0.99 [34]
Pd(2)
(s) −10.3 −51.3 0.19 [22]
Ti(l) −41.1 −44.5 [35]
Ti(s) −40.2 −43.3 0.38 [36]
Ti(2)
(s) −59.8 −49.9 0.71 [20]
Continued on next page
5

∆hmixH ∆sexH
System kJ (mol H)−1 J K−1 (mol H)−1 Tsol/Tliq References
U(l) 11.2 −33.7 [4]
U(s) 43.4 −42.9 1.0 [4]
The data in Table 1 are plotted in Fig. 1 where ∆∆hmixH R−1 is the ordinate81
and ∆∆sexH R−1 is the abscissa (R is the gas constant). The data point labels82
indicate the solid phase of the metal considered in the calculation of ∆∆hmixH83
and ∆∆sexH . For example, “Feα” refers to the alpha phase of Fe. The superscript84
numbers distinguish multiple values of ∆hmixH and ∆sexH reported for the solid85
phase. A single set of values is used for the liquid phase data for each M-H86
system.87
0
1
2
3
ΔΔsHex·R
-1
-2 -1 0 1 2 3
ΔΔhH
mix·R
-1/ 10
3K
Figure 1: Partial molar excess entropy (∆∆sexH , see Eq. 5) variation at melt-
ing versus the corresponding variation in the partial molar enthalpy of mixing
(∆∆hmixH , see Eq. 4) for M-H systems. Point labels denote the solid phase consid-
ered in the calculation of ∆∆hmixH and ∆∆sexH . The shaded regions are contours,
at different temperatures, of the surface defined by 1 ≤ rH ≡ (xH,liq/xH,sol) ≤ 3
(see Eq. 6).
6

Together, ∆∆hmixH and ∆∆sexH reflect changes in the equilibrium mole frac-88
tion of dissolved H. From Eqs. 3, 4, and 5, and for a constant pH2, we define the89
liquid-to-solid H solubility ratio, rH, as90
rH =xH,liq
xH,sol= exp
[−∆∆hmix
H
RTfus+
∆∆sexHR
]. (6)
A plot of ∆∆sexH versus ∆∆hmixH therefore defines a surface of the change in91
equilibrium H solubility for a given temperature. In Fig. 1 the shaded regions92
are contours of this surface. Each contour defines the inequality 1 ≤ rH ≤ 3 at93
a specific value of Tfus. Five contours are shown, from 1000 K (727 C) to 300094
K (2727 C) in steps of 500 K. This range of temperatures bounds Tfus for the95
majority of metals.96
Most of the data in Fig. 1 lie within the contours of the 1-to-3 times increase97
in solubility over the Tfus range of 1000–3000 K. This observation reflects the98
consensus in metallurgy that H solubility increases slightly upon melting [5].99
Furthermore, it is clear that the distribution of ∆∆hmixH and ∆∆sexH is non-100
random. Values of ∆∆hmixH and ∆∆sexH are within 0–2000R (J mol−1 H) and101
0–2R (J K−1 mol−1 H), respectively. There is a clustering of the data at ap-102
proximately 1000R for ∆∆hmixH and 1.3R for ∆∆sexH . The fact that chemically-103
dissimilar metals, such as Fe, Ag, U, and Nb, exhibit similar values of ∆∆hmixH104
and ∆∆sexH , in the vicinity of 1000R and 1.3R, respectively, suggests that a com-105
mon mechanism is responsible for the change in solution behavior of H across106
melting. We later adopt ∆∆hmixH = 1000R and ∆∆sexH = 1.3R as characteristic107
values.108
The characteristic values of ∆∆hmixH and ∆∆sexH may not be universally109
applicable. As Fig. 1 illustrates, outliers such as the Al-H system exist. In addi-110
tion, uncertainties in the values of reported partial molar mixing quantities, like111
∆hmixH and ∆sexH , tend to be large [37], and so drawing more precise correlations112
from the ∆∆hmixH and ∆∆sexH data should be done with some caution. In the113
absence of reported experimental uncertainties for ∆hmixH and ∆sexH , recourse114
should be made to reported uncertainties for other liquid metal-gas systems115
(e.g., M-O) and to liquid metal alloys in general to guide our understanding116
of the degree of scatter in the data shown in Fig. 1. Partial molar excess en-117
tropies and enthalpies of mixing are known to within about 1 J mol−1 K−1 and118
7

1 kJ mol−1, respectively [3, 38]. An approximate uncertainty for the data points119
in Fig. 1 may then be represented by error bars of ±0.2. This uncertainty does120
not change the systematic trend illustrated in Fig. 1.121
Nevertheless, a characteristic change in ∆hmixH and ∆sexH across melting may122
not be entirely surprising. Among the gas solutes frequently encountered in123
metallurgy—H, O, S, and N—hydrogen is the least reactive, with the smallest124
electronegativity difference. Dissolved H, particularly at high temperatures in125
the dilute regime (where the number of available H sites is much greater than the126
number of H atoms), is therefore more “gas-like” than, for example, dissolved127
O. It may be surmised, then, that changes in the quantities that define the128
interaction between M and H, i.e., ∆hmixH and ∆sexH , due to melting are the result129
of structural changes in the metal itself, more so than the result of changes in130
the specific chemical interaction. “Structural” here entails properties such as131
coordination number, molar volume, and ordering. Since the structural changes132
that occur during melting of most crystalline metals are often considered similar133
(see, for example, similarities in the entropies of fusion [39]), it can be argued134
that ∆∆hmixH and ∆∆sexH should be similar as well for different M-H systems.135
3. Derivation of ∆∆hmixH and ∆∆sexH from a Statistical Model of H136
Solubility137
In the previous section it was found that the change in ∆hmixH and ∆sexH at the138
solid-liquid transition is around 1000R and 1.3R, respectively, for most of the139
M-H systems in Table 1, constituting a characteristic shift in the equilibrium140
H concentration. A rationalization for the magnitude of these quantities is141
provided in the following using the statistical mechanical model of H solubility142
proposed by Fowler and Smithells [6]. This is the “proton gas” model, in which143
the metal, either solid or liquid, is treated as a potential field through which H144
atoms move.145
The grand canonical partition function (Γ) of dissolved H in a metal M of146
volume V may be written as :147
Γ = exp(lHλHωe
−χs/kT). (7)
8

The derivation of this form of Γ is given in Appendix A. lH (Eq. 8) is the148
molecular translational partition function, λH is the absolute activity of H, ω is149
the H nuclear spin statistical weight, and χs is the ground state energy of H in150
the metal, referenced to the state of infinite separation outside the metal.151
lH =
(2πmHkT
h2
)3/2
VH (8)
In Eq. 8, VH (Eq. 9) may be thought of as the effective volume in the metal over152
which H atoms behave “gas-like”. It is the classical configuration integral.2 VH153
is critical for connecting ∆∆sexH to short range ordering.154
VH =
∫V
e−W/kT dV (9)
In Eq. 9, W is the configurational potential energy of the H assembly referenced155
to the lowest energy state of H in the metal and is a function of the positional156
coordinates of the H atoms.157
The equilibrium number of dissolved H, NH, is158
NH = kT
(∂ ln Γ
∂µH
)= lHλHωe
−χs/kT (10)
The derivation of ∆sexH follows from the definition of the partial molar en-159
tropy as the temperature-derivative of the chemical potential. It is convenient160
to first convert the number of H atoms into the atomic ratio3 of H atoms and161
M atoms, as shown in Eq. 11.162
NH
NM=lHVλHω
MM
ρMNAe−χs/kT (11)
The chemical potential of dissolved H may then be written as:163
µH = kT lnλH = kT ln
(NH
NMθ(T )
)(12)
2The quantity VNHH /NH! is sometimes referred to as the configurational potential energy
partition function [40].3In the limit of infinite dilution, the atomic ratio is equivalent to the atomic fraction, and
so this conversion introduces no error with regards to the experimental data, which is defined
with respect to atomic fraction.
9

where θ(T ) =(lHV ω
MM
ρMNAe−χs/kT
)−1. Taking the derivative of µH with respect164
to temperature at constant P and NH, the total partial molar entropy is:165
sH = −k ln
(NH
NM
)− k
(T∂ ln θ(T )
∂T+ ln θ(T )
). (13)
The ideal configurational component is −k ln (NH/NM). Substituting for θ(T ),166
one finds for the excess component:167
sexHk
=3
2+
1
kT
∂ lnVH∂T
+3
2ln
(2πmHkT
h2
)+ln
(VHV
)+lnω+ln
(MM
ρMNA
)(14)
As discussed in the Introduction, the chosen standard state of dissolved H is168
the 12H2 gas standard state. The “relative” partial molar excess entropy, ∆sexH ,169
is then sexH − 12s
0H2
. Upon subtracting the entropy of H gas (see Appendix B),170
one finds:171
∆sexHk
=1
4
(ln
(m3
H
16πA2kh2T
)− 1
)+ln
(MM
ρMNA
)+
1
2lnP+ln
(VHV
)+
1
kT
∂ lnVH∂T
(15)
The relative partial molar enthalpy, ∆hmixH , can be derived following the172
same steps taken for Eqs. 13–15, where instead the Gibbs-Helmholtz relation173
defines the enthalpy from the chemical potential. For concision, we omit these174
steps and present the expression for ∆hmixH in Eq. 16.175
∆hmixH
kT=χs + 1
2χd
kT− 1
4+
1
kT
∂ lnVH∂T
(16)
It is important to note here that the terms in the expressions for ∆hmixH /kT176
(Eq. 15) and ∆sexH /k (Eq. 16) that are of the same order in T cannot be dis-177
tinguished as “enthalpic” or “entropic” if, experimentally, ∆hmixH and ∆sexH are178
calculated from an Arrhenius fitting of temperature-composition data. Conse-179
quently, it is prudent to define “effective” values of ∆hmixH and ∆sexH that are the180
result of allowing like-terms in the quantities ∆hmixH /kT and ∆sexH /k to com-181
bine. The effective values of ∆hmixH and ∆sexH may then be identified directly182
from Eq. 3. In doing so, a valid comparison can be made between the theoretical183
and measured values of ∆hmixH and ∆sexH . Eqs. 17 and 18 define the effective184
values of ∆hmixH and ∆sexH , respectively, in the proton gas model. For clarity, we185
will continue to refer to these quantities as ∆hmixH and ∆sexH .186
10

∆hmixH
kT=χs + 1
2χd
kT(17)
∆sexHk
=1
4ln
(m3
H
16πA2kh2T
)+ ln
(MM
ρMNA
)+
1
2lnP + ln
(VHV
)(18)
At this point, it is valuable to compare these results with experimental data.187
Fig. 2 is a plot of reported values of ∆sexX /R versus 1/T for M-X systems,188
where X is H, O, S, or N. The data point labels indicate the elemental liquid189
metal, M. The temperature coordinate of each data point is the lower bound190
of the temperature range for which the measured solution property, here ∆sexX ,191
is valid. For most of the M-X systems shown in Fig. 2 this temperature is in192
the vicinity of Tfus, though obvious exceptions exist (e.g., Al-O). Of primary193
interest here is the shaded band, which is the theoretical ∆sexH (Eq. 18) for194
values of VH/V between 0.1 (lower curve) and 1.0 (upper curve). The density195
(ρM) and molar mass (MM) are 104 kg m−3 and 0.1 kg mol−1, respectively,196
chosen as representative values for the elemental liquid metals.197
The measured values of ∆sexH are well-described by the results of the proton198
gas model within the bounds of 0.1 ≤ VH/V ≤ 1.0. This corroborates a simi-199
lar observation by Fowler and Guggenheim for solid transition metal-hydrogen200
systems in the dilute limit [40]. Given that the majority of the M-H systems201
in Fig. 2 fall within 0.1 ≤ VH/V ≤ 1.0, one may argue that values of ∆sexH202
well outside this range are suspect. The status of Au-H and Cr-H as outliers is203
therefore likely due to experimental uncertainty.204
A comparison may also be made with the entropy of the gas phase. The205
solid curves in Fig. 2 show 12s
0X2
as a function of temperature. If ∆sexH is taken206
to be its average value near −4.5R, the difference between ∆sexH and 12s
0X2
is207
about 5R to 8R. This represents the excess entropy arising from solute-solvent208
interaction.209
4. Discussion210
4.1. ∆sexH and Short Range Order211
The quantity VH (Eq. 9) in the proton gas model can be treated as a fitting212
parameter for interpreting experimentally measured values of ∆sexH . However,213
11

LiLa
SmFe
GaGe
In
Sb
V
Zr Au
Co
CuFe
In
Ni
Sb
Co
CuFe Mn
Ni
Nb
-8
-7
-6
-5
-4
-3
0.2 0.4 0.6 0.8 1.0
H
O
S
N
VH/V = 1.0
H
-12S H 20
-12S O
20
-12S S
20
-12S N 20
Be
Cr
Si
Au
ZnSn
Ga
AlSi
Ti
Ca
Cs
Na
Li
K
Te
Sn
PbBi Cd
Au
UMn
In
Hg
SnPb
Zn
Zr
V
TiCa
Li
Si
Na
Mo
-20
-15
-10
-5
0
5
10
sxex·R
-1
0.0 0.5 1.0 1.5 2.0 2.5 3.0
T-1
/ 103 K-1
Figure 2: Partial molar entropy of mixing (∆sexX ) as a function of 1/T for
X: H ( ), O ( ), S ( ), N ( ) in liquid metals. The shaded band is the theoretical
∆sexH (Eq. 18) derived from the proton gas model [6] for values of VH/V between
0.1 (lower curve) and 1.0 (upper curve). The majority of the data for the M-H
systems lie within this range of theoretical entropy values. The solid curves are
12s
0X2
, the standard state entropy of dissolved X, as functions of temperature.
The inset plot shows the boxed and shaded region in the full figure.
VH, the classical configuration integral, has a definite physical meaning that can214
be understood within the context of short range order in the M-H system. An215
immediate consequence of this view is that the shift in ∆sexH across the solid-216
liquid transition is the result of the local structural changes that occur during217
melting. This is the same conclusion proposed in Section 2 from a heuristic218
12

argument about chemical interaction energies, which can now be more rigorously219
treated using the proton gas model.220
The connection to short range order may be made recalling first that W is221
the potential energy of the H assembly above its ground state energy in the222
metal. W is a function of the spatial coordinates of the H atoms. In the limit223
that W → 0 everywhere in the metal, VH = V . As W increases, VH < V , and the224
effective volume in which H is well-described as a proton gas decreases. Stated225
differently, the tendency for M-H compound formation increases. VH, then, is226
a quantity that reflects the strength of the association between H and metal227
atoms. Second, the interpretation of VH as a measure of short range ordering228
requires a formal connection to the local M-H interactions. As of yet in this229
analysis, no description of the distribution of VH over the volume of the metal230
has been provided. Fowler [6] makes the connection between the proton gas231
occupying an effective volume VH and the short-range interaction between M232
and H by showing that, in the limit of small H solubility (NH αNM, where α233
is the number of H coordination sites per metal atom), it is valid to describe each234
H atom as being bound to a potential field of volume v′H = VH/(αNM), where α235
is the number of H coordination sites per metal atom. Thus, one may interpret236
VH as being uniformly distributed over αNM interstitial (or quasi-interstitial)237
sites, each with a volume v′H, associated with the metal atoms. The connection238
with short range order is now immediately clear. As W increases, reflecting239
a greater propensity for M-H compound formation, the effective volume v′H in240
which each H atom freely translates decreases.4 A localization of the H atoms241
with respect to the metal atoms is found and hence an increase in the short range242
order of the M-H system. The loss of entropy corresponding to an increase in243
W is appropriately reflected in Eq. 18, where, as VH decreases, ∆sexH decreases.244
From Eqs. 5 and 18, the change in ∆sexH across the solid-liquid transition,245
∆∆sexH , may be written as:246
4The H partition function in the proton gas model is classical. By treating H as a particle in
an infinite potential well, one can show that for v′H less than approximately 10−3 nm3, recourse
must be made to quantum statistical mechanics, as the difference between the energy states
of H is no longer much less than kT .
13
∆∆sexH = R ln
(VH,liq
VH,sol
)(19)
where the entropy is per mole of H rather than per atom. The value of VH,sol247
for most metals for temperatures on the order of 103 K varies from about 0.1 to248
1.0 and is typically less than 0.5 for transition metals [40]. The magnitude of249
∆∆sexH is then bounded by making use of the following arguments: VH ≤ V and250
VH,liq/VH,sol > 1, the latter inequality being a consequence of the expectation251
that the liquid is a more disordered state than the solid (Wliq < Wsol). This252
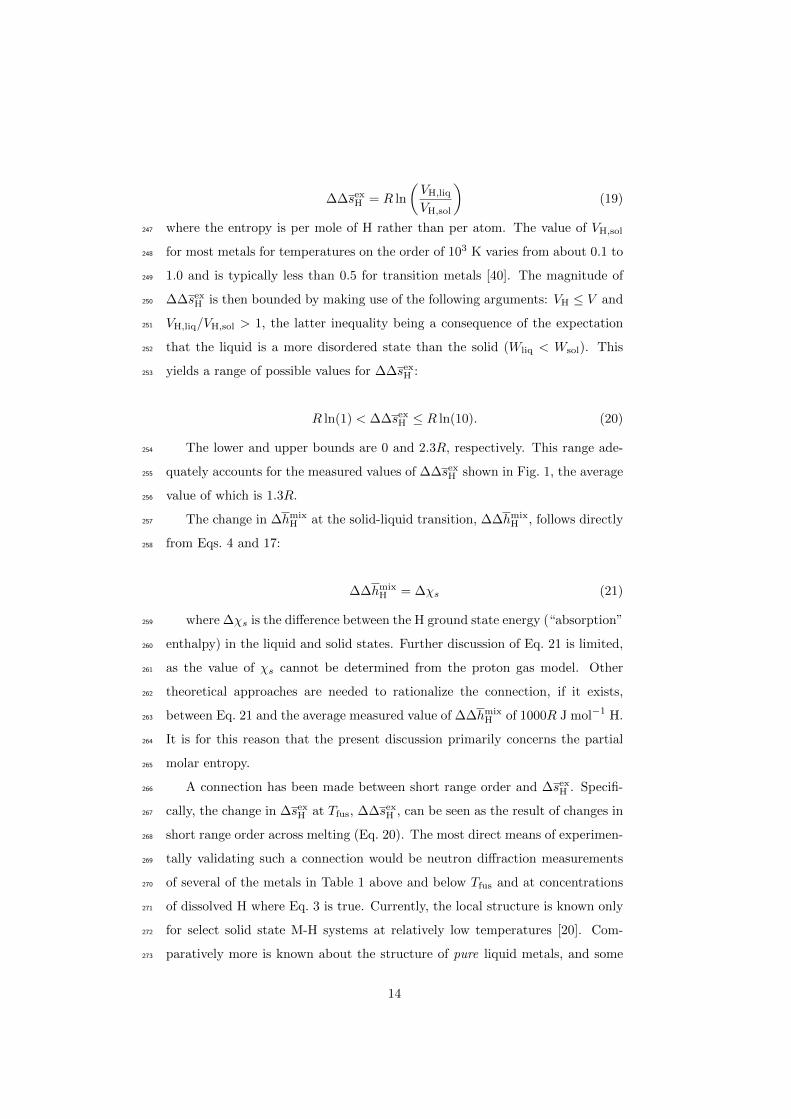
yields a range of possible values for ∆∆sexH :253
R ln(1) < ∆∆sexH ≤ R ln(10). (20)
The lower and upper bounds are 0 and 2.3R, respectively. This range ade-254
quately accounts for the measured values of ∆∆sexH shown in Fig. 1, the average255
value of which is 1.3R.256
The change in ∆hmixH at the solid-liquid transition, ∆∆hmix
H , follows directly257
from Eqs. 4 and 17:258
∆∆hmixH = ∆χs (21)
where ∆χs is the difference between the H ground state energy (“absorption”259
enthalpy) in the liquid and solid states. Further discussion of Eq. 21 is limited,260
as the value of χs cannot be determined from the proton gas model. Other261
theoretical approaches are needed to rationalize the connection, if it exists,262
between Eq. 21 and the average measured value of ∆∆hmixH of 1000R J mol−1 H.263
It is for this reason that the present discussion primarily concerns the partial264
molar entropy.265
A connection has been made between short range order and ∆sexH . Specifi-266
cally, the change in ∆sexH at Tfus, ∆∆sexH , can be seen as the result of changes in267
short range order across melting (Eq. 20). The most direct means of experimen-268
tally validating such a connection would be neutron diffraction measurements269
of several of the metals in Table 1 above and below Tfus and at concentrations270
of dissolved H where Eq. 3 is true. Currently, the local structure is known only271
for select solid state M-H systems at relatively low temperatures [20]. Com-272
paratively more is known about the structure of pure liquid metals, and some273
14

insight may be found by examining the changes in short range order that oc-274
cur at the solid-liquid transition of the metal solvent. First, it is well-known275
that the molar volume increases between 2–5 % for most metals upon melting276
[39, 41]. In addition, small changes in coordination number have been inferred277
from X-ray and neutron diffraction measurements of a number of solid and278
liquid metals [42]. The change in coordination number at melting is crystal-279
dependent: approximately −1 for close-packed metals and +2 to +3 for BCC280
metals. Lastly, one may infer information about the short range order in metals281
from band structure-dependent electronic properties [43]. Both nuclear mag-282
netic resonance measurements [44] and photoelectron spectroscopy [45] suggest283
measurable, but small, differences in short range order between the solid and284
liquid, which largely corroborate the diffraction studies. From the above points,285
it is clear some change in short range order of the metal does occur at melting,286
though the change is not large. The increase in molar volume and changes in287
the M-M coordination number leave open the possibility of an increase in the288
number of H sites at melting, which would yield the relation ∆∆sexH > 0 implied289
in Eq. 20. It must be stressed that the relevant ordering in this analysis is that290
between the metal and dissolved H. Information about M-M short range or-291
der, such as coordination number and nearest-neighbor distance, is, on its own,292
insufficient to corroborate Eq. 20.293
5. Conclusion294
A systematic change in ∆hmixH and ∆sexH of approximately 1000R and 1.3R,295
respectively, occurs at the solid-liquid transition for a number of M-H systems296
in the dilute limit. To rationalize these changes from first-principles, expres-297
sions for ∆hmixH and ∆sexH were derived from the proton gas model of Fowler298
and Smithells [6]. Good agreement was observed between the theoretical and299
experimental values of ∆sexH for values of the classical configuration integral300
(VH) between 0.1 and 1.0. The change in ∆sexH at melting, ∆∆sexH , is directly301
related to the change in VH, from which the following bounds were derived:302
R ln(1) < ∆∆sexH ≤ R ln(10). This range of 0–2.3R reflects the range of mea-303
sured values for ∆∆sexH , the average being 1.3R. It was proposed that VH is304
a quantity which reflects short range order in the M-H system. Consequently,305
15

the measured values of ∆∆sexH correspond to a decrease in short range order306
at melting. Qualitatively, the notion that H short range order decreases in the307
liquid state is supported by investigations of structural changes in pure liquid308
metals. The statistical mechanical description of H dissolved in liquid metals309
remains a frontier for thermodynamicists. Considering the importance of H con-310
trol in process metallurgy, further studies of this topic are of significant practical311
interest.312
6. Acknowledgments313
This work was supported by the National Science Foundation (NSF) under314
grant number 1562545.315
Appendix A. The Grand Canonical Partition Function316
The general form of the grand canonical partition function of the proton gas317
model of H solubility is:318
Γ =∑NH
Q (NH, V, T ) eNHµH/kT e−NHχs/kT . (A.1)
Upon expanding terms, Γ may be written as:319
Γ =∑NH
[ΩH(T )× φH(T )NH
]eNHµH/kT e−NHχs/kT
=∑NH
[(1
NH!
∫· · ·∫e−W/kT
NH∏i=1
(dxdydz)i
)×(
2πmHkT
h2
)3NH/2
ωNH
]eNHµH/kT e−NHχs/kT
=∑NH
1
NH!
[∫V
e−W/kT dV ×(
2πmHkT
h2
)3/2
ωλH(T )
]NH
e−NHχs/kT
= exp(lHλHωe
−χs/kT).
(A.2)
ΩH(T ) is the configurational potential energy partition function. φH(T ) is the320
molecular partition function of the dissolved H without the volumetric factor.321
µH is the chemical potential of H.322
16

Appendix B. Entropy and Enthalpy of Hydrogen Gas323
The absolute activity of atomic hydrogen gas is [40]:324
λg =
(P
kT
) 12
e−χdkT
[(4πmHkT
h2
) 32 8π2AkTω2
2h2
]− 12
. (B.1)
The same approach for deriving the total partial molar entropy entropy of dis-325
solved H may be applied here to determine the molar entropy of H gas, sg.326
sg = −(∂µg∂T
)P
= − ∂
∂TkT lnλg
∣∣∣∣P
= k
(7
4− 1
2ln
(P
k
)+
7
4lnT +
3
4ln
(4πmHk
h2
)+
1
2ln
(8π2Ak
h2
)+
1
2ln
(ω2
2
))(B.2)
The molar enthalpy of H gas, hg, is327
hg =
(∂µg/T
∂(1/T )
)P
= − ∂
∂(1/T )kT lnλg
∣∣∣∣P
= k
(7
4T − χd
2k
).
(B.3)
List of Symbols
A Moment of inertia of H2(g) (4.63 × 10⁻³⁴ kg m2)
aH Activity of H
h Planck constant (6.626 × 10⁻³⁴ J s)
∆hmixi Relative partial molar enthalpy of mixing (J mol−1)
∆∆hmixi
Difference between ∆hmixi,liq and ∆hmix
i,sol at Tfus
(J mol−1)
k Boltzmann constant (1.38 × 10⁻²³ J K−1)
lH Molecular translational partition function of H
MM Molecular weight of M (kg mol−1)
mH Mass of H (1.69 × 10⁻²⁷ kg)
NA Avogadro constant (6.022 × 10²³ mol−1)
Continued on next page
17
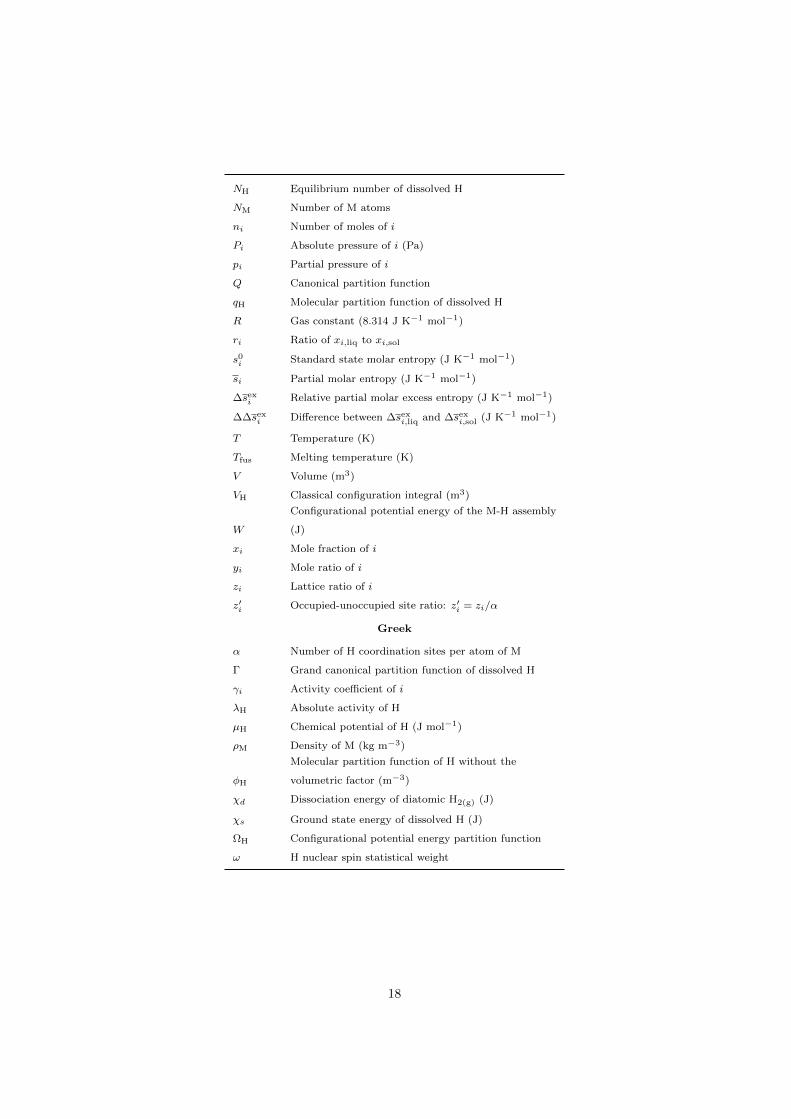
NH Equilibrium number of dissolved H
NM Number of M atoms
ni Number of moles of i
Pi Absolute pressure of i (Pa)
pi Partial pressure of i
Q Canonical partition function
qH Molecular partition function of dissolved H
R Gas constant (8.314 J K−1 mol−1)
ri Ratio of xi,liq to xi,sol
s0i Standard state molar entropy (J K−1 mol−1)
si Partial molar entropy (J K−1 mol−1)
∆sexi Relative partial molar excess entropy (J K−1 mol−1)
∆∆sexi Difference between ∆sexi,liq and ∆sexi,sol (J K−1 mol−1)
T Temperature (K)
Tfus Melting temperature (K)
V Volume (m3)
VH Classical configuration integral (m3)
W
Configurational potential energy of the M-H assembly
(J)
xi Mole fraction of i
yi Mole ratio of i
zi Lattice ratio of i
z′i Occupied-unoccupied site ratio: z′i = zi/α
Greek
α Number of H coordination sites per atom of M
Γ Grand canonical partition function of dissolved H
γi Activity coefficient of i
λH Absolute activity of H
µH Chemical potential of H (J mol−1)
ρM Density of M (kg m−3)
φH
Molecular partition function of H without the
volumetric factor (m−3)
χd Dissociation energy of diatomic H2(g) (J)
χs Ground state energy of dissolved H (J)
ΩH Configurational potential energy partition function
ω H nuclear spin statistical weight
18

References328
[1] J. P. Hirth, Effects of hydrogen on the properties of iron and steel, Metal-329
lurgical Transactions A 11 (6) (1980) 861–890.330
[2] A. R. Troiano, The role of hydrogen and other interstitials in the mechanical331
behavior of metals, Transactions of the American Society for Metals 52332
(1960) 54–80.333
[3] Y. A. Chang, K. Fitzner, M. X. Zhang, The solubility of gases in liquid334
metals and alloys, Progress in Materials Science 32 (2-3) (1988) 97–259.335
[4] E. Fromm, E. Gebhardt, Gase und Kohlenstoff in Metallen, Springer-336
Verlag, Berlin; New York, 1976.337
[5] F. D. Manchester (Ed.), Phase Diagrams of Binary Hydrogen Alloys, ASM338
International, Materials Park, OH, 2000.339
[6] R. H. Fowler, C. J. Smithells, A theoretical formula for the solubility of340
hydrogen in metals, Proceedings of the Royal Society A: Mathematical,341
Physical and Engineering Sciences 160 (900) (1937) 37–47.342
[7] Y. Ebisuzaki, M. O’Keeffe, The solubility of hydrogen in transition metals343
and alloys, Progress in Solid State Chemistry 4 (1967) 187–211.344
[8] T. Emi, R. D. Pehlke, Theoretical calculation of the solubility of hydrogen345
in liquid metals, Metallurgical Transactions 1 (10) (1970) 2733–2737.346
[9] M. O’Keeffe, S. A. Steward, Analysis of the thermodynamic behavior347
of hydrogen in body-centered-cubic metals with application to niobium-348
hydrogen, Berichte Der Bunsen-gesellschaft Fur Physikalische Chemie349
76 (12) (1972) 1278–1282.350
[10] S. Stafford, R. B. McLellan, The solubility of hydrogen in nickel and cobalt,351
Acta Metallurgica 22 (12) (1974) 1463–1468.352
[11] O. J. Kleppa, P. Dantzer, M. E. Melnichak, High-temperature thermody-353
namics of the solid solutions of hydrogen in bcc vanadium, niobium, and354
tantalum, Journal of Chemical Physics 61 (10) (1974) 4048–4058.355
19

[12] A. Magerl, N. Stump, H. Wipf, G. Alefeld, Interstitial position of hydrogen356
in metals from entropy of solution, Journal of Physics and Chemistry of357
Solids 38 (7) (1977) 683–686.358
[13] P. G. Dantzer, O. J. Kleppa, High-Temperature Thermodynamics of Di-359
lute Solutions of Hydrogen and Deuterium in Tantalum and in Tantalum-360
Oxygen Solid Solutions, Journal of Solid State Chemistry 24 (1978) 1–9.361
[14] A. Mainwood, A. M. Stoneham, The theory of the entropy and enthalpy of362
solution of chemical impurities: I. General method, Philosophical Magazine363
B 37 (2) (1978) 255–261.364
[15] G. Boureau, O. J. Kleppa, P. D. Antoniou, Thermodynamic Aspects of Hy-365
drogen Motions in Dilute Metallic Solutions, Journal of Solid State Chem-366
istry 28 (1979) 223–233.367
[16] P. Dantzer, O. Kleppa, Thermodynamics of the Lanthanum-Hydrogen Sys-368
tem at 917K, Journal of Solid State Chemistry 35 (1980) 34–42.369
[17] S. Yamanaka, Y. Fujita, M. Uno, M. Katsura, Influence of interstitial oxy-370
gen on hydrogen solubility in metals, Journal of Alloys and Compounds371
293 (1999) 42–51.372
[18] A. Sieverts, Absorption of gases by metals, Zeitschrift fur Metallkunde 21373
(1929) 37–46.374
[19] S. A. Gedeon, T. W. Eagar, Thermochemical analysis of hydrogen absorp-375
tion in welding, Welding Journal 69 (7) (1990) 264–271.376
[20] Y. Fukai, The Metal-Hydrogen System: Basic Bulk Properties, 2nd Edition,377
Springer-Verlag, Berlin, Heidelberg, 2005.378
[21] P. R. Subramanian, Ag-H (Silver-Hydrogen), in: F. D. Manchester (Ed.),379
Phase Diagrams of Binary Hydrogen Alloys, ASM International, Materials380
Park, OH, 2000, pp. 1–3.381
[22] E. Fromm, G. Horz, Hydrogen, nitrogen, oxygen, and carbon in metals,382
International Metals Reviews 25 (1) (1980) 269–311.383
20

[23] F. D. Manchester, A. San-Martin, Al-H (Aluminum-Hydrogen), in: F. D.384
Manchester (Ed.), Phase Diagrams of Binary Hydrogen Alloys, ASM In-385
ternational, Materials Park, OH, 2000, pp. 4–12.386
[24] P. N. Anyalebechi, Analysis and thermodynamic prediction of hydrogen387
solubility in solid and liquid multicomponent aluminum alloys, in: B. Welch388
(Ed.), Light Metals 1998, Minerals, Metals and Materials Society, 1998, pp.389
185–200.390
[25] M. Weinstein, J. F. Elliott, The Solubility of Hydrogen in Liquid Pure391
Metals Co, Cr, Cu, and Ni, Transactions of the Metallurgical Society of392
AIME 227 (1) (1963) 285–286.393
[26] V. I. Shapovalov, Hydrogen as an alloying element in metals, Russian Jour-394
nal of Physical Chemistry A 54 (11) (1980) 1659–1663.395
[27] A. San-Martin, F. D. Manchester, The Fe-H (Iron-Hydrogen) System, Bul-396
letin of Alloy Phase Diagrams 11 (2) (1990) 173–184.397
[28] F. D. Manchester, A. San-Martin, H-Mg (Hydrogen-Magnesium), in: F. D.398
Manchester (Ed.), Phase Diagrams of Binary Hydrogen Alloys, ASM In-399
ternational, Materials Park, OH, 2000, pp. 83–94.400
[29] A. Sieverts, H. Moritz, Manganese and hydrogen, Zeitschrift Fur Physikalis-401
che Chemie-abteilung A-chemische Thermodynamik, Kinetik, Elektro-402
chemie Eigenschaftslehre 180 (1937) 249–263.403
[30] A. San-Martin, F. D. Manchester, H-Mn (Hydrogen-Manganese), in: F. D.404
Manchester (Ed.), Phase Diagrams of Binary Hydrogen Alloys, ASM In-405
ternational, Materials Park, OH, 2000, pp. 95–104.406
[31] J. A. Pryde, C. G. Titcomb, Phase equilibria and kinetics of evolution of407
dilute solutions of hydrogen in niobium, Journal Of Physics C-Solid State408
Physics 5 (12) (1972) 1293–1300.409
[32] E. Veleckis, R. K. Edwards, Thermodynamic Properties in the Systems410
Vanadium-Hydrogen, Niobium-Hydrogen, and Tantalum-Hydrogen, Jour-411
nal of Physical Chemistry 7 (9) (1969) 683–692.412
21

[33] M. L. Wayman, G. C. Weatherly, H-Ni (Hydrogen-Nickel), in: F. D. Manch-413
ester (Ed.), Phase Diagrams of Binary Hydrogen Alloys, ASM Interna-414
tional, Materials Park, OH, 2000, pp. 147–157.415
[34] N. N. Kalinyuk, Solubility of hydrogen in solid and in liquid palladium,416
Russian Journal of Physical Chemistry A 54 (1980) 1611–1613.417
[35] F. D. Manchester, A. San-Martin, H-Ti (Hydrogen-Titanium), in: F. D.418
Manchester (Ed.), Phase Diagrams of Binary Hydrogen Alloys, ASM In-419
ternational, Materials Park, OH, 2000, pp. 238–258.420
[36] P. Dantzer, High temperature thermodynamics of H2 and D2 in titanium,421
and in dilute titanium oxygen solid solutions, Journal of Physics and Chem-422
istry of Solids 44 (9) (1983) 913–923.423
[37] C. H. P. Lupis, Chemical Thermodynamics of Materials, Prentice-Hall, Inc.,424
New York, 1983.425
[38] F. D. Richardson, Physical Chemistry of Melts in Metallurgy, Academic426
Press Inc. Ltd., London, 1974.427
[39] O. Kubaschewski, The change of entropy, volume and binding state of the428
elements on melting, Transactions of the Faraday Society 45 (1949) 931–429
940.430
[40] R. Fowler, E. A. Guggenheim, Statistical Thermodynamics, Cambridge431
University Press, Cambridge, 1965.432
[41] G. Kaptay, A unified model for the cohesive enthalpy, critical temperature,433
surface tension and volume thermal expansion coefficient of liquid metals434
of bcc, fcc and hcp crystals, Materials Science and Engineering A 495 (1-2)435
(2008) 19–26.436
[42] Y. Waseda, The structure of liquid transition metals and their alloys,437
in: R. Evans, D. A. Greenwood (Eds.), Liquid Metals, 1976 (Institute of438
Physics Conference Series No. 30), The Institute of Physics, Bristol, 1977,439
pp. 230–240.440
[43] N. E. Cusack, The electronic properties of liquid metals, Reports on441
Progress in Physics 26 (1963) 361–409.442
22

[44] W. Knight, A. Berger, V. Heine, Nuclear resonance in solid and liquid443
metals: A comparison of electronic structures, Annals of Physics 8 (2)444
(1959) 173–193.445
[45] C. Norris, Photoelectron spectroscopy of liquid metals and alloys, in:446
R. Evans, D. A. Greenwood (Eds.), Liquid Metals, 1976 (Institute of447
Physics Conference Series No. 30), The Institute of Physics, Bristol, 1977,448
pp. 171–180.449
23