Molar excess volumes of binary mixtures of ethylbenzene with n-alkanes at 298.15 k; an...
10
Thermochimicu Actu, 114 (1987) 337-346 Elsevier Science Publishers B.V., Amsterdam - Printed in The Netherlands 337 MOLAR EXCESS VOLUMES OF BINARY MIXTURES OF ETHYLBENZENE WITH n-ALKANES AT 298.15 K; AN INTERPRETATION IN TERMS OF THE PRIGOGINE-FLORY-PATTERSON MODEL AKL M. AWWAD *, NEDHAL K. AL-NIDAWY, MUNA A. SALMAN and FATIN A. HASSAN Scientific Research Council, Petroleum Research Centre, P. 0. Box 10039, Jadiriyah, Baghdad (Iraq) (Received 4 September 1986) ABSTRACT Molar excess volumes are reported for binary mixtures of ethylbenzene with n-hexane, n-heptane, n-octane, n-nonane, n-decane, n-dodecane, n-tetradecane and n-hexadecane at 298.15 K and over the whole mole fraction range. The Prigogine-Flory-Patterson model of solution thermodynamics has been used to predict the molar excess volumes. The values of Vz are well predicted and the results show the importance of the three contributions, AV,,,,,, Al’,* and AV,, to V,“. INTRODUCTION Molar excess volumes of binary mixtures of hydrocarbons have been studied extensively, both from theoretical and experimental points of view [l-5]. n-Alkane systems show a short-range orientational order phenomena which lead to an important contribution to the excess thermodynamic properties. The molar excess volume [6], molar excess enthalpy [7] and excess heat capacity [8] of some n-alkane and ethylbenzene systems have been reported. Molar excess enthalpies for ethylbenzene systems are found to be much smaller than those for benzene systems, which are similar to those of toluene systems [7]. Analysis of HE data in terms of the Prigogine-Flory-Patterson model explained the difference in terms of the existence of order correlations between benzene molecules, which are absent in toluene and ethylbenzene molecules. Recently, molar excess volumes were reported for binary mixtures of n-alkanes with benzene [9] and with toluene [lo], and the V,” data were analysed in terms of the Prigogine-Flory-Patterson model. The analysis * To whom correspondence should be addressed. 0040-6031/87/$03.50 0 1987 Elsevier Science Publishers B.V.
-
Upload
teknologimalaysia -
Category
Documents
-
view
1 -
download
0
Transcript of Molar excess volumes of binary mixtures of ethylbenzene with n-alkanes at 298.15 k; an...

Thermochimicu Actu, 114 (1987) 337-346
Elsevier Science Publishers B.V., Amsterdam - Printed in The Netherlands 337
MOLAR EXCESS VOLUMES OF BINARY MIXTURES OF ETHYLBENZENE WITH n-ALKANES AT 298.15 K; AN INTERPRETATION IN TERMS OF THE PRIGOGINE-FLORY-PATTERSON MODEL
AKL M. AWWAD *, NEDHAL K. AL-NIDAWY, MUNA A. SALMAN and FATIN A.
HASSAN
Scientific Research Council, Petroleum Research Centre, P. 0. Box 10039, Jadiriyah, Baghdad
(Iraq)
(Received 4 September 1986)
ABSTRACT
Molar excess volumes are reported for binary mixtures of ethylbenzene with n-hexane, n-heptane, n-octane, n-nonane, n-decane, n-dodecane, n-tetradecane and n-hexadecane at 298.15 K and over the whole mole fraction range. The Prigogine-Flory-Patterson model of solution thermodynamics has been used to predict the molar excess volumes. The values of Vz are well predicted and the results show the importance of the three contributions, AV,,,,,, Al’,* and AV,, to V,“.
INTRODUCTION
Molar excess volumes of binary mixtures of hydrocarbons have been studied extensively, both from theoretical and experimental points of view [l-5]. n-Alkane systems show a short-range orientational order phenomena which lead to an important contribution to the excess thermodynamic properties. The molar excess volume [6], molar excess enthalpy [7] and excess heat capacity [8] of some n-alkane and ethylbenzene systems have been reported. Molar excess enthalpies for ethylbenzene systems are found to be much smaller than those for benzene systems, which are similar to those of toluene systems [7]. Analysis of HE data in terms of the Prigogine-Flory-Patterson model explained the difference in terms of the existence of order correlations between benzene molecules, which are absent in toluene and ethylbenzene molecules.
Recently, molar excess volumes were reported for binary mixtures of n-alkanes with benzene [9] and with toluene [lo], and the V,” data were analysed in terms of the Prigogine-Flory-Patterson model. The analysis
* To whom correspondence should be addressed.
0040-6031/87/$03.50 0 1987 Elsevier Science Publishers B.V.

338
showed the importance of the three contributions AV,, A&,*, and AV&, to Vz. As a continuation of these investigations, we extend this work to n-alkanes and ethylbenzene systems to study the effect of the side chain in the aromatic ring on the molar excess volume. The present paper reports the molar excess volumes of the binary mixtures of ethylbenzene and n-alkanes: n-hexane (n-C,), n-heptane (n-C,), n-octane (n-C,), n-nonane (n-C,), n-de- cane (n-C,,), n-dodecane (n-C,,), n-tetradecane (n-C,,) and n-hexadecane (n-C,,). The Vz data obtained were analysed in terms of the Prigo~ne-Flop-Patterson model.
EXPERIMENTAL
The n-alkanes (Fluka AG, Puriss, P.a.) were used without further purifica- tion. All samples were stored over freshly activated 4A molecular sieve (Union Carbide) before use. Ethylbenzene (Fluka AG, Puriss grade) was purified by distillation at atmospheric pressure through a Vigreax column and then passed through an ~u~nium oxide column. The purified liquid was stored over sodium wire. The purity of the materials was checked by means of analytical GLC and density measurements. The densities at 298.15 K of the samples used in this study are listed in Table 1, together with the literature values for comparison.
Appuratus
The molar excess volumes Vz of the present systems were obtained from density data measured at 298.15 rt 0.001 K using a precision digital densime-
TABLE 1
Densities of pure component liquids at 298.15 K
Component P (oW P (W a (g cmw3) (g cm-3)
Ethylbe~ene 0.86249 0.86264 n-Hexane 0.65485 0.65481 n-Heptane 0.67966 0.67951 n-Octane 0.69876 0.69849 n-Nonane 0.71356 0.71381 n-Decane 0.72641 0.72625 n-Dodecane 0.74633 0.74516 n-Tetradecane 0.75933 0.75930 n-Hexadecane 0.76992 0.76996
” Ref. 11.
339
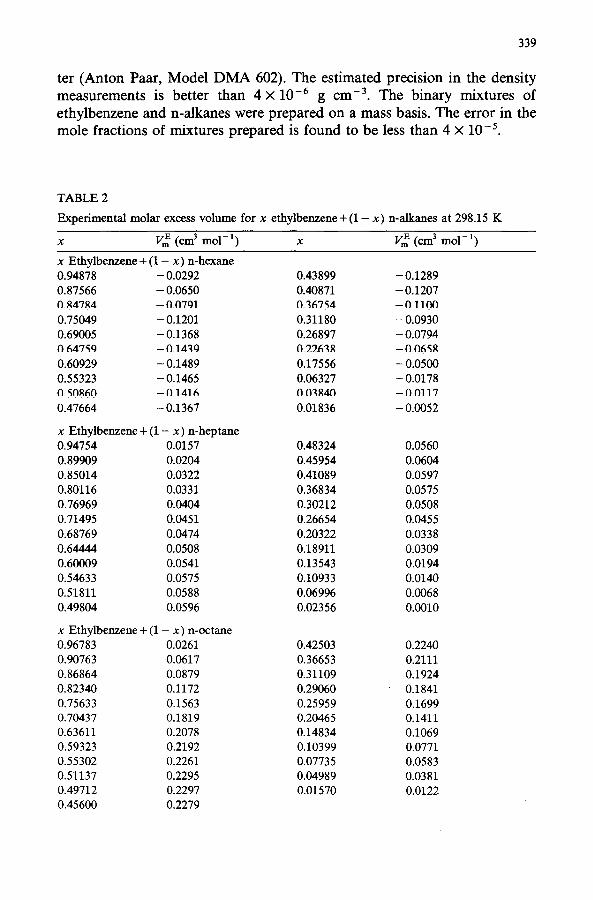
ter (Anton Paar, Model DMA 602). The estimated precision in the density measurements is better than 4 X 10m6 g cmm3. The binary mixtures of ethylbenzene and n-alkanes were prepared on a mass basis. The error in the mole fractions of mixtures prepared is found to be less than 4 X 10W5.
TABLE2
Experimental molar excess volume for x ethylbenzene+(l- x) n-alkanes at 298.15 K
x V," (cm3 mol-') x Vt (cm3 mol-')
x Ethylbenzene+(l- x)n-hexane 0.94878 -0.0292 0.87566 -0.0650 0.84784 -0.0791 0.75049 -0.1201 0.69005 -0.1368 0.64759 -0.1439 0.60929 -0.1489 0.55323 -0.1465 0.50860 -0.1416 0.47664 -0.1367
x Ethylbenzene+(l- x)n-heptane 0.94754 0.0157 0.89909 0.0204 0.85014 0.0322 0.80116 0.0331 0.76969 0.0404 0.71495 0.0451 0.68769 0.0474 0.64444 0.0508 0.60009 0.0541 0.54633 0.0575 0.51811 0.0588 0.49804 0.0596
x Ethylbenzene+(l- x) n-octane 0.96783 0.0261 0.90763 0.0617 0.86864 0.0879 0.82340 0.1172 0.75633 0.1563 0.70437 0.1819 0.63611 0.2078 0.59323 0.2192 0.55302 0.2261 0.51137 0.2295 0.49712 0.2297 0.45600 0.2279
0.43899 -0.1289 0.40871 -0.1207 0.36754 -0.1100 0.31180 -0.0930 0.26897 -0.0794 0.22638 -0.0658 0.17556 -0.0500 0.06327 -0.0178 0.03840 -0.0117 0.01836 -0.0052
0.48324 0.0560 0.45954 0.0604 0.41089 0.0597 0.36834 0.0575 0.30212 0.0508 0.26654 0.0455 0.20322 0.0338 0.18911 0.0309 0.13543 0.0194 0.10933 0.0140 0.06996 0.0068 0.02356 0.0010
0.42503 0.2240 0.36653 0.2111 0.31109 0.1924 0.29060 0.1841 0.25959 0.1699 0.20465 0.1411 0.14834 0.1069 0.10399 0.0771 0.07735 0.0583 0.04989 0.0381 0.01570 0.0122

340
TABLE2(continued)
X Vz (cm3 mol-l) x V," (cm3 mol-')
x Ethylben.zene+(l- x)n-nonane 0.91120 0.1050 0.86388 0.1627 0.84304 0.1856 0.78652 0.2369 0.74389 0.2646 0.71220 0.2796 0.68734 0.2886 0.63214 0.3014 0.61988 0.3032 0.58994 0.306s 0.55233 0.3089 0.51305 0.3099
x Ethylbenzene+(l- x)n-decane 0.94343 0.0741 0.89790 0.1340 0.84989 0.1942 0.78128 0.2697 0.73998 0.3080 0.70951 0.3319 0.64217 0.3742 0.58978 0.3890 0.52480 0.3961 0.47976 0.3919
x Ethylbenzene+(l- x)n-dodecane 0.97687 0.0567 0.90647 0.1999 0.82945 0.3116 0.77954 0.3666 0.73830 0.4008 0.68734 0.4330 0.65837 0.4660 0.58773 0.4637 0.54304 0.4650 0.47615 0.4590
x Ethylbenzene+(l- x) n-tetradecane 0.97853 0.0663 0.91548 0.2303 0.87533 0.3125 0.84235 0.3692 0.80115 0.4272 0.76152 0.4689 0.73939 0.4906 0.69094 0.5247 0.64989 0.5460 0.58612 0.5514 0.53939 0.5460 0.48520 0.5298
0.49441 0.3099 0.46388 0.3093 0.43922 0.3079 0.40397 0.3043 0.36874 0.2995 0.32218 0.2675 0.28984 0.2557 0.25502 0.2271 0.20299 0.1875 0.16854 0.1552 0.10333 0.0894 0.05705 0.0371
0.44323 0.3835 0.40783 0.3739 0.36312 0.3631 0.31979 0.3267 0.27452 0.2933 0.23940 0.2625 0.17837 0.2175 0.11568 0.1526 0.~~9 0.0859 0.02276 0.034s
0.42734 0.4352 0.36725 0.3954 0.31739 0.3647 0.25846 0.3131 0.19979 0.2492 0.13392 0.1706 0.07764 0.0990 0.04899 0.0794 0.01774 0.0177
0.43000 0.5036 0.38269 0.4728 0.32998 0.4304 0.29491 0.3973 0.25018 0.3514 0.21976 0.3168 0.16478 0.2485 0.13754 0.2116 0.09734 0.1541 0.05192 0.0848 0.02009 0.0368

341
TABLE 2 (continued)
X V,” (cm3 mol-‘)
x Ethylbenzene + (1 - x) n-hexadecane 0.94544 0.1964 0.90807 0.2989 0.86231 0.3905 0.81079 0.4692 0.78596 0.4968 0.73994 0.5353 0.67086 0.5685 0.64956 0.5739 0.60452 0.5818 0.53945 0.5737 0.48754 0.5588
X V,” (cm3 mol-‘)
0.43023 0.5301 0.39978 0.5125 0.34945 0.4735 0.28740 0.4123 0.24755 0.3658 0.20115 0.3048 0.15539 0.2386 0.10489 0.1607 0.08732 0.1331 0.05956 0.0894 0.01992 0.0288
RESULTS AND DISCUSSION
The experimental Vz results obtained from precise density measurements at 298.15 + 0.001 K are listed in Table 2. Each set of Vm data was fitted to the following equation by the least-squares method.
Vj(cm3 mol-‘) = x(1 - x) t aj(l - 2x)j-’ (1) j=l
The values of the coefficients uj are listed in Table 3 together with the standard deviation, aV2, of fits, which is evaluated from the equation:
UVE= (AVE)* “*
m [ 1 n-P
where n is the number of experimental points and p is the number of coefficients in eqn. (1).
TABLE 3
Coefficients aj and standard deviations oVE of eqn. (1)
System a1 a2 a3 a4 1o-5 UP
Ethylbenzene + n-Hexane - 0.5586 - 0.2908 0.1529 0.1652 9 n-Heptane 0.2374 - 0.0694 - 0.0609 0.8339 8 n-Octane 0.9091 - 0.0548 - 0.1505 0.0517 10 n-Nonane 1.2440 0.1101 0.5142 0.2519 2 n-Decane 1.5827 0.2087 - 0.1656 -0.3631 10 n-Dodecane 1.8403 0.3809 0.0749 0.2857 5 n-Tetradecane 2.1336 0.7096 0.3569 2 n-Hexadecaue 2.2528 0.6656 0.5568 0.7356 3

342
O-6
0.0 0.2 0-L 0.6 0.6 1.0
Fig. 1. Molar excess volumes of x e~ylbe~e~e+(l- X) n-alkanes at 298.15 K. (0) n-C6; (0) n-C,; (8) n-C*; (0) n-C,; (m) n-C,,; (A) n-C,,; (A) n-C,,; (X) ~-CM.
The experimental molar excess volume is negative for ethylbenzene + n- hexane and positive for ethylbenzene + n-heptane,-t n-octane,+ n- nonane, + n-decane, + n-dodecane, f n-tetradecane and + n-hexadecane over the whole mole fraction range at 298.15 K (Fig. 1). The Vt results obtained here for this class of mixtures are found to be in reasonable agreement with values published in the literature [6]. For example, at x = 0.5 and 298.15 K, the Vz values for ethylbenzene + n-heptane, + n-decane, + n-dodecane and + n-tetradecane are 0.0595,0.3557,0.4462 and 0.4930, while ours are 0.0593, 0.3957, 0.4601 and 0.5334, respectively. It is apparent that the magnitude of V,E for the ethylbenzen~ system is similar to that for toluene [lo] and much smaller than that for benzene system 191. The maximum value, for the ethylbenzene + n-hexadecane system is 0.581 cm3 mol-i (x = 0.395), for the toluene system is 0.562 cm3 mol-’ (x = O-380), and for the benzene system is 1.250 cm3 mall’ (x = 0.434) ( x is the mole fraction of n-alkanes). It seems that the sequence of Vz is consistent with that for HE.
343
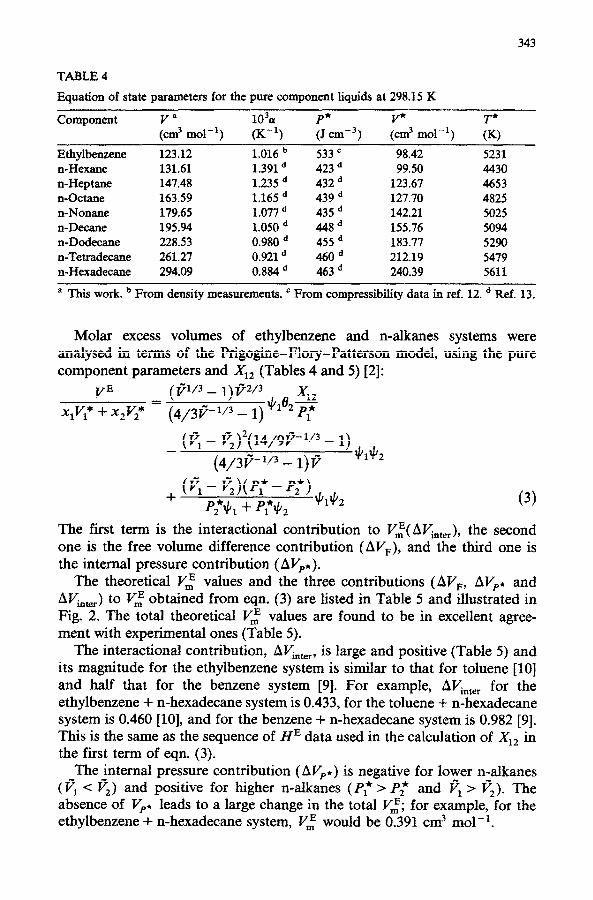
TABLE 4
Equation of state parameters for the pure component liquids at 298.15 K
Component a Lrn3 mol-‘)
103&I P* V” *
(K-l) (J cme3) (cm3 mol-‘) TK)
Ethylbenzene 123.12 n-Hexane 131.61 n-Heptane 147.48 n-Octane 163.59 n-Nonane 179.65 n-Decane 195.94 n-Dodecane 228.53 n-Tetradecane 261.27 n-Hexadecaae 294.09
1.016 b 533 = 98.42 5231 1.391 d 423 d 99.50 4430 1.235 d 432 d 123.67 4653 1.165 d 439 d 127.70 4825 1.077 d 435 d 142.21 5025 1.050 d 448d 155.76 5094 0.980 d 455 d 183.77 5290 0.921d 460 d 212.19 5479 0.884 d 463 d 240.39 5611
a This work. b From density measurements. ’ From compressibility data in ref. 12. d Ref. 13.
Molar excess volumes of ethylbenzene and n-alkanes systems were analysed in terms of the Prigogine-Plory-Patterson model, using the pure component parameters and X,, (Tables 4 and 5) [2]:
VE (PI’3 - 1)W \I/ 8 x,, XIV;* + x2V;r = (4/3#W3 - 1) l 2 PC
The first term is the interactional contribution to V,(AVi,t,,), the second one is the free volume difference contribution (AV,), and the third one is the internal pressure contribution ( Ah’v,,).
The theoretical Vz values and the three contributions (A&, AVpe and AJ$_) to Vz obtained from eqn. (3) are listed in Table 5 and illustrated in Fig. 2. Tbe total theoretical Vt values are found to be in excellent agree- ment with experimental ones (Table 5).
The interactional contribution, A&,,, is large and positive (Table 5) and its magnitude for the ethylbenzene system is similar to that for toluene [lo] and half that for the benzene system [9]. For example, AVinter for the ethylbenzene + n-hexadecane system is 0.433, for the toluene f n-hexadecane system is 0.460 [lo], and for the benzene + n-hexadecane system is 0.982 [9]. This is the same as the sequence of HE data used in the calculation of X,, in the first term of eqn. (3).
The internal pressure contribution (AVp*) is negative for lower n-alkanes (VI < &) and positive for higher n-alkanes (P: > Pt and r?, > I?& The absence of V& leads to a large change in the total Vz; for example, for the ethylbenzene + n-hexadecane system, Vz would be 0.391 cm3 mol-r.

344
TABLE 5
Experimental and theoretical molar excess volumes (cm3 mol-‘) of ethylbenzene (1) +n- alkanes (2) at 298.15 K
System :Zrnw3)
Af’, Av,* Al/,,,, vi%,, KFp
Ethylbenzene (1) + n-Hexane (2) n-Heptane (2) n-Octane (2) n-Nonane (2) n-Decane (2) n-Dodecane (2) n-Tetradecane (2) n-Hexadecane (2)
15.6 = 15.7 = 15.8 b 15.8 = 15.9 b 16.5 b 16.9 b 17.9 b
- 0.187 - 0.085 - 0.037 - 0.007 - 0.002 - 0.003 - 0.041 - 0.042
- 0.409 0.385 - 0.207 -0.139 - 0.258 0.375 0.032 0.059 - 0.160 0.384 0.187 0.227 - 0.074 0.380 0.299 0.311 - 0.037 0.396 0.357 0.395
0.037 0.402 0.437 0.460 0.099 0.412 0.470 0.533 0.139 0.433 0.530 0.563
a Estimated. b Ref. 7.
0.6 , , , , , , , , , F /’
0.5 -
0.L -
0.3 - I _.
;
? 0.2 -
u
Number of carbon atoms
Fig. 2. Experimental and theoretical V,” at x = 0.5 and 298.15 K. The three contributions to
v,“, Avinter, AVp and AV,, are indicated.
345
The free volume difference contribution (AV,) is negative for all systems studied. This contribution is more important for lower n-alkanes than for longer n-alkanes. For example the total Vz for the ethylbenzene + n-hexane system would be 0.024 cm3 mol-’ and for the ethylbenzene + n-hexadecane would be 0.572 cm3 mol-’ (see Table 5 for total Vz).
The values of Vt for ethylbenzene systems are nearly the same as that for the toluene system and are nearly half of the corresponding values for benzene systems. Such behaviour is probably due to: (i) the PF and PI values for benzene being much larger than for toluene or ethylbenzene and (ii) the molecular order contribution in benzene molecules, which is absent in toluene and ethylbenzene.
LIST OF SYMBOLS
coefficient in eqn. (1) excess enthalpy number of experimental points in eqn. (1) number of coefficients in eqn. (1) characteristic pressure of pure component characteristic temperature of pure component molar volume of pure component characteristic volume of pure component reduced volume of mixture molar excess volume the interactional contribution to Vm the free volume difference contribution to V, the P* contribution to Vm mole fraction of ethylbenzene interchange interaction parameter in Flory theory
Greek letters
a
Zi ei
P
thermal expansion coefficient standard deviation energy fraction contact surface fraction density of the pure component
REFERENCES
1 M. Barbe and D. Patters+, J. Solution Chem., 9 (1980) 753. 2 M. Costas and D. Patterson, J. Solution Chem., 11 (1982) 807.
346
3 H.T. Van and D. Patterson, J. Solution Chem., 11 (1982) 793. 4 I. Fujihara, M. Kobayashi and S. Mm~~, Fluid Phase Equilibria, 15 (1983) 81. 5 G. Delmas, P. Purves and P. de St. Remain, J. Phys. Chem., 79 (1975) 1970. 6 J.-P.E. Grolier and A. Faradjzadeh, Int. Data Ser., Ser. A, (1981) 143. 7 RL. Arenosa, R.C. Rubio, C. Menduiiia and M. Dik Peaa, J. Solution Chem., 14 (1985)
345; J. Chem. Eng. Data, 30 (1985) 24. 8 J.-P.E. Grolier and A. Faradjzadeh, Int. Data Ser., Ser. A, (1980) 131. 9 A.M. Awwad, S.F. Al-Azzawi and M.A. Salman, IWd Phase Equilibria, 31 (1986) 171.
10 A.M. Awwad, N.K. AI-Nidawy and F.A. Hassan, J. Pet. Res. (Iraq), 6 (1987). 11 F.D. Rossini, Selected Values of Physical and Thermodynamic Properties of Hydro-
carbons and Related Compounds, API Research Project 44,1967. 12 A.J. Richard and P.R. Fleming, J. Chem. Thermodyn., 13 (1981) 863. 13 A.M. Awwad and M.A. Salman, Fluid Phase Equilibria, 25 (1986) 195.