Structure Learning in Conditional Probability Models via an Entropic Prior and Parameter Extinction
Upload
ucentralgujaratgandhinagarCategory
view
6download
0
Journal of Molecular Liquids 203 (2015) 29–38
Contents lists available at ScienceDirect
Journal of Molecular Liquids
j ourna l homepage: www.e lsev ie r .com/ locate /mol l iq
Surface tension, viscosity, apparent molal volume, activation viscousflow energy and entropic changes of water + alkali metal phosphates atT = (298.15, 303.15, 308.15) K
R.K. Ameta, Man Singh ⁎School of Chemical Sciences, Central University of Gujarat, Gandhinagar, 382030, India
⁎ Corresponding author.E-mail addresses: [email protected] (R.K. Am
[email protected] (M. Singh).
http://dx.doi.org/10.1016/j.molliq.2014.12.0380167-7322/© 2014 Published by Elsevier B.V.
a b s t r a c t
a r t i c l e i n f oArticle history:Received 13 June 2014Received in revised form 21 November 2014Accepted 27 December 2014Available online 31 December 2014
Keywords:Ion–ionSolute–solvent interactionSurface tensionViscosityIntermolecular forcesSurvismeter
Surface tension and viscosity for water + alkali metals (Li, Na, K) were separately measured over their entirecomposition range at 298.15, 303.15 and 308.15 K. Viscosities and apparentmolal volumeswere used to calculateactivation viscous flow energy and entropy changes. Limiting surface tension and viscosity values obtained byfitting Redlich–Kister equation depict stronger ion–water interaction (IWI) than the interactions of water mole-cules themselves. Viscosity B coefficient obtained from Jones–Dole equation inferred solute impact on solventstructure and the size of ionic hydration. Ion–ion, ion–dipolar, solute–solvent and intermolecular interactionsstructurally affected the properties of solvent depicted from magnitudes of surface tension and viscosity. Thephysicochemical data scientifically and quantitatively inferred water + alkali metal phosphates interactions.For instancewith K3PO4 and K2HPO4 the increase in surface tension has been noticed 1.18 and 2.26% respectively,depending on their structural interactions. Surface tension and viscosity both have been synergized, and anAmeta-Singh-Interaction-Analysis-Model (ASIAM) for physicochemical properties has been proposed to distin-guish interaction pattern and a role of secondary cohesivity in developing dominance over primary cohesivityin interactochemistry of solutions.
© 2014 Published by Elsevier B.V.
1. Introduction
Among several biochemical buffers, the aqueous phosphate buffers(APBs) prepared out of alkali metals have been prerequisite require-ment as well as critically and appropriate model for last decades in ma-jority of biochemical processes. For instance, maintaining the catalyticactivity of enzymes and as well as vital medium for tissue engineeringand cell culture [1]. Reportedly, the phosphate salts are being used asAPB on associating with a pH-sensitive polymer to remediate a substi-tute (macrocapsules) of acidic ground water [2]. The pH, ionic strengthand viscosity of APBs have been the primary assistance in spectrophoto-metric assessment for determining nucleic acid purity [3–7]. For the lastdecade, an effective use of APBs has led to cause uncontrolled calcifica-tions of cornea on severe eye burns which depend on their surfacetension and viscosity [8]. Currently, in investigations concerning com-pounds as powerful mutagenic and carcinogenic, the APBs are beingwidely used and are at high demands; therefore their physicochemicalstudy is of utmost importance in interest of their interaction analysis[9]. In preparation of bacterial protein-extraction-reagent, the APBsare used to extract the soluble proteins such as recombinant from
eta),
bacteria (Escherichia coli) that depends on viscosity and surface tensionof APBs as function of their interacting activitieswith controlled entropy[10]. Like friccohesity in which both surface and bulk properties of thesolution are affected together with the salt's behavior or interacting ac-tivities at both the places' surface aswell as in bulk, and in both the casesthe entropy is controlled due to fixed concentration and homogeneousinteraction. The phosphate buffer saline (PBS) prepared by APBs iswidely used in biological research as well as microbiological due to itsisotonic and non-toxic nature which have attracted the biologists fortheir frequent use in their research. But surprisingly no adequate dataon their physicochemical scale are listed, although, such input is alwaysgood for efficient and better control over the processes. Especially,in vitro and vivo experiments for conducting anti-bacterial, fungal andcancer studies due to their moderate interaction in such systems.Thus, it seems that an applicability of APBs in thrust area of biochemicaland biological research depends on their physical properties such asconductance, surface tension and viscosity [5–10]. Therefore, for betterunderstanding of physicochemicalmechanism of the APBs, their surfacetension and viscosity are deciding parameters to prove their applicabil-ity in biological research due to an inter-convertibility of the cohesiveand intermolecular forces mutually [6–8]. The physicochemical or bio-logical processes are temperature dependent, and hence temperaturedependent activities of APBs are useful to know the action mechanisminvolves in these processes. For our best understanding, the surface
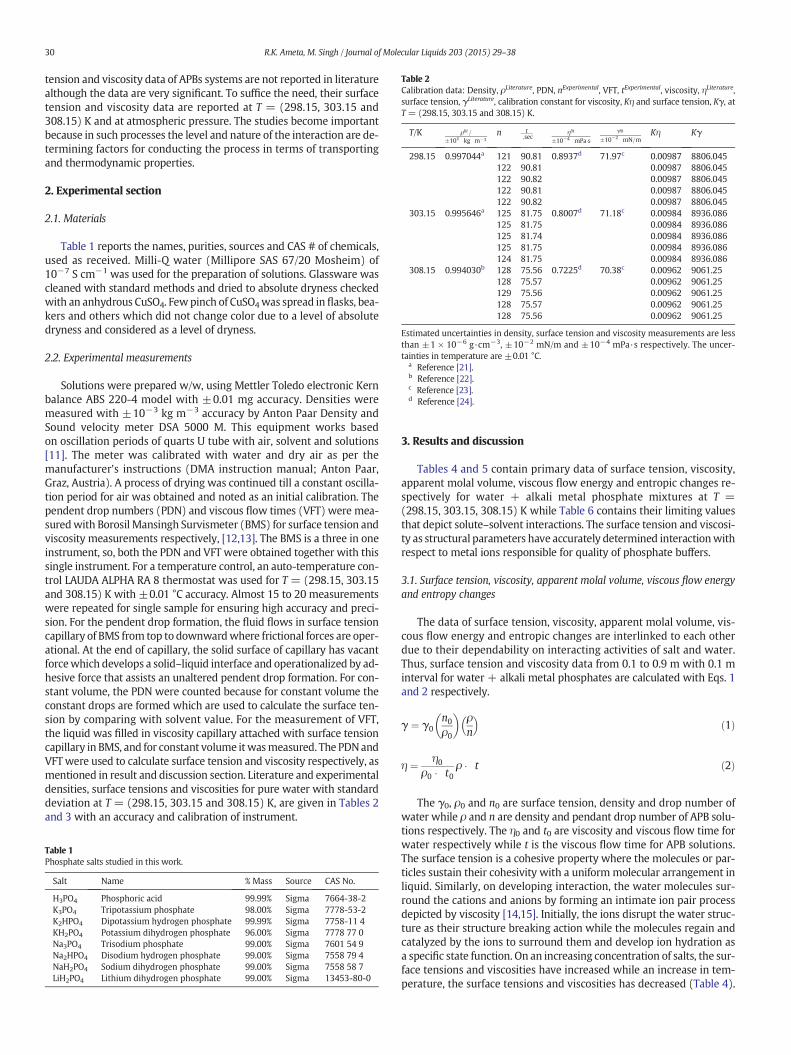
Table 2Calibration data: Density, ρLiterature, PDN, nExperimental, VFT, tExperimental, viscosity, ηLiterature,surface tension, γLiterature, calibration constant for viscosity, Kη and surface tension, Kγ, atT = (298.15, 303.15 and 308.15) K.
T/K ρlit=
�103 kg m−3n t
;secηlit
�10−4 mPa�sγlit
�10−2 mN=mKη Kγ
298.15 0.997044a 121 90.81 0.8937d 71.97c 0.00987 8806.045122 90.81 0.00987 8806.045122 90.82 0.00987 8806.045122 90.81 0.00987 8806.045122 90.82 0.00987 8806.045
303.15 0.995646a 125 81.75 0.8007d 71.18c 0.00984 8936.086125 81.75 0.00984 8936.086125 81.74 0.00984 8936.086125 81.75 0.00984 8936.086124 81.75 0.00984 8936.086
308.15 0.994030b 128 75.56 0.7225d 70.38c 0.00962 9061.25128 75.57 0.00962 9061.25129 75.56 0.00962 9061.25128 75.57 0.00962 9061.25128 75.56 0.00962 9061.25
Estimated uncertainties in density, surface tension and viscosity measurements are lessthan ±1 × 10⁻⁶ g·cm−3, ±10−2 mN/m and ±10−4 mPa·s respectively. The uncer-tainties in temperature are ±0.01 °C.
a Reference [21].b Reference [22].c Reference [23].d Reference [24].
30 R.K. Ameta, M. Singh / Journal of Molecular Liquids 203 (2015) 29–38
tension and viscosity data of APBs systems are not reported in literaturealthough the data are very significant. To suffice the need, their surfacetension and viscosity data are reported at T = (298.15, 303.15 and308.15) K and at atmospheric pressure. The studies become importantbecause in such processes the level and nature of the interaction are de-termining factors for conducting the process in terms of transportingand thermodynamic properties.
2. Experimental section
2.1. Materials
Table 1 reports the names, purities, sources and CAS # of chemicals,used as received. Milli-Q water (Millipore SAS 67/20 Mosheim) of10−7 S cm−1 was used for the preparation of solutions. Glassware wascleaned with standard methods and dried to absolute dryness checkedwith an anhydrous CuSO4. Fewpinch of CuSO4was spread in flasks, bea-kers and others which did not change color due to a level of absolutedryness and considered as a level of dryness.
2.2. Experimental measurements
Solutions were prepared w/w, using Mettler Toledo electronic Kernbalance ABS 220-4 model with ±0.01 mg accuracy. Densities weremeasured with ±10−3 kg m−3 accuracy by Anton Paar Density andSound velocity meter DSA 5000 M. This equipment works basedon oscillation periods of quarts U tube with air, solvent and solutions[11]. The meter was calibrated with water and dry air as per themanufacturer's instructions (DMA instruction manual; Anton Paar,Graz, Austria). A process of drying was continued till a constant oscilla-tion period for air was obtained and noted as an initial calibration. Thependent drop numbers (PDN) and viscous flow times (VFT) were mea-suredwith Borosil Mansingh Survismeter (BMS) for surface tension andviscosity measurements respectively, [12,13]. The BMS is a three in oneinstrument, so, both the PDN and VFT were obtained together with thissingle instrument. For a temperature control, an auto-temperature con-trol LAUDA ALPHA RA 8 thermostat was used for T = (298.15, 303.15and 308.15) K with ±0.01 °C accuracy. Almost 15 to 20 measurementswere repeated for single sample for ensuring high accuracy and preci-sion. For the pendent drop formation, the fluid flows in surface tensioncapillary of BMS from top to downwardwhere frictional forces are oper-ational. At the end of capillary, the solid surface of capillary has vacantforcewhich develops a solid–liquid interface and operationalized by ad-hesive force that assists an unaltered pendent drop formation. For con-stant volume, the PDN were counted because for constant volume theconstant drops are formed which are used to calculate the surface ten-sion by comparing with solvent value. For the measurement of VFT,the liquid was filled in viscosity capillary attached with surface tensioncapillary in BMS, and for constant volume itwasmeasured. The PDNandVFTwere used to calculate surface tension and viscosity respectively, asmentioned in result and discussion section. Literature and experimentaldensities, surface tensions and viscosities for pure water with standarddeviation at T = (298.15, 303.15 and 308.15) K, are given in Tables 2and 3 with an accuracy and calibration of instrument.
Table 1Phosphate salts studied in this work.
Salt Name % Mass Source CAS No.
H3PO4 Phosphoric acid 99.99% Sigma 7664-38-2K3PO4 Tripotassium phosphate 98.00% Sigma 7778-53-2K2HPO4 Dipotassium hydrogen phosphate 99.99% Sigma 7758-11 4KH2PO4 Potassium dihydrogen phosphate 96.00% Sigma 7778 77 0Na3PO4 Trisodium phosphate 99.00% Sigma 7601 54 9Na2HPO4 Disodium hydrogen phosphate 99.00% Sigma 7558 79 4NaH2PO4 Sodium dihydrogen phosphate 99.00% Sigma 7558 58 7LiH2PO4 Lithium dihydrogen phosphate 99.00% Sigma 13453-80-0
3. Results and discussion
Tables 4 and 5 contain primary data of surface tension, viscosity,apparent molal volume, viscous flow energy and entropic changes re-spectively for water + alkali metal phosphate mixtures at T =(298.15, 303.15, 308.15) K while Table 6 contains their limiting valuesthat depict solute–solvent interactions. The surface tension and viscosi-ty as structural parameters have accurately determined interactionwithrespect to metal ions responsible for quality of phosphate buffers.
3.1. Surface tension, viscosity, apparent molal volume, viscous flow energyand entropy changes
The data of surface tension, viscosity, apparent molal volume, vis-cous flow energy and entropic changes are interlinked to each otherdue to their dependability on interacting activities of salt and water.Thus, surface tension and viscosity data from 0.1 to 0.9 m with 0.1 minterval for water + alkali metal phosphates are calculated with Eqs. 1and 2 respectively.
γ ¼ γ0n0
ρ0
� �ρn
� �ð1Þ
η ¼ η0ρ0 � t0
ρ � t ð2Þ
The γ0, ρ0 and n0 are surface tension, density and drop number ofwater while ρ and n are density and pendant drop number of APB solu-tions respectively. The η0 and t0 are viscosity and viscous flow time forwater respectively while t is the viscous flow time for APB solutions.The surface tension is a cohesive property where the molecules or par-ticles sustain their cohesivity with a uniformmolecular arrangement inliquid. Similarly, on developing interaction, the water molecules sur-round the cations and anions by forming an intimate ion pair processdepicted by viscosity [14,15]. Initially, the ions disrupt the water struc-ture as their structure breaking action while the molecules regain andcatalyzed by the ions to surround them and develop ion hydration asa specific state function. On an increasing concentration of salts, the sur-face tensions and viscosities have increased while an increase in tem-perature, the surface tensions and viscosities has decreased (Table 4).
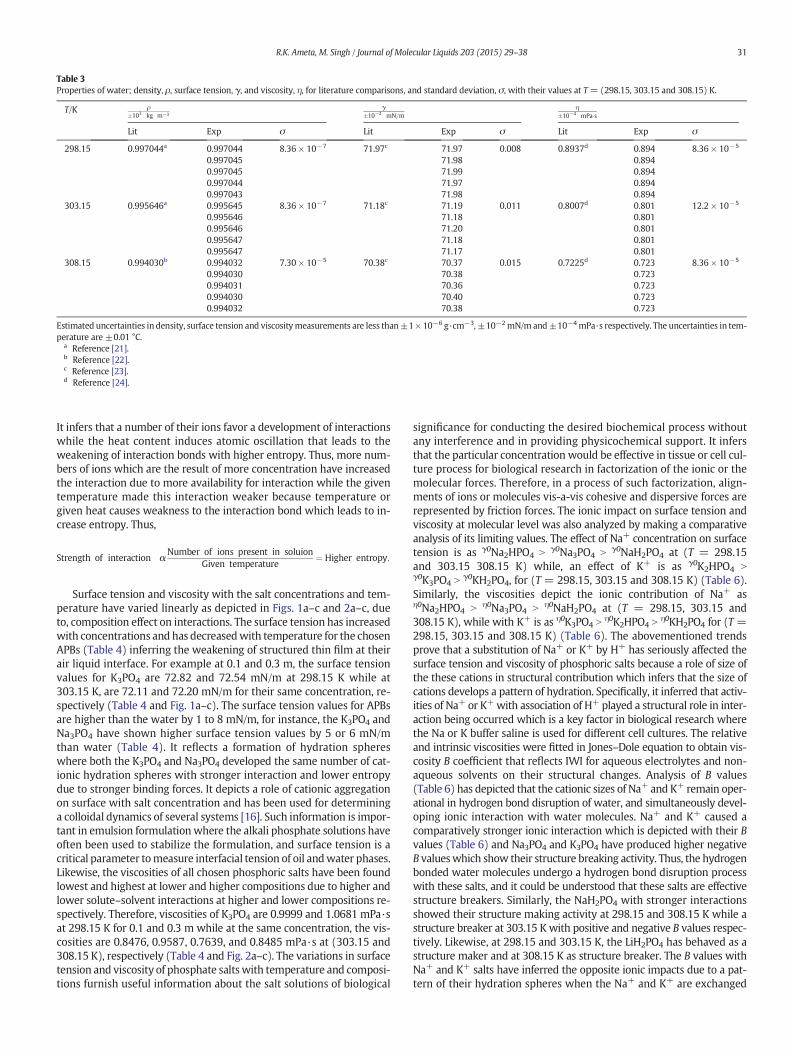
Table 3Properties of water; density, ρ, surface tension, γ, and viscosity, η, for literature comparisons, and standard deviation, σ, with their values at T = (298.15, 303.15 and 308.15) K.
T/K ρ�103 kg m−3
γ�10−2 mN=m
η�10−4 mPa�s
Lit Exp σ Lit Exp σ Lit Exp σ
298.15 0.997044a 0.997044 8.36 × 10⁻⁷ 71.97c 71.97 0.008 0.8937d 0.894 8.36 × 10⁻⁵
0.997045 71.98 0.8940.997045 71.99 0.8940.997044 71.97 0.8940.997043 71.98 0.894
303.15 0.995646a 0.995645 8.36 × 10⁻⁷ 71.18c 71.19 0.011 0.8007d 0.801 12.2 × 10⁻⁵
0.995646 71.18 0.8010.995646 71.20 0.8010.995647 71.18 0.8010.995647 71.17 0.801
308.15 0.994030b 0.994032 7.30 × 10⁻⁵ 70.38c 70.37 0.015 0.7225d 0.723 8.36 × 10⁻⁵
0.994030 70.38 0.7230.994031 70.36 0.7230.994030 70.40 0.7230.994032 70.38 0.723
Estimated uncertainties in density, surface tension and viscositymeasurements are less than±1× 10⁻⁶ g·cm−3, ±10−2mN/m and±10−4mPa·s respectively. The uncertainties in tem-perature are ±0.01 °C.
a Reference [21].b Reference [22].c Reference [23].d Reference [24].
31R.K. Ameta, M. Singh / Journal of Molecular Liquids 203 (2015) 29–38
It infers that a number of their ions favor a development of interactionswhile the heat content induces atomic oscillation that leads to theweakening of interaction bonds with higher entropy. Thus, more num-bers of ions which are the result of more concentration have increasedthe interaction due to more availability for interaction while the giventemperature made this interaction weaker because temperature orgiven heat causes weakness to the interaction bond which leads to in-crease entropy. Thus,
Strength of interaction αNumber of ions present in soluion
Given temperature¼ Higher entropy:
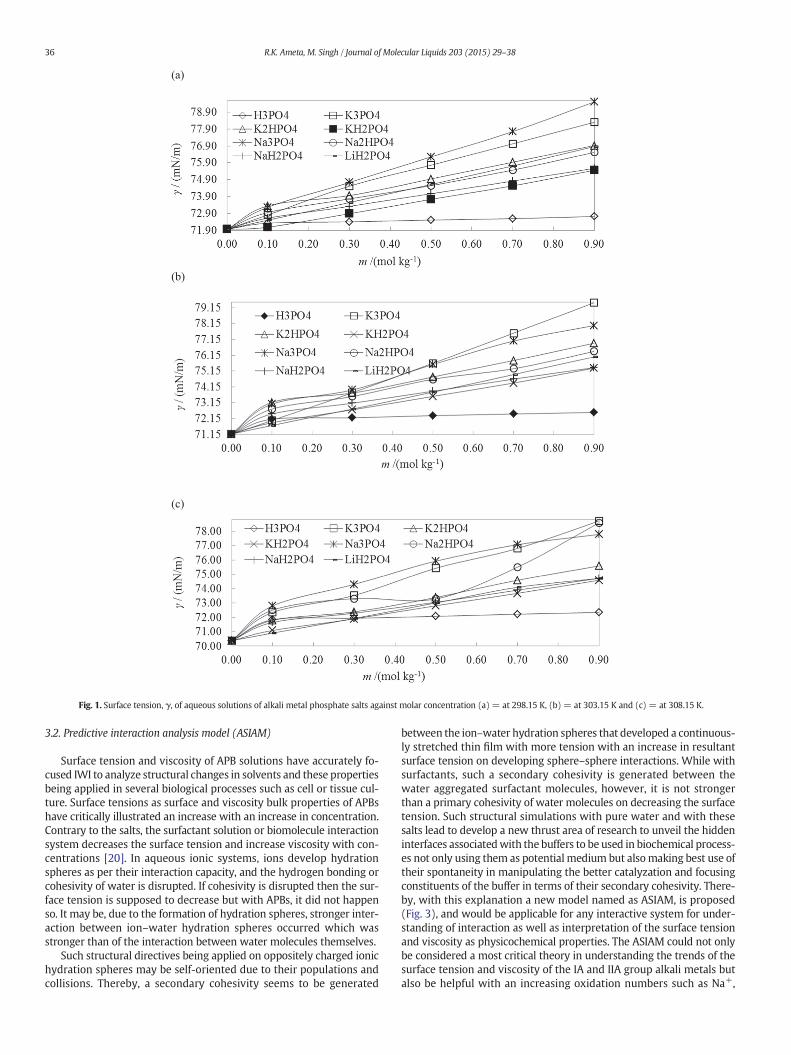
Surface tension and viscosity with the salt concentrations and tem-perature have varied linearly as depicted in Figs. 1a–c and 2a–c, dueto, composition effect on interactions. The surface tension has increasedwith concentrations and has decreasedwith temperature for the chosenAPBs (Table 4) inferring the weakening of structured thin film at theirair liquid interface. For example at 0.1 and 0.3 m, the surface tensionvalues for K3PO4 are 72.82 and 72.54 mN/m at 298.15 K while at303.15 K, are 72.11 and 72.20 mN/m for their same concentration, re-spectively (Table 4 and Fig. 1a–c). The surface tension values for APBsare higher than the water by 1 to 8 mN/m, for instance, the K3PO4 andNa3PO4 have shown higher surface tension values by 5 or 6 mN/mthan water (Table 4). It reflects a formation of hydration sphereswhere both the K3PO4 and Na3PO4 developed the same number of cat-ionic hydration spheres with stronger interaction and lower entropydue to stronger binding forces. It depicts a role of cationic aggregationon surface with salt concentration and has been used for determininga colloidal dynamics of several systems [16]. Such information is impor-tant in emulsion formulationwhere the alkali phosphate solutions haveoften been used to stabilize the formulation, and surface tension is acritical parameter tomeasure interfacial tension of oil andwater phases.Likewise, the viscosities of all chosen phosphoric salts have been foundlowest and highest at lower and higher compositions due to higher andlower solute–solvent interactions at higher and lower compositions re-spectively. Therefore, viscosities of K3PO4 are 0.9999 and 1.0681 mPa·sat 298.15 K for 0.1 and 0.3 m while at the same concentration, the vis-cosities are 0.8476, 0.9587, 0.7639, and 0.8485 mPa·s at (303.15 and308.15 K), respectively (Table 4 and Fig. 2a–c). The variations in surfacetension and viscosity of phosphate saltswith temperature and composi-tions furnish useful information about the salt solutions of biological
significance for conducting the desired biochemical process withoutany interference and in providing physicochemical support. It infersthat the particular concentration would be effective in tissue or cell cul-ture process for biological research in factorization of the ionic or themolecular forces. Therefore, in a process of such factorization, align-ments of ions or molecules vis-a-vis cohesive and dispersive forces arerepresented by friction forces. The ionic impact on surface tension andviscosity at molecular level was also analyzed by making a comparativeanalysis of its limiting values. The effect of Na+ concentration on surfacetension is as γ0Na2HPO4 N γ0Na3PO4 N γ0NaH2PO4 at (T = 298.15and 303.15 308.15 K) while, an effect of K+ is as γ0K2HPO4 Nγ0K3PO4 N
γ0KH2PO4, for (T = 298.15, 303.15 and 308.15 K) (Table 6).Similarly, the viscosities depict the ionic contribution of Na+ asη0Na2HPO4 N η0Na3PO4 N η0NaH2PO4 at (T = 298.15, 303.15 and308.15 K), while with K+ is as η0K3PO4 N
η0K2HPO4 Nη0KH2PO4 for (T =
298.15, 303.15 and 308.15 K) (Table 6). The abovementioned trendsprove that a substitution of Na+ or K+ by H+ has seriously affected thesurface tension and viscosity of phosphoric salts because a role of size ofthe these cations in structural contribution which infers that the size ofcations develops a pattern of hydration. Specifically, it inferred that activ-ities of Na+ or K+with association of H+ played a structural role in inter-action being occurred which is a key factor in biological research wherethe Na or K buffer saline is used for different cell cultures. The relativeand intrinsic viscosities were fitted in Jones–Dole equation to obtain vis-cosity B coefficient that reflects IWI for aqueous electrolytes and non-aqueous solvents on their structural changes. Analysis of B values(Table 6) has depicted that the cationic sizes of Na+ and K+ remain oper-ational in hydrogen bond disruption of water, and simultaneously devel-oping ionic interaction with water molecules. Na+ and K+ caused acomparatively stronger ionic interaction which is depicted with their Bvalues (Table 6) and Na3PO4 and K3PO4 have produced higher negativeB valueswhich show their structure breaking activity. Thus, the hydrogenbonded water molecules undergo a hydrogen bond disruption processwith these salts, and it could be understood that these salts are effectivestructure breakers. Similarly, the NaH2PO4 with stronger interactionsshowed their structure making activity at 298.15 and 308.15 K while astructure breaker at 303.15 K with positive and negative B values respec-tively. Likewise, at 298.15 and 303.15 K, the LiH2PO4 has behaved as astructure maker and at 308.15 K as structure breaker. The B values withNa+ and K+ salts have inferred the opposite ionic impacts due to a pat-tern of their hydration spheres when the Na+ and K+ are exchanged
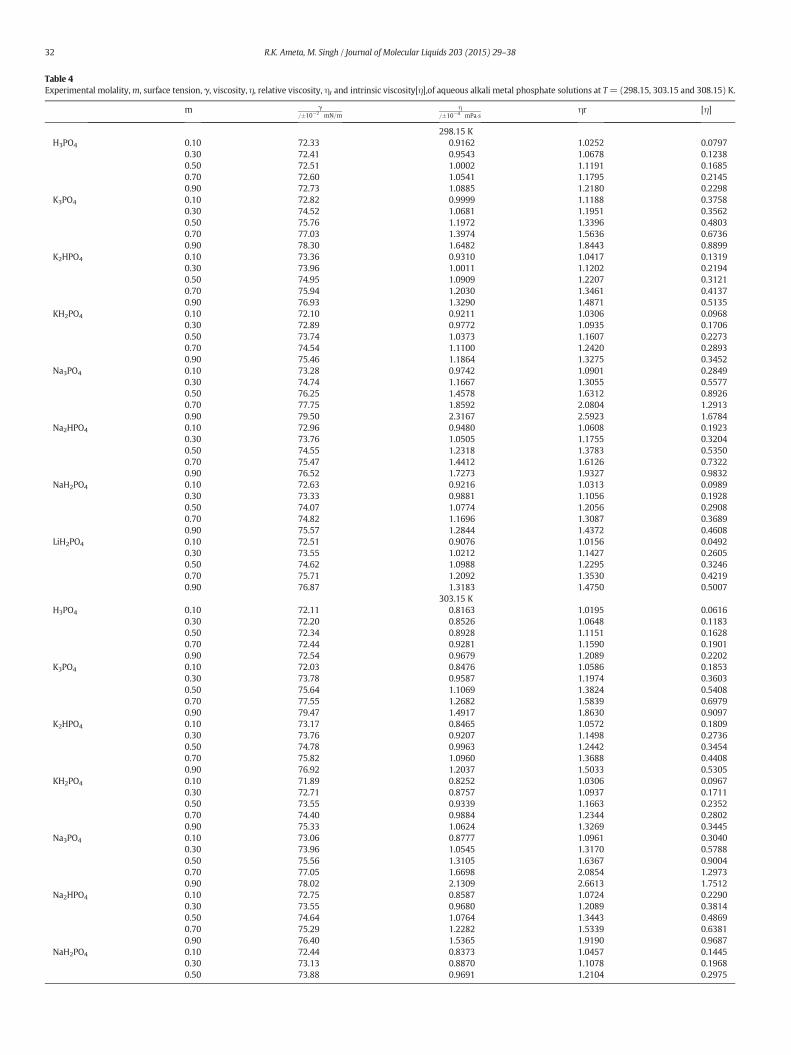
Table 4Experimental molality,m, surface tension, γ, viscosity, η, relative viscosity, ηr and intrinsic viscosity[η],of aqueous alkali metal phosphate solutions at T= (298.15, 303.15 and 308.15) K.
m γ=�10−2 mN=m
η=�10−4 mPa�s ηr [η]
298.15 KH3PO4 0.10 72.33 0.9162 1.0252 0.0797
0.30 72.41 0.9543 1.0678 0.12380.50 72.51 1.0002 1.1191 0.16850.70 72.60 1.0541 1.1795 0.21450.90 72.73 1.0885 1.2180 0.2298
K3PO4 0.10 72.82 0.9999 1.1188 0.37580.30 74.52 1.0681 1.1951 0.35620.50 75.76 1.1972 1.3396 0.48030.70 77.03 1.3974 1.5636 0.67360.90 78.30 1.6482 1.8443 0.8899
K2HPO4 0.10 73.36 0.9310 1.0417 0.13190.30 73.96 1.0011 1.1202 0.21940.50 74.95 1.0909 1.2207 0.31210.70 75.94 1.2030 1.3461 0.41370.90 76.93 1.3290 1.4871 0.5135
KH2PO4 0.10 72.10 0.9211 1.0306 0.09680.30 72.89 0.9772 1.0935 0.17060.50 73.74 1.0373 1.1607 0.22730.70 74.54 1.1100 1.2420 0.28930.90 75.46 1.1864 1.3275 0.3452
Na3PO4 0.10 73.28 0.9742 1.0901 0.28490.30 74.74 1.1667 1.3055 0.55770.50 76.25 1.4578 1.6312 0.89260.70 77.75 1.8592 2.0804 1.29130.90 79.50 2.3167 2.5923 1.6784
Na2HPO4 0.10 72.96 0.9480 1.0608 0.19230.30 73.76 1.0505 1.1755 0.32040.50 74.55 1.2318 1.3783 0.53500.70 75.47 1.4412 1.6126 0.73220.90 76.52 1.7273 1.9327 0.9832
NaH2PO4 0.10 72.63 0.9216 1.0313 0.09890.30 73.33 0.9881 1.1056 0.19280.50 74.07 1.0774 1.2056 0.29080.70 74.82 1.1696 1.3087 0.36890.90 75.57 1.2844 1.4372 0.4608
LiH2PO4 0.10 72.51 0.9076 1.0156 0.04920.30 73.55 1.0212 1.1427 0.26050.50 74.62 1.0988 1.2295 0.32460.70 75.71 1.2092 1.3530 0.42190.90 76.87 1.3183 1.4750 0.5007
303.15 KH3PO4 0.10 72.11 0.8163 1.0195 0.0616
0.30 72.20 0.8526 1.0648 0.11830.50 72.34 0.8928 1.1151 0.16280.70 72.44 0.9281 1.1590 0.19010.90 72.54 0.9679 1.2089 0.2202
K3PO4 0.10 72.03 0.8476 1.0586 0.18530.30 73.78 0.9587 1.1974 0.36030.50 75.64 1.1069 1.3824 0.54080.70 77.55 1.2682 1.5839 0.69790.90 79.47 1.4917 1.8630 0.9097
K2HPO4 0.10 73.17 0.8465 1.0572 0.18090.30 73.76 0.9207 1.1498 0.27360.50 74.78 0.9963 1.2442 0.34540.70 75.82 1.0960 1.3688 0.44080.90 76.92 1.2037 1.5033 0.5305
KH2PO4 0.10 71.89 0.8252 1.0306 0.09670.30 72.71 0.8757 1.0937 0.17110.50 73.55 0.9339 1.1663 0.23520.70 74.40 0.9884 1.2344 0.28020.90 75.33 1.0624 1.3269 0.3445
Na3PO4 0.10 73.06 0.8777 1.0961 0.30400.30 73.96 1.0545 1.3170 0.57880.50 75.56 1.3105 1.6367 0.90040.70 77.05 1.6698 2.0854 1.29730.90 78.02 2.1309 2.6613 1.7512
Na2HPO4 0.10 72.75 0.8587 1.0724 0.22900.30 73.55 0.9680 1.2089 0.38140.50 74.64 1.0764 1.3443 0.48690.70 75.29 1.2282 1.5339 0.63810.90 76.40 1.5365 1.9190 0.9687
NaH2PO4 0.10 72.44 0.8373 1.0457 0.14450.30 73.13 0.8870 1.1078 0.19680.50 73.88 0.9691 1.2104 0.2975
32 R.K. Ameta, M. Singh / Journal of Molecular Liquids 203 (2015) 29–38
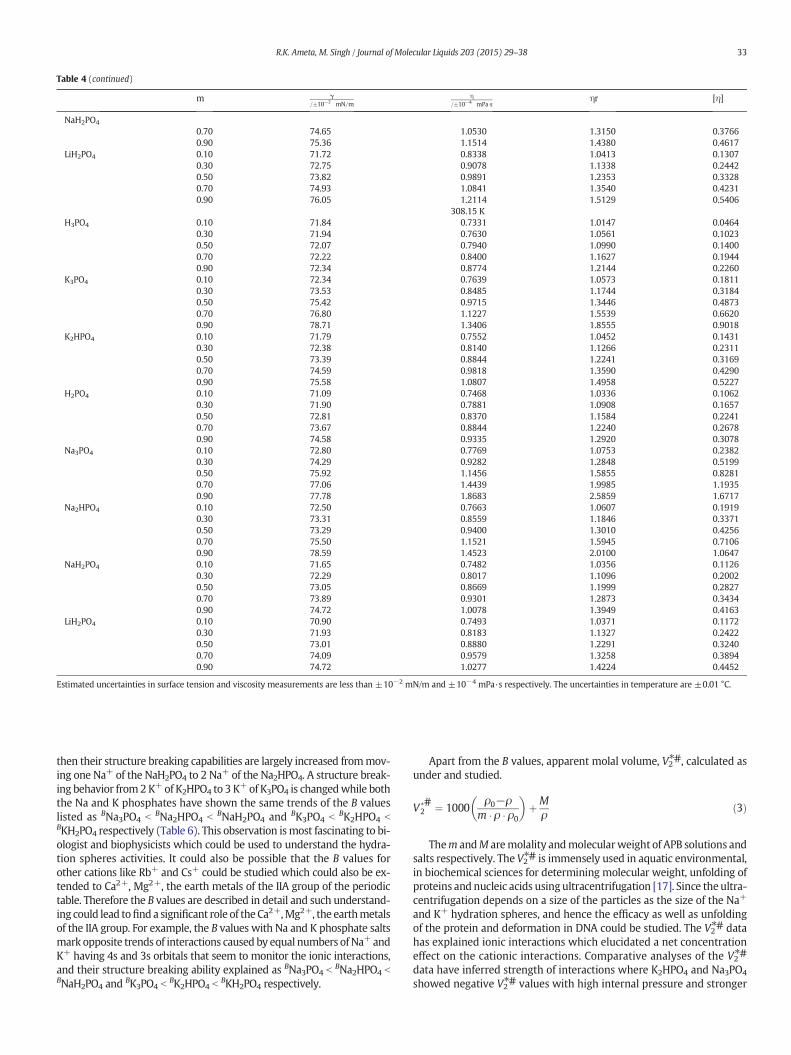
Table 4 (continued)
m γ=�10−2 mN=m
η=�10−4 mPa�s ηr [η]
NaH2PO4
0.70 74.65 1.0530 1.3150 0.37660.90 75.36 1.1514 1.4380 0.4617
LiH2PO4 0.10 71.72 0.8338 1.0413 0.13070.30 72.75 0.9078 1.1338 0.24420.50 73.82 0.9891 1.2353 0.33280.70 74.93 1.0841 1.3540 0.42310.90 76.05 1.2114 1.5129 0.5406
308.15 KH3PO4 0.10 71.84 0.7331 1.0147 0.0464
0.30 71.94 0.7630 1.0561 0.10230.50 72.07 0.7940 1.0990 0.14000.70 72.22 0.8400 1.1627 0.19440.90 72.34 0.8774 1.2144 0.2260
K3PO4 0.10 72.34 0.7639 1.0573 0.18110.30 73.53 0.8485 1.1744 0.31840.50 75.42 0.9715 1.3446 0.48730.70 76.80 1.1227 1.5539 0.66200.90 78.71 1.3406 1.8555 0.9018
K2HPO4 0.10 71.79 0.7552 1.0452 0.14310.30 72.38 0.8140 1.1266 0.23110.50 73.39 0.8844 1.2241 0.31690.70 74.59 0.9818 1.3590 0.42900.90 75.58 1.0807 1.4958 0.5227
H2PO4 0.10 71.09 0.7468 1.0336 0.10620.30 71.90 0.7881 1.0908 0.16570.50 72.81 0.8370 1.1584 0.22410.70 73.67 0.8844 1.2240 0.26780.90 74.58 0.9335 1.2920 0.3078
Na3PO4 0.10 72.80 0.7769 1.0753 0.23820.30 74.29 0.9282 1.2848 0.51990.50 75.92 1.1456 1.5855 0.82810.70 77.06 1.4439 1.9985 1.19350.90 77.78 1.8683 2.5859 1.6717
Na2HPO4 0.10 72.50 0.7663 1.0607 0.19190.30 73.31 0.8559 1.1846 0.33710.50 73.29 0.9400 1.3010 0.42560.70 75.50 1.1521 1.5945 0.71060.90 78.59 1.4523 2.0100 1.0647
NaH2PO4 0.10 71.65 0.7482 1.0356 0.11260.30 72.29 0.8017 1.1096 0.20020.50 73.05 0.8669 1.1999 0.28270.70 73.89 0.9301 1.2873 0.34340.90 74.72 1.0078 1.3949 0.4163
LiH2PO4 0.10 70.90 0.7493 1.0371 0.11720.30 71.93 0.8183 1.1327 0.24220.50 73.01 0.8880 1.2291 0.32400.70 74.09 0.9579 1.3258 0.38940.90 74.72 1.0277 1.4224 0.4452
Estimated uncertainties in surface tension and viscosity measurements are less than ±10−2 mN/m and ±10−4 mPa·s respectively. The uncertainties in temperature are ±0.01 °C.
33R.K. Ameta, M. Singh / Journal of Molecular Liquids 203 (2015) 29–38
then their structure breaking capabilities are largely increased frommov-ing one Na+ of the NaH2PO4 to 2 Na+ of the Na2HPO4. A structure break-ing behavior from2K+of K2HPO4 to 3 K+ of K3PO4 is changedwhile boththe Na and K phosphates have shown the same trends of the B valueslisted as BNa3PO4 b BNa2HPO4 b BNaH2PO4 and BK3PO4 b BK2HPO4 bBKH2PO4 respectively (Table 6). This observation ismost fascinating to bi-ologist and biophysicists which could be used to understand the hydra-tion spheres activities. It could also be possible that the B values forother cations like Rb+ and Cs+ could be studied which could also be ex-tended to Ca2+, Mg2+, the earth metals of the IIA group of the periodictable. Therefore the B values are described in detail and such understand-ing could lead tofind a significant role of the Ca2+,Mg2+, the earthmetalsof the IIA group. For example, the B values with Na and K phosphate saltsmark opposite trends of interactions caused by equal numbers ofNa+andK+ having 4s and 3s orbitals that seem to monitor the ionic interactions,and their structure breaking ability explained as BNa3PO4 b
BNa2HPO4 bBNaH2PO4 and BK3PO4 b
BK2HPO4 bBKH2PO4 respectively.
Apart from the B values, apparent molal volume, V2⁎#, calculated asunder and studied.
V�#2 ¼ 1000
ρ0−ρm � ρ � ρ0
� �þM
ρð3Þ
Them andM aremolality andmolecularweight of APB solutions andsalts respectively. The V2⁎# is immensely used in aquatic environmental,in biochemical sciences for determining molecular weight, unfolding ofproteins andnucleic acids usingultracentrifugation [17]. Since theultra-centrifugation depends on a size of the particles as the size of the Na+
and K+ hydration spheres, and hence the efficacy as well as unfoldingof the protein and deformation in DNA could be studied. The V2⁎# datahas explained ionic interactions which elucidated a net concentrationeffect on the cationic interactions. Comparative analyses of the V2⁎#
data have inferred strength of interactions where K2HPO4 and Na3PO4
showed negative V2⁎# values with high internal pressure and stronger
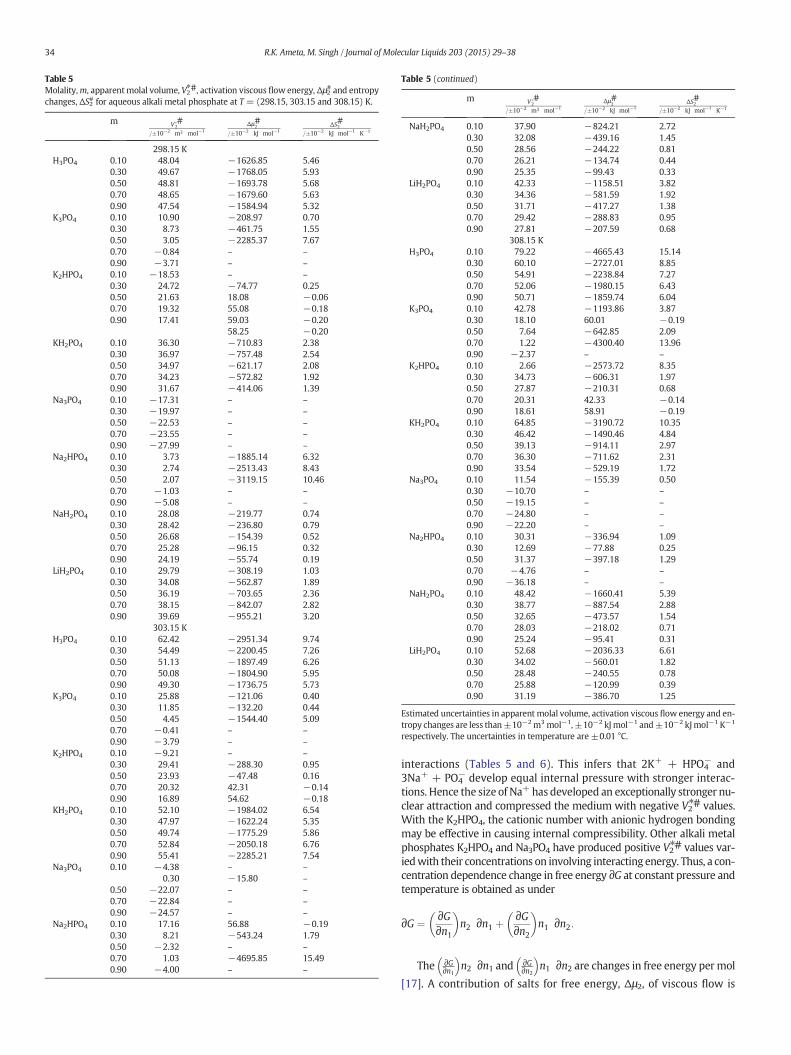
Table 5Molality,m, apparentmolal volume, V2⁎#, activation viscous flow energy, Δμ2# and entropychanges, ΔS2# for aqueous alkali metal phosphate at T = (298.15, 303.15 and 308.15) K.
m V�#2
=�10−2 m3 mol−1Δμ#2
=�10−2 kJ mol−1ΔS#2
=�10−2 kJ mol−1 K−1
298.15 KH3PO4 0.10 48.04 −1626.85 5.46
0.30 49.67 −1768.05 5.930.50 48.81 −1693.78 5.680.70 48.65 −1679.60 5.630.90 47.54 −1584.94 5.32
K3PO4 0.10 10.90 −208.97 0.700.30 8.73 −461.75 1.550.50 3.05 −2285.37 7.670.70 −0.84 – –
0.90 −3.71 – –
K2HPO4 0.10 −18.53 – –
0.30 24.72 −74.77 0.250.50 21.63 18.08 −0.060.70 19.32 55.08 −0.180.90 17.41 59.03 −0.20
58.25 −0.20KH2PO4 0.10 36.30 −710.83 2.38
0.30 36.97 −757.48 2.540.50 34.97 −621.17 2.080.70 34.23 −572.82 1.920.90 31.67 −414.06 1.39
Na3PO4 0.10 −17.31 – –
0.30 −19.97 – –
0.50 −22.53 – –
0.70 −23.55 – –
0.90 −27.99 – –
Na2HPO4 0.10 3.73 −1885.14 6.320.30 2.74 −2513.43 8.430.50 2.07 −3119.15 10.460.70 −1.03 – –
0.90 −5.08 – –
NaH2PO4 0.10 28.08 −219.77 0.740.30 28.42 −236.80 0.790.50 26.68 −154.39 0.520.70 25.28 −96.15 0.320.90 24.19 −55.74 0.19
LiH2PO4 0.10 29.79 −308.19 1.030.30 34.08 −562.87 1.890.50 36.19 −703.65 2.360.70 38.15 −842.07 2.820.90 39.69 −955.21 3.20
303.15 KH3PO4 0.10 62.42 −2951.34 9.74
0.30 54.49 −2200.45 7.260.50 51.13 −1897.49 6.260.70 50.08 −1804.90 5.950.90 49.30 −1736.75 5.73
K3PO4 0.10 25.88 −121.06 0.400.30 11.85 −132.20 0.440.50 4.45 −1544.40 5.090.70 −0.41 – –
0.90 −3.79 – –
K2HPO4 0.10 −9.21 – –
0.30 29.41 −288.30 0.950.50 23.93 −47.48 0.160.70 20.32 42.31 −0.140.90 16.89 54.62 −0.18
KH2PO4 0.10 52.10 −1984.02 6.540.30 47.97 −1622.24 5.350.50 49.74 −1775.29 5.860.70 52.84 −2050.18 6.760.90 55.41 −2285.21 7.54
Na3PO4 0.10 −4.38 – –
0.30 −15.80 –
0.50 −22.07 – –
0.70 −22.84 – –
0.90 −24.57 – –
Na2HPO4 0.10 17.16 56.88 −0.190.30 8.21 −543.24 1.790.50 −2.32 – –
0.70 1.03 −4695.85 15.490.90 −4.00 – –
Table 5 (continued)
m V�#2
=�10−2 m3 mol−1Δμ#2
=�10−2 kJ mol−1ΔS#2
=�10−2 kJ mol−1 K−1
NaH2PO4 0.10 37.90 −824.21 2.720.30 32.08 −439.16 1.450.50 28.56 −244.22 0.810.70 26.21 −134.74 0.440.90 25.35 −99.43 0.33
LiH2PO4 0.10 42.33 −1158.51 3.820.30 34.36 −581.59 1.920.50 31.71 −417.27 1.380.70 29.42 −288.83 0.950.90 27.81 −207.59 0.68
308.15 KH3PO4 0.10 79.22 −4665.43 15.14
0.30 60.10 −2727.01 8.850.50 54.91 −2238.84 7.270.70 52.06 −1980.15 6.430.90 50.71 −1859.74 6.04
K3PO4 0.10 42.78 −1193.86 3.870.30 18.10 60.01 −0.190.50 7.64 −642.85 2.090.70 1.22 −4300.40 13.960.90 −2.37 – –
K2HPO4 0.10 2.66 −2573.72 8.350.30 34.73 −606.31 1.970.50 27.87 −210.31 0.680.70 20.31 42.33 −0.140.90 18.61 58.91 −0.19
KH2PO4 0.10 64.85 −3190.72 10.350.30 46.42 −1490.46 4.840.50 39.13 −914.11 2.970.70 36.30 −711.62 2.310.90 33.54 −529.19 1.72
Na3PO4 0.10 11.54 −155.39 0.500.30 −10.70 – –
0.50 −19.15 – –
0.70 −24.80 – –
0.90 −22.20 – –
Na2HPO4 0.10 30.31 −336.94 1.090.30 12.69 −77.88 0.250.50 31.37 −397.18 1.290.70 −4.76 – –
0.90 −36.18 – –
NaH2PO4 0.10 48.42 −1660.41 5.390.30 38.77 −887.54 2.880.50 32.65 −473.57 1.540.70 28.03 −218.02 0.710.90 25.24 −95.41 0.31
LiH2PO4 0.10 52.68 −2036.33 6.610.30 34.02 −560.01 1.820.50 28.48 −240.55 0.780.70 25.88 −120.99 0.390.90 31.19 −386.70 1.25
Estimated uncertainties in apparent molal volume, activation viscous flow energy and en-tropy changes are less than±10−2m3 mol−1, ±10−2 kJmol−1 and±10−2 kJmol−1 K−1
respectively. The uncertainties in temperature are ±0.01 °C.
34 R.K. Ameta, M. Singh / Journal of Molecular Liquids 203 (2015) 29–38
interactions (Tables 5 and 6). This infers that 2K+ + HPO4− and
3Na+ + PO4− develop equal internal pressure with stronger interac-
tions. Hence the size of Na+ has developed an exceptionally stronger nu-clear attraction and compressed the medium with negative V2⁎# values.With the K2HPO4, the cationic number with anionic hydrogen bondingmay be effective in causing internal compressibility. Other alkali metalphosphates K2HPO4 and Na3PO4 have produced positive V2⁎# values var-iedwith their concentrations on involving interacting energy. Thus, a con-centration dependence change in free energy ∂G at constant pressure andtemperature is obtained as under
∂G ¼ ∂G∂n1
� �n2 ∂n1 þ
∂G∂n2
� �n1 ∂n2:
The ∂G∂n1
� �n2 ∂n1 and ∂G
∂n2
� �n1 ∂n2 are changes in free energy permol
[17]. A contribution of salts for free energy, Δμ2, of viscous flow is
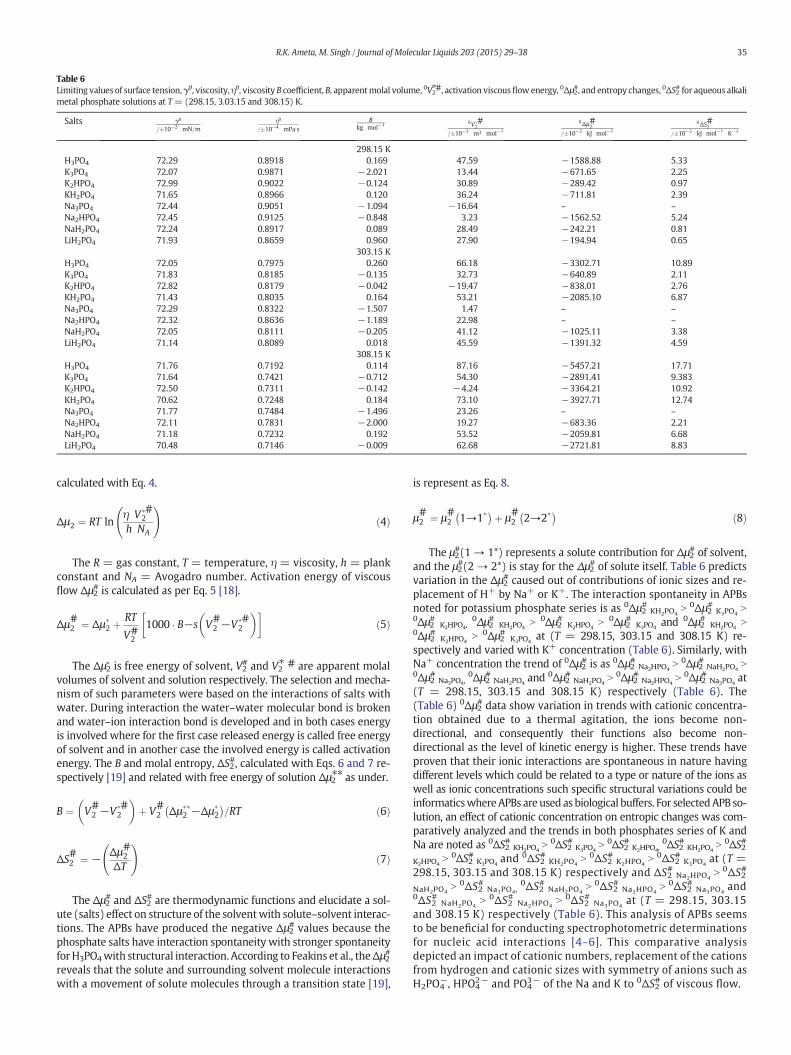
Table 6Limiting values of surface tension,γ0, viscosity,η0, viscosity B coefficient, B, apparentmolal volume, 0V2⁎#, activation viscousflow energy, 0Δμ2#, and entropy changes, 0ΔS2# for aqueous alkalimetal phosphate solutions at T = (298.15, 3.03.15 and 308.15) K.
Salts γ0
=�10−2 mN=mη0
=�10−4 mPa�sB
kg mol−10V�#
2
=�10−2 m3 mol−1
0Δμ#2=�10−2 kJ mol−1
0ΔS#2=�10−2 kJ mol−1 K−1
298.15 KH3PO4 72.29 0.8918 0.169 47.59 −1588.88 5.33K3PO4 72.07 0.9871 −2.021 13.44 −671.65 2.25K2HPO4 72.99 0.9022 −0.124 30.89 −289.42 0.97KH2PO4 71.65 0.8966 0.120 36.24 −711.81 2.39Na3PO4 72.44 0.9051 −1.094 −16.64 – –
Na2HPO4 72.45 0.9125 −0.848 3.23 −1562.52 5.24NaH2PO4 72.24 0.8917 0.089 28.49 −242.21 0.81LiH2PO4 71.93 0.8659 0.960 27.90 −194.94 0.65
303.15 KH3PO4 72.05 0.7975 0.260 66.18 −3302.71 10.89K3PO4 71.83 0.8185 −0.135 32.73 −640.89 2.11K2HPO4 72.82 0.8179 −0.042 −19.47 −838.01 2.76KH2PO4 71.43 0.8035 0.164 53.21 −2085.10 6.87Na3PO4 72.29 0.8322 −1.507 1.47 – –
Na2HPO4 72.32 0.8636 −1.189 22.98 – –
NaH2PO4 72.05 0.8111 −0.205 41.12 −1025.11 3.38LiH2PO4 71.14 0.8089 0.018 45.59 −1391.32 4.59
308.15 KH3PO4 71.76 0.7192 0.114 87.16 −5457.21 17.71K3PO4 71.64 0.7421 −0.712 54.30 −2891.41 9.383K2HPO4 72.50 0.7311 −0.142 −4.24 −3364.21 10.92KH2PO4 70.62 0.7248 0.184 73.10 −3927.71 12.74Na3PO4 71.77 0.7484 −1.496 23.26 – –
Na2HPO4 72.11 0.7831 −2.000 19.27 −683.36 2.21NaH2PO4 71.18 0.7232 0.192 53.52 −2059.81 6.68LiH2PO4 70.48 0.7146 −0.009 62.68 −2721.81 8.83
35R.K. Ameta, M. Singh / Journal of Molecular Liquids 203 (2015) 29–38
calculated with Eq. 4.
Δμ2 ¼ RT lnη V�#
2
h NA
!ð4Þ
The R = gas constant, T = temperature, η = viscosity, h = plankconstant and NA = Avogadro number. Activation energy of viscousflow Δμ2# is calculated as per Eq. 5 [18].
Δμ#2 ¼ Δμ�2 þ
RT
V#21000 � B−s V#2 −V�#
2
� �� �ð5Þ
The Δμ2∗ is free energy of solvent, V2# and V2⁎ # are apparent molal
volumes of solvent and solution respectively. The selection and mecha-nism of such parameters were based on the interactions of salts withwater. During interaction the water–water molecular bond is brokenand water–ion interaction bond is developed and in both cases energyis involved where for the first case released energy is called free energyof solvent and in another case the involved energy is called activationenergy. The B and molal entropy, ΔS2#, calculated with Eqs. 6 and 7 re-spectively [19] and related with free energy of solution Δμ2⁎⁎ as under.
B ¼ V#2 −V�#2
� �þ V#2 Δμ��
2 −Δμ�2
� =RT ð6Þ
ΔS#2 ¼ − Δμ#2ΔT
!ð7Þ
The Δμ2# and ΔS2# are thermodynamic functions and elucidate a sol-ute (salts) effect on structure of the solventwith solute–solvent interac-tions. The APBs have produced the negative Δμ2# values because thephosphate salts have interaction spontaneity with stronger spontaneityforH3PO4with structural interaction. According to Feakins et al., theΔμ2#
reveals that the solute and surrounding solvent molecule interactionswith a movement of solute molecules through a transition state [19],
is represent as Eq. 8.
μ#2 ¼ μ#2 1→1�� þ μ#2 2→2�� ð8Þ
The μ2#(1 → 1*) represents a solute contribution for Δμ2# of solvent,and the μ2#(2 → 2*) is stay for the Δμ2# of solute itself. Table 6 predictsvariation in the Δμ2# caused out of contributions of ionic sizes and re-placement of H+ by Na+ or K+. The interaction spontaneity in APBsnoted for potassium phosphate series is as 0Δμ2# KH2PO4
N 0Δμ2# K3PO4N
0Δμ2# K2HPO4,0Δμ2# KH2PO4
N 0Δμ2# K2HPO4N 0Δμ2# K3PO4
and 0Δμ2# KH2PO4N
0Δμ2# K2HPO4N 0Δμ2# K3PO4
at (T = 298.15, 303.15 and 308.15 K) re-spectively and varied with K+ concentration (Table 6). Similarly, withNa+ concentration the trend of 0Δμ2# is as 0Δμ2# Na2HPO4
N 0Δμ2# NaH2PO4N
0Δμ2# Na3PO4,0Δμ2# NaH2PO4
and 0Δμ2# NaH2PO4N 0Δμ2# Na2HPO4
N 0Δμ2# Na3PO4at
(T = 298.15, 303.15 and 308.15 K) respectively (Table 6). The(Table 6) 0Δμ2# data show variation in trends with cationic concentra-tion obtained due to a thermal agitation, the ions become non-directional, and consequently their functions also become non-directional as the level of kinetic energy is higher. These trends haveproven that their ionic interactions are spontaneous in nature havingdifferent levels which could be related to a type or nature of the ions aswell as ionic concentrations such specific structural variations could beinformaticswhereAPBs are used as biological buffers. For selectedAPB so-lution, an effect of cationic concentration on entropic changes was com-paratively analyzed and the trends in both phosphates series of K andNa are noted as 0ΔS2# KH2PO4
N 0ΔS2# K3PO4N 0ΔS2# K2HPO4,
0ΔS2# KH2PO4N 0ΔS2#
K2HPO4N 0ΔS2# K3PO4
and 0ΔS2# KH2PO4N 0ΔS2# K2HPO4
N 0ΔS2# K3PO4at (T =
298.15, 303.15 and 308.15 K) respectively and ΔS2# Na2HPO4N 0ΔS2#
NaH2PO4N 0ΔS2# Na3PO4,
0ΔS2# NaH2PO4N 0ΔS2# Na2HPO4
N 0ΔS2# Na3PO4and
0ΔS2#
NaH2PO4N 0ΔS2# Na2HPO4
N 0ΔS2#
Na3PO4at (T = 298.15, 303.15
and 308.15 K) respectively (Table 6). This analysis of APBs seemsto be beneficial for conducting spectrophotometric determinationsfor nucleic acid interactions [4–6]. This comparative analysisdepicted an impact of cationic numbers, replacement of the cationsfrom hydrogen and cationic sizes with symmetry of anions such asH2PO4
−, HPO42− and PO4
3− of the Na and K to 0ΔS2# of viscous flow.
(a)
(b)
(c)
Fig. 1. Surface tension, γ, of aqueous solutions of alkali metal phosphate salts against molar concentration (a) = at 298.15 K, (b) = at 303.15 K and (c) = at 308.15 K.
36 R.K. Ameta, M. Singh / Journal of Molecular Liquids 203 (2015) 29–38
3.2. Predictive interaction analysis model (ASIAM)
Surface tension and viscosity of APB solutions have accurately fo-cused IWI to analyze structural changes in solvents and these propertiesbeing applied in several biological processes such as cell or tissue cul-ture. Surface tensions as surface and viscosity bulk properties of APBshave critically illustrated an increase with an increase in concentration.Contrary to the salts, the surfactant solution or biomolecule interactionsystem decreases the surface tension and increase viscosity with con-centrations [20]. In aqueous ionic systems, ions develop hydrationspheres as per their interaction capacity, and the hydrogen bonding orcohesivity of water is disrupted. If cohesivity is disrupted then the sur-face tension is supposed to decrease but with APBs, it did not happenso. It may be, due to the formation of hydration spheres, stronger inter-action between ion–water hydration spheres occurred which wasstronger than of the interaction between water molecules themselves.
Such structural directives being applied on oppositely charged ionichydration spheres may be self-oriented due to their populations andcollisions. Thereby, a secondary cohesivity seems to be generated
between the ion–water hydration spheres that developed a continuous-ly stretched thin film with more tension with an increase in resultantsurface tension on developing sphere–sphere interactions. While withsurfactants, such a secondary cohesivity is generated between thewater aggregated surfactant molecules, however, it is not strongerthan a primary cohesivity of water molecules on decreasing the surfacetension. Such structural simulations with pure water and with thesesalts lead to develop a new thrust area of research to unveil the hiddeninterfaces associatedwith the buffers to be used in biochemical process-es not only using them as potential medium but alsomaking best use oftheir spontaneity in manipulating the better catalyzation and focusingconstituents of the buffer in terms of their secondary cohesivity. There-by, with this explanation a new model named as ASIAM, is proposed(Fig. 3), and would be applicable for any interactive system for under-standing of interaction as well as interpretation of the surface tensionand viscosity as physicochemical properties. The ASIAM could not onlybe considered a most critical theory in understanding the trends of thesurface tension and viscosity of the IA and IIA group alkali metals butalso be helpful with an increasing oxidation numbers such as Na+,
(a)
(b)
(c)
0.72200.92201.12201.32201.52201.7220
0.00 0.10 0.20 0.30 0.40 0.50 0.60 0.70 0.80 0.90
η/ (m
Pa.s)
m /(mol kg-1)
H3PO4 K3PO4 K2HPO4KH2PO4 Na3PO4 Na2HPO4NaH2PO4 LiH2PO4
Fig. 2. Viscosity, η, of aqueous solutions of alkali metal phosphate salts against molar concentration (a) = at 298.15 K, (b) = at 303.15 K and (c) = at 308.15 K.
37R.K. Ameta, M. Singh / Journal of Molecular Liquids 203 (2015) 29–38
Ca2+, Fe3+ and Au4+ salts and their nanoparticles. Since, in nanotech-nology such metals are used to encapsulate the drugs for enhancingtheir bioavailability, and this encapsulation is dependent on the interac-tion of metal and drug surface and other parameters. Thus, this modelcould depict their aggregation pattern being used for their stability anddesigning the optical, electrical conducing, thermal and phase extractionapplications. Under thismodel a new conceptual interaction analysis pat-tern is developed where the primary and secondary cohesivities are con-sidered, and proved a constructive role of surface tension and viscosity.Standarddeviation,σ,was calculatedwith following equationwhere den-sity, surface tension and viscosity had 1 × 10⁻⁶ g·cm−3, 1 × 10⁻² mN/mand 1 × 10⁻⁴ standard deviation.
σ ¼ffiffiffiffi1N
r XNi¼1
xi−xð Þ2
N is the number of measurements taken for each parameter.
4. Conclusion
Biological processes are thermodynamically and kinetically con-trolled with definite surface tension and viscosity data respectively.
Since all biological processes are carried out at particular pH of buffersystem, thus a real picture of biological activities in alkali metal phos-phate buffers described in the study based on their surface tensionand viscosity data. The higher surface tensions of buffer than water de-pict the development of stronger cohesive forces between oppositelycharged ionic hydration spheres modeled as secondary cohesivitywhich could be a most favorable structural environment for biomole-cules to act for desired or expected outcome. The secondary cohesivitycould prove buffer's sustainability in biological experiments computedout of cohesive and dispersive or ionic forces in terms of friccohesity.For example, NaH2PO4 behaved as a structure maker at 298.15 and308.15 K but a structure breaker at 303.15 K, defined as thermally depen-dent structure making/breaking activity for specific biological experi-ment. Replacement of H+ by Na+ and K+ has increased the surface andbulk properties in terms of higher surface tension and higher viscosityof the water respectively strengthening activity of H+ (pH) as essentialphysicochemical conducive environment for biological experiments.Since, the negative apparent molal and higher hydrodynamic volumesare useful interaction indicator for determining molecular weight andunfolding of proteins, therefore Na3PO4 and K2HPO4 having good valuesof these could be useful for this purpose. Negative activation viscousflow energy for a specified concentration inferred enhanced growth of
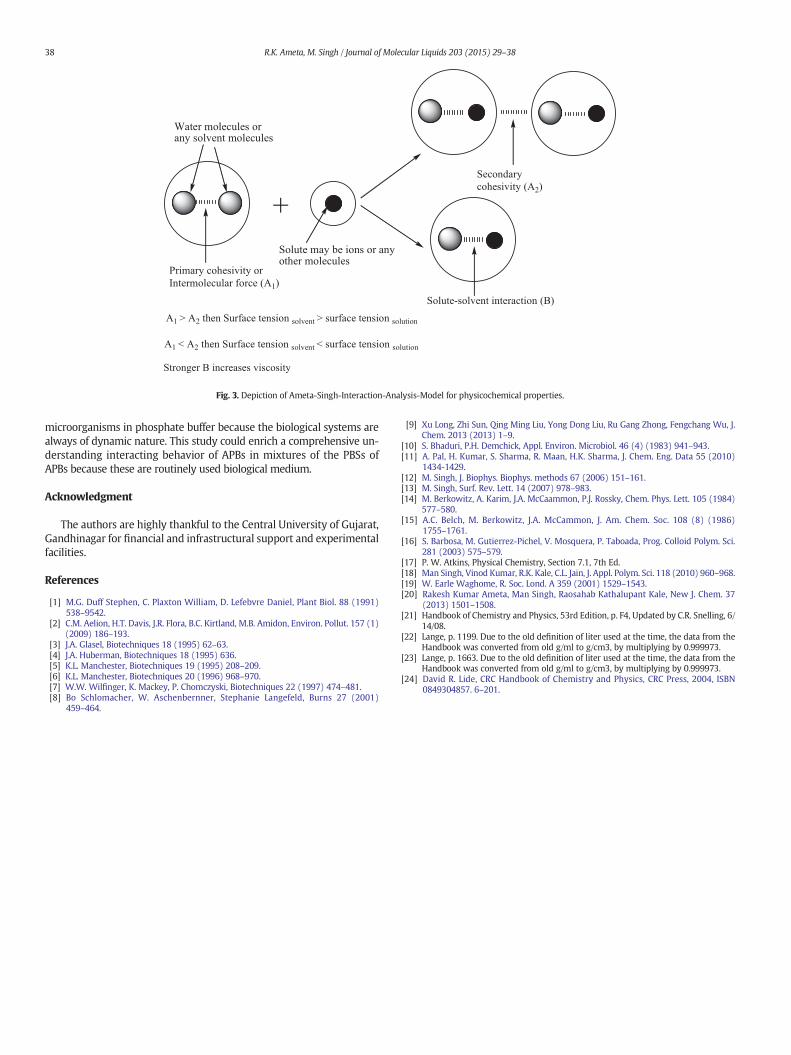
Primary cohesivity orIntermolecular force (A1)
Secondarycohesivity (A2)
Water molecules orany solvent molecules
Solute may be ions or anyother molecules
Solute-solvent interaction (B)
+
A1 > A2 then Surface tension solvent > surface tension solution
A1 < A2 then Surface tension solvent < surface tension solution
Stronger B increases viscosity
Fig. 3. Depiction of Ameta-Singh-Interaction-Analysis-Model for physicochemical properties.
38 R.K. Ameta, M. Singh / Journal of Molecular Liquids 203 (2015) 29–38
microorganisms in phosphate buffer because the biological systems arealways of dynamic nature. This study could enrich a comprehensive un-derstanding interacting behavior of APBs in mixtures of the PBSs ofAPBs because these are routinely used biological medium.
Acknowledgment
The authors are highly thankful to the Central University of Gujarat,Gandhinagar for financial and infrastructural support and experimentalfacilities.
References
[1] M.G. Duff Stephen, C. Plaxton William, D. Lefebvre Daniel, Plant Biol. 88 (1991)538–9542.
[2] C.M. Aelion, H.T. Davis, J.R. Flora, B.C. Kirtland, M.B. Amidon, Environ. Pollut. 157 (1)(2009) 186–193.
[3] J.A. Glasel, Biotechniques 18 (1995) 62–63.[4] J.A. Huberman, Biotechniques 18 (1995) 636.[5] K.L. Manchester, Biotechniques 19 (1995) 208–209.[6] K.L. Manchester, Biotechniques 20 (1996) 968–970.[7] W.W. Wilfinger, K. Mackey, P. Chomczyski, Biotechniques 22 (1997) 474–481.[8] Bo Schlomacher, W. Aschenbernner, Stephanie Langefeld, Burns 27 (2001)
459–464.
[9] Xu Long, Zhi Sun, Qing Ming Liu, Yong Dong Liu, Ru Gang Zhong, Fengchang Wu, J.Chem. 2013 (2013) 1–9.
[10] S. Bhaduri, P.H. Demchick, Appl. Environ. Microbiol. 46 (4) (1983) 941–943.[11] A. Pal, H. Kumar, S. Sharma, R. Maan, H.K. Sharma, J. Chem. Eng. Data 55 (2010)
1434-1429.[12] M. Singh, J. Biophys. Biophys. methods 67 (2006) 151–161.[13] M. Singh, Surf. Rev. Lett. 14 (2007) 978–983.[14] M. Berkowitz, A. Karim, J.A. McCaammon, P.J. Rossky, Chem. Phys. Lett. 105 (1984)
577–580.[15] A.C. Belch, M. Berkowitz, J.A. McCammon, J. Am. Chem. Soc. 108 (8) (1986)
1755–1761.[16] S. Barbosa, M. Gutierrez-Pichel, V. Mosquera, P. Taboada, Prog. Colloid Polym. Sci.
281 (2003) 575–579.[17] P. W. Atkins, Physical Chemistry, Section 7.1, 7th Ed.[18] Man Singh, Vinod Kumar, R.K. Kale, C.L. Jain, J. Appl. Polym. Sci. 118 (2010) 960–968.[19] W. Earle Waghome, R. Soc. Lond. A 359 (2001) 1529–1543.[20] Rakesh Kumar Ameta, Man Singh, Raosahab Kathalupant Kale, New J. Chem. 37
(2013) 1501–1508.[21] Handbook of Chemistry and Physics, 53rd Edition, p. F4, Updated by C.R. Snelling, 6/
14/08.[22] Lange, p. 1199. Due to the old definition of liter used at the time, the data from the
Handbook was converted from old g/ml to g/cm3, by multiplying by 0.999973.[23] Lange, p. 1663. Due to the old definition of liter used at the time, the data from the
Handbook was converted from old g/ml to g/cm3, by multiplying by 0.999973.[24] David R. Lide, CRC Handbook of Chemistry and Physics, CRC Press, 2004, ISBN
0849304857. 6–201.
Copyright © 2022 FDOKUMEN