Reliability difference between spectral and entropic measures of erector spinae muscle fatigability
6
Reliability difference between spectral and entropic measures of erector spinae muscle fatigability Paul S. Sung a, * , Ulrich Zurcher b , Miron Kaufman b a Department of Physical Therapy, College of Health Science, Korea University, #1 Jeongneung 3-dong, Sungbuk-gu, Seoul 136-703, Republic of Korea b Department of Physics, Cleveland State University, Cleveland, Ohio, USA article info Article history: Received 28 May 2008 Received in revised form 3 October 2008 Accepted 23 November 2008 Keywords: EMG Entropy Low back pain Fatigability Reliability Power spectrum Complexity Erector spinae abstract This study investigated back muscle fatigability of the erector spinae (ES) muscles during submaximal contractions with the use of surface electromyography (sEMG). It was important to confirm the reliability of measurements for characterizing neuromuscular alterations by establishing the difference between the Shannon (information) entropy and the power spectrum analysis in subjects with low back pain (LBP). The data was collected on two different days, one week apart, and the between-days reliability of these measures was examined. Thirty-two gender-matched subjects completed the modified Sorenson test; 16 of the subjects were female while 16 were male. The entropy of the sEMG signal was more reli- able than either the median frequency (MF) or the slope of the MF. The intraclass correlation coefficient (ICC) was higher for the entropy than for the MF slope. The ICC values of entropy for between-day mea- surements were higher (0.82–0.85) than MF (0.54–0.64) and MF slope (0.26–0.30). The standard errors of measurement (SEM) values for entropy were lower (0.04–0.05) than MF (3.10–3.60) and MF slope (0.03– 0.04). The Pearson correlation coefficients of the entropy were significantly higher (0.75–0.77) than those of the MF (0.38–0.47) and the MF slope (0.15–0.18). Therefore, the results of this study indicated that the entropy analysis could provide a reliable measure of muscle fatigability. Ó 2008 Elsevier Ltd. All rights reserved. 1. Introduction Several studies have suggested that surface electromyography (sEMG) power spectrum analysis could be used to evaluate pa- tients undergoing rehabilitation (De Luca, 1984; Mannion et al., 1998; Merletti et al., 1999; Sung, 2003). The connection between fatigue and sEMG spectral parameters is the basis for the use of sEMG as an objective and noninvasive method of assessment of back muscle endurance (De Luca, 1984; Mannion et al., 1997). The original study linking low back pain (LBP) with fatigue was presented by De Luca (1984), who found that subjects with LBP have less endurance, and thus smaller median frequency (MF) slopes, during sustained muscle contractions (Mannion et al., 1997; Roy et al., 1997; Sung, 2003). However, contradictory re- sults have subsequently been reported (Mannion et al., 2001; Sung, 2003; Humphrey et al., 2005) and have shown that MF slope is not better than chance in predicting LBP (Humphrey et al., 2005). Thus, a connection between spectral quantities and muscu- loskeletal pain/dysfunction remains elusive despite considerable efforts. In recent studies, we applied methods from nonlinear time ser- ies analysis and found that the time-dependent entropy calculated from the sEMG signal shows a distinct plateau-like behavior for intermediate times (Sung et al., 2005; Kaufman et al., 2007; Sung et al., 2007). The signal from sEMG is the instantaneous algebraic summations of action potentials from muscle fibers, and its power spectrum is obtained from a fast Fourier transform (FFT) of the sig- nal. The MF is calculated from the spectrum and reflects the prop- agation speed of the action signal. Recently, several studies in entropy measurements based on nonlinear time series analysis were published without reporting reliability and validity concerns (Goldberger et al., 2002; Kaufman et al., 2007; Sung et al., 2007). Therefore, it would be valuable to confirm the reliability of mea- surements for characterizing neuromuscular alterations by investi- gating differences between the power spectrum analysis and nonlinear time series analysis of entropy measures. Several nonlinear analyses have been applied to time series from a variety of physiologic time series such as human heartbeats (Ivanov et al., 1999; Costa et al., 2002, 2003). It has been found that the degree of randomness is a characteristic property of time ser- ies. Entropy is generally used to quantify the complexity. In partic- ular, entropy is used to characterize non-periodic, random phenomena and indicates the rate of information production as it relates to dynamic systems (Richman and Moorman, 2000). Several research groups have compared entropy values for subjects with and without illness/dysfunction (West, 1990; Stanley et al., 1992; Chialvo, 2002; Costa et al., 2002; Goldberger et al., 2002). 1050-6411/$ - see front matter Ó 2008 Elsevier Ltd. All rights reserved. doi:10.1016/j.jelekin.2008.11.005 * Corresponding author. Tel./fax: +82 2 940 2830. E-mail address: [email protected] (P.S. Sung). Journal of Electromyography and Kinesiology 20 (2010) 25–30 Contents lists available at ScienceDirect Journal of Electromyography and Kinesiology journal homepage: www.elsevier.com/locate/jelekin
Transcript of Reliability difference between spectral and entropic measures of erector spinae muscle fatigability

Journal of Electromyography and Kinesiology 20 (2010) 25–30
Contents lists available at ScienceDirect
Journal of Electromyography and Kinesiology
journal homepage: www.elsevier .com/locate / je lek in
Reliability difference between spectral and entropic measures of erectorspinae muscle fatigability
Paul S. Sung a,*, Ulrich Zurcher b, Miron Kaufman b
a Department of Physical Therapy, College of Health Science, Korea University, #1 Jeongneung 3-dong, Sungbuk-gu, Seoul 136-703, Republic of Koreab Department of Physics, Cleveland State University, Cleveland, Ohio, USA
a r t i c l e i n f o
Article history:Received 28 May 2008Received in revised form 3 October 2008Accepted 23 November 2008
Keywords:EMGEntropyLow back painFatigabilityReliabilityPower spectrumComplexityErector spinae
1050-6411/$ - see front matter � 2008 Elsevier Ltd. Adoi:10.1016/j.jelekin.2008.11.005
* Corresponding author. Tel./fax: +82 2 940 2830.E-mail address: [email protected] (P.S. Sung).
a b s t r a c t
This study investigated back muscle fatigability of the erector spinae (ES) muscles during submaximalcontractions with the use of surface electromyography (sEMG). It was important to confirm the reliabilityof measurements for characterizing neuromuscular alterations by establishing the difference betweenthe Shannon (information) entropy and the power spectrum analysis in subjects with low back pain(LBP). The data was collected on two different days, one week apart, and the between-days reliabilityof these measures was examined. Thirty-two gender-matched subjects completed the modified Sorensontest; 16 of the subjects were female while 16 were male. The entropy of the sEMG signal was more reli-able than either the median frequency (MF) or the slope of the MF. The intraclass correlation coefficient(ICC) was higher for the entropy than for the MF slope. The ICC values of entropy for between-day mea-surements were higher (0.82–0.85) than MF (0.54–0.64) and MF slope (0.26–0.30). The standard errors ofmeasurement (SEM) values for entropy were lower (0.04–0.05) than MF (3.10–3.60) and MF slope (0.03–0.04). The Pearson correlation coefficients of the entropy were significantly higher (0.75–0.77) than thoseof the MF (0.38–0.47) and the MF slope (0.15–0.18). Therefore, the results of this study indicated that theentropy analysis could provide a reliable measure of muscle fatigability.
� 2008 Elsevier Ltd. All rights reserved.
1. Introduction
Several studies have suggested that surface electromyography(sEMG) power spectrum analysis could be used to evaluate pa-tients undergoing rehabilitation (De Luca, 1984; Mannion et al.,1998; Merletti et al., 1999; Sung, 2003). The connection betweenfatigue and sEMG spectral parameters is the basis for the use ofsEMG as an objective and noninvasive method of assessment ofback muscle endurance (De Luca, 1984; Mannion et al., 1997).The original study linking low back pain (LBP) with fatigue waspresented by De Luca (1984), who found that subjects with LBPhave less endurance, and thus smaller median frequency (MF)slopes, during sustained muscle contractions (Mannion et al.,1997; Roy et al., 1997; Sung, 2003). However, contradictory re-sults have subsequently been reported (Mannion et al., 2001;Sung, 2003; Humphrey et al., 2005) and have shown that MF slopeis not better than chance in predicting LBP (Humphrey et al.,2005). Thus, a connection between spectral quantities and muscu-loskeletal pain/dysfunction remains elusive despite considerableefforts.
In recent studies, we applied methods from nonlinear time ser-ies analysis and found that the time-dependent entropy calculated
ll rights reserved.
from the sEMG signal shows a distinct plateau-like behavior forintermediate times (Sung et al., 2005; Kaufman et al., 2007; Sunget al., 2007). The signal from sEMG is the instantaneous algebraicsummations of action potentials from muscle fibers, and its powerspectrum is obtained from a fast Fourier transform (FFT) of the sig-nal. The MF is calculated from the spectrum and reflects the prop-agation speed of the action signal. Recently, several studies inentropy measurements based on nonlinear time series analysiswere published without reporting reliability and validity concerns(Goldberger et al., 2002; Kaufman et al., 2007; Sung et al., 2007).Therefore, it would be valuable to confirm the reliability of mea-surements for characterizing neuromuscular alterations by investi-gating differences between the power spectrum analysis andnonlinear time series analysis of entropy measures.
Several nonlinear analyses have been applied to time seriesfrom a variety of physiologic time series such as human heartbeats(Ivanov et al., 1999; Costa et al., 2002, 2003). It has been found thatthe degree of randomness is a characteristic property of time ser-ies. Entropy is generally used to quantify the complexity. In partic-ular, entropy is used to characterize non-periodic, randomphenomena and indicates the rate of information production as itrelates to dynamic systems (Richman and Moorman, 2000). Severalresearch groups have compared entropy values for subjects withand without illness/dysfunction (West, 1990; Stanley et al., 1992;Chialvo, 2002; Costa et al., 2002; Goldberger et al., 2002).

26 P.S. Sung et al. / Journal of Electromyography and Kinesiology 20 (2010) 25–30
This concept has been used to differentiate healthy subjects fromthose with heart disease using electrocardiogram time series aswell; it is generally found that disease is associated with a loweringof the entropy. In several papers, we applied these ideas to sEMGtime series for the low back muscles. We found that subjects withLBP have lower entropies than healthy subjects, which is in agree-ment with the general finding.
The traditional approach of sEMG is based within the frame-work of linear systems for which a given input leads to a well-de-fined periodicity. This connection led to the notion of homeostasis,namely that the normal function of physiologic systems operatesin a steady state and that fluctuations are suppressed. However,contradictory results have subsequently been reported (Mannionet al., 2001; Sung, 2003; Humphrey et al., 2005) without clearunderstanding of the reliability of entropy measures. In addition,statistical use of correlation coefficients (r) based on several resultshave no proven validity for follow-up studies.
A clinical assessment must be based on objective criteria thatare also reliable. In this study, we compared the between-day var-iability of the MF, the slope of the MF, and the entropy of sEMGtime series from the erector spinae (ES) muscles of subjects withLBP. The purpose of this study was to assess consistency in entro-pic measures of erector spinae muscle fatigability compared withpower spectral analyses.
2. Methods
2.1. Selection of subjects
The focus of this study was to examine the reliability of backmuscle fatigue, especially the ES muscle, in subjects suffering fromLBP. Subjects in this study were recruited from the greater Cleve-land area. Subjects with LBP were defined as those who presentedwith LBP, met study inclusion criteria, and experienced a disturb-ing impairment or abnormality in the functioning of the low backfor more than a two-month duration (Klenerman et al., 1995). Sub-jects were eligible to participate if they: (1) were 21 years of age orolder and (2) had LBP for more than two months without painreferral into the lower extremities. Individuals were excluded fromparticipation if they: (1) had a diagnosed psychological illness thatmight interfere with the study protocol, (2) had experienced overtneurological signs (sensory deficits or motor paralysis), or (3) werepregnant. Subjects were withdrawn from the study if they re-quested to withdraw. Those subjects who met study inclusion cri-teria received information regarding the purpose and methods ofthe study and signed a copy of the Institutional Review Board ap-proved consent form.
Participant handedness was determined based on a modifiedEdinburgh Handedness Inventory (Oldfield, 1971) since the previ-ous study confirmed that handedness could be a confounding fac-tor for a back muscle study (Sung et al., 2004). The Edinburghinventory indicated that the dominant hand was defined as thepreferred side for activities of daily living. In addition, the left sideof the back was regarded as the dominant side for all subjects inthis study since the participants were all right-handed.
2.2. Pain level
Subject disability was inferred from self-reported scores onthe Oswestry Disability Index (ODI), which was given to eachsubject during the initial testing session. The ODI is one of themost frequently used tools for measuring chronic disability(Ciccone et al., 1996). A sum is calculated and presented as apercentage, where 0% represents no disability and 100% theworst possible disability (Fairbank et al., 1980; Fairbank andPynsent, 2000).
2.3. EMG measurement
For all subjects, the sEMG measurements were repeated on twodifferent days under identical conditions. No subject underwentany traumatic event or injury between the two different measure-ments. The modified isometric fatigue test as originally introducedby Sorenson was used in this study. Subjects were asked to lie in aprone position on a table and suspend their unsupported trunkshorizontally against gravity while their lower bodies werestrapped to the table at a zero degree angle. The subjects’ upperbodies were positioned with their iliac crests at the edge of the ta-ble; their lower bodies were secured at the ankles and hamstringlevel using seatbelt straps. Subjects held their arms across theirchests with each hand placed on the opposite shoulder, and a hor-izontal position was held until exhaustion was reached. The testwas discontinued once the subjects could no longer maintain ahorizontal position level to the table. The patients were allowedto reposition their upper bodies one time during the test whilestandard verbalized encouragement was given throughout the test.
The sEMG electrodes were placed bilaterally over the greatestconvexity of the lumbar ES muscles at the L4–L5 level with a10 cm distance between electrodes of each pair. The electrode sitesand the distance of the electrodes were carefully determined ineach subject according to Zipp (1982). The sEMG data was col-lected using differential (inter-electrode distance of 20 mm withan 8 mm diameter), pre-amplified (gain of 35), silver–silver chlo-ride surface electrodes (Therapeutics Unlimited, Inc., Iowa City,IA, USA) during the approximate one-minute testing period. Dataacquisition was performed using AcqKnowledge� software (BIO-PAC Systems, Inc., Goleta, CA, USA) with the resulting data ana-lyzed in MathCad (The MathWorks, Inc., Natick, MA, USA). Usingstandard fast Fourier transform (FFT) of the EMG data, we obtainedthe power spectrum for each one-second time interval.
During each one-second interval, the sEMG signals were sam-pled at a rate of 1000. The EMG signals from the fatigue test weretransformed into their frequency spectra using a FFT of the data.The MF of the signal, hfi, was calculated from the spectrum for eachone-second time interval. Linear regression then gave the extrapo-lated value of the MF slope as well as the entropy scores during thetesting period.
The Shannon information entropy of the EMG time series quan-tifies the degree of ‘‘noisiness” of a signal. After dividing the rangeof X(t) into 500 equal-sized bins, we used the histogram to deter-mine the probability distribution pj,t. The entropy is calculatedfrom: St ¼
Pjpj;t ln pj;t . The entropy S versus time t exhibits a pla-
teau for t > 10 ms. This plateau-value of S(t) will be referred to asthe entropy. The detailed entropy calculation process is fully de-scribed in previous studies (Sung et al., 2005; Kaufman et al.,2007; Sung et al., 2007).
2.4. Statistical analysis
Descriptive statistics were used to compare the mean and stan-dard deviation of each muscle group as well as subject characteris-tics. Paired t-tests were used to examine any significant differencesbetween two completions of the power spectrum analysis for MF,MF slope, and nonlinear time series for entropy measures. The reli-ability of repeated measurements made on separate days using thesEMG was assessed with a repeated measure analysis of variance(ANOVA) followed by determination of the intraclass correlationcoefficient (ICC) on the right and left sides of the ES muscles. Thestandard error of measurement (SEM) for the repeated trials andthe 95% confidence intervals (1.96 � p2 � SEM) were also deter-mined. The MF and MF slopes for the ES muscles were compared.The nonlinear time series of sEMG data was also analyzed basedon entropy and mean square displacement in order to compare
0-0.25 0.5-0.75 1.0-1.25 1.5-1.75 2.-2.25 2.5-2.750
1
2
3
4
5
6
7
8
Num
ber
of s
ubje
cts
Entropy
Pre-measurement Post-measurement
Fig. 1. Histogram of entropy measurements for the right ES muscle.
1.5
2.0
2.5
3.0
Pos
t Ent
ropy
Y = 0.87 X + 0.17,R2=0.56
P.S. Sung et al. / Journal of Electromyography and Kinesiology 20 (2010) 25–30 27
the differences between subjects with LBP. The MathCad packagewas used for this analysis, which was loaded onto a PC runningthe Windows XP-operating system. For all statistical tests, type Ierror rate was set at 0.05.
3. Results
The subjects’ demographics are summarized in Table 1, and thecohort included 32 subjects consisting of 16 males and 16 females.The age of the subjects ranged from 26 to 63 years with an averageage of 48.2 ± 9.2 years. The number of months since pain onset ran-ged from 4 to 63 months with an average of 11.3 ± 4.7 months. TheODI scores reported by the subjects ranged from 2.0% to 36.1% withan average of 19.0 ± 10.0%. Overall, there was a significant genderdifference based on age (t = 1.04, p = 0.30), number of months sincepain onset (t = �0.48, p = 0.63), and ODI scores (t = 0.15, p = 0.89).
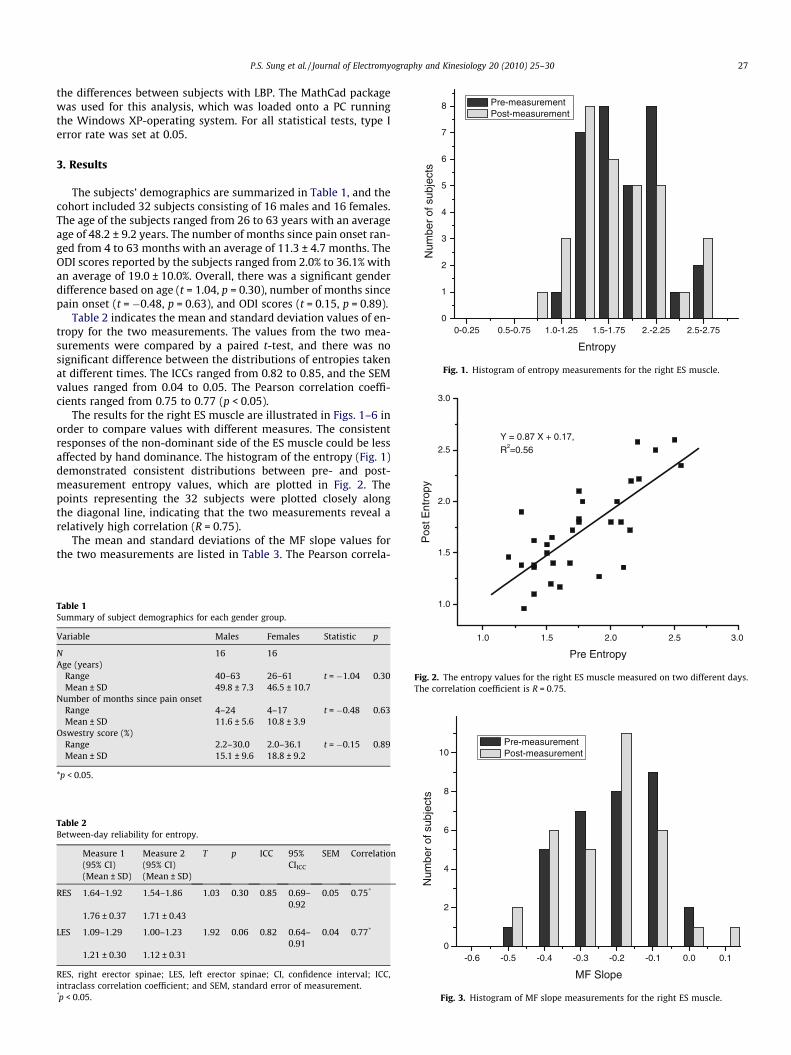
Table 2 indicates the mean and standard deviation values of en-tropy for the two measurements. The values from the two mea-surements were compared by a paired t-test, and there was nosignificant difference between the distributions of entropies takenat different times. The ICCs ranged from 0.82 to 0.85, and the SEMvalues ranged from 0.04 to 0.05. The Pearson correlation coeffi-cients ranged from 0.75 to 0.77 (p < 0.05).
The results for the right ES muscle are illustrated in Figs. 1–6 inorder to compare values with different measures. The consistentresponses of the non-dominant side of the ES muscle could be lessaffected by hand dominance. The histogram of the entropy (Fig. 1)demonstrated consistent distributions between pre- and post-measurement entropy values, which are plotted in Fig. 2. Thepoints representing the 32 subjects were plotted closely alongthe diagonal line, indicating that the two measurements reveal arelatively high correlation (R = 0.75).
The mean and standard deviations of the MF slope values forthe two measurements are listed in Table 3. The Pearson correla-
Table 1Summary of subject demographics for each gender group.
Variable Males Females Statistic p
N 16 16Age (years)
Range 40–63 26–61 t = �1.04 0.30Mean ± SD 49.8 ± 7.3 46.5 ± 10.7
Number of months since pain onsetRange 4–24 4–17 t = �0.48 0.63Mean ± SD 11.6 ± 5.6 10.8 ± 3.9
Oswestry score (%)Range 2.2–30.0 2.0–36.1 t = �0.15 0.89Mean ± SD 15.1 ± 9.6 18.8 ± 9.2
*p < 0.05.
Table 2Between-day reliability for entropy.
Measure 1 Measure 2 T p ICC 95%CIICC
SEM Correlation(95% CI) (95% CI)(Mean ± SD) (Mean ± SD)
RES 1.64–1.92 1.54–1.86 1.03 0.30 0.85 0.69–0.92
0.05 0.75*
1.76 ± 0.37 1.71 ± 0.43
LES 1.09–1.29 1.00–1.23 1.92 0.06 0.82 0.64–0.91
0.04 0.77*
1.21 ± 0.30 1.12 ± 0.31
RES, right erector spinae; LES, left erector spinae; CI, confidence interval; ICC,intraclass correlation coefficient; and SEM, standard error of measurement.*p < 0.05.
1.0 1.5 2.0 2.5 3.0
1.0
Pre Entropy
Fig. 2. The entropy values for the right ES muscle measured on two different days.The correlation coefficient is R = 0.75.
-0.6 -0.5 -0.4 -0.3 -0.2 -0.1 0.0 0.10
2
4
6
8
10
Num
ber
of s
ubje
cts
MF Slope
Pre-measurementPost-measurement
Fig. 3. Histogram of MF slope measurements for the right ES muscle.

-0.5 -0.4 -0.3 -0.2 -0.1 0.0 0.1
-0.5
-0.4
-0.3
-0.2
-0.1
0.0
0.1
0.2
Pos
t MF
Slo
pe
Pre MF Slope
Y = 0.20 X - 0.16,R2=0.03
Fig. 4. The MF slope measurements for the right ES muscle taken on two differentdays. The correlation coefficient is R = 0.18.
50-60 60-70 70-80 80-90 90-100 100-110 110-120 120-130 130-1400
1
2
3
4
5
6
7
8
Num
ber
of s
ubje
cts
Median Frequency
Pre-measurementPost-measurement
Fig. 5. Histogram of MF measurements for the right ES muscle.
50 60 70 80 90 100 110 120 130 14050
60
70
80
90
100
110
120
130
140
Pos
t MF
Pre MF
Y= 0.52 X = 47.49,R2=0.147
Fig. 6. The MF measurements for the right ES muscle taken on two different days.The correlation coefficient is R = 0.38.
28 P.S. Sung et al. / Journal of Electromyography and Kinesiology 20 (2010) 25–30
tion coefficients ranged from 0.15 to 0.18, which is consistent withno significant difference between the MF slopes at two differentobservations. This result confirms the values of the MF slope ofthe right ES muscle for post-measurement, which was plotted ver-sus the values of pre-measurement in Fig. 3 and shows no obviousdifference. The points representing the subjects were distributedrather broadly, which was reflected in the low correlation coeffi-cient (R = 0.18). The ICCs ranged from 0.26 to 0.30, and the SEMsvaried between 0.03 and 0.04, which were not significantly differ-ent for the distributions for two different times.
In Table 4, the distribution of post-measurement MF valuesfrom was shifted towards larger values. The Pearson correlationcoefficients ranged from 0.38 to 0.47 and were statistically signif-icant. Thus, there was a significant correlation between the distri-butions of the MF values from the measurements at two differenttimes. The ICCs ranged from 0.54 to 0.64, and the SEMs rangedfrom 3.10 to 3.60. Fig. 5 depicts the histograms of the MF values.The two histograms indicated little difference except for two out-liers for post-measurement values. Fig. 6 depicts the MF values
of the right ES muscle, and the linear regression analysis yieldedR = 0.15. The values of MF for the two measurements were morehighly correlated than those for the MF slope, although the corre-lation (R = 0.38) was much lower than that for the entropy.
4. Discussion
A clinical assessment of LBP is important to objectively identifysubjects with genuine pain and to assess the efficacy of therapeuticinterventions. The clinical assessment of muscle fatigue must bebased on valid, reliable, and objective measurements as well. Theassessment of LBP based on sEMG provides the connection be-tween LBP and properties derived from sEMG signals based onthe assumption that subjects with LBP fatigue more easily. The ori-ginal connection with quantities derived from sEMG signals stemsfrom the observation that the MF shifts towards lower values dur-ing sustained submaximal contractions. Since the purpose of thisstudy was to assess consistency in entropic measures of erectorspinae muscle fatigability, we compared differences between non-linear analysis of EMG time series and power spectrum analysis insubjects with LBP. However, it would be beneficial to review otherresults based on the relationship between LBP and ES muscle fati-gability and whether the results are consistent with healthy sub-jects. As we previously reported, the Shannon entropy of thetime series was significantly lower in the subjects with LBP (Sunget al., 2007) than in healthy subjects.
There is evidence to suggest that highly fatigable back musclesmay predispose an individual to the development of LBP (Biering-Sorensen, 1984; Alaranta et al., 1995; Adams et al., 1999). How-ever, a clinical assessment must be based on objective criteria thatare also reliable. A recent study also reported that an EMG spectralfrequency shift revealed a trend towards a flatter slope in paingroups, albeit not significant: the validity of frequency shift as anindicator of muscle fatigue in subjects with pain is questionedand should be further investigated (Ang, 2008). The empirical evi-dence of a connection between fatigability and LBP could be basedon the size and structure of the muscle (Mannion et al., 2000).However, there are no conclusive results regarding a cause andeffect relationship for muscle fatigue as a risk factor for thedevelopment of LBP (Mannion, 1999). Further studies are neededto investigate the effectiveness of nonlinear time series of EMGdata.
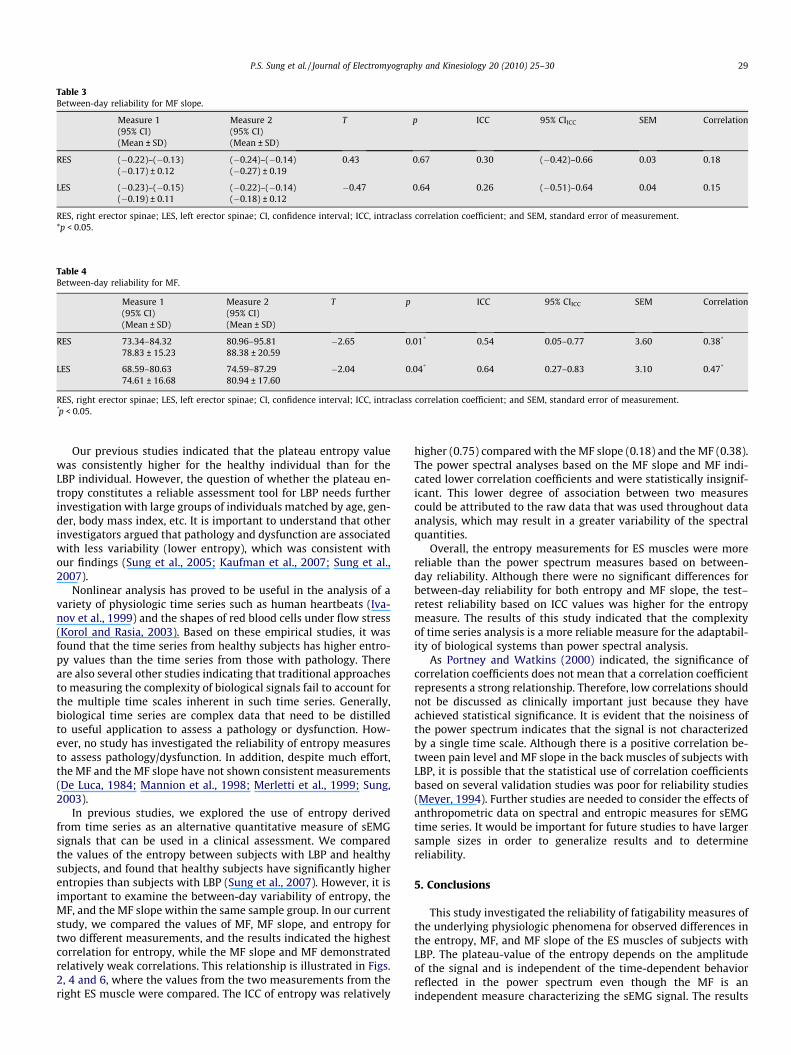
Table 4Between-day reliability for MF.
Measure 1 Measure 2 T p ICC 95% CIICC SEM Correlation(95% CI) (95% CI)(Mean ± SD) (Mean ± SD)
RES 73.34–84.32 80.96–95.81 �2.65 0.01* 0.54 0.05–0.77 3.60 0.38*
78.83 ± 15.23 88.38 ± 20.59
LES 68.59–80.63 74.59–87.29 �2.04 0.04* 0.64 0.27–0.83 3.10 0.47*
74.61 ± 16.68 80.94 ± 17.60
RES, right erector spinae; LES, left erector spinae; CI, confidence interval; ICC, intraclass correlation coefficient; and SEM, standard error of measurement.*p < 0.05.
Table 3Between-day reliability for MF slope.
Measure 1 Measure 2 T p ICC 95% CIICC SEM Correlation(95% CI) (95% CI)(Mean ± SD) (Mean ± SD)
RES (�0.22)–(�0.13) (�0.24)–(�0.14) 0.43 0.67 0.30 (�0.42)–0.66 0.03 0.18(�0.17) ± 0.12 (�0.27) ± 0.19
LES (�0.23)–(�0.15) (�0.22)–(�0.14) �0.47 0.64 0.26 (�0.51)–0.64 0.04 0.15(�0.19) ± 0.11 (�0.18) ± 0.12
RES, right erector spinae; LES, left erector spinae; CI, confidence interval; ICC, intraclass correlation coefficient; and SEM, standard error of measurement.*p < 0.05.
P.S. Sung et al. / Journal of Electromyography and Kinesiology 20 (2010) 25–30 29
Our previous studies indicated that the plateau entropy valuewas consistently higher for the healthy individual than for theLBP individual. However, the question of whether the plateau en-tropy constitutes a reliable assessment tool for LBP needs furtherinvestigation with large groups of individuals matched by age, gen-der, body mass index, etc. It is important to understand that otherinvestigators argued that pathology and dysfunction are associatedwith less variability (lower entropy), which was consistent withour findings (Sung et al., 2005; Kaufman et al., 2007; Sung et al.,2007).
Nonlinear analysis has proved to be useful in the analysis of avariety of physiologic time series such as human heartbeats (Iva-nov et al., 1999) and the shapes of red blood cells under flow stress(Korol and Rasia, 2003). Based on these empirical studies, it wasfound that the time series from healthy subjects has higher entro-py values than the time series from those with pathology. Thereare also several other studies indicating that traditional approachesto measuring the complexity of biological signals fail to account forthe multiple time scales inherent in such time series. Generally,biological time series are complex data that need to be distilledto useful application to assess a pathology or dysfunction. How-ever, no study has investigated the reliability of entropy measuresto assess pathology/dysfunction. In addition, despite much effort,the MF and the MF slope have not shown consistent measurements(De Luca, 1984; Mannion et al., 1998; Merletti et al., 1999; Sung,2003).
In previous studies, we explored the use of entropy derivedfrom time series as an alternative quantitative measure of sEMGsignals that can be used in a clinical assessment. We comparedthe values of the entropy between subjects with LBP and healthysubjects, and found that healthy subjects have significantly higherentropies than subjects with LBP (Sung et al., 2007). However, it isimportant to examine the between-day variability of entropy, theMF, and the MF slope within the same sample group. In our currentstudy, we compared the values of MF, MF slope, and entropy fortwo different measurements, and the results indicated the highestcorrelation for entropy, while the MF slope and MF demonstratedrelatively weak correlations. This relationship is illustrated in Figs.2, 4 and 6, where the values from the two measurements from theright ES muscle were compared. The ICC of entropy was relatively
higher (0.75) compared with the MF slope (0.18) and the MF (0.38).The power spectral analyses based on the MF slope and MF indi-cated lower correlation coefficients and were statistically insignif-icant. This lower degree of association between two measurescould be attributed to the raw data that was used throughout dataanalysis, which may result in a greater variability of the spectralquantities.
Overall, the entropy measurements for ES muscles were morereliable than the power spectrum measures based on between-day reliability. Although there were no significant differences forbetween-day reliability for both entropy and MF slope, the test–retest reliability based on ICC values was higher for the entropymeasure. The results of this study indicated that the complexityof time series analysis is a more reliable measure for the adaptabil-ity of biological systems than power spectral analysis.
As Portney and Watkins (2000) indicated, the significance ofcorrelation coefficients does not mean that a correlation coefficientrepresents a strong relationship. Therefore, low correlations shouldnot be discussed as clinically important just because they haveachieved statistical significance. It is evident that the noisiness ofthe power spectrum indicates that the signal is not characterizedby a single time scale. Although there is a positive correlation be-tween pain level and MF slope in the back muscles of subjects withLBP, it is possible that the statistical use of correlation coefficientsbased on several validation studies was poor for reliability studies(Meyer, 1994). Further studies are needed to consider the effects ofanthropometric data on spectral and entropic measures for sEMGtime series. It would be important for future studies to have largersample sizes in order to generalize results and to determinereliability.
5. Conclusions
This study investigated the reliability of fatigability measures ofthe underlying physiologic phenomena for observed differences inthe entropy, MF, and MF slope of the ES muscles of subjects withLBP. The plateau-value of the entropy depends on the amplitudeof the signal and is independent of the time-dependent behaviorreflected in the power spectrum even though the MF is anindependent measure characterizing the sEMG signal. The results

30 P.S. Sung et al. / Journal of Electromyography and Kinesiology 20 (2010) 25–30
of this study indicated that the complexity of time series analysis isa more reliable measure than power spectral analysis. Nonetheless,the ICC values indicated between-day differences, suggesting thatthe entropy measure could serve as a reliable clinical tool for mus-cle fatigability measurements.
Acknowledgments
This research was supported by the Korea University Grant. Theauthors would like to thank Mr. Brian Vyhnalek at Cleveland StateUniversity for his data analyses and assistance in preparing thismanuscript.
References
Adams MA, Mannion AF, Dolan P. Personal risk factors for first-time low back pain.Spine 1999;24:2497–505.
Alaranta H, Luoto S, Heliovaara M, Hurri H. Static back endurance and the risk oflow-back pain. Clin Biomech (Bristol, Avon) 1995;10:323–4.
Ang BO. Impaired neck motor function and pronounced pain-related fear inhelicopter pilots with neck pain – a clinical approach. J Electromyogr Kinesiol2008;18:538–49.
Biering-Sorensen F. Physical measurements as risk indicators for low-back troubleover a one-year period. Spine 1984;9:106–19.
Chialvo DR. Physiology: unhealthy surprises. Nature 2002;419:263.Ciccone DS, Just N, Bandilla EB. Non-organic symptom reporting in patients with
chronic non-malignant pain. Pain 1996;68:329–41.Costa M, Goldberger AL, Peng CK. Multiscale entropy analysis of complex
physiologic time series. Phys Rev Lett 2002;89.Costa M, Goldberger AL, Peng CK. Multiscale entropy analysis: a new measure of
complexity loss in heart failure. J Electrocardiol 2003;36(Suppl):39–40.De Luca CJ. Myoelectrical manifestations of localized muscular fatigue in humans.
Crit Rev Biomed Eng 1984;11:251–79.Fairbank JC, Pynsent PB. The Oswestry disability index. Spine 2000;25:2940-52;
discussion 52.Fairbank JC, Couper J, Davies JB, O’Brien JP. The Oswestry low back pain disability
questionnaire. Physiotherapy 1980;66:271–3.Goldberger AL, Amaral LA, Hausdorff JM, Ivanov PC, Peng CK, et al. Fractal dynamics
in physiology: alterations with disease and aging. Proc Natl Acad Sci USA2002a;99(Suppl. 1):2466–72.
Goldberger AL, Peng CK, Lipsitz LA. What is physiologic complexity and how does itchange with aging and disease? Neurobiol Aging 2002b;23:23–6.
Humphrey AR, Nargol AV, Jones AP, Ratcliffe AA, Greenough CG. The value ofelectromyography of the lumbar paraspinal muscles in discriminating betweenchronic-low-back-pain sufferers and normal subjects. Eur Spine J2005;14:175–84.
Ivanov PC, Amaral LA, Goldberger AL, Havlin S, Rosenblum MG, Struzik ZR, et al.Multifractality in human heartbeat dynamics. Nature 1999;399:461–5.
Kaufman M, Zurcher U, Sung P. Entropy of electromyography time series. Phys AStat Mech Appl 2007;386:698–707.
Klenerman L, Slade PD, Stanley IM, Pennie B, Reilly JP, Atchison LE, et al. Theprediction of chronicity in patients with an acute attack of low back pain in ageneral practice setting. Spine 1995;20:478–84.
Korol AM, Rasia R. Signatures of deterministic chaos in dyslipidemic erythrocytesunder shear stress. Chaos 2003;13:87–93.
Mannion AF, Connolly B, Wood K, Dolan P. The use of surface EMG power spectralanalysis in the evaluation of back muscle function. J Rehabil Res Dev1997;34:427–39.
Mannion AF, Dumas GA, Stevenson JM, Cooper RG. The influence of muscle fiber sizeand type distribution on electromyographic measures of back musclefatigability. Spine 1998;23:576–84.
Mannion AF, Kaser L, Weber E, Rhyner A, Dvorak J, Muntener M. Influence of age andduration of symptoms on fibre type distribution and size of the back muscles inchronic low back pain patients. Eur Spine J 2000;9:273–81.
Mannion AF, Muntener M, Taimela S, Dvorak J. Comparison of three active therapiesfor chronic low back pain: results of a randomized clinical trial with one-yearfollow-up. Rheumatology (Oxford) 2001;40:772–8.
Mannion AF. Fibre type characteristics and function of the human paraspinalmuscles: normal values and changes in association with low back pain. JElectromyogr Kinesiol 1999;9:363–77.
Merletti R, Roy SH, Kupa E, Roatta S, Granata A. Modeling of surface myoelectricsignals – Part II: model-based signal interpretation. IEEE Trans Biomed Eng1999;46:821–9.
Meyer JJ. The validity of thoracolumbar paraspinal scanning EMG as a diagnostictest: an examination of the current literature. J Manipulative Physiol Ther1994;17:539–51.
Oldfield RC. The assessment and analysis of handedness: the Edinburgh inventory.Neuropsychologia 1971;9:97–113.
Portney LG, Watkins MP. Foundations of clinical research applications to practice.2000.
Richman JS, Moorman JR. Physiological time-series analysis using approximateentropy and sample entropy. Am J Physiol Heart Circ Physiol 2000;278:H2039–49.
Roy SH, De Luca CJ, Emley M, Oddsson LI, Buijs RJ, Levins JA, et al. Classification ofback muscle impairment based on the surface electromyographic signal. JRehabil Res Dev 1997;34:405–14.
Stanley HE, Buldyrev SV, Goldberger AL, Hausdorff JM, Havlin S, Mietus J, Sciortino F,Simons M, et al. Fractal landscapes in biological systems: long-rangecorrelations in DNA and interbeat heart intervals. Physica A 1992;191:1–12.
Sung PS, Spratt KF, Wilder DG. A possible methodological flaw in comparingdominant and nondominant sided lumbar spine muscle responses withoutsimultaneously considering hand dominance. Spine 2004;29:1914–22.
Sung PS, Zurcher U, Kaufman M. Nonlinear analysis of electromyography time seriesas a diagnostic tool for low back pain. Med Sci Monit 2005;11:CS1–5.
Sung PS, Zurcher U, Kaufman M. Comparison of spectral and entropic measures forsurface electromyography time series: a pilot study. J Rehabil Res Dev2007;44:599–610.
Sung P. The efficacy of median frequency on multifidi muscles during one-minuteback extension. Arch Phys Med Rehabil 2003a;84:1313–8.
Sung PS. Multifidi muscles median frequency before and after spinal stabilizationexercises. Arch Phys Med Rehabil 2003b;84:1313–8.
West B. Fractal physiology and chaos in medicine. 1990.Zipp P. Recommendations for the standardization of lead positions in surface
electromyography. Eur J Appl Physiol 1982;50:41–54.
Paul S. Sung received his PhD degree in PhysicalTherapy from Nova Southeastern University, Ft.Lauderdale, Florida in 2004. He also received hisDHSc degree from the University of St. Augustine, St.Augustine, Florida in 1999. He conducted hisresearch fellowship at the Iowa Spine Research Cen-ter, Biomedical Engineering Department at the Uni-versity of Iowa in Iowa City, Iowa from 2001 to 2003.He is a member of the International Society for theStudy of the Lumbar Spine as well as the AmericanPhysical Therapy Association. Presently, he is anAssociate Professor in the Department of PhysicalTherapy at Korea University in Seoul, Korea. His
research interests include the mechanisms of chronic low back pain, trunk muscleactivity patterns, and non-operative spine care and its clinical application to neu-romuscular control.
Ulrich Zurcher earned a BS degree in 1985 and a PhDdegree in 1989 in Physics from the University ofBasel in Switzerland. He then spent two years, 1990–1991, at the Massachusetts Institute of Technology inPhysical Chemistry and one year at Clarkson Uni-versity in Physics Department. His other researchappointments include a postdoctoral position atBoston University in the Department of PhysicalChemistry. His research topics include the elasticproperties of glass-forming liquids and the mathe-matical properties of physiologic time series, whichis funded by a grant from the Research Corporation.His teaching interests include biomedical applica-
tions for the introductory physics sequence.
Miron Kaufman earned a BA degree in 1973 and anMS degree in 1977 in Physics from Tel-Aviv Univer-sity in Israel. He earned a PhD degree in Physics in1981 from Carnegie Mellon University in Pittsburgh,Pennsylvania. His research covers topics in: super-conductivity, magnetism, liquids, polymers andfractals. For the last 10 years, he has been involved incollaborative research projects at the interface ofstatistical physics with cognitive science, health sci-ence, urban studies, and polymer engineering. He iscurrently developing enriching materials for severalcourses involving simulations.