Structural and entropic modes in supercooled liquids: experimental and theoretical investigation
12
INSTITUTE OF PHYSICS PUBLISHING JOURNAL OF PHYSICS: CONDENSED MATTER J. Phys.: Condens. Matter 15 (2003) S1181–S1192 PII: S0953-8984(03)58344-8 Structural and entropic modes in supercooled liquids: experimental and theoretical investigation R Di Leonardo 1 , A Taschin 2,3 , R Torre 2,3 , M Sampoli 3,4 and G Ruocco 1 1 Dipartimento di Fisica and INFM, Universit` a di Roma ‘La Sapienza’, I-00185, Roma, Italy 2 Dipartimento di Fisica, LENS and INFM, Universit` a di Firenze, I-50019 Sesto, Firenze, Italy 3 INFM, Unit´ a di Firenze, I-50019 Sesto, Firenze, Italy 4 Dipartimento di Energetica, Universit` a di Firenze, via S Marta, I-50139, Firenze, Italy Received 3 December 2002 Published 10 March 2003 Online at stacks.iop.org/JPhysCM/15/S1181 Abstract We studied the relaxation processes of glycerol by a transient grating experiment with polarization selectivity and optical heterodyne detection. The density response of supercooled glycerol, for a wavevector q = 0.63 µm −1 , has been studied in that temperature range (T = 200–340 K), where the rearrangement of the structure (α-relaxation) and thermal diffusion occur on the same timescale. A strong interaction between the two modes is observed, manifesting in a dip in the T dependence of the apparent thermal conductivity and in a flattening of the apparent α-relaxation time upon cooling. A parameter-free thermo- hydrodynamic model for the long-time response is developed. The model is capable of quantitatively reproducing the data and of explaining the observed phenomenology. 1. Introduction Whenever an inhomogeneous temperature or pressure field exists inside a substance, heat and momentum will flow, giving rise to processes, thermal diffusion and sound propagation, which drive the system toward homogeneity. At low enough wavevector q (i.e. at the typical q values of a light scattering experiment) the timescales of the two processes are well separated, so that sound propagation is adiabatic and thermal diffusion isobaric. Every other microscopic dynamical process evolves on such a fast timescale that it enters the dynamic equations simply by determining the actual values of thermodynamic derivatives and transport coefficients. The situation changes when a liquid is supercooled below its melting temperature and the structural relaxation time, τ α , rapidly grows upon cooling. When τ α becomes of the order of a sound- wave period we observe phenomena such as the sound-velocity dispersion and sound absorption which have been widely investigated by ultrasonic and Brillouin spectroscopy and commonly described in terms of a relaxing bulk modulus or viscosity [1, 2]. Upon further cooling, τ α reaches the timescale of the thermal diffusion, giving rise to a non-trivial diffusive heat equation, usually described in terms of specific-heat relaxation, and experimentally observed by specific 0953-8984/03/111181+12$30.00 © 2003 IOP Publishing Ltd Printed in the UK S1181
-
Upload
independent -
Category
Documents
-
view
1 -
download
0
Transcript of Structural and entropic modes in supercooled liquids: experimental and theoretical investigation
INSTITUTE OF PHYSICS PUBLISHING JOURNAL OF PHYSICS: CONDENSED MATTER
J. Phys.: Condens. Matter 15 (2003) S1181–S1192 PII: S0953-8984(03)58344-8
Structural and entropic modes in supercooled liquids:experimental and theoretical investigation
R Di Leonardo1, A Taschin2,3, R Torre2,3, M Sampoli3,4 and G Ruocco1
1 Dipartimento di Fisica and INFM, Universita di Roma ‘La Sapienza’, I-00185, Roma, Italy2 Dipartimento di Fisica, LENS and INFM, Universita di Firenze, I-50019 Sesto, Firenze, Italy3 INFM, Unita di Firenze, I-50019 Sesto, Firenze, Italy4 Dipartimento di Energetica, Universita di Firenze, via S Marta, I-50139, Firenze, Italy
Received 3 December 2002Published 10 March 2003Online at stacks.iop.org/JPhysCM/15/S1181
AbstractWe studied the relaxation processes of glycerol by a transient grating experimentwith polarization selectivity and optical heterodyne detection. The densityresponse of supercooled glycerol, for a wavevector q = 0.63 µm−1, has beenstudied in that temperature range (T = 200–340 K), where the rearrangement ofthe structure (α-relaxation) and thermal diffusion occur on the same timescale.A strong interaction between the two modes is observed, manifesting in a dipin the T dependence of the apparent thermal conductivity and in a flatteningof the apparent α-relaxation time upon cooling. A parameter-free thermo-hydrodynamic model for the long-time response is developed. The model iscapable of quantitatively reproducing the data and of explaining the observedphenomenology.
1. Introduction
Whenever an inhomogeneous temperature or pressure field exists inside a substance, heat andmomentum will flow, giving rise to processes, thermal diffusion and sound propagation, whichdrive the system toward homogeneity. At low enough wavevector q (i.e. at the typical q valuesof a light scattering experiment) the timescales of the two processes are well separated, sothat sound propagation is adiabatic and thermal diffusion isobaric. Every other microscopicdynamical process evolves on such a fast timescale that it enters the dynamic equations simplyby determining the actual values of thermodynamic derivatives and transport coefficients. Thesituation changes when a liquid is supercooled below its melting temperature and the structuralrelaxation time, τα , rapidly grows upon cooling. When τα becomes of the order of a sound-wave period we observe phenomena such as the sound-velocity dispersion and sound absorptionwhich have been widely investigated by ultrasonic and Brillouin spectroscopy and commonlydescribed in terms of a relaxing bulk modulus or viscosity [1, 2]. Upon further cooling, τα
reaches the timescale of the thermal diffusion, giving rise to a non-trivial diffusive heat equation,usually described in terms of specific-heat relaxation, and experimentally observed by specific
0953-8984/03/111181+12$30.00 © 2003 IOP Publishing Ltd Printed in the UK S1181
S1182 R Di Leonardo et al
heat spectroscopy [3] and forced Rayleigh scattering [4, 5]. However, though both viscosityand specific heat relaxations are manifestations of the same microscopic process, there is nocommonly accepted form for the equations governing the fluid dynamics in the region wherestructural relaxation and thermal diffusion occur on the same timescale. The main difficultyarises when more than one single thermodynamic derivative has to be generalized to have afrequency dependence and one has to introduce free parameters relating the relaxation timesand shape parameters appearing in the various relaxation functions. In this paper, we presentan optical heterodyne transient grating (HD-TG) experiment [6] of liquid and supercooledglycerol covering a wide temperature range. First we studied the material response, performingHD-TG experiments with selective polarization configurations, so that we proved in this glass-former the response is dominated by the density relaxation excited by thermal effects (alsocalled impulsive stimulated thermal scattering, ISTS [7]). In the region where the structuraland entropic modes are temporally overlapped, a strong interaction between the two modes isobserved, manifesting as an apparent freezing of the structural relaxation time upon cooling,and a marked non-exponential decay of a long-time ISTS signal, usually governed by thermaldiffusion. This interaction produces a dip in the T dependence of the apparent thermalconductivity of different supercooled liquids [4–6] that were previously unexplained. Theproposed model is thus capable of explaining these phenomena as the non-exponential decayof the long-time part of the ISTS data, providing the correct temperature behaviour of thethermal conductivity and structural relaxation times. ISTS data are quantitatively reproducedby a thermo-hydrodynamic model which assumes local thermodynamic equilibrium in anextended parameter space. Every parameter entering the model is a well defined physicalquantity. Using literature data we are able to predict ISTS responses in very good agreementwith the measured ones.
2. Transient grating experiments
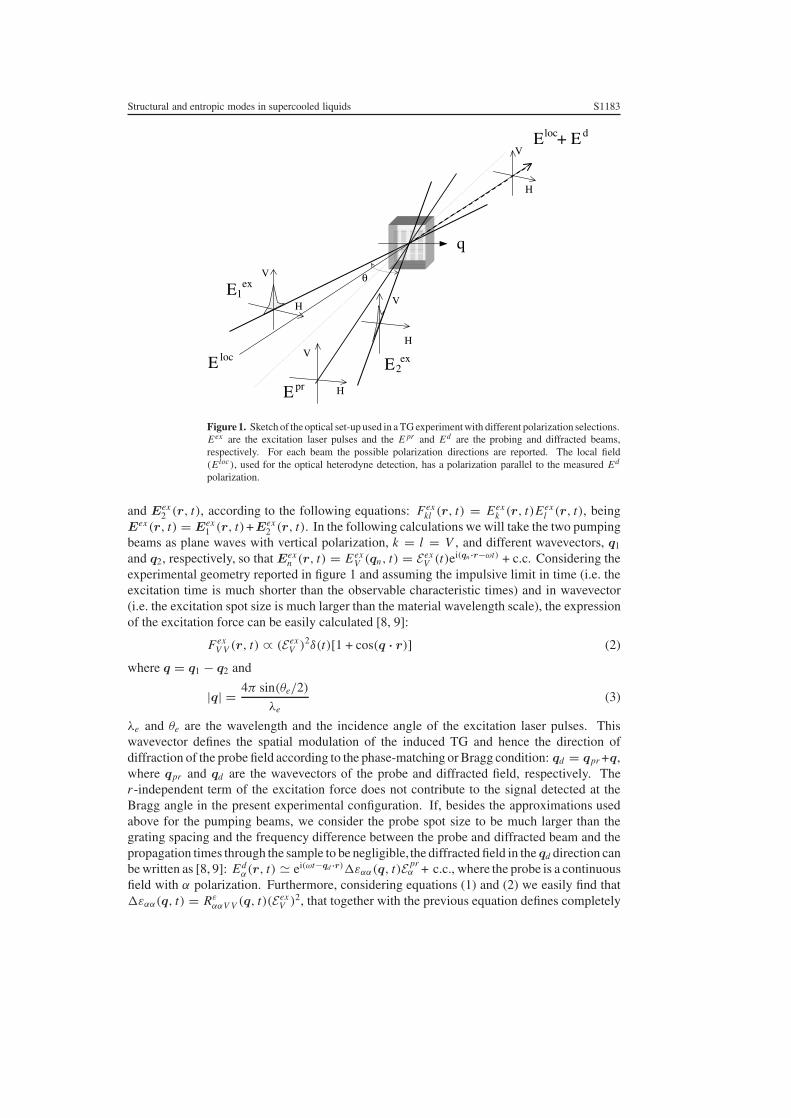
In a transient grating (TG) experiment two high power laser pulses, obtained by dividing asingle pulsed laser beam, interfere inside the sample and they produce a spatially periodicvariation of the index of refraction, see figure 1. A second laser beam, typically of a differentwavelength, is acting as a probe. It impinges on the induced grating at the Bragg angle and itproduces a diffracted beam, spatially separated by the pump pulses and probe beam itself. Thisdiffracted beam is the signal measured in a TG experiment and it yields dynamic informationfrom the relaxing grating. This induced variation of the dielectric constant of the sample canbe described by the following expression [8, 9]:
�εi j(r, t) =∫
dr′∫
dt ′ Rεi jkl(r − r′, t − t ′)Fex
kl (r′, t ′) (1)
where Fexkl represents the exciting force produced by the two pumping pulses of the pump, k
and l being the Cartesian coordinates of the electric fields of these beams, while j and i referto the electric fields of the probe and the diffracted beams, respectively. Rε
i jkl is the responsefunction of the system that defines the dynamical properties of the experimental observable,the local dielectric tensor, �εi j . The response function has a tensorial nature, Ri jkl , wherethe different components are selected through the excitation, probing and detection directionsof polarizations. In the experiments performed here, the directions of the four electric fieldswere such that i = j and k = l, so that only the Rααββ components were detected. We willconsider α or β = V if the polarization is orthogonal to the scattering plane, or α, β = Hif the polarization is parallel to the scattering plane, see figure 1. The exciting force isdefined by the interference field, Eex(r, t), produced by the two pumping beams, Eex
1 (r, t)
Structural and entropic modes in supercooled liquids S1183
E + Ed
E pr
E1ex
V
H
q
θ
E2exV
H
V
H
V
H
E
loc
loc
Figure 1. Sketch of the optical set-up used in a TG experiment with different polarization selections.Eex are the excitation laser pulses and the E pr and Ed are the probing and diffracted beams,respectively. For each beam the possible polarization directions are reported. The local field(Eloc), used for the optical heterodyne detection, has a polarization parallel to the measured Ed
polarization.
and Eex2 (r, t), according to the following equations: Fex
kl (r, t) = Eexk (r, t)Eex
l (r, t), beingEex(r, t) = Eex
1 (r, t)+Eex2 (r, t). In the following calculations we will take the two pumping
beams as plane waves with vertical polarization, k = l = V , and different wavevectors, q1
and q2, respectively, so that Eexn (r, t) = Eex
V (qn, t) = EexV (t)ei(qn ·r−ωt) + c.c. Considering the
experimental geometry reported in figure 1 and assuming the impulsive limit in time (i.e. theexcitation time is much shorter than the observable characteristic times) and in wavevector(i.e. the excitation spot size is much larger than the material wavelength scale), the expressionof the excitation force can be easily calculated [8, 9]:
FexV V (r, t) ∝ (Eex
V )2δ(t)[1 + cos(q · r)] (2)
where q = q1 − q2 and
|q| = 4π sin(θe/2)
λe(3)
λe and θe are the wavelength and the incidence angle of the excitation laser pulses. Thiswavevector defines the spatial modulation of the induced TG and hence the direction ofdiffraction of the probe field according to the phase-matching or Bragg condition: qd = qpr +q,where qpr and qd are the wavevectors of the probe and diffracted field, respectively. Ther -independent term of the excitation force does not contribute to the signal detected at theBragg angle in the present experimental configuration. If, besides the approximations usedabove for the pumping beams, we consider the probe spot size to be much larger than thegrating spacing and the frequency difference between the probe and diffracted beam and thepropagation times through the sample to be negligible, the diffracted field in the qd direction canbe written as [8, 9]: Ed
α(r, t) � ei(ωt−qd ·r)�εαα(q, t)E prα + c.c., where the probe is a continuous
field with α polarization. Furthermore, considering equations (1) and (2) we easily find that�εαα(q, t) = Rε
ααV V (q, t)(EexV )2, that together with the previous equation defines completely
S1184 R Di Leonardo et al
the diffracted field as Edα(r, t) � ei(ωt−qd ·r) Rε
ααV V (q, t)E prα (Eex
V )2+c.c. In a HD-TG experiment[6] the measured signal is S(t) ∝ 〈(Ed + Eloc)2〉 = 〈(Ed)2〉 + 〈(Eloc)2〉 + 2〈(Ed Eloc)〉, whereEloc is the local field used as the beating field and 〈·〉 represents the time average over theoptical period. In the previous equation, the last term is the heterodyne contribution and it canbe experimentally extracted by performing measurements characterized by selected phases ofthe local field. Finally, the heterodyne signal is
SH DααV V (q, t) � Rε
ααV V (q, t)E locα E pr
α (EexV )2. (4)
Hence, according to the present experimental configuration and approximations, the HD-TGsignal measures directly the relaxation processes defined by the tensor components Rε
ααV V ofthe dielectric response function. In particular, the two components Rε
V V V V and RεH H V V can be
measured using the α = V or H polarizations of the probe and diffracted fields. Formally, thedielectric response function contains all the physical information that these experiments canobtain. Nevertheless to define properly the connection between the material modes and themeasured signal, we have to consider again the key processes of these experiments. Three stepscan be identified: the first step is concerned with the forcing process and how effective it is inthe excitation of the material modes; the second step defines how these modes propagate andmodify the local dielectric properties of the material; the last step is the probing process thatdefines how the experiment measures the induced modification of the dielectric function. In theexcitation process, the interference electric field interacts with the material through differentphysical mechanisms. As reported in [6, 10–12], three main effects have to be consideredfor near-infrared pulsed excitation in weakly absorbing materials (absorption typically due toovertone and/or combination of vibrational bands):
(a) heat deposition (this has been reported as thermal effects),(b) the electrostriction effect (often called the Brillouin effect), and(c) the electric torque applied to the molecules by the electric field because of the presence
of an anisotropic polarizability (reported as the optical Kerr effect [13]).
Indeed electronic effects are also present but we will not take these into account since inthe present experiment they do not contribute to the response function (in fact, they relax ona timescale much shorter than the pulse duration). So Fex , that is the dielectric excitationforce, indeed produces three excitation forces that drive the material modes: Fhd , a heatdeposition force that drives directly the energy equation, Fes an electrostrictive force thatdrives the density and Fet a electrotorque force that drives the local orientational distributionof the molecules. All of these forces are normally present but, depending on the nature of theradiation–material interaction, some of them cannot be effective. The excitation brings thematerial out of equilibrium and, in the framework of non-linear response theory, the responsefunction describes how the system relaxes back toward the equilibrium state. Rε describes therelaxation of the dielectric properties but, of course, it is directly connected with the relaxationfunctions of the material modes [6, 14]; which modes are effective in defining the dielectricrelaxation depends on which forcing component is active and on the equations governing themodes’ dynamics. In other words, since the equations that define the dynamics of thermal,density and orientational variables are coupled, more then one material mode has to be takeninto account, even if a single force is efficient. For example, it has been shown by Taschinet al [10, 15] that in the glass-former m-toluidine the heating effect is the main driving forcebut, due to roto-translational coupling effects, both density and local orientation variables arepresent in the relaxation process. In this material, the heating force produces a density grating(or, better, a phase grating) and an orientational grating (a birefringence grating) and both thesegratings will contribute to the probing process. Indeed, which excitation forces and material
Structural and entropic modes in supercooled liquids S1185
100
101
102
103
104
105
106
T = 230 K
HHVV VVVV
Time [ns]
HHVV VVVV
T = 256 K
HD
-TG
Sig
nal [
Arb
. Un.
]
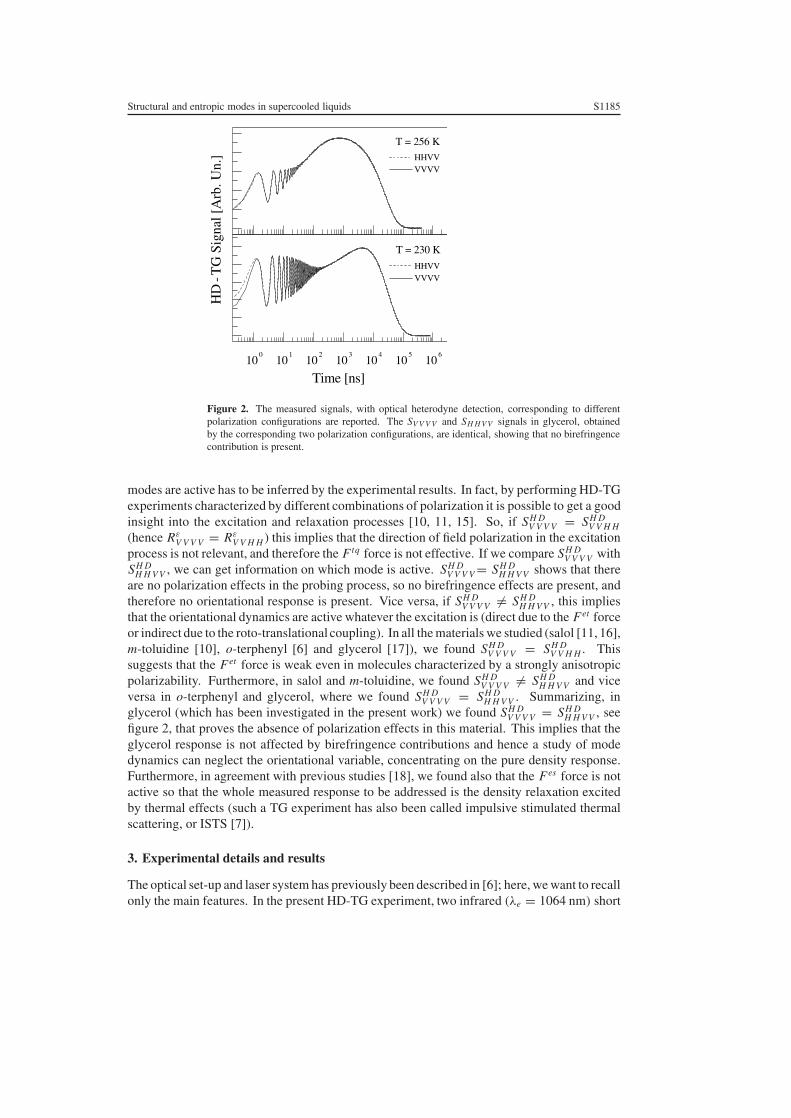
Figure 2. The measured signals, with optical heterodyne detection, corresponding to differentpolarization configurations are reported. The SV V V V and SH H V V signals in glycerol, obtainedby the corresponding two polarization configurations, are identical, showing that no birefringencecontribution is present.
modes are active has to be inferred by the experimental results. In fact, by performing HD-TGexperiments characterized by different combinations of polarization it is possible to get a goodinsight into the excitation and relaxation processes [10, 11, 15]. So, if SH D
V V V V = SH DV V H H
(hence RεV V V V = Rε
V V H H ) this implies that the direction of field polarization in the excitationprocess is not relevant, and therefore the Ftq force is not effective. If we compare SH D
V V V V withSH D
H H V V , we can get information on which mode is active. SH DV V V V = SH D
H H V V shows that thereare no polarization effects in the probing process, so no birefringence effects are present, andtherefore no orientational response is present. Vice versa, if SH D
V V V V �= SH DH H V V , this implies
that the orientational dynamics are active whatever the excitation is (direct due to the Fet forceor indirect due to the roto-translational coupling). In all the materials we studied (salol [11, 16],m-toluidine [10], o-terphenyl [6] and glycerol [17]), we found SH D
V V V V = SH DV V H H . This
suggests that the Fet force is weak even in molecules characterized by a strongly anisotropicpolarizability. Furthermore, in salol and m-toluidine, we found SH D
V V V V �= SH DH H V V and vice
versa in o-terphenyl and glycerol, where we found SH DV V V V = SH D
H H V V . Summarizing, inglycerol (which has been investigated in the present work) we found SH D
V V V V = SH DH H V V , see
figure 2, that proves the absence of polarization effects in this material. This implies that theglycerol response is not affected by birefringence contributions and hence a study of modedynamics can neglect the orientational variable, concentrating on the pure density response.Furthermore, in agreement with previous studies [18], we found also that the Fes force is notactive so that the whole measured response to be addressed is the density relaxation excitedby thermal effects (such a TG experiment has also been called impulsive stimulated thermalscattering, or ISTS [7]).
3. Experimental details and results
The optical set-up and laser system has previously been described in [6]; here, we want to recallonly the main features. In the present HD-TG experiment, two infrared (λe = 1064 nm) short
S1186 R Di Leonardo et al
320 K
HD
-TG
Sig
nal [
Arb
. Un.
] 290 K
252 K
100
101
102
103
104
105
220 K
Time [ns]
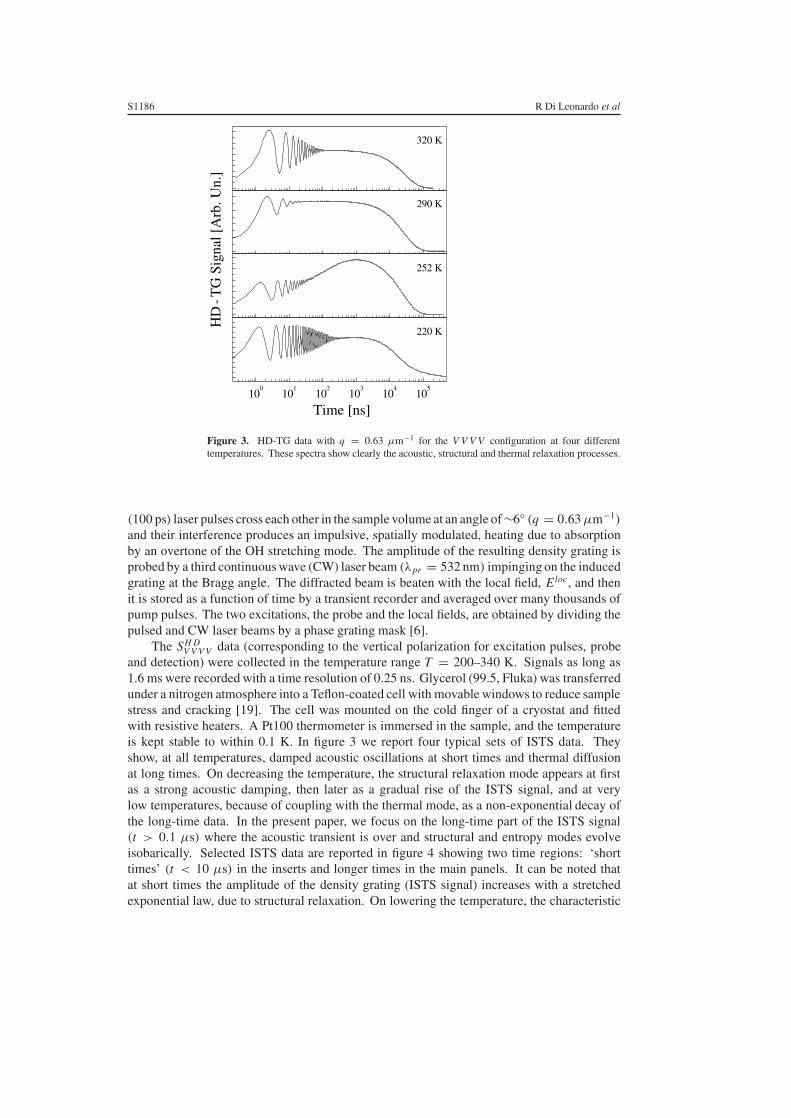
Figure 3. HD-TG data with q = 0.63 µm−1 for the V V V V configuration at four differenttemperatures. These spectra show clearly the acoustic, structural and thermal relaxation processes.
(100 ps) laser pulses cross each other in the sample volume at an angle of ∼6◦ (q = 0.63 µm−1)
and their interference produces an impulsive, spatially modulated, heating due to absorptionby an overtone of the OH stretching mode. The amplitude of the resulting density grating isprobed by a third continuous wave (CW) laser beam (λpr = 532 nm) impinging on the inducedgrating at the Bragg angle. The diffracted beam is beaten with the local field, Eloc, and thenit is stored as a function of time by a transient recorder and averaged over many thousands ofpump pulses. The two excitations, the probe and the local fields, are obtained by dividing thepulsed and CW laser beams by a phase grating mask [6].
The SH DV V V V data (corresponding to the vertical polarization for excitation pulses, probe
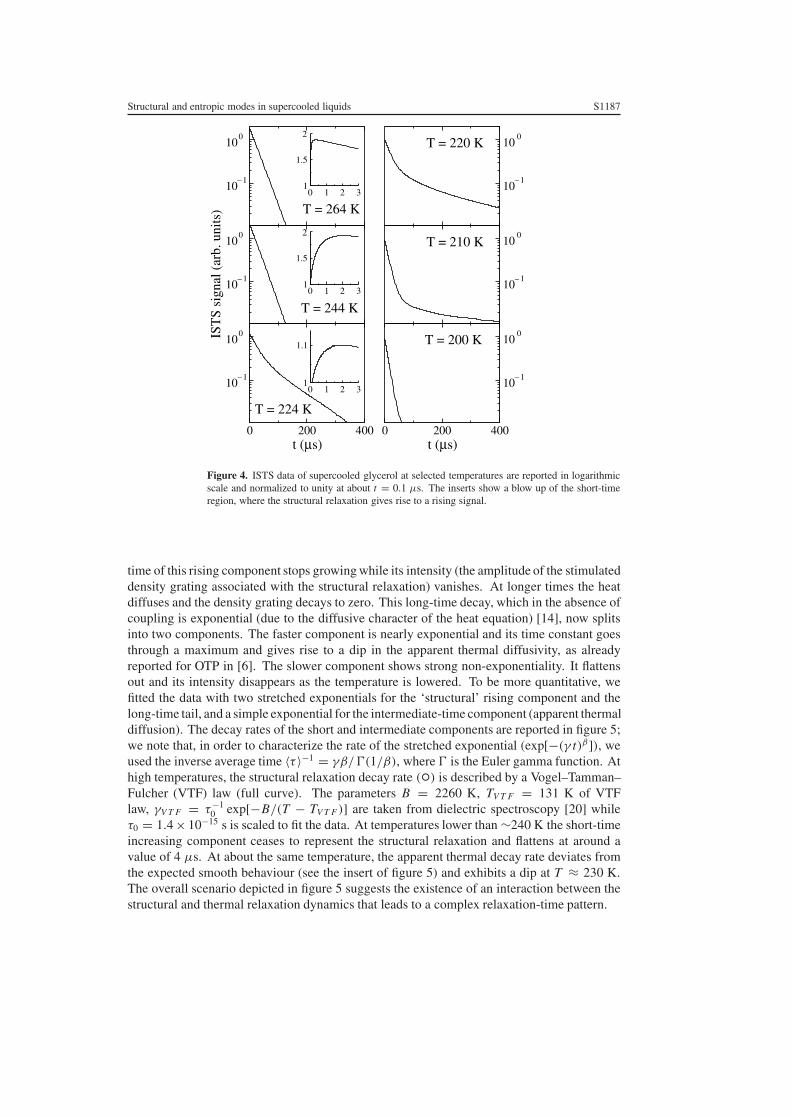
and detection) were collected in the temperature range T = 200–340 K. Signals as long as1.6 ms were recorded with a time resolution of 0.25 ns. Glycerol (99.5, Fluka) was transferredunder a nitrogen atmosphere into a Teflon-coated cell with movable windows to reduce samplestress and cracking [19]. The cell was mounted on the cold finger of a cryostat and fittedwith resistive heaters. A Pt100 thermometer is immersed in the sample, and the temperatureis kept stable to within 0.1 K. In figure 3 we report four typical sets of ISTS data. Theyshow, at all temperatures, damped acoustic oscillations at short times and thermal diffusionat long times. On decreasing the temperature, the structural relaxation mode appears at firstas a strong acoustic damping, then later as a gradual rise of the ISTS signal, and at verylow temperatures, because of coupling with the thermal mode, as a non-exponential decay ofthe long-time data. In the present paper, we focus on the long-time part of the ISTS signal(t > 0.1 µs) where the acoustic transient is over and structural and entropy modes evolveisobarically. Selected ISTS data are reported in figure 4 showing two time regions: ‘shorttimes’ (t < 10 µs) in the inserts and longer times in the main panels. It can be noted thatat short times the amplitude of the density grating (ISTS signal) increases with a stretchedexponential law, due to structural relaxation. On lowering the temperature, the characteristic
Structural and entropic modes in supercooled liquids S1187
10– 1
100
0 1 2 31
1.5
2
10– 1
100
10– 1
100
IST
S si
gnal
(ar
b. u
nits
)
0 1 2 31
1.5
2
10– 1
100
0 200 400t (µs)
10– 1
100
0 1 2 31
1.1
0 200 400t (µs)
10– 1
100
T = 264 K
T = 244 K
T = 224 K
T = 220 K
T = 210 K
T = 200 K
Figure 4. ISTS data of supercooled glycerol at selected temperatures are reported in logarithmicscale and normalized to unity at about t = 0.1 µs. The inserts show a blow up of the short-timeregion, where the structural relaxation gives rise to a rising signal.
time of this rising component stops growing while its intensity (the amplitude of the stimulateddensity grating associated with the structural relaxation) vanishes. At longer times the heatdiffuses and the density grating decays to zero. This long-time decay, which in the absence ofcoupling is exponential (due to the diffusive character of the heat equation) [14], now splitsinto two components. The faster component is nearly exponential and its time constant goesthrough a maximum and gives rise to a dip in the apparent thermal diffusivity, as alreadyreported for OTP in [6]. The slower component shows strong non-exponentiality. It flattensout and its intensity disappears as the temperature is lowered. To be more quantitative, wefitted the data with two stretched exponentials for the ‘structural’ rising component and thelong-time tail, and a simple exponential for the intermediate-time component (apparent thermaldiffusion). The decay rates of the short and intermediate components are reported in figure 5;we note that, in order to characterize the rate of the stretched exponential (exp[−(γ t)β]), weused the inverse average time 〈τ 〉−1 = γβ/�(1/β), where � is the Euler gamma function. Athigh temperatures, the structural relaxation decay rate (◦) is described by a Vogel–Tamman–Fulcher (VTF) law (full curve). The parameters B = 2260 K, TV T F = 131 K of VTFlaw, γV T F = τ−1
0 exp[−B/(T − TV T F )] are taken from dielectric spectroscopy [20] whileτ0 = 1.4 × 10⁻¹⁵ s is scaled to fit the data. At temperatures lower than ∼240 K the short-timeincreasing component ceases to represent the structural relaxation and flattens at around avalue of 4 µs. At about the same temperature, the apparent thermal decay rate deviates fromthe expected smooth behaviour (see the insert of figure 5) and exhibits a dip at T ≈ 230 K.The overall scenario depicted in figure 5 suggests the existence of an interaction between thestructural and thermal relaxation dynamics that leads to a complex relaxation-time pattern.

S1188 R Di Leonardo et al
210 220 230 240 250 260T( K )
10– 1
100
101
< τ
>–
1 ( µ
s–1 )
220 230 240 250
0.03
0.05
0.07
Figure 5. Temperature dependence of characteristic rates for the short rising component-apparentstructural relaxation (◦) and intermediate exponential decay-apparent thermal diffusion (•). Thefull curve is the VTF law γV T F = τ−1
0 exp[−2260 K/(T − 131 K)].
4. Non-equilibrium thermodynamic model and data interpretation
In the following, we will introduce a non-equilibrium-thermodynamic (NET) model that willallow us to compute the temperature evolution of this relaxation-time pattern and we findvery good agreement with the experimental observations. NET [21] provides a very powerfulframework to study irreversible processes, such as heat conduction, diffusion and viscous flow,from a unified point of view. However, in this formalism, it is not straightforward to considerthe non-exponentiality observed in the structural relaxation dynamics. On the contrary, thepresence of a large number of internal relaxing variables can be easily taken into account,provided that local thermodynamic equilibrium is valid in the extended parameter space.Therefore, following Allain et al [4], we choose to represent the observed non-exponentialityas the result of the superposition of N linearly relaxing variables. The number N should notbe read as a number of well-defined physical variables, but rather as the discrete representationof either a distribution of independent Debye relaxing variables, or a single strongly non-exponential relaxing variable. The choice of representing a distribution of relaxation timesas a sum of exponential decays is imposed by our will to approach the problem within theframework of non-equilibrium thermodynamics in its usual linear formulation. It is importantto note that the specific studies and experiments presented in this work do not allow one to findwhether the underlying relaxation process is homogeneous and intrinsically non-exponentialor if it is heterogeneous, i.e. the superposition of different, spatially separated, genuine Debyeprocesses (see [22] for a comprehensive review on the subject). In this hypothesis, the Gibbsfree energy law per unit mass is
dg = v d p − s dT −N∑
i=1
Ai dξ i (5)
where p is the pressure, s is the entropy, Ai is the affinity of the i th relaxation process andξ i is the corresponding progress variable (or order parameter). We remark that the followinganalysis is independent from the precise physical meaning of the ξ parameters; it only relieson the fact that
(i) they are frozen on a timescale shorter than the structural relaxation time (τα);(ii) they relax toward their equilibrium values on a timescale much greater than τα .
Structural and entropic modes in supercooled liquids S1189
As noted above, we are interested in the time region where the pressure becomes and staysuniform. In this time region, the linearized non-equilibrium thermodynamic equations [21]written in terms of the q components of the thermodynamic variables (e.g. T stands forT (t) = ∫
exp(iqr)T (, t)), are
p = 0T0ρ0(∂s/∂ t) = −q2λT∂ξ i/∂ t = −β i Ai
(6)
where T0 (ρ0) is the average temperature (density), λ is the thermal conductivity and β i arephenomenological constants. The first equation of (6) comes from the linearized combinedmass momentum conservation laws:
∂2ρ/∂ t2 + (ηq2/ρ0)∂ρ/∂ t + q2 p = 0.
After acoustic transient, the terms involving derivatives of density are negligible. The secondand third equations of (6) represent the energy conservation law and the phenomenologicalrelations for the relaxation processes, respectively. In order to close the above set of equations,we use the local thermal equilibrium in the extended parameter space:
ρ = ρ(p, T, ξ1, . . . , ξ N ),
s = s(p, T, ξ1, . . . , ξ N ),
Ai = Ai (p, T, ξ i ).
(7)
For simplicity, we assume that the thermodynamic affinity Ai does not depend on ξ j for j �= i .Differentiating the above equations and substituting in (6) we obtain
ρ = −ρ0α∞ T + (ρ20 c∞
p /T0)
N∑i=1
�i(ξ ip/ξ
iT )ζ i (8)
∂T/∂ t = −�∞H T −
N∑i=1
�iR�i (T − ζ i) (9)
∂ζ i/∂ t = −�iR(ζ i − T ), (10)
where we have introduced the following symbols:
α∞ = −ρ−1(∂ρ/∂T )pξ c∞p = T0(∂S/∂T )pξ
�i = T0 Aiξ ξ
i2T /c∞
p Aiξ = (∂ Ai/∂ξ i)pT
ξ ip = (∂ξ i/∂p)Ai T ξ i
T = (∂ξ i/∂T )Ai p (11)
ζ i = ξ i/ξ iT �∞
H = λq2/ρ0c∞p .
The ISTS density response is obtained by solving (9), (10) for the initial condition T (0) �= 0,ξ i (0) = 0 and then substituting in (8). To reduce the number of parameters, we use thesimplifying assumption that ξ i
p/ξiT is independent of i [4]. In that case, ρ(t) can be written as
ρ(t)/ρ(0) = −T (t)/T (0) − �α
α∞
c∞p
�cp
N∑i=1
�iζ i(t) (12)
where �α and �cp are the jumps from the relaxed to the unrelaxed (with respect to the ζ i )values of the corresponding thermodynamic derivatives:
�α = −ρ0
∑Ai
ξ ξipξ
iT
�cp = T0
∑Ai
ξ (ξiT )2.
S1190 R Di Leonardo et al
10–1
100
0 0.5 1 1.51
1.5
2
2.5
3
10– 3
10– 2
10– 1
100
0 100 200 300t (µs)
10–1
100
IST
S si
gnal
(ar
b. u
nits
)
0 2 4 6 8 101
1.2
1.4
0 200 400 600t (µs)
10– 3
10– 2
10– 1
T = 252 K
T = 228 K
T = 210 K
T = 203 K
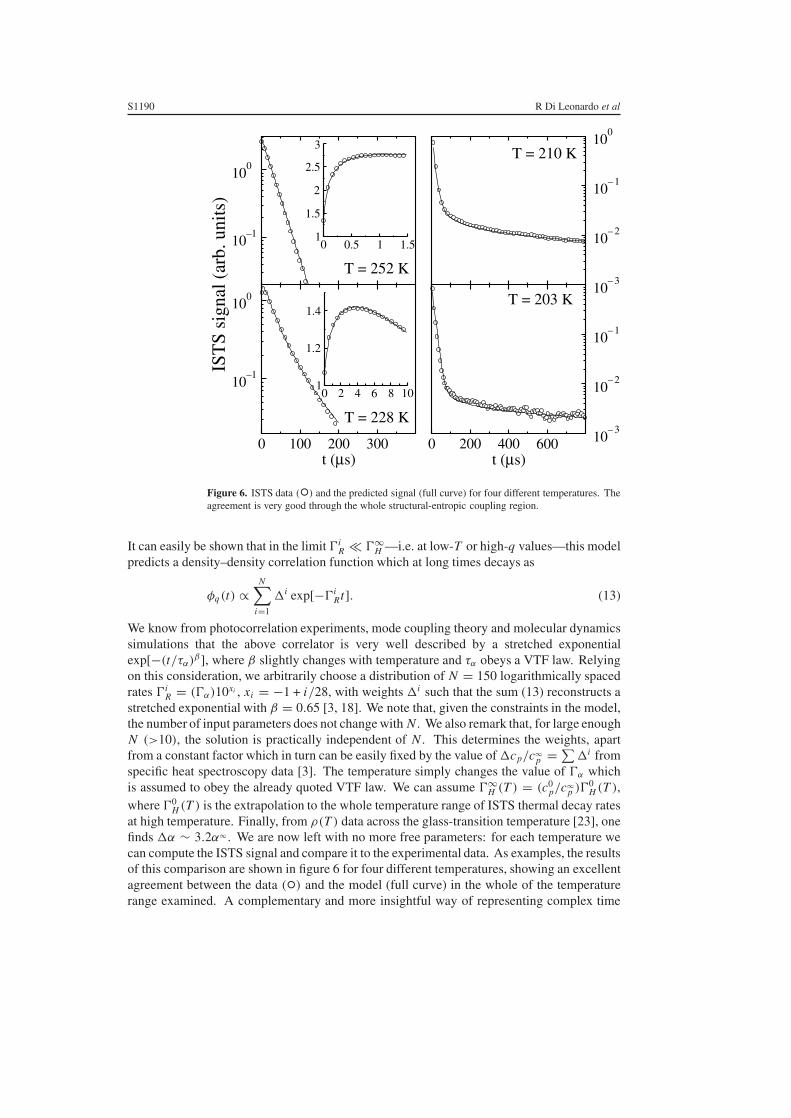
Figure 6. ISTS data (◦) and the predicted signal (full curve) for four different temperatures. Theagreement is very good through the whole structural-entropic coupling region.
It can easily be shown that in the limit �iR �∞
H —i.e. at low-T or high-q values—this modelpredicts a density–density correlation function which at long times decays as
φq(t) ∝N∑
i=1
�i exp[−�iRt]. (13)
We know from photocorrelation experiments, mode coupling theory and molecular dynamicssimulations that the above correlator is very well described by a stretched exponentialexp[−(t/τα)
β], where β slightly changes with temperature and τα obeys a VTF law. Relyingon this consideration, we arbitrarily choose a distribution of N = 150 logarithmically spacedrates �i
R = (�α)10xi , xi = −1 + i/28, with weights �i such that the sum (13) reconstructs astretched exponential with β = 0.65 [3, 18]. We note that, given the constraints in the model,the number of input parameters does not change with N . We also remark that, for large enoughN (>10), the solution is practically independent of N . This determines the weights, apartfrom a constant factor which in turn can be easily fixed by the value of �cp/c∞
p = ∑�i from
specific heat spectroscopy data [3]. The temperature simply changes the value of �α whichis assumed to obey the already quoted VTF law. We can assume �∞
H (T ) = (c0p/c∞
p )�0H (T ),
where �0H (T ) is the extrapolation to the whole temperature range of ISTS thermal decay rates
at high temperature. Finally, from ρ(T ) data across the glass-transition temperature [23], onefinds �α ∼ 3.2α∞ . We are now left with no more free parameters: for each temperature wecan compute the ISTS signal and compare it to the experimental data. As examples, the resultsof this comparison are shown in figure 6 for four different temperatures, showing an excellentagreement between the data (◦) and the model (full curve) in the whole of the temperaturerange examined. A complementary and more insightful way of representing complex time
Structural and entropic modes in supercooled liquids S1191
4 2 0 2 4log 10 ( )Γα/ ΓH
∞
−1
−0.5
0
0.5
1
1.5
2
G[log10
() ]
γ/ΓH∞
-2log
10( γ / Γ
H
∞ )
0.5
0
-0.5
-1
-2
r = 2
-4
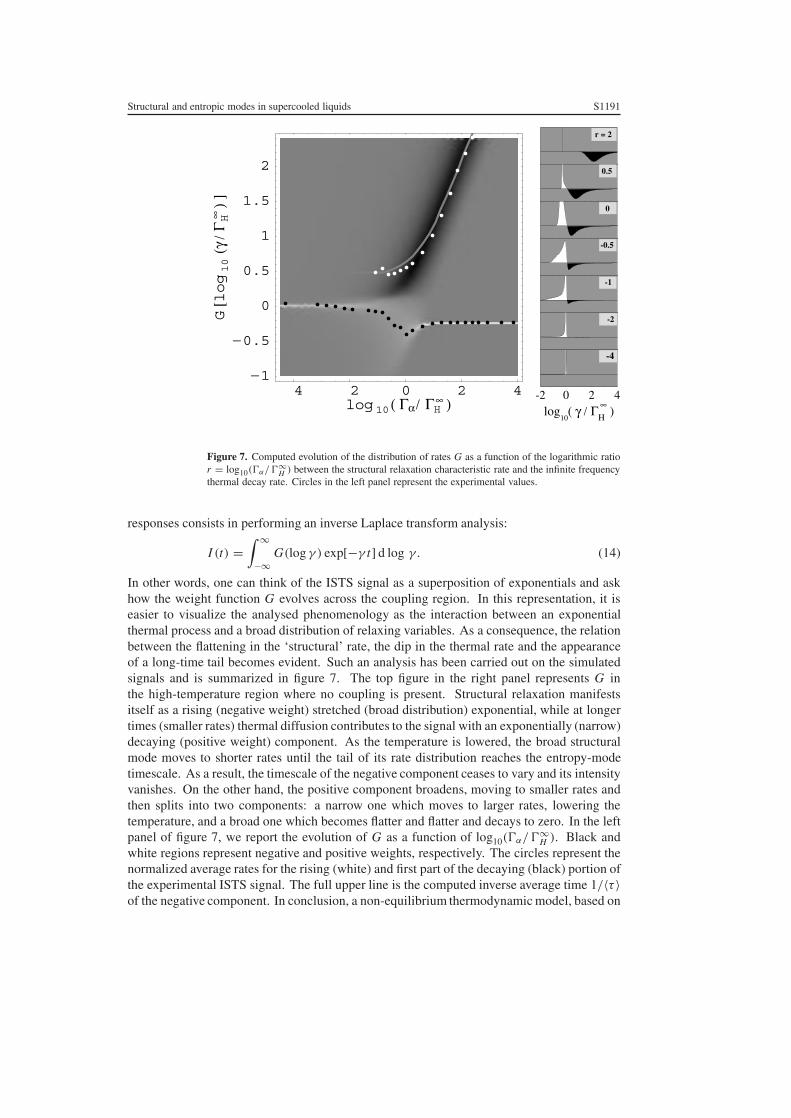
Figure 7. Computed evolution of the distribution of rates G as a function of the logarithmic ratior = log10(�α/�∞
H ) between the structural relaxation characteristic rate and the infinite frequencythermal decay rate. Circles in the left panel represent the experimental values.
responses consists in performing an inverse Laplace transform analysis:
I (t) =∫ ∞
−∞G(log γ ) exp[−γ t] d log γ. (14)
In other words, one can think of the ISTS signal as a superposition of exponentials and askhow the weight function G evolves across the coupling region. In this representation, it iseasier to visualize the analysed phenomenology as the interaction between an exponentialthermal process and a broad distribution of relaxing variables. As a consequence, the relationbetween the flattening in the ‘structural’ rate, the dip in the thermal rate and the appearanceof a long-time tail becomes evident. Such an analysis has been carried out on the simulatedsignals and is summarized in figure 7. The top figure in the right panel represents G inthe high-temperature region where no coupling is present. Structural relaxation manifestsitself as a rising (negative weight) stretched (broad distribution) exponential, while at longertimes (smaller rates) thermal diffusion contributes to the signal with an exponentially (narrow)decaying (positive weight) component. As the temperature is lowered, the broad structuralmode moves to shorter rates until the tail of its rate distribution reaches the entropy-modetimescale. As a result, the timescale of the negative component ceases to vary and its intensityvanishes. On the other hand, the positive component broadens, moving to smaller rates andthen splits into two components: a narrow one which moves to larger rates, lowering thetemperature, and a broad one which becomes flatter and flatter and decays to zero. In the leftpanel of figure 7, we report the evolution of G as a function of log10(�α/�∞
H ). Black andwhite regions represent negative and positive weights, respectively. The circles represent thenormalized average rates for the rising (white) and first part of the decaying (black) portion ofthe experimental ISTS signal. The full upper line is the computed inverse average time 1/〈τ 〉of the negative component. In conclusion, a non-equilibrium thermodynamic model, based on
S1192 R Di Leonardo et al
the assumption of local thermodynamic equilibrium in an extended parameter space, accountsfor the rich phenomenology observed in the ISTS experiments. In particular, using new ISTSdata on supercooled glycerol in the temperature region where the structural relaxation andthe thermal diffusion process take place on the same timescale, we have demonstrated that themodel is able to reproduce experimental data using data from other experiments in the literature.Further investigations into the possibility of assuming local thermodynamic equilibrium insupercooled liquids are crucial to the development of a thermodynamic description of glass-forming liquids.
Acknowledgments
This work was supported by INFM, MIUR and EC grant no HPRI-CT1999-00111.
References
[1] Mountain R D 1968 Rev. Mod. Phys. 38 205[2] Zwanzig R 1988 J. Chem. Phys. 88 5831[3] Birge N O 1986 Phys. Rev. B 34 1631[4] Allain C, Lallemand P and Ostrowsky N 1976 Mol. Phys. 31 581
Allain C and Lallemand P 1979 J. Physique 48 679[5] Kohler W, Fytas G, Steffen W and Reinhardt L 1996 J. Chem. Phys. 104 248[6] Torre R, Taschin A and Sampoli M 2001 Phys. Rev. E 64 61504[7] Yang Y and Nelson K A 1995 Phys. Rev. Lett. 74 4883[8] Eichler H J, Gunter P and Pohl D W 1986 Laser-Induced Dynamic Gratings (Berlin: Springer)[9] Yan Y and Nelson K A 1987 J. Chem. Phys. 87 6240
Yan Y and Nelson K A 1987 J. Chem. Phys. 87 6257[10] Taschin A, Torre R, Ricci M, Sampoli M, Dreyfus C and Pick R M 2001 Europhys. Lett. 56 407[11] Glorieux C, Nelson K A, Hinze G and Fayer M D 2002 J. Chem. Phys. 116 3384[12] Hinze G, Francis R S and Fayer M D 1999 J. Chem. Phys. 88 6477[13] Torre R, Bartolini P and Pick R M 1998 Phys. Rev. E 57 1912
Torre R, Bartolini P, Ricci M and Pick R M 2000 Europhys. Lett. 52 324[14] Yang Y and Nelson K A 1995 J. Chem. Phys. 103 7722
Yang Y and Nelson K A 1995 J. Chem. Phys. 103 7732[15] Pick R M, Dreyfus C, Azzimani A, Taschin A, Ricci M, Torre R and Franosch T 2003 J. Phys.: Condens. Matter
15 S825[16] Taschin A et al 2003 in preparation[17] Di Leonardo R, Taschin A, Sampoli M, Torre R and Ruocco G 2003 Phys. Rev. E 67 015102(R)[18] Paolucci D M and Nelson K A 2000 J. Chem. Phys. 112 6725[19] Halalay I and Nelson K A 1990 Rev. Sci. Instrum. 61 3623[20] Lunkenheimer P et al 1995 Europhys. Lett. 33 611[21] de Groot S R and Mazur P 1962 Non Equilibrium Thermodynamics (New York: Dover)[22] Richert R 2002 J. Phys.: Condens. Matter 14 R703[23] Ubbelohde A R 1965 Melting and Crystal Structure (Oxford: Clarendon)[24] Demoulin C, Montrose C J and Ostrowsky N 1974 Phys. Rev. A 9 1740