Acoustic and relaxation processes in supercooled orthoterphenyl by optical-heterodyne transient...
35
arXiv:cond-mat/0106643v1 [cond-mat.dis-nn] 29 Jun 2001 Acoustic and relaxation processes in supercooled o-ter-phenyl by optical-heterodyne transient grating experiment R. Torre 1,2 , A. Taschin 1,3 , M. Sampoli 1,4 . 1 INFM, Unit` a di Firenze, largo E.Fermi 2, I-50125, Firenze, Italy 2 LENS, Universit` a di Firenze, largo E.Fermi 2, I-50125,Firenze,Italy 3 Dip. di Fisica, Universit` a di Firenze, largo E.Fermi 2, I-50125,Firenze, Italy. 4 Dip. di Energetica, Universit` a di Firenze, via S.Marta, Firenze, Italy. (6/1/2001) Abstract The dynamics of the fragile glass-forming o-ter-phenyl is investigated by time- resolved transient grating experiment with an heterodyne detection technique in a wide temperature range. We investigated the dynamics processes of this glass-former over more then 6 decades in time with an excellent signal/noise. Acoustic, structural and thermal relaxations have been clearly identify and measured in a time-frequency window not covered by previous spectroscopic investigations. A detailed comparison with the density response function, calculated on the basis of generalized hydrodynamics model, has been worked out. Typeset using REVT E X 1
-
Upload
independent -
Category
Documents
-
view
1 -
download
0
Transcript of Acoustic and relaxation processes in supercooled orthoterphenyl by optical-heterodyne transient...
arX
iv:c
ond-
mat
/010
6643
v1 [
cond
-mat
.dis
-nn]
29
Jun
2001
Acoustic and relaxation processes in supercooled o-ter-phenyl by
optical-heterodyne transient grating experiment
R. Torre1,2, A. Taschin1,3, M. Sampoli1,4.
1 INFM, Unita di Firenze, largo E.Fermi 2, I-50125, Firenze, Italy
2LENS, Universita di Firenze, largo E.Fermi 2, I-50125,Firenze,Italy
3Dip. di Fisica, Universita di Firenze, largo E.Fermi 2, I-50125,Firenze, Italy.
4Dip. di Energetica, Universita di Firenze, via S.Marta, Firenze, Italy.
(6/1/2001)
Abstract
The dynamics of the fragile glass-forming o-ter-phenyl is investigated by time-
resolved transient grating experiment with an heterodyne detection technique
in a wide temperature range. We investigated the dynamics processes of this
glass-former over more then 6 decades in time with an excellent signal/noise.
Acoustic, structural and thermal relaxations have been clearly identify and
measured in a time-frequency window not covered by previous spectroscopic
investigations. A detailed comparison with the density response function,
calculated on the basis of generalized hydrodynamics model, has been worked
out.
Typeset using REVTEX
1

I. INTRODUCTION
Supercooled liquids and glasses have been the subject, in these last years, of an extensive
theoretical and experimental study [1,2]. One of most important features of these materials
is the wide range of times scales over which relaxations occur at fixed and mostly changing
temperature. The relaxation times can span over many decades (up to 13 decades) when
temperature is varied from the melting to glass transition temperature. Indeed these re-
laxation processes have a complex nature that, despite the recent research efforts, remain
unclear in many aspects. Among the others, a fundamental issue is the interplay of different
dynamical variables present in these materials. So that the rotational dynamics and its cou-
pling with the translational variables are under an intense experimental investigation [3–5].
Even when a single variable (e.g. density) is studied, many processes are involved in the
glass dynamics (like for example the acoustic, structural and thermal relaxation) and they
are usually characterized by different time scales. From the experimental point of view, it
is of fundamental importance to measure the investigated variables over the full temporal
or frequency range. Often this is accomplished hardly by the combination of several tech-
niques (e.g. Light Scattering, Photon Correlation Spectroscopy, etc.) since, even if the same
experimental observable is tested, the very wide frequency or time domain with possible not
overlapping range, preserves a reliable analysis of the data.
The transient grating technique (TG) is well know to give a unique experimental insight
in the dynamics of fluid and glassy material [6]. Recently this technique has been applied
to the study of dynamics of supercooled liquids [7]. Using a CW beam probe it has been
covered a very wide temporal range, from n sec to m sec, in a single experiment giving an
unique access to the glass dynamics.
In this paper we present a study of relaxation dynamics of the fragile glass-former ortho-
ter-phenyl (OTP) by optical Heterodyne Detected Transient Grating (HD-TG) experiment.
Acoustic, thermal and structural relaxations are investigated in wide temperature range,
from above the melting down to the glass-transition. This HD-TG experiment produces data
2

with an extremely high signal/noise ratio and allows to detected and measure signals even
of very low level. We present a study of the complex relaxation pattern of the density in a
prototype of the fragile glass-formers, OTP, and we put in evidence some new features of the
slow thermal relaxation that can not be properly account for by the standard hydrodynamic
model.
The paper begins (sec. II) with a brief description of the transient grating experiment
and in particular underlines the improvements that can be obtained by using an optical
heterodyne detection. In sec. III the theoretical background needed for data analysis and
interpretation is given. A detailed description of the OTP measurements is written in sec.
IV and in sec. V we present all data and their analysis. The last sec. VI is devoted to
discussions and conclusions.
II. HETERODYNE TRANSIENT GRATING EXPERIMENT
In a transient grating (TG) experiment two high power laser pulses interfere inside the
sample and produce a spatially periodic variation of the index of refraction [6,8]. A third
laser beam, typically of different wavelength, is acting as a probe by impinging on the
induced grating at the Bragg angle and producing a diffracted beam, spatially separated by
the pump pulses and probe beam, see fig.1. This diffracted beam is the signal measured in
a TG experiments and yields the dynamic information from the relaxing TG. The spatial
modulation in the TG defines a wave-vector q characterizing the diffracted beam and hence
the signal. The q wave-vector is:
q =4π sin
(θe
2
)
λe
(1)
where λe and θe are the wavelength and the incidence angle of the excitation laser pulses.
When, as usual, the homodyne scheme is used to detect the diffracted beam, the diffraction
efficiency results to be proportional to the square of the refraction index variation so that
small variations produce even smaller signal. A considerable improvement can be obtained
3

by using an optical heterodyne detection (HD). Indeed in our HD-TG experiment, the
measured signal is given by:
S(q, t) ∝⟨|Ed(q, t)|
2⟩ +⟨|El|
2⟩ + 2 〈|Ed(q, t)|〉 〈|El|〉 cos ∆ϕ (2)
where Ed is the electric field diffracted by the TG, El is the local beating field and ∆ϕ
is the phase difference between the Ed and El, see fig.1, 〈·〉 represent the time-averaging
over the optical period, e.g. 〈|Ed(q, t)|〉 is the amplitude of the oscillating diffracted electric
field. The first, second and third terms in the r.h.s. of eq. 2, are the homodyne (⟨|Ed|
2⟩),
local field (⟨|El|
2⟩), and heterodyne contributions (2 〈|Ed(q, t)|〉 〈|El|〉 cos ∆ϕ) respectively.
Normally, the local field is kept constant and much higher than the diffracted one, so that the
homodyne contribution becomes negligible and the time variation of the signal is dominated
by the heterodyne term. In addition, this last term can be experimentally isolated by
subtracting two recorded signals with different phases, and in particular the first one, S+,
with ∆ϕ+ = 2nπ and the second, S−, with ∆ϕ− = (2n + 1)π (n integer). It is evident that:
SHD(q, t) = [S+ − S−] ∝ 〈|Ed(q, t)|〉 〈|El|〉 (3)
We have two major advantages in using the heterodyne instead of homodyne detection.
First, we can improve substantially the signal to noise ratio in the all time window, both
because of the high level of the local field and because of discarding spurious signals which
are not reversed by a π phase shift of the local field. Second, the sensitivity at long times
when the TG is vanishing, is enhanced enormously since the recorded signal is proportional
to 〈|Ed|〉 instead of being proportional to its square. In the studies of materials with a
weak scattering efficiency and complex response, these features turns out to be of basic
importance. Nevertheless, the effective realization of such a detection is quite difficult at
optical frequencies. Indeed to get an interferometric phase stability between the diffracted
and the local field is not a simply experimental task, and so only few HD-TG experiments
have been realized up to now [6]. Recently the introduction of phase gratings in the optical
setup of TG experiments has reduced considerably the difficulties of using a heterodyne
detection [9,10]. The details of this new setup will be described in Sec. IV A.
4
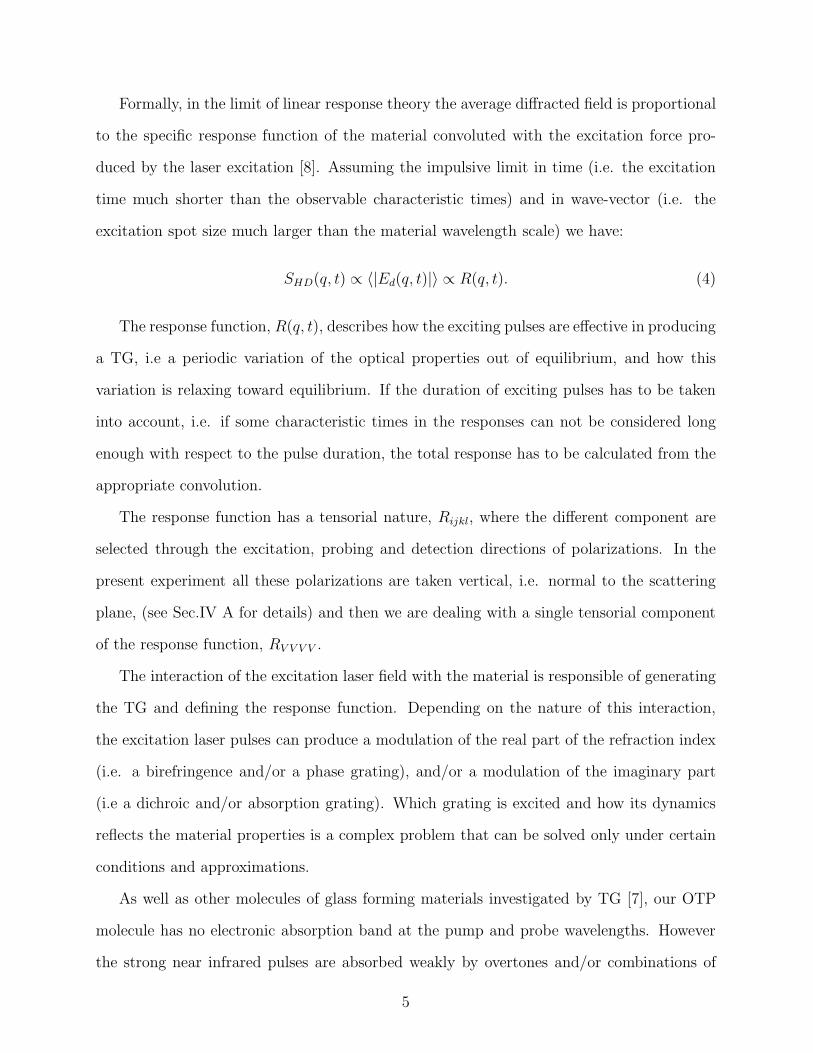
Formally, in the limit of linear response theory the average diffracted field is proportional
to the specific response function of the material convoluted with the excitation force pro-
duced by the laser excitation [8]. Assuming the impulsive limit in time (i.e. the excitation
time much shorter than the observable characteristic times) and in wave-vector (i.e. the
excitation spot size much larger than the material wavelength scale) we have:
SHD(q, t) ∝ 〈|Ed(q, t)|〉 ∝ R(q, t). (4)
The response function, R(q, t), describes how the exciting pulses are effective in producing
a TG, i.e a periodic variation of the optical properties out of equilibrium, and how this
variation is relaxing toward equilibrium. If the duration of exciting pulses has to be taken
into account, i.e. if some characteristic times in the responses can not be considered long
enough with respect to the pulse duration, the total response has to be calculated from the
appropriate convolution.
The response function has a tensorial nature, Rijkl, where the different component are
selected through the excitation, probing and detection directions of polarizations. In the
present experiment all these polarizations are taken vertical, i.e. normal to the scattering
plane, (see Sec.IV A for details) and then we are dealing with a single tensorial component
of the response function, RV V V V .
The interaction of the excitation laser field with the material is responsible of generating
the TG and defining the response function. Depending on the nature of this interaction,
the excitation laser pulses can produce a modulation of the real part of the refraction index
(i.e. a birefringence and/or a phase grating), and/or a modulation of the imaginary part
(i.e a dichroic and/or absorption grating). Which grating is excited and how its dynamics
reflects the material properties is a complex problem that can be solved only under certain
conditions and approximations.
As well as other molecules of glass forming materials investigated by TG [7], our OTP
molecule has no electronic absorption band at the pump and probe wavelengths. However
the strong near infrared pulses are absorbed weakly by overtones and/or combinations of
5
vibrational bands. Typically, these vibrational excitations thermalize in few picoseconds.
According to Nelson and co-worker [7] the induced TG can be described approximately as
a pure phase grating generated by two different mechanisms of laser-matter interaction: a
temperature grating produced by the field induced heating and a pressure electrostrictive
grating due to the field gradient. In this approach, no birefringence effects are taken in ac-
count, such as a modification of the molecular polarizability orientation due to field effects
(optical Kerr effect) or to a molecular alignment induced by roto-translation coupling. For
materials composed by molecules of nearly isotropic shape and without strong anisotropic
interactions, such as the OTP under the present investigation, the total response should be
considered mainly driven by the density. We verified experimentally this hypothesis measur-
ing the SHHV V signal (with the probe and detection polarizations, HH , perpendicular to the
excitation one, V V ) and comparing that with the SV V V V signal: no meaningful difference
has been detected for any temperature in OTP. So in this molecule no relevant birefringence
effects are present confirming that the response function can be mainly described by the
density dynamics. Viceversa strong difference has been detected in a other glass-former,
(e.g. m-toluidine and salol), showing that the response function of glass-formers made of
anisotropic molecules must include birefringence and roto-translational coupling effects [4].
By taking into account the two mechanism above mentioned, the measured signal is pro-
portional to the q-component of the density variations and is composed of three different
contributions: roughly speaking, two coming from the heating and one from the electrostric-
tion. i) The part of the solid like or fast liquid response of the sample to the sudden heat
flux, launches a sound wave of frequency ωA = cA q around the mean density at the new
local temperature. The sound wave is damped with the acoustic time constant τA and then
the local temperature relaxes with a time constant τH due to the thermal diffusivity. There-
fore this contribution can be written as: ρ(h,s)q ∝ [1 − exp(−t/τA) cos(ωA t)] exp(−t/τH). ii)
The part of viscous liquid response to the heat flux produces a slow density variation which
grows up with a time constant τR and vanishes again with the thermal diffusivity constant,
i.e. ρ(h,r)q ∝ [1 − exp(−t/τR)] exp(−t/τH).
6

iii) The sudden density momentum change due to the electrostriction launches a sound
wave of the same frequency ωA = cA q around the normal density which is damped always
with the same acoustic time constant, i.e. ρ(e)q ∝ exp(−t/τA) sin(ωA t).
Intuitively the sum of these contributions will be the measured signal. Obviously there
can be interactions among the contributions if the time constants are not well separated,
indeed this separation has been supposed implicitly in the previous derivation. Further,
the viscous response in supercooled liquids is made of a distribution of time constants in-
stead of single time. In the next section we derive the forced density fluctuations from the
hydrodynamic equations and important relations among the parameters we have introduced.
III. THEORETICAL BACKGROUND
The generalized hydrodynamics equations have been often used to describe the frequency
resolved light scattering experiments [11]. They express the conservation law the dynamics
of the fluid is subjected to: the conservation of mass, momentum and energy. As usual, we
neglect the effects of rotational dynamics, as already discussed and we use the linearized
form of the hydrodynamic equations (small fluctuation out of equilibrium) [12]. Since we
are interested to the q-component of the density fluctuations, we write directly the Fourier-
Laplace transform (FLT) of the continuity, Navier-Stokes, and energy equations. They read
s δρq(s) + i q Jq‖(s) = δρq(0)
[s + φL(s) q2] Jq‖(s) + i (qc2o/γ) [δρq(s) + α ρo δTq(s)] = Jq‖(0)
(s + γχq2) ρo δTq(s) + i [q(γ − 1)/α] Jq‖(s)δρq(s) + i q Jq‖(s) = ρo δTq(0)
where δxq(s) stand for the FLT of the fluctuating quantity δx(r, t), i.e.
δxq(s) =
∫ ∞
0
dt exp(−st)δxq(t) =
∫ ∞
0
dt exp(−st)
∫ +∞
−∞
d3r exp(iq · r) δx(r, t)
7
and ρo is the equilibrium mass density, Jq‖ the component parallel to q of the mass
current density, δTq the fluctuating temperature, co the adiabatic zero frequency sound
velocity, γ = Cp/Cv the ratio of the specific heats, α = −(∂ρ/∂T )p/ρ the coefficient of
thermal expansion, χ = k(ρoCp)−1 the thermal diffusivity, and ρo φL the longitudinal
kinematic viscosity.
Following Nelson [7,13], we can solve formally the previous equations with the starting
conditions δρq(0) = 0, Jq‖(0) = i q F , and ρo δTq(0) = Q/Cv and we obtain that the HD
signal can be written in the Nelson’s notation as:
SHD(q, t) ∝ Rρ(q, t) = −FGρρ(q, t) + QGρT (q, t) (5)
where Gρρ(q, t) is the response to the electrostriction (also called Impulsive Stimulated
Brilluoin Scattering, ISBS) , and GρT (q, t) to the absorption (also called Impulsive Stimu-
lated Thermal Scattering, ISTS) [6,7]. F and Q are two constants that define, respectively,
the magnitude of the electrostriction and heat flux in the limit of infinitely short pump laser
pulses.
In order to calculate the density response function, we have to know all the coefficients
and in particular the time (or frequency) dependence of the kinematic viscosity φL. Only for
particular form of φL it is possible to obtain analytical expressions for Gρρ(q, t) and GρT (q, t).
One of them is the very simple but useful Debye model of a viscous fluid where the kinematic
viscosity (or memory function for the elastic modulus) is approximated by the sum of an
instantaneous plus a exponential relaxing term: φL(q, t) = vLδ(t) + (c2∞ − c2
0) exp(−t/τR). If
all the characteristic times (i.e. the period of the acoustic wave, its damping time constant,
the structural relaxation time and the thermal diffusion time constant) are well separated
each other , very simple equations are obtained [7,13,14]:
GρT (q, t) ≃ A[e−ΓH t − e−ΓA t cos (ωAt)
]+ B
[e−ΓH t − e−t/τ ′
R
](6)
Gρρ(q, t) ≃ C[e−ΓAt sin (ωAt)
](7)
8
where: ΓH is the thermal damping rate (ΓH = 1/τH = χq2), τ ′R the effective structural
relaxation time (τ ′R =
(cA
c0
)2
τR being cA the sound velocity), ωA and ΓA = 1/τA are the
frequency and damping of acoustic longitudinal phonon, A, B, and C are constant depen-
dent on sample and experimental setup. The importance of this treatment resides in the
possibility to extract other information and to make expectations on the general behavior
of the various parameters versus q and temperature. In particular we expect a maximum on
the acoustic damping both versus q and T , and a gradual shift of the sound velocity from
c0 to c∞ lowering the temperature or increasing q. We have [13]:
ωA = cAq =
[c0
√D +
√D2 + (c0qτR)−2
]q; D = [c2
∞/c20 − (c0qτR)−2]/2 (8)
ΓA
q2=
1
2
{[vL + χ
(γ − c2
0/c2∞
)]+
c2∞ − c2
0
1 + ω2Aτ 2
R
}(9)
Further, always in the assumption that ωA ≫ ΓA ≫ τ−1R ≫ ΓH and some other minor
approximations [13], we can extract the Debye-Waller factor or non-ergodicity parameter
fq→0(T ) from A and B coefficients which in turn can be derived by fitting the experimental
data with the theoretical expression:
fq→0(T ) = 1 −c20
c2∞
=B
A + B(10)
However, the Debey model for the longitudinal kinematic viscosity has severe limitations.
As it has been pointed out in many experimental works, the structural relaxation around the
critical temperature of the structural arrest is not reproduced by a single relaxation time but
by a distribution of them; often this fact has been attributed to the rise of heterogeneities
during the cooling. As a consequence, more complex models have to be used to take into
account thedistribution of relaxation times, e.g. by a multi-exponential or stretched expo-
nential approach [1]. When all the relaxation times of the actual distribution are separated
from the other characteristic times, the kinematic viscosity affect only the term with the
B coefficient (the ii) term of the previous section) and a complex relaxation can be put di-
rectly in the response as a stretched exponential, i.e. a Kohlrausch-Williams-Watts (KWW)
function [13]:
9

GρT (q, t) ≃ A[e−ΓH t − e−ΓA t cos (ωAt)
]+ B
[e−ΓH t − e−(t/τS)β
](11)
where the ’relaxation time’ τS and the stretching factor β are fitting parameters for the
relaxation time distribution. This approximation has the advantage to keep an easy and
readable form for the response function but this simplicity prevents to account for possible
interactions among the different relaxing mechanisms. To compare τS with the relaxation
times derived by other time distribution (like the Cole-Davidson in the frequency domain)
or derived in single relaxation time approximation, the mean of the time distribution is
calculated as 〈τS〉 = β−1Γ(β−1) τS.
We want to remark that the presence of a stretched exponential in the GρT (q, t) can
not be considered per se a way to introduce the mode-coupling theory in the hydrodynamic
response [15].
IV. EXPERIMENTAL PROCEDURES
A. Laser system and optical set-up
The lasers and the optical set-up used to realize the HD-TG experiment are reported in
fig.1. The pump infrared pulses at 1064 nm wavelength, are produced by a mode-locked Nd-
YAG laser (Antares-Coherent) and then they are amplified by a regenerative Nd-YAG cavity
(R3800-Spectra Physics) to reach 1 mJ at 1 kHZ of repetition rate with 100 ps of duration.
The probing beam, at 532 nm wavelength, is produced by a diode-pumped intracavity-
doubled Nd-YVO (Verdi-Coherent), this is a CW single-mode laser characterized by an
excellent intensity stability with low and flat noise-intensity spectrum. The beam intensities
and polarizations are controlled by two couples of half-wave plate and polarizer.
The optical set-up, shown in fig.1, uses a phase grating as a diffractive optical element
(DOE): controlling the depth of the grooves and their spacing it is possible to obtain very
high diffraction efficiency also better than 80% on the first two orders. Since we have to
diffract both 1064 and 532 nm a compromise must be used. The chosen DOE (made by
10
Edinburgh Microoptics) gives on a single beam at first order a 12% diffraction efficiency
for the 532 nm and 38% for the 1064 nm. Different spacings can be used to change the q
vector. With the aid of a dicroic mirror (DM), the excitation and probing beams are sent
colinearly on the DOE that produces the two excitation pulses (Eex), the probing (Epr)
and the reference beam (El). These beams are collected by a first achromatic lens (AL1),
cleaned by a spatial mask to block other diffracted orders and then recombined and focused
by a second lens (AL2) on the sample. The local laser field is also attenuated by a neutral
density filter and adjusted in phase passing through a couple of quartz slab properly etched.
The excitation grating produced on the sample is mirror image of the enlighted DOE phase
pattern. If AL1 and AL2 have the same focal length, the excitation grating has half the
spacing of DOE [9]. This type of set-up gives automatically the Bragg condition on all the
beams and produces a very stable phase locking between the probing and reference beam, a
crucial parameter to realize a heterodyne detection. To properly test the acoustic damping
[7] the excitation beam is focalized by a cylindrical lens (CL2) on the DOE and the produced
grating on the sample is extended in the q direction (about 5 mm), viceversa the probing
beam is focalized in a circular spot (0.5 mm) on the sample, through the two lens CL1
and CL2. We reduced the lasers energy on the sample to the possible lowest level to avoid
undesirable thermal effects, and the CW beams has been gated in a window of about 1 ms
every 10 ms by using a mechanical chopper synchronized with the excitation pulses. The
mean exciting energy was 7 mW (35 µJ per pulse at 100 Hz) and the probing energy was
6 mW . The reference beam intensity is very low and it is experimentally adjusted, using a
variable neutral filter, to be about 100 times the intensity of the diffracted signal. With these
intensities the experiment is deeply inside the linear response regime and no dependence of
HD-TG signal shape on the intensities of the beams can be detected. The HD-TG signal,
after it has been optically filtered, is measured by the a fast avalanche photodiode with a
bandwidth of 1 GHz (APD, Hamamatsu), amplified and recorded by a digital oscilloscope
with 1 GHz − 4 Gs (LeCroy).
The OTP, from Fluka (99 %), has been purified by repeated crystallization in methanol
11
and dried under vacuum. The sample is kept in an aluminium cell with a teflon coating and
it shows a stable supercooled phase. The cell temperature is controlled by a cryostat system
(helium closed circle, Cryotip) with a platinum resistance dipped in the sample.
B. Data collection and handling
The OTP measured signal spans over many decades in time, typically up to about 1 ms,
so we recorded the data in a pseudo-logarithmic time scale. We use a fast time window (0−1
µs range with a 250 ps time-step), an intermediate (0−20 µs range with a 10 ns time-step)
and long one (0 − 1 ms range with a 200 ns time-step) and then the measurements are
merged in a single data file, we did not have any problems of overlapping. Each data is an
average of 5000 recording (corresponding to about 1 minute of acquisition time) and this is
enough to produce an excellent signal to noise ratio. In order to get rid of the homodyne
and other spurious signals, we recorded two measurements at different phases of the local
field, the first signal, S+, with ∆ϕ+ = 2nπ and a second one, S−, with ∆ϕ− = 2(n+1)π (see
eq.2) and then we subtracted S− from S+ to extract the pure HD signal, SHD (see eq.3).
From fig.2 where we have reported two typical S+ and S− signals and the extracted SHD, it
is clear how this procedure increase substantially the quality of data.
We measured the relaxation processes of OTP as a function of temperature for three
different value of q = 0.338, 0.630, 1.000 µm−1. The wave-vectors are evaluated by the
geometry of the experiment and are affected by 0.8 %, 0.6 % and 0.4 % error, respectively.
For each wave-vector we take data as function of temperature in a range, 243 − 373 K,
that largely covers the liquid and supercooled region around Tc ∼ 290, being Tg = 244 K
and Tm = 329 K. In fig.3 we show in linear-log scale some representative HD-TG data on
glass-forming OTP.
As is evident from fig.3, the density OTP dynamics is characterized by an acoustic
phonon, a structural relaxation that appears as a rise in the signal and by the final thermal
relaxation. The damping of acoustic phonon and the structural processes are strongly tem-
12

perature dependent. There is a temperature region where these ’modes’ (acoustic phonon,
structural and thermal relaxation) are characterized by separated time scales. Some physical
quantities, like the sound velocity, can be directly got from HD-TG data but a complete
analysis of them requires a fitting procedure.
We tested the response function defined in eq.s 7, 11 performing a non-linear least square
fit on our OTP data. The fitting includes a convolution with the instrumental response
(APD, amplifier and oscilloscope) especially important at small times in the acoustic oscil-
lating part of the signal. We found this response function able to reproduce our HD-TG
data on large time windows but not on the whole measured time scale, see fig.4. Indeed
the very fast time scale ( 0 − 2 ns) is fairly reproduced, even if an extreme care has been
taken to include all the possible signal contributions, e.g. the instantaneous signal due to
the molecular hyperpolarizzability. Actually it is not surprising that an hydrodynamics
approach is not appropriate on a fast time scale since it does not take into account any
molecular proprieties. Again, as we will discuss later in detailed see sec.V, we found that in
the long time scale (0.1 − 1 ms) and in the intermediate temperature range this response
function is not able to reproduce our data that show a relaxation pattern that can never
be explained by the used response function, see fig.9. From our fit on OTP it is clear the
presence of both the excitation mechanism: the electrostrictive effects (ISBS contribution)
and the thermal effects (ISTS). We can estimate about 60% of ISBS against 40 % of ISTS
for q = 0.338 µm−1 and this ratio increases when the value of the wave-vector increases.
Nevertheless from the fitting the two contributions can be safely disentangled, thank the
linear access to the response function. To evaluate the errors for such complex data and
fitting function is not a trivial task, we used an ’a posteriori’ procedure. We repeated the
experiment getting for each temperature and wave-vector several HD-TG signals, then we
fit all the signals producing a distribution of parameters.
13

V. RESULTS
We used the previously defined response function (see eq.s 5, 7, 11) to extract the infor-
mation about OTP dynamics from HD-TG data. The fitting parameters are: the acoustic
frequency and damping rate (ωA and ΓA), the structural relaxation time and stretching
parameter (τS and β), the thermal relaxation time (τH) and the amplitude constants (A,
B and C). In fig.5 we report the sound velocity, cA = ωA/q, and the damping rate, ΓA,
see table I. At all the investigated temperatures and wave-vectors these two parameters are
extracted with very small uncertainties, less then 1%. The sound velocity, see fig.5a), shows
the typical temperature dependence of viscoelastic liquids. The velocity increases lowering
the temperature and shifts from two linear dependence regime, at high temperatures the
velocity almost corresponds to the adiabatic sound velocity, c0, while at low temperatures
corresponds to the solid-like or ’infinite’ frequency sound velocity, c∞. In the transition
region, starting form a few ten of degree above Tc, there is a rapid increase of cA toward
c∞. At higher wave-vector the shift between the two regime appears at higher tempera-
ture. This behavior reflects the rapid variation of the structural relaxation time with the
temperature. In fact at high temperatures the structural relaxation time is shorter than
the phonon oscillation period, τS << (ωA)−1 and the relaxation process is coupled weakly
with the sound yielding a soft damping. Again at low temperatures when τS >> (ωA)−1 the
two processes are decoupled yielding again a soft damping of the sound waves. Viceversa
when τS ωA ∼ 1 the structural and acoustic phenomena have the maximum coupling yield-
ing a maximum in the damping rate, see fig.5b). The dependence of ωA on q produces a
q-dependence of the coupling and also a departure ΓA ∝ q2, as is seen clearly in fig.5 . ΓA
at high temperature, far from the structural region, is not far from being proportional to
q2. In the hypothesis of a single relaxation time we can extract its value from the damping
maximum, i.e. τS ∼ (ωA)−1. We found: τS ∼ 0.6 nsec for q = 1 µm−1, τS ∼ 0.9 nsec for
q = 0.63 µm−1and τS ∼ 1.6 nsec for q = 0.338 µm−1. This non negligible q-dependence of
the structural relaxation time is again a mark of the inadequacy of the single time simple
14
analysis and/or a mark of the presence of heterogeneities.
When the temperature is around Tc, the structural relaxation process is appearing in the
HD-TG pattern as a bump after the vanishing of the acoustic oscillations, see fig. 3. In that
case the structural time can easily be extracted with confidence from the fitting procedure.
Indeed only in a q-dependent restricted range of temperature it has been possible to get
reliable structural parameters, τS and β, from our HD-TG data on OTP, namely in the
range T = 279 − 297 K for q = 1 µm−1, T = 277 − 293 K for q = 0.63 µm−1 and
T = 272−287 K for q = 0.338 µm−1. This reflects the limitation of the fitting formulas, (eq.s
7, 11), since they fully applies only when a time scale separation exists among the various
characteristic times, as already pointed out. Nevertheless these measurements are covering
a key temperature range around the OTP critical temperature in a (q, t) or (q, ω) space
quite difficult to reach by other techniques. The OTP structural parameters are reported
in fig.6. They are covering three decades in time that was not previously investigated,
from about 10 nsec up to 20 µsec. Within the uncertainties resulting essentially from the
fitting procedure, the structural relaxation times does not show any q-dependence and in
the stretching parameter we cannot recognize any temperature dependent too. We want to
remark that the stretching parameter is really affected by large uncertainties, see fig.6b).
Unfortunately, also an other relevant quantity, i.e. the non-ergodicity parameter fq→0 which
can be estimated from eq. 10, is affected by large uncertainties. Within them, the fq→0
parameter of OTP from our HD-TG data do not show the cusp-like behavior predicted by
the mode-coupling theory [15], as is evident from fig.7. On the other hand, the behavior
of the non-ergodicity parameter has been measured by neutron scattering for different high
value of wave-vectors and by extrapolating its slope in the limit q → 0 the cusp-like seem
to be hardly visible [16].
The fit parameter τH , the thermal relaxation time, defines the final decay of the HD-TG
signal and is safely extracted when the condition τH ≫ τS is verified. Since τH ∼ 100 µsec and
it is typically not strongly temperature dependent until Tg [7], it should be safely extracted
in the range from 373 K down to 270 K. In figure 8 we report the thermal diffusivities,
15

χ = (τHq2)−1
= k(ρoCp)−1, resulting from the investigated three wave-vectors in the whole
temperature range. In the high temperature range χ shows the expected smooth variation
and independence of q. Approaching the critical temperature, a strong deviation is showing
up: starting from about 275 K at q = 0.338 µm−1 ( and from temperatures even higher
at higher q) an anomalous strong decrease in the thermal diffusivity is coming from our fit.
The decrease is so strong that the longer decay is clearly visible if we plot the data in a
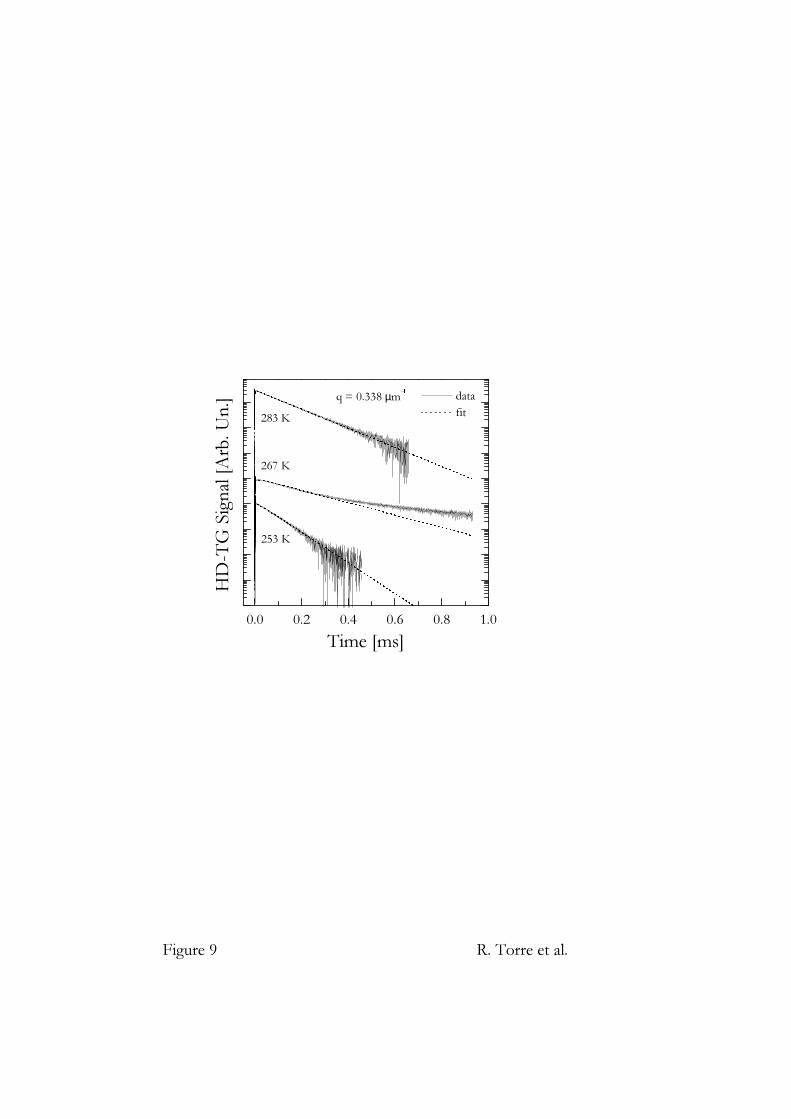
semilogarithmic scale, as in fig.9. This effect could be an interaction between the structural
and thermal relaxation time constant, τS and τH , that are getting closer decreasing the
temperature. However, when the thermal diffusivity starts to deviate, the structural and
thermal relaxation times seem to be too far each other, e.g. at q = 0.338 µm−1 the deviation
start at about T = 275 K, where τS = 15 µs and τH = 115 µs. Anyway we want to remember
that τS is a parameter of a time distribution rather than the real relaxation time. Further, in
the region of the thermal diffusivity dip, the HD-TG data show at long times a second very
slow decay: indeed it is clear from fig.9, that the slow relaxation at T = 283 K and 253 K are
characterized by a single exponential relaxation, the thermal decay, and viceversa at 267 K
some extra relaxation is appearing. It is fairly obvious that the used response function (eq.s
7, 11) is not able at all to reproduce these features. As regards the subsequent large increase
of the thermal diffusivity at low temperature where the structural relaxation times are found
even longer than the thermal relaxation, the experiments of specific heat spectroscopy on
glass-formers [17] suggest that the increase can be due to Cp approaching the solid-like or
high frequency response.
VI. DISCUSSION AND CONCLUSIONS
The present analysis in terms of density hydrodynamics response of the HD-TG data
of glass-forming OTP around the critical temperature of the structural arrest, shows some
clear results but also open some problems in the data interpretation. To get a further
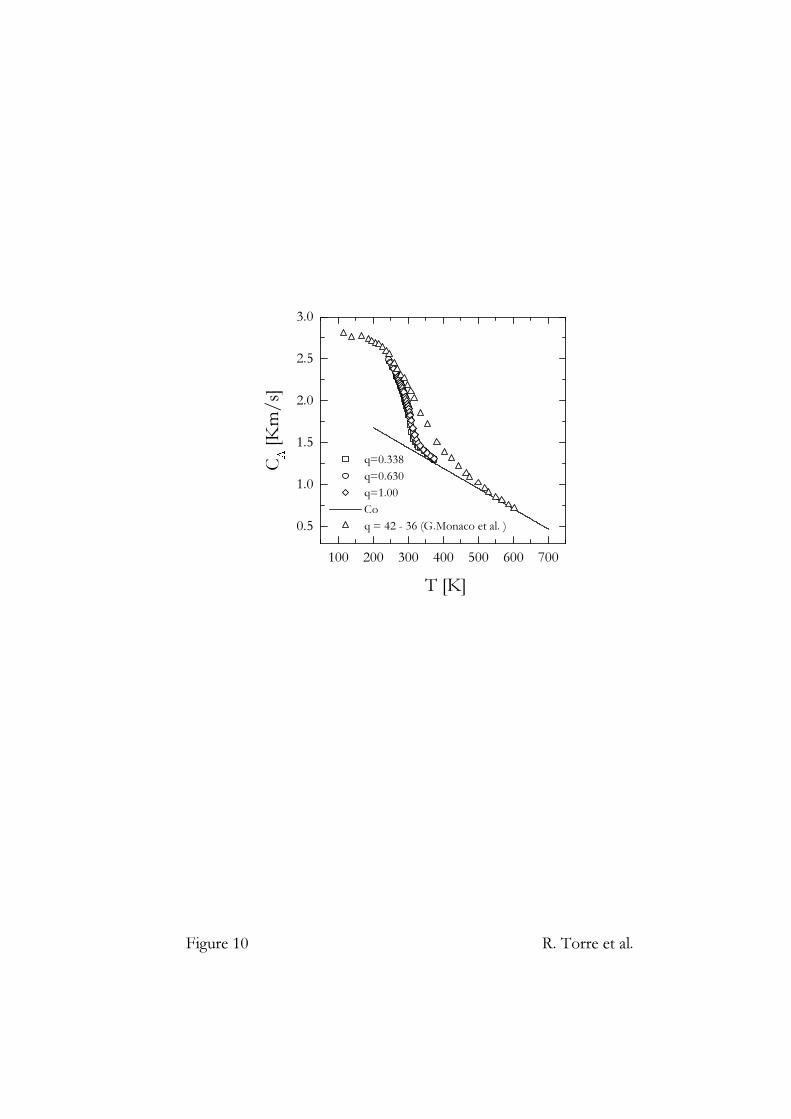
understanding, we compare our parameters with the other data from literature. In fig.10
16

we report our sound velocities together with the data from Brilluoin LS [18] and ultrasound
experiments [19]. Here the agreement is very nice. As expected, there is a clear dispersion
effect in q, as the LS data are taken at much higher wave-vectors, and the extreme values
c0 and c∞ are approached at high and low temperatures respectively. It is evident that the
HD-TG experiment is able to measure the sound velocity at wave-vectors in an otherwise
difficult range, too low for LS techniques but too high for ultrasound experiments. In fact,
in our experiment ωA ranges from 0.4 to 2 GHz with ΓA ∼ 2 − 160 MHz.
Our structural relaxation times are compared with the light scattering (LS) [20,21],
photon correlation (PC) [20,22] and time-resolved optical Kerr effect (OKE) data [23]. All
these data are extracted from experiments performed with depolarized light geometry and
so the influence of the orientational dynamics can be non negligible. Nevertheless, our OTP
data, spanning from 10−8 up to 10−5 sec, nicely cover the gap present between LS, OKE
and PC measurements and they follow the same course, as we can see in fig. 11. This
good agreement has some implication in OTP dynamics suggesting that the orientational
and translational dynamics have substantially the same temperature dependence, in the
investigated temperature range, with very similar relaxation times.
The cusp-like behavior of the Debye-Waller factor expected in the frame of mode-coupling
theory for a fragile glass such as OTP, is not recognizable, owing to large uncertainties.
We would like to stress that the slow thermal decay, at relatively low temperature, did
not show a simple single exponential decay and can not be properly characterized by the
simple hydrodynamics model used in this work. We have found this behavior common to
other several glass-formers: glycerol, m-toluidine, salol [24]. In our opinion the apparent
modification of the thermal diffusivity has to be addressed to effects of the structural dy-
namics on the thermalization process. In other word, the heat flux, produced by the weak
absorption of the pump laser pulses, modify the kinetic energy of the different degree of
freedom and not all of them thermalize in a very short time scale. Furthermore part of the
roto-translational energy thermalizes through collective rearragements that act on the struc-
tural time scale. This kind of processes are also responsible of the frequency dependence of
17

the specific heat. A more suitable hydrodynamic treatment for the heat transport should be
able to taken into account the complex relaxation patterns found in the present experiment.
ACKNOWLEDGMENTS
We thank F.Barocchi, K.A.Nelson, R.M.Pick and G.Ruocco for very helpful suggestions
and discussions. This work was supported by the Commission of the European Communities
through the contract No HPRI-CT1999-00111, by MURSTand by INFM through the project
TREB-Sez.C-PAISS1999.
18

REFERENCES
[1] J.Wong and C.A.Angell, Glass structure by spectroscopy (Marcel Dekker Inc., New
York, 1976) P.G.Debenedetti, Metastable Liquids (American Chemical Society, Wash-
ington, 1996); J.T.Fourkas, D.Kivelson, U.Mohanty, and K.A.Nelson, Supercooled Liq-
uids (Princeton University Press,New Jersey, 1996).
[2] W.Gotze, J.Phys.: Condens. Matter, 11, A1 (1999); H.Z. Cummins, J.Phys.: Condens.
Matter, 11, A95 (1999).
[3] R.Torre, P.Bartolini, R.M.Pick, Phys. Rev. E 57, 1912 (1998), R.Torre, P.Bartolini,
M.Ricci R.M.Pick, Europhysics Letters. 52, 324 (2000), G.Hinze, D.D.Brace,
S.D.Gottke, and M.D.Fayer, Phys.Rev.Lett. 84, 2437 (2000).
[4] A.Taschin, R.Torre, M.Ricci, M.Sampoli, and C.Dreyfus, R.Pick,
/cond-matter/0106632.
[5] G.Hinze, R.S.Francis, and M.D.Fayer, J. Chem. Phys. 88, 6477 (1999).
[6] H.J.Eichler, P.Gunter, and D.W. Pohl, Laser-Induced Dynamic Gratings (Spriger-
Verlag, Berlin, 1986).
[7] Y.Yang and K.A.Nelson, 74, 4883, Phys.Rev.Lett.(1995), Y.Yang and K.A.Nelson,103,
7732, J.Chem.Phys. (1995), and D.M.Paolucci and K.A.Nelson, 112, 6725,
J.Chem.Phys. (2000).
[8] Y.Yan and K.A.Nelson, 87, 6240, J. Chem. Phys.(1987); ibid: page 6257.
[9] A.A.Maznev, K.A.Nelson and J.A.Rogers, 23, 1319, Opt. Lett. (1998).
[10] G.D.Goodno, G.Dadusc and R.J.Dwayne Miller, 15, 1791, J.Opt. Soc. Am. B (1998).
[11] B.B.Berne and R.Pecora, Dynamic Light Scattering (Wiley, NewYork, 1976).
[12] J.P.Boon and S.Yip, Molecular Hydrodynamics (McGraw-Hill, New York, 1980).
19

[13] Y.Yang and K.A.Nelson, J.Chem.Phys. 103, 7722 (1995).
[14] According to the hydrodynamics model [7] the whole ISBS signal is the following:
Gρρ(q, t) ≃ C[e−ΓAt sin (ωAt)
]+ D
[−e−ΓAt cos(ωAt) + e−(t/τS )β
]
Indeed the amplitude D has been found in the previous work to be negligible. Also in
the present work we found the D terms to be very small and not affecting at all the
fitting results Nevertheless, since this test is based only on the fitting procedure not a
final conclusion can be given about the intensity of structural contribution in the ISBS
signal.
[15] W.Gotze and L.Sjogren, Rep. Prog. Phys. 55, 241 (1992).
[16] A.Tolle, H.Schober, J.Wuttke and F.Fujara, Phys. Rev. E 56, 809 (1997); E.Bartsch,
F.Fujara, B.Geil, M.Kiebel, W.Petry, W.Schnauss, H.Sillescu and J.Wuttke, Physica A
201, 223 (1993).
[17] N.O.Birge, Phys.Rev. B 34, 1631 (1986).
[18] G.Monaco, D.Fioretto, L.Comez, G.Ruocco, Phys. Rev. E 63, 61502 (2001).
[19] G. D’Arrigo, J. Chem. Phys. 63, 61 (1975).
[20] W.Steffen, A.Patkowski, G.Meier and E.W.Fisher, J.Chem.Phys. 96, 4171 (1992);
W.Steffen, A.Patkowski, H.Glaser, G.Meier and E.W.Fisher, Phys.Rev.E 49, 2992
(1994); A.Patkowski, E.W.Fisher,W.Steffen, H.Glaser, M. Baumann, T.Ruths and
G.Meier, Phys. Rev. E 63, 61503 (2001).
[21] H.Z.Cummins, G.Li, W.Du, Y.H.Hwang and G.Q.Shen, Prog.Theor.Phys.Suppl. 126,
21 (1997).
[22] Y.H.Hwang and G.Q.Shen, J.Phys.C 11, 1453 (1999).
[23] S.D.Gottke, D.D.Brace, G.Hinze and M.D.Fayer, J. Phys. Chem. B 105, 238 (2001).
20
[24] M.Sampoli et al., in preparation; R.DiLeonardo et al., in preparation.
21

TABLES
q = 0.338 µm−1 q = 0.630 µm−1 q = 1.00 µm−1
T ωA ΓA ωA ΓA ωA ΓA∆ωA
ωA
∆ΓA
ΓA
(K) (GHz) (MHz) (GHz) (MHz) (GHz) (MHz)
243.2 – – 1.572 3.30 – – 0 0.1 % 0 1 %
244 0.8348 2.94 – – – – ” ”
253.2 – – 1.525 3.81 2.423 6.47 ” ”
254 0.8094 3.02 – – – – ” ”
263.2 – – 1.474 6.90 2.343 8.57 ” ”
264 0.7821 3.52 – – – – ” ”
270 0.7629 4.53 – – – – ” ”
271.2 – – 1.424 8.90 2.273 12.7 ” ”
279.2 0.7275 10.1 1.381 15.2 2.195 22.3 ” ”
287.2 0.693 22.1 1.319 35 2.10 45 0 0.5 % 0 5 %
295.2 0.642 44 1.240 68 2.00 86 ” ”
303.2 – – 1.139 93 1.868 142 ” ”
304 0.577 50 – – – – ” ”
313.2 – – 1.025 86 1.674 156 ” ”
314 0.52283 30 – – – – ” ”
323.2 – – 0.948 41 1.539 95 0 0.1 % 0 1 %
324 0.4977 11.9 – – – – ” ”
333.2 – – 0.913 20.8 1.462 52.7 ” ”
334 0.4837 5.96 – – – – ” ”
343.2 – – 0.888 12.8 1.415 31.5 ” ”
344 0.4715 3.87 – – – – ” ”
353.2 – – 0.866 9.37 1.377 21.8 ” ”
354 0.4600 2.93 – – – – ” ”
363.2 – – 0.8441 7.34 1.342 15.8 ” ”
364 0.4485 2.47 – – – – ” ”
373.2 – – 0.8236 6.38 1.309 12.8 ” ”
374 0.4375 2.23 – – – – ” ”
TABLE I. Sound frequencies and damping rates with their relative errors for the analysed
q-values in the range 243 - 374. To avoid overcrowded table we report only some temperatures. K.
22
FIGURES
FIG. 1. Optical set-up and laser system for HD-TG experiment with optical heterodyne detec-
tion: M: mirror; CL#: cilyndrical lens; DM: dicroic mirror; DOE: diffractive optic element; AL#:
achromatic lens; APD: avalanche photodiode.
FIG. 2. Typical HD-TG raw data corresponding to phase difference between signal and local
reference of ∆ϕ = 0◦ and ∆ϕ = 180◦ (above); pure HD-TG signal (below) is obtained by substract-
ing the two previous signals. The subtraction permits to improve substantially the signal/noise
ratio and to remove the homodyne and all spurious contributions that are phase independent.
FIG. 3. HD-TG data on OTP for two wave-vectors, q = 0.338 and q = 1 µm−1 , at several
temperatures. The data, at all temperatures, show damped acoustic oscillations at short times and
thermal diffusion at long times. Decreasing of temperature the structural relaxation mode, typical
of complex liquids, appears at first as strong acoustic damping (ωAτS ∼ 1 condition) and later as
gradual rise of TG signal.
FIG. 4. HD-TG data (solid lines), fits (dotted lines) and residues x3 (lower lines) for OTP, at
the two temperatures, T = 288K and T = 267K at wave-vector q = 0.338 µm−1.
FIG. 5. Sound velocities CA (a) and acoustic damping rates ΓA (b) versus temperature from
fits to HD-TG data at the investigated wave-vectors. At each q-value the sound dispersion and
damping rate reach the maximum at the temperature at which ωAτS ∼ 1.
FIG. 6. Structural relaxation times τS and stretching parameter β versus temperature at the
three wave-vectors analysed.
FIG. 7. Temperature dependence of the Debye-Waller factor, fq→0(T ), in OTP, obtained by
fits, at all wave-vectors. There is no evidence of a MCT cusp in the analysed temperature range .
23
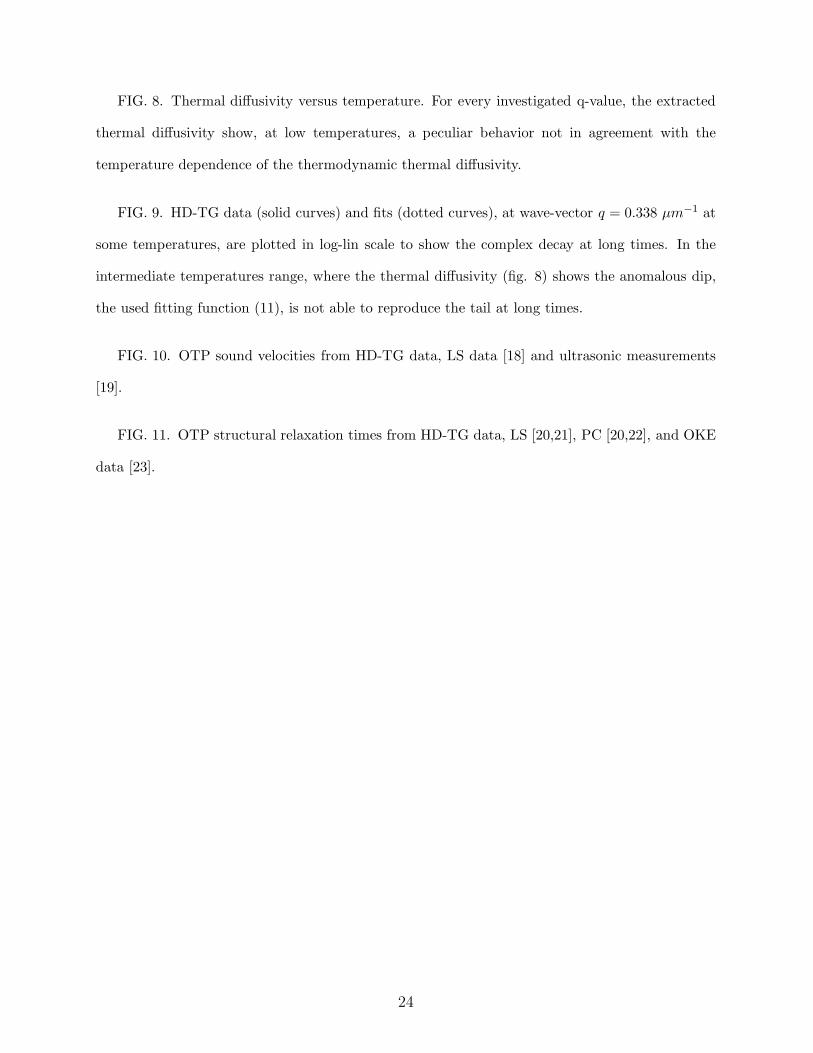
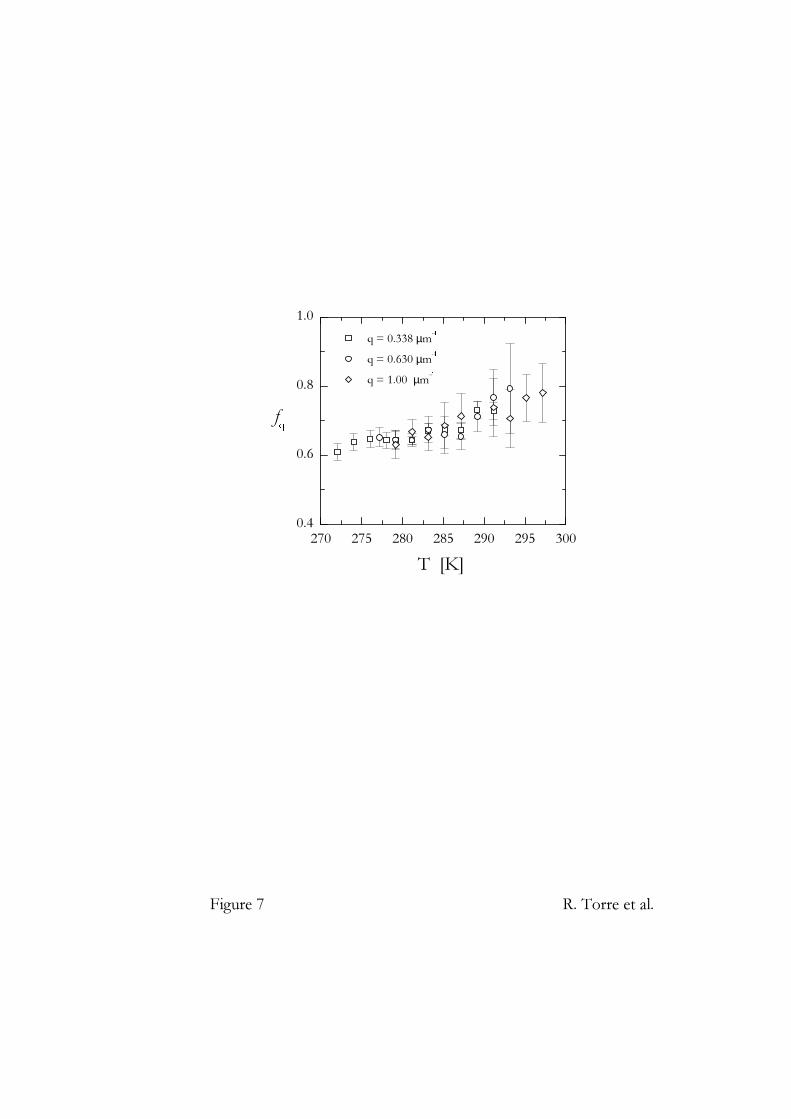
FIG. 8. Thermal diffusivity versus temperature. For every investigated q-value, the extracted
thermal diffusivity show, at low temperatures, a peculiar behavior not in agreement with the
temperature dependence of the thermodynamic thermal diffusivity.
FIG. 9. HD-TG data (solid curves) and fits (dotted curves), at wave-vector q = 0.338 µm−1 at
some temperatures, are plotted in log-lin scale to show the complex decay at long times. In the
intermediate temperatures range, where the thermal diffusivity (fig. 8) shows the anomalous dip,
the used fitting function (11), is not able to reproduce the tail at long times.
FIG. 10. OTP sound velocities from HD-TG data, LS data [18] and ultrasonic measurements
[19].
FIG. 11. OTP structural relaxation times from HD-TG data, LS [20,21], PC [20,22], and OKE
data [23].
24
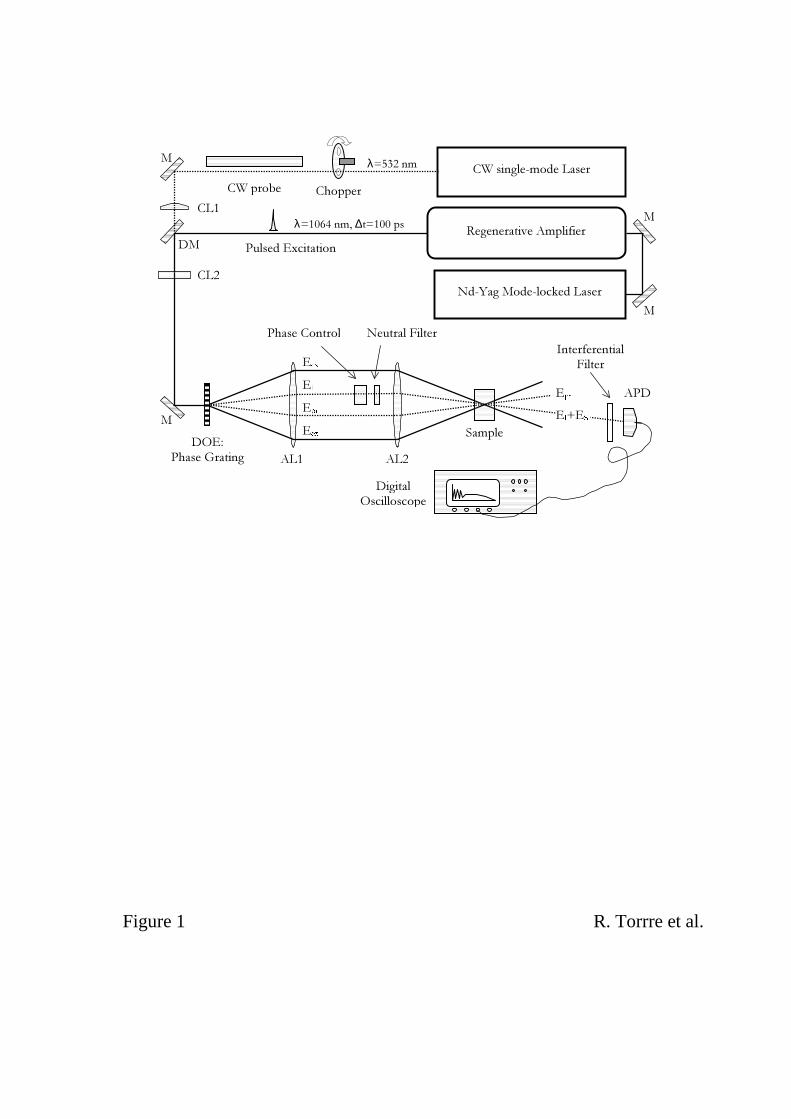
Figure 1 R. Torrre et al.
5HJHQHUDWLYH�$PSOLILHU
'2(�3KDVH�*UDWLQJ $/�
&/�
$3'
'LJLWDO2VFLOORVFRSH
6DPSOH
&:�SUREH
3XOVHG�([FLWDWLRQ
,QWHUIHUHQWLDO)LOWHU
1G�<DJ�0RGH�ORFNHG�/DVHU
&:�VLQJOH�PRGH�/DVHU
$/�
&/�
(O
(SU
3KDVH�&RQWURO 1HXWUDO�)LOWHU
&KRSSHU
(O�(6
'0
(H[
(H[
(SU
λ ����QP
λ �����QP��∆W ����SV
0
0
0
0

5��7RUUH�HW�DO�)LJXUH��
7� �����.��T� �������µP��
∆ϕ� ������
∆ϕ� ����
+'�7*
�6LJQDO�>$UE��8Q�@
� �� ��� ��� ��� ���
KHWHURG\QH�VLJQDO
7LPH�>QV@

����.�
�
�
����.
����.
�
����.
�+'�7*
�6LJQDO�>$UE��8Q�@�
����.
����.
����.
����.
���� ���� ��� ��� ��� ����7LPH�>µV@
����.
���� ���� ���� ��� ��� ���
5��7RUUH�HW�DO�)LJXUH��
T� ������µP��T� �������µP��
�7LPH�>µV@
����.

���� ���� ��� ��� ��� ���
7� �����.
[�
�
�
7LPH�>µV@
5��7RUUH�HW�DO�)LJXUH��
7� �����.
[�
T� �������µP��
�+'�7*
�6LJDQ
O�>$UE��8Q�@
�

��� ��� ��� ��� ��� ��� ��� ��� ����
��
��
���
���
Γ $
��>0+]@
7�>.@
���������������������
5��7RUUH�HW�DO�)LJXUH��
E�
D�
�T ������µP��
�T ������µP��
�T �������µP��
& $
�>.P�V@

��� ��� ��� ��� ��� ��� ���
���
���
���
��� E�
D�
β
7���>.@
����
����
���
���
5��7RUUH�HW�DO�)LJXUH��
�T� �������µP��
�T� �������µP��
�T� ��������µP��
τ V�>µV@
��� ��� ��� ��� ��� ��� ������
���
���
���
5��7RUUH�HW�DO�)LJXUH��
�
�
�T� �������µP��
�T� �������µP��
�T� �������µP���
IT
7��>.@
��� ��� ��� ��� ��� ��� ��� �������������������������������������������
5��7RUUH�HW�DO�)LJXUH��
χ���>PP� �V
@
�T� ��������µP��
�T� ��������µP��
�T� ���������µP��
7�>.@
��� ��� ��� ��� ��� ���
5��7RUUH�HW�DO�)LJXUH��
T� �������µP�� �GDWD�ILW
����.
����.
����.
�
�
+'�7*
�6LJQDO�>$UE��8Q�@
7LPH�>PV@
��� ��� ��� ��� ��� ��� ������
���
���
���
���
���
5��7RUUH�HW�DO�)LJXUH���
�7�>.@
�T ������T ������T �����&R�T� ����������*�0RQDFR�HW�DO���
& $
�>.P�V@

��� ��� ��� ��� ��� ��� ��� ��� �����������������������������������
5��7RUUH�HW�DO�)LJXUH���
�7�>.@
�3&�YK���)LVKHU�HW�DO���3&�YK���6KHQ�HW�DO���/6�YK��)LVKHU�HW�DO���/6�YK��&XPPLQV�HW�DO���2.(��*RWWNH�HW�DO���+'�7*��T ������+'�7*��T ������+'�7*��T �����τ
V!�>V@