Millimeter and submillimeter heterodyne observations of Titan: The vertical profile of carbon...
13
ICARUS 126, 170–182 (1997) ARTICLE NO. IS965640 Millimeter and Submillimeter Heterodyne Observations of Titan: Retrieval of the Vertical Profile of HCN and the 12 C/ 13 C Ratio T. HIDAYAT, A. MARTEN, B. BE ´ ZARD, AND D. GAUTIER DESPA, Observatoire de Paris—Meudon, 92195 Meudon Principal Cedex, France T. OWEN Institute for Astronomy, University of Hawaii, Honolulu, Hawaii 96822 H. E. MATTHEWS Joint Astronomy Centre, Komohana Street, Hilo, Hawaii 96720 AND G. PAUBERT Instituto de Radio Astronomı ´a Milime ´trica, Granada, Spain Received May 2, 1996; revised October 11, 1996 hydrogen cyanide (HCN), cyanogen (C 2 N 2 ), and cyanoace- tylene (HC 3 N) (Hanel et al. 1981, Kunde et al. 1981, Cous- We report new observations of the (1–0) line of HCN at 88.63 GHz, emitted by Titan, made in May 1995 with the IRAM tenis et al. 1989a, 1991). Carbon monoxide was subse- 30-m radiotelescope located at Pico Veleta (Spain). Compared quently detected from ground-based observations (Lutz et to previous observations of Tanguy et al. (1990, Icarus 85, al. 1983). Moreover, the disk-averaged detection of both 43–57), the signal-to-noise ratio has been improved by a factor HCN and HC 3 N was then obtained with the IRAM 30-m of 5, permitting us to retrieve the vertical distribution of HCN telescope (Tanguy et al. 1990, Be ´ zard et al. 1992). In addi- in the 80–350 km altitude range. Using the production rate of tion, acetonitrile (CH 3 CN) has recently been detected us- HCN predicted from photochemical models, we derive a profile ing the same telescope (Be ´ zard et al. 1993). of the eddy diffusion coefficient up to 350 km altitude consistent Comprehensive photochemical models of Titan’s atmo- with the observed HCN vertical distribution. This coefficient sphere were initially developed by Yung et al. (1984) and increases with height more rapidly than the standard n 20.5 de- updated by Yung (1987). Unfortunately, a fundamental pendence in the stratosphere. The (4–3) line of H 13 CN at 345.34 GHz was subsequently observed with the JCMT on Mauna Kea parameter of the models, the so-called eddy mixing or K- (Hawaii) in June 1995. The analysis of the two spectra yields profile, which parameterizes the vertical transport mecha- a 12 C/ 13 C ratio between 70 and 120, consistent with the terrestrial nisms in the lower atmosphere, was still poorly constrained. value. Taking into account possible fractionation processes, we Since Yung’s model did not correctly predict the HCN show that the C-bearing species which formed Titan should distribution, Tanguy et al. (1990) proposed a K-profile have had a carbon isotopic ratio in the same range. 1997 based upon their determination of the stratospheric verti- Academic Press cal profile of HCN. This K-profile was subsequently adopted, with some modifications, in a recently published photochemical model elaborated by Toublanc et al. (1995). 1. INTRODUCTION However, Tanguy et al.’s K-profile is not precise enough to design a model properly due to large uncertainties in The Voyager 1 encounter with Titan in 1980 revealed their retrieved HCN vertical distribution, especially in the that nitrogen is the principal constituent of the satellite’s altitude range 200–350 km. Therefore, we have undertaken atmosphere. Various chemical trace species such as hydro- observations of Titan during two periods in 1995. HCN carbons and nitriles, as well as carbon dioxide, were also spectra were recorded at 88.6 GHz with the IRAM 30-m identified in the stratosphere. Nitrile compounds discov- ered by the infrared experiment aboard the spacecraft were telescope and, additionally, we observed the isotopic com- 170 0019-1035/97 $25.00 Copyright 1997 by Academic Press All rights of reproduction in any form reserved.
-
Upload
independent -
Category
Documents
-
view
6 -
download
0
Transcript of Millimeter and submillimeter heterodyne observations of Titan: The vertical profile of carbon...

ICARUS 126, 170–182 (1997)ARTICLE NO. IS965640
Millimeter and Submillimeter Heterodyne Observations of Titan:Retrieval of the Vertical Profile of HCN and the 12C/13C Ratio
T. HIDAYAT, A. MARTEN, B. BEZARD, AND D. GAUTIER
DESPA, Observatoire de Paris—Meudon, 92195 Meudon Principal Cedex, France
T. OWEN
Institute for Astronomy, University of Hawaii, Honolulu, Hawaii 96822
H. E. MATTHEWS
Joint Astronomy Centre, Komohana Street, Hilo, Hawaii 96720
AND
G. PAUBERT
Instituto de Radio Astronomıa Milimetrica, Granada, Spain
Received May 2, 1996; revised October 11, 1996
hydrogen cyanide (HCN), cyanogen (C2N2), and cyanoace-tylene (HC3N) (Hanel et al. 1981, Kunde et al. 1981, Cous-We report new observations of the (1–0) line of HCN at
88.63 GHz, emitted by Titan, made in May 1995 with the IRAM tenis et al. 1989a, 1991). Carbon monoxide was subse-30-m radiotelescope located at Pico Veleta (Spain). Compared quently detected from ground-based observations (Lutz etto previous observations of Tanguy et al. (1990, Icarus 85, al. 1983). Moreover, the disk-averaged detection of both43–57), the signal-to-noise ratio has been improved by a factor HCN and HC3N was then obtained with the IRAM 30-mof 5, permitting us to retrieve the vertical distribution of HCN telescope (Tanguy et al. 1990, Bezard et al. 1992). In addi-in the 80–350 km altitude range. Using the production rate of tion, acetonitrile (CH3CN) has recently been detected us-HCN predicted from photochemical models, we derive a profile
ing the same telescope (Bezard et al. 1993).of the eddy diffusion coefficient up to 350 km altitude consistentComprehensive photochemical models of Titan’s atmo-with the observed HCN vertical distribution. This coefficient
sphere were initially developed by Yung et al. (1984) andincreases with height more rapidly than the standard n20.5 de-updated by Yung (1987). Unfortunately, a fundamentalpendence in the stratosphere. The (4–3) line of H13CN at 345.34
GHz was subsequently observed with the JCMT on Mauna Kea parameter of the models, the so-called eddy mixing or K-(Hawaii) in June 1995. The analysis of the two spectra yields profile, which parameterizes the vertical transport mecha-a 12C/13C ratio between 70 and 120, consistent with the terrestrial nisms in the lower atmosphere, was still poorly constrained.value. Taking into account possible fractionation processes, we Since Yung’s model did not correctly predict the HCNshow that the C-bearing species which formed Titan should distribution, Tanguy et al. (1990) proposed a K-profilehave had a carbon isotopic ratio in the same range. 1997 based upon their determination of the stratospheric verti-Academic Press
cal profile of HCN. This K-profile was subsequentlyadopted, with some modifications, in a recently publishedphotochemical model elaborated by Toublanc et al. (1995).1. INTRODUCTION
However, Tanguy et al.’s K-profile is not precise enoughto design a model properly due to large uncertainties inThe Voyager 1 encounter with Titan in 1980 revealedtheir retrieved HCN vertical distribution, especially in thethat nitrogen is the principal constituent of the satellite’saltitude range 200–350 km. Therefore, we have undertakenatmosphere. Various chemical trace species such as hydro-observations of Titan during two periods in 1995. HCNcarbons and nitriles, as well as carbon dioxide, were alsospectra were recorded at 88.6 GHz with the IRAM 30-midentified in the stratosphere. Nitrile compounds discov-
ered by the infrared experiment aboard the spacecraft were telescope and, additionally, we observed the isotopic com-
1700019-1035/97 $25.00Copyright 1997 by Academic PressAll rights of reproduction in any form reserved.

STRATOSPHERIC HCN ON TITAN 171
ponent H13CN at 345.34 GHz with the JCMT. The fre- very good, with a typical zenith opacity of 0.15. Taking intoaccount the sky emission and a forward beam efficiency ofquency bandwidth of the latter observations presents the0.92, this leads to total system temperatures in the rangeadvantage of covering nitrile molecular transitions of350–420 K.HC3N, C2H3CN, C2H5CN, as well as a part of a very broad
Standard calibration procedures provide the receiverline of the CO(3–2) transition at 345.796 GHz. We havetemperature, the zenith atmospheric optical depth, and thethen searched for possible signatures of these nitrile com-total system temperature. These were regularly carried outpounds.using the so-called ‘‘chopper wheel/cold load’’ method;Our observations are described in Section 2. We presenti.e., the backend counts were recorded when the receiverin Section 3 synthetic spectra used to retrieve the HCNlooked successively at two loads of known temperatures,vertical profile as well as to derive the H12CN/H13CN ratio.a warm chopper wheel and the cold sky. The scale factorComparison of our results with the previous observationsobtained from this procedure permits us to convert theof HCN and a search for upper limits on other nitrilesignal into antenna temperature units (T*a in K). Uranuscompounds are also presented in this section. In Sectionwas observed in order to derive the beam efficiency as well4, we propose a K-profile consistent with our HCN resultsas the HPBW. Furthermore, some reference spectral lineand discuss physical consequences of the derived H12CN/sources, W51D and G34.3, were checked and comparedH13CN ratio.with the reference results in the IRAM catalog (Mauers-berger et al. 1989).
2. OBSERVATIONSPointing and focus were frequently monitored in a
broadband continuum mode. The former was performedby scanning across Saturn in azimuth and elevation. We2.1. Observation of the HCN(1–0) Line at the IRAMdetermined that the pointing accuracy was better than
30-m Telescope2 arcsec rms in the two directions. Hence, taking intoaccount the gaussian beam shape of the lobe and itsObservations of the J 5 0 R 1 line of HCN in Titan’s
atmosphere were performed on May 21, 22, and 24, 1995 width of 28 arcsec at this frequency, the uncertaintiesin the flux calibration due to pointing errors do notat the IRAM 30-m radiotelescope, located at Pico Veleta,
Spain (see Baars et al. 1987). Titan was near western elon- exceed 3%.Antenna tracking on Titan was driven automaticallygation at the time of the observations when its separation
from Saturn varied between 130 and 180 arcsec and its under computer control. In order to obtain an accurateemission spectral line shape, it was necessary to integrateapparent angular diameter was 0.71 arcsec. The maximal
elevation of Saturn was approximately 488. the signal over a very long time. Titan’s signal wasrecorded as series of individual scans of 5 min eachIn order to improve the spectral baselines, we used a
beam-switched procedure that allows elimination of stand- interwoven with calibrations every 2–6 scans dependingon source elevations. For the 3 days of observations, weing waves and reduces the effect of sky noise fluctuations
to a low level. The procedure was carried out by chopping obtained a total integration time of about 480 min. Thetotal spectrum resulting from the average of the rawthe secondary mirror at 0.5 Hz so that the receiver alter-
nately viewed Titan and a reference point 60 arcsec away data corrected for Doppler shifts is shown in Fig. 1a.No important ripple effect appears in the spectral baselinein azimuth. Since the half-power beamwidth (HPBW) of
the telescope at 88 GHz is about 28 arcsec, this procedure and the noise level is approximately 3 mK rms in antennatemperature. The signal-to-noise ratio at the peak of theensured that no confusion could arise between Saturn
and Titan. HCN line is on the order of 12 at 1-MHz resolution.The mean absolute continuum level of these observa-During the observations, we utilized three SIS hetero-
dyne receivers tuned in single sideband mode in order tions is, however, not properly measured, since the fluxfrom Titan collected by the antenna is very weak com-to measure several emission lines in the frequency range
80–260 GHz simultaneously. The receivers were connected pared to the strong sky background. Nevertheless, thecalibration procedure provides a reliable temperatureto six spectrometer backends with resolutions varying from
78 kHz to 1.25 MHz. The signal from Titan reported here scale and the temperature contrast between the emissioncore and the underlying continuum is well determined.was recorded by a SIS receiver operating in the range
85–116 GHz. The backend was the 1-MHz filterbank, con- From close examination of all spectra and narrow-bandcontinuum data measured on standard calibrators andsisting of 512 adjacent channels, 1 MHz-wide each. The
SSB receiver temperature was typically between 150 and planets we estimate that the flux calibration accuracy isbetter than 610%. In the following, we adopt this number200 K, and the measured image sideband gain ratio was
0.001. as an adequate value for estimating the influence ofobservational errors on the HCN determination.Atmospheric conditions during the observations were
172 HIDAYAT ET AL.
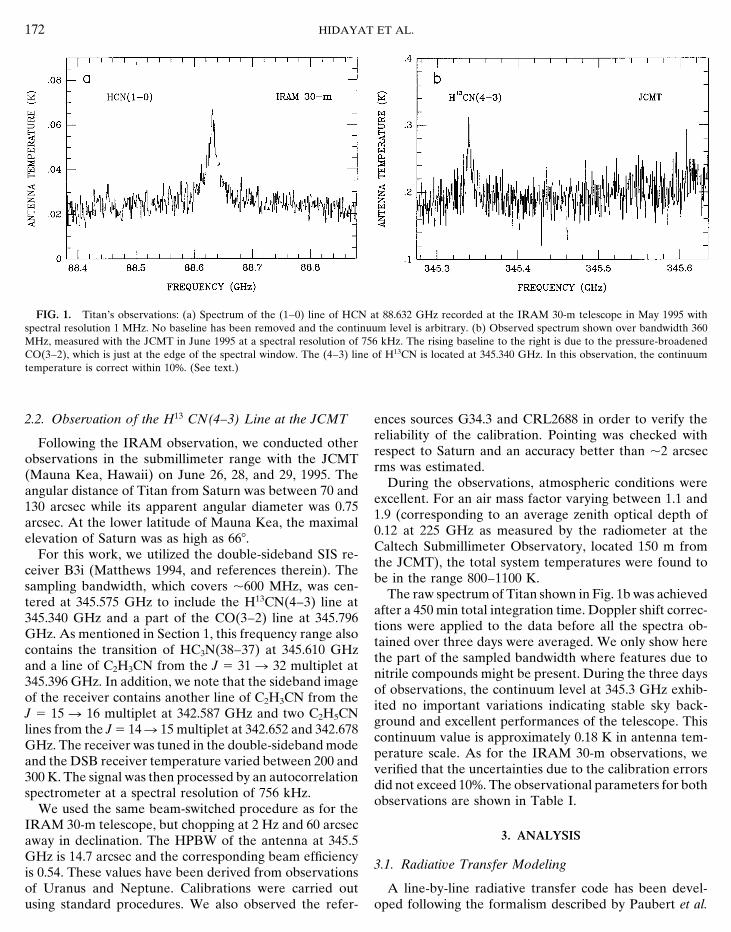
FIG. 1. Titan’s observations: (a) Spectrum of the (1–0) line of HCN at 88.632 GHz recorded at the IRAM 30-m telescope in May 1995 withspectral resolution 1 MHz. No baseline has been removed and the continuum level is arbitrary. (b) Observed spectrum shown over bandwidth 360MHz, measured with the JCMT in June 1995 at a spectral resolution of 756 kHz. The rising baseline to the right is due to the pressure-broadenedCO(3–2), which is just at the edge of the spectral window. The (4–3) line of H13CN is located at 345.340 GHz. In this observation, the continuumtemperature is correct within 10%. (See text.)
2.2. Observation of the H13 CN(4–3) Line at the JCMT ences sources G34.3 and CRL2688 in order to verify thereliability of the calibration. Pointing was checked with
Following the IRAM observation, we conducted otherrespect to Saturn and an accuracy better than p2 arcsec
observations in the submillimeter range with the JCMTrms was estimated.
(Mauna Kea, Hawaii) on June 26, 28, and 29, 1995. TheDuring the observations, atmospheric conditions were
angular distance of Titan from Saturn was between 70 andexcellent. For an air mass factor varying between 1.1 and
130 arcsec while its apparent angular diameter was 0.751.9 (corresponding to an average zenith optical depth of
arcsec. At the lower latitude of Mauna Kea, the maximal0.12 at 225 GHz as measured by the radiometer at the
elevation of Saturn was as high as 668.Caltech Submillimeter Observatory, located 150 m from
For this work, we utilized the double-sideband SIS re-the JCMT), the total system temperatures were found to
ceiver B3i (Matthews 1994, and references therein). Thebe in the range 800–1100 K.
sampling bandwidth, which covers p600 MHz, was cen-The raw spectrum of Titan shown in Fig. 1b was achieved
tered at 345.575 GHz to include the H13CN(4–3) line atafter a 450 min total integration time. Doppler shift correc-
345.340 GHz and a part of the CO(3–2) line at 345.796tions were applied to the data before all the spectra ob-
GHz. As mentioned in Section 1, this frequency range alsotained over three days were averaged. We only show here
contains the transition of HC3N(38–37) at 345.610 GHzthe part of the sampled bandwidth where features due to
and a line of C2H3CN from the J 5 31 R 32 multiplet atnitrile compounds might be present. During the three days
345.396 GHz. In addition, we note that the sideband imageof observations, the continuum level at 345.3 GHz exhib-
of the receiver contains another line of C2H3CN from theited no important variations indicating stable sky back-
J 5 15 R 16 multiplet at 342.587 GHz and two C2H5CNground and excellent performances of the telescope. This
lines from the J 5 14 R 15 multiplet at 342.652 and 342.678continuum value is approximately 0.18 K in antenna tem-
GHz. The receiver was tuned in the double-sideband modeperature scale. As for the IRAM 30-m observations, we
and the DSB receiver temperature varied between 200 andverified that the uncertainties due to the calibration errors
300 K. The signal was then processed by an autocorrelationdid not exceed 10%. The observational parameters for both
spectrometer at a spectral resolution of 756 kHz.observations are shown in Table I.
We used the same beam-switched procedure as for theIRAM 30-m telescope, but chopping at 2 Hz and 60 arcsec
3. ANALYSISaway in declination. The HPBW of the antenna at 345.5GHz is 14.7 arcsec and the corresponding beam efficiency
3.1. Radiative Transfer Modelingis 0.54. These values have been derived from observationsof Uranus and Neptune. Calibrations were carried out A line-by-line radiative transfer code has been devel-
oped following the formalism described by Paubert et al.using standard procedures. We also observed the refer-

STRATOSPHERIC HCN ON TITAN 173
TABLE IObservational Parameters
IRAM 30-m JCMT
Date of Observations May 21, 22, 24 June 26, 28, 29(1995)
Spectral line HCN(1–0) H13CN(4–3)Line frequency 88.632 GHz 345.340 GHzReceiver (mode) SIS (SSB) SIS (DSB)Spectrometer 512 3 1 MHz AutocorrelatorReceiver noise temper- 150–200 K 200–300 K
atureSystem temperature 350–420 K 800–1100 KObservational Procedure beam-switching beam-switchingIntegration time 480 min 450 minCalibration sources W51D, G34.3, G34.3, CRL2688,
Saturn, Uranus, Saturn, Uranus,Neptune Neptune
(1984) in which the numerical calculation of the total radi-ance emitted by the planet takes into account the sphericityof its atmosphere. In the spectral simulations, we integratethe radiative transfer equation up to an altitude of z0 5800 km above the surface of radius R 5 2575 km (Lindalet al. 1983). Consequently, an ‘‘effective radius’’ of R 1z0 5 3375 km is adopted in the evaluation of the totalflux emitted by Titan. The validity of this assumption isjustified hereafter.
FIG. 2. ‘‘Nominal’’ temperature profile of Titan adopted for thisThe opacity due to HCN was calculated from the spec- work (from Coustenis and Bezard 1995). The upper part (above 300 km)troscopic parameters of the JPL catalog (Poynter and Pick- is taken from model J of Yelle (1991) that satisfies the temperature
constraints (shown as a box) derived from stellar occultation observationsett 1985). The HCN–N2 collisional broadening coefficient(Hubbard et al. 1993).for the ground state rotational transition of HCN was taken
from Rohart et al. (1987) following the law 0.177(T/300)20.80 cm21 atm21. In addition, the N2–N2 pressure-in-duced absorption which dominates the continuum millime- consistent with the temperatures inferred from the 28 Sgrter opacity of Titan was calculated using the model of stellar occultation measurements (Hubbard et al. 1993).Courtin (1988). We consider that HCN condenses out in Assuming a uniform HCN mixing ratio of 2 3 1027 abovethe lower stratosphere according to the saturation law its condensation level, we have calculated contributionlog10 Vp(mbar) 5 11.535 2 2318/T(K), from Lellouch et functions for HCN(1–0) at several frequencies from theal. (1994). line center (88.632 GHz). Figure 3 presents five of these
In modeling the observed spectrum, we adopted, as our functions calculated at resolution 100 kHz. We remark that‘‘nominal’’ model of Titan’s temperature profile, model A Titan’s continuum flux originates from the lower tropo-of Coustenis and Bezard (1995). This model, which was sphere while the HCN emission comes from 80 up to p500used in their work to describe the equatorial thermal pro- km depending on the observed frequency offset. We canfile, is appropriate to our work since we need to model also notice that the upper part of the stratosphere abovethe flux density spectrum averaged over Titan’s disk, which 300 km corresponds to a very narrow frequency coverageis more heavily weighted towards equatorial latitudes. This of a few MHz around the line center and that the HCNtemperature profile was determined from the Voyager 1 retrieval in this part is thus limited by the signal-to-noiseradio-occultation data combined with the results of infra- ratio we can obtain at the highest spectral resolution.red observations in the 7.7 em methane band (Lindal et The synthetic computations demand a careful consider-al. 1983, Lellouch et al. 1989), roughly in the altitude range ation of suitable basic parameters. First, the total radius0–270 km, and then extrapolated to join model J of Yelle Rt 5 R 1 z0 5 3375 km of Titan was chosen after the
radiative transfer equation was integrated up to different(1991) at 300 km. As shown in Fig. 2, the latter is fairly

174 HIDAYAT ET AL.
TABLE IIDilution Factors
IRAM 30-m JCMT(at 88 GHz) (at 345 GHz)
Half-power beam width (HPBW) 28 arcsec 14.7 arcsecMain beam efficiency (Beff) 0.75 0.54Forward efficiency (Feff) 0.92 —Dilution factor (TB/T*a ) 1605 6 160 590 6 60
tive to the telescope beam size and C is a correcting factordepending on the telescope, i.e., C 5 Feff/Beff for the IRAM30-m telescope (Beff is the beam efficiency and Feff is theforward efficiency) and C 5 1/Beff for the JCMT.
Such a conversion is straightforward because the sourcesize is relatively small compared to that of the beam. Thetelescope parameters—HPBW, Beff , and Feff—which de-termine the so-called dilution factor, TB/T*a , were mea-sured during the observations. Recall that a conservativelimit of the cumulative errors on these parameters is p10%.The dilution factors used for this work are shown in TableII, where the adopted Titan radius is 3375 km.
3.2. Results from HCN(1–0) Observations
Since the mean continuum of the observed spectrum isarbitrary, we shift it down to a zero level in our antennatemperature scale by subtracting a zeroth order polynomial
FIG. 3. Normalized contribution function for HCN(1–0) at several baseline, i.e., a constant factor.frequencies from the line center (88.632 GHz), calculated at resolution Synthetic spectra have been calculated for several con-100 kHz and assuming a uniform HCN mixing ratio of 2 3 1027 above
stant mixing ratios of HCN above its condensation level.its condensation level.As examples, spectra (in T*a unit) corresponding to 1, 4,and 8 3 1027 mixing ratio are displayed in Fig. 4. The mean
altitude limits z. We found that the contribution of theupper atmosphere is negligible above z 5 800 km and,consequently, this estimated value of z (5 z0) was adoptedto define the effective angular diameter u of Titan, i.e.,u 5 2 tan21(Rt/D), where D is the geocentric distance.Second, the calculation of the emitted flux (in Jy), whichcorresponds to an equivalent brightness temperature TB
(in K), yields spectra appropriate for comparison with theobserved spectra T*a if we introduce the relationship
TB 5 hCT*a , (1)
where
h 51
1 2 22(u/HPBW)2 (2)
FIG. 4. Comparison of the observed spectrum with synthetic spectragenerated for a uniform HCN mixing ratio of 1, 4, and 8 3 107 above
represents a coupling factor between the beam assumed condensation level. Note that a zeroth order polynomial baseline in thedata has been removed. See text for details.to be gaussian and the planetary disk. The HPBW is rela-

STRATOSPHERIC HCN ON TITAN 175
FIG. 5. (a) Observed HCN(1–0) spectrum compared with the best fit model (solid line). The corresponding HCN distribution is shown in Fig.6. (b) The same HCN distribution is subsequently used to model the H13CN(4–3) line. A terrestrial value of 89 for the H12CN/H13CN ratio yieldsa good fit of the observed line shown at a spectral resolution of 1.5 MHz.
continuum level of the calculated spectra have also been 2). Keeping the same HCN abundance we found that thiseffect perturbs the radiances by less than 3% and conse-shifted down for comparison with the observed spectrum.
The 1 3 1027 model yields a narrower line profile whereas quently lies well below calibration uncertainties.the other two exhibit broader line shapes. However, the
3.3. Measurements of the H13CN(4–3) Line and the4 3 1027 model provides a good fit to the peak of the12C/13C Ratiomeasured spectrum. A detailed examination of the contri-
bution functions in Fig. 3 suggests that this model overesti- The observations of the H13CN(4–3) line on Titan pro-mates the HCN concentration in the lower stratosphere, vide a way of deriving the value of the 12C/13C ratio in thebut not in the upper stratosphere. In other words, the HCN atmosphere, assuming the validity of the HCN verticalmixing ratio must increase with height in the stratosphere, distribution inferred from the spectrum of the (1–0) lineas first pointed out by Tanguy et al. (1990). of H12CN. We note that the H13CN line mostly originates
We subsequently found by trial and error that the peakof the data can be best-represented by a constant distribu-tion of 3.5 3 1027 above an altitude of 200 km. Belowthis level, the HCN concentration decreases down to thecondensation level at p80 km. The best fit to the datais shown in Fig. 5a with the corresponding HCN profiledisplayed in Fig. 6.
As mentioned in Section 2, however, the calibrationprocedure could produce a systematic error in the tempera-ture scale amounting to p10%. We therefore applied multi-plying factors of 0.9 and 1.1 to the observed spectrumand derived the HCN profile which best reproduces theperturbed spectrum. This analysis provided us with enve-lope profiles from which we derived the error bars associ-ated with our nominal solution (Fig. 6).
Systematic errors can also arise from uncertainties re-lated to the atmospheric temperature profile. We investi-gated the influence of the profile on the calculated spec-trum by alternatively using the profile of Lellouch et al.
FIG. 6. HCN vertical distribution derived from our observations.(1989). This profile is isothermally extrapolated above 200 Note that it exhibits a constant value above 200 km, at least up to 350km corresponding to the extreme temperature (p180 K) km altitude. The associated error bars correspond to 10% uncertainty
mainly due to calibration errors.derived from stellar occultation measurements (see Fig.

176 HIDAYAT ET AL.
from atmospheric levels located below 200 km altitude, a Tanguy et al. found that their vertical distribution wasbest constrained by their data around an altitude of 170region where the thermal profile and the HCN distribution
are relatively well determined. km, for which they derived a mixing ratio of 3.310.920.8 3 1027
having a scale height of 47136211 km. They subsequently ex-The modeled spectrum shown in Fig. 5b was calculated
for the terrestrial value of 12C/13C, namely 89 (Wedepohl trapolated their distribution from these nominal values upto 400 km assuming that the HCN mixing ratio profile kept1969). So for this calculation, the density profile of H13CN
is 1/89 that of H12CN and follows the same saturation the same vertical gradient. Tanguy et al.’s model leads toa spectral line that would be too intense and too broadlaw in the lower stratosphere. The spectral resolution was
downgraded by a factor of 2, i.e., 1.5 MHz, to increase the compared to our data.The discrepancy between the two results can be ex-signal-to-noise ratio. We have added a constant value to
the calculated spectrum in order to take into account the plained as follows. Tanguy et al. retrieved the HCN profilefrom observations of the same J 5 0 R 1 line made withcontinuum signal received in the image sideband of the
receiver around 342.575 GHz. This constant agrees within the IRAM 30-m telescope in 1986 and 1987, some 10 yrago. This was the first ground-based detection of HCN. We10% with the T*a continuum value predicted by our model-
ing and provides additional good support for the evaluation obtained approximately the same temperature contrast, onthe order of p40 mK. But the significant difference is thatof calibration uncertainties. A detailed analysis of this spec-
trum related to the CO abundance determination will be we improved the signal-to-noise ratio by a factor of atleast 5. In addition, the ripple effect in their data was notpresented in a forthcoming paper.
The good fit of these observations suggests that the negligible, and this could have biased the measurement,explaining some of the difference with our results at alti-12C/13C ratio in Titan is roughly terrestrial. From comple-
mentary calculations made with other values of the ratio, tudes above 200 km. Note also that the different saturationlaw of HCN adopted here makes HCN condense outthere is some evidence that our determination is in the
range 70–120 (see Fig. 7), implying that 12C/13C can be slightly higher above the tropopause level, as can be seenfrom Fig. 8.considered terrestrial within 25%. Our result is consistent
with the value 80 6 20 estimated from measurements ofinfrared emission lines of 12C2H6 and 13C12CH6 reported
3.5. Upper Limits on Other Nitrilesby Orton (1992). Its implication is discussed in Section 4.2.
Our observations with the JCMT were mainly devotedto H13CN measurements. However, other nitriles expected
3.4. Comparison with Results from Voyager 1 andto be present in Titan’s atmosphere exhibit transitions in
Tanguy et al. (1990)the frequency bandwidth we used. We therefore investi-gated the possible presence of these nitrile signatures.Reanalyzing the Voyager IRIS data in the equatorial
region, Coustenis et al. (1989a) derived an average mole As shown in Fig. 5b, there is a relatively weak HC3Nline at 345.610 GHz from its J 5 37 R 38 transition whichfraction of HCN equal to 1.610.4
20.6 3 1027 roughly in the85–180 km altitude range, consistent with our profile as exhibits an extremely narrow line profile. Inspection of the
intensity compared to the noise level indicates that theshown in Fig. 8. However, HCN varies with latitude (Cous-tenis et al. 1991, Coustenis and Bezard 1995). The strong mean stratospheric mixing ratio of this compound cannot
exceed 1.5 3 1029, in agreement with the upper limit de-pole-to-pole variations of HCN found by these authorscannot be measured using our disk average determination. rived by Coustenis et al. (1989a) at equatorial latitudes.
Note, however, that the HC3N mixing ratio varies withIn other words, our observation of Titan is essentially rep-resentative of mid-latitudes because of the limited contri- latitude (Coustenis and Bezard 1995) and altitude (Bezard
et al. 1992).bution of the polar regions to the global emitted flux. Weconclude that the HCN distribution we propose in the Another line in the same range is from the J 5 31 R
32 multiplet of C2H3CN at 345.396 GHz. Unfortunately,lower stratosphere is comparable to the equatorial valuemeasured by Voyager if we assume that no significant the intensity of this line is weaker than that of HC3N(38–
37) by a factor of 300. The other one, from the multipletchange in the global composition has occurred over thepast 15 yr. J 5 15 R 16 at 342.587 GHz, is even weaker by a factor
of 1000. The formation of this compound has been studiedComparison of our derived HCN vertical profile withthe previous model of Tanguy et al. is shown in Fig. 8. We by Thompson et al. (1991) from an experiment with plasma
discharge is a mixture of N2 1 CH4 at low pressures, fromsee that our model is compatible with theirs within errorbars in the altitude range 100–200 km. However, it does not which they predicted a mixing ratio of about 1.9 3 1029.
The signal-to-noise ratio in our present observation is notsteadily increase with height above 200 km, as suggested byTanguy et al. Instead, we find a mixing ratio 3.510.9
21.1 3 1027 sufficient to constrain a nitrile production model becausewe found a higher limit p1027. We note that this upperthat is approximately constant.

STRATOSPHERIC HCN ON TITAN 177
FIG. 7. Synthetic spectra calculated by assuming: (a) H12CN/H13CN 5 70 and (b) H12CN/H13CN 5 120. Both are displayed (in absolute T*a )over a 300 MHz bandwidth. Model (a) fits the peak fairly well but appears larger in the wings, while model (b), in constrast, exhibits a narrowerline shape but yields a good fit to the continuum in the wings. This leads us to consider that the possible value for the 12C/13C ratio is in the range 70–120.
limit is comparable to that previously derived from Voy- trieval of the K-profile depends on the assumed productionrate of HCN, which in turn depends on the dissociationager data by Cerceau et al. (1985).rate of N2 .The last nitrile compound in our frequency bandwidth
In their investigation of Titan’s photochemistry Yungis C2H5CN, exhibiting two lines from the J 5 14 R 15et al. (1984) assumed a K-profile derived from calculationsmultiplet at 342.652 and 342.678 GHz. But again, the inten-of the eddy transport in the terrestrial upper atmospheresity of these lines is weaker by a factor of 500 than that(Allen et al. 1981). The magnitudes of the eddy diffusionof HC3N(38–37), and consequently no stringent constraintcoefficient in the thermosphere and in the lower strato-can be set on the column density of this compound.sphere were adjusted in order to fit UVS and Voyager IRISdata available at that time. From a complete reanalysis of
4. DISCUSSION IRIS measurements, Coustenis et al. (1989a) subsequentlyderived more precise values of hydrocarbon and HCN4.1. The Eddy Diffusion Coefficient Profilemixing ratios, which were found to be in conflict with the
The determination of the vertical distribution of HCN predictions of the model of Yung et al.provides a way to infer the eddy diffusion coefficient profile This model does not agree with the millimeter observa-K(z), at least in the lower stratosphere of the satellite. tions of Tanguy et al. (1990) either. In order to reconcile the
predictions of the photochemical model with their verticalHowever, as pointed out by Monks et al. (1993), the re-

178 HIDAYAT ET AL.
of HCN less than half than that inferred by Yung et al. Intheir model, Toublanc et al. chose a value of K in thethermosphere (3.5 3 106 cm2 sec21) that fits the UVS obser-vations of CH4 at high altitudes. In the lower stratosphere,they used the HCN vertical distribution of Tanguy et al.to constrain K(z): the resulting profile, however, leads tolower values of K than the nominal profile of Tanguy etal. below 400 km (see Fig. 9).
We used our retrieved HCN distribution to derive con-straints on the eddy mixing profile in Titan’s lower strato-sphere. HCN is produced in the thermosphere from thereaction of N atoms with the 3CH2 radical, diffuses down-ward, and is eventually lost by condensation in the lowerstratosphere. In the framework of a simplified photochemi-cal model, the HCN vertical profile q(z) was obtained bysolving the continuity equation
FIG. 8. Comparison of the derived HCN vertical profile (shadedarea) with previous measurements of Tanguy et al. (1990). Below the 200km altitude level, our model agrees with Tanguy et al.’s model and with
Kndqdz
(z) 5 Kcncdqdz
(zc) 1 S RR 1 zD2
Prod(z), (3)the stratospheric average value derived by Coustenis et al. (1989) fromVoyager IRIS data (shown as a box).
where n is the atmospheric number density and Prod(z)is the net production rate of HCN above altitude z (normal-
distribution of HCN, these authors modified the eddy diffu- ized to the surface at radius R). The subscript c refers tosion coefficient used by Yung et al. in the lower strato- the condensation level. We adopted a net HCN productionsphere. They assumed that HCN was produced at a rate rate in the high atmosphere (above 650 km) of 1 3 108
of 1 3 108 cm22 sec21 above 700 km and that its vertical cm22 sec21, identical to that used in Tanguy et al. and alsoprofile was governed by diffusion at lower levels down to found by Toublanc et al. (1995) in models where catalyticthe condensation region. They then solved the continuity destruction of H is not included. At lower levels, we as-equation, adjusting K(z) in the lower stratosphere to get sumed that HCN did not undergo any chemical loss orvertical distributions of HCN consistent with their observa- production while transported by eddy mixing to the con-tions (Fig. 9). The magnitude of the resulting eddy diffusion densation region. On the other hand, we incorporatedcoefficients is substantially lower than that used by Yung losses due to photodissociation (calculated for a solar fluxet al. below the 300 km region. at 308 latitude) along with subsequent reactions of the CN
Subsequently, Toon et al. (1992) also utilized another radicals with CH4 , C2H2 , C2H4 , and C2H6 which recycleeddy diffusion coefficient profile to calculate a haze distri- most of the HCN. Rate constants were taken from Simsbution aimed at reproducing the geometric albedo ob- et al. (1993) and the fractional yields for the CN 1 C2H4served in both the ultraviolet and the near infrared ranges. reactions from Monks et al. (1993). The hydrocarbon distri-Their retrieved K-coefficient is found to be consistent, butions come from Lara et al.’s (1996) photochemicalwithin error bars, with the HCN distribution of Tanguy et model. The continuity equation was iteratively solved withal. at altitudes lower than 150 km. It is the same as that a lower boundary condition such that q(zc) and dq(zc)/dzof Yung et al. between 150 and 400 km, but substantially are equal to qs(zc) and dqs(zc)/dz respectively, where qs(z)stronger at higher altitudes. is the saturated mixing ratio profile. This assumption is
Toublanc et al. (1995) have developed a new one-dimen- equivalent to assuming that the condensation time is muchsional photochemical model of Titan’s atmosphere in shorter than the mixing time in the condensation regionwhich the N2 dissociation rate due to magnetospheric elec- so that supersaturation is negligible.trons is lower than that used by Yung et al. by more than Figure 9 shows a K-profile which yields an HCN profileone order of magnitude. They found that the total produc- consistent with that retrieved from the (1–0) line. Errortion of N(2D), responsible for the formation of HCN, was bars, calculated from those set on the HCN profile, areinstead dominated by solar extreme UV. They came out indicated at a few typical levels. The resulting K-profilewith a production rate for odd nitrogen of 7.7 3 108 cm22 is close to that obtained by Tanguy et al. in the lower
stratosphere below 200 km, but has to increase moresec21, 2.5 times lower than that used by Yung et al. (2 3109) but close to the revised value, 1 3 109, adopted by steeply with altitude to reproduce the weaker gradient in
the observed HCN profile. Our profile is also significantlyYung (1987). Accordingly, they derived a production rate

STRATOSPHERIC HCN ON TITAN 179
FIG. 9. Eddy diffusion coefficient K(z) inferred from the observed HCN vertical profile (right-half of the figure). Values larger than thosederived by Tanguy et al. (1990) are found above p140 km, as a consequence of the less steep gradient inferred for the HCN profile. The K-profilesused by Toon et al. (1992) and recently by Toublanc et al. (1995) are also plotted up to 400 km for comparison. On the left the observed andcalculated HCN distributions are displayed.
larger than that used by Toublanc et al. (1995) in the whole 4.2. The 12C/13C Ratio in Titan100- to 400-km range. For the assumed HCN production
The H12CN/H13CN ratio we derived may suggest a ter-rate, we found that K must be in the range 3–6 3 104 cm2
restrial value. The uncertainties related to this determina-sec21 at 160 km, increasing to at least 2 3 106 cm2 sec21 attion, however, do not permit us to draw firm conclusions.350 km. The K coefficient thus increases more steeply thanWhatever its value, it is useful to examine what informationpredicted by the standard n20.5 law usually assumed incould be inferred from our measurements. The key pointthe stratosphere. For our best fit model, calculations alsois that HCN is formed from the dissociation of CH4 , whichindicate that the HCN loss due to photodissociation doesis the main reservoir of carbon in Titan’s atmosphere. Innot exceed 10% in the stratosphere and mesosphere.turn, CH4 originates from the surface of the satellite. TwoToublanc et al. calculated vertical distributions for thequestions must then be considered: (i) Can we infer frommost abundant hydrocarbons (C2H2 , C2H6 , C3H8) in fairHCN abundances the value of the 12C/13C ratio in C-bear-agreement with the Voyager measurements (Coustenis eting species which formed Titan? (ii) What would be theal. 1989a). The agreement was less satisfactory for minorimplications of a terrestrial 12C/13C ratio in these species?species. The K-profile proposed here will affect to some
(i) Photochemical models of Titan predict a fast destruc-extent the results from photochemical calculations and maytion of methane in the upper atmosphere due to its photoly-eventually help to improve models of the photochemistrysis by photons below 1450 A (Yung et al. 1984, Toublancof Titan.et al. 1995). A reservoir of CH4 must then exist at theNo reliable information can be extracted from the pres-surface from which the atmospheric gas is permanentlyent data above the 400-km level. At higher altitudes, ourreplenished. Lunine et al. (1983) proposed that this reser-K-profile must be extrapolated in a way that satisfies thevoir could be a surficial ocean of hydrocarbons. On theVoyager UVS observations of methane above 1000 km. Aother hand, Stevenson (1992) suggested that CH4 is storedpossible solution is presented in the most recent photo-
chemical model of Lara et al. (1996). in pore space and caverns; such a model would reconcile

180 HIDAYAT ET AL.
the absence of a surficial ocean of hydrocarbons indicated nario where the carbon present in grains which formedthe satellite was mainly in the form of CH4 ices (Prinn andby the analysis of radar echos (Muhleman et al. 1990)Fegley 1981).and of near IR spectra (Griffith et al. 1991, Griffith 1993,
(ii) As discussed in Marten et al. (1994), the 12C/13CLemmon et al.1993, Coustenis et al. 1995). Another possi-ratio is expected to be practically the same everywherebility is that methane is outgassed from the interior throughin the Solar System and equal to the terrestrial valuevolcanoes (Lunine and Stevenson 1987).(with the exception of anomalies in meteorites whichThe evaporation of methane from a liquid reservoir mayconcern a very small part of the matter in these objects;result in isotopic fractionation (Kaye 1987). However, thisthe micrograins containing atypical 12C/13C ratios wouldauthor points out that the CH4 vapor pressure isotopicoriginate from the interstellar medium and would haveeffects are fairly small and should not lead to a substantialsurvived to the formation of the nebula (Ott 1993)). Thefractionation between 12CH4 and 13CH4 . The photolysis of12C/13C ratio reflects in principle the degree of evolutionCH4 as well as bimolecular reactions responsible for theof the major part of the interstellar medium in the regiondestruction of the gas might lead to a preferential produc-of the galaxy where the Solar System was formed 4.5tion of one isotopic variety that would affect the 12C/13Cbillion years ago. This assumption is based on the factratio in HCN. The problem has not been quantified butthat 12C and 13C are respectively products of primaryKaye (1987) indicates that such effects are not likely toand secondary thermonuclear processes occurring in stars.be crucial on Titan. Fegley and Prinn (1988) have consid-Some fractionation between C-bearing species is possibleered the isotopic fractionations resulting from thermo-but is too small to be detectable, in the present statechemical equilibrium between trace gases as HCN and CO,of measurements, among the various objects of the Solarand the major reservoir CH4 , according to the exchangeSystem. Thus, the 12C/13C ratio has been found to equalreactionsthe terrestrial ratio in the Sun, Mars, Venus, and Jupiter(Pepin 1989, Marten et al. 1994). Some preliminary results
13CH4 1 H12CN 5 12CH4 1 H13CN concerning comet Halley had suggested a nonterrestrial12C/13C, but have been subsequently revised: within uncer-13CH4 1 12CO 5 12CH4 1 13CO.tainties, the ratio in P/Halley (100 6 15) is also terrestrial(Mumma et al. 1993).In the case of Jupiter and Saturn, at least, the calculated
fractionation factors do not vary from unity by more thana few tenths of a percent (Fegley and Prinn 1988).
5. CONCLUSIONNote that carbon cannot escape from the exosphere atan appreciable rate (Yung et al. 1984) and therefore we New millimeter observations of the (1–0) line of HCNcan rule out a significant isotopic fractionation of carbon emitted from Titan made at the IRAM radiotelescope al-by atmospheric escape. lowed us to retrieve the vertical distribution of this species
Alternatively, we must invoke cometary impacts that in the stratosphere of the satellite, from the saturationmay have contributed gases to the atmosphere of Titan, level, located at 80 km altitude, up to about the 350 kmas advocated by several authors (Zahnle et al. 1992, Griffith level.and Zahnle 1995). If so, the 12C/13C ratio in Titan could Using the HCN production rate predicted from photo-be representative of this ratio in comets (see (ii) below). chemical models, we derived constraints on the eddyHowever, the D/H ratio measured in comet P/Halley (re- mixing profile in the lower stratosphere. The K coefficientcently revised by Balsiger et al. 1995 and Eberhardt et al. is close to that derived by Tanguy et al. (1990) below1995) as well as in comet Hyakutake (Gautier et al. 1996) 160 km but increases more rapidly with height at higheris higher by at least a factor of 2 than that inferred in Titan levels. In particular, the gradient between 100 and 350as reported by various authors (Owen et al. 1986, de Bergh km is larger than the n20.5 law. The retrieved eddy profileet al. 1988, Coustenis et al. 1989b, Orton 1992). All known is also much larger than that derived by Toublanc et al.fractionation processes would deplete deuterium with re- (1995) from fitting the HCN profile of Tanguy et al. Ourspect to a cometary value; therefore, the D/H ratio in Titan result should help constraining photochemical modelsrequires hypothesizing that its present atmosphere is not and ultimately improve our understanding of the complexpredominantly of cometary origin. photochemistry at work in Titan’s atmosphere.
To sum up, the range 70–120 we inferred for the H12CN/ The observation of the (4–3) line of H13CN made atH13CN ratio seems to be representative, within uncertain- the JCMT permitted us to derive an atmospheric H12CN/ties, of the 12C/13C value in carbon present in volatiles H13CN ratio compatible with the terrestrial value. We con-trapped in the interior of Titan. Note that available thermo- clude that fractionation processes of carbon expected to
occur in Titan seem to be negligible.chemical models of the subnebula of Saturn favor a sce-

STRATOSPHERIC HCN ON TITAN 181
ACKNOWLEDGMENTS GRIFFITH, C. A., T. OWEN, AND R. WAGENER 1991. Titan’s surface andtroposphere, investigated with ground-based, near-infrared observa-
T. H. and A. M. thank J. Mondellini for her precious help in the data tions. Icarus 93, 362–378.processing. We are also grateful to Y. Biraud and A. Coustenis for fruitful GRIFFITH, C. A., AND K. ZAHNLE 1995. Influx of cometary volatiles todiscussions, and to the IRAM staff, especially Raphael Moreno for his planetary moons: The atmosphere of 1000 possible Titans. J. Geophys.efficient assistance during the observations. Res. 100, 16,907–16,922.
HANEL, R., B. CONRATH, F. M. FLASAR, V. KUNDE, W. MAGUIRE, J.PEARL, J. PIRRAGLIA, R. SAMUELSON, L. HERATH, M. ALLISON, D.
REFERENCES CRUIKSHANK, D. GAUTIER, P. GIERASCH, L. HORN, R. KOPPANY, AND
C. PONNAMPERUNA 1981. Infrared observations of the saturnian systemfrom Voyager 1. Science 212, 192–200.ALLEN, M., Y. L. YUNG, AND J. W. WATERS 1981. Vertical transport and
HUBBARD, W. B., B. SICARDY, R. MILES, AND 43 COLLEAGUES. 1993. Thephotochemistry in the terrestrial mesosphere and lower thermosphereoccultation of 28 Sgr by Titan. Astron. Astrophys. 269, 541–563.(50–120 km). J. Geophys. Res. 86, 3617–3627.
KAYE, J. A. 1987. Mechanisms and observations for isotope fractionationBAARS, J. W. M., B. G. HOOGHOUDT, P. G. MEZGER, AND M. J. DE JONGEof molecular species in planetary atmospheres. Rev. Geophys. 25, 1609–1987. The IRAM 30-m millimeter radio telescope on Pico Veleta, Spain.1658.Astron. Astrophys. 175, 319–326.
KUNDE, V. G., A. C. AIKIN, R. A. HANEL, D. E. JENNINGS, W. C. MAGUIRE,BALSIGER, H., K. ALTWEGG, AND J. GEISS 1995. D/H and 18O/16O-ratioAND R. E. SAMUELSON 1981. C4H2 , HC3N and C2N2 in Titan’s atmo-in the hydronium ion and in neutral water from in situ measurementssphere. Nature 292, 686–688.in Comet Halley. J. Geophys. Res. 100, 5827–5834.
LARA, L. M., E. LELLOUCH, J. J. LOPEZ-MORENO, AND R. RODRIGO 1996.BEZARD, B., A. MARTEN, AND G. PAUBERT 1992. First ground-basedVertical distributions of Titan’s neutral constituents. J. Geophys. Res.detection of cyanoacetylene on Titan. Bull. Am. Ast. Soc. 24, 953.Planets 101, 23,261–23,283.BEZARD, B., A. MARTEN, AND G. PAUBERT 1993. Detection of acetonitrile
LELLOUCH, E., A. COUSTENIS, D. GAUTIER, F. RAULIN, N. DUBOULOZ,on Titan. Bull. Am. Ast. Soc. 25, 1100.AND C. FRERE 1989. Titan’s atmosphere and hypothesized ocean: ACERCEAU, F., F. RAULIN, R. COURTIN, AND D. GAUTIER 1985. Infraredreanalysis of the Voyager 1 radio-occultation and IRIS 7.7 em data.spectra of gaseous mononitriles—Application to the atmosphere ofIcarus 79, 328–349.Titan. Icarus 62, 207–220.
LELLOUCH, E., P. N. ROMANI, AND J. ROSENQVIST 1994. The verticalCOURTIN, R. 1988. Pressure-induced absorption coefficient for radiativedistribution and origin of HCN in Neptune’s atmosphere. Icarustransfer calculations in Titan’s atmosphere. Icarus 75, 245–254.108, 112–136.
COUSTENIS, A., B. BEZARD, AND D. GAUTIER 1989a. Titan’s atmosphereLEMMON, M. T., E. KARKOSCHKA, AND M. TOMASKO 1993. Titan’s rota-from Voyager infrared observations. I. The gas composition of Titan’s
tion: Surface feature observed. Icarus 103, 329–332.equatorial region. Icarus 80, 54–76.LINDAL, G. F., G. E. WOOD, H. B. HOTZ, D. N. SWEETNAM, V. R. ESHLE-COUSTENIS, A., B. BEZARD, AND D. GAUTIER 1989b. Titan’s atmosphere
MAN, AND G. L. TYLER 1983. The atmosphere of Titan: An analysisfrom Voyager infrared observations. II. The CH3 abundance andof the Voyager I radio occultation measurements. Icarus 53, 348–363.D/H ratio from the 900–1200 cm21 spectral region. Icarus 82, 67–80.
LUNINE, J. I., D. J. STEVENSON, AND Y. L. YUNG 1983. Ethane ocean inCOUSTENIS, A., B. BEZARD, D. GAUTIER, A. MARTEN, AND R. SAMUELSONTitan. Science 272, 1229–1230.1991. Titan’s atmosphere from Voyager infrared observations. III. Ver-
LUNINE, J. I., AND D. J. STEVENSON 1987. Clathrates and ammonia hy-tical distributions of hydrocarbons and nitriles near Titan’s north pole.drates at high pressures: Application to the origin of methane in Titan.Icarus 89, 152–167.Icarus 70, 61–77.COUSTENIS, A., AND B. BEZARD 1995. Titan’s atmosphere from Voyager
LUTZ, B. L., C. DE BERGH, AND T. OWEN 1983. Titan: Discovery of carboninfrared observations. IV. Latitudinal variations of temperature andmonoxide in its atmosphere. Science 220, 1374–1375.composition. Icarus 115, 126–140.
MARTEN, A., C. DE BERGH, T. OWEN, D. GAUTIER, J. P. MAILLARD, P.COUSTENIS, A., E. LELLOUCH, J. P. MAILLARD, AND C. P. MCKAY 1995.DROSSART, B. L. LUTZ, AND G. S. ORTON 1994. Four micron high-Titan’s surface: Composition and variability from the near-infraredresolution spectra of Jupiter in the North Equatorial Belt: H1
3 emissionsalbedo. Icarus 118, 87–104.and the 12C/13C ratio. Planet. Space. Sci. 42, 391–399.
DE BERGH, C., B. L. LUTZ, T. OWEN, AND J. CHAUVILLE 1988. Monodeut-MATTHEWS, H. E. 1994. The James Clerck Maxwell Telescope: A Guideerated methane in the outer Solar System. III. Its abundance on Titan.
for the Prospective User. Joint Astronomy Centre, Hilo.Astrophys. J. 329, 951–955.MAUERSBERGER, R., M. GUELIN, J. MARTIN-PINTADO, J. CERNICHARO,EBERHARDT, P., M. REBER, D. KRANKOWSKY, AND R. R. HODGES 1995.
H. HEIN, AND S. NAVARRO 1989. Line calibrators at l 5 1.3, 2 and 3The D/H and 18O/16O ratios in water from Comet P/Halley. Astron.mm. Astron. Astrophys. Suppl. Ser. 79, 217–261.Astrophys. 302, 301–318.
MONKS, P. S., P. N. ROMANI, F. L. NESBITT, M. SCANLON, AND L. J.FEGLEY, B., JR., AND R. G. PRINN 1988. The predicted abundances ofSTIEF 1993. The kinetics of the formation of nitrile compounds in thedeuterium-bearing gases in the atmospheres of Jupiter and Saturn.atmospheres of Titan and Neptune. J. Geophys. Res. Planets. 98,Astrophys. J. 326, 490–508.17,115–17,122.GAUTIER, D., D. BOCKELEE-MORVAN, J. CROVISIER, T. OWEN, D. LIS, J.
MUHLEMAN, D. O., A. W. GROSSMAN, B. J. BUTLER, AND M. A. SLADEKEENE, K. YOUNG, T. PHILLIPS, E. BERGIN, P. GOLDSMITH, A. WOOT-
1990. Radar reflectivity of Titan. Science 248, 975–980.TEN, AND D. DESPOIS 1996. Observations of HDO in C/1996B2 Hyaku-take at the Caltech Submillimeter Observatory. Presented at Asteroids, MUMMA, M. J., P. R. WEISSMAN, AND A. STERN 1993. Comets and theComets, Meteors Colloquium, Versailles, 8–12 July, 1996. origin of the Solar System: reading the Rosetta Stone. In Protostars
and Planets III (E. H. Levy and J. I. Lunine, Eds.), pp. 1177–1252.GRIFFITH, C. A., 1993. Evidence for surface heterogeneity on Titan.Nature 364, 511–514. University of Arizona Press, Tucson.

182 HIDAYAT ET AL.
ORTON, G. 1992. Ground-based observations of Titan’s thermal spectrum. STEVENSON, D. J. 1992. Interior of Titan. In Proceedings of the Sympo-sium on Titan, ESA SP-338, pp. 29–33. ESA Publications Division,In Proceedings of the Symposium on Titan, ESA SP-338, pp. 81–85.Noordwijk.ESA Publications Division, Noordwijk.
STROBEL, D. F., M. E. SUMMERS, AND X. ZHU 1992. Titan’s upper atmo-OTT, V. 1993. Physical and isotopic properties of surviving interstellarsphere: Structure and ultraviolet emissions. Icarus 100, 512–526.carbon phases. In Protostars and Planets III (E. H. Levy and J. I.
Lunine, Eds.), pp. 883–902. University of Arizona Press, Tucson. TANGUY, L., B. BEZARD, A. MARTEN, D. GAUTIER, E. GERARD, G.PAUBERT, AND A. LECACHEUX 1990. The stratospheric profile of HCNOWEN, T., B. L. LUTZ, AND C. DE BERGH 1986. Deuterium in the outeron Titan from millimeter observations. Icarus 85, 43–57.Solar System: Evidence for two distinct reservoirs. Nature 320, 244–246.
THOMPSON, W. R., T. J. HENRY, J. M. SCHWARTZ, B. N. KHARE, AND C.PAUBERT, G., D. GAUTIER, AND R. COURTIN 1984. The millimeter spec-SAGAN 1991. Plasma discharge in N2 1 CH4 at low pressures: Experi-trum of Titan: Detectability of HCN, HC3N, CH3CN and the COmental results and applications to Titan. Icarus 90, 57–73.abundance. Icarus 60, 599–612.
TOON, O. B., C. P. MCKAY, C. A. GRIFFITH, AND R. P. TURCO 1992. APEPIN, R. O. 1989. Atmospheric compositions: Key similarities and differ-
physical model of Titan’s aerosols. Icarus 95, 24–53.ences. In Origin and Evolution of Planetary and Satellites Atmospheres
TOUBLANC, D., J. P. PARISOT, J. BRILLET, D. GAUTIER, F. RAULIN, AND(S. K. Atreya, J. B. Pollack and M. S. Matthews, Eds.), pp. 291–305.C. P. MCKAY 1995. Photochemical modeling of Titan’s atmosphere.University of Arizona Press, Tucson.Icarus 113, 2–26.
POYNTER, R. L., H. M. PICKETT 1985. Submillimeter, millimeter and WEDEPOHL, K. M. 1969. Handbook of Geochemistry. Springer-Verlag,microwave spectral line catalog. Appl. Opt. 24, 2235–2240. Berlin.
PRINN, R. G., AND B. FEGLEY 1981. Kinetic inhibition of CO and N2 YELLE, R. V. 1991. Non-LTE models of Titan’s upper atmosphere.reduction in circumplanetary nebulae: Implications for satellite compo- Astrophys. J. 383, 380–400.sition. Astrophys. J. 249, 308–317. YUNG, Y. L. 1987. An update of nitrile photochemistry on Titan. Icarus
ROHART, F., D. DEROZIER, AND J. LEGRAND 1987. Foreign gas relaxation 72, 468–472.of the J 5 0 R 1 transition of HC15N. A study of the temperature YUNG, Y. L., M. ALLEN, AND P. J. PINTO 1984. Photochemistry of thedependence by coherent transient. J. Chem. Phys. 87, 5794–5803. atmosphere of Titan: Comparison between model and observations.
Astrophys. J. Suppl. Ser. 55, 465–506.SIMS, I. R., J.-L. QUEFFELEC, D. TRAVERS, B. R. ROWE, L. B. HERBERT,J. KARTHAUSER, AND I. W. M. SMITH 1993. Rate constants for the ZAHNLE, K., J. B. POLLACK, D. GRINSPOON, AND L. DONES 1992. Impact-reactions of CN with hydrocarbons at low and ultra-low temperatures. generated atmospheres over Titan, Ganymede, and Callisto. Icarus
95, 1–23.Chem. Phys. Lett. 211, 461–468.