A 3-dimensional analysis of molar movement during headgear treatment
12
18 I n the treatment of Angle Class II malocclusions, headgear is used routinely or occasionally by 9 out of 10 orthodontists. 1 Beginning in the late 1980s, the National Institutes of Health supported 3 separate clinical trials at the Universities of Florida, North Car- olina, and Pennsylvania, all of which included evalua- tions of headgear treatment for Class II malocclusion patients. In growing children, headgear had a significant therapeutic effect when compared with untreated con- trol groups. 2-4 The general consensus is that headgear inhibits the anterior displacement of the maxilla and thus contributes to the correction of the anteroposterior discrepancy between the maxillary and the mandibular dentitions. 3,4 The headgear force, transmitted to the maxilla via the maxillary first molars, can also cause these teeth to move distally. 2,4 All 3 trials documented the wide individual variations in response to headgear treatment, 4,5 underscoring the importance of character- izing the sources of such differences that result from seemingly similar treatments. 5-9 Understanding the effects of headgear treatment in the anteroposterior and vertical planes is derived pri- marily from the superimposition of serial lateral head radiographs. Stable anatomic landmarks 10 are used for registering a patient’s serial cephalographs to estimate the skeletal and dental change during the time period evaluated. 11 Unfortunately, cephalometric superimposi- tions have several limitations. Because exposure to ion- izing radiation should be minimized, cephalographs are made at relatively long intervals. The observed changes are divided by the number of years between headfilms to yield an annualized measure of change 2,4 that can obscure the true dynamic changes. Furthermore, anatomic landmarks are often difficult to identify reli- ably because of the overlap of left and right bilateral structures of the head. Variable head positioning in the cephalostat between serial radiographs can affect this overlap, further complicating the superimposition of films. Reliability of cephalometric superimposition is This investigation was supported by the University of Washington Orthodontic Alumni Association. The patient records used in this study were obtained from 2 NIH-funded studies (DE08715 and DE08722). Dr Ramsay received additional support from NIH grant DE00379. a Department of Orthodontics, University of Washington. b Department of Biostatistics, University of Washington. c Department of Pediatric Dentistry, University of Washington. d Department of Orthodontics, University of Florida. e Department of Orthodontics, University of Pennsylvania. Reprint requests to: Dr Douglas S. Ramsay, Department of Orthodontics, Uni- versity of Washington, Box 357446, Seattle, WA 98195-7446; e-mail, [email protected]. Submitted, February 2001; revised and accepted, June 2001. Copyright © 2002 by the American Association of Orthodontists. 0889-5406/2002/$35.00 + 0 8/1/120687 doi:10.1067/mod.2002.120687 ORIGINAL ARTICLE A 3-dimensional analysis of molar movement during headgear treatment Jennifer L. Ashmore, DDS, MSD, a Brenda F. Kurland, MS, EdM, b Gregory J. King, DMD, DMSc, a Timothy T. Wheeler, DMD, PhD, d Joseph Ghafari, DMD, e and Douglas S. Ramsay, DMD, PhD, MSD a,c Seattle, Wash, Gainesville, Fla, and Philadelphia, Pa Superimposition of serial cephalograms provides a limited description of tooth movement that could be complemented by data obtained from serial dental casts. The aim of this study was to develop a mathematical method for superimposing 3-dimensional data obtained from selected landmarks on longitudinally collected dental casts to describe maxillary first molar movement during headgear treatment. The material consisted of dental casts taken bimonthly from 36 children whose Class II Division 1 malocclusion was treated with straight-pull headgear during a 24-month period. Control data were collected from initial and final models of 38 subjects with a similar malocclusion who were not treated during a 24-month observation period. Spatial data from each subject’s initial model were oriented similarly in an anatomically derived coordinate system, and a best-fit superimposition of palatal rugae landmarks from subsequent models allowed the measurement of molar movement. On average, headgear treatment resulted in distal movement of the molars, and the fitted net difference between treated and control subjects was 3.00 mm (SE, 0.37 mm; P < .001). Also, the headgear caused significantly more molar extrusion (0.56 mm; SE, 0.20 mm; P < .006) and buccal expansion (0.58 mm; SE, 0.17 mm; P < .001) on average than in the control group.Poor reliability of the method for measuring molar rotations indicated that they could not be determined accurately. Longitudinal description of molar movement for each subject revealed great individual variability in the amount and pattern of tooth movement. Several reasons could account for the wide range of individual variation and warrant exploration. (Am J Orthod Dentofacial Orthop 2002;121:18-30)
-
Upload
washington -
Category
Documents
-
view
1 -
download
0
Transcript of A 3-dimensional analysis of molar movement during headgear treatment

18
In the treatment of Angle Class II malocclusions,headgear is used routinely or occasionally by 9 outof 10 orthodontists.1 Beginning in the late 1980s,
the National Institutes of Health supported 3 separateclinical trials at the Universities of Florida, North Car-olina, and Pennsylvania, all of which included evalua-tions of headgear treatment for Class II malocclusionpatients. In growing children, headgear had a significanttherapeutic effect when compared with untreated con-trol groups.2-4 The general consensus is that headgearinhibits the anterior displacement of the maxilla andthus contributes to the correction of the anteroposteriordiscrepancy between the maxillary and the mandibular
dentitions.3,4 The headgear force, transmitted to themaxilla via the maxillary first molars, can also causethese teeth to move distally.2,4 All 3 trials documentedthe wide individual variations in response to headgeartreatment,4,5 underscoring the importance of character-izing the sources of such differences that result fromseemingly similar treatments.5-9
Understanding the effects of headgear treatment inthe anteroposterior and vertical planes is derived pri-marily from the superimposition of serial lateral headradiographs. Stable anatomic landmarks10 are used forregistering a patient’s serial cephalographs to estimatethe skeletal and dental change during the time periodevaluated.11 Unfortunately, cephalometric superimposi-tions have several limitations. Because exposure to ion-izing radiation should be minimized, cephalographs aremade at relatively long intervals. The observed changesare divided by the number of years between headfilmsto yield an annualized measure of change2,4 that canobscure the true dynamic changes. Furthermore,anatomic landmarks are often difficult to identify reli-ably because of the overlap of left and right bilateralstructures of the head. Variable head positioning in thecephalostat between serial radiographs can affect thisoverlap, further complicating the superimposition offilms. Reliability of cephalometric superimposition is
This investigation was supported by the University of Washington OrthodonticAlumni Association. The patient records used in this study were obtained from2 NIH-funded studies (DE08715 and DE08722). Dr Ramsay received additionalsupport from NIH grant DE00379.aDepartment of Orthodontics, University of Washington.bDepartment of Biostatistics, University of Washington.cDepartment of Pediatric Dentistry, University of Washington.dDepartment of Orthodontics, University of Florida.eDepartment of Orthodontics, University of Pennsylvania.Reprint requests to: Dr Douglas S. Ramsay, Department of Orthodontics, Uni-versity of Washington, Box 357446, Seattle, WA 98195-7446; e-mail,[email protected], February 2001; revised and accepted, June 2001.Copyright © 2002 by the American Association of Orthodontists.0889-5406/2002/$35.00 + 0 8/1/120687doi:10.1067/mod.2002.120687
ORIGINAL ARTICLE
A 3-dimensional analysis of molar movementduring headgear treatment Jennifer L. Ashmore, DDS, MSD,a Brenda F. Kurland, MS, EdM,b Gregory J. King, DMD, DMSc,a
Timothy T. Wheeler, DMD, PhD,d Joseph Ghafari, DMD,e and Douglas S. Ramsay, DMD, PhD, MSDa,c
Seattle, Wash, Gainesville, Fla, and Philadelphia, Pa
Superimposition of serial cephalograms provides a limited description of tooth movement that could becomplemented by data obtained from serial dental casts. The aim of this study was to develop a mathematicalmethod for superimposing 3-dimensional data obtained from selected landmarks on longitudinally collecteddental casts to describe maxillary first molar movement during headgear treatment. The material consisted ofdental casts taken bimonthly from 36 children whose Class II Division 1 malocclusion was treated withstraight-pull headgear during a 24-month period. Control data were collected from initial and final models of38 subjects with a similar malocclusion who were not treated during a 24-month observation period. Spatialdata from each subject’s initial model were oriented similarly in an anatomically derived coordinate system,and a best-fit superimposition of palatal rugae landmarks from subsequent models allowed the measurementof molar movement. On average, headgear treatment resulted in distal movement of the molars, and the fittednet difference between treated and control subjects was 3.00 mm (SE, 0.37 mm; P < .001). Also, the headgearcaused significantly more molar extrusion (0.56 mm; SE, 0.20 mm; P < .006) and buccal expansion (0.58 mm;SE, 0.17 mm; P < .001) on average than in the control group. Poor reliability of the method for measuring molarrotations indicated that they could not be determined accurately. Longitudinal description of molar movementfor each subject revealed great individual variability in the amount and pattern of tooth movement. Severalreasons could account for the wide range of individual variation and warrant exploration. (Am J OrthodDentofacial Orthop 2002;121:18-30)

American Journal of Orthodontics and Dentofacial Orthopedics Ashmore et al 19Volume 121, Number 1
also compromised by the method’s susceptibility tounnoticed differences in stable reference structures.12
The treatment changes of interest are often small rela-tive to the error of the cephalometric method; thismakes their precise estimation difficult.13,14
An alternative approach to cephalometric analysis toassess dental movement is to measure changes in toothposition with serial maxillary models. Advantages ofthis approach include (1) 3-dimensional (3D) informa-tion is preserved in the model, (2) the impression mate-rial provides an accurate spatial reproduction of theoriginal structures of interest, (3) impressions can betaken at frequent intervals, and (4) precise measurementtechniques can be used to collect spatial data from themodels, including simple linear measuring devices (eg,digital calipers15) and more sophisticated devices capa-ble of measuring data in 3 dimensions (eg, reflex met-rograph,16,17 traveling microscope,18 and laser scan-ners19,20). Although little is known about the stability ofidentifiable landmarks on dental casts, palatal rugaehave been suggested as relatively stable structures forregistration of serial maxillary models.21 The shape ofthe palatal vault and the medial portions of the palatalrugae are rather stable throughout the development ofthe dentition.22 Palatal rugae retain their shape and pat-tern throughout a person’s lifetime;23 thus, they havebeen used for identification purposes in forensics.24
From age 5 to adulthood, the rugae increase in length anaverage of 2 mm.25
Several investigators have studied the potential use ofthe palatal rugae for the superimposition of serial mod-els.16,21,26 Almeida et al16 found that headgear treatmentcan alter the position of the lateral ends of the rugae. Bai-ley et al26 reported that orthodontic treatment involvingmaxillary premolar extraction resulted in greater spatialchange in some areas of the rugae when compared withthose of patients treated without extractions. Neverthe-less, the authors of both studies concluded that specificparts (eg, medial) of the palatal rugae may be sufficientlystable to serve as an anatomic reference for superimpos-ing serial maxillary models, despite intervening headgearor premolar extraction treatment.
The goal of this study was to describe dental move-ment of the maxillary first molars during headgear treat-ment. A retrospective study was conducted with a sam-ple of models taken bimonthly during phase I headgeartreatment and a control sample of models obtained fromuntreated Class II subjects. The specific aims were to(1) develop a mathematical approach for using homolo-gous structures on dental models to orient the initial(T1) models into a common frame of reference, andthen to superimpose a patient’s subsequent models onthe T1 model by registering unique anatomic landmarks
selected on the palatal rugae, (2) describe the bimonthlymolar movement for each patient during headgear treat-ment, and (3) compare the molar displacement duringheadgear treatment to that of an untreated controlgroup.
SUBJECTS AND METHODS
The records were obtained from 2 prospective, lon-gitudinal, randomized clinical trials (RCT) investigat-ing the treatment of children with Angle Class II Divi-sion 1 malocclusions. They included dental casts frompatients treated with headgear at the University of Penn-sylvania27 and from untreated control subjects at theUniversity of Florida.2 (The University of PennsylvaniaRCT did not include an untreated control sample of sub-jects.) All subjects were diagnosed with a Class II molarrelationship as part of the selection criteria for bothRCTs. The minimum criterion for inclusion at the Uni-versity of Pennsylvania was bilateral molar distoclu-sion, and those with a unilateral Class I molar relation-ship were excluded. In the control sample from theUniversity of Florida, the distoclusion was measured inone–fourth-cusp increments with a minimum require-ment of either a bilateral one–half-cusp or a unilateralfull-cusp Class II molar relationship. To better matchthe 2 samples, only the untreated control subjects withat least a three–fourths-cusp distoclusion were includedin the study. Complete details of these trials have beenreported previously.27,28
Data for treated subjects were obtained from thedental casts of 36 patients randomized to treatment withstraight-pull headgear for a 24-month phase 1 treatmentperiod. No other orthodontic treatment was performedbefore or during treatment. The inner bow for these sub-jects was adjusted at each visit to fit passively and toavoid constriction or major expansion of the intermolardistance. On average, each side received 14 to 16ounces of distalizing force and was measured every 4weeks. Subjects were instructed to wear the headgear14 hours a day starting with 10 hours a day the firstweek. Once neutrocclusion was achieved, the headgearwas worn at night only (approximately 10 hours a night)until the patient was ready for fixed appliances. Algi-nate impressions were taken once every 2 months dur-ing headgear treatment, and dental casts were mountedon an articulator.27
Data for the control subjects were collected fromdental casts of 38 patients randomized to an observa-tion-only condition. These subjects had no orthodontictreatment before or during the observation period. Theywere seen every 3 months for a clinical evaluation, andimpressions were taken at the start and end of a 24-month observation period.

20 Ashmore et al American Journal of Orthodontics and Dentofacial OrthopedicsJanuary 2002
Spatial data from maxillary casts were collectedwith a desktop mechanical 3D digitizer (Microscribe3DX, Immersion Corporation, San Jose, Calif), whichcollects 3D data through a stylus tip connected to amechanical arm that allows a full range of movements.Data were recorded by pressing a foot pedal when thestylus tip was positioned on the point being captured.The digitizer connects to the computer via a serial port.The data were stored in the computer by using special-ized software. A LabVIEW software program(National Instruments, Austin, Tex) read the serial portcommunications from the digitizer and computed theX, Y, and Z coordinate locations of the stylus tip. Inconjunction with the foot pedal control, each entry wasadded to a data file by means of a specialized userinterface, which facilitated annotation of the capturedpoints.
Procedures
The following procedures were used by 1 investiga-tor (J.L.A.) for each subject’s series of maxillary models(2 models per control subject and approximately 12 pertreatment subject). The T1 model was examined forunique anatomic details in the palatal rugae configura-tion. A minimum of 8 points (4 on the left side and 4 onthe right) was identified that were present on all modelsin the series. Points were chosen for specificity of detailand reproducibility throughout the series of models. Thepoints were marked with a 0.3-mm graphite pencil, 1point at a time. An analogous procedure was repeated toidentify 4 unique anatomical points on each of the firstmaxillary molars. Additionally, the initial maxillary andmandibular models were occluded to identify and markpoints of posterior dental contact to be digitized to pro-vide an estimate of the occlusal plane. Each maxillarycast was then fixed to the flat desktop work surface withfixturing putty (Tac’N Stick, Taylor, Mich), and the fol-lowing points were digitized:
MR1: a single point where the median raphe meetsthe base of the incisive papillae.
MR2-16: 10 to 15 points captured as the stylus tipwas traced along the median raphe.
RR1-4: a minimum of 4 unique anatomic rugaepoints on the right side of the palate.
LR1-4: a minimum of 4 unique anatomic rugaepoints on the left side of the palate.
RM 1-4: 4 unique anatomic points on the right firstpermanent molar.
LM 1-4: 4 unique anatomic points on the left firstpermanent molar.
OP1-3: 3 points of posterior occlusal contact withthe mandibular teeth (2 on one side and 1 on the other)used to estimate the occlusal plane.
Lateral cephalometric radiographs were taken of allsubjects before treatment or observation. Digitally scannedinitial radiographs for the control subjects were measuredwith the program NIH Image version 1.61 (developed atthe U.S. National Institutes of Health and available on theInternet at http://rsb.info.nih.gov/nih-image). Values forSNA, SNB, and SNOP (ie, sella-nasion to occlusal plane)were recorded. These cephalometric values had alreadybeen measured at the University of Pennsylvania as part ofprior studies on these headgear patients.
Baseline data analysis
Because subjects were not randomly assigned froma common pool to be in either the headgear or the con-trol group, the present study is considered a retrospec-tive analysis of existing orthodontic records. Eachgroup was drawn from a different RCT that took placeat different locations and used different inclusion andexclusion criteria. For this reason and to evaluate thesimilarity of the groups, baseline characteristics for theheadgear and the observation groups were comparedwith t tests and a 2-sample test for equality of propor-tions with continuity correction.
Orientation and superimposition of maxillary casts
The 3D data from all subjects were oriented in acommon and interpretable spatial coordinate system toassess molar movement. Each subject’s T1 model datawere oriented in a uniform coordinate system based onanatomic structures that are homologous to all subjects:the point where the base of the incisive papilla and themedian raphe meet (MR1), the median raphe, and theposterior occlusal plane. These structures were orientedwith rigid transformations (translations and rotations)that maintained the spatial relationship between all dig-itized points on each T1 model.
The initial step in this orientation process was toestablish a plane through the median raphe points with aprincipal-components analysis. The first 2 principal com-ponents identify the plane that best fits the median raphedata points. The third principal component is a normalvector to the plane and determines the equation for theplane. Next, the data points were rotated to orient the fit-ted median raphe plane into the X-Z plane. Subsequently,the line created by the intersection of the posteriorocclusal plane and the X-Z plane was used to rotate themodel points so that this line was parallel to the X-axis.A translation then established the constructed MR1 point(the point in the fitted X-Z plane closest to the digitizedMR1 point) as the origin (0,0,0) of the coordinate system.These rotations and translations were computed so that,in the final orientation, the median raphe points were inthe quadrant with negative X and positive Z values.
American Journal of Orthodontics and Dentofacial Orthopedics Ashmore et al 21Volume 121, Number 1
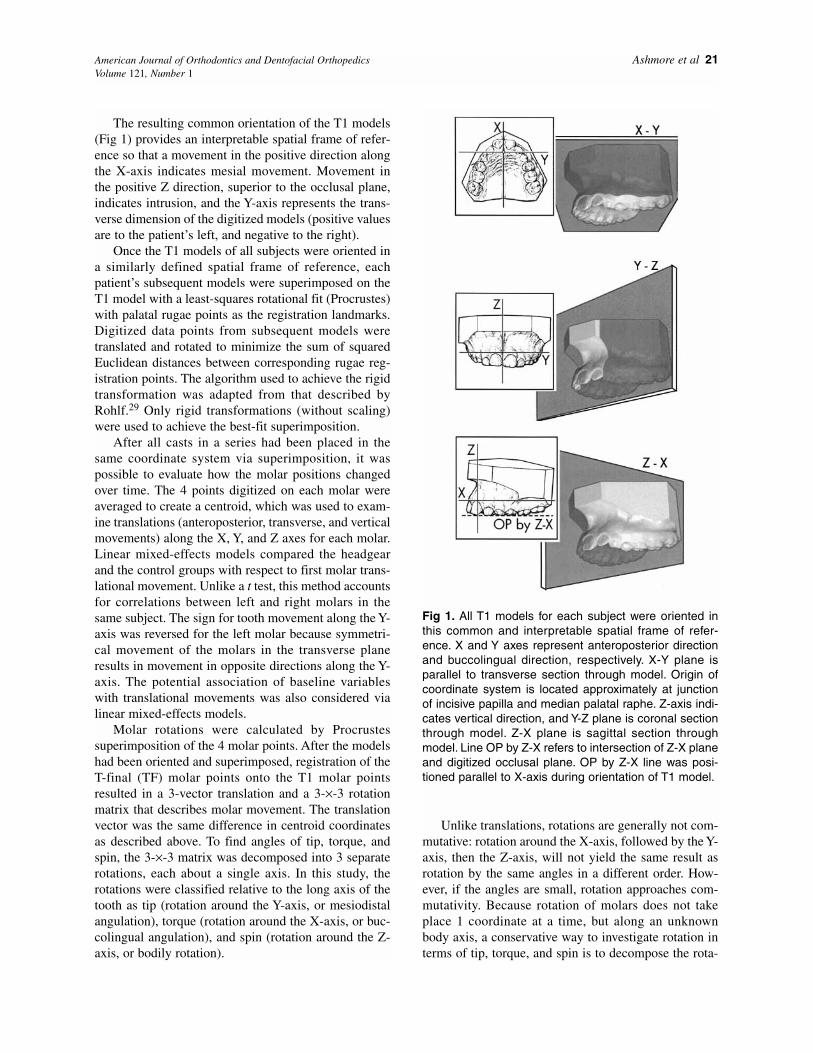
The resulting common orientation of the T1 models(Fig 1) provides an interpretable spatial frame of refer-ence so that a movement in the positive direction alongthe X-axis indicates mesial movement. Movement inthe positive Z direction, superior to the occlusal plane,indicates intrusion, and the Y-axis represents the trans-verse dimension of the digitized models (positive valuesare to the patient’s left, and negative to the right).
Once the T1 models of all subjects were oriented ina similarly defined spatial frame of reference, eachpatient’s subsequent models were superimposed on theT1 model with a least-squares rotational fit (Procrustes)with palatal rugae points as the registration landmarks.Digitized data points from subsequent models weretranslated and rotated to minimize the sum of squaredEuclidean distances between corresponding rugae reg-istration points. The algorithm used to achieve the rigidtransformation was adapted from that described byRohlf.29 Only rigid transformations (without scaling)were used to achieve the best-fit superimposition.
After all casts in a series had been placed in thesame coordinate system via superimposition, it waspossible to evaluate how the molar positions changedover time. The 4 points digitized on each molar wereaveraged to create a centroid, which was used to exam-ine translations (anteroposterior, transverse, and verticalmovements) along the X, Y, and Z axes for each molar.Linear mixed-effects models compared the headgearand the control groups with respect to first molar trans-lational movement. Unlike a t test, this method accountsfor correlations between left and right molars in thesame subject. The sign for tooth movement along the Y-axis was reversed for the left molar because symmetri-cal movement of the molars in the transverse planeresults in movement in opposite directions along the Y-axis. The potential association of baseline variableswith translational movements was also considered vialinear mixed-effects models.
Molar rotations were calculated by Procrustessuperimposition of the 4 molar points. After the modelshad been oriented and superimposed, registration of theT-final (TF) molar points onto the T1 molar pointsresulted in a 3-vector translation and a 3-×-3 rotationmatrix that describes molar movement. The translationvector was the same difference in centroid coordinatesas described above. To find angles of tip, torque, andspin, the 3-×-3 matrix was decomposed into 3 separaterotations, each about a single axis. In this study, therotations were classified relative to the long axis of thetooth as tip (rotation around the Y-axis, or mesiodistalangulation), torque (rotation around the X-axis, or buc-colingual angulation), and spin (rotation around the Z-axis, or bodily rotation).
Unlike translations, rotations are generally not com-mutative: rotation around the X-axis, followed by the Y-axis, then the Z-axis, will not yield the same result asrotation by the same angles in a different order. How-ever, if the angles are small, rotation approaches com-mutativity. Because rotation of molars does not takeplace 1 coordinate at a time, but along an unknownbody axis, a conservative way to investigate rotation interms of tip, torque, and spin is to decompose the rota-
Fig 1. All T1 models for each subject were oriented inthis common and interpretable spatial frame of refer-ence. X and Y axes represent anteroposterior directionand buccolingual direction, respectively. X-Y plane isparallel to transverse section through model. Origin ofcoordinate system is located approximately at junctionof incisive papilla and median palatal raphe. Z-axis indi-cates vertical direction, and Y-Z plane is coronal sectionthrough model. Z-X plane is sagittal section throughmodel. Line OP by Z-X refers to intersection of Z-X planeand digitized occlusal plane. OP by Z-X line was posi-tioned parallel to X-axis during orientation of T1 model.

22 Ashmore et al American Journal of Orthodontics and Dentofacial OrthopedicsJanuary 2002
tion matrix as if rotations occurred in sequence (XYZ,XZY, YXZ, YZX, ZXY, and ZYX). Each of the 6 order-ings is the result of multiplying 3 rotation matrices, 1about each coordinate axis. The terms of the orderedrotation matrix were equated to terms of the 3-×-3 rota-tion matrix computed by Procrustes superimposition,with a simple algorithm.30 If the 6 sets of angles com-puted are similar, they should accurately describe tip,torque, and spin.
Error of the method
The landmarks identified in pencil on the initial andfinal models from 26 subjects (14 in the control groupand 12 in the headgear group) were digitized a secondtime for reliability. Preliminary studies with sets ofduplicated casts permitted the determination of the vari-ability associated with identifying the same rugae pointthroughout a series of casts, with (SD = 0.25 mm) andwithout (SD = 0.56 mm) a pencil mark placed on therugae point. By using repeated measurements of thesame cast, it was possible to calculate molar translationsand rotations and thus assess the reliability of the datacollection and superimposition methods. The spatialdata from the second measurement were superimposedon the initial model measurements in the same way asdescribed for performing serial model analysis to makethese calculations. Because the same model was mea-sured twice, any measured movement of the molarcould only result from method error.
Stability of palatal rugae points
The Procrustes superimposition used in the rotationstep above assumes that the palatal rugae are stablelandmarks. This assumption was evaluated by deter-mining whether the measured rugae points changedshape over time. A method of shape comparison that isinvariant to changes in translation, rotation, reflection,and scaling is Euclidean distance matrix analysis,31,32
which describes shape (and form, which is shape for afixed scale) as the matrix of Euclidean distances
between landmarks (rugae points). Comparison of theform of 2 sets of landmarks (such as the digitized rugaepoints on 2 dental models) is achieved by taking theratio of each element of the matrix of distances. Theform distance matrix of ratios is summarized by thesquare root of the sum of squared natural logs of eachelement of the matrix.33 The form distance matrixdivided by the number of distances compared is referredto as the form dissimilarity index. For each pair of dis-tances, the form distance matrix entry is 1 if the dis-tances in the 2 forms are the same. Thus, the form dissimilarity index is zero if the models are identical,and values increase for greater form differencesbetween sets of rugae. Form dissimilarity indexes forrugae in the treatment and the control groups were com-pared by a t test.
Another evaluation of rugae stability assessedwhether form differences increased over time in thetreatment group. Form change was described as lack offit after superimposition and was measured as lack of fitof the average Euclidean distance between superim-posed rugae for the T1 model and a subsequent model.This method overestimates form change because it doesnot control for measurement error. The lack of fit ofrugae between T1 and T2 models (taken approximately2 months apart) was compared with the lack of fitbetween the T1 and TF models (taken approximately 2years apart). This statistical comparison (paired t test)could be made only for the treatment group, because nomodels were taken between the T1 and the TF modelsfor the control group.
RESULTSSample description
Demographic and cephalometric characteristics ofthe sample are presented in Table I. The control and thetreated groups were not statistically different withrespect to age, treatment/observation time, or SNBangle. The control group had a significantly larger pro-portion of male subjects (76%) than did the headgear
Table I. Descriptive statistics at baseline for headgear and control groups
Variable Headgear group (Univ of Penn) Control group (Univ of Florida) Statistic (P value)
Sample size (N) 36 38Gender (male, female) 17, 19 29, 9 χ2 = 5.47*, P < .05Age (yr) mean (SD, range) 9.65 (1.42, 7.2-13.3) 9.63 (0.87, 8.18-12.56) t = 0.07, P > .05Treatment/observation (mo) mean (SD, range) 23.49 (2.27, 18-28) 24.51 (1.55, 20-30) t = 1.15, P > .05SNA (°) mean (SD, range) 82.07 (3.02, 76.41-88.63) 80.65 (2.97, 75.56-87.7) t = –2.03, P < .05SNB (°) mean (SD, range) 74.51 (2.90, 67.29-81.4) 75.05 (2.86, 67.76-80.45) t = 0.82, P > .05ANB (°) mean (SD, range) 7.57 (2.02, 36, 4.46-11.68) 5.60 (2.15, 2.5-10.16) t = –4.05, P < .001SNOP (°) mean (SD, range) 16.87 (4.1, 5.85-25.03) 20.41 (3.17, 14.05-28.37) t = 4.16, P < .001
*2-sample test for equality of proportions, with continuity correction.

American Journal of Orthodontics and Dentofacial Orthopedics Ashmore et al 23Volume 121, Number 1
treatment group (47%). On average, the control grouphad a larger SNOP angle and smaller SNA and ANBangles than did the headgear group. These characteris-tics (gender, SNA, ANB, and SNOP) were consideredas potential confounding variables in analyzing groupdifferences.
Error of the method
Any measured maxillary molar movement obtainedfrom data collected from the same model on 2 occasionscould only result from method error. The average trans-lation of the centroid of the 4 molar points between therepeated measurements (Table II) was close to 0 mm,and the standard deviation (0.28-0.41 mm) was onlyslightly greater than the reported measurement error ofthe Microscribe 3DX (0.25 mm). In paired and 2-sample t tests, the translations were not significantlydifferent from zero, and group differences in degree ofmeasurement error were not detected.
The reliability of the method for computing rotationof maxillary molars was poor. Computed rotations forthe repeated digitization of the T1 and the TF modelsare shown in Table III. The average rotation rangedfrom –2.48° to 1.31°. Although the true rotation of 0° iscertainly within a 95% confidence interval for the meanrotation, the large standard deviations for rotations (7°-11°) indicate an unacceptably large measurement error.
Measurement error in digitization may have a largerrole in reliability of rotations (which rely on the posi-tions of the 4 molar points separately) than for transla-tions (computed with the measured centroid). The 4measured molar points show only small variability in Z-axis coordinates; therefore, small errors in measurementmay have a large impact on calculated rotations. Forexample, adding small changes to the Z-axis coordi-nates of molars caused aberrant (large, inconsistentbetween orderings) measured rotations appear sensible.Conversely, adding small changes to the Z-axis coordi-nates made seemingly reasonable measured rotationsbecome aberrant. Most calculated rotations were smalland consistent between the 6 orderings. However,because of this lack of robustness in measuring rota-tions, neither descriptions of average rotation from T1to TF nor analysis of group differences in rotation ispresented.
Translation
The average translational movement of the molars inthe headgear group was significantly larger (P < .001)in the anteroposterior direction than that observed forthe control group. A mean distal movement of 2.20 mmfor the headgear group and a mean mesial movement of0.76 mm for the observation group were seen, for an
overall mean difference of 2.96 mm. With linear mixed-effects regression to model distal movement for the 2groups, the fitted mean difference was 3.00 mm (TableIV). The fitted mean differences between the groups inthe transverse direction (0.58 mm) and the verticaldirection (0.56 mm) were also statistically significant(Table IV). Main effects of demographic and cephalo-metric characteristics were considered through linearmixed-effects models, as well as interactions of thesevariables with the treatment group effect. None was sta-tistically significant. Inclusion of ANB somewhat miti-gated the treatment group difference, but the group dif-ference remained statistically significant. A sensitivityanalysis that involved removing influential data pointsalso did not greatly affect the estimated group differ-ences or their statistical significance.
Frequently taken serial models provided a descrip-tive analysis of the molar movement that occurred dur-ing headgear treatment for each patient. Each headgearsubject’s translational molar movements in themesiodistal, vertical, and transverse directions are dis-played in Figs 2, 3, and 4, respectively. Large individualdifferences in molar movement are apparent; whilesome subjects experienced significant distal molarmovement throughout treatment (eg, P111, P123), oth-ers had little or no tooth movement (eg, P105, P119).Interestingly, some patients had a change in direction inmesiodistal tooth movement midway through treatment(eg, P113, P132).
Stability of palatal rugae points
The average percentage of form dissimilaritybetween rugae at T1 and TF was 1.18% (SD, 0.98;range, 0.28-6.76) for the control group and 2.29% (SD,0.85; range, 0.92-4.14) for the headgear group. In otherwords, on average, each Euclidean distance betweenlandmarks at TF was about 1% different from that at T1for the control group and 2% different for the treatmentgroup. Translating the form dissimilarity index into mil-limeters is not possible, because the form dissimilarity
Table II. Method error for measuring translation of thecalculated molar centroid
Standard Direction of translation (axis) Mean (mm) deviation Range
X (anteroposterior) 0.03 0.41 –1.78-1.70Y (transverse) –0.02 0.28 –1.22-0.88Z (vertical) –0.05 0.28 –0.66-0.97
Models from 26 (12 headgear, 14 control) subjects were measuredtwice to determine method error. Right and left molars were measuredfor T1 and TF models. Five molars were not included in analysisbecause of missing data.

24 Ashmore et al American Journal of Orthodontics and Dentofacial OrthopedicsJanuary 2002
matrix is composed of ratios. A t test showed a statisti-cally significant group difference (t = 7.54; P < .001),indicating group differences in form change in rugaeover the duration of the study.
To determine if the form difference was greater forcomparisons over a longer time, we examined T1 to T2and T1 to TF form differences for the treatment group.The average Euclidean distance between correspondingrugae points for T1 compared with T2 was 0.31 mm(SD, 0.12; range, 0.16-0.81), and the average distancefor T1 compared with TF was 0.72 mm (SD, 0.24;range, 0.29-1.14). The T1 to TF average distance wassignificantly higher than the T1 to T2 average distance(mean difference, 0.42 mm; SD, 0.22; range, -0.05-0.86; paired t = -11.43; P < .001). Although we couldnot calculate change in form differences over time forthe control group, the average Euclidean distancebetween corresponding rugae points from T1 to TF was0.44 mm, verifying differences in rugae form changebetween groups over a 24-month period. Whether theseform changes were large enough to alter the interpreta-tion of molar movement was unclear.
DISCUSSION
Based on the translational movement of the centroidof the digitized molar points, a maxillary molar movedan average of 2.20 mm distally in the headgear group.This posterior movement was significantly differentfrom the average 0.76 mm of mesial molar movement
observed in the control group during the 24-monthperiod. The fitted mean difference (3.00 mm) in molarmovement during treatment is comparable with previ-ous cephalometric research. Ucem and Yuksel34 re-ported 1 of the largest amounts of distal molar move-ment, an average of 3.6 to 4 mm, for patients instructedto wear a combination headgear for 20 hours a day. A more modest amount of distal movement (0.75 mm ayear) was reported by Keeling et al2 in patientsinstructed to wear both a headgear and a biteplane for14 hours each day during a 24-month treatment period.The mesial molar movement in the control group alsowas comparable with that reported in previous studiesof persons with untreated Class II malocclusions.2,11 Onaverage, headgear treatment caused significantly moremolar extrusion (0.56 mm) and buccal expansion (0.58mm) than was observed in the untreated control group(Table IV). These effects were small, reflecting achieve-ment of the clinical objective of the straight-pull head-gear treatment, which was to deliver a distalizing forceto the molars while minimizing vertical changes inmolar position. The lack of further increase in trans-verse movement was related to the fact that the innerbow was not overly expanded to maintain a consistentprotocol of adjustment across patients.27
An important contribution of this study is the devel-opment of a serial maxillary model superimpositionmethod that permitted a detailed examination of howeach person’s molars moved during headgear treatment
Table IV. Translation (mm) of calculated molar centroid for headgear treatment group (n = 36) and control group (n = 38)
Headgear group Control group Fitted group difference* Adjusted t statistic*,Direction of translation (axis) Mean (SD, range) Mean (SD, range) Mean (SE) df=72
X (negative is distal) –2.20 (2.22, –8.58-1.29) 0.76 (0.92, –1.33-2.79) 3.00 (0.37) 8.13 (P < .001)Y (negative is buccal) –0.90 (1.25, –4.57-2.36) –0.31 (0.66, –2.14-1.99) 0.58 (0.17) 3.50 (P < .001)Z (negative is occlusal) –1.40 (1.19, –4.53-2.12) –0.86 (0.94, –3.10-2.28) 0.56 (0.20) 2.83 (P < .006)
*Linear mixed-effects model with random intercept to account for repeated measures (left and right molars).
Table III. Method error for measuring molar rotation (in degrees)
Torque Tip SpinAngle of rotation around X-axis, Angle of rotation around Y-axis, Angle of rotation around Z-axis,
Order of rotation Mean (SD, range) Mean (SD, range) Mean (SD, range)
XYZ –2.48 (8.02, –40.52-14.55) 1.13 (6.83, –25.32-35.10) –1.83 (9.94, –89.16-3.93)XZY –1.55 (10.83, –39.10-73.80) 0.15 (11.06, –85.96-35.11) –0.12 (9.11, –31.53-78.25)YXZ 1.27 (–8.07, –18.96-38.94) –1.42 (7.06, –35.11-26.05) –1.31 (9.71, –86.67-6.67)YZX 0.43 (11.08, –74.49-39.13) –2.12 (10.97, –86.13-26.71) 0.34 (8.94, –29.18-77.73)ZXY –2.39 (7.68, –38.90-10.44) 1.04 (7.27, –27.16-35.12) –1.82 (9.72, –86.68-3.93)ZYX 1.31 (8.17, –18.97-40.50) –1.10 (6.98, –35.11-26.68) –1.35 (9.92, –89.16-6.15)
Models from 26 (12 headgear, 14 control) subjects were measured twice to determine method error. Right and left molars were measured for T1and TF models. Five molars were not included in analysis because of missing data.

American Journal of Orthodontics and Dentofacial Orthopedics Ashmore et al 25Volume 121, Number 1
(Figs 2-5). Accordingly, the method revealed substantialbetween-subject variation not only in the magnitude oftooth movement, but also in the pattern of movementover time. Explaining the origin of the individual dif-ferences that result from a uniform treatment modalityhas been recognized as a major goal in orthodontictreatment research.4,6,9
The strategy Baumrind7 recommends to investigateindividual variation has 2 major components. The firstis that the dependent variable should be measured fre-quently and precisely. The results of the present studydemonstrate that models can be taken often duringorthodontic treatment and that the serial model-super-imposition methodology is sufficiently precise to pro-vide a detailed description of individual differences inmolar translational movement during headgear treat-
ment (Figs 2-5). The second component is that addi-tional measures should be taken during treatment thatmay account for the individual variations in outcome.This task is difficult because it requires knowledge ofthe critical sources of variability that result from head-gear treatment.9 No clear agreement exists amongorthodontists about specifics of headgear use, such asideal force levels and amount of time to wear the appli-ance or the dental and skeletal consequences of varyingthese parameters. The variation displayed in Figure 2would support testing the hypothesis that subjects whohad considerable distal molar movement might haveworn the headgear for more hours each day or had moreforce exerted on the molars when compared with sub-jects who displayed little tooth movement. Recentwork35,36 in the development of sophisticated micro-
Fig 2. X-axis translational movement of calculated centroid for each maxillary molar over time rep-resents movement in mesiodistal direction. Decreasing values indicate distalization.

26 Ashmore et al American Journal of Orthodontics and Dentofacial OrthopedicsJanuary 2002
electronic devices to measure characteristics of head-gear use (eg, amount of force, circadian timing of force,duration of force) or the development of biological indi-cators of periodontal response to treatment may provideinsight into the etiology of individual variation. Thedevelopment of new methods such as those described inthis study may help determine the dose-effect relation-ship between headgear wear and therapeutic effect.36 Ofcourse, for a more complete assessment of treatmentoutcome, information gathered from other records,including cephalometric data, must be considered toappraise the contribution of skeletal growth on treat-ment of distoclusion.
To track 3D tooth movement from serial models,investigators have relied on the physical superimposi-tion of palatal rugae using impression materials (eg,
acrylic or elastomeric material) to construct a templateof the rugae that would be transferred over serial mod-els.37,38 However, any inconsistencies in the dental castcould reduce the stability of the template and thus theaccuracy of the superimposition. Also, changes in therugae16,26 may require the fabrication of another tem-plate that would better fit in a given sequence of themodel series. With the mathematical approach intro-duced in this study, the best fit of the digitized rugaepoints can be determined despite minor variations in thespatial configuration of the rugae caused by measure-ment error, growth, or treatment effects.16,26 The math-ematical approach can also help quantify the accuracyof the superimposition of the rugae points.
We used a best fit of rugae to register a series of lon-gitudinal casts, similar to the way a best anatomic fit of
Fig 3. Y-axis translational movement of calculated centroid for each maxillary molar over time repre-sents movement in buccolingual direction. Sign for left molar values was reversed; therefore,decreasing values indicate movement in buccal direction.

American Journal of Orthodontics and Dentofacial Orthopedics Ashmore et al 27Volume 121, Number 1
anterior cranial base structures is used to superimposeserial cephalometric headfilms. After cephalometricsuperimposition, spatial changes in orofacial structuresare usually described in relation to a coordinate systemderived from homologous structures across individuals(eg, pretreatment Frankfort horizontal). In this study,a standardized coordinate system was defined for allsubjects, using homologous structures (median raphe,incisive papillae, and pretreatment occlusal plane)apparent on each subject’s T1 model. If a coordinatesystem is established on references selected arbitrarilywithin the cranial base, the palatal rugae, or the physi-cal templates over the rugae, the variation inherent tothe method of orientation can mask, and induce errorsof interpretation of, the examined changes. Given thetechnological advances in scanning dental casts and theemerging trends to use 3D scanning to store models as
well as diagnostic and therapeutic modalities,39 thepresent mathematical approach should serve as a modelfor orientation, superimposition, and evaluation of ser-ial casts.
In support of previous research,16,21,26 the presentstudy found statistically detectable changes in thepalatal rugae configuration for subjects in both theheadgear and the untreated control groups. Euclideandistance matrix analysis indicated that the distancebetween measured rugae points changed only an aver-age of 2% over the 2-year treatment period in the head-gear group. It is unlikely that this change in form islarge enough to affect the measured treatment result;however, it should be considered in evaluating theresults of studies that use this approach. In futureresearch, investigators may want to consider using aweighted Procrustes superimposition method so that
Fig 4. Z-axis translational movement of calculated centroid for each maxillary molar over time repre-sents movement in vertical direction. Decreasing values indicate extrusion.

28 Ashmore et al American Journal of Orthodontics and Dentofacial OrthopedicsJanuary 2002
greater statistical emphasis can be placed on rugaepoints known to be the least susceptible to treatment-induced changes (eg, medial aspects) and less emphasisplaced on the areas of the rugae configuration known tochange more with treatment (eg, lateral and anterioraspects).
Tracking the movement of a single point (centroid)on the occlusal surface of the molar simply indicates thedirection of movement of the tooth, not the type ofmovement (translation or rotation). The ability to eval-uate how headgear treatment may change torque, tip,and spin of the maxillary first molars is important froma clinical point of view and should be the object of afuture evaluation. The method proposed to calculaterotations computes a rotation matrix by superimposing4 landmark points per molar. This is a small number ofpoints, and the distance between points is small, espe-cially in the Z (vertical) dimension, because the digi-tized points on the molar were selected based on uniquedetails in the occlusal anatomy. It is not possible toincrease the distance between these points in the verti-cal dimension beyond what the anatomy of the toothallows. Given the close spatial proximity of the 4 molarpoints, minor measurement errors could have a largeimpact on the calculated rotations. Translations are lesssensitive to measurement error because they are com-puted with the measured centroid that is the average ineach coordinate axis for all 4 molar points. Possibleways to improve the ability to measure molar rotationinclude (1) using more precise methods to measuremolar points, (2) collecting more molar points, (3)spreading the molar points over a larger area, (4) deter-mining the axial inclination of the molar by creating aperpendicular to the tooth’s occlusal table, and (5) pos-sibly, although with inherent limitations, using a rigidphysical template to extend the surface area of themolars for digitization of points over a broader range inall 3 planes of space.
The present investigation has the limitations com-mon to most retrospective research designs. Thepatients were recruited at different sites to participate indifferent studies, and the subject inclusion/exclusioncriteria were not identical. For example, the RCT at theUniversity of Pennsylvania required a minimum ANBangle of 4.5°, a criterion not required in the FloridaRCT. The 2 groups differed significantly in the averageANB angle. To evaluate the potential influence of thesepossible confounders, we analyzed known demographicand pretreatment factors and determined that none ofthe initial differences between the 2 groups changed thesignificance of the results. Subtle unintended differ-ences between groups can influence the findings of ret-rospective studies in many ways. Nevertheless, the
opportunity to examine a set of frequently taken serialmodels during a well-controlled study of headgeartreatment and the availability of a well-defined sampleof untreated Class II subjects made it possible todescribe molar movement during headgear treatmentmore thoroughly than has been done previously.
CONCLUSIONS
When compared with an untreated control group,headgear treatment resulted in distal movement of themaxillary first molars. The method developed for super-imposing digital configurations of serial dental modelsallowed accurate measurement of maxillary first-molartranslational movement in 3 dimensions for both head-gear and untreated groups; this may have broad appli-cation in orthodontics. Wide individual differences inmolar movement were observed in response to a com-mon headgear treatment regimen. The sources of varia-tion require extensive investigation.
The authors would like to thank Mr Chris Prall forhis valuable contributions to this study.
REFERENCES
1. O’Connor BM. Contemporary trends in orthodontic practice:a national survey. Am J Orthod Dentofacial Orthop 1993;103:163-70.
2. Keeling SD, Wheeler TT, King GJ, Garvan CW, Cohen DA,Cabassa S, et al. Anteroposterior skeletal and dental changes afterearly Class II treatment with bionators and headgear. Am JOrthod Dentofacial Orthop 1998;113:40-50.
3. Tulloch JF, Phillips C, Koch G, Proffit WR. The effect of earlyintervention on skeletal pattern in Class II malocclusion: a ran-domized clinical trial. Am J Orthod Dentofacial Orthop1997;111:391-400.
4. Ghafari J, King GJ, Tulloch JF. Early treatment of Class II, divi-sion 1 malocclusion: comparison of alternative treatment modal-ities. Clin Orthod Res 1998;1:107-17.
5. Baumrind S. Some comments on clinical studies in orthodonticsand their applications to orthodontic treatment. Semin Orthod1999;5:96-109.
6. Baumrind S. The decision to extract: preliminary findings from aprospective clinical trial. In: Trotman CA, McNamara JA Jr, edi-tors. Orthodontic treatment: outcome and effectiveness, Volume30. Craniofacial Growth Series. Ann Arbor: Center for HumanGrowth and Development; University of Michigan; 1995. p. 43-80.
7. Baumrind S. Clinical studies in orthodontics: an overview ofNIDR-sponsored clinical orthodontic studies in the US. ClinOrthod Res 1998;1:80-7.
8. Ghafari JG. Emerging paradigms in orthodontics—an essay. AmJ Orthod Dentofacial Orthop 1997;111:573-80.
9. Tulloch JF, Proffit WR, Phillips C. Influences on the outcome ofearly treatment for Class II malocclusion. Am J Orthod Dentofa-cial Orthop 1997;111:533-42.
10. Bjork A. The use of metallic implants in the study of facialgrowth in children: method and application. Am J Phys Anthro-pol 1968;29:243-54.
11. Johnston LE. A comparative analysis of Class II treatments. In:

American Journal of Orthodontics and Dentofacial Orthopedics Ashmore et al 29Volume 121, Number 1
Vig PS, Ribbens KA, editors. Science and clinical judgment inorthodontics, Volume 19. Craniofacial Growth Series. Ann Arbor:Center for Human Growth and Development; University ofMichigan; 1986. p. 103-48.
12. Ghafari J, Baumrind S, Efstratiadis SS. Misinterpreting growthand treatment outcome from serial cephalographs. Clin OrthodRes 1998;1:102-6.
13. Jones ML. A comparison of orthodontic treatment changes asmeasured from study casts and cephalometric radiographs. Br JOrthod 1991;18:99-103.
14. Richmond S. Recording the dental cast in three dimensions. AmJ Orthod Dentofacial Orthop 1987;92:199-206.
15. Kirjavainen M, Kirjavainen T, Haavikko K. Changes in dentalarch dimensions by use of an orthopedic cervical headgear inClass II correction. Am J Orthod Dentofacial Orthop 1997;111:59-66.
16. Almeida MA, Phillips C, Kula K, Tulloch C. Stability of thepalatal rugae as landmarks for analysis of dental casts. AngleOrthod 1995;65:43-8.
17. Takada K, Lowe AA, DeCou R. Operational performance of theReflex Metrograph and its applicability to the three-dimensionalanalysis of dental casts. Am J Orthod 1983;83:195-9.
18. Bhatia SN, Harrison VE. Operational performance of the travel-ling microscope in the measurement of dental casts. Br J Orthod1987;14:147-53.
19. Alcaniz M, Grau V, Monserrat C, Juan C, Albalat S. A system forthe simulation and planning of orthodontic treatment using a lowcost 3D laser scanner for dental anatomy capturing. Stud HealthTechnol Inform 1999;62:8-14.
20. Okumura H, Chen LH, Tsutsumi S, Oka M. Three-dimensionalvirtual imaging of facial skeleton and dental morphologic condi-tion for treatment planning in orthognathic surgery. Am J OrthodDentofacial Orthop 1999;116:126-31.
21. van der Linden FP. Changes in the position of posterior teeth inrelation to ruga points. Am J Orthod 1978;74:142-61.
22. Lebret L. Growth changes of the palate. J Dent Res 1962;41:1391-404.
23. Peavy DC Jr, Kendrick GS. The effects of tooth movement on thepalatine rugae. J Prosthet Dent 1967;18:536-42.
24. English WR, Robison SF, Summitt JB, Oesterle LJ, Brannon RB,Morlang WM. Individuality of human palatal rugae. J ForensicSci 1988;33:718-26.
25. Lysell L. Plicae palatinae transversae and papilla incisiva in man:a morphologic and genetic study. Acta Odont Scand 1955;13(supp 18):5-137.
26. Bailey LT, Esmailnejad A, Almeida MA. Stability of the palatalrugae as landmarks for analysis of dental casts in extraction andnonextraction cases. Angle Orthod 1996;66:73-8.
27. Ghafari J, Shofer FS, Jacobsson-Hunt U, Markowitz DL, LasterLL. Headgear versus function regulator in the early treatment ofClass II, division 1 malocclusion: a randomized clinical trial. AmJ Orthod Dentofacial Orthop 1998;113:51-61.
28. Keeling SD, King GJ, Wheeler TT, McGorray S. Timing of ClassII treatment: rationale, methods and early results of an ongoingrandomized clinical trial. In: Trotman CA, McNamara JA Jr, edi-tors. Orthodontic treatment: outcome and effectiveness. Volume30. Craniofacial Growth Series. Ann Arbor: Center for HumanGrowth and Development; University of Michigan; 1995. p. 81-112.
29. Rohlf FJ. Rotational fit (Procrustes) methods. In: Rohlf FJ, Book-stein F, editors. Proceedings of the Michigan morphometricsworkshop. Ann Arbor: University of Michigan Museum of Zool-ogy; 1990. p. 227-36.
30. Eberly DH. 3D game engine design: a practical approach to real-time computer graphics. San Francisco: Morgan Kaufmann Pub-lishers; 2000.
31. Lele S. Some comments on coordinate-free and scale-invariantmethods in morphometrics. Am J Phys Anthropol 1991;85:407-17.
32. Lele S, Richtsmeier JT. Euclidean distance matrix analysis: acoordinate-free approach for comparing biological shapes usinglandmark data. Am J Phys Anthropol 1991;86:415-27.
33. Richtsmeier JT, Cole TM III, Krovitz G, Valeri CJ, Lele S. Pre-operative morphology and development in sagittal synostosis. J Craniofac Genet Dev Biol 1998;18:64-78.
34. Ucem TT, Yuksel S. Effects of different vectors of forces appliedby combined headgear. Am J Orthod Dentofacial Orthop1998;113:316-23.
35. Lyons EK, Ramsay DS. A self-regulation model of patient com-pliance in orthodontics: implications for the design of a headgearmonitor. Semin Orthod 2000;6:224-30.
36. Ramsay DS, Soma M, Sarason IG. Enhancing patient adherence:the role of technology and its application to orthodontics. In:McNamara JA Jr, Trotman CA, editors. Creating the compliantpatient, Volume 33. Craniofacial Growth Series. Ann Arbor: Cen-ter for Human Growth and Development; University of Michi-gan; 1997. p. 141-65.
37. Bar-Zion Y, Ferrer D, Johnson PD, Gibbs CH, Taylor M, McGor-ray SP, et al. New method to reproducibly examine and quantifyspatial orientation of teeth with relation to a fixed structure onorthodontic study models. J Dent Res 1998;77:253 (abstract#1178).
38. McDonald JL, Shofer FS, Ghafari J. Effect of molar rotation onarch length. Clin Orthod Res 2001;4:79-85.
39. Halazonetis DJ. Acquisition of 3-dimensional shapes fromimages. Am J Orthod Dentofacial Orthop 2001;119:556-60.
COMMENTARY
This is a superb study and a valuable contribution tothe literature for several reasons. It is a serious andscholarly analysis of an important clinical problembased on the careful measurement of large and appro-priately gathered samples. It represents the first rigor-ous 3D analysis of study cast materials gathered fromrandomized prospective clinical trials. Its content is ofinterest to clinicians and academics alike, from both theclinical and methodologic points of view. Perhaps evenmore important, it represents the successful merging ofinformation from data sets from the investigations of 2outstanding groups of clinical investigators—I believethe first such intimate sharing of data in the history oforthodontic research in the United States.
The key clinical question in this study is how themaxillary first molar moves in space when straight-pullheadgear is used. The authors’ main analysis, however,is focused on how a single point on the occlusal surfaceof the molar moves through time. Most orthodontists donot immediately grasp the distinction between trackingthe displacement of a point and tracking the displace-ment of a rigid body like a tooth. But if the problem isphrased in different terms, they will understand the dif-