Genetic correlations between mandibular molar cusp areas in baboons
10
Genetic Correlations Between Mandibular Molar Cusp Areas in Baboons Leslea J. Hlusko, 1 * Nicholas Do, 1 and Michael C. Mahaney 2 1 Department of Integrative Biology, University of California at Berkeley, Berkeley, CA 94708 2 Department of Genetics, Southwest Foundation for Biomedical Research, San Antonio, TX 78245-0549 KEY WORDS dentition; dental variation; quantitative genetics; Papio; evolution; primate ABSTRACT Primate evolutionary studies rely signifi- cantly on dental variation given the large role that teeth play in how an organism interacts with its environ- ment (animal and plant) and conspecifics. Variation in cusp size has been shown to vary among primate taxa, although most studies to date focused on extant and extinct hominoids. Here we test the assumed hypothesis that a significant proportion of this variation in baboons is due to the additive effects of genes. We perform quan- titative genetic analyses on variation in two-dimensional (2-D) mandibular molar cusp size in a captive pedigreed breeding population of baboons (Papio hamadryas) from the Southwest National Primate Research Center. These analyses show that variation in cusp size is heritable and sexually dimorphic. Additionally, we tested for gene- tic correlations between cusps on the same crown, be- tween morphological homologues along the tooth row, and between cusp area and crown buccolingual width. We find that four of the six cusp pairs on the first molar have a genetic correlation of one, save for the metaco- nid–hypoconid and entoconid–hypoconid, which are not statistically different from zero. The second and third molars have lower genetic correlations, although the metaconid–hypoconid correlation is similarly estimated at zero and the entoconid–protoconid correlation is esti- mated to be one. This cross pattern of genetic and no genetic correlation does not immediately accord with the known pattern of development and/or calcification. We pro- pose two explanative hypotheses. Am J Phys Anthropol 132:445–454, 2007. V V C 2006 Wiley-Liss, Inc. Dental variation plays a critical role in reconstructing the phylogenetic relationships, diet, and ethology of numerous primate taxa (Rose et al., 1981; Ungar, 2004; Seiffert et al., 2005). This is particularly evident in pale- ontological research, where teeth are often the most ab- undant or only known anatomy of an extinct taxon. With advances in computer technology, researchers are start- ing to study variation in dental phenotypes that are rela- tively complicated to quantify, i.e. anatomical features that are non-linear. One of these non-linear phenotypes that has proven to vary significantly is the two-dimen- sional (2-D) occlusal area of molar cusps, also called the basal cusp area (Erdbrink, 1965, 1967; Sperber, 1974; Corruccini, 1977; Wood and Abbott, 1981; Hills et al., 1983; Wood et al., 1983; Wood and Engelman, 1988; Suwa, 1990; Reid et al., 1991; Wood and Xu, 1991; Macho and Moggi-Cecchi, 1992; Macho, 1994; Suwa et al., 1994; Suwa, 1996; Suwa et al., 1996; Uchida, 1996, 1998a,b; Kondo and Yamada, 2003; Bailey, 2004; Bailey et al., 2004; Kondo et al., 2005; Kondo and Townsend, 2006). Early studies of molar cusp area analyzed data col- lected as polyhedrons constructed from X,Y landmarks from photographs (Biggerstaff, 1969, 1976) or measured photographs with a planimeter (Erdbrink, 1965, 1967; Hills et al., 1983; Wood et al., 1983; Wood and Engleman, 1988; Reid et al., 1991; Macho, 1994). Other studies employed cusp diameter as a proxy for cusp size (Sperber, 1974; Corruccini, 1977; Kondo and Yamada, 2003; Kondo et al., 2005). More recent studies digitized negatives (Uchida, 1996, 1998a,b), employed digital tablets (Suwa, 1990; Wood and Xu, 1991; Macho and Moggi Cecchi, 1992; Suwa et al., 1994, 1996; Suwa, 1996), or used digi- tal photography and image-analysis software programs to measure 2-D basal cusp area (Bailey, 2004; Bailey et al., 2004; Kondo and Townsend, 2006). 3-D studies of cuspal area have also been conducted (Kanazawa et al., 1983; Kanazawa et al., 1984; Mayhall and Kanazawa, 1989; Mayhall and Alvesalo, 1992; M’Kirera and Ungar, 2003; Ungar and M’Kirera, 2003; Ulhaas et al., 2004; Ungar, 2004). Although the data collection process has grown easier as technology has improved, the results from earlier 2-D studies have been largely validated and expanded on by more recent projects. To date, neontological research has focused primarily on hominoids, assessing basal cusp size within and between humans, chimpanzees and gorillas. Erdbrink, (1965, 1967) reported negative correlations between human mandibular molar cusp areas such that the more distal and lingual cusps are relatively smaller. However, Hills et al. (1983) found that human mandibular molar cusp areas have only a weak, if any, allometric relationship with crown area. In contrast, maxillary molar cusp areas do appear to be allo- Grant sponsor: National Science Foundation; Grant numbers: BCS-0500179, BCS-0130277, BCS-0616308; Grant sponsor: Research Experience for Undergraduates; Grant sponsor: National Institutes of Health, National Center for Research Resources: Grant number: P51 RR013986. *Correspondence to: Leslea J. Hlusko, University of California, Berkeley, Department of Integrative Biology, 3060 Valley Life Sciences Building, 3140, Berkeley, CA 94720. E-mail: [email protected] Received 10 April 2006; accepted 27 September 2006. DOI 10.1002/ajpa.20528 Published online 11 December 2006 in Wiley InterScience (www.interscience.wiley.com). V V C 2006 WILEY-LISS, INC. AMERICAN JOURNAL OF PHYSICAL ANTHROPOLOGY 132:445–454 (2007)
-
Upload
independent -
Category
Documents
-
view
0 -
download
0
Transcript of Genetic correlations between mandibular molar cusp areas in baboons

Genetic Correlations Between MandibularMolar Cusp Areas in Baboons
Leslea J. Hlusko,1* Nicholas Do,1 and Michael C. Mahaney2
1Department of Integrative Biology, University of California at Berkeley, Berkeley, CA 947082Department of Genetics, Southwest Foundation for Biomedical Research, San Antonio, TX 78245-0549
KEY WORDS dentition; dental variation; quantitative genetics; Papio; evolution; primate
ABSTRACT Primate evolutionary studies rely signifi-cantly on dental variation given the large role that teethplay in how an organism interacts with its environ-ment (animal and plant) and conspecifics. Variation incusp size has been shown to vary among primate taxa,although most studies to date focused on extant andextinct hominoids. Here we test the assumed hypothesisthat a significant proportion of this variation in baboonsis due to the additive effects of genes. We perform quan-titative genetic analyses on variation in two-dimensional(2-D) mandibular molar cusp size in a captive pedigreedbreeding population of baboons (Papio hamadryas) fromthe Southwest National Primate Research Center. Theseanalyses show that variation in cusp size is heritableand sexually dimorphic. Additionally, we tested for gene-
tic correlations between cusps on the same crown, be-tween morphological homologues along the tooth row,and between cusp area and crown buccolingual width.We find that four of the six cusp pairs on the first molarhave a genetic correlation of one, save for the metaco-nid–hypoconid and entoconid–hypoconid, which are notstatistically different from zero. The second and thirdmolars have lower genetic correlations, although themetaconid–hypoconid correlation is similarly estimatedat zero and the entoconid–protoconid correlation is esti-mated to be one. This cross pattern of genetic and nogenetic correlation does not immediately accord with theknown pattern of development and/or calcification. We pro-pose two explanative hypotheses. Am J Phys Anthropol132:445–454, 2007. VVC 2006 Wiley-Liss, Inc.
Dental variation plays a critical role in reconstructingthe phylogenetic relationships, diet, and ethology ofnumerous primate taxa (Rose et al., 1981; Ungar, 2004;Seiffert et al., 2005). This is particularly evident in pale-ontological research, where teeth are often the most ab-undant or only known anatomy of an extinct taxon. Withadvances in computer technology, researchers are start-ing to study variation in dental phenotypes that are rela-tively complicated to quantify, i.e. anatomical featuresthat are non-linear. One of these non-linear phenotypesthat has proven to vary significantly is the two-dimen-sional (2-D) occlusal area of molar cusps, also called thebasal cusp area (Erdbrink, 1965, 1967; Sperber, 1974;Corruccini, 1977; Wood and Abbott, 1981; Hills et al.,1983; Wood et al., 1983; Wood and Engelman, 1988;Suwa, 1990; Reid et al., 1991; Wood and Xu, 1991; Machoand Moggi-Cecchi, 1992; Macho, 1994; Suwa et al., 1994;Suwa, 1996; Suwa et al., 1996; Uchida, 1996, 1998a,b;Kondo and Yamada, 2003; Bailey, 2004; Bailey et al.,2004; Kondo et al., 2005; Kondo and Townsend, 2006).Early studies of molar cusp area analyzed data col-
lected as polyhedrons constructed from X,Y landmarksfrom photographs (Biggerstaff, 1969, 1976) or measuredphotographs with a planimeter (Erdbrink, 1965, 1967;Hills et al., 1983; Wood et al., 1983; Wood and Engleman,1988; Reid et al., 1991; Macho, 1994). Other studiesemployed cusp diameter as a proxy for cusp size (Sperber,1974; Corruccini, 1977; Kondo and Yamada, 2003; Kondoet al., 2005). More recent studies digitized negatives(Uchida, 1996, 1998a,b), employed digital tablets (Suwa,1990; Wood and Xu, 1991; Macho and Moggi Cecchi,1992; Suwa et al., 1994, 1996; Suwa, 1996), or used digi-tal photography and image-analysis software programsto measure 2-D basal cusp area (Bailey, 2004; Bailey
et al., 2004; Kondo and Townsend, 2006). 3-D studies ofcuspal area have also been conducted (Kanazawa et al.,1983; Kanazawa et al., 1984; Mayhall and Kanazawa,1989; Mayhall and Alvesalo, 1992; M’Kirera and Ungar,2003; Ungar and M’Kirera, 2003; Ulhaas et al., 2004;Ungar, 2004). Although the data collection process hasgrown easier as technology has improved, the resultsfrom earlier 2-D studies have been largely validated andexpanded on by more recent projects.To date, neontological research has focused primarily on
hominoids, assessing basal cusp size within and betweenhumans, chimpanzees and gorillas. Erdbrink, (1965, 1967)reported negative correlations between human mandibularmolar cusp areas such that the more distal and lingualcusps are relatively smaller. However, Hills et al. (1983)found that human mandibular molar cusp areas have onlya weak, if any, allometric relationship with crown area. Incontrast, maxillary molar cusp areas do appear to be allo-
Grant sponsor: National Science Foundation; Grant numbers:BCS-0500179, BCS-0130277, BCS-0616308; Grant sponsor: ResearchExperience for Undergraduates; Grant sponsor: National Institutesof Health, National Center for Research Resources: Grant number:P51 RR013986.
*Correspondence to: Leslea J. Hlusko, University of California,Berkeley, Department of Integrative Biology, 3060 Valley Life SciencesBuilding, 3140, Berkeley, CA 94720. E-mail: [email protected]
Received 10 April 2006; accepted 27 September 2006.
DOI 10.1002/ajpa.20528Published online 11 December 2006 in Wiley InterScience
(www.interscience.wiley.com).
VVC 2006 WILEY-LISS, INC.
AMERICAN JOURNAL OF PHYSICAL ANTHROPOLOGY 132:445–454 (2007)

metric with crown size—the decrease in human maxillarymolars from anterior to posterior is primarily a function ofthe reduction of the distal components of the crown(Macho, 1994).Gorillas and chimpanzees are not reported to have an
allometric relationship between crown size and cusp size(Hills et al., 1983), although a relative shift in trigonid–talonid relative size is a critical distinction between thelesser and great ape mandibular molar crown morpholo-gies (Corruccini, 1977).Researchers have also found differences in cusp area
variance across primate taxa. Uchida (1996) noted thatPapio molar cusps have greater variability than do greatape cusps, attributing this to differing levels of sexualdimorphism, although cusp areas are sexually dimorphicin Gorilla and Pongo (Uchida, 1998a,b, respectively).Human molar cusps also show evidence of sexual sizedimorphism, but the degree of dimorphism varies depend-ing on the cusp (Kondo and Townsend, 2006), whichaccords somewhat with an earlier study reporting a min-imal level of sexual dimorphism in human molar cuspsize (Biggerstaff, 1976). Variance also appears to increasein the later forming cusps such that the primary cusp,the paracone is the least variable in the maxillary firstmolar (Kondo and Townsend, 2006).Paleontological research indicates that relative basal
cusp areas also differentiate extinct taxa. Uchida (1996)reported that mandibular first molars (M1s) of Proconsulafricanus have relatively larger hypoconulids and ento-conids and relatively smaller metaconids and hypoconidscompared to those of P. major. A lack of variation inbasal cusp area has been evoked to argue against thepresence of more than one taxon in the large assemblageof teeth from Lufeng, China (Wood and Xu, 1991).Plio-Pleistocene hominid basal cusp area has been the
most intensively investigated to date (Sperber, 1974; Woodet al., 1983; Wood and Engleman, 1988; Suwa et al., 1994;Suwa et al., 1996; Bailey, 2004). Wood et al. (1983) notedthat the mandibular molars of the robust species ofAustralopithecus (\Paranthropus") tend to have relativelysmaller mesial cusps and larger distal cusps compared toother hominids. Later studies show that although themesial cusps are smaller in the megadont species, theexpanded talonid is largely due to the enlargement of dif-ferent distal cusps in A. boisei and A. robustus, the ento-conid or the hypoconid (Suwa et al., 1994). This may reflecteither developmental sample bias, epigenetic factors, orthat talonid expansion is convergent in these species(Suwa et al., 1994).Bailey (2004) also found that a negative correlation
between the trigon and talon differentiate Neandertalfrom modern human maxillary molars, with the hypo-cone and metacone primarily accounting for these differ-ences. Corruccini (1977) also reported mesial/distal pro-portional differences in the mandibular molars of homi-noids, driven primarily by the metaconid in the trigonidand the entoconid in the talonid.Variation in basal area between cusps clearly contrib-
utes to taxonomic variation. Given that the nature andmagnitude of the genetic contribution(s) to the phenotypicvariance in a trait influence to a large extent the responseof that trait to selection (Fisher, 1930; Lynch and Walsh,1998), understanding the genetic architecture of popula-tion-level variation in molar cusp area would facilitateour interpretation of its evolutionary significance.It has long been recognized that offspring tend to
resemble their parents, and that this tendency can be
exploited in animal and plant breeding. Darwin appliedthis understanding to his development of the concept ofnatural selection (1859). By incorporating advances ininferential statistics to Gregor Mendel’s principles of inher-itance and Francis Galton’s biometry, biologists developedthe following well-known equation to describe the relation-ship between the inheritance of variation and selection,
R ¼ h2S
where S is the selection differential (the difference inpopulation mean before and after selection in a singlegeneration), R is the response to selection in the followinggeneration (Falconer, 1989) and h2 is the heritability ofthe trait of interest. The additive genetic variance of thephenotype is a critical element in understanding how atrait will respond to selective pressure. Genetic variancehas since become instrumental in studies of \evolvability"(Houle, 1992), with heritability estimation being one ofthe more common parameters for comparative studies(Lande, 1976, 1979; but see also Hansen et al., 2003).To date, there have been very few studies elucidating
the genetics of molar cusp area. From a study of basalcusp area in 199 pairs of same sex-twins in whichco-twin and cross-twin correlations were compared, Big-gerstaff (1976) concluded that the genetic component tovariation in this trait was relatively low. More recentreports of human genetic diseases indicate that thereis a genetic contribution to molar cusp area variation.Mayhall and Alvesalo (1992) considered the specificmolar morphology of 45,XO human females (individualslacking a second sex chromosome who are thereforephenotypically female). Affected individuals have smallermolar crowns overall, although the distal cusps arerelatively smaller compared to 46,XX females (Mayhalland Alvesalo, 1992). Individuals with Down syndromealso have cuspal differences in their maxillary molars(Peretz et al., 1996).In light of the importance of molar cusp area to pri-
mate odontological evolution and the dearth of knowl-edge regarding the genetic architecture of this variation,we undertook a quantitative genetic analysis of variationin mandibular molar cusp basal area in a captive ped-igreed population of baboons housed at the SouthwestNational Primate Research Center in San Antonio, Texas.Specifically, our aims were: 1) to estimate the heritabilityof this variation; 2) to estimate genetic correlationsbetween cusps on the same molar crown and along thetooth row; and lastly 3) to test for genetic correlationsbetween variation in molar cusp area and crown mesio-distal width.
MATERIALS
Data were collected from a large captive, pedigreedbreeding colony of baboons, Papio hamadryas, housed atthe Southwest National Primate Research Center (SNPRC)in San Antonio, Texas, following protocols in accordancewith the Guide for the Care and Use of Laboratory Ani-mals (National Research Council, 1996). The colony ismaintained in pedigrees (all familial relationships known)with all matings controlled and a female to male sex ratioapproximating 2:1.Genetic management of the colony, initiated over
20 years ago, allows for data collection from non-inbredanimals. All non-founder animals in this study resultedfrom matings that were random with respect to dental,
446 L.J. HLUSKO ET AL.
American Journal of Physical Anthropology—DOI 10.1002/ajpa

skeletal, and developmental phenotype. Genetic markermaps have been constructed using data obtained fromapproximately 1,000 individuals (Rogers et al., 2000; Coxet al., 2006).All pedigree data management and preparation was
conducted using the computer package PEDSYS (Dyke,1996). The animals from which data were collected aredistributed across eleven extended pedigrees. The meannumber of animals with data per pedigree was 44, andthese individuals typically occupied the lower, mostrecent two or three generations of each pedigree.Odontometric data were collected from high resolution
plaster dental casts of 627 pedigreed genotyped baboons.Dental casts were collected following a protocol describedin detail elsewhere (Hlusko et al., 2002).2-D areas of each tooth crown and cusp were mea-
sured from these digital photographs using Image ProPlus 5.1�C software. Area data were only collected fromthe left mandibular tooth row. Each image was cali-brated using the program’s calibration function and amillimeter scale that was present in every photograph.Image Pro Plus 5.1�C enables users to outline a 2-Dshape using the mouse and cursor, and a measuringfunction then calculates the area within the designatedshape.Cusp areas were not taken from broken or unusually
worn cusps. Sample sizes ranged from 198 to 510 out ofan overall sample of 627.Cusps were defined as in Figure 1, following Suwa
et al. (1994), but with modifications to account for thedifferences between baboon and hominid molar mor-phology. The fissures of each molar were used to definethe interior edges of individual cusps. Intercusp enamelareas such as the mesial and distal enamel shelves, buc-cal enamel shelves between the protoconid and entoco-nid, lingual enamel shelves existing between the metaco-nid and entoconid, and the middle fovea were notincluded, which differs from the method of Suwa et al.(1994) and Wood et al. (1983). When fissures delineatinga cusp were obliterated by wear, that cusp was excludedfrom measurement. On the M3s, crown and hypoconulidcusp areas would not be taken if obscured by the gum-line. This practice lead to rather small sample sizes forthe M3 phenotypes.Two of the authors collected these data (LH and ND).
Interobserver and intraobserver error was assessed for acombination of first, second, and third molars. Measure-ment error never exceeded 8% for interobserver or 5%for intraobserver error (Table 1). This does not differgreatly from the error reported by other researchers forthese types of data (Bailey et al., 2004).Mesial and distal buccolingual widths were also
analyzed. Details on how these data were collected areavailable in Hlusko et al. (2002).
METHODS
Statistical genetic analyses were performed using amaximum likelihood based variance decomposition ap-proach implemented in the computer package SOLAR2.1.2 (Almasy and Blangero, 1998). The phenotypic co-variance for each trait within a pedigree was modeled asX ¼ 2Ur2
G þ Ir2E, where U is a matrix of kinship coeffi-
cients for all relative pairs in a pedigree, r2G is the addi-
tive genetic variance, I is an identity matrix (composedof ones along the diagonal and zeros for all off diago-nal elements), and r2
E is the environmental variance.
Because the components of the phenotypic variance areadditive, such that r2
P ¼ r2G þ r2
E, we estimated herit-ability as h2 ¼ r2
G=r2P. Phenotypic variance attributable
to non-genetic factors is calculated as e2 ¼ 1 – h2. Weestimated the mean effects of sex and age on the 2-Darea recorded for each molar and each molar cusp. Co-variates found to be significant in the univariate ana-lyses were also included in the bivariate analyses. Weused likelihood ratio tests to compare the likelihoods ofmodels in which the value of each one of these covariateswas constrained to be zero to that of the general modelin which all covariate effects were estimated. For thepurposes of these analyses, P � 0.10 indicated a signifi-cant mean effect of the covariate.Using extensions to univariate genetic analyses that
encompass the multivariate state (Hopper and Mathews,
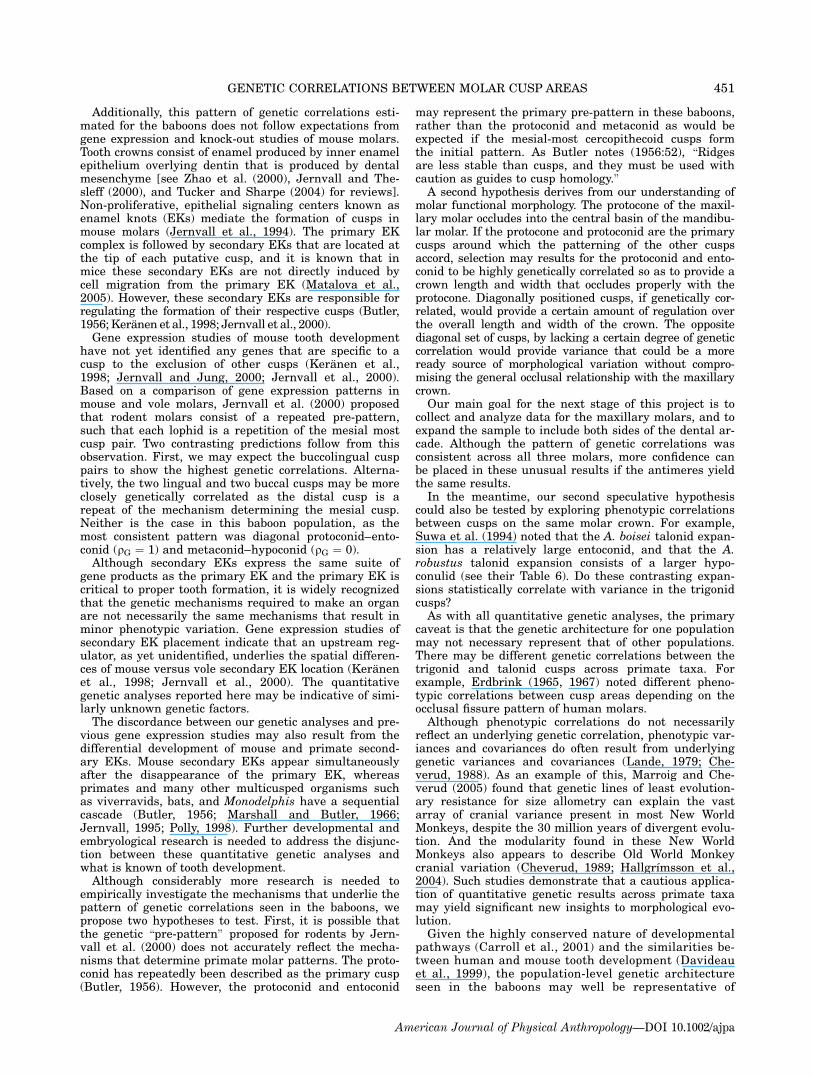
Fig. 1. Mesial is to the top and lingual to the right. A. Thisfigure shows how the cusps were defined for the data collectionprotocol. See text for more details. B. Schematic of the geneticcorrelations between cusps on the same molar crown. The solidarrows indicate a genetic correlation that is not significantlydifferent from one. The dotted arrows indicate partial correla-tions and incomplete pleiotropy. The cut-off point for signifi-cance in this figure was at the 0.05 level. Note the lack of a cor-relation between the metaconid and hypoconid on all threemolars.
447GENETIC CORRELATIONS BETWEEN MOLAR CUSP AREAS
American Journal of Physical Anthropology—DOI 10.1002/ajpa

1982; Lange and Boehnke, 1983; Boehnke et al., 1987),we modeled the multivariate phenotype of an individualas a linear function of the measurements on the individ-ual’s traits, the means of these traits in the population,the covariates and their regression coefficients, plus theadditive genetic values and random environmental devi-ations, as well as the genetic and environmental correla-tions between them. This approach is described in detailelsewhere (Mahaney et al., 1995). The phenotypic covari-ance in this multivariate extension is modeled asX ¼ G� 2Uþ E� I, where G and E, respectively are thegenetic and environmental variance–covariance matricesamong traits and � is the Kronecker product operator.From these two variance–covariance matrices, we esti-mated the additive genetic correlation, qG, and the envi-ronmental correlation, qE, between trait pairs. These corre-lations are estimates of the additive effects of shared genes(i.e., pleiotropy) and shared environmental (i.e., unmeas-ured and nongenetic) factors on the variance in a trait,respectively.The genetic and environmental components of the phe-
notypic correlation matrix are additive, like those of thecorresponding variance–covariance matrix, so we coulduse the maximum likelihood estimates of the additivegenetic and environmental correlations to obtain thetotal phenotypic correlation between two traits, qP, as
qP ¼ffiffiffiffiffiffih21
q ffiffiffiffiffiffih22
qqG þ
ffiffiffiffiffiffiffiffiffiffiffiffiffiffiffiffiffiffið1� h2
1Þq ffiffiffiffiffiffiffiffiffiffiffiffiffiffiffiffiffiffi
ð1� h22Þ
qqE:
Significance of the maximum likelihood estimates forheritability and other parameters was assessed by meansof likelihood ratio tests. Twice the difference of the maxi-mum likelihoods of a general model (in which all param-eters were estimated) and a restricted model (in whichthe value of a parameter to be tested was held constantat some value, usually zero) is distributed asymptoticallyapproximately as either a [1/2]:[1/2] mixture of v2 and apoint mass at zero, for tests of parameters like h2 forwhich a value of zero in a restricted model is at a bound-ary of the parameter space, or as a v2 variate for tests ofcovariates for which zero is not a boundary value (Hopperand Mathews, 1982). In both cases, degrees of freedom isequal to the difference in the number of estimated pa-rameters in the two models (Boehnke et al., 1987). How-ever, in tests of parameters like h2, whose values may befixed at a boundary of their parameter space in the nullmodel, the appropriate significance level is obtained byhalving the P-value (Boehnke et al., 1987).For bivariate models in which genetic correlations are
found to be significantly greater than zero, additionaltests are performed to compare the likelihood of a modelin which the value of the genetic correlation is fixedat 1.00 or zero to that of the unrestricted model inwhich the value of the genetic correlation is estimated. A
significant difference between the likelihoods of the re-stricted and polygenic models suggests incomplete pleiot-ropy; i.e., not all of the additive genetic variance in thetwo traits is due to the effects of the same gene or genes.
RESULTS
Analyses for 12 of the 13 cusp area phenotypes yieldedsignificant heritability estimates (Table 2), demonstrat-ing that a significant amount of phenotypic variance inmolar cusp size in this population is due to the additiveeffects of genes. Total h2 estimates indicate that 15–42%of the phenotypic variance can be attributed to additivegenetic effects.The M3 protoconid area has a leptokurtic distribution
(1.89), making further analyses with this phenotypequestionable. We present the results from these analyseswith this caveat in mind. The M3 hypoconulid areais not found to be significantly heritable, arguably anartifact of the rather small sample size (n ¼ 198).Covariate effects account for 16–34% of the total
phenotypic variance. Sex is the only consistently signifi-cant covariate indicating that cusp area is sexuallydimorphic, where males are larger than females.Age and age-by-sex effects are found for 7 of the pheno-
types. In these analyses, age serves as a proxy for wearsince enamel formation stops at eruption. This indicatesthat wear introduced a systematic measurement errorfor 7 of the phenotypes. However this does not appear tosignificantly raise the covariate variance relative to theother cusps, and therefore does not appear to contributesignificantly to the total phenotypic variance or nega-tively affect these results.Our first set of bivariate analyses tested for genetic
and environmental correlations between all possible cusparea pairs within an individual molar (Table 3). Stati-stical significance levels are biologically arbitrary andserve only as a cut-off point chosen by the researcher.Several of our likelihood ratio tests yielded P-values thatare significant at P < 0.05 but not at P < 0.01. We gene-rally apply a significance criterion of P < 0.01 unlessotherwise noted.For the M1, four of the six genetic correlations are
high and not significantly different from one. The geneticcorrelation for the remaining two pairs is lower. Themetaconid–hypoconid (qG ¼ 0.359) is not significantlydifferent from zero but it is significantly different fromone. The entoconid–hypoconid (qG ¼ 0.604) is signifi-cantly different from zero but arguably different fromone, P(qG ¼ 1) ¼ 0.015. The standard errors for theseestimates are high.The bivariate analyses yielded similar genetic correla-
tions for the M2 and M3 cusp pairs. For the M2, thesegenetic correlations are lower than are those found forthe M1, with the lowest two correlations similarly being
TABLE I. Inter- and Intra-observer measurement error for the SNPRC baboon basal cusp area data
Protoconid area Metaconid area Entoconid area Hypoconid area
Inter-observer error (n ¼ 19)Avg. difference 1.33 1.25 0.86 1.21Avg. measurement 17.52 18.36 15.79 16.48Percent error 7.6 6.8 5.5 7.3
Intra-observer error (n ¼ 10)Percent error 1.63 4.60 3.01 1.96
448 L.J. HLUSKO ET AL.
American Journal of Physical Anthropology—DOI 10.1002/ajpa

the metaconid–hypoconid and entoconid–hypoconid. Asfor the M1, the metaconid–entoconid correlation is alsosignificantly different from zero, whereas the entoco-nid–hypoconid [P(qG ¼ 0) ¼ 0.04] is arguable, and themetaconid–hypoconid [P(qG ¼ 0) ¼ 0.28] is not signifi-cantly different from zero.
The M3 results mirror those found for the M1 andM2. The genetic correlations are lower than those esti-mated for the M1. The metaconid–hypoconid pair isparticularly low and not significantly different fromzero. The entoconid–protoconid pair is the highest, andnot significantly different from one.
Our second set of bivariate analyses focused on serialanalyses of cusp morphological homologues along themolar row (Table 3). Genetic correlations for all homo-logue pairs were generally high, significantly differentfrom zero, and not statistically different from one.The exceptions to this are for the M1 and M3 compari-sons of entoconid, protoconid, and hypoconid, whichreturned large standard errors and consequently statis-tically inconclusive results.
Lastly, cusp area and buccolingual width were com-pared: the mesial cusps were compared with the mesialwidth and the distal cusps with distal width (Table 4).The buccal cusps yielded higher genetic correlationsthan did the lingual cusps, and all the correlationsbetween cusps and widths were found to be signifi-cantly different from one. Likelihood ratio tests indi-cate that the qG estimate for hypoconid area – distalwidth (qG ¼ 0.882) is significantly different (P ¼ 0.01)from that for the lingual cusp. The qG estimate for pro-toconid area – mesial width (qG ¼ 0.717) is only sug-gestively different (P ¼ 0.07) from that estimate for thelingual cusp (qG ¼ 0.481).
DISCUSSION
Variation in molar cusp size is heritable in this popu-lation of captive pedigreed baboons. Although not un-expected, this is an important first step to understand-ing the genetic architecture of cusp area, as only varia-tion that is heritable can respond to selective pressure(Fisher, 1930; Lynch and Walsh, 1998).
The second aim of this project was to identify thegenetic interrelatedness of cusps on the same tooth aswell as serially along the molar row. We first addressthe question of genetic correlations between cusps onthe same crown.
Genetic correlations between traits can result fromeither pleiotropy or gametic phase disequilibrium(Lynch and Walsh, 1998). The degree of gametic phasedisequilibrium (or linkage disequilibrium, LD) is afunction of a population’s genetic history and demogra-phy: e.g., it will be lower in outbred populations withmany unrelated founders as recombination exerts itseffects each generation, higher in populations under-going rapid expansion from a small number of foundersand those resulting from recent admixture. Given aconducive set of population characteristics, the likeli-hood of genetic correlation between two traits beingdue to LD is higher for simple traits, with monogenic(or nearly so) inheritance. However, if variation in apair of traits is attributable to the effects of multiple al-leles at multiple loci, LD is not likely to be a major con-tributor to the genetic correlation (Lande, 1980; Lynchand Walsh, 1998). Therefore, we are cautiously confi-dent that significant additive genetic correlations esti-
TABLE
2.DescriptivestatisticsandheritabilityestimatesforSNPRC
baboonmandibularmolarcu
spareasa
M1ma
M1ea
M1pa
M1ha
M2ma
M2ea
M2pa
M2ha
M3ma
M3ea
M3pa
M3ha
M3hla
Mea
n14.57
13.27
15.66
15.32
21.62
16.91
21.33
19.79
23.45
18.30
22.38*
21.59
17.28
Variance
4.13
2.45
3.42
3.20
7.64
3.36
5.65
5.37
8.72
5.43
7.39
5.97
16.02
Low
value
8.27
7.69
8.47
9.00
11.00
10.26
12.83
11.65
12.67
9.31
12.55
12.62
4.45
Highvalue
21.00
20.00
22.00
22.40
29.44
23.07
29.51
26.48
32.12
25.41
30.66
27.61
28.51
CV
13.95
11.81
11.81
11.68
12.78
10.84
11.14
11.71
12.59
12.74
12.14
11.31
23.16
n340
346
338
356
498
475
479
480
406
382
405
392
198
h2residual6
SE
0.4486
0.139
0.2906
0.144
0.2486
0.124
0.2766
0.140
0.5006
0.108
0.3866
0.116
0.1936
0.108
0.5726
0.119
0.5856
0.120
0.4356
0.131
0.2836
0.111
0.3346
0.114
0.0336
0.138
P-value
<0.001
<0.01
<0.01
<0.01
<0.001
<0.001
<0.01
<0.001
<0.001
<0.001
<0.001
<0.001
ns
Totalh2
0.378
0.228
0.185
0.233
0.369
0.288
0.150
0.418
0.387
0.324
0.213
0.237
0.028
e20.466
0.558
0.560
0.611
0.368
0.458
0.627
0.312
0.275
0.421
0.540
0.471
0.822
c20.157
0.213
0.255
0.156
0.263
0.254
0.223
0.270
0.337
0.256
0.247
0.292
0.151
bage
ns
ns
ns
ns
ns
<0.1
<0.01
<0.1
ns
ns
<0.1
ns
ns
bage2
ns
ns
<0.1
ns
ns
ns
ns
ns
ns
ns
<0.1
<0.1
ns
bsex
<0.001
<0.001
<0.001
<0.001
<0.001
<0.001
<0.001
<0.001
<0.001
<0.001
<0.001
<0.001
<0.001
bage*sex
ns
ns
ns
ns
ns
<0.1
<0.1
<0.1
ns
ns
ns
ns
ns
bage2sex
ns
ns
ns
ns
ns
ns
ns
ns
ns
<0.1
<0.1
<0.1
ns
ama¼
metaconid
area;ea
¼en
toconid
area;pa¼
protoconid
area;ha¼
hypocon
idarea;hla
¼hypocon
ulidarea;ns¼
not
significant.
Asterisk(*)den
otes
ahighresidualkurtosis
(1.89);Totalc2
¼amou
ntof
phen
otypic
variance
attributable
tocovariates;
Totalh2¼
(Residualh2)(1�T
otalc2);Totale2
¼[1–(Total
c2+Totalh2)];Coefficien
tof
variation
(CV)¼
[standard
dev
iation
*100]/mea
n;mea
suremen
tsare
inmm
2.
449GENETIC CORRELATIONS BETWEEN MOLAR CUSP AREAS
American Journal of Physical Anthropology—DOI 10.1002/ajpa

mated in our analyses on pairs of complex, multifactorialdental measures from our non-inbred, extended baboonpedigrees are primarily indicative of pleiotropy ratherthan LD. Ongoing and planned whole genome screensand LD analyses in this population will help confirmthis.The sequence of cusp calcification in the mandibular
molars of baboons is usually protoconid ? metaconid ?hypoconid ? entoconid (Swindler et al., 1968; Swindler,1985). This sequence of calcification is the same for mac-aques, humans, chimpanzees, and gorillas (Kraus andJordan, 1965; Oka and Kraus, 1969; Swindler, 1985).
Macaque protoconids and hypoconids start calcificationvery close in time (Swindler and Gavan, 1962) and thesecond cusp to calcify varies between the metaconid andhypoconid (Swindler and McCoy, 1965). During molarcusp coalescence in cercopithecoids, a buccolingual crestforms uniting the two mesial and two distal cusps priorto circumferential calcification (Swindler and Gavan,1962; Swindler and McCoy, 1965). This coalescence pat-terns differs from humans and howler monkeys (Tarrantand Swindler, 1972; Swindler, 1985).It would be reasonable to hypothesize that cusps tem-
porally adjacent to one another in the sequence of calcifi-cation have a higher degree of genetic correlation thancusps that are not. Alternatively, a higher degree ofgenetic correlation could be anticipated between cuspswithin a lophid, following the pattern of coalescence.The baboons yielded genetic correlations between
molar cusps that follow neither expectation. Rather, allcusps on the M1 have a genetic correlation that is notstatistically distinguishable from one, save for the meta-conid–hypoconid (qG ¼ 0) and the entoconid–hypoconid.For the M2 and M3, all cusps have overlapping but non-identical genetic effects (partial genetic correlations)except for the metaconid–hypoconid that are geneticallyindependent (qG ¼ 0) and the protoconid–entoconid thathave qG ¼ 1. Therefore, the most evident intercuspalrelationships are diagonal across the crown: 1) the com-plete genetic correlation between the protoconid andentoconid (qG ¼ 1), and 2) the lack of a genetic correla-tion between the metaconid and hypoconid (qG ¼ 0) (seeFig. 1B).
TABLE 4. Bivariate statistical genetic analyses between cusparea and widths for M2: Maximum-likelihood estimates (MLE)
of genetic and environmental correlationsa
Phenotypepairs N
Correlations(MLEs)
SignificanceP(Hypothesis)
qG qE qG ¼ 0 |qG| ¼ 1
pa–mw 534 0.717 0.731 0.0051 0.0045ma–mw 534 0.481 0.503 0.0242 <0.0001ha–dw 532 0.882 0.750 <0.0001 0.0001ea–dw 528 0.612 0.531 0.0185 0.0008
a pa ¼ protoconid area; ma ¼ metaconid area; ha ¼ hypoconidarea; ea ¼ entoconid area; mw ¼ mesial buccolingual width; dw ¼distal buccolingual width; P(Hypothesis): probability of the hypoth-esis (indicated in columns below) being true given the availablepedigreed data.
TABLE 3. Bivariate statistical genetic analyses: Maximum-likelihood estimates (MLE) of genetic and environmental correlationsa
Phenotype pairs N
Correlations (MLEs)Significance of correlations
P(Hypothesis)
qG (se) qE qG ¼ 0 |qG| ¼ 1
M1 ma–ea 346 0.836 (0.145) 0.549 0.0046 0.1063ma–pa 350 0.915 (0.093) �0.353 <0.0001 0.1442ma–ha 356 0.359 (0.270) �0.089 0.2229 0.0049ea–pa 354 0.934 (0.122) 0.011 0.0004 0.2805ea–ha 356 0.604 (0.246) 0.157 0.0725 0.0146pa–ha 356 0.838 (0.163) 0.592 0.0175 0.1144
M2 ma–ea 503 0.616 (0.116) 0.593 0.0007 <0.0001ma–pa 507 0.489 (0.185) 0.039 0.0250 0.0005ma–ha 508 0.160 (0.169) 0.003 0.3581 <0.0001ea–pa 504 0.806 (0.132) 0.052 0.0001 0.0317ea–ha 504 0.428 (0.156) 0.010 0.0152 <0.0001pa–ha 502 0.802 (0.084) 0.624 <0.0001 0.0005
M3 ma–ea 410 0.535 (0.145) 0.4420 0.0065 <0.0001ma–pa 421 0.458 (0.175) �0.056 0.0198 <0.0001ma–ha 421 0.141 (0.211) 0.065 0.5121 <0.0001ea–pa 423 0.910 (–) �0.156 <0.0001 0.2817ea–ha 417 0.580 (0.201) 0.099 0.0149 0.0057pa–ha 423 0.675 (0.148) 0.647 0.0026 0.0011
Metaconid M1–M2 519 1.000 (–) 0.154 <0.0001 –M1–M3 490 0.884 (0.081) 0.251 <0.0001 0.0236M2–M3 543 0.897 (0.060) 0.335 <0.0001 0.0107
Entoconid M1–M2 518 0.760 (0.206) 0.444 0.0095 0.1195M1–M3 492 0.542 (0.252) 0.218 0.0532 0.0375M2–M3 546 0.935 (0.079) 0.124 <0.0001 0.1655
Protoconid M1–M2 522 0.567 (0.237) 0.316 0.0776 0.0059M1–M3 506 0.481 (0.278) �0.007 0.1003 0.0303M2–M3 548 1.000 (–) 0.161 <0.0001 –
Hypoconid M1–M2 524 0.777 (0.165) 0.225 0.0018 0.0383M1–M3 503 0.691 (0.360) �0.033 0.0728 0.1638M2–M3 546 0.951 (0.111) 0.007 <0.0001 0.3138
a P(Hypothesis): probability of the hypothesis indicated in the columns below being true given the available pedigreed data;se ¼ standard error; ma ¼ metaconid area; ea ¼ entaconid area; pa ¼ protoconid area; hypoconid area; M1 ¼ first mandibular molar.
450 L.J. HLUSKO ET AL.
American Journal of Physical Anthropology—DOI 10.1002/ajpa
Additionally, this pattern of genetic correlations esti-mated for the baboons does not follow expectations fromgene expression and knock-out studies of mouse molars.Tooth crowns consist of enamel produced by inner enamelepithelium overlying dentin that is produced by dentalmesenchyme [see Zhao et al. (2000), Jernvall and The-sleff (2000), and Tucker and Sharpe (2004) for reviews].Non-proliferative, epithelial signaling centers known asenamel knots (EKs) mediate the formation of cusps inmouse molars (Jernvall et al., 1994). The primary EKcomplex is followed by secondary EKs that are located atthe tip of each putative cusp, and it is known that inmice these secondary EKs are not directly induced bycell migration from the primary EK (Matalova et al.,2005). However, these secondary EKs are responsible forregulating the formation of their respective cusps (Butler,1956; Keranen et al., 1998; Jernvall et al., 2000).Gene expression studies of mouse tooth development
have not yet identified any genes that are specific to acusp to the exclusion of other cusps (Keranen et al.,1998; Jernvall and Jung, 2000; Jernvall et al., 2000).Based on a comparison of gene expression patterns inmouse and vole molars, Jernvall et al. (2000) proposedthat rodent molars consist of a repeated pre-pattern,such that each lophid is a repetition of the mesial mostcusp pair. Two contrasting predictions follow from thisobservation. First, we may expect the buccolingual cusppairs to show the highest genetic correlations. Alterna-tively, the two lingual and two buccal cusps may be moreclosely genetically correlated as the distal cusp is arepeat of the mechanism determining the mesial cusp.Neither is the case in this baboon population, as themost consistent pattern was diagonal protoconid–ento-conid (qG ¼ 1) and metaconid–hypoconid (qG ¼ 0).Although secondary EKs express the same suite of
gene products as the primary EK and the primary EK iscritical to proper tooth formation, it is widely recognizedthat the genetic mechanisms required to make an organare not necessarily the same mechanisms that result inminor phenotypic variation. Gene expression studies ofsecondary EK placement indicate that an upstream reg-ulator, as yet unidentified, underlies the spatial differen-ces of mouse versus vole secondary EK location (Keranenet al., 1998; Jernvall et al., 2000). The quantitativegenetic analyses reported here may be indicative of simi-larly unknown genetic factors.The discordance between our genetic analyses and pre-
vious gene expression studies may also result from thedifferential development of mouse and primate second-ary EKs. Mouse secondary EKs appear simultaneouslyafter the disappearance of the primary EK, whereasprimates and many other multicusped organisms suchas viverravids, bats, and Monodelphis have a sequentialcascade (Butler, 1956; Marshall and Butler, 1966;Jernvall, 1995; Polly, 1998). Further developmental andembryological research is needed to address the disjunc-tion between these quantitative genetic analyses andwhat is known of tooth development.Although considerably more research is needed to
empirically investigate the mechanisms that underlie thepattern of genetic correlations seen in the baboons, wepropose two hypotheses to test. First, it is possible thatthe genetic \pre-pattern" proposed for rodents by Jern-vall et al. (2000) does not accurately reflect the mecha-nisms that determine primate molar patterns. The proto-conid has repeatedly been described as the primary cusp(Butler, 1956). However, the protoconid and entoconid
may represent the primary pre-pattern in these baboons,rather than the protoconid and metaconid as would beexpected if the mesial-most cercopithecoid cusps formthe initial pattern. As Butler notes (1956:52), \Ridgesare less stable than cusps, and they must be used withcaution as guides to cusp homology."A second hypothesis derives from our understanding of
molar functional morphology. The protocone of the maxil-lary molar occludes into the central basin of the mandibu-lar molar. If the protocone and protoconid are the primarycusps around which the patterning of the other cuspsaccord, selection may results for the protoconid and ento-conid to be highly genetically correlated so as to provide acrown length and width that occludes properly with theprotocone. Diagonally positioned cusps, if genetically cor-related, would provide a certain amount of regulation overthe overall length and width of the crown. The oppositediagonal set of cusps, by lacking a certain degree of geneticcorrelation would provide variance that could be a moreready source of morphological variation without compro-mising the general occlusal relationship with the maxillarycrown.Our main goal for the next stage of this project is to
collect and analyze data for the maxillary molars, and toexpand the sample to include both sides of the dental ar-cade. Although the pattern of genetic correlations wasconsistent across all three molars, more confidence canbe placed in these unusual results if the antimeres yieldthe same results.In the meantime, our second speculative hypothesis
could also be tested by exploring phenotypic correlationsbetween cusps on the same molar crown. For example,Suwa et al. (1994) noted that the A. boisei talonid expan-sion has a relatively large entoconid, and that the A.robustus talonid expansion consists of a larger hypo-conulid (see their Table 6). Do these contrasting expan-sions statistically correlate with variance in the trigonidcusps?As with all quantitative genetic analyses, the primary
caveat is that the genetic architecture for one populationmay not necessary represent that of other populations.There may be different genetic correlations between thetrigonid and talonid cusps across primate taxa. Forexample, Erdbrink (1965, 1967) noted different pheno-typic correlations between cusp areas depending on theocclusal fissure pattern of human molars.Although phenotypic correlations do not necessarily
reflect an underlying genetic correlation, phenotypic var-iances and covariances do often result from underlyinggenetic variances and covariances (Lande, 1979; Che-verud, 1988). As an example of this, Marroig and Che-verud (2005) found that genetic lines of least evolution-ary resistance for size allometry can explain the vastarray of cranial variance present in most New WorldMonkeys, despite the 30 million years of divergent evolu-tion. And the modularity found in these New WorldMonkeys also appears to describe Old World Monkeycranial variation (Cheverud, 1989; Hallgrımsson et al.,2004). Such studies demonstrate that a cautious applica-tion of quantitative genetic results across primate taxamay yield significant new insights to morphological evo-lution.Given the highly conserved nature of developmental
pathways (Carroll et al., 2001) and the similarities be-tween human and mouse tooth development (Davideauet al., 1999), the population-level genetic architectureseen in the baboons may well be representative of
451GENETIC CORRELATIONS BETWEEN MOLAR CUSP AREAS
American Journal of Physical Anthropology—DOI 10.1002/ajpa

other primate species. We plan to carry out studies ofphenotypic correlations specifically designed to test thishypothesis.Returning to our second specific aim, analyses of mor-
phologically homologous cusps along the tooth row indi-cate that variation in basal cusp area is determined bythe same genetic effects on each crown. This result is in-triguing when contrasted to the overall pattern of inter-cusp correlations. The M1 cusps have high genetic corre-lations that are not statistically different from one, savefor the lack of a correlation between the metaconid andhypoconid, and between the entoconid and hypoconid (qG¼ 0). The M2 and M3 have much lower genetic correla-tion estimates, although they also demonstrate the com-plete lack of a genetic correlation between the metaconidand hypoconid. Both of these more distal crowns alsoyielded a genetic correlation of one between the protoco-nid and entoconid, as was seen for the M1. Therefore, apattern of diagonal cusp area interrelationships is main-tained along the tooth row, but the level of the geneticcorrelation among the other cusp pairs is significantlyhigher in the M1 compared to the M2 and M3.Previous work on mammalian dental variation demon-
strates the M1 to be the least variable of all teeth alongthe molar row (e.g., Gingerich, 1974; Gingerich andSchoeninger, 1979; Gingerich and Winkler, 1979; Harrisand Dinh, in press). Basal cusp area studies show thesame pattern (Macho, 1994; Uchida, 1998a). Previousheritability studies found that the least variable toothreturned the highest heritability estimate (Alvesalo andTiggerstedt, 1974). Here we find that the M1 does notreturn higher heritability estimates, but that the cuspson this crown do have much higher genetic correlationsthan those estimated on the M2 and M3. If the geneticarchitecture seen in the baboons is also found in othertaxa, these high genetic correlations within the M1 mayunderlie the reduced phenotypic variability observed inother species.Numerous studies demonstrate that patterns of pheno-
typic variability appear to reflect developmental cascades(Polly, 1998; Kondo and Yamada, 2003; Kondo and Town-send, 2006). It is difficult to compare variance in thispopulation to variance in other studies because individu-als in this baboon colony are related (violating theassumption of independence in most statistical analyses).Therefore, the distributions for many of the dentalphenotypes are significantly leptokurtic and familial rela-tionships must be accounted for in the analysis ofvariance. However, we have provided the coefficient ofvariation (CV) for each of the cuspal phenotypes (Table 2).These data show that there is no clear difference in theCVs for these cusps, although the metaconid CV is thehighest on the M1 and M2.Our data reveal tentative evidence for what may be an
expected trend, that is for cusp areas on adjacent crownsto have higher genetic correlations than do those onspatially and temporally more distant crowns. Thisdecrease in pleiotropy may result from changing pat-terns of epistasis (or gene–gene interactions) as molarcrowns are in developmentally different environmentsgiven the differences in ontogenetic timing. Alternatively,the decrease in pleiotropy may result from differentselective pressures acting on the various molar crownsover evolutionary time.The results of our bivariate analyses of cusp areas and
crown widths suggest that the gene or genes that influ-ence buccolingual width also exert more of an influence
on the areas of buccal cusps than those of lingual cusps.In both cases, the pleiotropic effect is incomplete (i.e.,the genetic correlation is significantly less than one),which we interpret to mean that a portion of the varia-tion in cusp area and crown width is due to the effects ofgenes not shared with the other trait.Interestingly though, the buccal cusps have a signifi-
cantly higher genetic correlation with width than do thelingual cusps. The functional cusps on the mandibularmolars—those that occlude with the maxillary molars—are those on the buccal side. The buccal cusps are alsolarger than are those on the lingual side. Therefore, thehigher genetic correlation between total buccolingualwidth and the buccal cusps may have resulted fromfunctional selective pressures to withstand the greaterforces imposed on the buccal half of the crown duringmastication.The quantitative genetic analysis of mandibular molar
cusp area reveals a pattern of genetic correlations thatdo not conform to our expectations from what is knownabout tooth development. Rather, we find a patternthat can be explained, perhaps, by a response to func-tional pressures exerted on the genetic architecture overevolutionary time. Further research is needed to testthis hypothesis.
CONCLUSIONS
We performed a quantitative genetic analysis of varia-tion in mandibular molar cusp size in a captive ped-igreed breeding population of baboons housed at theSouthwest National Primate Research Center. Resultsfrom these analyses indicate that this phenotype is herit-able and sexually dimorphic. Approximately 15–42%of the total phenotypic variance is due to the additiveeffects of genes.We found a pattern of genetic correlation and lack of
correlation that is repeated on the first, second, andthird molars. The entoconid and protoconid have a highgenetic correlation that is not significantly different fromone. In contrast, the metaconid and hypoconid do nothave a genetic correlation.The first molar genetic correlations are typically
higher than those found for the more distal molars, butthe pattern of qG & 1 between entoconid and protoconid,and qG & 0 between metaconid and hypoconid is foundon all three crowns. These genetic correlations do notaccord with expectations from developmental genetics orembryological studies. Further analyses are needed toexplore this disjunction. In the meantime, we tentativelysuggest a functional hypothesis that may have shapedthe genetic architecture of cusp area interrelatednessover evolutionary time.Variation along the tooth row appears to be influenced
by the same genetic effects, as morphological homologueshave genetic correlations that are high or not signifi-cantly different from one. This is similar to results fromthe serial analyses of other phenotypes (Hlusko andMahaney, 2003; Hlusko et al., 2004).As would be expected, there is a genetic correlation
between cusp size and buccolingual width, although thiscorrelation is higher in the buccal cusps compared to thelingual cusps. The buccal cusps are the functional cuspsfor the mandibular molars, and also the larger of thecusps. This result might be explained by a genetic archi-tecture that has evolved in response to functional pres-sures moreso than the result of developmental cascades,
452 L.J. HLUSKO ET AL.
American Journal of Physical Anthropology—DOI 10.1002/ajpa

similar to our possible explanation for the cusp areainterrelationships mentioned above. Clearly, further re-search is needed to determine whether or not functionalversus developmental explanations best accord with thegenetic architecture of minor population-level dentalvariation.
ACKNOWLEDGMENTS
The authors thank K.D. Carey, K. Rice and the Veteri-nary Staff of the Southwest Foundation for BiomedicalResearch and the Southwest National Primate ResearchCenter; Jim Cheverud (Washington University) foraccess to specimens; Deborah E. Newman for pedigreedata management and processing; Jeffrey Rogers, AlanWalker, and Ken Weiss for project support and develop-ment; Laurel Buchanan, Theresa Cannistraro, LeslieHolder, Jennifer Irwin, Anne Liberatore, Mary-LouiseMaas, and Danelle Pillie for assistance with data collec-tion. Thanks also to Bill Clemens and two anonymousreviewers and for helpful comments on the manuscript.
LITERATURE CITED
Almasy L, Blangero J. 1998. Multipoint quantitative-trait link-age analysis in general pedigrees. Am J Hum Genet 62:1198–1211.
Alvesalo K, Tigerstedt PMA. 1974. Heritabilities of human toothdimensions. Hereditas 77:311–318.
Bailey SE. 2004. A morphometric analysis of maxillary molarcrowns of Middle-Late Pleistocene hominins. J Hum Evol 47:183–198.
Bailey SE, Pilbrow VC, Wood BA. 2004. Interobserver errorinvolved in independent attempts to measure cusp base areasof Pan M1s. J Anat 205:323–331.
Biggerstaff RH. 1969. The basal area of posterior tooth crowncomponents: the assessment of within tooth variation of pre-molars and molars. Am J Phys Anthropol 31:163–170.
Biggerstaff RH. 1976. Cusp size, sexual dimorphism, and theheritability of maxillary molar cusp size in twins. J Dent Res55:189–195.
Boehnke M, Moll PP, Kottke BA, Weidman WH. 1987.Partitioning the variability of fasting plasma-glucose levels inpedigrees. Genetic and environmental factors. Am J Epide-miol 125:679–689.
Butler PM. 1956. The ontogeny of molar pattern. Biol Rev 31:30–70.
Carroll SB, Grenier JK, Weatherbee SD. 2001. From DNA to di-versity. Malden, MA: Blackwell Science.
Cheverud JM. 1988. A comparison of genetic and phenotypiccorrelations. Evolution 42:958–968.
Cheverud JM. 1989. A comparative analysis of morphologicalvariation patterns in the papionins. Evolution 43:1737–1747.
Corruccini RS. 1977. Crown component variation in hominoidlower third molars. Z Morph Anthropol 68:14–25.
Cox LA, Mahaney MC, VandeBerg JL, Rogers J. 2006. A secondgeneration genetic linkage map of the baboon (Papio hama-dryas) genome. Genomics 88:274–286.
Darwin C. 1859. The origin of species by means of natural selec-tion, 1st ed. London: John Murray.
Davideau JL, Demri P, Hotton D, Gu TT, MacDougall M,Sharpe P, Forest N, Berdal A. 1999. Comparative study ofMSX-2, DLX-5, and DLX-7 gene expression during earlyhuman tooth development. Pediatr Res 46:650–656.
Dyke B. 1996. PEDSYS: a pedigree data management software.San Antonio: Southwest Foundation for Biomedical Research.
Erdbrink DP. 1965. A quantification of the Dryopithecus andother lower molar patterns in man and some of the apes.Z Morph Anthropol 57:70–108.
Erdbrink DP. 1967. A quantification of lower molar patterns indeutero-Malayans. Z Morph Anthropol 59:40–56.
Falconer DS. 1989. Introduction to quantitative genetics, 3rdedition. Harlow, UK: Longman Science and Technology.
Fisher RA. 1930. The genetical theory of natural selection.Oxford: The Clarendon Press.
Gingerich PD. 1974. Size variability of the teeth in livingmammals and the diagnosis of closely related sympatric fossilspecies. J Paleontol 48:895–903.
Gingerich PD, Schoeninger MJ. 1979. Patterns of tooth size var-iability in the dentition of primates. Am J Phys Anthropol51:457–466.
Gingerich PD, Winkler DA. 1979. Paterns of variation and cor-relation in the dentition of the red fox, Vulpes vulpes.J Mammal 60:691–704.
Hallgrımsson B, Willmore K, Dorval C, Cooper DML. 2004.craniofacial variability and modularity in macaques and mice.J Exp Zool B Mol Dev Evol 302:207–225.
Hansen TF, Armbruster WS, Carlson ML, Pelabon C. 2003.Evolvability and genetic constraint in Dalechampia blossoms:genetic correlations and conditional evolvability. J Exp Zool BMol Dev Evol 296:23–39.
Harris EF, Dinh DP. Intercusp relationships of the permanentmaxillary first and second molars in American whites. Am JPhys Anthropol , in press.
Hills M, Graham SH, Wood BA. 1983. The allometry of relativecusp size in hominoid mandibular molars. Am J Phys Anthro-pol 62:311–316.
Hlusko LJ, Maas ML, Mahaney MC. 2004. Statistical geneticsof molar cusp patterning in pedigreed baboons: implicationsfor primate dental development and evolution. J Exp Zool BMol Dev Evol 302:268–283.
Hlusko LJ, Mahaney MC. 2003. Genetic contributions to expres-sion of the baboon cingular remnant. Arch Oral Biol 48:663–672.
Hlusko LJ, Weiss KM, Mahaney MC. 2002. Statistical geneticcomparison of two techniques for assessing molar crownsize in pedigreed baboons. Am J Phys Anthropol 117: 182–189.
Hopper JL, Mathews JD. 1982. Extensions to multivariate nor-mal models for pedigree analysis. Ann Hum Genet 46:373–383.
Houle D. 1992. Comparing evolvability and variability of quanti-tative traits. Genetics 130:195–204.
Jernavall J. 1995. Mammalian molar cusp patterns: deve-lopmental mechanisms of diversity. Acta Zool Fenn 198:1–61.
Jernvall J, Jung H-S. 2000. Genotype, phenotype, and deve-lopmental biology of molar tooth characters. Yrbk Phys Anthro-pol 43:171–190.
Jernvall J, Keranen SVE, Thesleff I. 2000. Evolutionary modifi-cation of development in mammalian teeth: quantifying geneexpression patterns and topography. Proc Natl Acad Sci USA97:14444–14448.
Jernvall J, Kettunen P, Karavanova I, Martin LB, Thesleff I.1994. Evidence for the role of the enamel knot as a control cen-ter in mammalian tooth cusp formation: non-dividing cells ex-press growth stimulating Fgf-4 gene. Int J Dev Biol 38:463–469.
Jernvall J, Thesleff I. 2000. Reiterative signaling and pattern-ing during mammalian tooth morphogenesis. Mech Dev 92:19–29.
Kanazawa E, Sekikawa M, Ozaki T. 1983. Three-dimensionalmeasurement of the occlusal surface of upper first molars in amodern Japanese population. Acta Anat 116:90–96.
Kanazawa E, Sekikawa M, Ozaki T. 1984. Three-dimensionalmeasurements of the occlusal surfaces of upper molars in aDutch population. J Dent Res 63:1298–1301.
Keranen SVE, Aberg T, Kettunen P, Thesleff I, Jernvall J. 1998.Association of developmental regulatory gene with the devel-opment of different molar tooth shapes in two species ofrodents. Dev Genes Evol 208:477–486.
Kondo S, Townsend GC. 2006. Associations between Carabellitrait and cusp areas in human permanent maxillary firstmolars. Am J Phys Anthropol 129:196–203.
Kondo S, Townsend GC, Yamada H. 2005. Sexual dimorphism ofcusp dimensions in human maxillary molars. Am J PhysAnthropol 128:870–877.
453GENETIC CORRELATIONS BETWEEN MOLAR CUSP AREAS
American Journal of Physical Anthropology—DOI 10.1002/ajpa

Kondo S, Yamada H. 2003. Cusp size variability of themaxillary molariform teeth. Anthropol Sci 111:255–263.
Kraus BS, Jordan RE. 1965. The human dentition before birth.Philadelphia: Lea and Febiger.
Lande R. 1976. Natural selection and random genetic drift inphenotypic evolution. Evolution 30:314–334.
Lande R. 1979. Quantitative genetic analysis of multivariateevolution, applied to brain: body size allometry. Evolution 33:402–416.
Lande R. 1980. Genetic variation and phenotypic evolution dur-ing allopatric speciation. Am Nat 116:463–479.
Lange K, Boehnke M. 1983. Extensions to pedigree analysis. IV.Covariance components models for multivariate traits. Am JMed Genet 14:513–524.
Lynch M, Walsh B. 1998. Genetics and analysis of quantitativetraits. Sunderland, MA: Sinauer Associates.
M’Kirera F, Ungar P. 2003. Occlusal relief changes with molarwear in Pan troglodytes troglodytes and Gorilla gorilla gorilla.Am J Primatol 60:31–41.
Macho GA, Moggi-Cecchi J. 1992. Reduction of maxillary molarsin Homo sapiens: a different perspective. Am J Phys Anthro-pol 87:151–159.
Macho GA. 1994. Variation in enamel thickness and cusp areawithin human maxillary molars and its bearing on scalingtechniques used for studies of enamel thickness betweenspecies. Arch Oral Biol 39:783–792.
Mahaney MC, Blangero J, Comuzzie AG, VandeBerg JL, Stern MP,MacCluer JW. 1995. Plasma HDL cholesterol, triglycerides, andadiposity. A quantitative genetic test of the conjoint trait hypothe-sis in the San-Antonio Family Heart-Study. Circulation 92:3240–3248.
Marroig G, Cheverud JM. 2005. Size as a line of leastevolutionary resistance: diet and adaptive morphological radi-ation in New World monkeys. Evolution 59:1128–1142.
Marshall PM, Butler PM. 1966. Molar cusp development in thebat, Hipposideros beatus, with reference to the ontogenic basisof occlusion. Arch Oral Biol 11:949–966.
Matalova E, Antonarakis GS, Sharpe PT, Tucker AS. 2005. Celllineage of primary and secondary enamel knots. Dev Dyn 233:754–759.
Mayhall JT, Alvesalo L. 1992. Dental morphology of 45,X0human females: molar cusp area, volume, shape and linearmeasurements. Arch Oral Biol 37:1039–1043.
Mayhall JT, Kanazawa E. 1989. Three-dimensional analysis ofthe maxillary first molar crowns of Canadian-Inuit. Am JPhys Anthropol 78:73–78.
National Research Council. 1996. Guide for the care and use oflaboratory animals.Washington, DC:National Academy Press.
Oka SW, Kraus BS. 1969. The circumnatal status of molarcrown maturation among the Hominoidea. Arch Oral Biol 14:639–659.
Peretz B, Shapira J, Farbstein H, Arieli E, Smith P. 1996. Modi-fication of tooth size and shape in Down’s syndrome. J Anat188:167–172.
Polly PD. 1998. Variability, selection, and constraints; develop-ment and evolution in viverravid (Carnivora, Mammalia)molar morphology. Paleobiology 24:409–429.
Reid C, van Reenen JF, Groeneveld HT. 1991. Tooth size andthe Carabelli trait. Am J Phys Anthropol 84:427–432.
Rogers J, Mahaney MC, Witte SM, Nair S, Newman D, Wedel S,Rodriguez LA, Rice KS, Slifer SH, Perelygin A, Slifer M, Palla-dino-Negro P, Newman T, Chambers K, Joslyn G, Parry P,Morin PA. 2000. A genetic linkage map of the baboon (Papiohamadryas) genome based on human microsatellite polymor-phisms. Genomics 67:237–247.
Rose KD, Walker A, Jacobs LL. 1981. Function of the mandibu-lar tooth comb in living and extinct mammals. Nature 289:583–585.
Seiffert ER, Simons EL, Clyde WC, Rossie JB, Attia Y, Bown TM,Chatrath P, Mathison ME. 2005. Basal anthropoids from Egyptand the antiquity of Africa’s higher primate radiation. Science310:300–304.
Sperber G. 1974. Morphology of the cheek teeth of early SouthAfrican hominids. Ph.D. thesis, University of the Witwatersrand.
Suwa G. 1990. A comparative analysis of hominid dentalremains from the Shungura and Usno formations, OmoValley, Ethiopia. Ph.D. thesis, University of California atBerkeley.
Suwa G. 1996. Serial allocation of isolated mandibular molars ofunknown taxonomic affinities form the Shungura and Unsoformations, Ethiopia, a combined method approach. J HumEvol 11:269–282.
Suwa G, White TD, Howell FC. 1996. Mandibular postcaninedentition from the Shungura formation, Ethiopia: Crown mor-phology, taxonomic allocations, and Plio-Pleistocene hominidevolution. Am J Phys Anthropol 101:247–282.
Suwa G, Wood BA, White TW. 1994. Further analysis of man-dibular molar crown and cusp areas in Pliocene and earlyPleistocene hominids. Am J Phys Anthropol 93:407–426.
Swindler DR, Gavan JA. 1962. Calcification of the mandibularmolars in rhesus monkeys. Arch Oral Biol 7:727–734.
Swindler DR, McCoy HA. 1965. Primate odontogenesis. J DentRes 44(Suppl):283–295.
Swindler DR, Orlosky FJ, Hendrickx AG. 1968. Calcification ofthe deciduous molars in baboons (Papio anubis) and other pri-mates. J Dent Res 47:167–170.
Swindler DR. 1985. Nonhuman primate dental development andits relationship to human dental development. In: ES Watts,editor. Nonhuman primate models for human growth and de-velopment. New York: Alan R. Liss. p 67–94.
Tarrant LH, Swindler DR. 1972. The state of the deciduous den-tition of a chimpanzee fetus (Pan troglodytes). J Dent Res51:677.
Tucker A, Sharpe P. 2004. The cutting–edge of mammalian de-velopment: How the embryo makes teeth. Nat Rev Genet 5:499–508.
Uchida A. 1996. Dental variation of Proconsul from the Tinderetregion, Kenya. J Hum Evol 31:489–497.
Uchida A. 1998a. Variation in tooth morphology of Gorillagorilla. J Hum Evol 34:55–70.
Uchida A. 1998b. Variation in tooth morphology of Pongo pygmaeus.J Hum Evol 34:71–79.
Ulhaas L, Kullmer O, Schrenk F, Henke W. 2004. A new3-D approach to determine functional morphology of cercopi-thecoid molars. Ann Anat 186:487–493.
Ungar P, M’Kirera F. 2003. A solution to the worn toothconundrum in primate functional anatomy. Proc Natl AcadSci USA 100:3874–3877.
Ungar P. 2004. Dental topography and diets of Australopithecusafarensis and early Homo. J Hum Evol 46:605–622.
Wood BA, Abbott SA. 1981. Analysis of mandibular molar mor-phology of early hominids. J Anat 132:454.
Wood BA, Abbott SA, Graham SH. 1983. Analysis of the dentalmorphology of Plio-Pleistocene hominds. II. Mandibularmolars—study of cups areas, fissure pattern and crosssectional shape of the crown. J Anat 137:287–314.
Wood BA, Engleman CA. 1988. Analysis of the dentalmorphology of Plio-Pleistocene hominds. V. Maxillary postca-nine tooth morphology. J Anat 161:1–35.
Wood BA, Xu Q. 1991. Variation in the Lufeng dental remains.J Hum Evol 20:291–311.
Zhao Z, Weiss KM, Stock DW. 2000. Development and evolutionof dentition patterns and their genetic basis. In: Teaford M,Smith MM, Ferguson M, editors. Development, function andevolution of teeth. Cambridge: Cambridge University Press.p 152–172.
454 L.J. HLUSKO ET AL.
American Journal of Physical Anthropology—DOI 10.1002/ajpa