Regularities and diversity in developmental pathways: Mother-infant relationships in hamadryas...
21
Regularities and Diversity in Developmental Pathways: Mother–Infant Relationships in Hamadryas Baboons Marı ´a Victoria Herna ´ndez-Lloreda Departamento de Metodologı ´a de las Ciencias del Comportamiento Facultad de Psicologı ´a Universidad Complutense de Madrid Campus de Somosaguas 28223 Madrid, Spain E-mail: [email protected] Fernando Colmenares Departamento de Psicobiologı ´a Facultad de Psicologı ´a Universidad Complutense de Madrid Campus de Somosaguas 28223 Madrid, Spain E-mail: [email protected] ABSTRACT: Change, stasis, stability, discontinuity, orderliness, and diversity are all potential characteristics of developmental systems. This study uses multilevel modeling to characterize the normative developmental pathways of the early social relationships of 23 mother–infant pairs embedded in a multilayered colony of hamadryas baboons (Papio hamadryas hamadryas). The relationships were assessed by means of 27 behavioral measures that were collected during 100– 220 focal sampling sessions per infant, from birth to 380 days of age (25 two-week age intervals). Seventy four percent of the behavioral measures exhibited an age- related pattern. Infant age, however, was not predictive of the rate of the behaviors relating to the management of mother–infant conflicts. This study provides empirical evidence that the development of mother–infant relationships may involve periods of change and stasis, overall orderliness, and diversity as well as canalization of developmental pathways. We believe that growth curve analysis can be useful to tackle various hot issues in the study of behavioral development. ß 2005 Wiley Periodicals, Inc. Dev Psychobiol 47: 297–317, 2005. Keywords: developmental pathways; growth curve analysis; change; regularities; diversity; mother–infant relationships; hamadryas baboon INTRODUCTION Living systems, whether they consist of cells, organs, whole organisms, or groups of individual organisms, undergo changes over their lifetimes. Understanding how they develop during ontogeny and why they follow the particular developmental trajectories they do pose a major challenge in developmental science and in evolutionary biology (Bateson & Martin, 2000; Bateson, 2001; Gould, 1977; Gottlieb, 1992; Oyama, 2000). Animal behavior researchers interested in unraveling the principles that account for the development of an individual’s behavior or the relationship within a two-partner (or higher order) social system have struggled to develop conceptual and quantitative tools capable of capturing, assessing, and measuring its crucial properties and of testing hypotheses that provide a meaningful account of the processes that drive the patterns of stability and change observed during ontogeny (Bateson, 1983, 2003; Blass, 1986, 1988; Bryk & Raudenbush, 1987; Butterworth & Bryant, 1990; Chalmers, 1987; Gottlieb, 1992, 2001; Hall & Oppen- heim, 1987; Immelmann, Barlow, Petrinovich, & Main, 1981; Lewkowicz & Lickliter, 2002; Michel & Moore, 1995; Oyama, 2000; Oyama, Griffiths, & Gray, 2001; Turkewitcz, 1992; Willett, 1988). The conceptual framework adopted here is based on the developmental systems view, laid down by evolution- ary biologists (Hoo, 1998; Hood, 1998; Lewontin, 1983; Oyama, 1982, 2000), psychobiologists and comparative psychologists (Gottlieb, 1992; Johnston & Gottlieb, 2000), and ethologists (Bateson & Martin, 2000; Bateson, Received 15 February 2004; Accepted 8 June 2005 Correspondence to: F. Colmenares Contract grant sponsor: MEyC (Spain) (postdoctoral fellowship to FC (1988–1991) Contract grant sponsor: MCyT (Spain) (to FC) (project grants) Contract grant numbers: PB98-0773, BSO2002-00161 Published online in Wiley InterScience (www.interscience.wiley.com). DOI 10.1002/dev.20104 ß 2005 Wiley Periodicals, Inc.
-
Upload
independent -
Category
Documents
-
view
0 -
download
0
Transcript of Regularities and diversity in developmental pathways: Mother-infant relationships in hamadryas...
Regularities and Diversity inDevelopmental Pathways:Mother–Infant Relationships inHamadryas Baboons
Marıa Victoria Hernandez-LloredaDepartamento de Metodologıa de las
Ciencias del ComportamientoFacultad de Psicologıa
Universidad Complutense de MadridCampus de Somosaguas
28223 Madrid, SpainE-mail: [email protected]
Fernando ColmenaresDepartamento de Psicobiologıa
Facultad de PsicologıaUniversidad Complutense de Madrid
Campus de Somosaguas28223 Madrid, Spain
E-mail: [email protected]
ABSTRACT: Change, stasis, stability, discontinuity, orderliness, and diversity areall potential characteristics of developmental systems. This study uses multilevelmodeling to characterize the normative developmental pathways of the early socialrelationships of 23 mother–infant pairs embedded in a multilayered colony ofhamadryas baboons (Papio hamadryas hamadryas). The relationships wereassessed by means of 27 behavioral measures that were collected during 100–220 focal sampling sessions per infant, from birth to 380 days of age (25 two-weekage intervals). Seventy four percent of the behavioral measures exhibited an age-related pattern. Infant age, however, was not predictive of the rate of the behaviorsrelating to the management of mother–infant conflicts. This study providesempirical evidence that the development of mother–infant relationships mayinvolve periods of change and stasis, overall orderliness, and diversity as well ascanalization of developmental pathways. We believe that growth curve analysis canbe useful to tackle various hot issues in the study of behavioral development.� 2005 Wiley Periodicals, Inc. Dev Psychobiol 47: 297–317, 2005.
Keywords: developmental pathways; growth curve analysis; change; regularities;diversity; mother–infant relationships; hamadryas baboon
INTRODUCTION
Living systems, whether they consist of cells, organs,
whole organisms, or groups of individual organisms,
undergo changes over their lifetimes. Understanding how
they develop during ontogeny and why they follow the
particular developmental trajectories they do pose a major
challenge in developmental science and in evolutionary
biology (Bateson & Martin, 2000; Bateson, 2001; Gould,
1977; Gottlieb, 1992; Oyama, 2000). Animal behavior
researchers interested in unraveling the principles that
account for the development of an individual’s behavior or
the relationship within a two-partner (or higher order)
social system have struggled to develop conceptual and
quantitative tools capable of capturing, assessing, and
measuring its crucial properties and of testing hypotheses
that provide a meaningful account of the processes that
drive the patterns of stability and change observed during
ontogeny (Bateson, 1983, 2003; Blass, 1986, 1988; Bryk
& Raudenbush, 1987; Butterworth & Bryant, 1990;
Chalmers, 1987; Gottlieb, 1992, 2001; Hall & Oppen-
heim, 1987; Immelmann, Barlow, Petrinovich, & Main,
1981; Lewkowicz & Lickliter, 2002; Michel & Moore,
1995; Oyama, 2000; Oyama, Griffiths, & Gray, 2001;
Turkewitcz, 1992; Willett, 1988).
The conceptual framework adopted here is based on
the developmental systems view, laid down by evolution-
ary biologists (Hoo, 1998; Hood, 1998; Lewontin, 1983;
Oyama, 1982, 2000), psychobiologists and comparative
psychologists (Gottlieb, 1992; Johnston & Gottlieb,
2000), and ethologists (Bateson & Martin, 2000; Bateson,
Received 15 February 2004; Accepted 8 June 2005Correspondence to: F. ColmenaresContract grant sponsor: MEyC (Spain) (postdoctoral fellowship to
FC (1988–1991)Contract grant sponsor: MCyT (Spain) (to FC) (project grants)Contract grant numbers: PB98-0773, BSO2002-00161Published online in Wiley InterScience
(www.interscience.wiley.com). DOI 10.1002/dev.20104
� 2005 Wiley Periodicals, Inc.
2003). This view emphasizes emergence at all levels of
organization as the outcome of constructive interactions
or coactions within and across levels. It also highlights the
hierarchical organization of developmental systems, the
interpenetration of genes, organisms, and their environ-
ments, and the dialectical relation between the multiple
interactants, which are constructed rather than fixed and
inherited separately.
The longitudinal approach to the study of behavioral
development involves repeated measurements on one or
several behaviors for the same sample of individuals over
a number of consecutive points in time (Martin & Bateson,
1993; Sackett, Sameroff, Cairns, & Suomi, 1981; Willett,
1988; Wohlwill, 1973). The resulting data structures are
inherently hierarchical, that is, each occasion of measure-
ment contributes to a subset of observations that are nested
within individuals, and, therefore, statistically dependent.
Conventional statistical methods, including regression
and ANOVA models, have a number of conceptual,
methodological, and statistical limitations and short-
comings (see, e.g., Bryk & Raudenbush, 1987, 1992;
Boyle & Willms, 2001; Hox & Kreft, 1994; Hernandez-
Lloreda, Colmenares, & Martınez-Arias, 2003; Michel,
2001; van der Leeden, 1998; Willett, 1988). The proper
analysis of such developmental data requires statistical
methods that take fully into account the multilevel struct-
ure of longitudinal data and which are flexible regarding
both the handling of unbalanced designs and the modeling
of covariance structures. One of these analysis techniques
is hierarchical linear modeling, variously labeled multi-
level models, random-coefficient models, mixed models,
and covariance components models (Bryk & Raudenbush,
1987, 1992; Goldstein, 2003; Raudenbush, 2001; Snijders
& Bosker, 1999; van der Leeden, 1998; Willett, 1988).
Growth curve analysis allows the estimation of a group’s
average developmental trajectory and each individual’s
developmental trajectory; it therefore allows an esti-
mation of the individual variation around the average
trajectory and the analysis of correlates and predictors of
individual differences in developmental pathways.
One of the circumstances that have contributed to
hinder the advance in our understanding of behavioral
and relationship development as it takes place in freely-
interacting socially-living animals is the paucity of
empirical data available on the ontogenetic trajectories
of known individuals within and across species. Some
taxa, such as, for example, primates, are long-lived
animals (Kappeler, Pereira, & van Schaik, 2003) and
adequate knowledge of an individual’s complete develop-
mental (life) history would ideally require the collection
of longitudinal observations spanning several decades. An
alternative research strategy, which has already proved
fruitful, is to focus on early relationships such as those
involving the mother and her infant, as they are known to
have long-lasting effects on the physiological and
psychological systems that regulate the infant’s beha-
vioral and social competence and on both partners’
biological fitness (Fairbanks, 1996, 2003; Hofer, 1987;
Kraemer, 1992; Maestripieri, 2003; Pryce, Martin, &
Skuse, 1995; Suomi, 1997; Suomi, Novak, & Well, 1996).
Thus, data on the first months of the development of an
infant’s relationship with his or her mother are available
for a number of primate species (e.g., Berman, 1984;
Deputte, 2000; Fairbanks, 1996, 2003; Maestripieri, 1994,
2003; Nash & Wheeler, 1982; Nicolson, 1987; Pereira &
Altmann, 1985).
The main goal of this study was to identify patterns in
the development of two-animal social systems by means
of multi-level modeling, a statistical methodology that, to
our knowledge, has not been previously used in this
context (see Hernandez-Lloreda et al., 2003; Hernandez-
Lloreda, Colmenares, & Martınez-Arias, 2004). The
study was conducted on 23 mother–infant pairs embed-
ded in a large, multilayered colony of hamadryas baboons
(Papio hamadryas hamadryas), and the data were colle-
cted longitudinally during the infants’ first year of life.
Although the findings are expected to contribute to the
knowledge of the natural history of the study species’
behavioral development, on which almost nothing is
known, we were primarily interested in using the data to
come to terms with key developmental issues of wider
theoretical interest. In particular, we wanted to explore the
nature of behavioral development, for example, the occur-
rence of age-related regularities and the extent of diversity
in individual developmental pathways. We believe that
having precise information on these general issues is a
crucial and necessary first step for formulating research
questions that can be specified more clearly and for testing
more refined and focused alternative hypotheses in the
future.
MATERIALS AND METHODS
Subjects and Housing
The subjects of this study were members of the colony of
hamadryas baboons (P. h. hamadryas) housed in the Madrid Zoo,
Spain (for details, see Colmenares & Gomendio, 1988). The
colony was established in June 1972 and was studied continuo-
usly until 2002 (Colmenares, 2004). The colony was housed in a
large compound consisting of an outdoor enclosure measuring
36 m-long, 26 m-wide, and 7 m-deep, and an attached indoor
area. The outdoor enclosure was terraced and contained several
climbing structures, a water-filled moat, and several islands.
Animals were fed once daily and running water was available ad
libitum. Animals could enter and leave the indoor rooms at will.
The social organization and mating system of the Madrid baboon
colony resemble those described for wild hamadryas baboons
298 Hernandez-Lloreda and Colmenares
(e.g., Kummer, 1984): multilevel social structure, one-male
reproductive units with and without ‘‘follower’’ males, harem
defence polygyny, serial polyandry, strong bonding between the
harem-holding males and their females and relatively weak
affiliative relationships among the harem females (Colmenares,
1992, 2004). The observational study reported here was conduc-
ted from August 1986 to February 1989, when the colony
consisted of 48–61 individuals, organized into five one-male
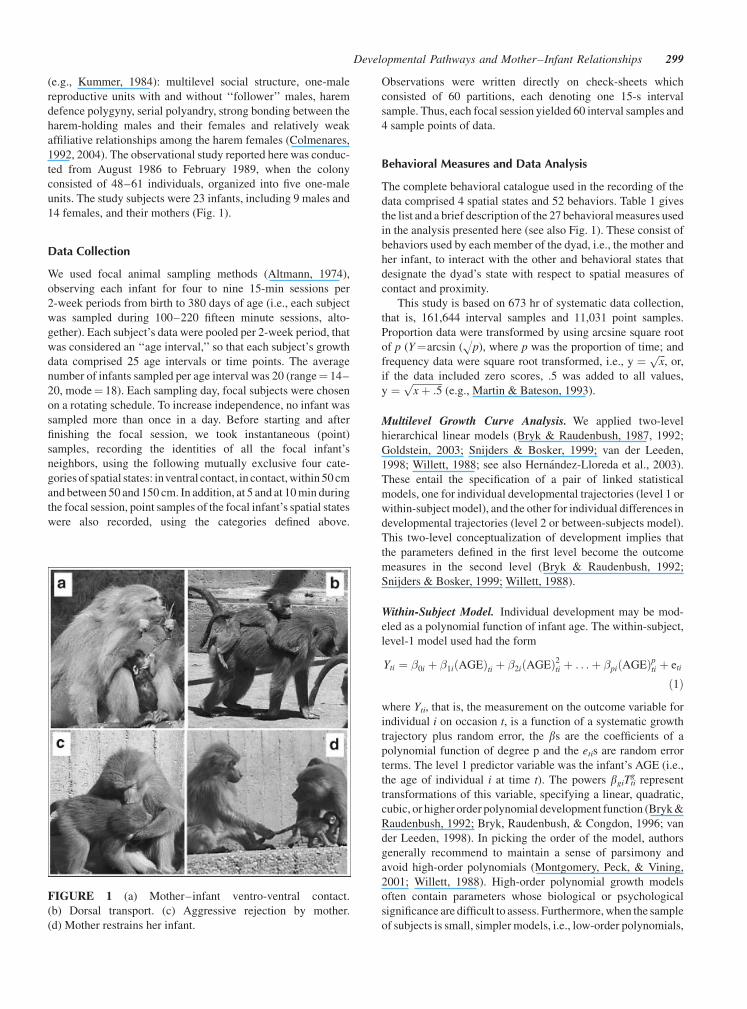
units. The study subjects were 23 infants, including 9 males and
14 females, and their mothers (Fig. 1).
Data Collection
We used focal animal sampling methods (Altmann, 1974),
observing each infant for four to nine 15-min sessions per
2-week periods from birth to 380 days of age (i.e., each subject
was sampled during 100–220 fifteen minute sessions, alto-
gether). Each subject’s data were pooled per 2-week period, that
was considered an ‘‘age interval,’’ so that each subject’s growth
data comprised 25 age intervals or time points. The average
number of infants sampled per age interval was 20 (range¼ 14–
20, mode¼ 18). Each sampling day, focal subjects were chosen
on a rotating schedule. To increase independence, no infant was
sampled more than once in a day. Before starting and after
finishing the focal session, we took instantaneous (point)
samples, recording the identities of all the focal infant’s
neighbors, using the following mutually exclusive four cate-
gories of spatial states: inventral contact, in contact, within 50 cm
and between 50 and 150 cm. In addition, at 5 and at 10 min during
the focal session, point samples of the focal infant’s spatial states
were also recorded, using the categories defined above.
Observations were written directly on check-sheets which
consisted of 60 partitions, each denoting one 15-s interval
sample. Thus, each focal session yielded 60 interval samples and
4 sample points of data.
Behavioral Measures and Data Analysis
The complete behavioral catalogue used in the recording of the
data comprised 4 spatial states and 52 behaviors. Table 1 gives
the list and a brief description of the 27 behavioral measures used
in the analysis presented here (see also Fig. 1). These consist of
behaviors used by each member of the dyad, i.e., the mother and
her infant, to interact with the other and behavioral states that
designate the dyad’s state with respect to spatial measures of
contact and proximity.
This study is based on 673 hr of systematic data collection,
that is, 161,644 interval samples and 11,031 point samples.
Proportion data were transformed by using arcsine square root
of p (Y¼arcsin (Hp), where p was the proportion of time; and
frequency data were square root transformed, i.e., y ¼ffiffiffi
xp
, or,
if the data included zero scores, .5 was added to all values,
y ¼ffiffiffiffiffiffiffiffiffiffiffiffi
x þ :5p
(e.g., Martin & Bateson, 1993).
Multilevel Growth Curve Analysis. We applied two-level
hierarchical linear models (Bryk & Raudenbush, 1987, 1992;
Goldstein, 2003; Snijders & Bosker, 1999; van der Leeden,
1998; Willett, 1988; see also Hernandez-Lloreda et al., 2003).
These entail the specification of a pair of linked statistical
models, one for individual developmental trajectories (level 1 or
within-subject model), and the other for individual differences in
developmental trajectories (level 2 or between-subjects model).
This two-level conceptualization of development implies that
the parameters defined in the first level become the outcome
measures in the second level (Bryk & Raudenbush, 1992;
Snijders & Bosker, 1999; Willett, 1988).
Within-Subject Model. Individual development may be mod-
eled as a polynomial function of infant age. The within-subject,
level-1 model used had the form
Yti ¼ �0i þ �1iðAGEÞti þ �2iðAGEÞ2ti þ . . .þ �piðAGEÞp
ti þ eti
ð1Þ
where Yti, that is, the measurement on the outcome variable for
individual i on occasion t, is a function of a systematic growth
trajectory plus random error, the bs are the coefficients of a
polynomial function of degree p and the etis are random error
terms. The level 1 predictor variable was the infant’s AGE (i.e.,
the age of individual i at time t). The powers bgiTtig represent
transformations of this variable, specifying a linear, quadratic,
cubic, or higher order polynomial development function (Bryk &
Raudenbush, 1992; Bryk, Raudenbush, & Congdon, 1996; van
der Leeden, 1998). In picking the order of the model, authors
generally recommend to maintain a sense of parsimony and
avoid high-order polynomials (Montgomery, Peck, & Vining,
2001; Willett, 1988). High-order polynomial growth models
often contain parameters whose biological or psychological
significance are difficult to assess. Furthermore, when the sample
of subjects is small, simpler models, i.e., low-order polynomials,
FIGURE 1 (a) Mother–infant ventro-ventral contact.
(b) Dorsal transport. (c) Aggressive rejection by mother.
(d) Mother restrains her infant.
Developmental Pathways and Mother–Infant Relationships 299
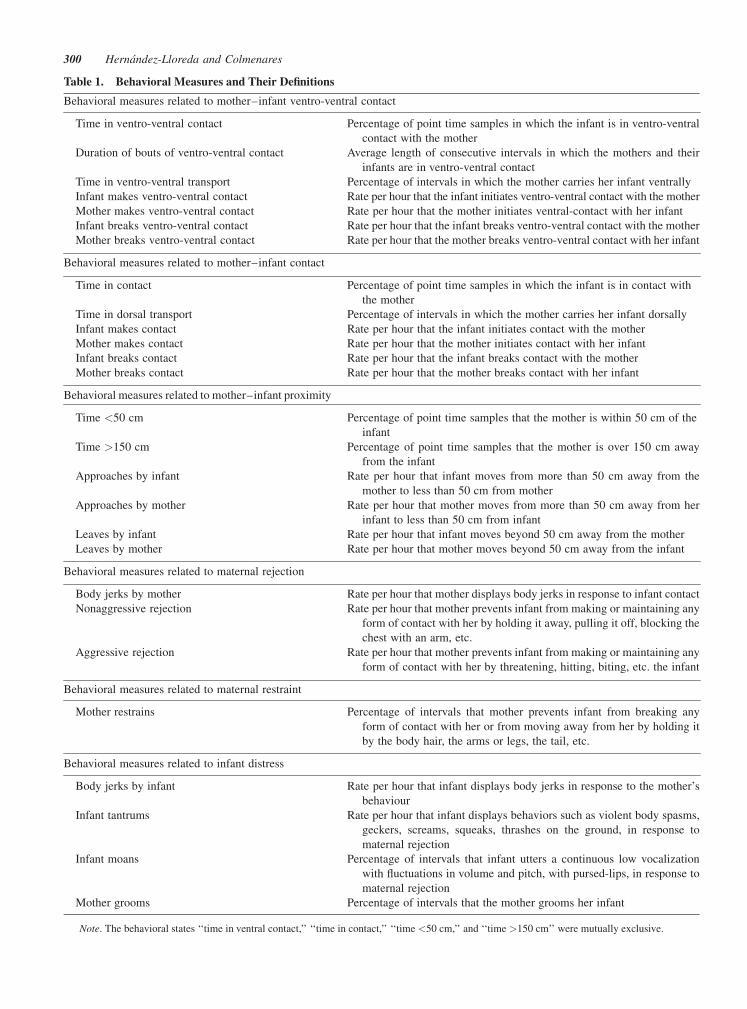
Table 1. Behavioral Measures and Their Definitions
Behavioral measures related to mother–infant ventro-ventral contact
Time in ventro-ventral contact Percentage of point time samples in which the infant is in ventro-ventral
contact with the mother
Duration of bouts of ventro-ventral contact Average length of consecutive intervals in which the mothers and their
infants are in ventro-ventral contact
Time in ventro-ventral transport Percentage of intervals in which the mother carries her infant ventrally
Infant makes ventro-ventral contact Rate per hour that the infant initiates ventro-ventral contact with the mother
Mother makes ventro-ventral contact Rate per hour that the mother initiates ventral-contact with her infant
Infant breaks ventro-ventral contact Rate per hour that the infant breaks ventro-ventral contact with the mother
Mother breaks ventro-ventral contact Rate per hour that the mother breaks ventro-ventral contact with her infant
Behavioral measures related to mother–infant contact
Time in contact Percentage of point time samples in which the infant is in contact with
the mother
Time in dorsal transport Percentage of intervals in which the mother carries her infant dorsally
Infant makes contact Rate per hour that the infant initiates contact with the mother
Mother makes contact Rate per hour that the mother initiates contact with her infant
Infant breaks contact Rate per hour that the infant breaks contact with the mother
Mother breaks contact Rate per hour that the mother breaks contact with her infant
Behavioral measures related to mother–infant proximity
Time <50 cm Percentage of point time samples that the mother is within 50 cm of the
infant
Time >150 cm Percentage of point time samples that the mother is over 150 cm away
from the infant
Approaches by infant Rate per hour that infant moves from more than 50 cm away from the
mother to less than 50 cm from mother
Approaches by mother Rate per hour that mother moves from more than 50 cm away from her
infant to less than 50 cm from infant
Leaves by infant Rate per hour that infant moves beyond 50 cm away from the mother
Leaves by mother Rate per hour that mother moves beyond 50 cm away from the infant
Behavioral measures related to maternal rejection
Body jerks by mother Rate per hour that mother displays body jerks in response to infant contact
Nonaggressive rejection Rate per hour that mother prevents infant from making or maintaining any
form of contact with her by holding it away, pulling it off, blocking the
chest with an arm, etc.
Aggressive rejection Rate per hour that mother prevents infant from making or maintaining any
form of contact with her by threatening, hitting, biting, etc. the infant
Behavioral measures related to maternal restraint
Mother restrains Percentage of intervals that mother prevents infant from breaking any
form of contact with her or from moving away from her by holding it
by the body hair, the arms or legs, the tail, etc.
Behavioral measures related to infant distress
Body jerks by infant Rate per hour that infant displays body jerks in response to the mother’s
behaviour
Infant tantrums Rate per hour that infant displays behaviors such as violent body spasms,
geckers, screams, squeaks, thrashes on the ground, in response to
maternal rejection
Infant moans Percentage of intervals that infant utters a continuous low vocalization
with fluctuations in volume and pitch, with pursed-lips, in response to
maternal rejection
Mother grooms Percentage of intervals that the mother grooms her infant
Note. The behavioral states ‘‘time in ventral contact,’’ ‘‘time in contact,’’ ‘‘time <50 cm,’’ and ‘‘time >150 cm’’ were mutually exclusive.
300 Hernandez-Lloreda and Colmenares
are more efficient than complex ones because the latter tend to
vary more across samples (Zucchini, 2000). Thus, we chose the
model that provided the best fit, but we stopped at polynomials of
third order.
With the within-subject model described in Equation 1 we
tested the hypothesis that the status of the various behavioral
measures analyzed was a function of the infant’s age.
Between-Subjects Model. A key feature of Equation 1 is the
assumption that the individual growth parameters (i.e. the bs)
vary across subjects. The between-subjects model represents the
observed heterogeneity in individual development trajectories.
A between-subjects model, with simple random variation in the
individual development parameters across the group, could be:
�0i ¼ �00 þ u0i
�1i ¼ �10 þ u1i
..
.
�pi ¼ �p0 þ upi
ð2Þ
where the parameters g00, g10, . . . ,gp0 are known as fixed effects,
and represent the average developmental trajectory over all
individuals. The u0i, u1i, . . . ,upi are random error components
denoting the departures of b0i, b1i, . . . ,bpi from these g00,
g10, . . . ,gp0 coefficients for each individual i. This level 2 model
of simple random variation is called an unconditional model
since no level 2 predictors for any of the b parameters have been
introduced (Bryk & Raudenbush, 1992; van der Leeden, 1998).
More elaborate between-subject models can be developed if one
or several level 2 predictor variables are added to the model to try
to explain part of the variability of the level 1 b coefficients. This
further step in the analysis would take us beyond the scope of this
paper, though. Nevertheless, an analysis of predictor variables
that account for the patterns of inter-individual variation
observed has been presented elsewhere (Hernandez-Lloreda &
Colmenares, 2005).
Proportion of Variance Explained. In a hierarchical linear
model there is more than one level at which the explained
variance must be determined (Snijders & Bosker, 1999). In a
two-level model, the within-unit variance explained (i.e., R12) is a
measure of how well the independent variables in the model
explain the outcome variable, and the between-unit measure
(i.e., R22) is the amount of variance between level 2 units that is
accounted for by the predictors in the model. In the model
presented here, the predictor variable was the infant’s age, thus
R12 represents the proportional reduction of error for predicting
an individual’s outcome at any given point in time by infant age
and R22 denotes the proportional reduction of error for predicting
an individual’s mean over time by infant age. To these measures
of explained variance, only the fixed effects contribute. To
calculate R12 and R2
2 we used Snijders’ and Bosker’s formulae
(Snijders & Bosker, 1999) for models with random intercepts
only. To estimate R12 and R2
2 in models with random slopes we re-
estimate the models as random intercept models with the same
fixed parts (omitting the random slopes). These yield values that
are very close to the values obtained for the random slopes
models (Snijders & Bosker, 1999).
Assumptions. For the level 1 random terms (eti), it is assumed
that they are independent and normally distributed with zero
mean and variance s2. The level 2 random terms are assumed to
have a joint normal distribution with zero mean, variance tqq and
covariance tqq0 for any pair of random effects q and q0. (It is
important to remark that multilevel models are very flexible
regarding the data design and allow modeling of a broad array of
covariance structures, see, for example, Bryk and Raudenbush
(1987, 1992)).
Testing the Assumptions. We checked the tenability of the
assumptions underlying the model by means of analysis of the
residuals (Bryk et al., 1996). As regards the assumptions about
level 1 random effects, homogeneity of variances was tested
using the H statistic (Bryk & Raudenbush, 1992) and normality
was checked by computing separate probability plots for each
i unit (Bryk & Raudenbush, 1992). Normality at level 2 was
checked by using the Mahalanobis Distance measure (Bryk &
Raudenbush, 1992). For each i unit we plotted the observed
distance statistics against the expected order statistics. The
assumptions were met by the data, except in the case of four
behavioral measures, i.e., mother makes ventro-ventral contact,
mother makes contact, body jerks by mother, and infant breaks
ventro-ventral contact, in which the level 1 homogeneity of
variances assumption was violated. We re-analyzed these
behavioral measures by means of a nonlinear (Poisson) model;
however, the results did not differ from those obtained with
hierarchical linear regression modeling. Thus, we have reported
the results of the latter model.
To run the analyses we used the software packages HLM for
Windows, versions 4.01 and 6.0 (Bryk et al., 1996; Raudenbush,
Bryk, Cheong, & Congdon, 2004), and MlwiN version 1.00
(Goldstein et al., 1998) and SPSS version 11.0.
RESULTS
Average Developmental Trajectories
A large proportion of the behavioral measures analyzed
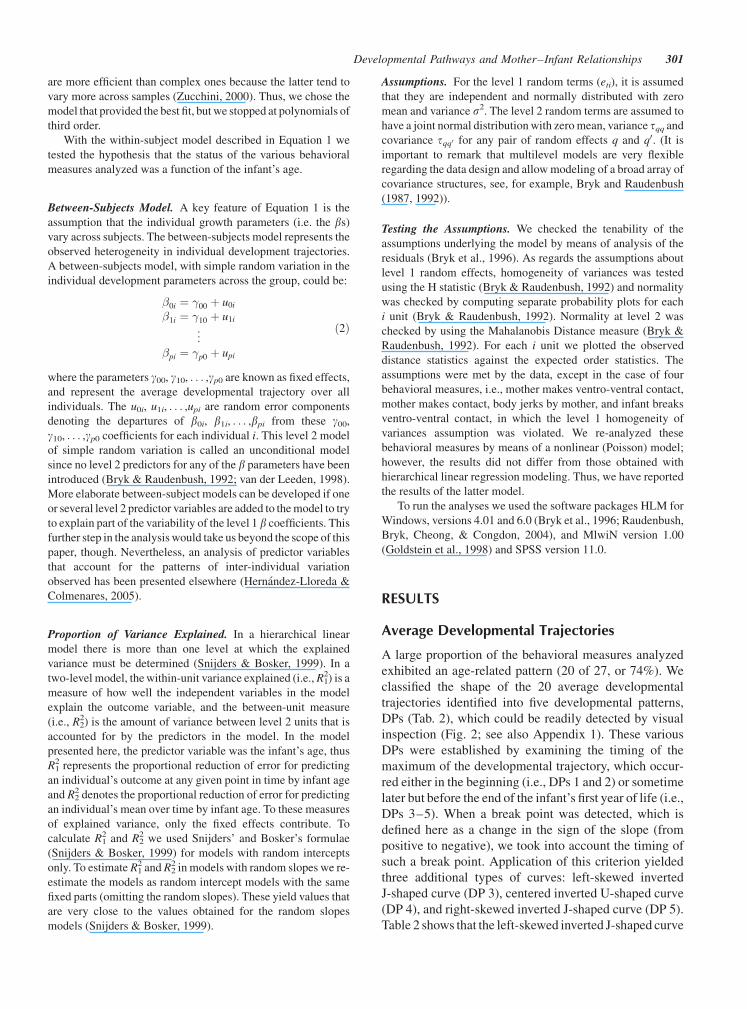
exhibited an age-related pattern (20 of 27, or 74%). We
classified the shape of the 20 average developmental
trajectories identified into five developmental patterns,
DPs (Tab. 2), which could be readily detected by visual
inspection (Fig. 2; see also Appendix 1). These various
DPs were established by examining the timing of the
maximum of the developmental trajectory, which occur-
red either in the beginning (i.e., DPs 1 and 2) or sometime
later but before the end of the infant’s first year of life (i.e.,
DPs 3–5). When a break point was detected, which is
defined here as a change in the sign of the slope (from
positive to negative), we took into account the timing of
such a break point. Application of this criterion yielded
three additional types of curves: left-skewed inverted
J-shaped curve (DP 3), centered inverted U-shaped curve
(DP 4), and right-skewed inverted J-shaped curve (DP 5).
Table 2 shows that the left-skewed inverted J-shaped curve
Developmental Pathways and Mother–Infant Relationships 301
(i.e., DP 3) was the most common shape of developmental
trajectory for the behavioral measures that followed an
age-related pattern (11 of 20, or 55%) and that the second
most common developmental trajectory was the one
classified as DP 1 (5 of 20, or 25%), in which the status of
the behavior was a decreasing function of infant age, that
is, the maximum was reached in the first age interval (i.e.,
at birth) and there was no plateau thereafter (see Tab. 2,
DP2). Appendix 2 shows the final unconditional models
fitted to each of the behavioral measures and presents the
results of the significance tests for the fixed effects of the
models (i.e., mean initial status, mean first-order para-
meter, mean second-order parameter, and mean third-
order parameter).
Developmental Pattern 1 (DP 1). This includes five
behavioral measures that peaked in the very early stages of
the infant’s life and then exhibited a pronounced decline in
their status as a function of infant age (Tab. 2). The overall
values of R12 and R2
2 tend to be fairly high (.41� .22 and
Table 2. Developmental Patterns (DPs), Behavioral Measures, and Proportion of Variance Explained by Infant Age
(First Year of Life)
Developmental pattern Behavioral measure s2 explained
Time in ventro-ventral contact R12¼ .61; R2
2¼ .62
Time in ventro-ventral transport R12¼ .69; R2
2¼ .61
Mother makes ventro-ventral contact R12¼ .33; R2
2¼ .36
Body jerks by mother R12¼ .22; R2
2¼ .27
Mother grooms R12¼ .15; R2
2¼ .05
Duration of bouts of ventro-ventral contact R12¼ .36; R2
2¼ .30
Time in dorsal transport R12¼ .40; R2
2¼ .12
Time in contact R12¼ .96; R2
2¼ .97
Time <50 cm R12¼ .20; R2
2¼ .02
Infant makes ventro-ventral contact R12¼ .31; R2
2¼ .06
Infant makes contact R12¼ .39; R2
2¼ .08
Infant breaks ventro-ventral contact R12¼ .47; R2
2¼ .26
Infant breaks contact R12¼ .36; R2
2¼ .03
Leaves by infant R12¼ .41; R2
2¼ .09
Approaches by infant R12¼ .39; R2
2¼ .15
Mother makes contact R12¼ .21; R2
2¼ .13
Approaches by mother R12¼ .22; R2
2¼ .07
Mother breaks contact R12¼ .09; R2
2¼ .00
Leaves by mother R12¼ .25; R2
2¼ .07
Time >150 cm R12¼ .59; R2
2¼ .61
302 Hernandez-Lloreda and Colmenares
.39� .24, respectively), especially for those measures
denoting the dyad’s overall level of ventro-ventral contact
time (i.e., time in ventro-ventral contact and in ventral
transport). This indicates that the age of the infant
represents a good predictor of the changes in the status of
these behaviors across time. Interestingly, in addition to
the two states of ventral contact already mentioned, this
pattern is followed by three behaviors initiated by the
mother (i.e., mother makes ventro-ventral contact, mother
grooms, and mother displays body jerks).
Developmental Pattern 2 (DP 2). This pattern is
followed by only one behavior pattern which is, in fact,
a behavioral state: the average duration of the bouts of
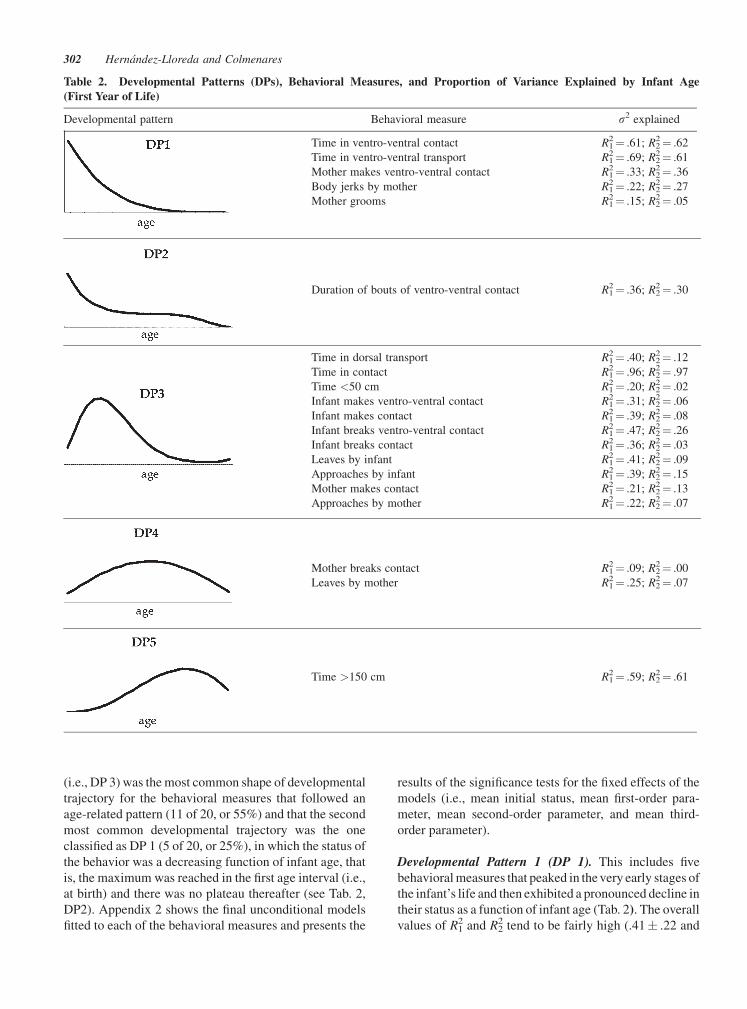
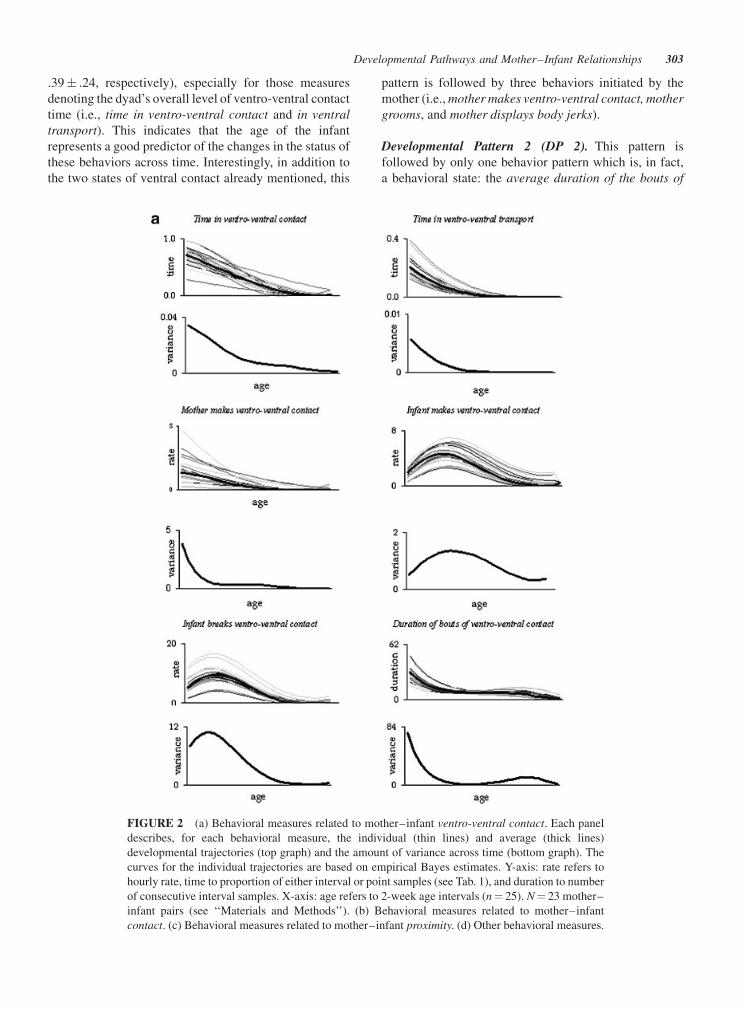
FIGURE 2 (a) Behavioral measures related to mother–infant ventro-ventral contact. Each panel
describes, for each behavioral measure, the individual (thin lines) and average (thick lines)
developmental trajectories (top graph) and the amount of variance across time (bottom graph). The
curves for the individual trajectories are based on empirical Bayes estimates. Y-axis: rate refers to
hourly rate, time to proportion of either interval or point samples (see Tab. 1), and duration to number
of consecutive interval samples. X-axis: age refers to 2-week age intervals (n¼ 25). N¼ 23 mother–
infant pairs (see ‘‘Materials and Methods’’). (b) Behavioral measures related to mother–infant
contact. (c) Behavioral measures related to mother–infant proximity. (d) Other behavioral measures.
Developmental Pathways and Mother–Infant Relationships 303
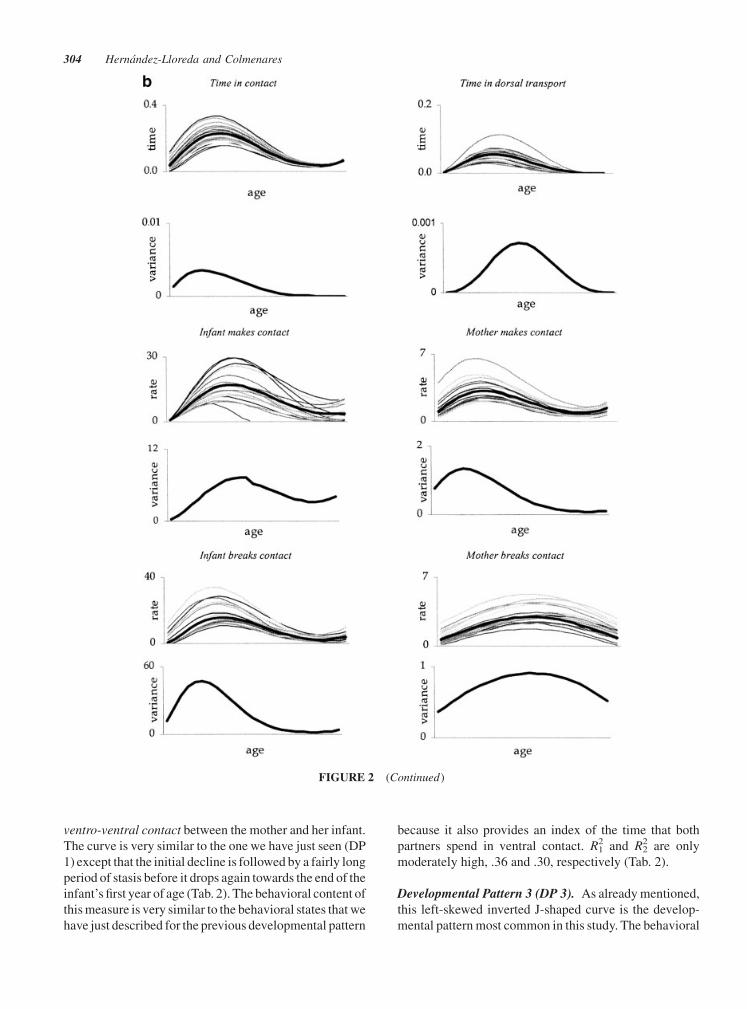
ventro-ventral contact between the mother and her infant.
The curve is very similar to the one we have just seen (DP
1) except that the initial decline is followed by a fairly long
period of stasis before it drops again towards the end of the
infant’s first year of age (Tab. 2). The behavioral content of
this measure is very similar to the behavioral states that we
have just described for the previous developmental pattern
because it also provides an index of the time that both
partners spend in ventral contact. R12 and R2
2 are only
moderately high, .36 and .30, respectively (Tab. 2).
Developmental Pattern 3 (DP 3). As already mentioned,
this left-skewed inverted J-shaped curve is the develop-
mental pattern most common in this study. The behavioral
FIGURE 2 (Continued)
304 Hernandez-Lloreda and Colmenares
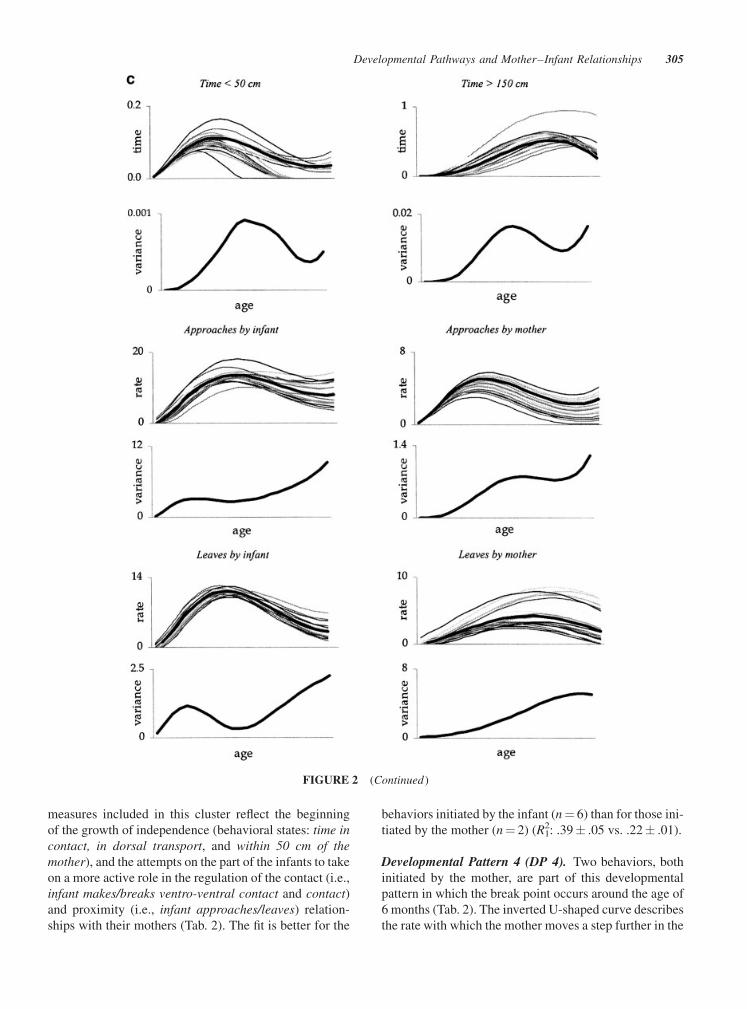
measures included in this cluster reflect the beginning
of the growth of independence (behavioral states: time in
contact, in dorsal transport, and within 50 cm of the
mother), and the attempts on the part of the infants to take
on a more active role in the regulation of the contact (i.e.,
infant makes/breaks ventro-ventral contact and contact)
and proximity (i.e., infant approaches/leaves) relation-
ships with their mothers (Tab. 2). The fit is better for the
behaviors initiated by the infant (n¼ 6) than for those ini-
tiated by the mother (n¼ 2) (R12: .39� .05 vs. .22� .01).
Developmental Pattern 4 (DP 4). Two behaviors, both
initiated by the mother, are part of this developmental
pattern in which the break point occurs around the age of
6 months (Tab. 2). The inverted U-shaped curve describes
the rate with which the mother moves a step further in the
FIGURE 2 (Continued)
Developmental Pathways and Mother–Infant Relationships 305
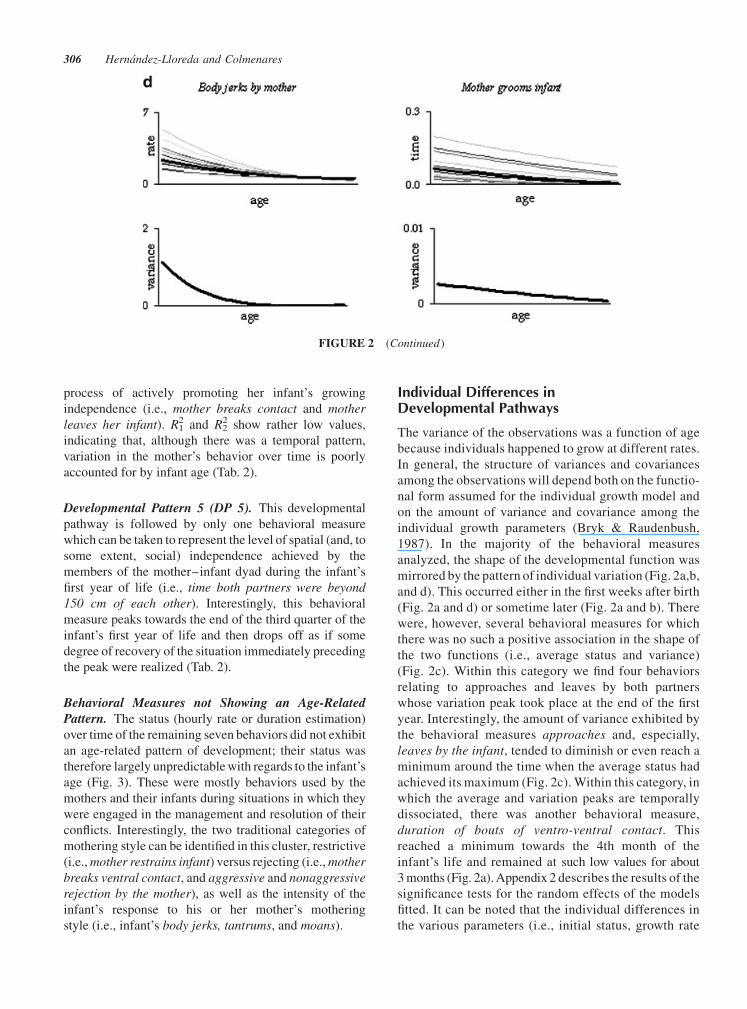
process of actively promoting her infant’s growing
independence (i.e., mother breaks contact and mother
leaves her infant). R12 and R2
2 show rather low values,
indicating that, although there was a temporal pattern,
variation in the mother’s behavior over time is poorly
accounted for by infant age (Tab. 2).
Developmental Pattern 5 (DP 5). This developmental
pathway is followed by only one behavioral measure
which can be taken to represent the level of spatial (and, to
some extent, social) independence achieved by the
members of the mother–infant dyad during the infant’s
first year of life (i.e., time both partners were beyond
150 cm of each other). Interestingly, this behavioral
measure peaks towards the end of the third quarter of the
infant’s first year of life and then drops off as if some
degree of recovery of the situation immediately preceding
the peak were realized (Tab. 2).
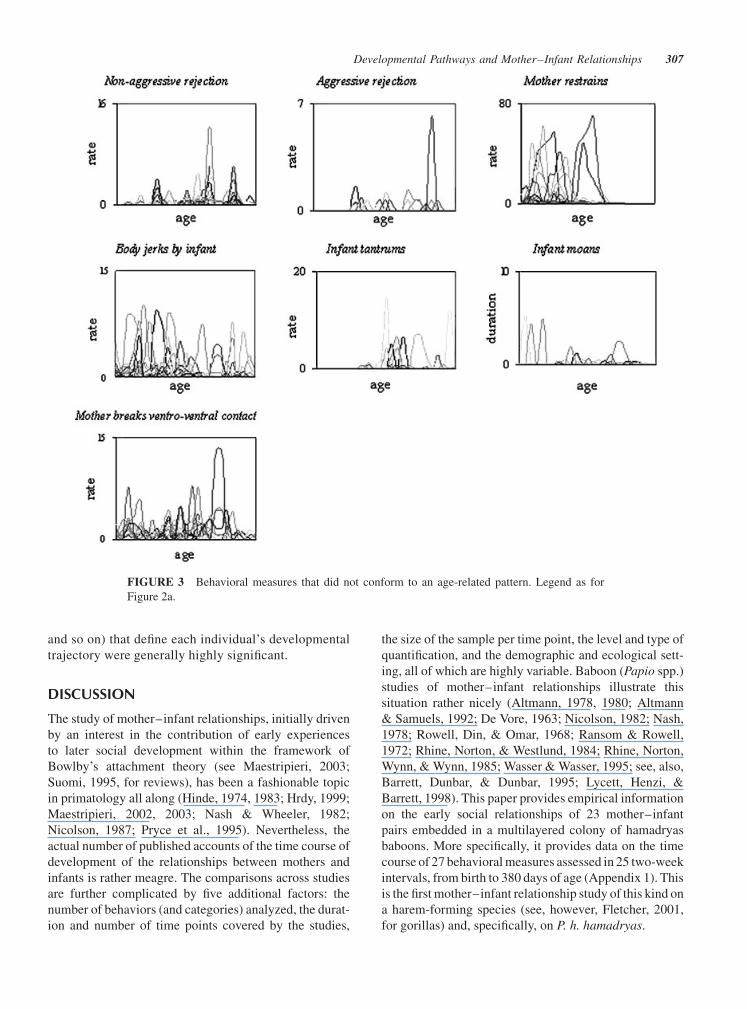
Behavioral Measures not Showing an Age-RelatedPattern. The status (hourly rate or duration estimation)
over time of the remaining seven behaviors did not exhibit
an age-related pattern of development; their status was
therefore largely unpredictable with regards to the infant’s
age (Fig. 3). These were mostly behaviors used by the
mothers and their infants during situations in which they
were engaged in the management and resolution of their
conflicts. Interestingly, the two traditional categories of
mothering style can be identified in this cluster, restrictive
(i.e., mother restrains infant) versus rejecting (i.e., mother
breaks ventral contact, and aggressive and nonaggressive
rejection by the mother), as well as the intensity of the
infant’s response to his or her mother’s mothering
style (i.e., infant’s body jerks, tantrums, and moans).
Individual Differences inDevelopmental Pathways
The variance of the observations was a function of age
because individuals happened to grow at different rates.
In general, the structure of variances and covariances
among the observations will depend both on the functio-
nal form assumed for the individual growth model and
on the amount of variance and covariance among the
individual growth parameters (Bryk & Raudenbush,
1987). In the majority of the behavioral measures
analyzed, the shape of the developmental function was
mirrored by the pattern of individual variation (Fig. 2a,b,
and d). This occurred either in the first weeks after birth
(Fig. 2a and d) or sometime later (Fig. 2a and b). There
were, however, several behavioral measures for which
there was no such a positive association in the shape of
the two functions (i.e., average status and variance)
(Fig. 2c). Within this category we find four behaviors
relating to approaches and leaves by both partners
whose variation peak took place at the end of the first
year. Interestingly, the amount of variance exhibited by
the behavioral measures approaches and, especially,
leaves by the infant, tended to diminish or even reach a
minimum around the time when the average status had
achieved its maximum (Fig. 2c). Within this category, in
which the average and variation peaks are temporally
dissociated, there was another behavioral measure,
duration of bouts of ventro-ventral contact. This
reached a minimum towards the 4th month of the
infant’s life and remained at such low values for about
3 months (Fig. 2a). Appendix 2 describes the results of the
significance tests for the random effects of the models
fitted. It can be noted that the individual differences in
the various parameters (i.e., initial status, growth rate
FIGURE 2 (Continued)
306 Hernandez-Lloreda and Colmenares
and so on) that define each individual’s developmental
trajectory were generally highly significant.
DISCUSSION
The study of mother–infant relationships, initially driven
by an interest in the contribution of early experiences
to later social development within the framework of
Bowlby’s attachment theory (see Maestripieri, 2003;
Suomi, 1995, for reviews), has been a fashionable topic
in primatology all along (Hinde, 1974, 1983; Hrdy, 1999;
Maestripieri, 2002, 2003; Nash & Wheeler, 1982;
Nicolson, 1987; Pryce et al., 1995). Nevertheless, the
actual number of published accounts of the time course of
development of the relationships between mothers and
infants is rather meagre. The comparisons across studies
are further complicated by five additional factors: the
number of behaviors (and categories) analyzed, the durat-
ion and number of time points covered by the studies,
the size of the sample per time point, the level and type of
quantification, and the demographic and ecological sett-
ing, all of which are highly variable. Baboon (Papio spp.)
studies of mother–infant relationships illustrate this
situation rather nicely (Altmann, 1978, 1980; Altmann
& Samuels, 1992; De Vore, 1963; Nicolson, 1982; Nash,
1978; Rowell, Din, & Omar, 1968; Ransom & Rowell,
1972; Rhine, Norton, & Westlund, 1984; Rhine, Norton,
Wynn, & Wynn, 1985; Wasser & Wasser, 1995; see, also,
Barrett, Dunbar, & Dunbar, 1995; Lycett, Henzi, &
Barrett, 1998). This paper provides empirical information
on the early social relationships of 23 mother–infant
pairs embedded in a multilayered colony of hamadryas
baboons. More specifically, it provides data on the time
course of 27 behavioral measures assessed in 25 two-week
intervals, from birth to 380 days of age (Appendix 1). This
is the first mother–infant relationship study of this kind on
a harem-forming species (see, however, Fletcher, 2001,
for gorillas) and, specifically, on P. h. hamadryas.
FIGURE 3 Behavioral measures that did not conform to an age-related pattern. Legend as for
Figure 2a.
Developmental Pathways and Mother–Infant Relationships 307
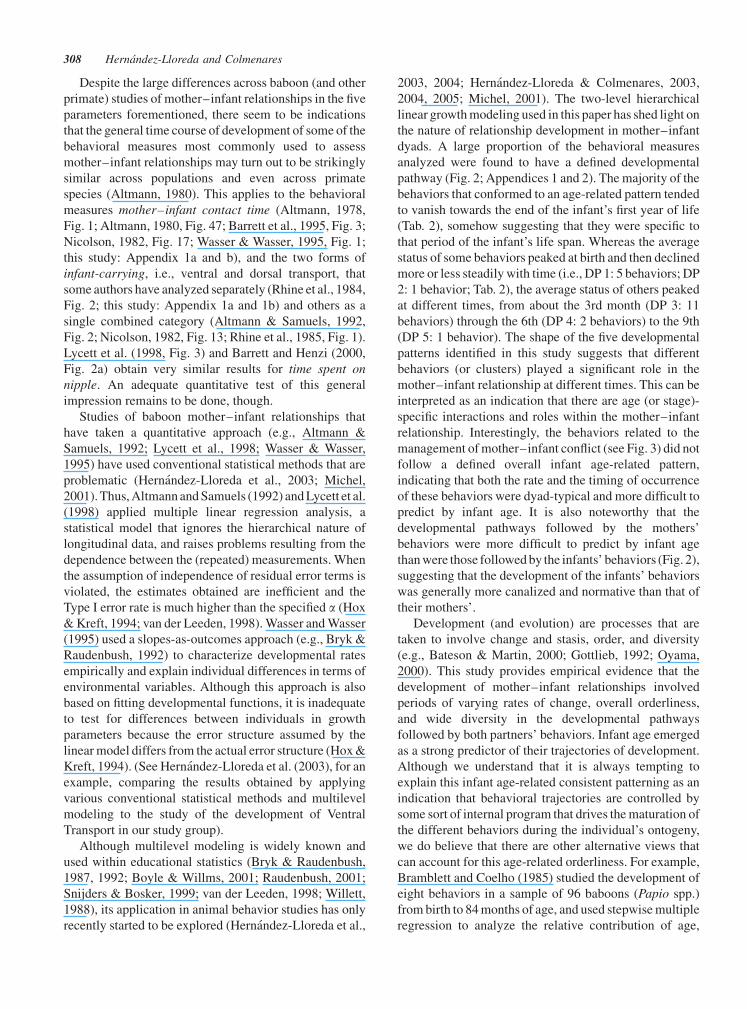
Despite the large differences across baboon (and other
primate) studies of mother–infant relationships in the five
parameters forementioned, there seem to be indications
that the general time course of development of some of the
behavioral measures most commonly used to assess
mother–infant relationships may turn out to be strikingly
similar across populations and even across primate
species (Altmann, 1980). This applies to the behavioral
measures mother–infant contact time (Altmann, 1978,
Fig. 1; Altmann, 1980, Fig. 47; Barrett et al., 1995, Fig. 3;
Nicolson, 1982, Fig. 17; Wasser & Wasser, 1995, Fig. 1;
this study: Appendix 1a and b), and the two forms of
infant-carrying, i.e., ventral and dorsal transport, that
some authors have analyzed separately (Rhine et al., 1984,
Fig. 2; this study: Appendix 1a and 1b) and others as a
single combined category (Altmann & Samuels, 1992,
Fig. 2; Nicolson, 1982, Fig. 13; Rhine et al., 1985, Fig. 1).
Lycett et al. (1998, Fig. 3) and Barrett and Henzi (2000,
Fig. 2a) obtain very similar results for time spent on
nipple. An adequate quantitative test of this general
impression remains to be done, though.
Studies of baboon mother–infant relationships that
have taken a quantitative approach (e.g., Altmann &
Samuels, 1992; Lycett et al., 1998; Wasser & Wasser,
1995) have used conventional statistical methods that are
problematic (Hernandez-Lloreda et al., 2003; Michel,
2001). Thus, Altmann and Samuels (1992) and Lycett et al.
(1998) applied multiple linear regression analysis, a
statistical model that ignores the hierarchical nature of
longitudinal data, and raises problems resulting from the
dependence between the (repeated) measurements. When
the assumption of independence of residual error terms is
violated, the estimates obtained are inefficient and the
Type I error rate is much higher than the specified a (Hox
& Kreft, 1994; van der Leeden, 1998). Wasser and Wasser
(1995) used a slopes-as-outcomes approach (e.g., Bryk &
Raudenbush, 1992) to characterize developmental rates
empirically and explain individual differences in terms of
environmental variables. Although this approach is also
based on fitting developmental functions, it is inadequate
to test for differences between individuals in growth
parameters because the error structure assumed by the
linear model differs from the actual error structure (Hox &
Kreft, 1994). (See Hernandez-Lloreda et al. (2003), for an
example, comparing the results obtained by applying
various conventional statistical methods and multilevel
modeling to the study of the development of Ventral
Transport in our study group).
Although multilevel modeling is widely known and
used within educational statistics (Bryk & Raudenbush,
1987, 1992; Boyle & Willms, 2001; Raudenbush, 2001;
Snijders & Bosker, 1999; van der Leeden, 1998; Willett,
1988), its application in animal behavior studies has only
recently started to be explored (Hernandez-Lloreda et al.,
2003, 2004; Hernandez-Lloreda & Colmenares, 2003,
2004, 2005; Michel, 2001). The two-level hierarchical
linear growth modeling used in this paper has shed light on
the nature of relationship development in mother–infant
dyads. A large proportion of the behavioral measures
analyzed were found to have a defined developmental
pathway (Fig. 2; Appendices 1 and 2). The majority of the
behaviors that conformed to an age-related pattern tended
to vanish towards the end of the infant’s first year of life
(Tab. 2), somehow suggesting that they were specific to
that period of the infant’s life span. Whereas the average
status of some behaviors peaked at birth and then declined
more or less steadily with time (i.e., DP 1: 5 behaviors; DP
2: 1 behavior; Tab. 2), the average status of others peaked
at different times, from about the 3rd month (DP 3: 11
behaviors) through the 6th (DP 4: 2 behaviors) to the 9th
(DP 5: 1 behavior). The shape of the five developmental
patterns identified in this study suggests that different
behaviors (or clusters) played a significant role in the
mother–infant relationship at different times. This can be
interpreted as an indication that there are age (or stage)-
specific interactions and roles within the mother–infant
relationship. Interestingly, the behaviors related to the
management of mother–infant conflict (see Fig. 3) did not
follow a defined overall infant age-related pattern,
indicating that both the rate and the timing of occurrence
of these behaviors were dyad-typical and more difficult to
predict by infant age. It is also noteworthy that the
developmental pathways followed by the mothers’
behaviors were more difficult to predict by infant age
than were those followed by the infants’ behaviors (Fig. 2),
suggesting that the development of the infants’ behaviors
was generally more canalized and normative than that of
their mothers’.
Development (and evolution) are processes that are
taken to involve change and stasis, order, and diversity
(e.g., Bateson & Martin, 2000; Gottlieb, 1992; Oyama,
2000). This study provides empirical evidence that the
development of mother–infant relationships involved
periods of varying rates of change, overall orderliness,
and wide diversity in the developmental pathways
followed by both partners’ behaviors. Infant age emerged
as a strong predictor of their trajectories of development.
Although we understand that it is always tempting to
explain this infant age-related consistent patterning as an
indication that behavioral trajectories are controlled by
some sort of internal program that drives the maturation of
the different behaviors during the individual’s ontogeny,
we do believe that there are other alternative views that
can account for this age-related orderliness. For example,
Bramblett and Coelho (1985) studied the development of
eight behaviors in a sample of 96 baboons (Papio spp.)
from birth to 84 months of age, and used stepwise multiple
regression to analyze the relative contribution of age,
308 Hernandez-Lloreda and Colmenares
cohort, gender, and rearing experience (experimentally
controlled: peer-reared vs. mother-reared) to the variation
observed in rates of performance. These authors found
that rearing experience was statistically unimportant and
from this they concluded that ‘‘ . . . genetic control of
maturation shapes behavioral development in baboons
regardless of subtle experiential differences in early or
later life. Behavioral flexibility may have adaptive value,
but it may also be little more than a veneer on a genetically
mediated structure.’’ (p. Bramblett & Coelho, 1985,
p. 270). Leaving aside the fact that such a single-level
approach is statistically inadequate and may thus lead to
misleading conclusions (Hernandez-Lloreda et al., 2003),
and that there is abundant information showing that early
experiences may have profound effects on later social
relationships (e.g., Suomi, 1995, 1997), their findings can
also be interpreted in a very different way. According
to the developmental systems view (e.g., Gottlieb, 1992;
Oyama, 2000; Oyama et al., 2001), espoused in this study,
behavioral traits are constructed during ontogeny rather
than genetically programmed to emerge, and the char-
acteristics of behavioral development, including their
being orderly patterned over time as well as the diversity
of individual pathways that may arise, are the outcome of
the coactions that take place within and across multiple
levels and not the fulfillment of an internally guided plan.
The growth curve analyses presented in this paper have
shown that the performance of the behavioral measures
related to mother–infant interaction changed over the
infant’s first year of life, that such changes were signi-
ficantly predicted by infant age (level 1 predictor), and that
individual differences in development pathways were also
statistically significant. The next logical step will be to
determine which variables (level 2 predictors) may account
for the individual differences reported in this study
(Hernandez-Lloreda et al., 2003; Hernandez-Lloreda &
Colmenares, 2005). It would also be interesting to analyze
data from different populations for which data are
available (see above) by means of three-level hierarchical
linear growth models.
Although the developmental functions identified
suggest that the development of the behaviors analyzed
was a continuous process (Boyle & Willms, 2001), the
curvilinear characteristics of many of the developmental
pathways (Fig. 2) also suggest that developmental
discontinuities might be occurring (e.g., Bateson, 1981),
which can be investigated with a special analysis techni-
que known as piecewise linear growth modeling (see
Hernandez-Lloreda et al., 2004; Hernandez-Lloreda &
Colmenares, 2005).
Although we have described and analyzed separately
the developmental time course of the mothers’ and their
infants’ behaviors, it is assumed all along that each partner
is very likely to affect and, to some extent, shape the
other’s behavior over time. For example, the mothers’ and
infants’ roles in the maintenance of contact and proximity
within the dyad has been a traditional concern in studies of
primate mother–infant relationships (Hinde, 1974, 1983;
Maestripieri, 2002, 2004; Nash & Wheeler, 1982), and we
believe that this should also be approached with modern
statistical techniques such as Multivariate Multilevel
Modeling (e.g., MacCallum & Kim, 2000), which we
are now applying (Hernandez-Lloreda & Colmenares,
2004 and in prep.). This analysis should help to clarify the
contributions of each interactant to the developing system,
and to interpret many characteristics of the developmental
pathways in terms of the conceptual system put forward
by Gottlieb (1976) and Bateson (1983). In this respect, an
examination of the findings from this study regarding the
relation between the timing of the peaks in the average
status of the behaviors of each partner and in the amount
of individual differences across time suggests a number
of hypotheses worth testing in the future. We have the
impression, for example, that the mother’s return to oestrus
after the period of postpartum amenorrhea has an important
impact on her behavior (Esteban & Colmenares, 2001; see
also Berman, Rasmussen, & Suomi, 1994) and that this
might induce a major reorganization of the mother–infant
relationship, including the narrowing of individual differ-
ences (i.e., canalization) for some behaviors (for example,
duration of bouts of ventro-ventral contact, Fig. 2a).
We are well aware that we have partly simplified (and
to some extent distorted) the complexity of the develop-
mental processes that drive these early relationships by
ignoring the fact that the mother–infant dyads are actually
part of a larger system, i.e., the group where they are
embedded. Thus, although extra-dyadic reciprocal influ-
ences have not been considered, this should not be taken
to imply that we regard them as unimportant. The local
characteristics of the social niche and general landscape
where the mother–infant-dyads develop may well be
responsible for the differences within and between species
that have been reported (e.g., Maestripieri, 2001).
NOTES
This work was partly supported by a postdoctoral fellowship
from the MEyC (Spain) to F. Colmenares (1988–1991) and by
project grants PB98-0773 and BSO2002-00161 from the MCyT
(Spain) to F. Colmenares. We would like to thank the students
that participated in the data collection and in the tabulation,
S. Albares, M.J. Blanco, R. Gil, and C. Moratalla, and M.J.
Cepero, M.M. Esteban, V. Gutierrez-Diego, M. Pertegal, and F.
Zaragoza, respectively. We also thank Rosario Martınez-Arias
for statistical advice and Francisco Serradilla for the photo-
graphs included in Figure 1. We are grateful to the staff of the
Madrid Zoo for their cooperation in the maintenance of the
baboon long-term research project.
Developmental Pathways and Mother–Infant Relationships 309
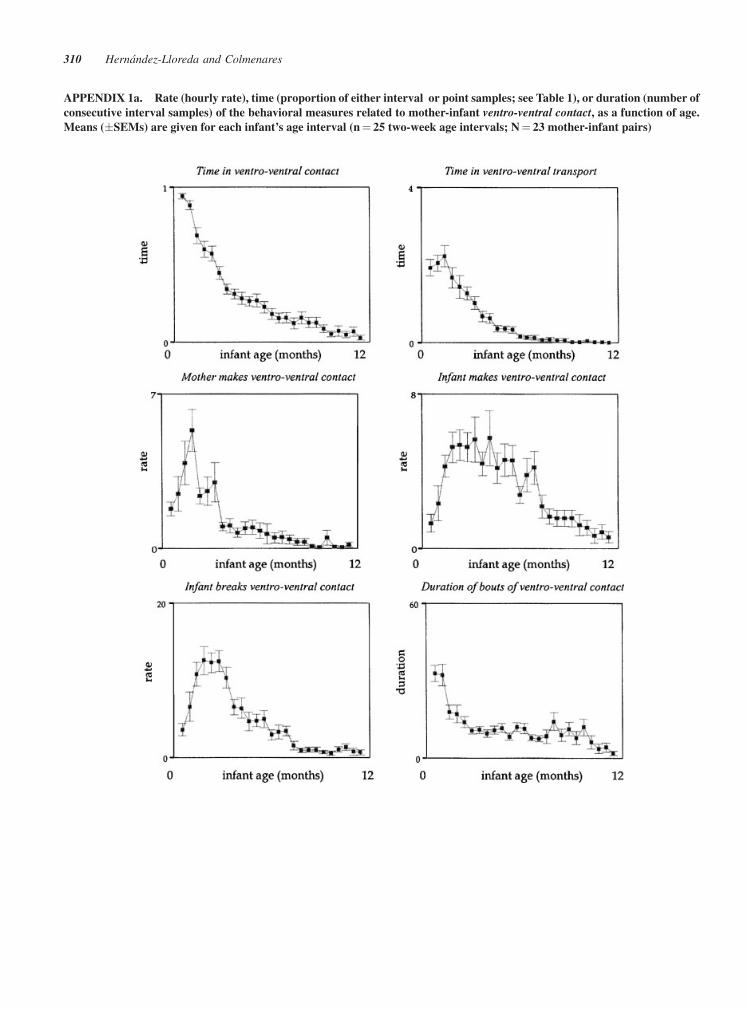
APPENDIX 1a. Rate (hourly rate), time (proportion of either interval or point samples; see Table 1), or duration (number of
consecutive interval samples) of the behavioral measures related to mother-infant ventro-ventral contact, as a function of age.
Means (�SEMs) are given for each infant’s age interval (n¼ 25 two-week age intervals; N¼ 23 mother-infant pairs)
310 Hernandez-Lloreda and Colmenares
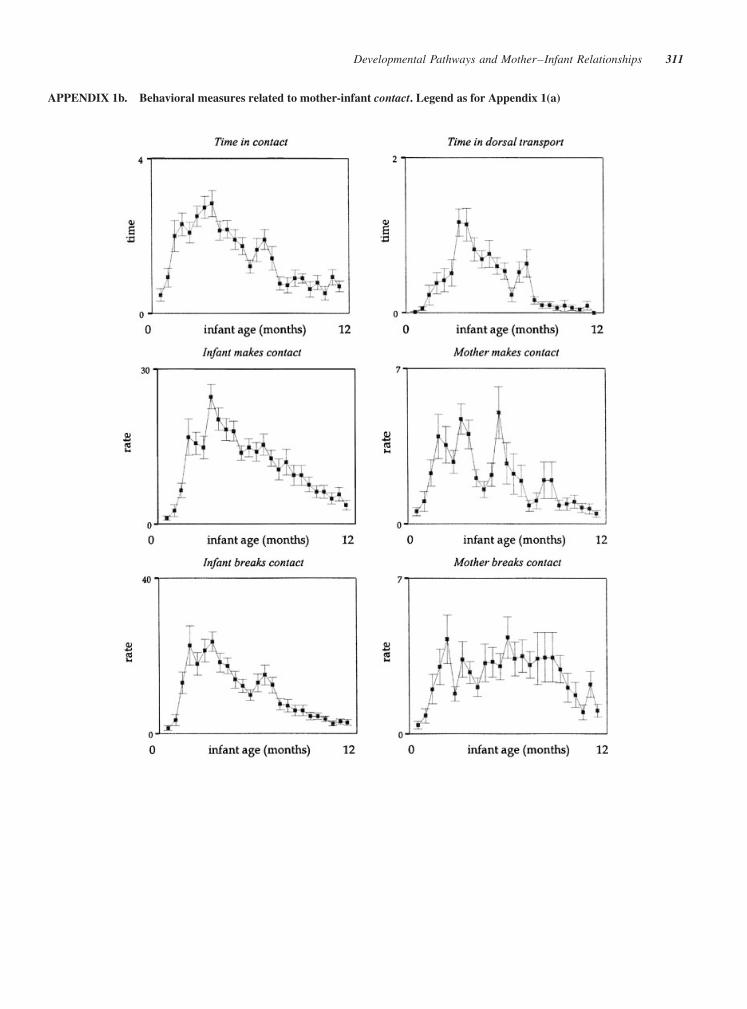
APPENDIX 1b. Behavioral measures related to mother-infant contact. Legend as for Appendix 1(a)
Developmental Pathways and Mother–Infant Relationships 311
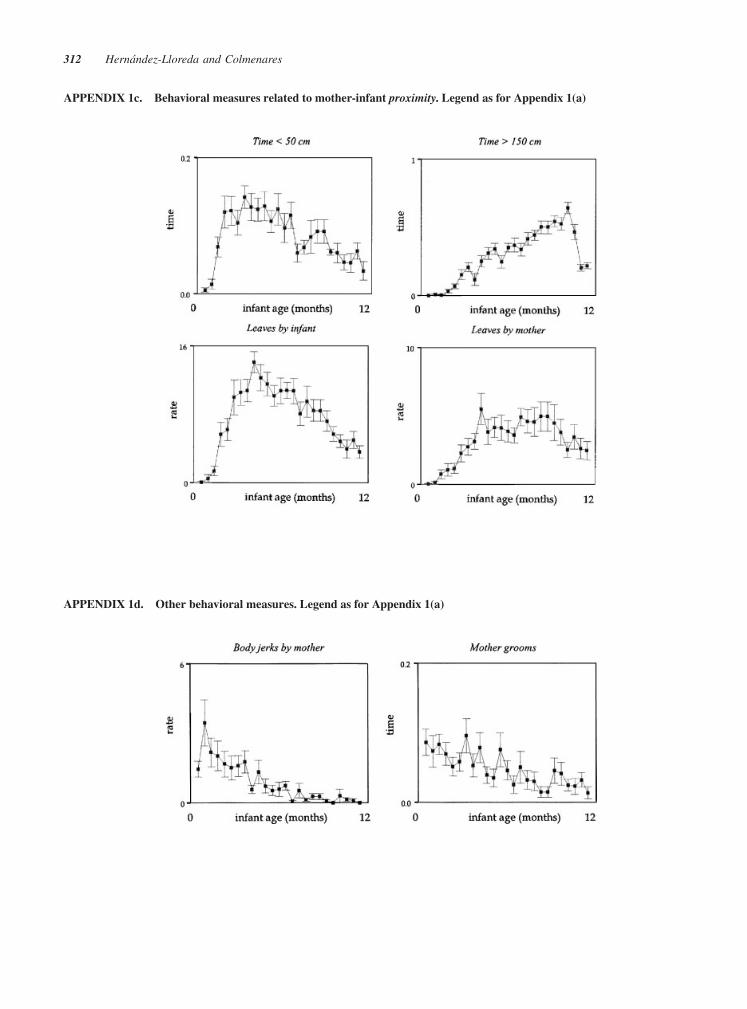
APPENDIX 1c. Behavioral measures related to mother-infant proximity. Legend as for Appendix 1(a)
APPENDIX 1d. Other behavioral measures. Legend as for Appendix 1(a)
312 Hernandez-Lloreda and Colmenares
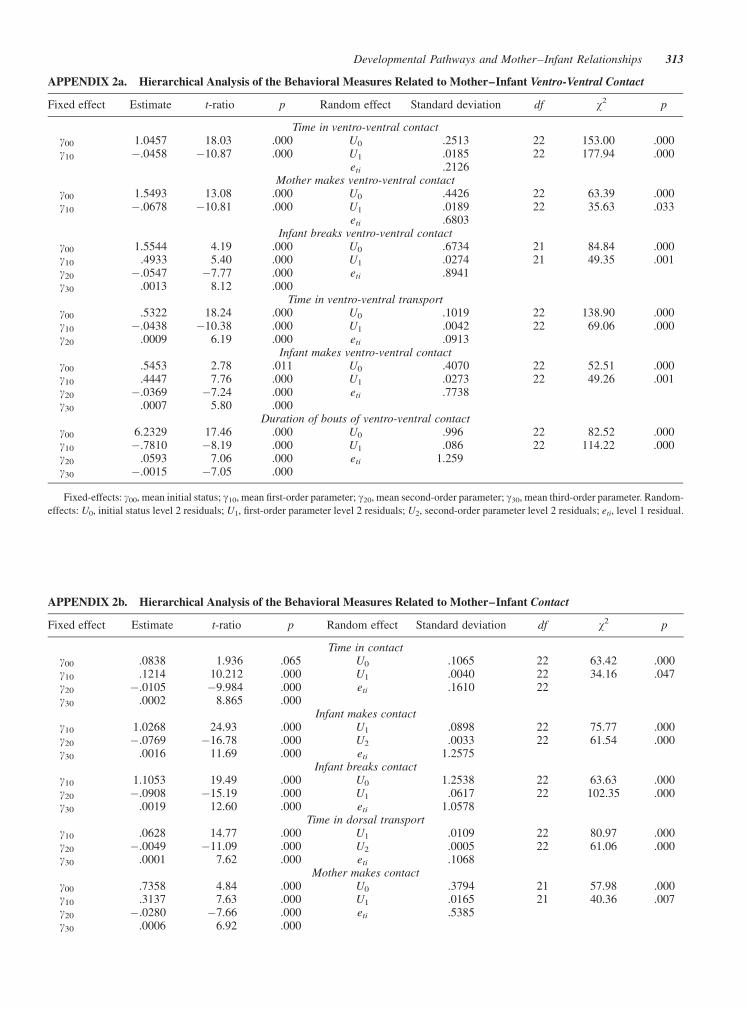
APPENDIX 2a. Hierarchical Analysis of the Behavioral Measures Related to Mother–Infant Ventro-Ventral Contact
Fixed effect Estimate t-ratio p Random effect Standard deviation df w2 p
Time in ventro-ventral contactg00 1.0457 18.03 .000 U0 .2513 22 153.00 .000g10 �.0458 �10.87 .000 U1 .0185 22 177.94 .000
eti .2126Mother makes ventro-ventral contact
g00 1.5493 13.08 .000 U0 .4426 22 63.39 .000g10 �.0678 �10.81 .000 U1 .0189 22 35.63 .033
eti .6803Infant breaks ventro-ventral contact
g00 1.5544 4.19 .000 U0 .6734 21 84.84 .000g10 .4933 5.40 .000 U1 .0274 21 49.35 .001g20 �.0547 �7.77 .000 eti .8941g30 .0013 8.12 .000
Time in ventro-ventral transportg00 .5322 18.24 .000 U0 .1019 22 138.90 .000g10 �.0438 �10.38 .000 U1 .0042 22 69.06 .000g20 .0009 6.19 .000 eti .0913
Infant makes ventro-ventral contactg00 .5453 2.78 .011 U0 .4070 22 52.51 .000g10 .4447 7.76 .000 U1 .0273 22 49.26 .001g20 �.0369 �7.24 .000 eti .7738g30 .0007 5.80 .000
Duration of bouts of ventro-ventral contactg00 6.2329 17.46 .000 U0 .996 22 82.52 .000g10 �.7810 �8.19 .000 U1 .086 22 114.22 .000g20 .0593 7.06 .000 eti 1.259g30 �.0015 �7.05 .000
Fixed-effects: g00, mean initial status; g10, mean first-order parameter; g20, mean second-order parameter; g30, mean third-order parameter. Random-
effects: U0, initial status level 2 residuals; U1, first-order parameter level 2 residuals; U2, second-order parameter level 2 residuals; eti, level 1 residual.
APPENDIX 2b. Hierarchical Analysis of the Behavioral Measures Related to Mother–Infant Contact
Fixed effect Estimate t-ratio p Random effect Standard deviation df w2 p
Time in contactg00 .0838 1.936 .065 U0 .1065 22 63.42 .000g10 .1214 10.212 .000 U1 .0040 22 34.16 .047g20 �.0105 �9.984 .000 eti .1610 22g30 .0002 8.865 .000
Infant makes contactg10 1.0268 24.93 .000 U1 .0898 22 75.77 .000g20 �.0769 �16.78 .000 U2 .0033 22 61.54 .000g30 .0016 11.69 .000 eti 1.2575
Infant breaks contactg10 1.1053 19.49 .000 U0 1.2538 22 63.63 .000g20 �.0908 �15.19 .000 U1 .0617 22 102.35 .000g30 .0019 12.60 .000 eti 1.0578
Time in dorsal transportg10 .0628 14.77 .000 U1 .0109 22 80.97 .000g20 �.0049 �11.09 .000 U2 .0005 22 61.06 .000g30 .0001 7.62 .000 eti .1068
Mother makes contactg00 .7358 4.84 .000 U0 .3794 21 57.98 .000g10 .3137 7.63 .000 U1 .0165 21 40.36 .007g20 �.0280 �7.66 .000 eti .5385g30 .0006 6.92 .000
Developmental Pathways and Mother–Infant Relationships 313
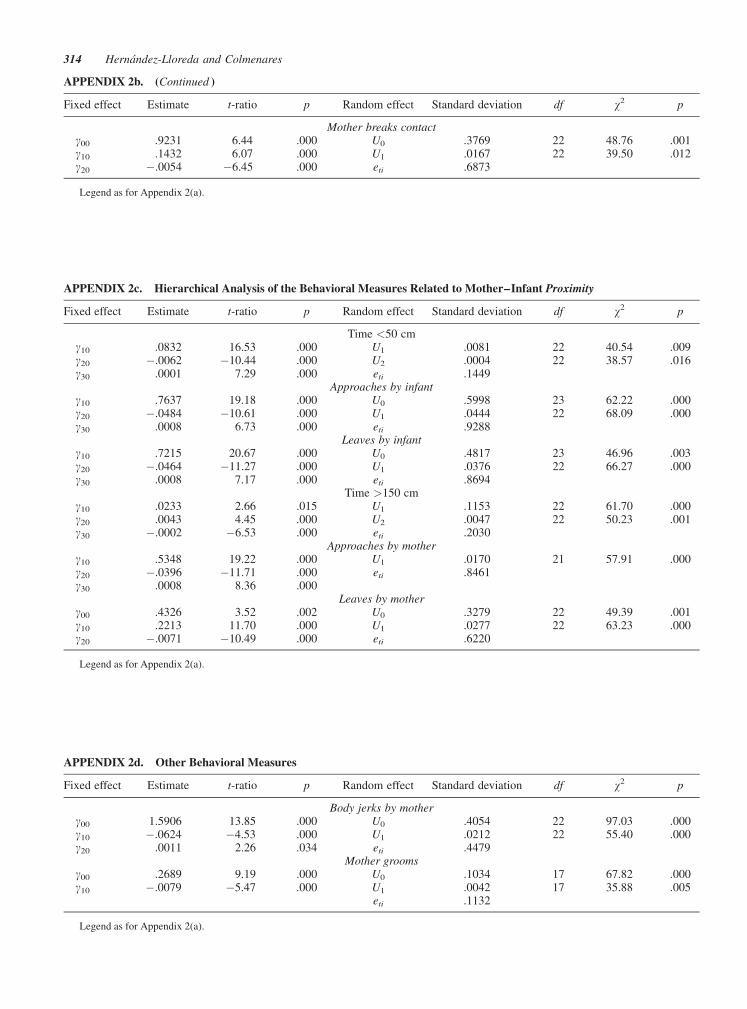
APPENDIX 2b. (Continued )
Fixed effect Estimate t-ratio p Random effect Standard deviation df w2 p
Mother breaks contactg00 .9231 6.44 .000 U0 .3769 22 48.76 .001g10 .1432 6.07 .000 U1 .0167 22 39.50 .012g20 �.0054 �6.45 .000 eti .6873
Legend as for Appendix 2(a).
APPENDIX 2c. Hierarchical Analysis of the Behavioral Measures Related to Mother–Infant Proximity
Fixed effect Estimate t-ratio p Random effect Standard deviation df w2 p
Time <50 cmg10 .0832 16.53 .000 U1 .0081 22 40.54 .009g20 �.0062 �10.44 .000 U2 .0004 22 38.57 .016g30 .0001 7.29 .000 eti .1449
Approaches by infantg10 .7637 19.18 .000 U0 .5998 23 62.22 .000g20 �.0484 �10.61 .000 U1 .0444 22 68.09 .000g30 .0008 6.73 .000 eti .9288
Leaves by infantg10 .7215 20.67 .000 U0 .4817 23 46.96 .003g20 �.0464 �11.27 .000 U1 .0376 22 66.27 .000g30 .0008 7.17 .000 eti .8694
Time >150 cmg10 .0233 2.66 .015 U1 .1153 22 61.70 .000g20 .0043 4.45 .000 U2 .0047 22 50.23 .001g30 �.0002 �6.53 .000 eti .2030
Approaches by motherg10 .5348 19.22 .000 U1 .0170 21 57.91 .000g20 �.0396 �11.71 .000 eti .8461g30 .0008 8.36 .000
Leaves by motherg00 .4326 3.52 .002 U0 .3279 22 49.39 .001g10 .2213 11.70 .000 U1 .0277 22 63.23 .000g20 �.0071 �10.49 .000 eti .6220
Legend as for Appendix 2(a).
APPENDIX 2d. Other Behavioral Measures
Fixed effect Estimate t-ratio p Random effect Standard deviation df w2 p
Body jerks by motherg00 1.5906 13.85 .000 U0 .4054 22 97.03 .000g10 �.0624 �4.53 .000 U1 .0212 22 55.40 .000g20 .0011 2.26 .034 eti .4479
Mother groomsg00 .2689 9.19 .000 U0 .1034 17 67.82 .000g10 �.0079 �5.47 .000 U1 .0042 17 35.88 .005
eti .1132
Legend as for Appendix 2(a).
314 Hernandez-Lloreda and Colmenares
REFERENCES
Altmann, J. (1974). Observational study of behavior: Sampling
methods. Behaviour, 49, 227–247.
Altmann, J. (1978). Infant independence in yellow baboons. In
G. M. Burghardt, & M. Bekoff (Eds.), The development of
behavior (pp. 253–277). New York: Garland STPM Press.
Altmann, J. (1980). Baboon mothers and infants. Cambridge,
MA: Harvard University Press.
Altmann, J., & Samuels, A. (1992). Costs of maternal care:
Infant-carrying in baboons. Behavioral Ecology and Socio-
biology, 29, 391–398.
Barrett, L., Dunbar, R. I. M. & Dunbar, P. (1995). Mother–
infant contact as contingent behaviour in gelada baboons.
Animal Behaviour, 49, 805–810.
Barrett, L., & Henzi, S. P. (2000). Are baboon infants Sir Phillip
Sydney’s offspring? Ethology, 106, 645–658.
Bateson, P. P. G. (1981). Discontinuities in development and
changes in the organization of play in cats. In K. G.
Immelmann, W. Barlow, L. Petrinovich, & M. Main (Eds.),
Behavioral development (pp. 281–295). Cambridge: Cam-
bridge University Press.
Bateson, P. P. G. (1983). Genes, environment, and the
development of behaviour. In T. R. Halliday, & P. J. B.
Slater (Eds.), Animal behaviour, genes, environment, and
learning (Vol. 3), (pp. 52–81). Oxford: Blackwell.
Bateson, P. P. G. (2001). Behavioral development and
darwinian evolution. In S. Oyama, P. E. Griffiths, & R. D.
Gray (Eds.), Cycles of contingency. Developmental systems
and evolution (pp. 149–166). London: The MIT Press.
Bateson, P. P. G. (2003). The promise of behavioural biology.
Animal Behaviour, 65, 11–17.
Bateson, P. P. G., & Martin, P. (2000). Design for a life. How
behaviour develops. London: Cape.
Berman, C. M. (1984). Variation in mother–infant relation-
ships: Traditional and non-traditional factors. In M. F. Smith
(Ed.), Female primates (pp. 17–36). New York: Alan R. Liss.
Berman, C. M., Rasmussen, K. L. R., & Suomi, S. J. (1994).
Responses of free-ranging rhesus monkeys to a natural form
of social separation. I. Parallels with mother–infant separa-
tion in captivity. Child Development, 65, 1028–1041.
Blass, E. M. (Ed.). (1986). Handbook of behavioral neurobiol-
ogy. Developmental psychobiology and developmental
neurobiology (Vol. 8). New York: Plenum.
Blass, E. M. (Ed.). (1988). Handbook of behavioral neurobiol-
ogy. Developmental psychobiology and behavioral ecology
(Vol. 9). New York: Plenum.
Boyle, M. H., & Willms, J. D. (2001). Multilevel modelling of
hierarchical data in developmental studies. Journal of Child
Psychology and Psychiatry, 42, 141–162.
Bramblett, C. A., & Coelho, A. M. (1985). Age changes
in affinitive behaviors of baboons. American Journal of
Primatology, 9, 259–271.
Bryk, A. S., & Raudenbush, S. W. (1987). Application of
hierarchical linear models to assessing change. Psychological
Bulletin, 101, 147–158.
Bryk, A. S., & Raudenbush, S. W. (1992). Hierarchical linear
models: Applications and data analysis methods. London: Sage.
Bryk, A. S., Raudenbush, S. W., & Congdon, J. R. (1996).
HLM: Hierarchical linear and nonlinear modeling with the
HLM/2L and HLM/3L programs. Chicago: Scientific Soft-
ware international.
Butterworth, G., & Bryant, P. (Eds.). (1990). Causes of
development: Interdisciplinary perspectives. New York:
Harvester Wheatsheaf.
Chalmers, N. R. (1987). Developmental pathways of behaviour.
Animal Behaviour, 35, 659–674.
Colmenares, F. (1992). Clans and harems in a colony of
hamadryas and hybrid baboons: Male kinship, familiarity
and the formation of brother teams. Behaviour, 121, 61–94.
Colmenares, F. (2004). Kinship and its impact on social
behavior in multileveled societies. In B. Chapais, & C.
Berman (Eds.), Kinship and behavior in primates (pp. 242–
270). Oxford: Oxford University Press.
Colmenares, F., & Gomendio, M. (1988). Changes in female
reproductive condition following male take-overs in a colony
of hamadryas and hybrid baboons. Folia Primatologica, 50,
157–174.
De Vore, I. (1963). Mother–infant relations in free-ranging
baboons. In H. L. Rheingold (Ed.), Maternal behavior in
Mammals (pp. 305–335). New York: Wiley.
Deputte, B.(2000). Primate socialization revisited: Theoretical
and practical issues in social ontogeny. Advances in the
Study of Behavior, 29, 99–157.
Esteban, M. M., & Colmenares, F. (2001). The effect of the
mother’s first postpartum oestrus on the mother–infant
relationship in a non-seasonally breeding species, the
hamadryas baboon (Papio hamadryas). Folia Primatologica,
72, 353.
Fairbanks, L. A. (1996). Individual differences in maternal
style. Causes and consequences for mothers and offspring.
Advances in the Study of Behavior, 25, 579–611.
Fairbanks, L. A. (2003). Parenting. In D. Maestripieri (Ed.),
Primate psychology (pp. 144–170). Cambridge: Harvard
University Press.
Fletcher, A. (2001). Development of infant independence from
the mother in wild mountain gorillas. In M. M. Robbins, P.
Sicotte, & K. Stewart (Eds.), Mountain gorillas (pp. 153–182).
Cambridge: Cambridge University Press.
Goldstein, H. (2003). Multilevel statistical models ( 3rd ed.)
London: Hodder Arnold.
Goldstein, H., Rasbash, J., Plewis, I., Draper, D., Browne, W.,
Yang, M., Woodhouse, G., & Healy, M. (1998). A user’s
guide to MlwiN. London: Multilevel models Project,
Institute of education, University of London.
Gottlieb, G. (1976). Conceptions of prenatal development:
Behavioral embriology. Psychological Review, 83, 215–234.
Gottlieb, G. (1992). Individual development and evolution: The
genesis of novel behavior. Oxford: Oxford University Press.
Gottlieb, G. (2001). A developmental psychobiological systems
view: Early formulation and current status. In S. Oyama, P. E.
Griffiths, & R. D. Gray (Eds.), Cycles of contingency.
Developmental systems and evolution (pp. 41–54). London:
The MIT Press.
Gould, S. J. (1977). Ontogeny and phylogeny. Cambridge:
Harvard University Press.
Developmental Pathways and Mother–Infant Relationships 315
Hall, W. G., & Oppenheim, R. W. (1987). Developmental
psychobiology: Prenatal, perinatal, and early postnatal
aspects of behavioral development. Annual Review of
Psychology, 38, 91–128.
Hernandez-Lloreda, M. V., & Colmenares, F. (2003). Assessing
continuity and stability of maternal styles in a colony of
baboons (Papio hamadryas). Folia Primatologica, 74,
198.
Hernandez-Lloreda, M. V., & Colmenares, F. (2005). Mother–
infant relationships in hamadryas baboons: Predictors of
individual differences and discontinuities in developmental
pathways. Journal of Comparative Psychology, 119.
Hernandez-Lloreda, M. V., & Colmenares, F. (2004). Partner
contribution to an ongoing dyadic relationship in hamadryas
baboons: Multivariate multilevel modelling of mother–
offspring relationships in hamadryas baboons. Folia Prima-
tologica, 75, 382.
Hernandez-Lloreda, M. V., Colmenares, F., & Martınez-Arias,
R. (2003). Application of hierarchical linear modelling to the
study of trajectories of behavioural development. Animal
Behaviour, 65, 607–613.
Hernandez-Lloreda, M. V., Colmenares, F., & Martınez-Arias,
R. (2004). Application of piecewise hierarchical linear
growth modeling to the study of discontinuities in behavioral
development. Journal of Comparative Psychology, 118, 316–
324.
Hinde, R. A. (1974). Biological bases of human social behavior.
New York: McGraw-Hill.
Hinde, R. A. (Ed.). (1983). Primate social relationships: An
integrated approach. Oxford: Blackwell.
Hofer, M. A. (1987). Early social relationships: A psychobiol-
ogist’s view. Child Development, 58, 633–647.
Hoo, M.-W. (1998). Evolution. In G. Greenberg, & M. M.
Haraway (Eds.), Comparative psychology, a handbook
(pp. 107–119). New York: Garland.
Hood, K. E. (1998). Dynamical systems and dialectical
processes in development and evolution. In G. Greenberg,
& M. M. Haraway (Eds.), Comparative psychology, a
handbook (pp. 98–104). New York: Garland.
Hox, J. J., & Kreft, I. G. (1994). Multilevel analysis methods.
Sociological Methods & Research, 22, 283–299.
Hrdy, B. S. (1999). Mother nature. A history of mothers,
infants, and natural selection. New York: Pantheon.
Immelmann, K., Barlow, G. W., Petrinovich, L., & Main, M.
(Eds.). (1981). Behavioral development. Cambridge: Cambridge
University Press.
Johnston, J. D., & Gottlieb, G. (2000). Neophenogenesis: A
developmental theory of phenotypic evolution. Journal of
Theoretical Biology, 147, 471–495.
Kappeler, P. M., Pereira, M. E., & van Schaik, C. P. (2003).
Primate life histories and socioecology. In P. M. Kappeler, &
M. E. Pereira (Eds.), Primate life histories and socioecology
(pp. 1–23). Cambridge: Cambridge University Press.
Kraemer, G. W. (1992). A psychobiological theory of
attachment. Behavioral and Brain Sciences, 15, 493–541.
Kummer, H. (1984). From laboratory to desert and back: a
social system of hamadryas baboons. Animal Behaviour, 32,
965–971.
Lewkowicz, D. J., & Lickliter, R. (Eds.). (2002). Concepts of
development. New York: Psychology Press.
Lewontin, R. (1983). Gene, organism, and environment. In D.
S. Bendall (Ed.), Evolution from molecules to man (pp. 273–
285). Cambridge: Cambridge University Press.
Lycett, J. E., Henzi, S. P., & Barrett, L. (1998). Maternal invest-
ment in mountain baboons and the hypothesis of reduced
care. Behavioural Ecology and Sociobiology, 42: 49–56.
MacCallum, R. C., & Kim, C. (2000). Modeling multivariate
change. In T. D. Little, K. U. Schanabel, & J. Baumrt (Eds.),
Modeling longitudinal and multilevel data (pp. 51–68). New
Jersey: LEA.
Maestripieri, D. (1994). Mother–infant relationships in three
species of macaques (Macaca mulatta, M. nemestrina, M.
arctoides). I. Development of the mother–infant relationship
in the first three months. Behaviour, 131, 75–96.
Maestripieri, D. (2001). Intraspecific variability in parenting
styles of rhesus macaques (Macaca mulatta): The role of the
social environment. Ethology, 107, 237–248.
Maestripieri, D. (2002). Parent-offspring conflict in primates.
International Journal of Primatology, 23, 923–951.
Maestripieri, D. (2003). Attachment. In D. Maestripieri (Ed.),
Primate psychology (pp. 108–143). Cambridge: Harvard
University Press.
Maestripieri, D. (2004). Genetic aspects of mother–offspring
conflict in rhesus macaques. Behavioral Ecology and Socio-
biology, 55, 381–387.
Martin, P., & Bateson, P. P. G. (1993). Measuring behaviour:
An introductory guide. Cambridge: Cambridge University Press.
Michel, G. F. (2001). Growth curve analyses are best suited to
examine the relation between developmental pathways and
selective breeding: Comment on Hofer, Shair, Masmela, &
Brunelli, ‘‘Developmental effects of selective breeding for
an infantile trait: The rat pup ultrasonic isolation call’’.
Developmental Psychobiology, 39, 247–250.
Michel, G. F., & Moore, C. L. (1995). Developmental
psychobiology, an interdisciplinary science. Cambridge, Mass:
The MIT Press.
Montgomery, D. C., Peck, E. A., & Vining, G. G. (2001).
Introduction to linear regression analysis (3rd ed.) New York:
Wiley.
Nash, L. T. (1978). The development of mother–infant
relationship in wild baboons (Papio anubis). Animal
Behaviour, 26, 746–759.
Nash, L. T., & Wheeler, R. L. (1982). Mother–infant relation-
ships in non-human primates. In H. E. Fitzgerald, J. A.
Mullins, & P. Gage (Eds.), Child nurturance: Primate behavior
and child nurturance (Vol. 3) (pp. 27–59). New York: Plenum.
Nicolson, N. A. (1982). Weaning and the development of
independence in olive baboons. Ph.D. thesis, University of
Harvard.
Nicolson, N. A. (1987). Infants, mothers, and other females. In
B. B. Smuts, D. L. Cheney, R. M. Seyfarth, R. W. Wrangham,
& T. T. Struhsaker (Eds.), Primate societies (pp. 330–342).
Chicago: Chicago University Press.
Oyama, S. (1982). A reformulation of the idea of maturation. In
P. P. G. Bateson, & P. H. Klopfer (Eds.), Perspectives in
ethology (pp. 101–131). New York: Plenum.
316 Hernandez-Lloreda and Colmenares
Oyama, S. (2000). Evolution’s eye. A systems view of the
biology-culture divide. London: Duke University Press.
Oyama, S., Griffiths, P. E., & Gray, R. D. (2001). Introduction:
what is developmental systems theory? In S. Oyama, P. E.
Griffiths, & R. D. Gray (Eds.), Cycles of contingency.
Developmental systems and evolution (pp. 1–11). London:
The MIT Press.
Pereira, M. E., & Altmann, J. (1985). Development of social
behavior in free-living nonhuman primates. In E. S. Watts
(Ed.), Nonhuman primate models for human growth and
development (pp. 217–309). New York: Alan Liss.
Pryce, C. R., Martin, R. D., & Skuse, D. (Eds.). (1995).
Motherhood in human and nonhuman primates. Biosocial
determinants. Basel: Karger.
Ransom, T. W., & Rowell, T. E. (1972). Early social
development of feral baboons. In F. E. Poirier (Ed.),
Primate socialization (pp. 105–144). New York: Random
House.
Raudenbush, S. W. (2001). Comparing personal trajectories and
drawing causal inferences from longitudinal data. Annual
Review of Psychology, 52, 501–525.
Raudenbush, S. W., Bryk, A. S., Cheong, F., & Congdon, R.
(2004). HLM 6: Hierarchical linear and nonlinear modeling.
Chicago: Scientific Software international.
Rhine, R. J., Norton, G. W., & Westlund, B. J. (1984). The
waning of dependence in infant free-ranging yellow baboons
(Papio cynocephalus) of Mikumi National Park. American
Journal of Primatology, 7, 213–228.
Rhine, R. J., Norton, G. W., Wynn, G. M., & Wynn, R. D. 1985.
Weaning of free-ranging infant baboons (Papio cynocephalus)
as indicated by one-zero and instantaneous sampling of
feeding. International Journal of Primatology, 6, 491–499.
Rowell, T. E., Din, N. A., & Omar, A. (1968). The social
development of baboons in their first three months. Journal of
Zoology, 155, 461–483.
Sackett, G. P., Sameroff, A. J., Cairns, R. B., & Suomi, S. J.
(1981). Continuity in behavioral development: Theoretical
and empirical issues. In K. Immelmann, G. W. Barlow, L.
Petrinovich, & M. Main (Eds.), Behavioral development
(pp. 23–57). Cambridge: Cambridge University Press.
Snijders, T. A. B., & Bosker, R. J. (1999). Multilevel analysis:
An introduction to basic and advanced multilevel modeling.
London: Sage Publications.
Suomi, S. J. (1995). Influence of attachment theory on etholo-
gical studies of biobehavioral development in nonhuman
primates. In S. Goldberg, R. Muir, & J. Kerr (Eds.), Attach-
ment theory: Social, developmental, and clinical perspectives
(pp. 185–201). Hillsdale, NJ: The Analytic Press.
Suomi, S. J. (1997). Early determinants of behaviour: Evidence
from primate studies. British Medical Bulletin, 53, 170–184.
Suomi, S. J., Novak, M. A., & Well, A. (1996). Aging in rhesus
monkeys: Different windows on behavioral continuity and
change. Developmental Psychology, 32, 1116–1128.
Turkewitcz, G. (1992). Developmental psychobiology. New
York: The New York Academy of Sciences.
Van der Leeden, R. (1998). Multilevel analysis of longitudinal
data. In C. C. J. Bijleveld ,& X. Van der Kamp (Eds.),
Longitudinal data analysis (pp. 268–315). London. Sage.
Wasser, L. M., & Wasser, S. K. (1995). Environmental variation
and developmental rate among free ranging yellow baboons
(Papio cynocephalus). American Journal of Primatology, 35,
15–30.
Willett, J. B. (1988). Questions and answers in the measurement
of change. In E. Rothkopf (Ed.), Review of Research in
Education (1988–1989) (pp. 345–422). Washington, DC:
American Educational Research Association.
Wohlwill, J. (1973). The study of behavioral development. San
Diego, CA: Academic Press.
Zucchini, W. (2000). An introduction to model selection.
Journal of Mathematical Psychology, 44, 41–61.
Developmental Pathways and Mother–Infant Relationships 317