
Regional dimensions of infant mortality in Brazil
19
1 Regional dimensions of infant mortality rate in Brazil, 1980-2000 BARUFI, Ana M.B. (University of São Paulo, Economics Department, Master Student, [email protected]) HADDAD, Eduardo A. (University of São Paulo, Economics Department, Professor, [email protected]) PAEZ, Antonio (McMaster University, School of Geography & Earth Sciences, Associate Professor, [email protected]) Abstract Development can be understood from many perspectives. Among those, the one proposed by Amartya Sen states that a development policy should aim at expanding the freedom of individuals, and this goal can be achieved by the expansion of capabilities. With this conceptual framework in mind, health, more specifically infant mortality, is chosen as a measure of development and as the object of study. The Government should guarantee the provision of health services, as they consist in meritory goods. Mosley and Chen (1984) propose a theoretical framework to study infant mortality based on the proximal determinants, in which the socioeconomic factors affect the result observed indirectly. In Brazil there has been a substantial reduction of the average levels of infant mortality rates in the last decades. However, there is still a significant regional inequality. Econometric models for 1980, 1991 and 2000 are estimated including a spatial filter in order to account for the spatial dependency observed in the data. The study concludes that health infrastructure lost its explanative power for the differences in infant mortality rate among the localities. On the other hand, socioeconomic variables have become more relevant and significant. It means that future public policies must try to improve the access of the families to public facilities, reduce poverty and inequality and improve educational levels. Therefore, the family-based prevention against health problems should be stimulated, helping to avoid premature death. Keywords: development, infant mortality, spatial filter. Introduction Ever since the 1970’s, the idea that a multidimensional perspective should be applied for the study of development has achieved consensus among researchers and policy makers. Many international institutions including the United Nations, the Organization for Economic Cooperation and Development (OECD) and the World Bank have focused on key goals to promote the international development of developing and transition countries. 1 This approach is directly related to Amartya Sen’s concept of development as the increase of freedom. Sen (1992, 2005) argues that there are many dimensions that must be considered in order to improve the quality of life and welfare of the population. Moreover, it is important to provide conditions that enhance the possibilities of choice of the individuals in every situation, or in other words, that expand their capabilities. Considering the multidimensional perspective of this approach, it is increasingly recognized that other variables than economic growth are relevant to understand
Transcript of Regional dimensions of infant mortality in Brazil
1
Regional dimensions of infant mortality rate in Brazil, 1980-2000
BARUFI, Ana M.B. (University of São Paulo, Economics Department, Master Student, [email protected])
HADDAD, Eduardo A. (University of São Paulo, Economics Department, Professor, [email protected])
PAEZ, Antonio (McMaster University, School of Geography & Earth Sciences, Associate Professor, [email protected])
Abstract
Development can be understood from many perspectives. Among those, the one proposed by Amartya Sen states that a development policy should aim at expanding the freedom of individuals, and this goal can be achieved by the expansion of capabilities. With this conceptual framework in mind, health, more specifically infant mortality, is chosen as a measure of development and as the object of study. The Government should guarantee the provision of health services, as they consist in meritory goods. Mosley and Chen (1984) propose a theoretical framework to study infant mortality based on the proximal determinants, in which the socioeconomic factors affect the result observed indirectly. In Brazil there has been a substantial reduction of the average levels of infant mortality rates in the last decades. However, there is still a significant regional inequality. Econometric models for 1980, 1991 and 2000 are estimated including a spatial filter in order to account for the spatial dependency observed in the data. The study concludes that health infrastructure lost its explanative power for the differences in infant mortality rate among the localities. On the other hand, socioeconomic variables have become more relevant and significant. It means that future public policies must try to improve the access of the families to public facilities, reduce poverty and inequality and improve educational levels. Therefore, the family-based prevention against health problems should be stimulated, helping to avoid premature death.
Keywords: development, infant mortality, spatial filter.
Introduction
Ever since the 1970’s, the idea that a multidimensional perspective should be applied for the study of development has achieved consensus among researchers and policy makers. Many international institutions including the United Nations, the Organization for Economic Cooperation and Development (OECD) and the World Bank havefocused on key goals to promote the international development of developing and transition countries.1
This approach is directly related to Amartya Sen’s concept of development as the increase of freedom. Sen (1992, 2005) argues that there are many dimensions that must be considered in order to improve the quality of life and welfare of the population. Moreover, it is important to provide conditions that enhance the possibilities of choice of the individuals in every situation, or in other words, that expand their capabilities.
Considering the multidimensional perspective of this approach, it is increasingly recognized that other variables than economic growth are relevant to understand

2
development and find ways to appropriately promote it. For instance, the United Nations’ Millennium Development Goals propose eight targets that must be attained by 2015. They try to address the main restrictions to the individual’s freedom, giving minimal conditions for a healthy life, with higher equality and education. Three of these goals are directly related to health issues, and to measure the advances in this area, the infant mortality rate is one of the indicators proposed.2
In this respect, the type of development strategy that should be adopted by countries in order to obtain a better outcome remains controversial (Hanmer et al. 2003). Two broad perspectives have been propounded. The first one is based on a growth-oriented vision, which maintains that the promotion of economic growth (or, equivalently, income growth) can also maximize welfare as measured by social indicators.3 This position is more concerned with productivity, and less with investments in other areas considered as of low productivity impact, such as health infrastructure.
On the other hand, based on empirical evidence indicating that countries with the same level of income per capita can have very different levels of Human Development Index (HDI), there is a literature which states that targeting income is a narrow strategy. The relationship of income with health outcomes exists, but may be at least in part caused by a third variable. In this sense, a policy aiming to promote development must target a wide range of variables, as education, health, and household facilities, among others. Therefore, an active social policy may be advisable for this purpose.4
Adopting a broader perspective of the latter approach shifts the focus from income per capita alone, to other factors that can help to explain the recent pattern observed of infant mortality. This perspective fits better the notion of multidimensional development as it identifies more complete relationships between the relevant variables.
With these considerations in mind, the main objective of this paper is to study the determinants of infant mortality rates of Brazilian municipalities in the last decades. In particular, we seek to assess the impact of health infrastructure, as well as living conditions and socioeconomic factors, over the reduction of the regional infant mortality rate in Brazil in this period. The structure of the paper is as follows. Previous work in this area is reviewed, before describing the data and methods used in this research. Next, the results of the analysis are presented and discussed. Finally, the implications of the findings are highlighted in the closing remarks.
Brief review of the literature
The recent scientific literature reports various studies that try to understand the pattern of infant mortality in Brazil. Some of these studies were motivated by the need to evaluate the effect of specific health governmental programs, as the Health Family Program (Programa Saúde da Família - PSF) and the Community Health Agents Program (that were created in a context of decentralization of health services), taking into account socioeconomic factors. Peixoto (2008) identifies a significant effect of both programs over the reduction of the infant mortality rate (IMR) in the municipalities of the Southeast of Brazil, from 1999 to 2003. Guanais and Macinko (2009) find the same positive effect of these programs between 1998 and 2006 for the Brazilian municipalities with more than 10,000 people and reliable information (89% of the population).
In a slightly different setting, Soares (2007) examines the main factors that explain the increase in life expectancy across Brazilian municipalities, with a panel data structure

3
from 1970 to 2000. Income per capita, access to water and to sanitation, and illiteracy can explain 72% of its variation.
Based on a health production function (proposed by Becker and Lewis, 1973), Alves and Belluzzo (2004) find that education, sanitary services and higher per capita income can help reducing infant mortality in a municipality level (from 1970 to 2000). They highlight the role of education as one of the most important factors, based on a variety of panel data models, including an endogeneity control (Arellano-Bond procedure)5.
Rosemberg et al. (2000) stress the fundamental role of education over the reduction of IMR, while controlling for the influence of climate changes over health indicators, using regional dummies to represent the regional effect. The increase of temperatures has varying effects according to the region and the season of the year. The same model is used by Thomas et al. (1990), with the main result that parental education has a direct effect over child survival, independently of the link provided by income.
There are also evaluations of general health issues, as for instance the effectiveness of prenatal health care utilization and its effect over health outcomes (Wehby et al, 2009). The authors identify regional differences in the utilization, highly correlated with the differences in the income per capita between the states. In addition, the positive relation between the higher usage and better health outcomes is identified.
On the spatial distribution of infant mortality in Brazil, Bezerra-Filho et al. (2007) try to set possible risk factors through the comparison of the spatial pattern of the IMR and other relevant variables in the state of Ceará, from 2000 to 2002. The models to explain the IMR show spatial dependency in the residuals, even with the inclusion of socioeconomic, demographic and health care variables. One of the possible causes for that is the omission of relevant variables, as for instance contagious measures. Other studies focus in specific regions of the country, using spatial autocorrelation techniques in a descriptive type of study.6
The present paper contributes to the literature by conducting a novel geographical analysis of IMR for Brazil. The research investigates the situation for the years 1980, 1991, and 2000, with a regional treatment not previously reported in the case of the IMR at a national level (minimum comparable areas). From a technical perspective, we use variables to account for potential spatial spillovers accruing from the provision of infrastructure, the size of the urban area, and other variables of interest.
Methods
Health outcomes can be measured by any of an extensive group of indicators. Many of these indicators are almost interchangeable, in the sense that they capture the results of very similar groups of the population. Victora et al. (1994) and Hanmer et al (2003) present some: neonatal mortality (from the first to the twenty-seventh day of life), post-neonatal mortality (from the twenty-eightieth day to one year of life), child mortality (from the first to the fifth year of life), under-five mortality (number of deaths of children more than one year old and less than five years old), and finally, infant mortality (children under one year old).
In this study, we use the latter measure, as it is easily available from data calculated by the Ministry of Health in a regionally disaggregated form. It is also one of the measures most affected by precarious life conditions, because it does not depend so much on congenital diseases (as the neonatal) or vaccination policies (as the under-five mortality

4
rate), being more sensitive to other aspects such as nutritional conditions (Victora et al., 1994).
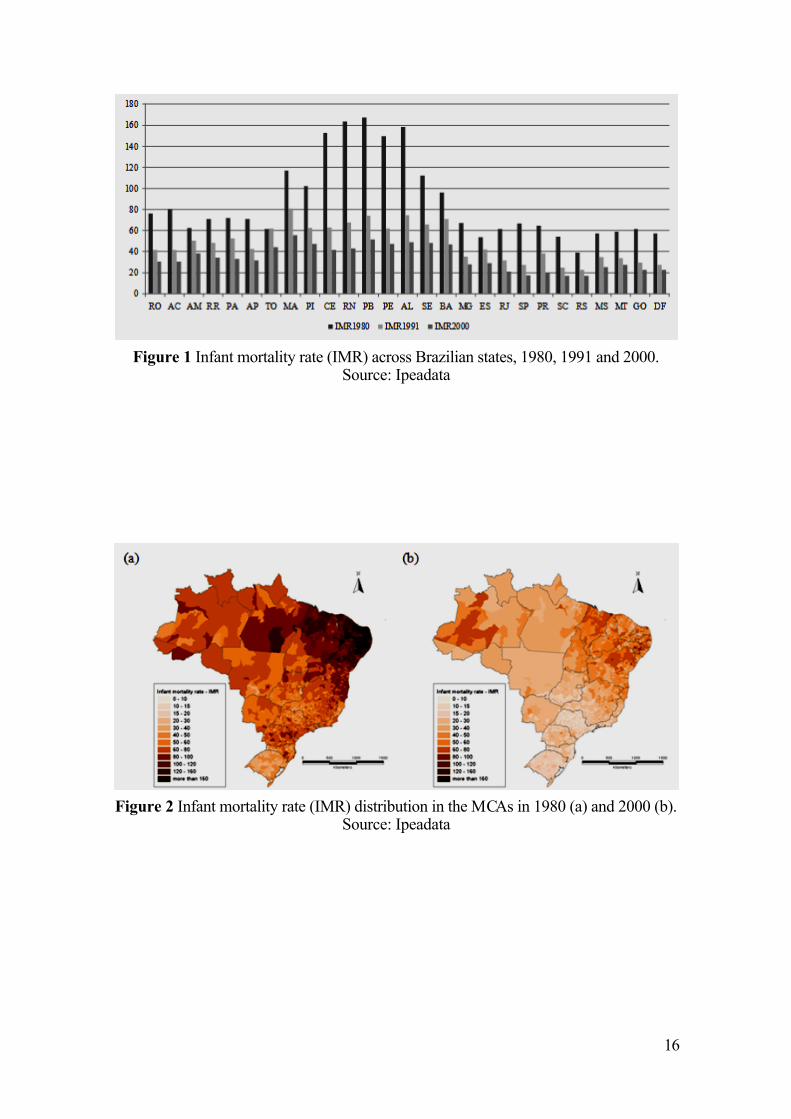
With regards to infant mortality, Brazil has shown consistent reduction of rates in the last decades, moving from 123.19 deaths per 1,000 people born alive in 1970 to 30.57 deaths per 1,000 people in 2000.7 However, there is a significant regional variation in the pattern of reduction, as can be seen in Figure 1.
The states of the Northeast of Brazil8, in 1980, noticeably had a higher level of infant mortality than the rest of the country. In spite of showing substantial reductions, these states still had the highest infant mortality rates in the country in 2000.
Figure 1
Furthermore, it is possible to analyze the change in the distribution of the IMR in a more disaggregated way, as seen in Figure 2. Analysis is based on the Minimum Comparable Areas (MCA, 3,659 units), created by the Applied Institute of Economic Research (IPEA) for the purpose of making official statistics comparable between census years. These areas guarantee that each unit of analysis has the same size in every period; then, it is possible to consider both merges and splits of municipalities.9
The maps presented in Figure 2 show a very distinctive regional pattern, characterized by high levels of IMR concentrated in part of the Northeast and small levels of IMR in the South of Brazil. Even though there has been a broad reduction in IMR levels from 1980 to 2000, this regional inequality still remains quite clear.
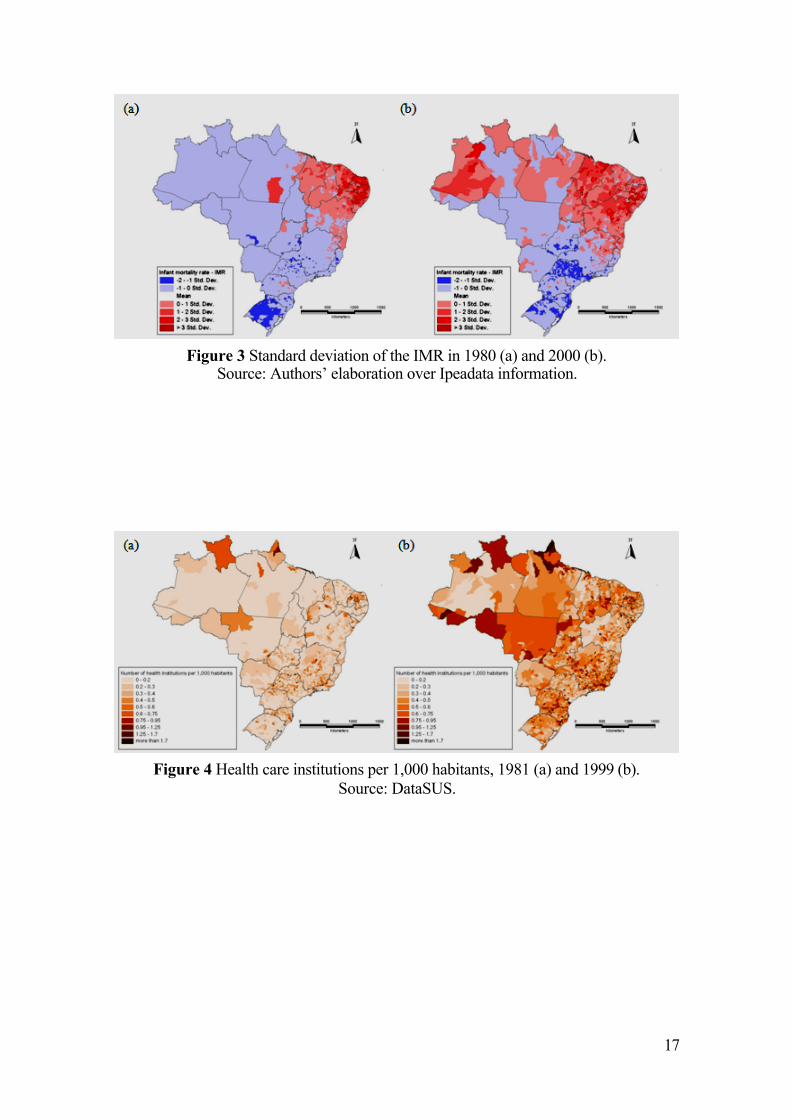
Figure 2
Figure 3 displays the standard deviation of this variable across the country. Clearly, both in 1980 and 2000, the highest values over the average are in the Northeast and the lowest ones are in the Southeast. However, it is important to note that in 2000, due to the overall reduction in the infant mortality rate, the groups with extreme values became bigger, which means that the general inequality has been reduced. In spite of that, there are still relatively IMR high values in some areas of the country that reveal a relative backwardness. Markedly, the gains in reducing infant mortality have been uneven, and the developmental challenge of improving life conditions remains to be fully addressed.
Figure 3
One of the most commonly used factors to explain the pattern of IMR is the supply of health services. Sastry (1996), Leal and Szwarcwald (1997), Hanmer et al. (2003) and Macinko et al. (2006), among others, highlight the relevance of providing health care services in past reductions of infant mortality in the Brazilian context.
Health can be considered a public good or at least a semipublic good, in the sense that it has a high level of externalities (the benefits that come from its consumption are not totally internalized by the individual who purchases it). Besides, the government provision has also a social role. When the prices of health services are defined in the market, there may be an exclusion of the access to it of a significant portion of the population. It can be prejudicial to the survival of the individuals, justifying public provision (Rezende (2001) and Musgrove (2004)).
In the Brazilian context, Baer et al. (2000) highlight that public provision of health services was not directed to the poorer class, at least until the 1990’s. Highly specialized services were often offered to and accessed by high and medium income individuals. At the same time, basic services supply was neglected, resulting in a congested and low

5
quality provision. Therefore, poor people often had to resort to relatively costly private services, or go without access to health care at all.
Showing this under-provision of public health care, less than 30% of hospital beds were in public institutions in 1999, according to data from IBGE (Pesquisa de Assistência Médica e Sanitária). As death in the first year of life is usually highly correlated to income, this unequal health care access may have its part in the explanation of the patterns of infant mortality still observed in the country. Therefore, the provision of health care may not have the expected effect in the reduction of infant mortality. Figure 4 reinforces this argument, showing that the spatial distribution of health care institutions does not seem to have a similar regional pattern of the IMR.
Figure 4
Therefore, other variables must explain this regional inequality. In the search of relevant factors, usually socioeconomic variables are included and many studies have found significant relationship among the improvement of social conditions and the reduction of infant mortality.10 This can be seen in Figure 5, where the distribution of the poverty rate is compared between 1980 and 2000. Noticeably, the poverty rate distribution is much more similar to the IMR one comparing with the distribution of health infrastructure.
Other variables that can be included in this group are the level of education and the income inequality. For the first one, the literature points out that in general an increase in the education of the population has a strong effect over the measures that the families adopt to avoid basic health problems. For the latter, there is no conclusion of the direction of its effect over IMR. The worsening of health outcomes can happen because of psychological issues and underinvestment on infrastructure in the unfavorable areas (Shi et al., 2004), or because of the concentration of poverty, that can help the proliferation of diseases (Szwarcwald et al., 2002).
Figure 5
Deaton (2003) proposes a theoretical framework in which progressive income redistribution would result in improved health measures following decreasing returns of income over health outcomes. Therefore, inequality reduction should be expected to reduce infant mortality rates.
The conceptual framework used in this paper follows the model proposed by Mosley and Chen (1984).11 The authors use the concept of proximate determinants to assess the effect of indirect determinants. The more variables regarded as relevant in the model, the better estimated is the real effect of them over the IMR.
This framework considers an exhaustive set of factors. However, as is usually the case, there are many relevant dimensions of it for which information is not available, or if data exist, may not be for all the years and the spatial disaggregation needed. This is an important consideration given the well-known impacts of omitted relevant variables in analysis (see for instance Greene, 2003). It creates statistical problems that can be manifested in the form of extremely high spatial autocorrelation, that is, a systematic clustering of residuals values that violates the basic assumptions of independence in regression analysis. There are many ways of dealing with this issue, depending on what is causing it (Anselin and Griffith, 1988). The approach employed here helps to correct for omitted relevant variables and the resulting autocorrelation problem, and is described in more detail in Annex 1.
6
Figure 6
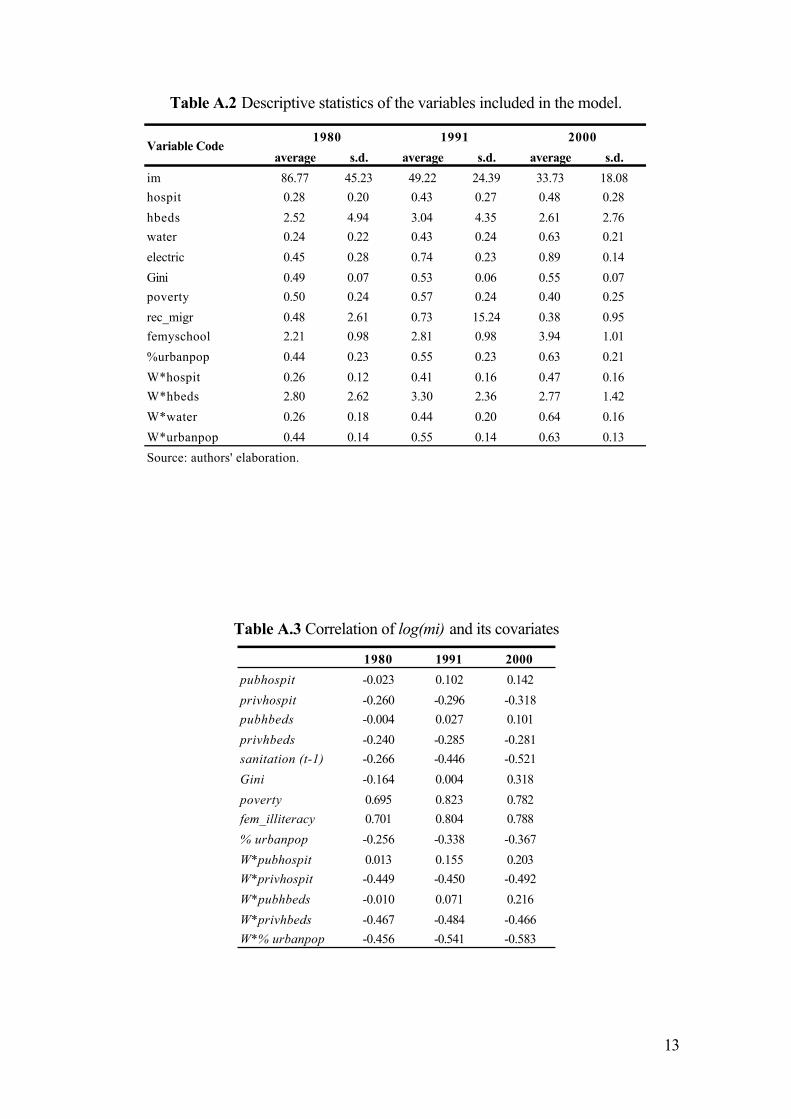
Our analysis was bounded by the data available for the desired period and level of regional disaggregation. The main data used in the present study are the 1980, 1991 and 2000 Brazilian Census of Population (Censo Demográfico, Instituto Brasileiro de Geografia e Estatística – IBGE). In 1980, the sample consists of 25 percent of the population. Both in 1991 and in 2000, the samples have been constituted in a 10 percent base for localities with more than 15.000 habitants and a 20 percent base otherwise. The variables obtained from these sources refer to income, inequality, education, size of the population and other characteristics of the areas of analysis.
Health service information is derived using data obtained from the Medical and Sanitary Assistance Surveys, of 1981, 1990 and 1999.12 This is an annual survey by the Brazilian Ministry of Health, and based on it we could obtain hospital beds and health institutions information, as proxies for health care provision. More details on the variables can be found in Annex 2.
Results
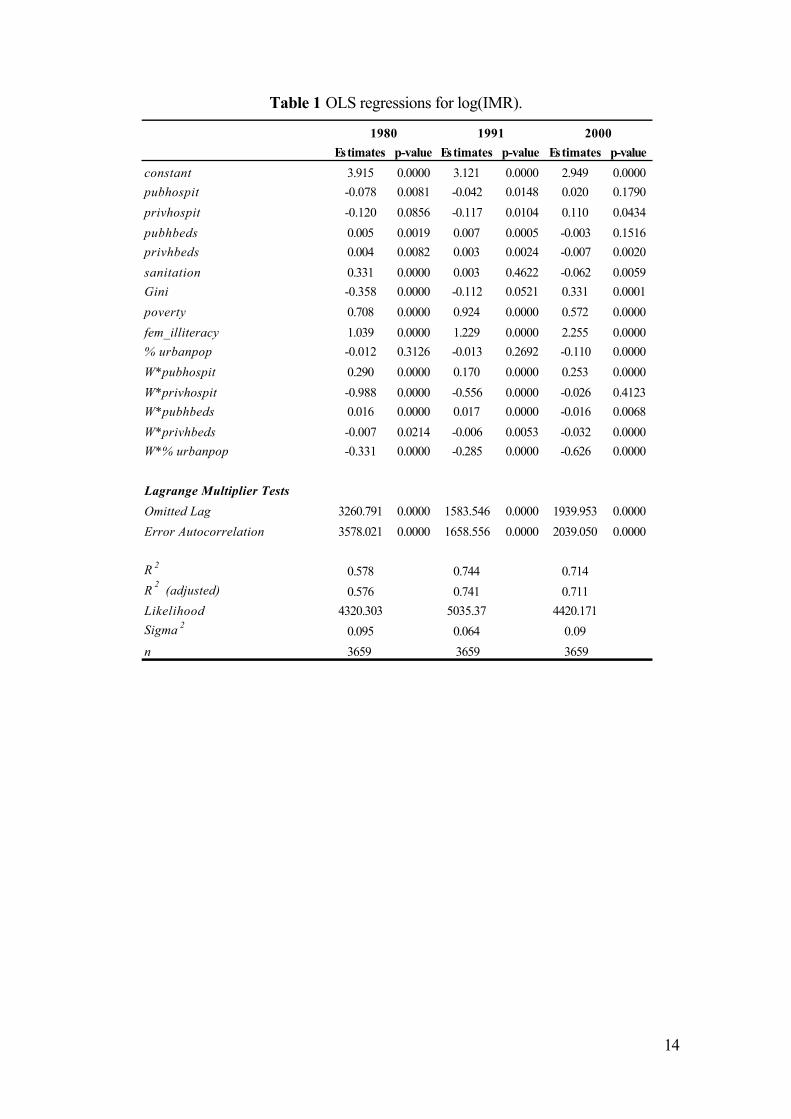
Analysis was conducted by means of ordinary least squares (OLS) regressions for each year. Table 1 shows the first of the models estimated in order to explain the pattern of infant mortality in the MCA of Brazil. One of the diagnostic tests used for the evaluation of the model identifies that this strategy implies in very high and significant spatial autocorrelation, what generates inefficient and biased estimates. One of the possible methods to solve this problem is the spatial filtering approach described in Annex 1. This solution avoids the adoption of any hypothesis regarding the most suitable models to explain the spatial dependence.
Table 1
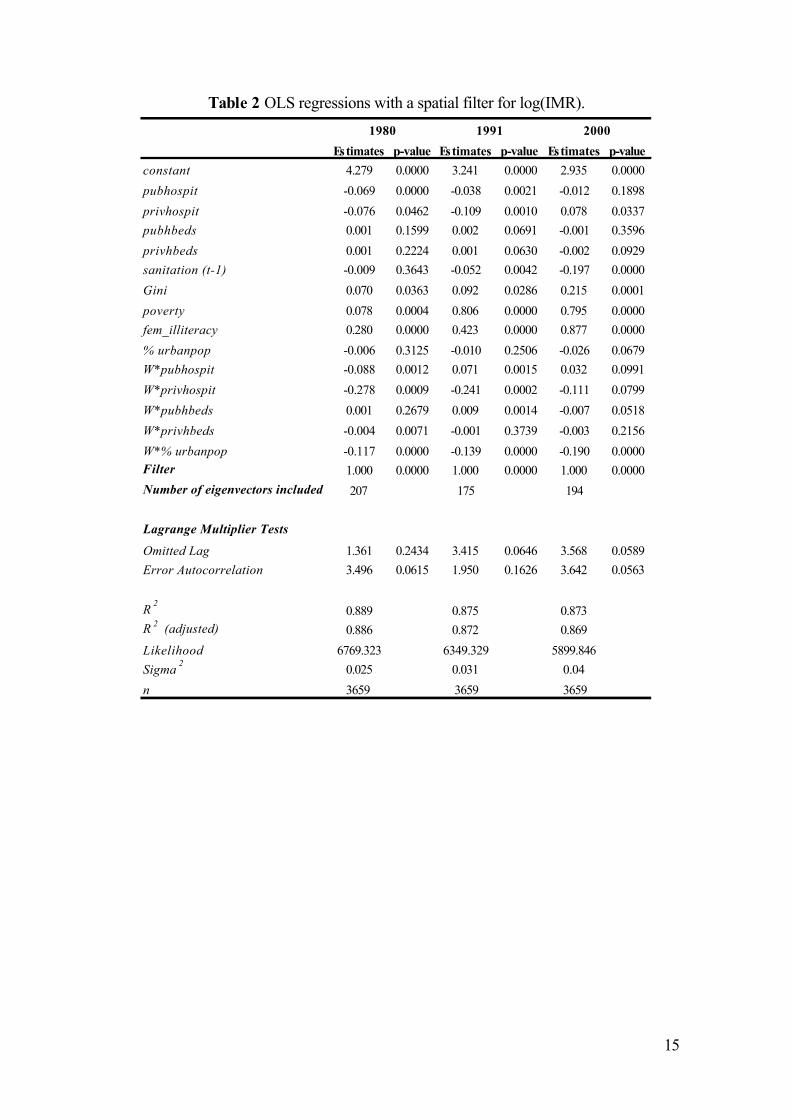
With the application of a spatial filter and the spatial lag of some of the variables, the results shown in Table 2 are obtained. Getis and Griffith (2002) show that after the inclusion of the spatial filter, OLS can be used in a regression that previously had spatial autocorrelation. Spatially lagged variables measure regionally available health care services and the urban size of the neighbors, beyond that of the unit itself. In the case of urban population, for example, the spatial lag is an indicator of the degree of urbanization in neighboring areas. As seen in the table, application of a spatial filter solves the problem of spatial autocorrelation, thus resulting in consistent coefficients. The first aspect to be pointed out is that all the models have a high fit, measured by the R2 statistic (when there is no autocorrelation problem, this statistic can be analyzed in the OLS framework), which is higher than 0.87 in every year.
Regarding health care facilities offered around the country, the main effect is captured by pubhospit and privhospit variables and their spatial lags. From that, it is possible to conclude that the increase in the number of health care institutions in a specific area contributes to the reduction of the IMR, as expected. The spatial lag (or the weighted average of the number of health care institutions of the neighbors) indicates that there is also a regional spillover effect. It means that investments in health care facilities have an effect that goes beyond the unit of analysis, to positively impact neighboring zones as well by reducing infant mortality rates there as well. Given the fine level of spatial aggregation used in this study, it may also be capturing the hierarchical provision of health services in the Brazilian urban system.
7
Table 2
In this sense, it is possible to conclude that health investments can have spillover effects, meaning that there is an additional set of information to be considered when evaluating the cost-benefit relation of specific health programs, an aspect that to our knowledge has not been reported in the literature before. Another important result to note is that the direct effect of health care infrastructure decreases over time until in 2000 it is not significant anymore. As explained below, this may indicate a point where most potential benefits of health care infrastructure have been attained.
Another spatially lagged variable, W*pubhbeds, is significant only for 1991, with a positive sign. It means that if a unit has neighbors that showed an increase in the number of public hospital beds, then infant mortality may also increase in this central area. An explanation for this adverse effect can be the concentration of ill people looking for health care services in those centers with higher capacity.
Housing infrastructure provision (sanitation access) seems to have a negative effect over the IMR, as previous work has shown. It is important to notice that this variable is temporarily lagged, which means the value used is the one of 10 years before the IMR observation. It is so because sanitation provision may have a long-run effect over health outcomes of the population, meaning that diseases will be reduced slowly on time after an area’s service has been improved.13
As expected, the female illiteracy rate increases the IMR. Moreover, over the course of time, this factor has become increasingly relevant in the explanation of IMR, replacing the leading role of health care infrastructure. A similar trend is observed for another socioeconomic measure, poverty, with the analysis indicating that income has continued to have a significant and increasing impact over infant mortality. It is noteworthy that at the same time that socioeconomic variables gained relevance in our analysis, health infrastructure lost some significance. This can be seen as an increase in the importance of prevention of health problems based on the increase of information related to family behavior to avoid simple problems that could result in infant death.
In relation to this as well, income inequality has also an adverse effect over health outcomes, probably because the concentration of poverty generates an environment that is suitable for the proliferation of diseases, as discussed in the previous section. This coefficient confirms the expected result of Deaton’s model (Deaton, 2003), reaffirming the idea of decreasing returns of income over health outcomes.
The degree of urbanization does not seem to have an influence over the IMR. A possible reason for that is that its main effect may be being captured by other variables indirectly, as for instance facilities provision. However, high urbanization in the neighborhood reduces the IMR in the MCA considered (with a stronger effect in the later decades).
Discussion
The results presented above indicate that there is a relevant spatial effect to be considered when the object of study is the IMR. One of the causes for this very high level of spatial autocorrelation is the omission of relevant variables in the model. All relevant variables are not readily available for the period under analysis, and therefore the application of spatial analysis techniques was needed. The method of spatial filtering allows us to clean the model from this effect and then analyze the results

8
obtained. There are some neighbor’s effects that can be observed as well, measured by the inclusion of spatial lags of some of the explanatory variables.
Health care facilities appear to be less important to the reduction of the IMR than advocated in the literature – and their effect has been reduced along the decades. A possible reason for it is that at first, when the level of infant mortality was extremely high across the country, policies that attempted to spread health care provision had a significant result. Later on, IMR achieved a level that was more affected by the prevention inside the family.
Moreover, as has been already discussed, in Brazil the unequal access to health care until now may have reduced the effect of health services expansion. Early death is highly related to low income, and poor people have less access to high quality health care. Therefore, socioeconomic improvements seem to be more important to explain the IMR reduction. More than that, policies that aim to disseminate information related to hygienic habits, nutritional facts and other relevant aspects that can influence children health have gained higher importance to promote the reduction of the IMR.
In other words, providing health care infrastructure appears to be an important initial condition for reducing IMR. However, additional measures related to the family environment can improve it even more. Importantly, there are also spatial spillover effects (represented in the analysis by means of lagged variables) indicating that the effect of health infrastructure tends to be widespread.
With the onset of diminishing returns to health infrastructure, other elements become stronger predictors of the observed pattern. The main ones are related to socioeconomic aspects (namely, poverty, education and income inequality). The main conclusion that can be drawn from this result is that after the IMR has been reduced to a certain level, public policy should concentrate its efforts in the alleviation of deprivation and in long-term policies to increase the level of education, based on the idea of prevention.
This aspect is in agreement with the arguments of Sen (2005), who highlights the importance of the connection of the many dimensions of development. Promoting development means increasing the freedom of people, and as it has been already said, infant mortality is an important measure of this development. Even though, Amartya Sen emphasizes that better results can be obtained when not only the outcome variable is directly addressed, but also other relevant dimensions are promoted (for instance, education). The interaction between these dimensions is another channel to promote the increase of freedom.14
Another important conclusion comes from the degree of urbanization, which is not significant locally, but generates positive externalities to the neighbor areas in terms of the reduction of the IMR. Locally, other variables may be capturing the effects of a higher urban area in the own minimum comparable area, but there is still room for such a variable in the neighboring relationship.
Summing up, the most effective policy to promote the reduction of the IMR in Brazil seems to be the one that promotes better socioeconomic conditions, in order to increase diseases’ prevention. Health care investments are important, but seem to have lost their power to change this situation in recent years.
Further studies should try to identify other factors that cause this singular regional pattern in infant mortality, as well as include other variables that are not currently available. As soon as another census research becomes available, it is important to evaluate if the movement captured in this study continues to be observed. In other
9
words, is this reduction of the importance of health care facilities and the increase of socioeconomic variables as explanatory factors for the IMR still happening? With this question in mind, it is possible to obtain interesting recommendations for future policies.
Conclusion
The study suggests that there has been a change in the main factors that can explain the reduction of infant mortality rates in the last few decades. One possible reason for it is that infant mortality causes such as the ones affected by vaccination policy that could be easily addressed by health care provision, are not anymore the main ones. The remaining mortality may have deep roots in cultural aspects and other factors affected by socioeconomic conditions. Then, policies should try to provide better life conditions in general, at least in the Brazilian context.
Acknowledgements
This work was supported by The State of São Paulo Research Foundation grant (FAPESP, [ 07/52432-0]), the Foreign Affairs and International Trade Canada (DFAIT) with a Graduate Students Exchange Program grant (GSEP), and by the Fundação Instituto de Pesquisas Econômicas (FIPE). The authors would like to thank the Economic Department and the School of Economics, Business and Accounting at the University of São Paulo, as well as the Geography Department at McMaster University, by their fundamental support as places where this research was conducted. They provided the ideal environment for the discussion and formulation of hypothesis of this work. Eduardo Haddad acknowledges also financial support by the National Council for Scientific and Technological Development (CNPq).
References
Alves, D.; Belluzzo, W. 2004. Infant mortality and child health in Brazil. Economics and Human Biology 2: 391-410.
Amaral, J.; Leite, A.J.M.; Cunha, A.J.L.A.;Victora, C.G. 2005. Impacto f IMCI health worker training on routinely collected child health indicators in Northeast Brazil. Health Policy and Planning, 20: i42-i48.
Anselin, L. 1988. Spatial Econometrics: Methods and Models. London: Kluwer Academic Publishers.
Anselin, L.; Griffith, D.A. 1988. Do spatial effects really matter in regression analysis? Papers of the Regional Science Association 65: 11-34.
Baer, W.; Campino, A.C.C.; Cavalcanti, T. 2000. Condições e política de saúde no Brasil. Economia Aplicada, 4: 763-785.
Becker, G.S.; Lewis, H.G. 1973. On the interaction between the quantity and the quality of children. The Journal of Political Economy, New Economic Approaches to Fertility (Mar-Apr) 81: S279-S288.
Bezerra-Filho, J.G; Kerr, L.R.F.S.; Miná, D.L.; Barreto, M.L. 2007. Distribuição espacial da taxa de mortalidade infantil e principais determinantes no Ceará, Brasil, no período 2000-2002. Cadernos de Saúde Pública 23: 1173-1185.
Deaton, A. 2003. Health inequality and economic development. Journal of Economic Literature 41: 113-158.

10
Devarajan, S.; Miller, M.J.; Swanson, E.V. 2002. Goals for development: history, prospects and costs. World Bank Policy Research Paper, no. 2819, Washington, World Bank.
Getis, A.; Griffith, D.A. 2002. Comparative spatial filtering in regression analysis. Geographical Analysis 34: 130-140.
Greene, W.H. 2003. Econometric Analysis. 5th edn. New Jersey: Prentice Hall.Griffith, D.A. 1996. Spatial autocorrelation and eigenfucntions of the geographic
weights matrix accompanying geo-referenced data. The Canadian Geographer40: 351-367
Griffith, D.A. 2000. A linear regression solution to the spatial autocorrelation problem. Journal of Geographic Systems 2, pp. 141-156.
Guanais, F.C.; Macinko, J. 2009. The health effects of decentralizing primary care in Brazil. Health Affairs 28: 1127-1135.
Hanmer, L.; Lensink, R.; White, H. 2003. Infant and child mortality in developing countries: analyzing the data for robust determinants. Journal of Development Studies 40: 101-118.
Leal, M. do C.; Szwarcwald, C.L. 1997. Características da mortalidade neonatal no Estado do Rio de Janeiro na década de 80: uma visão espaço-temporal. Revista de Saúde Pública 31: 457-465.
Lock, K.; Andreev, E.M.; Shkolnikov, V.; McKee, M. 2002. What targets for international development policies are appropriate for improving health in Russia? Health Policy and Planning 17: 257-263.
Macinko, J.; Guanais, F.C.; Souza, M.F.M. (2006) Evaluation of the impact of the Family Health Program on infant mortality in Brazil, 1990-2002. Journal of Epidemiology and Community Health 60: 13-19.
Mosley, W.H.; Chen, L.C. 1984. An analytical framework for the study of child survival in developing countries. Population and Development Review, Supplement: Child Survival/ Strategies for Research 10: 25-45.
Musgrove, P. 2004 Public and private roles in health. In Musgrove, P. (ed.) Health Economics in Development. The World Bank, Washington D.C. 34-75.
Patuelli, R.; Griffith, D.A.; Tiefelsdorf, M. ; Nijkamp, P. 2006. The use of spatial filtering techniques. Tinbergen Institute Discussion Paper TI 2006-049/3.
Peixoto, S.G.D. 2008. Eficácia e Gestão da Política de Atenção Básica de Saúde nos Municípios Brasileiros. Master’s Thesis, FEA-USP, São Paulo.
Preston, S.H. 1996. Population studies of mortality. Population Studies 50: 525-536.Pritchett, L.; Summers, L.H. (1996). Wealthier is healthier. The Journal of Human
Resources 31: 841-868.Ravaillon, M. 1997. Good and bad growth: the Human Development Reports. World
Development 25: 631-638. Reis, E.; Pimentel, M.; Alvarenga, A.I. 2007. Áreas mínimas comparáveis para os
períodos intercensitários de 1872 a 2000. Available in www.nemesis.org.brRezende, F. 2001. Finanças Públicas. 2nd Edition, Editora Atlas, São Paulo.Rosenberg, E.; Alves, D.; Timmins, C.; Evenson, R. 2000. Health, climate and
development in Brazil: a cross-section analysis. Research Network Working PaperR-386, Inter-American Development Bank.
Sastry, N. 1996. Community characteristics, individual and household attributes, and child survival in Brazil. Demography 33: 211-229.
Sen, A. 1992. Inequality Reexamined. Oxford University Press.Sen, A. 2005. Desenvolvimento Como Liberdade. 5th edn. São Paulo: Companhia das
Letras.

11
Shi, L.; Macinko, J.; Starfield, B.; Xu, J.; Regan, J.; Politzer, R.; Wulu, J. 2004. Primary care, infant mortality, and low birth weight in the states of the USA. Journal of Epidemiology and Community Health, 58: 374-380.
Soares, R. 2007 Health and the evolution of welfare across Brazilian municipalities. Journal of Development Economics, 84: 590-608.
Szwarcwald, C.L.; Andrade, C.L.T.; Bastos, F.I. 2002. Income inequality, residential poverty clustering and infant mortality: a study in Rio de Janeiro, Brazil. Social Science and Medicine, 55: 2083-2092.
Thomas, D.; Strauss, J.;Henriques, M. H. 1990. Child survival, height for age and household characteristics in Brazil. Journal of Development Economics, 33: 192-234.
Victora, C.G.; Grassi, P.R.; Schmidt, A.M. 1994. Situação de saúde da criança em área da região sul do Brasil, 1980-1992: tendências temporais e distribuição espacial. Revista de Saúde Pública, 28: 423-432.
Wehby, G.L.; Murray, J.C.; Castilla, E.E.; Lopez-Camelo, J.S.; Ohsfeldt, R.L. 2009. Prenatal care effectiveness and utilization in Brazil. Health Policy and Planning. 24: 175-188.
Appendix
Annex 1 Spatial filtering method
The technique applied in this study involves the use of a spatial filter, which bases itself in a spatial weights matrix15. As we are dealing with areal data, in a health outcome framework, the most appropriated weights matrix is based on contiguity16, with the neighborhood defined by the “queen” criterion. This matrix C is standardized by the sum of the values of each line, obtaining a matrix W.
The results presented in Table 1 show that there are strong autocorrelation problems in the model estimated. It implies that ordinary least squares estimators are biased and inefficient, or just inefficient (depending on the cause of this problem), so it is necessary to use another estimation strategy or a method that takes this autocorrelation into account.
Griffith (1996, 2000) proposes an alternative that “cleans” the model from any spatial autocorrelation and simplifies the model estimation. Considering the W matrix mentioned above and the model given by (1), it is possible to apply autocorrelation tests to identify spatial dependency (LM tests and Moran’s I).
Furthermore, defining as a projection matrix that centralizes Y (1 is a
vector nx1 filled with ones), the Moran’s I can be obtained from (2):
Griffith identifies an intrinsic relationship between (2) and the eigenvalues of MCM:
each one of the latter, if multiplied by results in a Moran Coefficient. Extracting the
n eigenvalues and eigenvectors of MCM (that are mutually orthogonals), the author can obtain the spatial dependency structure represented by the weights matrix. One

12
criterion to define the order of extraction of these eigenvectors is the size of the Moran Coefficient related to them (from the higher to the smaller). Due to the orthogonality of the eigenvectors and their relationship with the final Moran Coefficient, they can be included one by one in (1) through a linear combination, until the autocorrelation problem is sufficiently represented. However, only the significant ones are taken into account in this process.
This method was applied using the software MAT-LAB. After running the first regressions, identifying the spatial dependency problem, the significant eigenvectors were included. After each one was included, we calculated the LM statistics (distributed as χ2). The criterion to stop this process was the 5% significance level. Routines are available from the authors.
Annex 2 Description and statistics of the variables used in the model
Table A.1 Description of the variables included in the model.
Variable name Code Description Source Reference years
Infant mortality im Number of people that will not complete 1
year of life from 1,000 born alive in the
reference year.
IPEAdata 1980, 1991 and 2000
Number of public health
care institutions per 1,000
people
pubhospit Number of public health care institutions in
the MCA divided by the population and
multiplied by 1,000.
DATASUS - IBGE (Assistência
Médica e Sanitária)
1981, 1990 and 1999 *
Number of private health
care institutions per 1,000
people
privhospit Number of private health care institutions
in the MCA divided by the population and
multiplied by 1,000.
DATASUS - IBGE (Assistência
Médica e Sanitária)
1981, 1990 and 1999 *
Number of public hospital
beds per 1,000 people
pubhbeds Number of public hospital beds in the
MCA divided by the population and
multiplied by 1,000.
DATASUS - IBGE (Assistência
Médica e Sanitária)
1981, 1990 and 1999 *
Number of private hospital
beds per 1,000 people
privhbeds Number of private hospital beds in the
MCA divided by the population and
multiplied by 1,000.
DATASUS - IBGE (Assistência
Médica e Sanitária)
1981, 1990 and 1999 *
% of households with
access to public sanitation
sanitation Percentage of households with access to
public sanitation.
IPEAdata - IBGE 1970, 1980 and 1991
Gini index Gini Index that ranges from 0 (complete equality
in the income distribution) to 1 (only one
person concentrates the income), obtained
from the per capita household income.
Microdata of the Demographic
Census (IBGE)
1980, 1991 and 2000
% of people under the
poverty line
poverty Percentage of people with declared income
with less than R$ 75.50 as their per capita
household income (R$ of 2000).
Microdata of the Demographic
Census (IBGE)
1980, 1991 and 2000
Female illiteracy rate fem_illiteracy Number of women older than 5 years that
are illiterate over the total of women older
than 5.
Microdata of the Demographic
Census (IBGE)
1980, 1991 and 2000
% of urban population % urbanpop Percentage of people living in the urban
area of the MCA.
IPEAdata 1980, 1991 and 2000
Spatial lag of pubhospit W*pubhospit Spatial lag (average of the neighbors) of
the number of public health care
insititutions over 1,000 people.
Microdata of the Demographic
Census (IBGE)
1980, 1991 and 2000
Spatial lag of privhospit W*privhospit Spatial lag (average of the neighbors) of
the number of private health care
insititutions over 1,000 people.
Microdata of the Demographic
Census (IBGE)
1980, 1991 and 2000
Spatial lag of pubhbeds W*pubhbeds Spatial lag (average of the neighbors) of
the number of public hospital beds over
1,000 people.
Microdata of the Demographic
Census (IBGE)
1980, 1991 and 2000
Spatial lag of privhbeds W*privhbeds Spatial lag (average of the neighbors) of
the number of private hospital beds over
1,000 people.
Microdata of the Demographic
Census (IBGE)
1980, 1991 and 2000
Spatial lag of %urbanpop W*% urbanpop Spatial lag (average of the neighbors) of
the percentage of people living in the urban
area of the MCA.
IPEAdata 1980, 1991 and 2000
* padronization made with the population of 1980, 1991 and 2000, respectively.
13
Table A.2 Descriptive statistics of the variables included in the model.
Table A.3 Correlation of log(mi) and its covariates
average s.d. average s.d. average s.d.
im 86.77 45.23 49.22 24.39 33.73 18.08
hospit 0.28 0.20 0.43 0.27 0.48 0.28
hbeds 2.52 4.94 3.04 4.35 2.61 2.76
water 0.24 0.22 0.43 0.24 0.63 0.21
electric 0.45 0.28 0.74 0.23 0.89 0.14
Gini 0.49 0.07 0.53 0.06 0.55 0.07
poverty 0.50 0.24 0.57 0.24 0.40 0.25
rec_migr 0.48 2.61 0.73 15.24 0.38 0.95
femyschool 2.21 0.98 2.81 0.98 3.94 1.01
%urbanpop 0.44 0.23 0.55 0.23 0.63 0.21
W*hospit 0.26 0.12 0.41 0.16 0.47 0.16
W*hbeds 2.80 2.62 3.30 2.36 2.77 1.42
W*water 0.26 0.18 0.44 0.20 0.64 0.16
W*urbanpop 0.44 0.14 0.55 0.14 0.63 0.13
Source: authors' elaboration.
Variable Code1980 1991 2000
1980 1991 2000
pubhospit -0.023 0.102 0.142
privhospit -0.260 -0.296 -0.318
pubhbeds -0.004 0.027 0.101
privhbeds -0.240 -0.285 -0.281
sanitation (t-1) -0.266 -0.446 -0.521
Gini -0.164 0.004 0.318
poverty 0.695 0.823 0.782
fem_illiteracy 0.701 0.804 0.788
% urbanpop -0.256 -0.338 -0.367
W*pubhospit 0.013 0.155 0.203
W*privhospit -0.449 -0.450 -0.492
W*pubhbeds -0.010 0.071 0.216
W*privhbeds -0.467 -0.484 -0.466
W*% urbanpop -0.456 -0.541 -0.583
14
Table 1 OLS regressions for log(IMR).
Estimates p-value Estimates p-value Estimates p-value
constant 3.915 0.0000 3.121 0.0000 2.949 0.0000
pubhospit -0.078 0.0081 -0.042 0.0148 0.020 0.1790
privhospit -0.120 0.0856 -0.117 0.0104 0.110 0.0434
pubhbeds 0.005 0.0019 0.007 0.0005 -0.003 0.1516
privhbeds 0.004 0.0082 0.003 0.0024 -0.007 0.0020
sanitation 0.331 0.0000 0.003 0.4622 -0.062 0.0059
Gini -0.358 0.0000 -0.112 0.0521 0.331 0.0001
poverty 0.708 0.0000 0.924 0.0000 0.572 0.0000
fem_illiteracy 1.039 0.0000 1.229 0.0000 2.255 0.0000
% urbanpop -0.012 0.3126 -0.013 0.2692 -0.110 0.0000
W*pubhospit 0.290 0.0000 0.170 0.0000 0.253 0.0000
W*privhospit -0.988 0.0000 -0.556 0.0000 -0.026 0.4123
W*pubhbeds 0.016 0.0000 0.017 0.0000 -0.016 0.0068
W*privhbeds -0.007 0.0214 -0.006 0.0053 -0.032 0.0000
W*% urbanpop -0.331 0.0000 -0.285 0.0000 -0.626 0.0000
Lagrange Multiplier Tests
Omitted Lag 3260.791 0.0000 1583.546 0.0000 1939.953 0.0000
Error Autocorrelation 3578.021 0.0000 1658.556 0.0000 2039.050 0.0000
R 2 0.578 0.744 0.714
R2
(adjusted) 0.576 0.741 0.711
Likelihood 4320.303 5035.37 4420.171
Sigma 2 0.095 0.064 0.09
n 3659 3659 3659
1980 1991 2000
15
Table 2 OLS regressions with a spatial filter for log(IMR).
Estimates p-value Estimates p-value Estimates p-value
constant 4.279 0.0000 3.241 0.0000 2.935 0.0000
pubhospit -0.069 0.0000 -0.038 0.0021 -0.012 0.1898
privhospit -0.076 0.0462 -0.109 0.0010 0.078 0.0337
pubhbeds 0.001 0.1599 0.002 0.0691 -0.001 0.3596
privhbeds 0.001 0.2224 0.001 0.0630 -0.002 0.0929
sanitation (t-1) -0.009 0.3643 -0.052 0.0042 -0.197 0.0000
Gini 0.070 0.0363 0.092 0.0286 0.215 0.0001
poverty 0.078 0.0004 0.806 0.0000 0.795 0.0000
fem_illiteracy 0.280 0.0000 0.423 0.0000 0.877 0.0000
% urbanpop -0.006 0.3125 -0.010 0.2506 -0.026 0.0679
W*pubhospit -0.088 0.0012 0.071 0.0015 0.032 0.0991
W*privhospit -0.278 0.0009 -0.241 0.0002 -0.111 0.0799
W*pubhbeds 0.001 0.2679 0.009 0.0014 -0.007 0.0518
W*privhbeds -0.004 0.0071 -0.001 0.3739 -0.003 0.2156
W*% urbanpop -0.117 0.0000 -0.139 0.0000 -0.190 0.0000
Filter 1.000 0.0000 1.000 0.0000 1.000 0.0000
Number of eigenvectors included 207 175 194
Lagrange Multiplier Tests
Omitted Lag 1.361 0.2434 3.415 0.0646 3.568 0.0589
Error Autocorrelation 3.496 0.0615 1.950 0.1626 3.642 0.0563
R2
0.889 0.875 0.873
R 2 (adjusted) 0.886 0.872 0.869
Likelihood 6769.323 6349.329 5899.846
Sigma2
0.025 0.031 0.04
n 3659 3659 3659
1980 1991 2000
16
Figure 1 Infant mortality rate (IMR) across Brazilian states, 1980, 1991 and 2000.Source: Ipeadata
Figure 2 Infant mortality rate (IMR) distribution in the MCAs in 1980 (a) and 2000 (b).Source: Ipeadata
17
Figure 3 Standard deviation of the IMR in 1980 (a) and 2000 (b).Source: Authors’ elaboration over Ipeadata information.
Figure 4 Health care institutions per 1,000 habitants, 1981 (a) and 1999 (b).Source: DataSUS.

18
Figure 5 Poverty rate (% of the population under the poverty line – R$ 75.50 in values of 2000), 1980 (a) and 2000 (b).
Source: Micro-data of the Demographic Census, IBGE.
Figure 6 Operation of the five groups of proximate determinants on the health dynamics of a population.
Source: Adapted from Mosley and Chen (1984).
1 See Lock et al. (2002).2 See Devarajan et al. (2002).3
See Pritchett and Summers (1996) and Ravaillon (1997), among others.4 Hanmer et al. (2003) and Preston (1996).

19
5 Arellano, M., Bond, S.R., 1991. Some tests of specification for panel data: Monte Carlo evidence and an application to employment equations. Review of Economic Studies 58: 277–297.6 See Victora et al. (1994) and Leal and Szwarcwald (1997). Amaral et al. (2005) present an analysis for some states in the Northeast including spatial dimensions as for instance the distance to the capital.7 Information obtained within www.ipeadata.gov.br8 Maranhão (MA), Piauí (PI), Ceará (CE), Rio Grande do Norte (RN), Paraíba (PB), Pernambuco (PE), Alagoas (AL), Sergipe (SE) and Bahia (BA).9 Reis et al. (2007).10
Alves and Belluzzo (2004), Bezerra-Filho et al. (2007) , Hanmer et al. (2003) and Leal and Szwarcwald (1997)11 Other studies that applied this model: Sastry (1996) and Hanmer et al. (2003).12
Information available at www.datasus.gov.br13 We thank Professor Carlos Antonio Luque for calling the attention to this point.14 See Sen (2005), pp. 57-58.15
For further information on the spatial weights matrix, see for instance Anselin (1988) and Patuelli et al. (2006).16A spatial weights matrix based on contiguity allows us to consider not only the municipal administrative units, but also the effects that cultural habits may have in the neighboring areas. Matrices based in distance, for instance, would be more suitable in a case of economic transactions, but here the main issue relates to the public policy adopted in the area, as well as the effects of policies in the neighbors.