An exploratory study on perceptions of seismic risk and mitigation in two districts of Istanbul
22
An exploratory study on perceptions of seismic risk and mitigation in two districts of Istanbul Korel Eraybar PhD candidate, Faculty of Architecture, Istanbul Technical University, Turkey, Kenji Okazaki Professor, National Graduate Institute for Policy Studies, Japan, and Alper Ilki Associate Professor, Faculty of Civil Engineering, Istanbul Technical University, Turkey Istanbul is one of the world’s cities most vulnerable to seismic events. According to seismologists, the probability of a severe earthquake in the next 30 years is approximately 40 per cent. Following an outline of the seismicity of this vital Turkish city and a summary of current seismic risks and mitigation studies, this paper presents the results of a survey conducted in two districts of Istanbul, Avcilar and Bakirkoy. The survey comprised some 60 questions on the seismic risk perceptions of individuals and requested basic personal data, such as on age, education level, employment type, financial income, and gender. Despite various differences among the survey population, such as academic background and level of financial income, responses were surprisingly similar, especially in terms of having no plan for a safer house. The data may help those planning miti- gation programmes and public awareness campaigns on preparedness and particularly mitigation in highly vulnerable regions. Keywords: earthquake, housing, mitigation, public awareness, seismic risk perception, survey Introduction Istanbul, a city connecting Asia and Europe, was the capital of the Roman, Byzantine, and Ottoman Empires and is now the most important city in Turkey, from a cul- tural, financial, and social standpoint. It is located on the North Anatolian Fault, part of the Himalayan–Mediterranean Fault. Like other parts of Turkey, Istanbul has experienced a number of severe earthquakes in the past. Around the Marmara Sea, which forms the southern border of Istanbul, there have been 34 earthquakes with a surface wave magnitude of more than 7 .0 in the last 2,000 years (Ambraseys, 2006)— that is, a severe earthquake every 60 years on average. According to a 2004 inves- tigation, the probability of a magnitude 7 .0 or higher earthquake affecting Istanbul in the next 30 years is 41±14 per cent (Parsons, 2004). The Kocaeli earthquake, which hit northwest Turkey on 16 August 1999 and reg- istered at a magnitude of 7 .4, impacted on a very large geographic area, including a section of Istanbul. Although the epicentre was some 150 kilometres east of Istanbul, a large number of buildings collapsed, causing hundreds of casualties. The inten- sity of the earthquake was greatest in west Istanbul, which has relatively weak soil doi:10.1111/j.0361-3666.2009.01115.x Disasters, 2010, 34(1): 71−92. © 2010 The Author(s). Journal compilation © Overseas Development Institute, 2010 Published by Blackwell Publishing, 9600 Garsington Road, Oxford, OX4 2DQ, UK and 350 Main Street, Malden, MA 02148, USA
-
Upload
istanbultek -
Category
Documents
-
view
1 -
download
0
Transcript of An exploratory study on perceptions of seismic risk and mitigation in two districts of Istanbul

An exploratory study on perceptions of seismic risk and mitigation in two districts of Istanbul
Korel Eraybar PhD candidate, Faculty of Architecture, Istanbul Technical University, Turkey, Kenji Okazaki Professor, National Graduate Institute for Policy Studies, Japan, and Alper Ilki Associate Professor, Faculty of Civil Engineering, Istanbul Technical University, Turkey
Istanbul is one of the world’s cities most vulnerable to seismic events. According to seismologists, the probability of a severe earthquake in the next 30 years is approximately 40 per cent. Following an outline of the seismicity of this vital Turkish city and a summary of current seismic risks and mitigation studies, this paper presents the results of a survey conducted in two districts of Istanbul, Avcilar and Bakirkoy. The survey comprised some 60 questions on the seismic risk perceptions of individuals and requested basic personal data, such as on age, education level, employment type, financial income, and gender. Despite various differences among the survey population, such as academic background and level of financial income, responses were surprisingly similar, especially in terms of having no plan for a safer house. The data may help those planning miti-gation programmes and public awareness campaigns on preparedness and particularly mitigation in highly vulnerable regions.
Keywords: earthquake, housing, mitigation, public awareness, seismic risk perception, survey
IntroductionIstanbul, a city connecting Asia and Europe, was the capital of the Roman, Byzantine, and Ottoman Empires and is now the most important city in Turkey, from a cultural, financial, and social standpoint. It is located on the North Anatolian Fault, part of the Himalayan–Mediterranean Fault. Like other parts of Turkey, Istanbul has experienced a number of severe earthquakes in the past. Around the Marmara Sea, which forms the southern border of Istanbul, there have been 34 earthquakes with a surface wave magnitude of more than 7.0 in the last 2,000 years (Ambraseys, 2006)—that is, a severe earthquake every 60 years on average. According to a 2004 investigation, the probability of a magnitude 7.0 or higher earthquake affecting Istanbul in the next 30 years is 41±14 per cent (Parsons, 2004). The Kocaeli earthquake, which hit northwest Turkey on 16 August 1999 and registered at a magnitude of 7.4, impacted on a very large geographic area, including a section of Istanbul. Although the epicentre was some 150 kilometres east of Istanbul, a large number of buildings collapsed, causing hundreds of casualties. The intensity of the earthquake was greatest in west Istanbul, which has relatively weak soil
doi:10.1111/j.03613666.2009.01115.x
Disasters, 2010, 34(1): 71−92. © 2010 The Author(s). Journal compilation © Overseas Development Institute, 2010 Published by Blackwell Publishing, 9600 Garsington Road, Oxford, OX4 2DQ, UK and 350 Main Street, Malden, MA 02148, USA
Korel Eraybar, Kenji Okazaki and Alper Ilki72
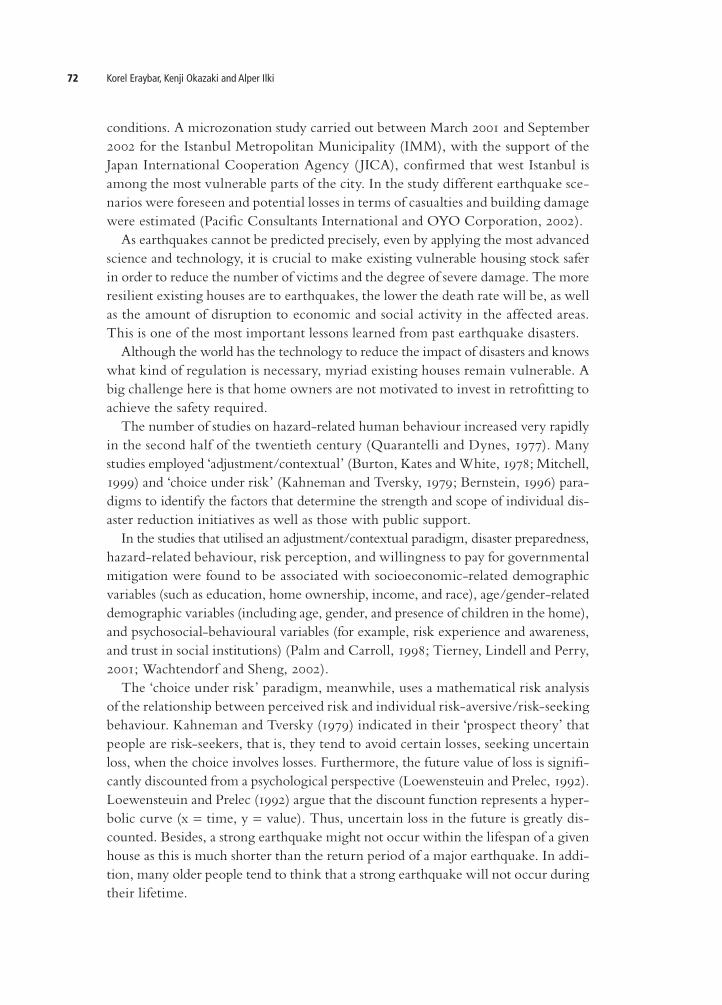
conditions. A microzonation study carried out between March 2001 and September 2002 for the Istanbul Metropolitan Municipality (IMM), with the support of the Japan International Cooperation Agency ( JICA), confirmed that west Istanbul is among the most vulnerable parts of the city. In the study different earthquake scenarios were foreseen and potential losses in terms of casualties and building damage were estimated (Pacific Consultants International and OYO Corporation, 2002). As earthquakes cannot be predicted precisely, even by applying the most advanced science and technology, it is crucial to make existing vulnerable housing stock safer in order to reduce the number of victims and the degree of severe damage. The more resilient existing houses are to earthquakes, the lower the death rate will be, as well as the amount of disruption to economic and social activity in the affected areas. This is one of the most important lessons learned from past earthquake disasters. Although the world has the technology to reduce the impact of disasters and knows what kind of regulation is necessary, myriad existing houses remain vulnerable. A big challenge here is that home owners are not motivated to invest in retrofitting to achieve the safety required. The number of studies on hazardrelated human behaviour increased very rapidly in the second half of the twentieth century (Quarantelli and Dynes, 1977). Many studies employed ‘adjustment/contextual’ (Burton, Kates and White, 1978; Mitchell, 1999) and ‘choice under risk’ (Kahneman and Tversky, 1979; Bernstein, 1996) paradigms to identify the factors that determine the strength and scope of individual disaster reduction initiatives as well as those with public support. In the studies that utilised an adjustment/contextual paradigm, disaster preparedness, hazardrelated behaviour, risk perception, and willingness to pay for governmental mitigation were found to be associated with socioeconomicrelated demographic variables (such as education, home ownership, income, and race), age/genderrelated demographic variables (including age, gender, and presence of children in the home), and psychosocialbehavioural variables (for example, risk experience and awareness, and trust in social institutions) (Palm and Carroll, 1998; Tierney, Lindell and Perry, 2001; Wachtendorf and Sheng, 2002). The ‘choice under risk’ paradigm, meanwhile, uses a mathematical risk analysis of the relationship between perceived risk and individual riskaversive/riskseeking behaviour. Kahneman and Tversky (1979) indicated in their ‘prospect theory’ that people are riskseekers, that is, they tend to avoid certain losses, seeking uncertain loss, when the choice involves losses. Furthermore, the future value of loss is significantly discounted from a psychological perspective (Loewensteuin and Prelec, 1992). Loewensteuin and Prelec (1992) argue that the discount function represents a hyperbolic curve (x = time, y = value). Thus, uncertain loss in the future is greatly discounted. Besides, a strong earthquake might not occur within the lifespan of a given house as this is much shorter than the return period of a major earthquake. In addition, many older people tend to think that a strong earthquake will not occur during their lifetime.

An exploratory study on perceptions of seismic risk and mitigation 73
Okazaki (2006) contends that even if people have a better understanding of the seismic risk they face, most people will still be reluctant to opt for seismic retrofitting, because of riskseeking nature and intertemporal discount. He urges governments to offer strong financial incentives to those who own safer houses and to convert future uncertain loss to current disadvantage through policies. Asgary and Willis (1997) reached a similar conclusion, stating that 50 per cent of residents included in their sample survey would not take any mitigatory action even if they were informed that they were residing in a location with high earthquake hazard and risk. They presented also an assessment of alternative theories of household behaviour in response to earthquake risk. This paper discusses how people perceive seismic risk, how such risk perception is shaped by economic and social aspects, and how they would like to avoid (or not avoid) such risk. It draws on social survey data acquired from 865 people (residents) in two districts of Istanbul, Avcilar and Bakirkoy, with different demographic and economic characteristics. The outcome of the research could benefit experts and policymakers, allowing them to develop policies and strategies for risk communication that fit with people’s perceptions of risk. Although various studies have been conducted on the seismic risk perceptions of people, such as Mileti and Darlington (1997) and Armas (2006), the significance of this enquiry is its focus on the economic and social situation of the survey population, the potential effects of the catastrophic 1999 Kocaeli earthquake, and the high probability of a stronger earthquake in Istanbul in the near future. Avcilar and Bakirkoy are very close to each other in southwest Istanbul, with the Marmara Sea to the south. The two districts face almost the same level of seismic risk and vulnerability—both are among the most vulnerable parts of Istanbul—but have significantly different social structures. Avcilar (Merkez quarter) is a newer residential area than Bakirkoy (Yesilkoy quarter), and the people who live in Avcilar generally have a much lower level of income than the inhabitants of Bakirkoy. The survey methodology and basic survey results follow a brief synopsis of the demographic and economic situation in Turkey and presentation of data on the existing building stock in Avcilar and Bakirkoy districts, including its age, construction type, damage due to the 1999 Kocaeli earthquake, number of storeys, and level of seismic risk in the area.
Turkey’s demographic and economic situationTable 1 presents basic demographic and economic data on Turkey, together with comparative data obtained for Japan, the European Union (EU), and the United States. Table 1 demonstrates that Turkey spans quite a large area, particularly in relation to Japan and EU countries, and has a fairly high and young population. The population growth rate is around one per cent. However, when Istanbul city is taken into account, the population growth rate rises because of immigration from almost all of the country. Currently, the population of Istanbul is estimated at some 13 million

Korel Eraybar, Kenji Okazaki and Alper Ilki74
people—approximately onefifth that of the whole of Turkey. Istanbul’s gross domestic product (GDP) is approximately oneseventh or oneeighth that of Japan and GDP per capita in Turkey is around onequarter that of Japan. It is important to note that the distribution of total annual income in Turkey is significantly unbalanced, causing social and ethical problems. It is worth emphasising also that 96 per cent of the total area of the country faces a threat of earthquakes and 98 per cent of the population lives in earthquakeprone areas.
Basic information on Avcilar and Bakirkoy districtsTable 2 contains basic demographic information on the Avcilar and Bakirkoy districts of Istanbul as well as comparative data for the whole of Istanbul and Turkey (Pacific Consultants International and OYO Corporation, 2002). One should be aware that since the survey study was carried out in the Merkez quarter of Avcilar district and the Yesilkoy quarter of Bakirkoy district, these numbers, provided as averages of whole districts, may not fully represent actual situations in survey areas. In the Yesilkoy quarter of Bakirkoy district, in particular, the economic and social situation is significantly better than that in the rest of Bakirkoy. Unfortunately, reliable demographic data is not available for quarters. Table 3 summarises the distribution of the building stock according to structural systems in Avcilar, Bakirkoy, and Istanbul. Figures 1a and 1b show the number of storeys and the construction years of buildings in Avcilar and Bakirkoy districts and in Istanbul. One can see in Figure 1a that while the majority of the building stock in Istanbul has between one and three storeys (with a further significant portion having between four and seven storeys), the majority of buildings in Avcilar and Bakirkoy have between four and seven storeys. Figure 1b reveals that buildings in Bakirkoy are much older than those in
Table 1 Basic demographic and economic data
Country Turkey Japan EU US
Area (square kilometre) 780,000 378,000 4,300,000 9,800,000
Population 71,000,0001 127,000,0001 490,000,0001 301,000,0001
Median age 28.61 43.51 n/a 36.61
Population growth (%) 1.041 -0.091 0.161 0.891
GDP (USD) 109 6402 4,2182 13,0802 13,0602
GDP/capita (USD) 9,1002 33,1002 29,9002 43,8002
GDP growth rate (%) 6.12 2.22 3.22 2.92
Notes:1 2007 estimates.2 2006 estimates.
Source: https://www.cia.gov/library/publications/theworldfactbook/index.html.

An exploratory study on perceptions of seismic risk and mitigation 75
Table 2 Population, population density, and number of buildings in Avcilar, Bakirkoy,
Istanbul, and Turkey (2000)
Avcilar Bakirkoy Istanbul Turkey
Area (hectares) 3,861 2,951 98,981 78,058,000
Population 233,749 208,398 10,018,735 67,803,927
Male (%) 50.3 49.0 50.8 50.5
Female (%) 49.7 51.0 49.2 49.5
Buildings 14,030 10,067 724,609 –
Population density (person/hectare)
60 70 101 0.9
Population density (person/building)
17 21 12 –
Average length of education (years)
6.2 8.5 6.7 6.0
Average size of household (persons)
3.9 3.1 3.9 4.5
Source: Pacific Consultants International and OYO Corporation, 2002.
Table 3 Structural systems of buildings in Avcilar, Bakirkoy, and Istanbul
District Reinforced concrete frame (%)
Masonry (%) Other (%)
Avcilar 93.9 5.4 0.7
Bakirkoy 89.2 7.4 3.4
Istanbul 74.4 21.7 3.9
Source: Pacific Consultants International and OYO Corporation, 2002.
Avcilar and that they are slightly older than the average fabrication in Istanbul. The percentage of buildings in Avcilar constructed after 1990 is significantly higher than that in Bakirkoy and the average in Istanbul, indicating an augmentation in the building stock and population in recent years.
Seismic risk in IstanbulSevere earthquakes in Turkey in recent years have had catastrophic consequences, notably thousands of casualties and significant economic losses. The main reasons for the extent of the damage and losses are generally believed to be construction malpractice and lack of adequate inspection of enforcement of the 1975 or 1998 Seismic Design Codes (Architectural Institute of Japan, Japan Society of Civil Engineers, and The Japanese Geotechnical Society, 2001). In Turkey, particularly in cities, the

Korel Eraybar, Kenji Okazaki and Alper Ilki76
Figure 1 Distribution of buildings in Avcilar, Bakirkoy, and all of Istanbul (number of
storeys (a) and construction years (b))
Source: Pacific Consultants International and OYO Corporation (2002).
most common structure type is a ‘reinforced concrete frame’ of between four and six storeys. Among the most common structural deficiencies are irregular structural systems, lowquality concrete, precarious structural alterations (such as the addition of more floors), use of plain longitudinal bars without sufficient bonding capacity, poor connections between longitudinal reinforcing bars at storey levels, inadequate transverse reinforcement, and insufficient reinforcing details. Other problems include deterioration over time, lack of maintenance, and lowquality workmanship and materials. The 1999 Kocaeli earthquake had a significant impact on part of Istanbul city. Although, as noted above, the epicentre was some 150 kilometres east of Istanbul, the areas that suffered most damage were the southwest parts of Istanbul, namely Avcilar and Bakirkoy. The significantly high level of damage to buildings in this area was attributed to the amplification of seismic effects due to poor ground conditions.
The base ground acceleration rate was around 0.15–0.25 g (gravitational acceleration) in these areas, while it was around 0.05–0.10 g in most other parts of Istanbul, even though they were closer to the epicentre. While the rate of heavily damaged or collapsed buildings was between 0.5 and two per cent in most parts of Bakirkoy, it was between two to five per cent in some parts of Avcilar. Figure 2 shows the number of heavily and heavily/moderately damaged buildings in Avcilar,
Figure 2 Damage due to the 1999 Kocaeli earthquake
Notes:H = heavily damaged buildingsH+M = heavily/moderately damaged buildings
Source: Pacific Consultants International and OYO Corporation (2002).
a b

An exploratory study on perceptions of seismic risk and mitigation 77
Bakirkoy, and Istanbul as a whole. One can see that a significant proportion of heavily and heavily/moderately damaged buildings in Istanbul were in the surveyed area, particularly in Avcilar district. The 1999 Kocaeli earthquake caused the deaths of more than 400 people, as well as severe injury to around 2,000 others. More than 30 per cent of the casualties were in Avcilar. In Bakirkoy, there were no fatalities and far fewer severe injuries than in Avcilar.
Survey methodologyThe basic rationale behind selecting Avcilar (Merkez quarter) and Bakirkoy (Yesilkoy quarter) districts was to study areas with similar seismic risk but different social structures to highlight relationships between risk perception and social structure, as well as the effects of personal assets, such as academic qualification and financial income level. All interviewees were randomly selected male or female adults. All interviews were carried out during visits to the homes of respondents and involved facetoface communication. The surveyors completed the questionnaires according to the answers of interviewees. The questionnaire was developed in such a way as to learn, inter alia, about respondents’ past experiences of disasters and their perceptions of seismic risk, whether they believe their house is capable of guarding against earthquakes, how they want to avoid future risk, and what they know about retrofitting. In addition, demographic characteristics, which are thought to play a role in the development of the risk perceptions of people, were included in the questionnaire, such as age, household income, occupation, number of family members living together, and sex, as was houserelated information such as address, cost, floor area, structural type, and ownership. As this survey was conducted as a part of the Collaborative Research and Development Project for Disaster Mitigation, in which four institutions are participating—Institut Teknologi Bandung (Indonesia), National Society for Earthquake Technology (Nepal), Preston University (Pakistan), and Istanbul Technical University (Turkey)—the questionnaire was pretested in Nepal to identify areas for possible improvement. Similar surveys based on the same questionnaire were conducted in the other three countries simultaneously, allowing for crosssocietal studies in the future, as recommended by Quarantelli (1996). The survey was designed to target at least 400 respondents randomly from one community so that the sampling error is less than approximately five per cent. According to past research, the selected survey areas of Avcilar and Bakirkoy are among the most vulnerable parts of Istanbul. The number of respondents in Avcilar and Bakirkoy was 426 and 439, respectively. The questionnaire was modified slightly to take account of Turkish culture and daily practices with regard to administrative, economic, ethical, legal, religious, and social matters. The surveyors were undergraduate or postgraduate students in the Faculties of Civil Engineering and Architecture at Istanbul Technical University.

Korel Eraybar, Kenji Okazaki and Alper Ilki78
They were officially assigned by the university rectorate and all permissions were obtained from police departments and local administrations. All surveyors were officially insured for one month, and before the site survey began, they were all provided with training in such areas as technical aspects, the target of the survey study, details of the questionnaire, attitudes towards respondents, the official language, foreseen difficulties, and appropriate attire. All questions were posed together in a multiplechoice format. For the most part, respondents were expected to select only one answer from the alternatives, with the exception of a few questions for which they were allowed to choose multiple responses (see Table 13). To prevent any bias in the order of the answers, the surveyors altered the order of the answers while reading them to respondents. After the onsite survey study was finished, another group of civil engineering students was hired to input the data into computers. The students who worked on site were not employed in the data entry procedure. After all of the data was entered, the evaluation procedure began. There are plans to survey the seismic risk perceptions of national/local government officers and house builders/head masons in these four countries in the near future.
Survey results Basic data on communities and housing characteristics
In Avcilar, respondents were younger (see Figure 3a) and families were larger. In both districts, though, the number of family members of the largest group of respondents was four. In terms of the gender of the respondents, females comprised the majority in both districts: 58 and 69 per cent in Avcilar and Bakirkoy, respectively. The reason for this is that the survey was carried out in homes and during the day, when most males are normally at work, as well as a large portion of females. Most of the respondents, therefore, were housewives, students, or retired people. Although differences between male and female responses to most of the questions were not significant, the overrepresentation of females may have caused a sampling bias at least for some of the findings. As Figure 3b shows, the level of academic qualification is much higher in Bakirkoy, as is family income (Figure 3c). It is apparent from the collected data that the social status of respondents in Bakirkoy is generally higher than that of those in Avcilar. The average annual household income of respondents in Avcilar is estimated at USD 11,304, while in Bakirkoy it is USD 20,040. The average annual household income in Turkey as a whole is USD 12,139. Figure 3d shows the relationship between income level and academic qualification for all survey respondents. There is a strong relation between the two variables: the higher the level of academic qualification, the higher the level of income. Although one would expect home ownership to increase with level of economic income, the study revealed that buying a house is not directly related to economic income level.

An exploratory study on perceptions of seismic risk and mitigation 79
Figure 3 Age groups (a), academic quali-
fication (b), financial income (c), and
relationship between academic qualifica-
tion and monthly family income (d)
Source: authors.
a
b
c
d
Figure 4 shows the construction year of buildings in Avcilar and Bakirkoy. The majority of buildings in both districts were built between 1975 and 1998. While the number of buildings erected in Avcilar in that period is higher than that in Bakirkoy, the number of buildings constructed in Bakirkoy before 1975 and after 1998 is higher. This interesting result may be explained by the higher number of reconstruction works carried out in recent years in Bakirkoy, which is a relatively older settlement area, and the reduced demand for property in Avcilar due to the effects of the 1999 Kocaeli earthquake. The time intervals selected are based on the publication of different versions of the Turkish Seismic Design Code. Before 1975, although there was a code in Turkey, the construction details and seismic loads were not sufficient for a seismicresistant building. Consequently, one can consider most of the buildings put up before 1975 to be vulnerable to seismic events. In 1975, a new version of the code was published, in which seismic design loads were increased by almost 100 per cent and the construction details were significantly improved in relation to seismic resistance. Between 1975 and 1998, however, code regulations could not be enforced due to a lack of an adequate inspection system. In addition, because of different combinations of structural deficiencies, such as use of lowquality concrete, irregular structural systems, and substandard reinforcing detailing, a significant portion of existing structures built in this period remain vulnerable to earthquakes. A new version of the Seismic Design Code was published in 1998. More important than the emergence of this document,

Korel Eraybar, Kenji Okazaki and Alper Ilki80
though, were the catastrophic ramifications of the Kocaeli (magnitude 7.4) and the Duzce (magnitude 7.2) earthquakes of 16 August and 12 November 1999, which struck northwest Turkey, impacting on the construction inspection system and the attitudes of constructors. As a result, the construction inspection system was totally restructured and construction practice improved after 1999. It is believed, therefore, that the vulnerability of buildings constructed after 1998 is much lower
than that of older building stock. Moreover, widespread use of readymixed concrete and deformed bars in recent years has also contributed to the better structural performance of buildings. Another consequence of the 1999 earthquakes was a new attitude among a minority of people living in earthquakeprone areas towards retrofitting their buildings or demolishing or reconstructing them. Thus, the most recent Seismic Design Code, published in 2007, includes chapters on seismic safety assessment and retrofitting of existing buildings.
Data on disaster risk perception and mitigation Table 4 contains details of respondents’ answers regarding the most significant events in both districts. The majority of respondents in Avcilar (52 per cent), where the 1999 earthquakes had catastrophic consequences, consider disaster to be the most significant event, while approximately 26 per cent of respondents believe it to be
Figure 4 Construction years of housing units in
Avcilar and Bakirkoy
Table 4 Most significant event
Avcilar Bakirkoy Total population
Disaster 202 (51.7%) 155 (35.6%) 357 (43.2%)
Disease 102 (26.1%) 160 (36.8%) 262 (31.7%)
Unemployment 36 (9.2%) 51 (11.7%) 87 (10.5%)
Accident 14 (3.6%) 40 (9.2%) 54 (6.5%)
Violent encounter 28 (7.2%) 24 (5.5%) 52 (6.3%)
Other 9 (2.3%) 5 (1.1%) 14 (1.7%)
Total 391 (100.0%) 435 (100.0%) 826 (100.0%)
Source: authors.

An exploratory study on perceptions of seismic risk and mitigation 81
disease. By contrast, disease (37 per cent) and disaster (36 per cent) are viewed as almost equal in Bakirkoy, which lost considerably less in past earthquakes, but is almost as vulnerable as Avcilar to future seismic events. This finding may be related to the attention that individuals on higher incomes pay to health issues, as well as to the older age of respondents in Bakirkoy. That 43.2 per cent of the overall population consider disaster to be the most significant event can be attributed to the terrible consequences of the 1999 earthquakes, which media outlets broadcast widely and extensively. This apparent consciousness of disasters provides a good chance to implement swiftly preparedness and mitigation measures—past experience shows that generally, societies have a short memory when it comes to disasters. Tables 5 and 6, respectively, present perceptions of the most significant event with respect to family income and academic qualification. One should note that the tables
Table 5 Relation between monthly family income (in USD) and most significant event
Less than 700
700–1,400 1,400–2,100 2,100–2,800 More than 2,800
Total
Disaster 104 (45.4%) 131 (42.7%) 69 (45.1%) 20 (41.7%) 21 (32.3%) 345 (43.0%)
Disease 69 (30.1%) 97 (31.6%) 50 (32.7%) 17 (35.4%) 25 (38.%) 258 (32.2%)
Unemployment 22 (9.6%) 39 (12.7%) 15 (9.8%) 5 (10.4%) 3 (4.6%) 84 (10.5%)
Accident 8 (3.5%) 21 (6.8%) 11 (7.2%) 3 (6.3%) 11 (16.9%) 54 (6.7%)
Violent encounter 19 (8.3%) 16 (5.2%) 8 (5.2%) 3 (6.3%) 4 (6.2%) 50 (6.2%)
Other 7 (3.1%) 3 (1.0%) 0 (0.0%) 0 (0.0%) 1 (1.5%) 11 (1.4%)
Total 229 (100.0%)
307 (100.0%)
153 (100.0%)
48 (100.0%)
65 (100.0%)
802 (100.0%)
Source: authors.
Table 6 Relation between academic qualification and most significant event
Cannot reador write
Basic readingand writing
Primaryschool
Secondaryschool
University Total
Disaster 4 (44.4%) 10 (58.8%) 137 (42.9%) 125 (43.9%) 81 (41.3%) 357 (43.2%)
Disease 2 (22.2%) 5 (29.4%) 95 (29.8% ) 94 (33.0%) 66 (33.7%) 262 (31.7%)
Unemployment 2 (22.2%) 1 (5.9%) 46 (14.4%) 23 (8.1%) 15 (7.7%) 87 (10.5%)
Accident 0 (0.0%) 0 (0.0%) 17 (5.3%) 20 (7.0%) 17 (8.7%) 54 (6.5%)
Violent encounter 0 (0.0%) 1 (5.9%) 16 (5.0%) 21 (7.4%) 14 (7.1%) 52 (6.3%)
Others 1 (11.1%) 0 (0.0%) 8 (2.5%) 2 (0.7%) 3 (1.5%) 14 (1.7%)
Total 9 (100.0%)
17 (100.0%)
319 (100.0%)
285 (100.0%)
196 (100.0%)
826 (100.0%)
Source: authors.
Korel Eraybar, Kenji Okazaki and Alper Ilki82
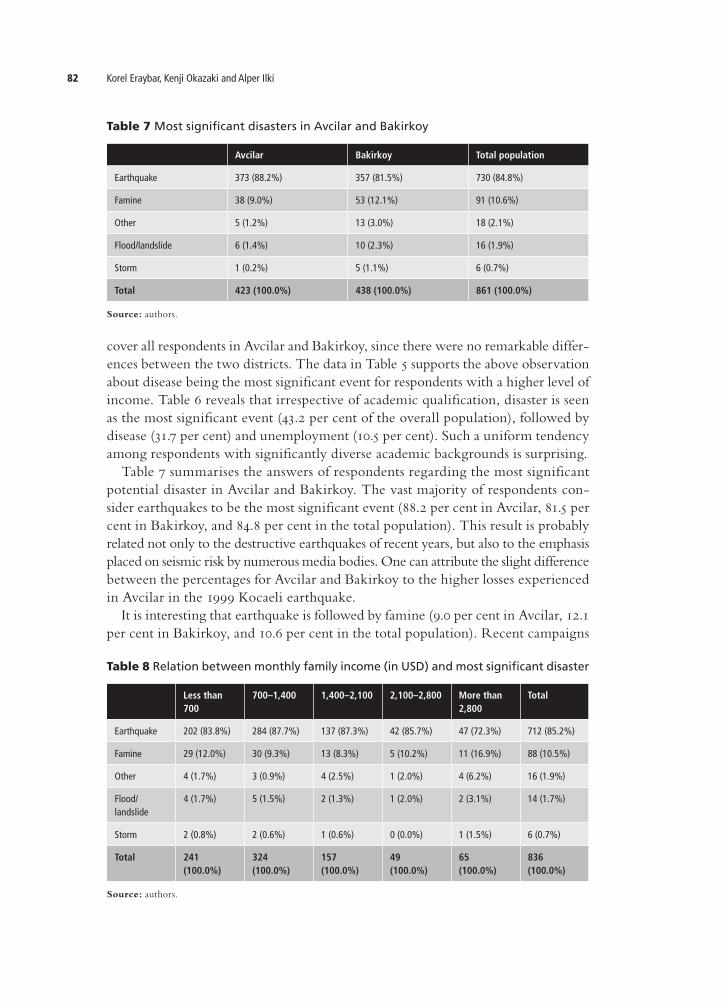
cover all respondents in Avcilar and Bakirkoy, since there were no remarkable differences between the two districts. The data in Table 5 supports the above observation about disease being the most significant event for respondents with a higher level of income. Table 6 reveals that irrespective of academic qualification, disaster is seen as the most significant event (43.2 per cent of the overall population), followed by disease (31.7 per cent) and unemployment (10.5 per cent). Such a uniform tendency among respondents with significantly diverse academic backgrounds is surprising. Table 7 summarises the answers of respondents regarding the most significant potential disaster in Avcilar and Bakirkoy. The vast majority of respondents consider earthquakes to be the most significant event (88.2 per cent in Avcilar, 81.5 per cent in Bakirkoy, and 84.8 per cent in the total population). This result is probably related not only to the destructive earthquakes of recent years, but also to the emphasis placed on seismic risk by numerous media bodies. One can attribute the slight difference between the percentages for Avcilar and Bakirkoy to the higher losses experienced in Avcilar in the 1999 Kocaeli earthquake. It is interesting that earthquake is followed by famine (9.0 per cent in Avcilar, 12.1 per cent in Bakirkoy, and 10.6 per cent in the total population). Recent campaigns
Table 7 Most significant disasters in Avcilar and Bakirkoy
Avcilar Bakirkoy Total population
Earthquake 373 (88.2%) 357 (81.5%) 730 (84.8%)
Famine 38 (9.0%) 53 (12.1%) 91 (10.6%)
Other 5 (1.2%) 13 (3.0%) 18 (2.1%)
Flood/landslide 6 (1.4%) 10 (2.3%) 16 (1.9%)
Storm 1 (0.2%) 5 (1.1%) 6 (0.7%)
Total 423 (100.0%) 438 (100.0%) 861 (100.0%)
Source: authors.
Table 8 Relation between monthly family income (in USD) and most significant disaster
Less than 700
700–1,400 1,400–2,100 2,100–2,800 More than 2,800
Total
Earthquake 202 (83.8%) 284 (87.7%) 137 (87.3%) 42 (85.7%) 47 (72.3%) 712 (85.2%)
Famine 29 (12.0%) 30 (9.3%) 13 (8.3%) 5 (10.2%) 11 (16.9%) 88 (10.5%)
Other 4 (1.7%) 3 (0.9%) 4 (2.5%) 1 (2.0%) 4 (6.2%) 16 (1.9%)
Flood/landslide
4 (1.7%) 5 (1.5%) 2 (1.3%) 1 (2.0%) 2 (3.1%) 14 (1.7%)
Storm 2 (0.8%) 2 (0.6%) 1 (0.6%) 0 (0.0%) 1 (1.5%) 6 (0.7%)
Total 241 (100.0%)
324 (100.0%)
157 (100.0%)
49 (100.0%)
65 (100.0%)
836 (100.0%)
Source: authors.

An exploratory study on perceptions of seismic risk and mitigation 83
focused on climate change and ecosystems may have played an important part in shaping this selection by respondents. Table 8 shows the relation between income level and most significant disaster. One should note that this table contains data for all respondents in Avcilar and Bakirkoy. Among all respondents, earthquake (85.2 per cent) is seen as the primary potential disaster, followed by famine (10.5 per cent). While between 8.3 and 12.0 per cent of respondents with a monthly income of less than USD 2,800 consider famine to be the most significant potential disaster, 16.9 per cent of respondents with a monthly income of more than USD 2,800 reached the same conclusion. Interestingly, similar variation was not observed for the different academic qualification variable. Irrespective of academic qualification, 81.5–88.2 per cent of respondents view earthquake as the most significant disaster, while the proportion is between 9.0 and 12.1 per cent for famine. One can explain the low percentages for other disaster events, such as floods and storms, by their relatively low occurrence and their low damage potential in the survey area. Table 9 summarises expectations of earthquakes in Avcilar and Bakirkoy, while Table 10 presents variation in earthquake expectations with respect to academic qualification. Table 9 shows that 61.8 per cent of all respondents think that a strong earthquake will hit the survey area within 50 years, whereas only 7.7 per cent of respondents believe that a strong earthquake will not hit the survey area within 50 years. This result seems to contradict the findings of Armas (2006), who carried out a similar study in Bucharest, Romania. According to the latter survey, the population of Bucharest is not prepared to cope with the consequences of a major earthquake, a fact underlined by the high percentage of people who deny that such an event may occur. Table 10 illustrates that with a decrease in academic qualification comes a significant increase in the percentage of respondents who have no idea about the next major earthquake—23.1 per cent for university graduates and 64.7 per cent for respondents with basic reading and writing capabilities. Tables 9 and 10 reveal that most respondents are aware of the potential danger, with greater awareness associated with stronger academic background. A sizeable proportion of respondents expect a strong earthquake within 10 years (44.8 per cent in total).
Table 9 Earthquake expectations in Avcilar and Bakirkoy
Avcilar Bakirkoy Total population
Within a few years 66 (15.6%) 92 (21.0%) 158 (18.4%)
Within 10 years 101 (23.9%) 126 (28.8%) 227 (26.4%)
Within 50 years 64 (15.1%) 82 (18.7%) 146 (17.0%)
After 50 years or never 31 (7.3%) 35 (8.0%) 66 (7.7%)
No idea 161 (38.1%) 103 (23.5%) 264 (30.7%)
Source: authors.

Korel Eraybar, Kenji Okazaki and Alper Ilki84
Table 11 shows that, despite the apparent danger, the majority of respondents plan to remain in their current house for more than 10 years (59.0 per cent in total), and 20.4 per cent of all respondents plan to do so for less than five years. The percentage of respondents intending to stay in the same residence for less than five years is 24.6 per cent and 16.4 per cent in Avcilar and Bakirkoy, respectively. One can attribute this difference to the university in Avcilar. A sizeable proportion of respondents in Avcilar are students who originally resided in other Turkish cities. Some 80 per cent of those people who plan to live in their current house for more than 10 years in spite of the expectation of a strong earthquake believe that their building is capable of withstanding such a natural disaster (see Table 12). This contradicts, though, the findings of Ozdemir, Boduroglu and Ilki (2005), who discovered that 11 of the 12 buildings they examined in Zeytinburnu district—located in the vicinity of Avcilar and Bakirkoy—are vulnerable. Their results are based on a simplified approximate assessment method as well as a detailed threedimensional nonlinear structural analysis. It is interesting to note that the proportions of respondents
Table 10 Relation between academic qualification and earthquake expectation
Cannot reador write
Basic readingand writing
Primaryschool
Secondaryschool
University Total
Within a few years
0 (0.0%) 1 (5.9%) 66 (19.5%) 51 (17.2%) 40 (20.1%) 158 (18.4%)
Within 10 years
2 (20.0%) 1 (5.9%) 79 (23.4%) 84 (28.3%) 61 (30.7%) 227 (26.4%)
Within 50 years
0 (0.0%) 1 (5.9%) 37 (10.9%) 69 (23.2%) 39 (19.6%) 146 (17.0%)
After 50 years or never
0 (0.0%) 3 (17.6%) 33 (9.8%) 17 (5.7%) 13 (6.5%) 66 (7.7%)
No idea 8 (80.0%) 11 (64.7%) 123 (36.4%) 76 (25.6%) 46 (23.1%) 264 (30.7%)
Total 10 (100.0%) 17 (100.0%) 338 (100.0%)
297 (100.0%)
199 (100.0%)
861 (100.0%)
Source: authors.
Table 11 Time that respondents plan to spend in their current house
Avcilar Bakirkoy Total
Less than 5 years 103 (24.6%) 72 (16.4%) 175 (20.4%)
5–10 years 21 (5.0%) 36 (8.2%) 57 (6.7%)
More than 10 years 239 (57.0%) 267 (61.0%) 506 (59.0%)
No idea 56 (13.4%) 63 (14.4%) 119 (13.9%)
Total 419 (100.0%) 438 (100.0%) 857 (100.0%)
Source: authors.

An exploratory study on perceptions of seismic risk and mitigation 85
proposing to stay in their current house for more than 10 years are 74, 56, and 49 per cent for monthly family income groups of less than USD 700, USD 700–1,400, and more than USD 2,800, respectively, with similar trends across other income groups. The proportions of respondents planning to live in their current house for less than five years are 16, 25, and 30 per cent for monthly family income groups of less than USD 700, USD 1,400–2,100, and more than USD 2,800, respectively. Table 13 summarises the actions that respondents have taken to reduce apparent seismic risk. Considering the data in Table 12, it is not surprising that respondents have not done much to soften the potential impacts of earthquakes. Table 13 shows that 28.0 per cent of all respondents have not done anything at all in this regard. The proportions of respondents who have not taken any action are 33.3 and 22.7 per cent in Avcilar and Bakirkoy, respectively. The difference between the two districts may be attributed in part to a relatively low level of income and academic qualification in Avcilar (see Figures 3b and 3c). Purchasing insurance seems to be the preferred mechanism, utilised by 49.0 per cent and 54.7 per cent of respondents in Avcilar and Bakirkoy, respectively. It is interesting to note that earthquake insurance is compulsory in Turkey. According to the Turkish Catastrophe Insurance Pool (http://www.dask.gov.tr/istatistik21.html), however, only 19.9 per cent of housing units in
Table 12 Is your house strong enough to guard against earthquakes?
Avcilar Bakirkoy Total
Yes 349 (82.7%) 340 (78.5%) 689 (80.6%)
No 73 (17.3%) 93 (21.5%) 166 (19.4%)
Total 422 (100.0%) 433 (100.0%) 855 (100.0%)
Source: authors.
Table 13 Actions to reduce the impacts of earthquakes (multiple answers allowed)
Action Avcilar Bakirkoy Total
House covered under insurance 206 (49.0%) 231 (54.7%) 437 (51.9%)
None 140 (33.3%) 96 (22.7%) 236 (28.0%)
Awareness raising with family/neighbours 68 (16.2%) 98 (23.2%) 166 (19.7%)
Securing the safety of non-structural components
55 (13.1%) 93 (22.0%) 148 (17.6%)
Keeping emergency materials 53 (12.6%) 73 (17.3%) 126 (15.0%)
House strengthened (retrofitted) 53 (12.6%) 37 (8.8%) 90 (10.7%)
Living in/moved to/bought an earthquake-resistant house
25 (6.0%) 45 (10.7%) 70 (8.3%)
Total 420 422 842
Source: authors.

Korel Eraybar, Kenji Okazaki and Alper Ilki86
Turkey are insured—the figure for Istanbul is 29.9 per cent. The higher percentage of insured housing units in Avcilar and Bakirkoy (according to respondents’ answers) demonstrates that the inhabitants of these districts are aware of the relatively higher seismic risk in the area. Table 14 shows that 48.9 per cent of the overall survey population—57.3 per cent in Avcilar and 41.7 percent in Bakirkoy—does not have any plans for safer housing despite having experienced the catastrophic consequences of the 1999 Kocaeli earthquake. Since Avcilar suffered more damage in 1999, one might expect the number of people without any plans to be less in Bakirkoy. This seemingly contradictory result may be attributed to new arrivals in Avcilar after 1999, people with no experience of earthquakes, as well as to the relatively lower level of economic income and weaker academic background in the district. According to these results, in terms of disaster communication, it may be misleading to assume that people living in an earthquake zone are more aware of potential risk, due to the possibility of many people leaving the area and many new people arriving. This result also confirms the conclusion reached by Quarantelli (1996) after the magnitude 8.1 earthquake in Mexico City on 19 September 1985: earthquake victims learned little from their experience in so far as how to prepare for future disasters. Shaw et al. (2004) also found that earthquake experience is not the primary factor
Table 14 Relation between academic qualification and plans for safer houses
Cannot reador write
Basic readingand writing
Primaryschool
Secondaryschool
University Total
No plan 6 (85.7%) 6 (66.7%) 152 (54.5%)
109 (50.0%)
45 (32.8%) 318 (48.9%)
Build or purchase an earthquake-resistant house
1 (14.3%) 3 (33.3%) 57 (20.4%) 63 (28.9%) 59 (43.1%) 183 (28.2%)
Strengthen (retrofit) existing house
0 (0.0%) 0 (0.0%) 21 (7.5%) 12 (5.5%) 17 (12.4%) 50 (7.7%)
Secure the safety of non-structural elements
0 (0.0%) 0 (0.0%) 13 (4.7%) 13 (6.0%) 2 (1.5%) 28 (4.3%)
Other 0 (0.0%) 0 (0.0%) 7 (2.5%) 11 (5.0%) 6 (4.4%) 24 (3.7%)
Always keep emergency goods/foodstuffs at home
0 (0.0%) 0 (0.0%) 13 (4.7%) 6 (2.8%) 2 (1.5%) 21 (3.2%)
Cover the house under an insurance policy
0 (0.0%) 0 (0.0%) 11 (3.9%) 2 (0.9%) 3 (2.2%) 16 (2.5%)
Awareness-raising among family members/neighbours
0 (0.0%) 0 (0.0%) 5 (1.8%) 2 (0.9%) 3 (2.2%) 10 (1.5%)
Total 7 (100.0%)
9 (100.0%)
279 (100.0%)
218 (100.0%)
137 (100.0%)
650 (100.0%)
Source: authors.

An exploratory study on perceptions of seismic risk and mitigation 87
informing awareness. Rather, schooling is important in enhancing knowledge and perceptions of earthquakerelated disasters. In addition, according to Mileti and Sorensen (1987), frequent exposure to hazardrelevant information does not automatically elicit attention and comprehension, let alone the acceptance, personalisation, and retention required to initiate hazard adjustments. Only 28.2 per cent of the overall population that participated in this survey has considered purchasing and/or building an earthquakeresistant house and only 7.7 per cent has thought about retrofitting their home. This low percentage demonstrates that retrofitting is not a well known and trusted step in Istanbul. The social and administrative obstacles to retrofitting may be another reason. It is interesting to note that people prefer to purchase new houses, rather than to retrofit existing stock, although seismic retrofitting may be more feasible. Table 14 shows that, as expected, the percentage of respondents with no plan for a safer house increases with a declining level of academic qualification. It is interesting to observe, too, that the vast majority of respondents do not plan to implement relatively simple measures such as the purchase of an insurance policy, engage in awarenessraising within the family and among neighbours, and secure the safety of nonstructural elements. Although there may be exceptions, the assumption that newer structures are less vulnerable to earthquakes may be correct in most cases in Istanbul due to the enforcement of newer versions of the Seismic Design Code, revised inspection systems, inherent developments in the quality of structural materials, and relatively less damage to the building stock due to aging. Therefore, existing buildings may be grouped into three risk categories as a function of their year of construction and revision years of the Seismic Design Code in Turkey:
• built before 1975;• built between 1975 and 1998; and • built after 1998.
Twentynine per cent of respondents who live in buildings erected before 1975 think that their structures are not strong enough to endure a severe earthquake, compared with 17.1 and 8.8 per cent of respondents who reside in buildings constructed between 1975 and 1998 and after 1998, respectively. This shows that people living in older houses are aware of the relatively higher seismic vulnerability of their buildings. This conclusion is reflected also in the answers of respondents about their plans for safer housing. While 38.1 per cent of respondents who reside in buildings put up before 1975 do not have any plans for a safer house, this proportion is 51.4 and 64.0 per cent for respondents who live in buildings constructed between 1975 and 1998 and after 1998, respectively. An attempt to determine the value that respondents attach to their properties and families was made through the following two questions: ‘How much do you spend on protecting your property?’ and ‘How much do you spend on protecting your family?’. The results show that respondents are prepared to spend significantly more on protecting their family than on protecting their property. Table 15 reveals that

Korel Eraybar, Kenji Okazaki and Alper Ilki88
38.0 per cent of all respondents would spend less than one month of household income on protecting their property, while the proportion of respondents who would spend more than five years of household income is 10.7 per cent. Table 16 shows that 37.4 per cent of respondents would spend more than five years of household
Table 15 Relation between academic qualification and proportion of family income
that respondents can spend on protecting their property
Cannot reador write
Basic readingand writing
Primaryschool
Secondaryschool
University Total
Less than 1 month of income
6 (85.7%) 7 (77.8%) 122 (45.0%) 75 (35.5%) 28 (21.9%) 238 (38.0%)
1–3 months 0 (0.0%) 0 (0.0%) 41 (15.1%) 33 (15.6%) 22 (17.2%) 96 (15.3%)
3–6 months 1 (14.3%) 0 (0.0%) 38 (14.0%) 43 (20.4%) 29 (22.7%) 111 (17.7%)
6 months– 2 years
0 (0.0%) 1 (11.1%) 32 (11.8%) 35 (16.6%) 20 (15.6%) 88 (14.1%)
2–5 years 0 (0.0%) 0 (0.0%) 13 (4.8%) 9 (4.3%) 4 (3.1%) 26 (4.2%)
More than 5 years
0 (0.0%) 1 (11.1%) 25 (9.2%) 16 (7.6%) 25 (19.5%) 67 (10.7%)
Total 7 (100.0%)
9 (100.0%)
271 (100.0%)
211 (100.0%)
128 (100.0%)
626 (100.0%)
Source: authors.
Table 16 Relation between academic qualification and proportion of family income
that respondents can spend on protecting their family
Cannot reador write
Basic readingand writing
Primaryschool
Secondaryschool
University Total
Less than 1 month of income
4 (50.0%) 6 (66.7%) 86 (32.1%) 47 (22.6%) 22 (17.3%) 165 (26.6%)
1–3 months 0 (0.0%) 1 (11.1%) 20 (7.5%) 10 (4.8%) 14 (11.0%) 45 (7.3%)
3–6 months 0 (0.0%) 0 (0.0%) 28 (10.4%) 22 (10.6%) 14 (11.0%) 64 (10.3%)
6 months– 2 years
1 (12.5%) 1 (11.1%) 24 (9.0%) 28 (13.5%) 22 (17.3%) 76 (12.3%)
2–5 years 1 (12.5%) 0 (0.0%) 18 (6.7%) 14 (6.7%) 5 (3.9%) 38 (6.1%)
More than 5 years
2 (25.0%) 1 (11.1%) 92 (34.3%) 87 (41.8%) 50 (39.4%) 232 (37.4%)
Total 8 (100.0%)
9 (100.0%)
268 (100.0%)
208 (100.0%)
127 (100.0%)
620 (100.0%)
Source: authors.

An exploratory study on perceptions of seismic risk and mitigation 89
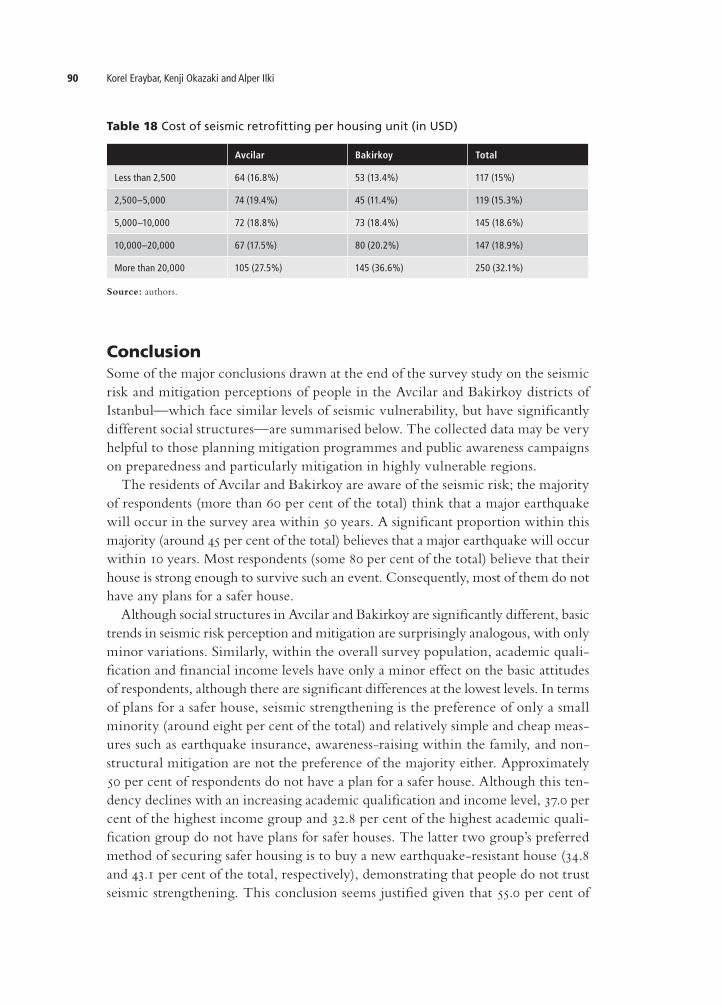
income on protecting their family. However, the percentage of respondents who would spend less than one month of household income is also high at 26.6 per cent. An interesting point concerning these two questions is that most of the respondents who would spend less than one month of household income actually selected ‘I would not spend any money’ as their answer. Another interesting outcome regarding the question ‘How much do you spend on protecting your family?’ is that two extreme answers, ‘Less than one month’ and ‘More than five years’, were chosen by 64.0 per cent of respondents, while only 36.0 per cent of respondents selected the other four answers. A strong relation was discovered between academic qualification and answers to the question ‘How much do you spend on protecting your property?’. Table 15 reveals that increasing level of academic qualification is accompanied by a rise in the amount of income to be spent on protecting the property. Interestingly, similar relationships are not as pronounced in the case of ‘How much do you spend on protecting your family?’. Table 16 shows that when family protection is a concern, approximately the same percentages (34.3–41.8 per cent) of primary school, secondary school, and university graduates are ready to spend more than their five years of household income. However, among people who cannot read and write, and those who have basic reading and writing skills but no formal academic background, this proportion is remarkably lower. One should note that most respondents with low academic profiles are also in the low financial income group. Tables 17 and 18 summarise respectively respondents’ knowledge of available seismicstrengthening techniques and the costs involved. Table 17 shows that only 21.5 per cent of respondents claimed to have knowledge of available seismicstrengthening techniques, while 55.0 per cent said they have no information on them. Table 18 illustrates that 32.1 per cent of respondents estimate the cost of seismic strengthening per housing unit at more than USD 20,000, while 18.9 per cent of respondents believe the figure to be between USD 10,000 and 20,000. In fact, seismic retrofitting currently costs around USD 100 per square metre for structural aspects—and approximately an additional USD 100 per square metre for architectural repairs, such as finishing—using conventional retrofitting techniques employed in Turkey. The cost estimations of a large portion of respondents for seismic strengthening thus seem fairly reasonable. The most common structural seismicstrengthening techniques in Turkey involve the addition of new reinforced concrete structural shear walls and the jacketing of reinforced concrete columns.
Table 17 Knowledge of seismic strengthening
Avcilar Bakirkoy Total
Yes 83 (19.7%) 102 (23.3) 185 (21.5%)
No 246 (58.3%) 227 (51.8%) 473 (55.0%)
Partial 93 (22.0%) 109 (24.9%) 202 (23.5%)
Source: authors.
Korel Eraybar, Kenji Okazaki and Alper Ilki90
ConclusionSome of the major conclusions drawn at the end of the survey study on the seismic risk and mitigation perceptions of people in the Avcilar and Bakirkoy districts of Istanbul—which face similar levels of seismic vulnerability, but have significantly different social structures—are summarised below. The collected data may be very helpful to those planning mitigation programmes and public awareness campaigns on preparedness and particularly mitigation in highly vulnerable regions. The residents of Avcilar and Bakirkoy are aware of the seismic risk; the majority of respondents (more than 60 per cent of the total) think that a major earthquake will occur in the survey area within 50 years. A significant proportion within this majority (around 45 per cent of the total) believes that a major earthquake will occur within 10 years. Most respondents (some 80 per cent of the total) believe that their house is strong enough to survive such an event. Consequently, most of them do not have any plans for a safer house. Although social structures in Avcilar and Bakirkoy are significantly different, basic trends in seismic risk perception and mitigation are surprisingly analogous, with only minor variations. Similarly, within the overall survey population, academic qualification and financial income levels have only a minor effect on the basic attitudes of respondents, although there are significant differences at the lowest levels. In terms of plans for a safer house, seismic strengthening is the preference of only a small minority (around eight per cent of the total) and relatively simple and cheap measures such as earthquake insurance, awarenessraising within the family, and nonstructural mitigation are not the preference of the majority either. Approximately 50 per cent of respondents do not have a plan for a safer house. Although this tendency declines with an increasing academic qualification and income level, 37.0 per cent of the highest income group and 32.8 per cent of the highest academic qualification group do not have plans for safer houses. The latter two group’s preferred method of securing safer housing is to buy a new earthquakeresistant house (34.8 and 43.1 per cent of the total, respectively), demonstrating that people do not trust seismic strengthening. This conclusion seems justified given that 55.0 per cent of
Table 18 Cost of seismic retrofitting per housing unit (in USD)
Avcilar Bakirkoy Total
Less than 2,500 64 (16.8%) 53 (13.4%) 117 (15%)
2,500–5,000 74 (19.4%) 45 (11.4%) 119 (15.3%)
5,000–10,000 72 (18.8%) 73 (18.4%) 145 (18.6%)
10,000–20,000 67 (17.5%) 80 (20.2%) 147 (18.9%)
More than 20,000 105 (27.5%) 145 (36.6%) 250 (32.1%)
Source: authors.

An exploratory study on perceptions of seismic risk and mitigation 91
respondents do not have any knowledge of seismic strengthening, while only 21.5 per cent of respondents consider themselves aware of such techniques. Protection of family members seems to be significantly more important than protection of property for a great majority of respondents. To reduce future losses, it appears that one of the main objectives should be to develop easy and economical seismicstrengthening techniques and to introduce them to people living in vulnerable housing units, as well as to build new structures with sufficient seismic resistance. As for disaster communication, the notion that people who live in earthquakeprone areas are more aware of seismic risk may be misleading. This is due to rapid changes within the resident population, as witnessed in Avcilar. Future research should explore these factors, which can successfully motivate people to invest in earthquake mitigation and to change their fatalistic approach to disasters.
AcknowledgementsThis study was conducted jointly by Istanbul Technical University (ITU) and the National Graduate Institute for Policy Studies (GRIPS) as a part of the Collaborative Research and Development Project for Disaster Mitigation, coordinated by Tatsuo Narafu, Building Research Institute (BRI). ITU and the Japanese Ministry of Education, Culture, Sports, Science and Technology (MEXT) provided financial support.
CorrespondenceAlper Ilki, Faculty of Civil Engineering, Istanbul Technical University, 34469, Maslak, Istanbul, Turkey. Telephone/fax: +90 212 285 3838; email: [email protected]
ReferencesAmbraseys, N.N. (2006) ‘Comparison of frequency of occurrence of earthquakes with slip rates
from longterm seismicity data: the cases of Gulf of Corinth, Sea of Marmara and Dead Sea Fault Zone’. Geophyical Journal International. 165 (2). pp. 516–526.
Architectural Institute of Japan, Japan Society of Civil Engineers and The Japanese Geotechnical Society (2001) Report on the Damage Investigation of the 1999 Kocaeli Earthquake in Turkey.
Armas, I. (2006) ‘Earthquake risk perception in Bucharest, Romania’. Risk Analysis. 26(5). pp. 1223–1234.
Asgary, A. and K.G. Willis (1997) ‘Household behaviour in response to earthquake risk: an assessment of existing theories’. Disasters. 21(4). pp. 354–365.
Bernstein, P.L. (1996) Against the Gods. John Wiley & Sons, Inc., New York, NY.Burton, I.R., W. Kates and G.F. White (1978) The Environment as Hazard. Oxford University Press,
New York, NY.Kahneman, D. and A. Tversky (1979) ‘Prospect theory: analysis of decision under risk’. Econometrica.
47(2). pp. 263–291. Lowensteuin, G. and D. Prelec (1992) ‘Anomalies in intertemporal choice’. The Quarterly Journal of
Economics. 107(2). pp. 573–592.

Korel Eraybar, Kenji Okazaki and Alper Ilki92
Mileti, D.S. and H. Sorensen (1987) ‘Natural hazards and precautionary behavior’. In N.D. Weinstein (ed.) Taking Care: Why People Take Precautions. Cambridge University Press, New York, NY. pp. 189–207.
Mileti, D.S. and J.D. Darlington (1997) ‘The role of searching in shaping reactions to earthquake risk information’. Social Problems. 44(1). pp. 89–103.
Mitchell, J.K. (1999) Crucibles of Hazard: Mega-cities and Disasters in Transition. United Nations University Press, New York, NY.
Okazaki, K. (2006) New Strategy for Earthquake Risk Management–How to Motivate People for Safety. Proceedings of the First European Conference on Earthquake Engineering and Seismology, Geneva, Switzerland, 3–8 September.
Ozdemir, P., M.H. Boduroglu and A. Ilki (2005) Seismic Safety Screening Method. Proceedings of the SPEAR International Workshop, Ispra, Italy, 4–5 April.
Pacific Consultants International and OYO Corporation (2002) The Study on a Disaster Prevention/Mitigation Basic Plan in Istanbul Including Seismic Microzonation in the Republic of Turkey: Final Report. Japan International Cooperation Agency and Istanbul Metropolitan Municipality, Istanbul.
Palm, R. and J. Carroll (1998) Illusions of Safety: Culture and Earthquake Hazard Response in California and Japan. Westview Press, Boulder, CO.
Parsons, T. (2004) ‘Recalculated probability of M>=7 earthquakes beneath the Sea of Marmara, Turkey’. Journal of Geophysical Research. 109(B5). Art. No. B05304.
Quarantelli, E.L. (1996) ‘Basic themes derived from survey findings on human behavior in the Mexico City earthquake’. International Sociology. 11(4). pp. 481–499.
Quarantelli, E.L. and R.R. Dynes (1977) ‘Response to social crisis and disaster’. Annual Review of Sociology. 3. pp. 23–49.
Shaw, R., K. Shiwaku, H. Kobayashi, and M. Kobayashi (2004) ‘Linking experience, education, perception and earthquake preparedness’. Disaster Prevention and Management. 13(1). pp. 39–49.
Tierney, K., M.K. Lindell and R.W. Perry (2001) Facing the Unexpected: Disaster Preparedness and Response in the United States. Joseph Henry Press, Washington, DC.
Wachtendorf, T. and X. Sheng (2002) Influence of Social Demographic Characteristics and Past Earthquake Experience on Earthquake Risk Perception. Proceedings of the Second Workshop for ‘Comparative Study on Urban Earthquake Disaster Mitigation’, Kobe, Japan, 14–15 February.