An Effective Approach for Clustering InhA Molecular Dynamics Trajectory Using Substrate-Binding...
25
RESEARCH ARTICLE An Effective Approach for Clustering InhA Molecular Dynamics Trajectory Using Substrate-Binding Cavity Features Renata De Paris 1☯ , Christian V. Quevedo 1☯ , Duncan D. A. Ruiz 1 *, Osmar Norberto de Souza 2 * 1 Grupo de Pesquisa em Inteligência de Negócio—GPIN, Faculdade de Informática, PUCRS, Av. Ipiranga, 6681-Prédio 32, sala 628, Porto Alegre, RS, Brasil, 2 Laboratório de Bioinformática, Modelagem e Simulação de Biossistemas—LABIO, Faculdade de Informática, PUCRS, Av. Ipiranga, 6681- Building 32, Room 602, Porto Alegre, RS, Brasil ☯ These authors contributed equally to this work. * [email protected] (DDAR); [email protected] (ONS) Abstract Protein receptor conformations, obtained from molecular dynamics (MD) simulations, have become a promising treatment of its explicit flexibility in molecular docking experiments applied to drug discovery and development. However, incorporating the entire ensemble of MD conformations in docking experiments to screen large candidate compound libraries is currently an unfeasible task. Clustering algorithms have been widely used as a means to reduce such ensembles to a manageable size. Most studies investigate different algorithms using pairwise Root-Mean Square Deviation (RMSD) values for all, or part of the MD confor- mations. Nevertheless, the RMSD only may not be the most appropriate gauge to cluster conformations when the target receptor has a plastic active site, since they are influenced by changes that occur on other parts of the structure. Hence, we have applied two partition- ing methods (k-means and k-medoids) and four agglomerative hierarchical methods (Com- plete linkage, Ward’s, Unweighted Pair Group Method and Weighted Pair Group Method) to analyze and compare the quality of partitions between a data set composed of properties from an enzyme receptor substrate-binding cavity and two data sets created using different RMSD approaches. Ensembles of representative MD conformations were generated by selecting a medoid of each group from all partitions analyzed. We investigated the perfor- mance of our new method for evaluating binding conformation of drug candidates to the InhA enzyme, which were performed by cross-docking experiments between a 20 ns MD trajectory and 20 different ligands. Statistical analyses showed that the novel ensemble, which is represented by only 0.48% of the MD conformations, was able to reproduce 75% of all dynamic behaviors within the binding cavity for the docking experiments performed. Moreover, this new approach not only outperforms the other two RMSD-clustering solu- tions, but it also shows to be a promising strategy to distill biologically relevant information from MD trajectories, especially for docking purposes. PLOS ONE | DOI:10.1371/journal.pone.0133172 July 28, 2015 1 / 25 a11111 OPEN ACCESS Citation: De Paris R, Quevedo CV, Ruiz DDA, Norberto de Souza O (2015) An Effective Approach for Clustering InhA Molecular Dynamics Trajectory Using Substrate-Binding Cavity Features. PLoS ONE 10(7): e0133172. doi:10.1371/journal.pone.0133172 Editor: Patrick Aloy, Institute for Research in Biomedicine, SPAIN Received: January 10, 2015 Accepted: June 23, 2015 Published: July 28, 2015 Copyright: © 2015 De Paris et al. This is an open access article distributed under the terms of the Creative Commons Attribution License, which permits unrestricted use, distribution, and reproduction in any medium, provided the original author and source are credited. Data Availability Statement: All relevant data are within the paper and its Supporting Information files. Funding: This work was supported by Hewlett Packard – PROFACC, PhD Scholarship: RDP; the Foundation for Research Support of the State of Rio Grande do Sul (FAPERGS) (http://www.fapergs.rs. gov.br/), PhD Scholarship: CVQ, Project Grant: DDAR, Project Grant: ONS; and the National Council for Scientific and Technological Development (CNPq) (http://www.cnpq.br/), Project Grant: ONS, CNPq Research Fellow: ONS. The funders had no role in study design, data collection and analysis, decision to publish, or preparation of the manuscript.
Transcript of An Effective Approach for Clustering InhA Molecular Dynamics Trajectory Using Substrate-Binding...
RESEARCH ARTICLE
An Effective Approach for Clustering InhAMolecular Dynamics Trajectory UsingSubstrate-Binding Cavity FeaturesRenata De Paris1☯, Christian V. Quevedo1☯, Duncan D. A. Ruiz1*, Osmar Norberto deSouza2*
1 Grupo de Pesquisa em Inteligência de Negócio—GPIN, Faculdade de Informática, PUCRS, Av. Ipiranga,6681-Prédio 32, sala 628, Porto Alegre, RS, Brasil, 2 Laboratório de Bioinformática, Modelagem eSimulação de Biossistemas—LABIO, Faculdade de Informática, PUCRS, Av. Ipiranga, 6681- Building 32,Room 602, Porto Alegre, RS, Brasil
☯ These authors contributed equally to this work.* [email protected] (DDAR); [email protected] (ONS)
AbstractProtein receptor conformations, obtained from molecular dynamics (MD) simulations, have
become a promising treatment of its explicit flexibility in molecular docking experiments
applied to drug discovery and development. However, incorporating the entire ensemble of
MD conformations in docking experiments to screen large candidate compound libraries is
currently an unfeasible task. Clustering algorithms have been widely used as a means to
reduce such ensembles to a manageable size. Most studies investigate different algorithms
using pairwise Root-Mean Square Deviation (RMSD) values for all, or part of the MD confor-
mations. Nevertheless, the RMSD only may not be the most appropriate gauge to cluster
conformations when the target receptor has a plastic active site, since they are influenced
by changes that occur on other parts of the structure. Hence, we have applied two partition-
ing methods (k-means and k-medoids) and four agglomerative hierarchical methods (Com-
plete linkage, Ward’s, Unweighted Pair Group Method and Weighted Pair Group Method) to
analyze and compare the quality of partitions between a data set composed of properties
from an enzyme receptor substrate-binding cavity and two data sets created using different
RMSD approaches. Ensembles of representative MD conformations were generated by
selecting a medoid of each group from all partitions analyzed. We investigated the perfor-
mance of our new method for evaluating binding conformation of drug candidates to the
InhA enzyme, which were performed by cross-docking experiments between a 20 ns MD
trajectory and 20 different ligands. Statistical analyses showed that the novel ensemble,
which is represented by only 0.48% of the MD conformations, was able to reproduce 75% of
all dynamic behaviors within the binding cavity for the docking experiments performed.
Moreover, this new approach not only outperforms the other two RMSD-clustering solu-
tions, but it also shows to be a promising strategy to distill biologically relevant information
from MD trajectories, especially for docking purposes.
PLOS ONE | DOI:10.1371/journal.pone.0133172 July 28, 2015 1 / 25
a11111
OPEN ACCESS
Citation: De Paris R, Quevedo CV, Ruiz DDA,Norberto de Souza O (2015) An Effective Approachfor Clustering InhA Molecular Dynamics TrajectoryUsing Substrate-Binding Cavity Features. PLoS ONE10(7): e0133172. doi:10.1371/journal.pone.0133172
Editor: Patrick Aloy, Institute for Research inBiomedicine, SPAIN
Received: January 10, 2015
Accepted: June 23, 2015
Published: July 28, 2015
Copyright: © 2015 De Paris et al. This is an openaccess article distributed under the terms of theCreative Commons Attribution License, which permitsunrestricted use, distribution, and reproduction in anymedium, provided the original author and source arecredited.
Data Availability Statement: All relevant data arewithin the paper and its Supporting Information files.
Funding: This work was supported by HewlettPackard – PROFACC, PhD Scholarship: RDP; theFoundation for Research Support of the State of RioGrande do Sul (FAPERGS) (http://www.fapergs.rs.gov.br/), PhD Scholarship: CVQ, Project Grant:DDAR, Project Grant: ONS; and the National Councilfor Scientific and Technological Development (CNPq)(http://www.cnpq.br/), Project Grant: ONS, CNPqResearch Fellow: ONS. The funders had no role instudy design, data collection and analysis, decision topublish, or preparation of the manuscript.
IntroductionMolecular dynamics (MD) simulation and the insights it offers into protein motion is a power-ful technique for understanding the structure and function of biological macromolecules inrational drug discovery [1, 2]. It incorporates flexibility on 3D structures of biological macro-molecules by exploring the dynamic behavior of proteins at different timescales. A typical MDsimulation may generate above of 104 conformations or snapshots to explore the conforma-tional space of the protein concerned by individual particle motions as a function of time [1].Although this approach is time-consuming, it provides improved accuracy in the moleculardocking process and opens new opportunities for the discovery of novel potential drugs [3]. Inthis study, the large ensemble of snapshots generated by an MD simulation is called a Fully-Flexible Receptor (FFR) model [4]. Typically, FFR models are used to play docking experi-ments with accessible ligand libraries, which hold currently at least 106 possible solutions[5–8]. Therefore, the high computational cost involved in using FFR models to perform practi-cal virtual screening in such ligand databases may make it unfeasible. For this reason, new andpromising approaches to reduce the dimensionality of FFR models systematically—withoutlosing critical structural information—should be investigated and applied [9].
Clustering has been used in a variety of situations, such as understanding virtual screeningresults [10], partitioning data sets into structurally homogeneous subsets for modeling [11, 12],and picking representative chemical structures from individual clusters [13–15]. The use ofclustering algorithms to group similar conformations is the most appropriate data miningtechnique to distill the structural information from properties of an MD trajectory [16–18]. Inthis approach, MD receptor conformations are grouped according to some similarity metricsuch as Root Mean Square Deviation (RMSD) [13, 19] or Distance Matrix Error Dab (DME)[17].
Several studies used clustering algorithms to investigate dissimilar behavior on the MD tra-jectory. For example, Li [11] used RMSD differences and dihedral angles transitions from asmall MD trajectory of the HIV-1 integrase catalytic core to create conformational ensemblesusing the Bayesian clustering method. Li applied the posterior probability and the class crossentropy to identify the optimal number of clusters; however, the quality of clustering was mea-sured by visual inspection. Philips et al. [12] developed a framework to validate the perfor-mance and utility of spectral clustering algorithms for studying molecular biopolymersimulations. A more detailed analysis on clustering of MD trajectories using different methodswas done by Torda and van Gunsteren [17] and Shao et al. [16]. Torda and van Gunsteren cre-ated the distance measure Dab for clustering an MD trajectory with 2,000 structures applyingsingle linkage and hierarchical divisive algorithms, and they concluded that the divisive algo-rithm produced satisfactory results when a trajectory configuration is evenly distributed acrossthe conformational space. Shao et al. [16] compared eleven different clustering algorithms toassess the performance and differences between such algorithms based on the pairwise RMSDdistance. Shao and co-authors used the clustering metrics to find an adequate number of clus-ters in ensembles of structures taken from a sieving approach. In this approach, a portion ofthe data is clustered and the remaining data are added to existing clusters in order to handlevery large data sets more efficiently. To assess the advantages of using the sieving approach,Shao et al. [16] performed four clustering experiments and concluded that pairwise RMSD val-ues were able to keep the DB [20] and CH [21] values similar to MD conformations collectedat every 10, 20, 50, and 500 ps. This sieved clustering performs well when the pairwise RMSDvalue is the only metric applied to measure the similarity between structures. However, makinguse of a sieving approach for identifying similarities from properties of the substrate-bindingcavity (such as area, volume, and heavy atoms) may lead to loss or distortion of the relations
An Approach for Clustering MD Trajectory Using Cavity-Based Features
PLOS ONE | DOI:10.1371/journal.pone.0133172 July 28, 2015 2 / 25
Competing Interests: The authors have declaredthat no competing interests exist.
among the original data and to a biased grouping, if the selection at the first stage is notrepresentative.
Alternative studies generate groups of similar conformations in order to find representativeobjects that reproduce the original MD trajectory [13, 22]. Nevertheless, the ability to apply aclustering method that is strongly sensitive to a measure of similarity and accurately extractsthe most meaningful biological information remains challenging. For instance, Lyman et al.[22] generate sets of reference structures by building histograms of nearest MD structuresbased on different cutoff distances (RMSD). The authors identify the optimal representativeensemble by comparing the convergence of the MD simulation and the relative populations ofthe clusters. On the other hand, Landon et al. [13] produce representative MD conformationsby mapping the number of cluster representatives at a 1.3 Å cutoff using the CS-Map clusteringalgorithm on apo and holo N1 X-ray structures. Even though both studies are capable of cover-ing very different portions of the conformational space of different MD trajectories, the pair-wise RMSD distances remain the only measure of similarity applied. Further, they conduct theexperiments with a reduced MD trajectory, which is generated by choosing the smallestobserved distance between any pairs of structure based on cutoff values.
In contrast to previous works, we concentrate our efforts on identifying small and localizedchanges that are expected to have a major influence on the interactions between flexible recep-tors and different ligands. The method we introduced may group similar behavior in the sub-strate-binding cavity of every MD conformation, which is impossible when using traditionalclustering methods, as shown in Fig 1. This figure highlights the differences in the cluster distri-bution between a traditional RMSD-based clustering (Fig 1a) and the strategy that we are pro-posing (Fig 1b). The latter depicts alternatives groups of binding modes that the MDsimulation holds at different timescales when several attributes from the binding cavity (suchas area, volume, RMSD and heavy atoms) are used as input for the k-means clustering algo-rithm. However, because of the pairwise RMSD distance applied as attribute for clustering thepartitioning from Fig 1a, the groups of conformations appears strongly influenced by structuralchanges that occurs along the MD trajectory.
This study presents two main contributions. First, we provide a detailed comparison of sixclustering algorithms applied to three different data sets from an MD trajectory. Subsequently,we identify ensembles of reduced and representative MD conformations from the best cluster-ing solutions based on measures of dispersions of estimated Free Energy of Binding (FEB) val-ues by docking experiments performed on AutoDock4 [23]. Towards this end, we comparedresulting partitions of every data set, which contain features extracted from a 20 ns MD trajec-tory of the InhA-NADH complex. The applied algorithms are partitioning methods (k-means[24] and k-medoids [25]) and agglomerative hierarchical methods (Complete linkage, Ward’sand Group average agglomerative methods). A performance comparison was made among twodata sets formed by different pairwise RMSD-based approaches and a data set built with prop-erties from the substrate-binding cavity, which is our novel approach for clustering MD trajec-tories. The analysis of the generated partitions were conducted by taking into account therepresentative object of each partition, i.e. the medoids. To select the best partitions, we assessquartile values from medoids of each partition based on predicted FEB values, which wereobtained by performing cross-docking experiments involving protein-ligand complexes with20 different ligands and the FFR model under study. Quartile values are computed in a detailedprogression of the partitioning, thereby allowing characterization of clustering performanceacross a range of number of clusters. Ensembles of representative MD snapshots were selectedfrom the best partitioning performance to evaluate the quality of the proposed ensemble. Toillustrate this, we evaluated if such a small and representative ensemble, which holds less than0.4% of all conformations, is able to cover a high level of dissimilar binding modes that the full
An Approach for Clustering MD Trajectory Using Cavity-Based Features
PLOS ONE | DOI:10.1371/journal.pone.0133172 July 28, 2015 3 / 25
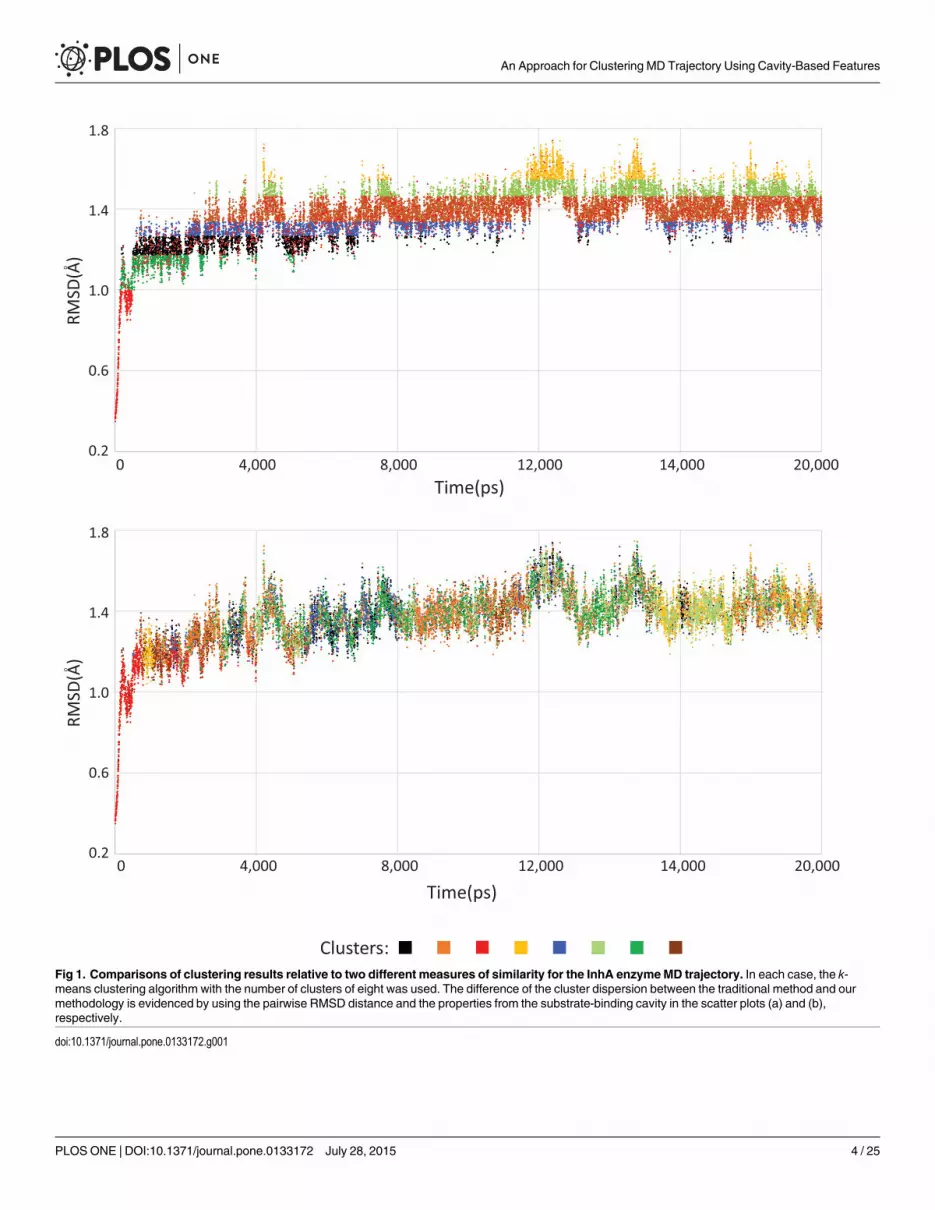
Fig 1. Comparisons of clustering results relative to two different measures of similarity for the InhA enzymeMD trajectory. In each case, the k-means clustering algorithm with the number of clusters of eight was used. The difference of the cluster dispersion between the traditional method and ourmethodology is evidenced by using the pairwise RMSD distance and the properties from the substrate-binding cavity in the scatter plots (a) and (b),respectively.
doi:10.1371/journal.pone.0133172.g001
An Approach for Clustering MD Trajectory Using Cavity-Based Features
PLOS ONE | DOI:10.1371/journal.pone.0133172 July 28, 2015 4 / 25
set of MD conformations can assume when it is submitted to docking experiments. Conse-quently, we expect to significantly reduce the redundancy in the full set of conformations, andthus make computationally tractable the practice of performing virtual screening experimentson MD trajectories, without losing the most biologically relevant information.
This paper is structured as follows. Section 2 describes details from the MD simulation, thestructural features from the substrate cavity of every MD conformation, clustering methodsand statistical metrics used to evaluate the quality of the produced clustering. Section 3 reportsthe analyses and experiments performed to group MD structures from three different data setsand six clustering algorithms as well as presents the reference structures selected to span thewhole MD trajectory. Finally, Section 4 describes the conclusions and future work directions.
Materials and Methods
Molecular Dynamics (MD) simulationThe MD trajectory used in this study was generated from the 2.2 Å crystal structure of theenzyme Enoyl-Reductase or InhA-NADH complex fromMycobacterium tuberculosis (PDBID: 1ENY) [26] with 41 crystallographic water molecules as described in Gargano et al. [27]. Inthis simulation, the Amber 9 program suite [28] and the AMBER ff99SB force field [29] wereused to extract data at every 1 ps interval over the 20 ns simulation, yielding a set of 20,000instantaneous receptor structures, being also referenced as a FFR model of InhA. For theNADHmolecule the atomic charges were assigned by ab initio calculations in the HF 6-31G�
level [30] and fitted with the RESP procedure [31], which are fully compatible with theAMBER force field [29]. The structures belonging to the FFR model were superimposed ontothe initial structure using a least-square fit and the protein was solvated with 10,491 TIP3Pwater molecules in a rectangular box of 77.7 Å x 73.3 Å x 77.3 Å. All hydrogen atoms, ions andwater molecules were initially submitted to 100 steps of energy minimization with steepestdescent in order to remove closely contacts of van der Waals forces. The pressure of the simula-tion was kept at 1 atm and, in order to avoid disturbance to the system, the temperature wasgradually increased from 10 K up to 298 K in six steps (10 K to 50 K, 50 K to 100 K, and soforth). For these steps of temperatures, the velocities were reassigned according to the Max-well-Boltzmann distribution and equilibrated for 200 ps.
We emphasize the changes that the macromolecular structure suffers during an MD simula-tion. The RMSD of protein backbone atoms from the initial structure is often used as an indica-tor of structural changes, as shown in Fig 1. The plot displays the structural variation of theInhA’s full trajectory and delineates the equilibration phase at 500 ps. During the equilibrationstage, the results present significant variations because the initial structure is not within theequilibrium phase of the simulation conditions. After this initial stage, MD properties can beefficiently studied by keeping the system in a steady non-equilibrium state [32]. For this reason,the first 500 conformations were withdrawn from the MD trajectory before starting the cluster-ing analyses. The RMSD variation of the production phase is stabilized between 1.0 Å and 1.8Å, reaching a plateau around 1.4 ± 0.1 Å.
Extracting structural features from the MD trajectoryFor clustering the MD conformations, we generated the following data sets:
1. Protein RMSD. It has the pairwise RMSD distance between the first and every MD’s struc-ture, considering all structure residues as applied by [16, 22, 33] (S1 Dataset).
2. Cavity RMSD. This data set contains the RMSD distance between the first and every MD’sstructure, considering the residues that enclose the substrate-binding cavity of the InhA
An Approach for Clustering MD Trajectory Using Cavity-Based Features
PLOS ONE | DOI:10.1371/journal.pone.0133172 July 28, 2015 5 / 25
enzyme in complex with NADH and the C16 substrate analog (PDB ID: 1BVR) enzyme.Application examples of this measure of similarity are in [13, 34] (S2 Dataset).
3. Cavity Attributes. It was built by using a set of features extracted from the substrate-bindingcavity of the MD trajectory. This is the proposed data set and a more detailed explanation isgiven in this section (S3 Dataset).
The first two data sets were generated from typical measures of similarity for clustering MDsimulations. Our purpose in using these data sets is to compare the quality of partitionsbetween them and the Cavity Attributes data set.
For generating the Cavity Attributes data set, we extract structural properties from the sub-strate-binding cavity of each conformation generated by an MD simulation. From those fea-tures, we seek to partition dissimilar behaviors found within the binding site along an MDsimulation followed by generating an ensemble of representative structures that allows the cov-ering of localized protein movements to improve the fitting of ligands during the docking pro-cess. The structural features extracted from the substrate cavity of each FFR model’sconformation and used as input to the clustering algorithms are:
1. the volume of the substrate cavity (in ų);
2. the number of heavy atoms present in the substrate-binding cavity of the 1BVR structure[35]; and;
3. the pairwise RMSD distance relative from the first to the current snapshot (in Å).
Pairwise RMSD distances were evaluated by using the differences among the backbone Cαatoms from the first structure against the conformation being compared, using the followingequation:
RMSDrt ;rref¼
ffiffiffiffiffiffiffiffiffiffiffiffiffiffiffiffiffiffiffiffiffiffiffiffiffiffiffiffiffiffiffiffiffiffiffiffi1
n
Xn
i¼1
jrt;i � rref :ij2vuut ð1Þ
where rt,i and rref,i are the positions of equivalent atoms in the conformation at time t(rt) alongthe MD simulations and the reference structure (rref), respectively. The RMSD was calculatedusing the ptrajmodule from AmberTools14 [36].
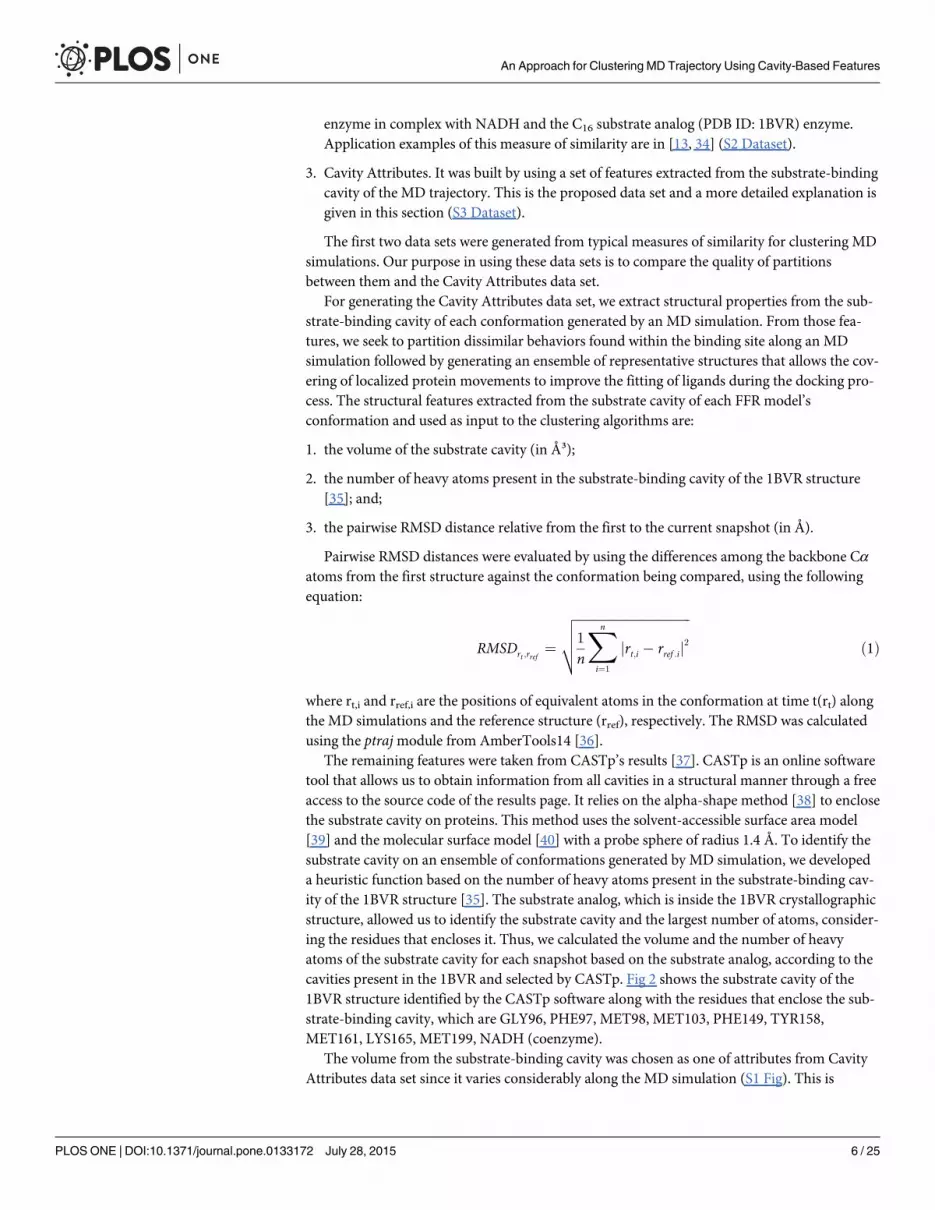
The remaining features were taken from CASTp’s results [37]. CASTp is an online softwaretool that allows us to obtain information from all cavities in a structural manner through a freeaccess to the source code of the results page. It relies on the alpha-shape method [38] to enclosethe substrate cavity on proteins. This method uses the solvent-accessible surface area model[39] and the molecular surface model [40] with a probe sphere of radius 1.4 Å. To identify thesubstrate cavity on an ensemble of conformations generated by MD simulation, we developeda heuristic function based on the number of heavy atoms present in the substrate-binding cav-ity of the 1BVR structure [35]. The substrate analog, which is inside the 1BVR crystallographicstructure, allowed us to identify the substrate cavity and the largest number of atoms, consider-ing the residues that encloses it. Thus, we calculated the volume and the number of heavyatoms of the substrate cavity for each snapshot based on the substrate analog, according to thecavities present in the 1BVR and selected by CASTp. Fig 2 shows the substrate cavity of the1BVR structure identified by the CASTp software along with the residues that enclose the sub-strate-binding cavity, which are GLY96, PHE97, MET98, MET103, PHE149, TYR158,MET161, LYS165, MET199, NADH (coenzyme).
The volume from the substrate-binding cavity was chosen as one of attributes from CavityAttributes data set since it varies considerably along the MD simulation (S1 Fig). This is
An Approach for Clustering MD Trajectory Using Cavity-Based Features
PLOS ONE | DOI:10.1371/journal.pone.0133172 July 28, 2015 6 / 25
evidenced by analyzing the substrate-binding cavity volumes generated by CASTp, which ran-ged from 45.4 Å3 to 2,852.9 Å3 for the entire 20 ns MD simulation trajectory. We also note thatthe volumes of the substrate-binding cavity from the MD trajectory comprise proportionallythose found in the boundaries of the InhA crystal structure. For instance, cavity volumes from2B37 and 4OXN structures are 445.1 Å3 and 2,032.8 Å3, respectively, pointing out to signifi-cantly different volume values in the MD trajectory.
Fig 2. Substrate-binding cavity of the InhA enzyme (PDB ID: 1BVR) identified by the CASTp software tool.On the left, the substrate-binding cavity ofthe 1BVR structure represented by molecular surface and colored by atom types (carbon and hydrogen: light grey; nitrogen: blue; oxygen: red; sulphur:yellow). The projection displays all residues from the binding pocket in stick representation.
doi:10.1371/journal.pone.0133172.g002
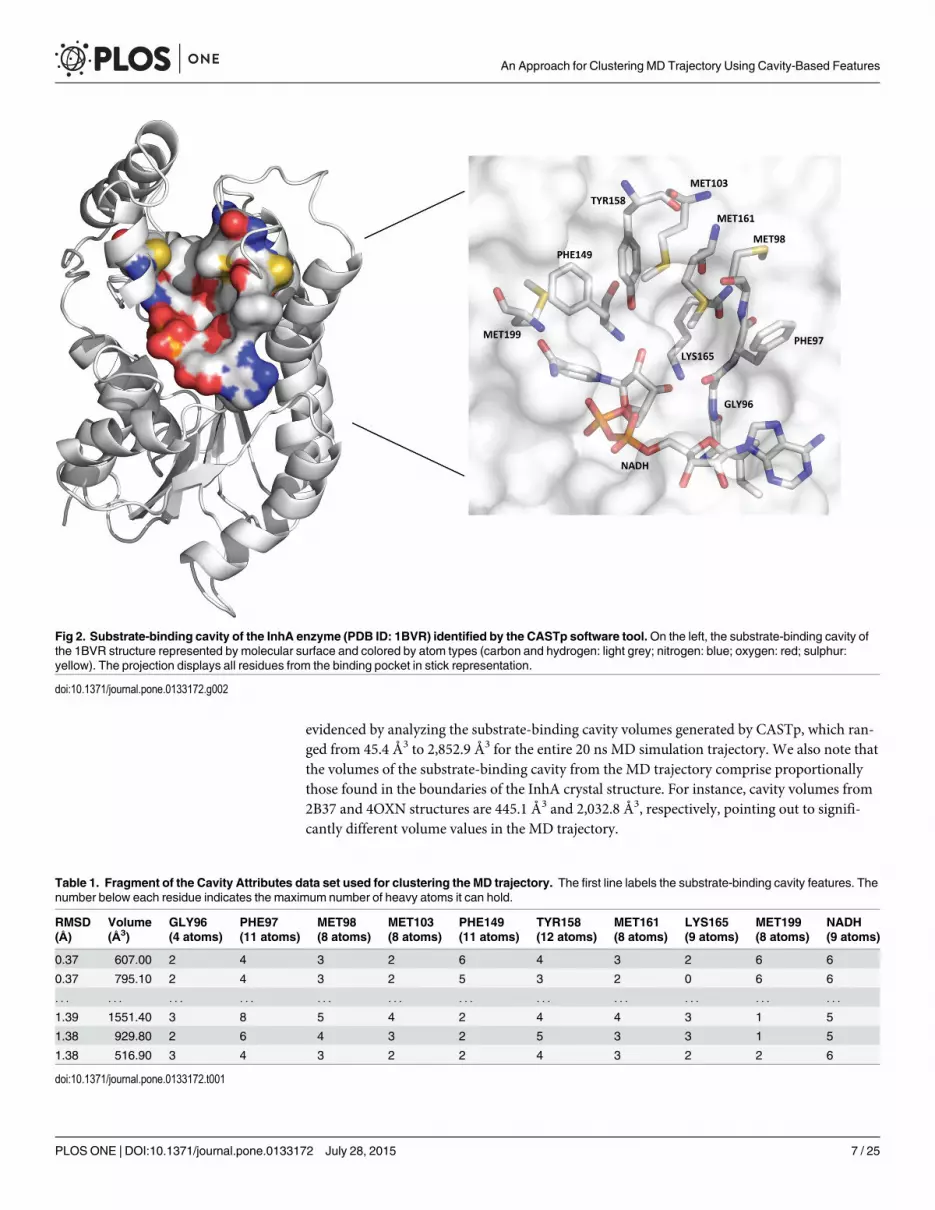
Table 1. Fragment of the Cavity Attributes data set used for clustering the MD trajectory. The first line labels the substrate-binding cavity features. Thenumber below each residue indicates the maximum number of heavy atoms it can hold.
RMSD Volume GLY96 PHE97 MET98 MET103 PHE149 TYR158 MET161 LYS165 MET199 NADH(Å) (Å3) (4 atoms) (11 atoms) (8 atoms) (8 atoms) (11 atoms) (12 atoms) (8 atoms) (9 atoms) (8 atoms) (9 atoms)
0.37 607.00 2 4 3 2 6 4 3 2 6 6
0.37 795.10 2 4 3 2 5 3 2 0 6 6
. . . . . . . . . . . . . . . . . . . . . . . . . . . . . . . . . . . .
1.39 1551.40 3 8 5 4 2 4 4 3 1 5
1.38 929.80 2 6 4 3 2 5 3 3 1 5
1.38 516.90 3 4 3 2 2 4 3 2 2 6
doi:10.1371/journal.pone.0133172.t001
An Approach for Clustering MD Trajectory Using Cavity-Based Features
PLOS ONE | DOI:10.1371/journal.pone.0133172 July 28, 2015 7 / 25
Although the volume allows us to identify the biggest accessible surface of the substrate-binding cavity, we also considered the geometric properties of the cavity to identify whether ornot the cavity dimension allows the fitting of a ligand within this 3D space. For that, we devel-oped a function based on a weight system. It gives weight 1 for the atoms whose residues deter-mine the substrate analog in the crystal structure, and 3 for atoms whose residues surround theNADH nicotinamide ring. Remember that the substrate cavity is placed on the NADH coen-zyme, which shapes the base of the target cavity and, for this reason, has more weight. Thealgorithm output is a set of cavities and their respective scores (sum of weights) for every con-formation. Hence, we consider cavities with potential level of binding those that show highscores of weights.
The number of heavy atoms summarized by the residues from the binding cavity are illus-trated in Table 1. In this table, it is clear that the RMSD values are fully sensitive to conforma-tional changes. However, the direction of internal motions is only detected by the volume andheavy atoms, which in turn recognizes small and localized changes that take place in the sol-vent-accessible surface of flexible systems. For instance, the first two and last two structurescontain equal RMSD values; however there is a considerable difference between the volumevalue and the number of heavy atoms for each residues. The values from Table 1 are in differ-ent ranges since they correspond to the original information of each conformation. For cluster-ing purposes, we created a CSV file with the data normalized within the interval [0,1]. It isnoteworthy that this methodology is not specific for the InhA’s protein; it may be used for anystructure that contains its binding sites known in advance.
Clustering AlgorithmsThe large ensemble of MD conformations was clustered using algorithms implemented in theR Programming Language [41]. k-means [24], k-medoids [25], agglomerative hierarchical [25]methods and their variations were used to find representative clusters of the FFR model. k-means and k-medoids belong to the set of partitioning clustering methods, which divide a setof data objects into non-overlapping subsets with spherical shape such that each data object isin exactly one subset [42, 43].
k-means is a well-known clustering algorithm that locally optimizes the average squared dis-tance of points from their nearest cluster center (centroid). It randomly chooses k centroids,and refines them throughout several iterations, where the distance of every point to the k cen-troids are computed to determine the cluster memberships [24]. To generate groups morecompact and separate as possible, the k-means algorithm applies the sum of squared errors(EMeans) between all objects p of a given cluster Ch and its centroid ch for all clusters k accord-ing to the following equation:
EMeans ¼Xk
h¼1
Xp2Ch
distðp; chÞ2 ð2Þ
In contrast to k-means, whose centroid almost never correspond to an object, k-medoidsuses the PAM (Partitioning Around Medoids) algorithm [25] for clustering data sets based oncentral objects. This algorithm chooses a set of representative objects or medoids to determinewhether a non representative object is a good replacement for a current medoid [43]. While thek-means technique uses the sum of the squared error function to measure the within-clustervariation, the k-medoids algorithms apply an absolute error criterion. In this method, theobjects (n) are grouped into k clusters by minimizing the sum of the dissimilarities betweeneach object and its corresponding representative. Then, the sum of the absolute error for all
An Approach for Clustering MD Trajectory Using Cavity-Based Features
PLOS ONE | DOI:10.1371/journal.pone.0133172 July 28, 2015 8 / 25
objects p in the data set is defined as:
EMedoids ¼Xk
h¼1
Xp2Ch
distðp; ohÞ ð3Þ
Where oh is the representative object of Ch. PAM is the algorithm used to compute medoidsfor small data sets. To deal with large data, PAM has an extension called CLARA (ClusteringLARge Applications) [25]. CLARA optimizes the k-medoids performance by generating sam-ples from the entire data set and computing the medoids from them using PAM algorithm.Even though CLARA is used to reduce the time taken to generate partitions from k-medoids, itis still a time-consuming task since its complexity is O(ks2+(k(n-k))), where s is the size of thesample, k is the number of clusters and n the number of objects. In this study, CLARA is thealgorithm applied to generate the k-medoid partitions due to the dimension of our data sets.
Unlike partitioning clustering, hierarchical clustering methods aim to group data into levelssuch as in a hierarchy or “tree” of clusters [43]. It has two basic approaches, known as agglom-erative and divisive. The agglomerative hierarchical clustering, which uses the bottom-up strat-egy, starts with each object as an individual cluster and interactively merges the closest pair ofclusters until all the objects are in a single cluster or the maximum number of clusters isreached. The divisive hierarchical clustering, which uses the top-down strategy, starts with allobjects in the same cluster and splits a cluster into smaller clusters in each iteration until eachobject becomes a singleton cluster or a termination condition holds [42, 43]. In this study, weuse only the agglomerative algorithms since the divisive method does not handle efficientlylarge data sets due to its computational costs. The limiting factor of the divisive method is thatthere are 2n−1−1 possible ways to partition a set of n objects into two subsets.
To measure the proximity between two points in two different clusters, the agglomerativealgorithms widely use the methods known as single linkage, complete linkage, median, cen-troid, group average and Ward’s. In our study, all these methods were applied for clusteringthe data sets using the AGNES (AGglomerative NESting) method [25]. However, there are cer-tain drawbacks associated with the use of some agglomerative algorithms. Two of these are thehigh number of singleton clusters and sensibility to outliers. For instance, we found in somepartitions more than 50% of all MD conformations within a single large cluster. Hence, weidentified that the best agglomerative methods to adopt for this investigation are CompleteLinkage, Unweighted Pair Group Method using Arithmetic averages (UPGMA), WeightedPair Group Method using Arithmetic averages (WPGMA) andWard’s.
The complete linkage version of hierarchical clustering tends to minimize the increase indiameter of the clusters at each iteration by determining the proximity of two clusters (Ci, Cj)as the maximum distance based on the following equation:
CompleteðCi;CjÞ ¼ maxx2Ci ;y2Cj
distfjx � yjg ð4Þ
where |x-y| is the distance between two objects or points x and y.In UPGMA andWPGMA, which are group average agglomerative methods, the distance
between two clusters is defined as the average pairwise proximity among all pairs of points orobjects in different clusters. The difference between these methods is the weight given to thepoints in different clusters to measure the pairwise proximity. While UPGMA takes intoaccount the number of points in each cluster making a linkage between groups, WPGMA treatsall clusters equally making a linkage within groups. The equations defined to measure the
An Approach for Clustering MD Trajectory Using Cavity-Based Features
PLOS ONE | DOI:10.1371/journal.pone.0133172 July 28, 2015 9 / 25
distance between the clusters for UPGMA andWPGMAmethods are:
UPGMAðCi;CjÞ ¼1
ninj
Xx2Ci
Xy2Cj
distjx � yj ð5Þ
WPGMAðCi;CjÞ ¼1
2
Xx2Ci
Xy2Cj
distjx � yj ð6Þ
where ni and nj are the number of objects from cluster Ci and Cj, respectively, and |x-y| is thedistance between two objects or points x and y.
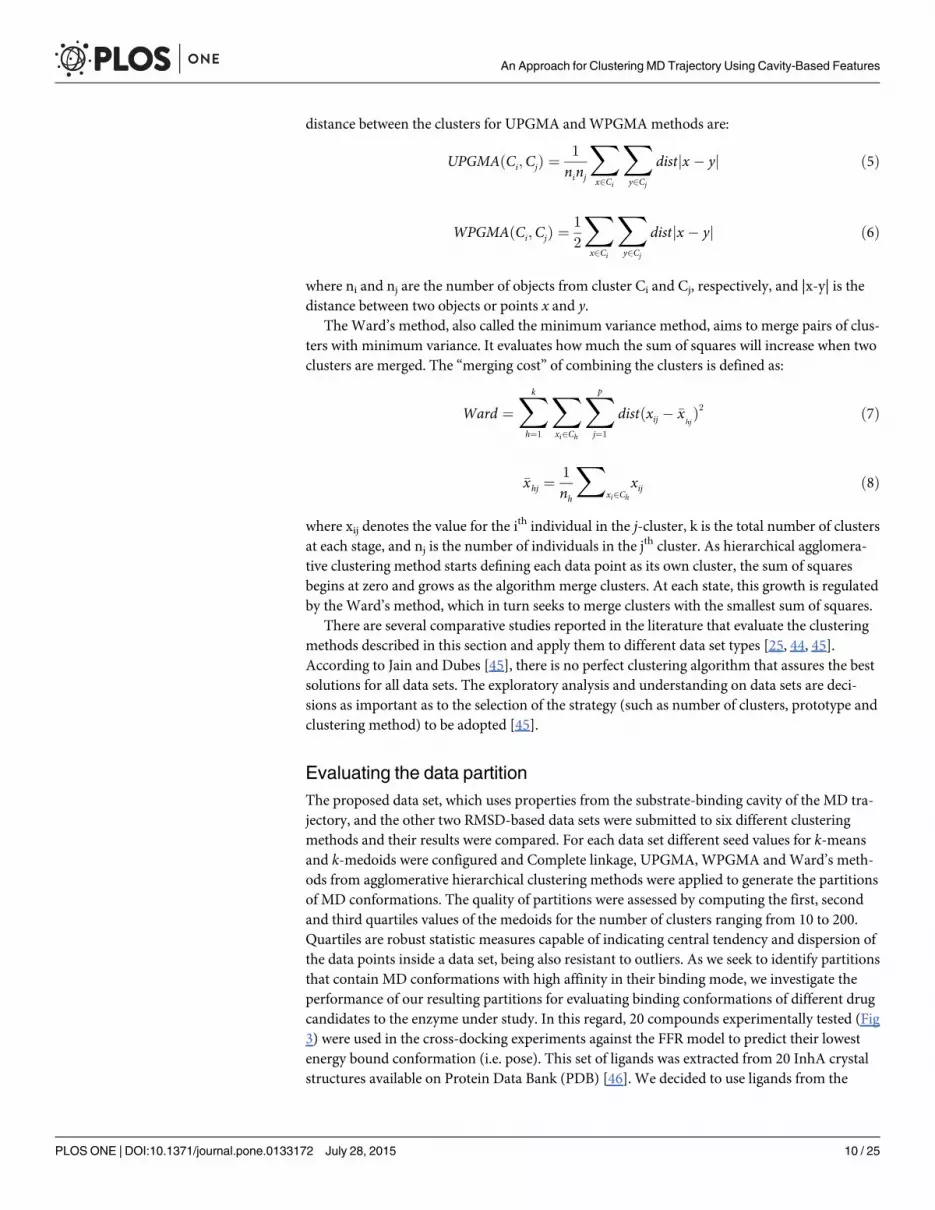
The Ward’s method, also called the minimum variance method, aims to merge pairs of clus-ters with minimum variance. It evaluates how much the sum of squares will increase when twoclusters are merged. The “merging cost” of combining the clusters is defined as:
Ward ¼Xk
h¼1
Xxi2Ch
Xp
j¼1
distðxij � �xhjÞ2 ð7Þ
�xhj ¼1
nh
Xxi2Ch
xij ð8Þ
where xij denotes the value for the ith individual in the j-cluster, k is the total number of clusters
at each stage, and nj is the number of individuals in the jth cluster. As hierarchical agglomera-tive clustering method starts defining each data point as its own cluster, the sum of squaresbegins at zero and grows as the algorithm merge clusters. At each state, this growth is regulatedby the Ward’s method, which in turn seeks to merge clusters with the smallest sum of squares.
There are several comparative studies reported in the literature that evaluate the clusteringmethods described in this section and apply them to different data set types [25, 44, 45].According to Jain and Dubes [45], there is no perfect clustering algorithm that assures the bestsolutions for all data sets. The exploratory analysis and understanding on data sets are deci-sions as important as to the selection of the strategy (such as number of clusters, prototype andclustering method) to be adopted [45].
Evaluating the data partitionThe proposed data set, which uses properties from the substrate-binding cavity of the MD tra-jectory, and the other two RMSD-based data sets were submitted to six different clusteringmethods and their results were compared. For each data set different seed values for k-meansand k-medoids were configured and Complete linkage, UPGMA, WPGMA andWard’s meth-ods from agglomerative hierarchical clustering methods were applied to generate the partitionsof MD conformations. The quality of partitions were assessed by computing the first, secondand third quartiles values of the medoids for the number of clusters ranging from 10 to 200.Quartiles are robust statistic measures capable of indicating central tendency and dispersion ofthe data points inside a data set, being also resistant to outliers. As we seek to identify partitionsthat contain MD conformations with high affinity in their binding mode, we investigate theperformance of our resulting partitions for evaluating binding conformations of different drugcandidates to the enzyme under study. In this regard, 20 compounds experimentally tested (Fig3) were used in the cross-docking experiments against the FFR model to predict their lowestenergy bound conformation (i.e. pose). This set of ligands was extracted from 20 InhA crystalstructures available on Protein Data Bank (PDB) [46]. We decided to use ligands from the
An Approach for Clustering MD Trajectory Using Cavity-Based Features
PLOS ONE | DOI:10.1371/journal.pone.0133172 July 28, 2015 10 / 25
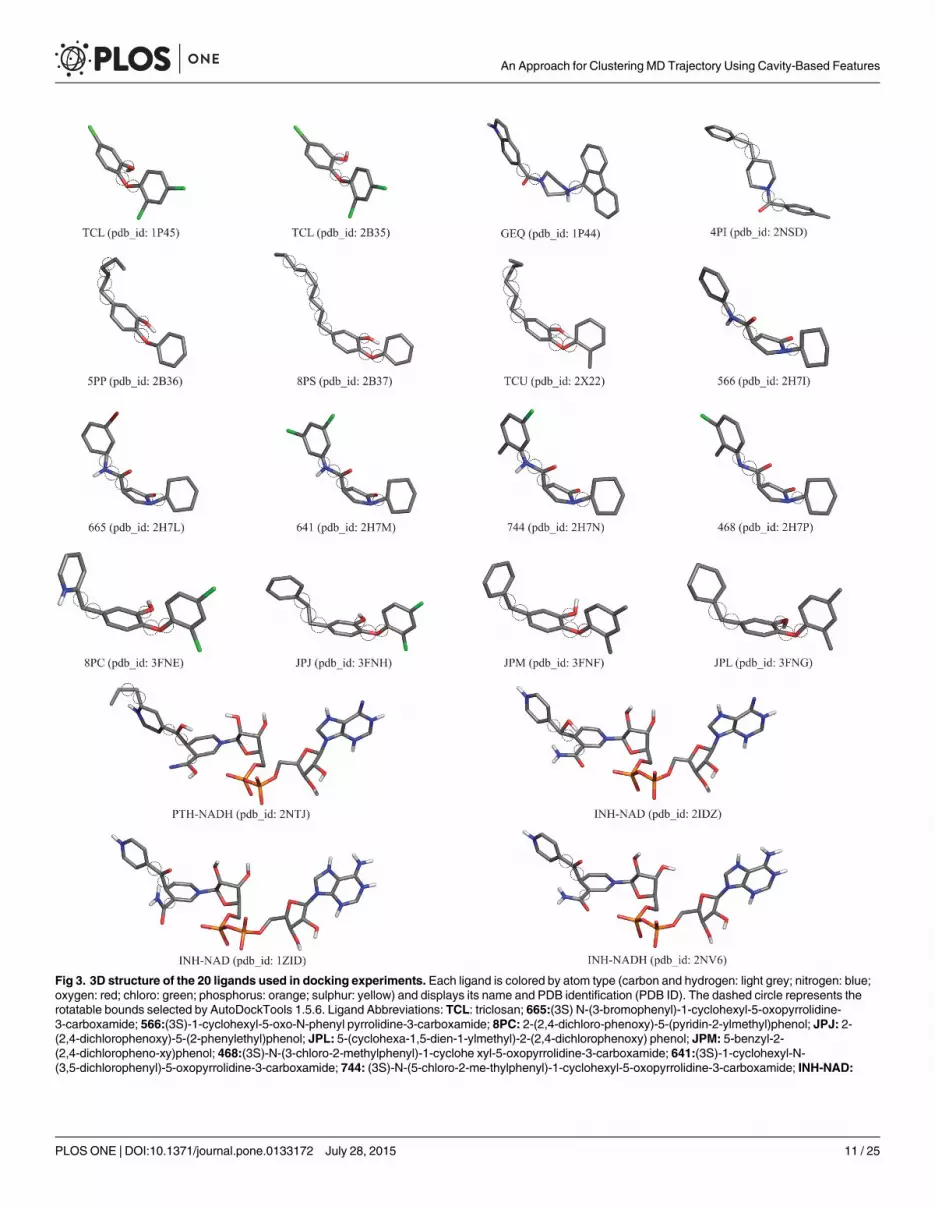
Fig 3. 3D structure of the 20 ligands used in docking experiments. Each ligand is colored by atom type (carbon and hydrogen: light grey; nitrogen: blue;oxygen: red; chloro: green; phosphorus: orange; sulphur: yellow) and displays its name and PDB identification (PDB ID). The dashed circle represents therotatable bounds selected by AutoDockTools 1.5.6. Ligand Abbreviations: TCL: triclosan; 665:(3S) N-(3-bromophenyl)-1-cyclohexyl-5-oxopyrrolidine-3-carboxamide; 566:(3S)-1-cyclohexyl-5-oxo-N-phenyl pyrrolidine-3-carboxamide; 8PC: 2-(2,4-dichloro-phenoxy)-5-(pyridin-2-ylmethyl)phenol; JPJ: 2-(2,4-dichlorophenoxy)-5-(2-phenylethyl)phenol; JPL: 5-(cyclohexa-1,5-dien-1-ylmethyl)-2-(2,4-dichlorophenoxy) phenol; JPM: 5-benzyl-2-(2,4-dichloropheno-xy)phenol; 468:(3S)-N-(3-chloro-2-methylphenyl)-1-cyclohe xyl-5-oxopyrrolidine-3-carboxamide; 641:(3S)-1-cyclohexyl-N-(3,5-dichlorophenyl)-5-oxopyrrolidine-3-carboxamide; 744: (3S)-N-(5-chloro-2-me-thylphenyl)-1-cyclohexyl-5-oxopyrrolidine-3-carboxamide; INH-NAD:
An Approach for Clustering MD Trajectory Using Cavity-Based Features
PLOS ONE | DOI:10.1371/journal.pone.0133172 July 28, 2015 11 / 25
available InhA crystallographic structures since the overall topology RMSD of their complexesare significantly different. According to Pauli et al. [47] the binding cavity volumes of the 36InhA Crystal structures available on PDB ranges from 1,597.3 Å3 to 3,046.7 Å3 for the wholecavity (NADH + substrate-binding cavity). This range represents the different sizes and struc-tures of the ligands that are bound in such structures, being a good sample of structures todock in our MD trajectory, which has its binding cavity volume ranges from 419.4 Å3 to2,032.8 Å3 (InhA-NAD complex).
The docking experiments were performed on FReMI [48], which is a powerful middlewaredeveloped to execute molecular docking simulations of FFR models in multiprocessingmachines using the AutoDock4.2.5.1 software [23]. We set up AutoDock4.2 to run theLamarckian Genetic algorithm on three Intel Core i7-2600 3.4 GHz computers with 12 GBRAM, using as operating system the Linux Ubuntu version 13.04. The number of docking runswas set up to 25 since we are working with flexible structures. The box dimensions for gridparameters were tailored according to the structure of each ligand. We defined the atom typesof AutoDock, add the Gasteiger charges and merge the non-polar atoms for each snapshot ofthe FFR model. All these configurations were determined before running the docking experi-ments and the input AutoDock files were generated during the experiments by FReMI [48]based on AutoDockTools 1.5.6 parameters. The energy evaluation and the number of genera-tions were configured as 300,000 and 27,000, respectively. All ligands were treated as flexible inAutoDock and their rotatable bounds are highlighted in Fig 3. In order to preserve the environ-mental conditions available to the substrate and ligands, the NADH coenzyme was consideredas part of the protein receptor. Conversely, we removed the NADH coenzyme from all snap-shots of the FFR model when we performed the experiments with adducts (INH-NAD andPTH-NAD), since they already have the coenzyme as part of their structures.
To obtain ensembles of representative MD conformations from the clustering algorithmsused we assessed the dispersion of the resulting partitions based on the predicted FEB values.The dispersion corresponds to the first, second and third quartile values that were calculated tocompare the level of convergence between the resulting partitions and the MD’s full trajectory.The first step in this process was to extract the medoids from all partitioning and obtained anensemble of medoids for every partitioning. This provided us diverse reduced and representa-tive ensembles of MD conformations. The second step was to calculate the quartile values fromthe ensembles of reduced MD conformations (or medoids) as follow:
Quartiles ¼XN
i¼1
XQ
j¼1
xij ð9Þ
where N is the amount of ligands and Q identifies the first, second and third quartiles, whichwere measured based on the predicted FEB values obtained from cross-docking experiments.With the quartile values at hand, we then evaluated the Sum of the Quartile Differences (SQD)in order to identify ensembles of medoids having similar dispersion to the MD’s full trajectory.
Isoniazid + NADH coenzyme; 5PP: 5-pentyl-2-phenoxyphenol; 8PS: 5-octyl-2-phenoxyphenol; TCU: 5-hexyl-2-(2-methylphenoxy)- phenol; PTH-NAD:Prothionamide + NADH coenzyme; THT: trans-2-hexadecenoyl-(n-acetyl-cys-teamine)- thioester 4PI: N-4-methylbenzoyl-4-benzylpiperidine;GEQ: 5-{[4-9H-fluoren-9-YL)pipera- zin-1-YL]carbonyl}-1H-indole.
doi:10.1371/journal.pone.0133172.g003
An Approach for Clustering MD Trajectory Using Cavity-Based Features
PLOS ONE | DOI:10.1371/journal.pone.0133172 July 28, 2015 12 / 25
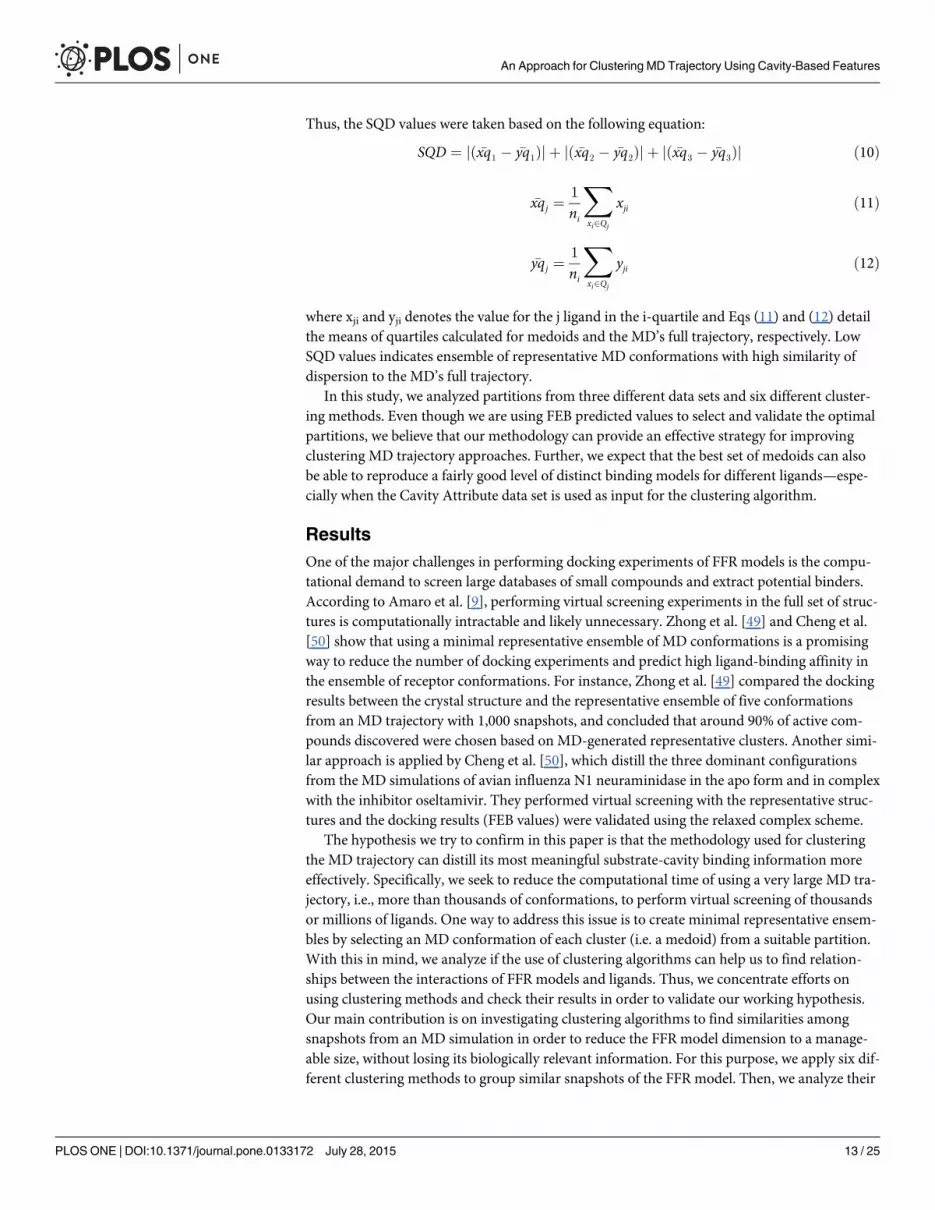
Thus, the SQD values were taken based on the following equation:
SQD ¼ jð �xq1 � �yq1Þj þ jð �xq2 � �yq2Þj þ jð �xq3 � �yq3Þj ð10Þ
�xqj ¼1
ni
Xxi2Qj
xji ð11Þ
�yqj ¼1
ni
Xxi2Qj
yji ð12Þ
where xji and yji denotes the value for the j ligand in the i-quartile and Eqs (11) and (12) detailthe means of quartiles calculated for medoids and the MD’s full trajectory, respectively. LowSQD values indicates ensemble of representative MD conformations with high similarity ofdispersion to the MD’s full trajectory.
In this study, we analyzed partitions from three different data sets and six different cluster-ing methods. Even though we are using FEB predicted values to select and validate the optimalpartitions, we believe that our methodology can provide an effective strategy for improvingclustering MD trajectory approaches. Further, we expect that the best set of medoids can alsobe able to reproduce a fairly good level of distinct binding models for different ligands—espe-cially when the Cavity Attribute data set is used as input for the clustering algorithm.
ResultsOne of the major challenges in performing docking experiments of FFR models is the compu-tational demand to screen large databases of small compounds and extract potential binders.According to Amaro et al. [9], performing virtual screening experiments in the full set of struc-tures is computationally intractable and likely unnecessary. Zhong et al. [49] and Cheng et al.[50] show that using a minimal representative ensemble of MD conformations is a promisingway to reduce the number of docking experiments and predict high ligand-binding affinity inthe ensemble of receptor conformations. For instance, Zhong et al. [49] compared the dockingresults between the crystal structure and the representative ensemble of five conformationsfrom an MD trajectory with 1,000 snapshots, and concluded that around 90% of active com-pounds discovered were chosen based on MD-generated representative clusters. Another simi-lar approach is applied by Cheng et al. [50], which distill the three dominant configurationsfrom the MD simulations of avian influenza N1 neuraminidase in the apo form and in complexwith the inhibitor oseltamivir. They performed virtual screening with the representative struc-tures and the docking results (FEB values) were validated using the relaxed complex scheme.
The hypothesis we try to confirm in this paper is that the methodology used for clusteringthe MD trajectory can distill its most meaningful substrate-cavity binding information moreeffectively. Specifically, we seek to reduce the computational time of using a very large MD tra-jectory, i.e., more than thousands of conformations, to perform virtual screening of thousandsor millions of ligands. One way to address this issue is to create minimal representative ensem-bles by selecting an MD conformation of each cluster (i.e. a medoid) from a suitable partition.With this in mind, we analyze if the use of clustering algorithms can help us to find relation-ships between the interactions of FFR models and ligands. Thus, we concentrate efforts onusing clustering methods and check their results in order to validate our working hypothesis.Our main contribution is on investigating clustering algorithms to find similarities amongsnapshots from an MD simulation in order to reduce the FFR model dimension to a manage-able size, without losing its biologically relevant information. For this purpose, we apply six dif-ferent clustering methods to group similar snapshots of the FFR model. Then, we analyze their
An Approach for Clustering MD Trajectory Using Cavity-Based Features
PLOS ONE | DOI:10.1371/journal.pone.0133172 July 28, 2015 13 / 25
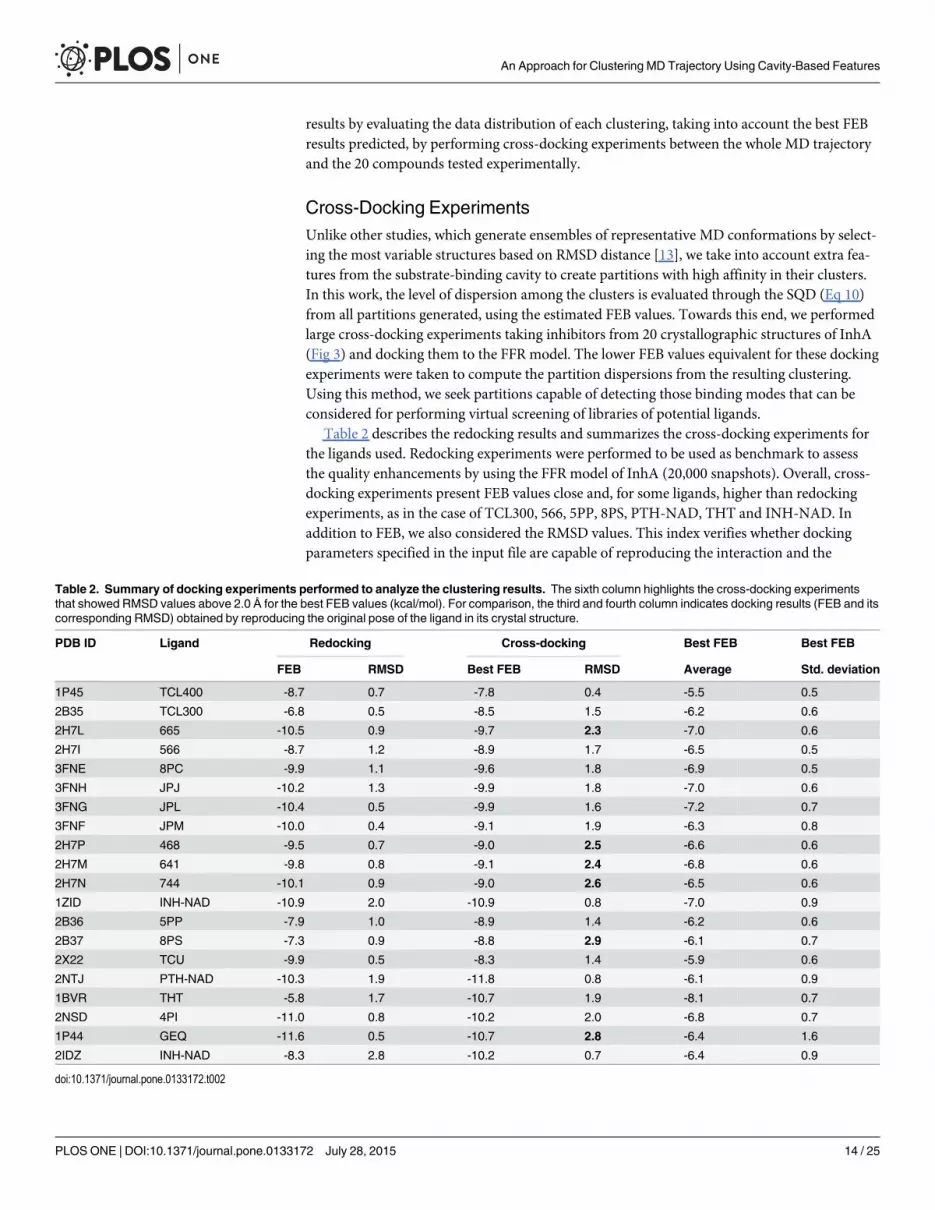
results by evaluating the data distribution of each clustering, taking into account the best FEBresults predicted, by performing cross-docking experiments between the whole MD trajectoryand the 20 compounds tested experimentally.
Cross-Docking ExperimentsUnlike other studies, which generate ensembles of representative MD conformations by select-ing the most variable structures based on RMSD distance [13], we take into account extra fea-tures from the substrate-binding cavity to create partitions with high affinity in their clusters.In this work, the level of dispersion among the clusters is evaluated through the SQD (Eq 10)from all partitions generated, using the estimated FEB values. Towards this end, we performedlarge cross-docking experiments taking inhibitors from 20 crystallographic structures of InhA(Fig 3) and docking them to the FFR model. The lower FEB values equivalent for these dockingexperiments were taken to compute the partition dispersions from the resulting clustering.Using this method, we seek partitions capable of detecting those binding modes that can beconsidered for performing virtual screening of libraries of potential ligands.
Table 2 describes the redocking results and summarizes the cross-docking experiments forthe ligands used. Redocking experiments were performed to be used as benchmark to assessthe quality enhancements by using the FFR model of InhA (20,000 snapshots). Overall, cross-docking experiments present FEB values close and, for some ligands, higher than redockingexperiments, as in the case of TCL300, 566, 5PP, 8PS, PTH-NAD, THT and INH-NAD. Inaddition to FEB, we also considered the RMSD values. This index verifies whether dockingparameters specified in the input file are capable of reproducing the interaction and the
Table 2. Summary of docking experiments performed to analyze the clustering results. The sixth column highlights the cross-docking experimentsthat showed RMSD values above 2.0 Å for the best FEB values (kcal/mol). For comparison, the third and fourth column indicates docking results (FEB and itscorresponding RMSD) obtained by reproducing the original pose of the ligand in its crystal structure.
PDB ID Ligand Redocking Cross-docking Best FEB Best FEB
FEB RMSD Best FEB RMSD Average Std. deviation
1P45 TCL400 -8.7 0.7 -7.8 0.4 -5.5 0.5
2B35 TCL300 -6.8 0.5 -8.5 1.5 -6.2 0.6
2H7L 665 -10.5 0.9 -9.7 2.3 -7.0 0.6
2H7I 566 -8.7 1.2 -8.9 1.7 -6.5 0.5
3FNE 8PC -9.9 1.1 -9.6 1.8 -6.9 0.5
3FNH JPJ -10.2 1.3 -9.9 1.8 -7.0 0.6
3FNG JPL -10.4 0.5 -9.9 1.6 -7.2 0.7
3FNF JPM -10.0 0.4 -9.1 1.9 -6.3 0.8
2H7P 468 -9.5 0.7 -9.0 2.5 -6.6 0.6
2H7M 641 -9.8 0.8 -9.1 2.4 -6.8 0.6
2H7N 744 -10.1 0.9 -9.0 2.6 -6.5 0.6
1ZID INH-NAD -10.9 2.0 -10.9 0.8 -7.0 0.9
2B36 5PP -7.9 1.0 -8.9 1.4 -6.2 0.6
2B37 8PS -7.3 0.9 -8.8 2.9 -6.1 0.7
2X22 TCU -9.9 0.5 -8.3 1.4 -5.9 0.6
2NTJ PTH-NAD -10.3 1.9 -11.8 0.8 -6.1 0.9
1BVR THT -5.8 1.7 -10.7 1.9 -8.1 0.7
2NSD 4PI -11.0 0.8 -10.2 2.0 -6.8 0.7
1P44 GEQ -11.6 0.5 -10.7 2.8 -6.4 1.6
2IDZ INH-NAD -8.3 2.8 -10.2 0.7 -6.4 0.9
doi:10.1371/journal.pone.0133172.t002
An Approach for Clustering MD Trajectory Using Cavity-Based Features
PLOS ONE | DOI:10.1371/journal.pone.0133172 July 28, 2015 14 / 25
structure of a known complex [23]. The best results are achieved when the predicted positionby the docking algorithm with the lowest energy has the RMSD value less or equal to 2.0 Åfrom the crystallographic position of the ligand [51]. Table 2 highlights the RMSD values for665, 468, 641, 744, 8PS, and GEQ since these ligands present energetically favorable interac-tions with the MD trajectory, but their final binding-mode are significantly different fromthose obtained by the crystallographic structures.
It is worth notice that the FEB and RMSD values from Table 2 show that ligands resultingfrom adducts of NADH fit better in the FFR model than their crystallographic structures. Forinstance, RMSD values from the lowest energy conformation for INH-NAD and PTH-NADligands are around 0.8 Å in cross-docking experiments and over 1.9 Å in redocking experi-ments. This well fit is justified by the fact that the FFR model was generated from an MD simu-lation of the InhA-NADH enzyme complex, which in turn provides suitable clefts in thesubstrate-binding cavity due to its flexibility. Remaining ligands were unable to overcomeRMSD values undertaken by crystallographic structures but they present very similar FEB val-ues. It means that, the FFR model of 1ENY was able to produce a favorable interaction with theligands even when the RMSD is higher than the crystallographic conformation.
In this study, we omitted details on the level of accuracy of docking experiments since ourfocus is to employ FEB values predicted from cross-docking experiments and to analyze themto identify optimal partitioning solutions from the clustering methods used. Redocking experi-ments were performed to take the input docking parameters for cross-docking experiments.The statistical analysis, i.e. average and standard deviation, represents FEB variations predictedby AutoDock4 along the production phase of the MD trajectory against each of the 20 ligands.From Table 2, we can concluded that, except for GEQ ligand, the variation of the FEB values inthe cross-docking experiments was less than 0.9 kcal/mol in 68% of the MD conformations,concentrating a large quantity of conformations closely to the average FEB values.
Clustering analyses on data sets from the MD trajectoryThis section reports and compares the results obtained for clustering three different data setsfrom structural information of the FFR model. We applied the six clustering algorithmsdescribed in the Materials and Methods section. In this regard, we first executed the clusteringalgorithms for Cavity Attributes, Cavity RMSD, and Protein RMSD data sets varying the num-ber of clusters from 10 to 200, and afterward we extracted the medoids from every generatedpartitioning. Solutions were evaluated based on statistical assessments in the predicted FEB val-ues. We decided to start the clustering analyses from 10 since low k values shows poor level ofscatter and, consequently are unable to reflect all possible movements of a 20 ns MD trajectory.In opposition, high numbers of clusters tend to represent better dispersion but we limit thecluster ranges up to 1% of all MD conformations since our findings show the best partitioningsolution used cluster count less than 100. Our first set of experiments was performed with anumber of clusters range from 2 to 1,000. However, we decided to decrease this range for tworeasons: (i) the time consuming taken for performing practical virtual screening of large data-base of ligands in an ensemble with 1,000 representative MD conformations; and (ii) the highlevel of accuracy achieved by using a representative ensemble with 200 MD conformations.
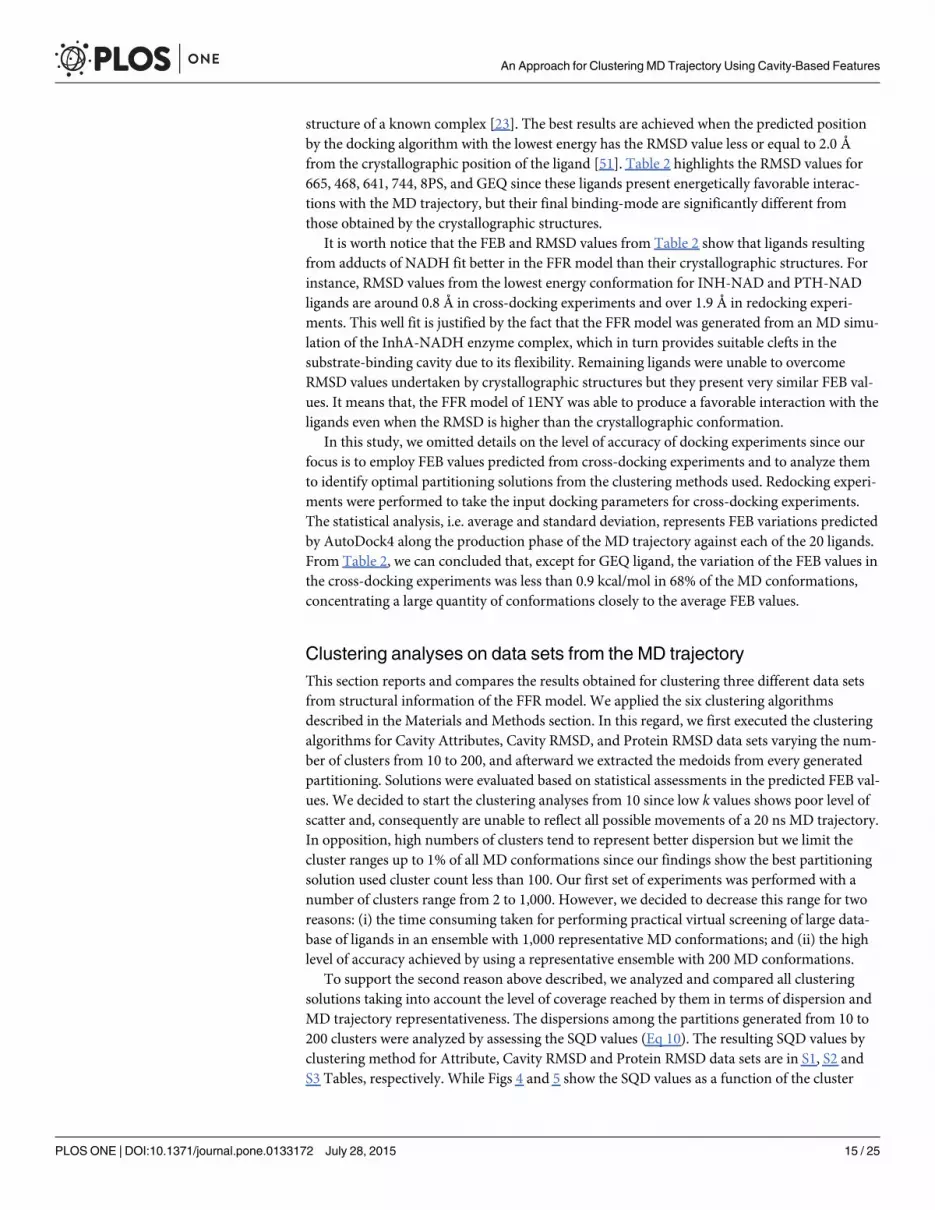
To support the second reason above described, we analyzed and compared all clusteringsolutions taking into account the level of coverage reached by them in terms of dispersion andMD trajectory representativeness. The dispersions among the partitions generated from 10 to200 clusters were analyzed by assessing the SQD values (Eq 10). The resulting SQD values byclustering method for Attribute, Cavity RMSD and Protein RMSD data sets are in S1, S2 andS3 Tables, respectively. While Figs 4 and 5 show the SQD values as a function of the cluster
An Approach for Clustering MD Trajectory Using Cavity-Based Features
PLOS ONE | DOI:10.1371/journal.pone.0133172 July 28, 2015 15 / 25
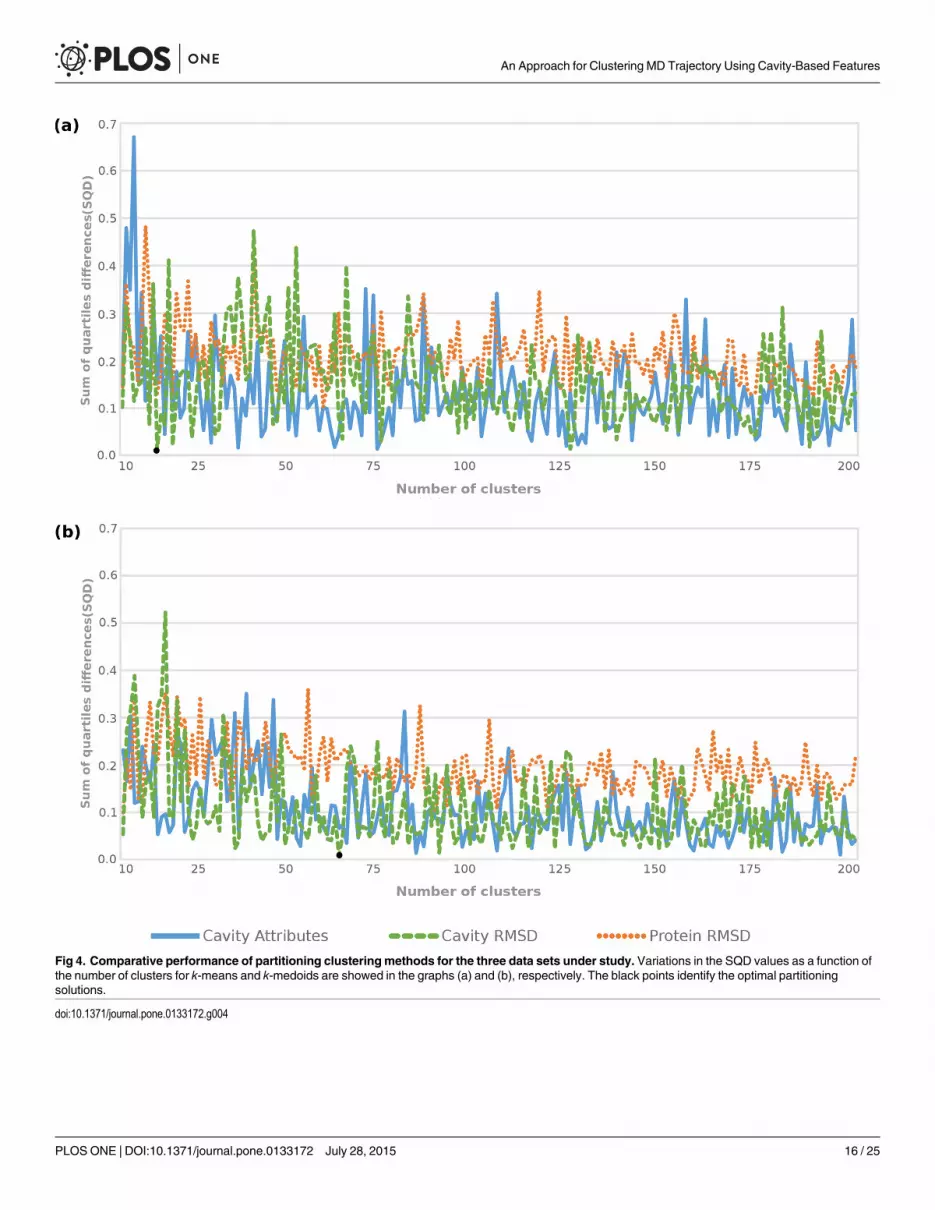
Fig 4. Comparative performance of partitioning clusteringmethods for the three data sets under study. Variations in the SQD values as a function ofthe number of clusters for k-means and k-medoids are showed in the graphs (a) and (b), respectively. The black points identify the optimal partitioningsolutions.
doi:10.1371/journal.pone.0133172.g004
An Approach for Clustering MD Trajectory Using Cavity-Based Features
PLOS ONE | DOI:10.1371/journal.pone.0133172 July 28, 2015 16 / 25
Fig 5. Comparative performance of hierarchical agglomerative clustering methods for each of thethree data sets generated from the conformations of the MD trajectory. The SQD values as a function ofthe number of clusters for, UPGMA,WPGMA, Complete andWard’s methods are showed in the graphs (a),(b), (c) and (d), respectively. The black points identify optimal partitioning solutions.
doi:10.1371/journal.pone.0133172.g005
An Approach for Clustering MD Trajectory Using Cavity-Based Features
PLOS ONE | DOI:10.1371/journal.pone.0133172 July 28, 2015 17 / 25
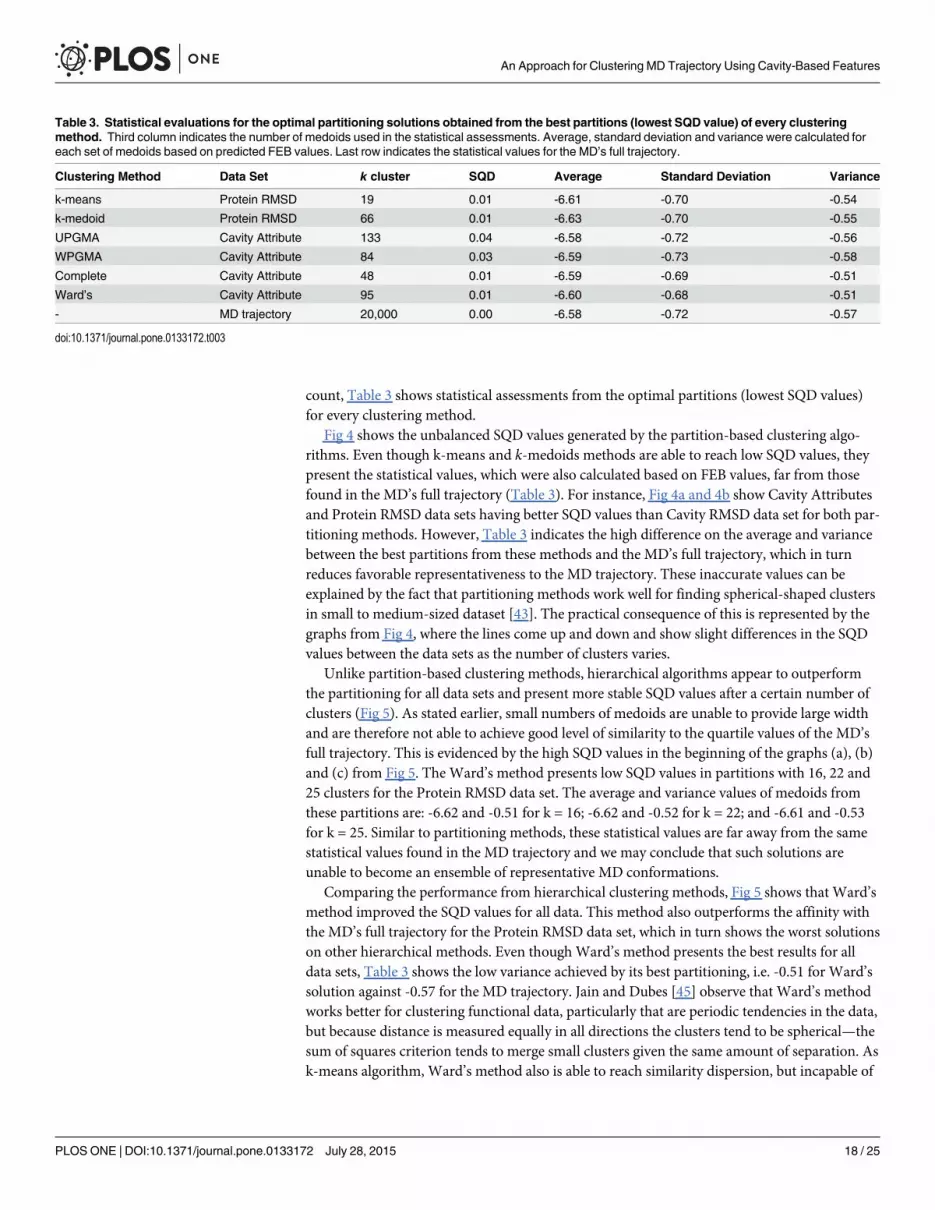
count, Table 3 shows statistical assessments from the optimal partitions (lowest SQD values)for every clustering method.
Fig 4 shows the unbalanced SQD values generated by the partition-based clustering algo-rithms. Even though k-means and k-medoids methods are able to reach low SQD values, theypresent the statistical values, which were also calculated based on FEB values, far from thosefound in the MD’s full trajectory (Table 3). For instance, Fig 4a and 4b show Cavity Attributesand Protein RMSD data sets having better SQD values than Cavity RMSD data set for both par-titioning methods. However, Table 3 indicates the high difference on the average and variancebetween the best partitions from these methods and the MD’s full trajectory, which in turnreduces favorable representativeness to the MD trajectory. These inaccurate values can beexplained by the fact that partitioning methods work well for finding spherical-shaped clustersin small to medium-sized dataset [43]. The practical consequence of this is represented by thegraphs from Fig 4, where the lines come up and down and show slight differences in the SQDvalues between the data sets as the number of clusters varies.
Unlike partition-based clustering methods, hierarchical algorithms appear to outperformthe partitioning for all data sets and present more stable SQD values after a certain number ofclusters (Fig 5). As stated earlier, small numbers of medoids are unable to provide large widthand are therefore not able to achieve good level of similarity to the quartile values of the MD’sfull trajectory. This is evidenced by the high SQD values in the beginning of the graphs (a), (b)and (c) from Fig 5. The Ward’s method presents low SQD values in partitions with 16, 22 and25 clusters for the Protein RMSD data set. The average and variance values of medoids fromthese partitions are: -6.62 and -0.51 for k = 16; -6.62 and -0.52 for k = 22; and -6.61 and -0.53for k = 25. Similar to partitioning methods, these statistical values are far away from the samestatistical values found in the MD trajectory and we may conclude that such solutions areunable to become an ensemble of representative MD conformations.
Comparing the performance from hierarchical clustering methods, Fig 5 shows that Ward’smethod improved the SQD values for all data. This method also outperforms the affinity withthe MD’s full trajectory for the Protein RMSD data set, which in turn shows the worst solutionson other hierarchical methods. Even thoughWard’s method presents the best results for alldata sets, Table 3 shows the low variance achieved by its best partitioning, i.e. -0.51 for Ward’ssolution against -0.57 for the MD trajectory. Jain and Dubes [45] observe that Ward’s methodworks better for clustering functional data, particularly that are periodic tendencies in the data,but because distance is measured equally in all directions the clusters tend to be spherical—thesum of squares criterion tends to merge small clusters given the same amount of separation. Ask-means algorithm, Ward’s method also is able to reach similarity dispersion, but incapable of
Table 3. Statistical evaluations for the optimal partitioning solutions obtained from the best partitions (lowest SQD value) of every clusteringmethod. Third column indicates the number of medoids used in the statistical assessments. Average, standard deviation and variance were calculated foreach set of medoids based on predicted FEB values. Last row indicates the statistical values for the MD’s full trajectory.
Clustering Method Data Set k cluster SQD Average Standard Deviation Variance
k-means Protein RMSD 19 0.01 -6.61 -0.70 -0.54
k-medoid Protein RMSD 66 0.01 -6.63 -0.70 -0.55
UPGMA Cavity Attribute 133 0.04 -6.58 -0.72 -0.56
WPGMA Cavity Attribute 84 0.03 -6.59 -0.73 -0.58
Complete Cavity Attribute 48 0.01 -6.59 -0.69 -0.51
Ward’s Cavity Attribute 95 0.01 -6.60 -0.68 -0.51
- MD trajectory 20,000 0.00 -6.58 -0.72 -0.57
doi:10.1371/journal.pone.0133172.t003
An Approach for Clustering MD Trajectory Using Cavity-Based Features
PLOS ONE | DOI:10.1371/journal.pone.0133172 July 28, 2015 18 / 25
achieving the similar central tendency undertakes for the entire ensemble of MDconformations.
As expected, the partitions from Cavity Attributes data set appear to accurately determinecrucial changes that occur in the substrate-binding cavity of the MD conformations understudy. Fig 5 evidences this statement by drawing the Cavity Attributes analyses (blue lines)with lower SQD values and Table 3 indicates the statistical significance for the hierarchicalmethods regarding to the FEB values. Even though Fig 5 indicates that UPGMA, WPGMA andComplete algorithms are well suited for clustering Cavity Attributes and Cavity RMSD datasets, it does not mean that both data sets have the best representativeness for the MD trajectorysince the smallest SQD values are reached by the Cavity Attributes data set only. It means thatthe black points, which denotes the best solutions, are in the blue line and far from the CavityRMSD data set line.
The representative ensemble of MD receptor conformationsOne of the major challenges to perform virtual screening experiments on FFR models is toassess to what extent the MD sampling can cover all or most of the binding cavity conforma-tions realized in nature [9, 52]. According to Zhang et al. [33], we should take as many struc-tures as possible to find the most representative conformations. By contrast, Landon et al. [13]showed that a small number of representative conformations could support the developmentof high-affinity inhibitors capable of binding hot spot regions. Although previous studiesapply different techniques to determine an optimal number of representative MD conforma-tions, we validate our solution by examining the level of coverage from the entire MD ensem-ble based on the results obtained from the cross docking experiments—as we intend to distillcrucial changes that occurs within the substrate-binding cavity of the MD trajectories. Forthat, we statistically evaluated the optimal partitioning solution by accessing the binding cav-ity of representative MD conformations (medoids) generated by six different clusteringmethods.
As previously stated, hierarchical clustering methods outperform the clustering solutionsfor the Cavity Attributes data set, showing statistical values similar to the 20 ns InhA MD tra-jectory and lowest SQD values. Latter reason is determinant to decide which solution repre-sents the original MD trajectory more accurately. Table 3 shows that Complete and Ward’smethods have the best SQD value for Cavity Attributes data set (SQD = 0.01). Completemethod has the average and standard deviation slightly nearest to the MD’s full trajectory andits best solution encloses less medoids than Ward’s method. Bearing this in mind, we definedthat the partitioning with 48 clusters from Complete method, that corresponds to 0.01 SQDvalue, is the optimal solution for representing the MD trajectory under study.
We generated the boxplot graph to compare the data distribution between the optimal parti-tion solution and the MD’s full trajectory based on predicted FEB values from cross-dockingexperiments. Fig 6 represents the conformations range from the first quartile to the third quar-tile with the median FEB values denoted by the black line across the central box region. Thebottom and top whiskers each extend an additional 1.5 times the distance from the median tothe first and third quartiles, but they are truncated to the minimum and maximum data values,respectively [53]. The coverage comparison between the representative ensembles produced byCavity Attributes, Cavity RMSD and Protein RMSD data set and the MD’s full trajectory forthe 20 ligands analyzed is depicted in Fig 6.
As can be seen from Fig 6, the boxplots from Cavity Attributes report dispersions and cen-tral tendencies noticeably more similar to the entire MD ensemble than the other two data sets(Cavity RMSD and Protein RMSD). It can therefore be assumed that the representative
An Approach for Clustering MD Trajectory Using Cavity-Based Features
PLOS ONE | DOI:10.1371/journal.pone.0133172 July 28, 2015 19 / 25
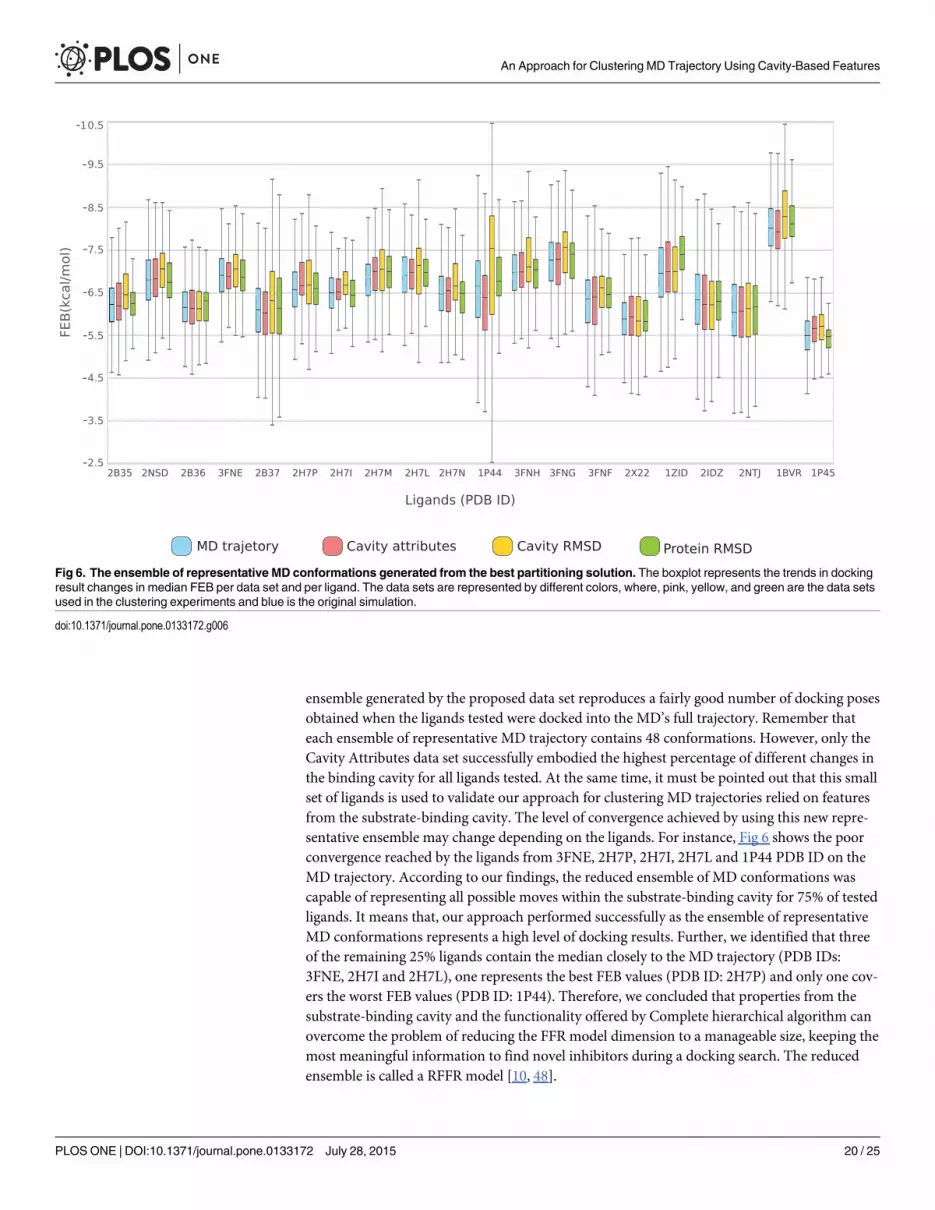
ensemble generated by the proposed data set reproduces a fairly good number of docking posesobtained when the ligands tested were docked into the MD’s full trajectory. Remember thateach ensemble of representative MD trajectory contains 48 conformations. However, only theCavity Attributes data set successfully embodied the highest percentage of different changes inthe binding cavity for all ligands tested. At the same time, it must be pointed out that this smallset of ligands is used to validate our approach for clustering MD trajectories relied on featuresfrom the substrate-binding cavity. The level of convergence achieved by using this new repre-sentative ensemble may change depending on the ligands. For instance, Fig 6 shows the poorconvergence reached by the ligands from 3FNE, 2H7P, 2H7I, 2H7L and 1P44 PDB ID on theMD trajectory. According to our findings, the reduced ensemble of MD conformations wascapable of representing all possible moves within the substrate-binding cavity for 75% of testedligands. It means that, our approach performed successfully as the ensemble of representativeMD conformations represents a high level of docking results. Further, we identified that threeof the remaining 25% ligands contain the median closely to the MD trajectory (PDB IDs:3FNE, 2H7I and 2H7L), one represents the best FEB values (PDB ID: 2H7P) and only one cov-ers the worst FEB values (PDB ID: 1P44). Therefore, we concluded that properties from thesubstrate-binding cavity and the functionality offered by Complete hierarchical algorithm canovercome the problem of reducing the FFR model dimension to a manageable size, keeping themost meaningful information to find novel inhibitors during a docking search. The reducedensemble is called a RFFR model [10, 48].
Fig 6. The ensemble of representative MD conformations generated from the best partitioning solution. The boxplot represents the trends in dockingresult changes in median FEB per data set and per ligand. The data sets are represented by different colors, where, pink, yellow, and green are the data setsused in the clustering experiments and blue is the original simulation.
doi:10.1371/journal.pone.0133172.g006
An Approach for Clustering MD Trajectory Using Cavity-Based Features
PLOS ONE | DOI:10.1371/journal.pone.0133172 July 28, 2015 20 / 25
DiscussionWe have presented a strategy to generate ensembles of representative MD conformations thatare more sensitive to changes in the substrate-binding cavity properties than the widely usedRMSD approaches. This strategy uses two partitioning clustering methods (k-means and k-medoids) and four agglomerative hierarchical clustering methods (complete linkage, UPGMA,WPGMA andWard’s). We use them in order to compare and analyze the quality of partition-ing outcomes between the binding cavity data set that we are proposing and two different datasets composed by pairwise RMSD distances. To provide the optimal ensemble of representativeMD conformations, we obtained the FEB values from docking experiments with 20 knowninhibitors of the InhA enzyme by which we identified optimal partitions by statistical assess-ments and calculated their percentage of similarity with the original MD trajectory.
The results for hierarchical algorithms highlighted their main advantages, i.e. they are moreversatile and embed flexibility regarding seeking a proper level of granularity. Comparing theperformance from clustering methods, Fig 5 shows that UPGMA, WPGMA and Complete aregood methods for clustering kinds of data sets similar to Cavity Attributes and Cavity RMSDwhile Ward’s methods can be considered a good solution for all data set. However, the abilityof Ward’s in grouping objects that are as homogeneous as possible ended in partitions withcentral tendencies considerably far from that found in the MD’s full trajectory. Further, thehigh cohesion in the clusters generated from UPGMA andWPGMAmethods were unable toreach low SQD values and number of clusters. Complete method looks for maximum distanceto merge a new object in a cluster and therefore it becomes more susceptible to noise and outli-ers. Remember that the first 500 conformations from the MD trajectory were eliminated asthey constitute the equilibration phase. For this reason Complete method shows the lowestSQD values and number of clusters for the Cavity Attributes. Hence, we conclude that due tothe farthest neighbor method the representative ensemble of MD conformations is composedby medoids belonging to compact clusters of approximately equal diameters.
The complexity of clustering algorithms is strongly related to the number n of data objectsand the number k of clusters [54, 55]. From all experiments, CLARA was the algorithm thatrequired the longest execution time, considering an experiment when the number of partitionsstarts from 2 until 200. The time noticeably increased since the size of the sample grows pro-portionally to the number of clusters. It happens on the account of k-medoids is more robustin the presence of noise and outliers. The complexity to compute and select a new medoidfrom representative objects by PAM algorithm is O(k(n-k)2). Algorithms from hierarchicalagglomerative methods are in second position. They are expensive in terms of their computa-tional and storage requirements [42]. Agglomerative methods compute the proximity matrixthat needs O(n2) time to store and keep track of the clusters. The total time required for thesealgorithms is O(n2 ×logg n) where logn is the additional complexity of keeping data in a sortedlist. In contrast to the hierarchical algorithms that have the quadratic asymptotic running timewith respect to the number of objects, k-means produces a number of partitions for every k in alinear time complexity with respect to any aspect of the problem size [54]. The complexity ofk-means algorithm is O(nkh), where the number of clusters (k) and the number of interactions(h) are usually less than the number of objects (n).
Several works explore the relative accuracy of various clustering algorithms in extracting theright number of clusters from generated data [43]. According to Hartigan et al. [18], we cannotpoint the best clustering method since different approaches are right for different purposes.Chen and Lonardi [15] say that the more popular methods for clustering MD conformationsare agglomerative hierarchical clustering since its linkage method is able to use the attributesfor describing the chemical structures. More specifically, linkage is the only method able to
An Approach for Clustering MD Trajectory Using Cavity-Based Features
PLOS ONE | DOI:10.1371/journal.pone.0133172 July 28, 2015 21 / 25
calculate the dissimilarities between two clusters of chemical structures using Euclidean dis-tance. Alternatively, Shao et al. [16] found that UPGMA, k-means, and SOM outperformedCOBWEB, Bayesian, and other hierarchical clustering methods by using the pairwise RMSDdistance as measure of similarity. Although our analyses also show hierarchical agglomerativemethods as the best choices for all data sets, the k-means and k-medoids algorithms appear asthe worst choice for all data sets. Each study has its own way to generate data and to identifythe best clustering algorithm and, therefore, comes with its own advantages and drawbacks.Indeed, an appropriate solution depends on a given analysis or application scenario, so datacollection, data representation, and interpreting the clusters found are crucial for selecting aclustering strategy [45, 55].
ConclusionsThe work we present here analyzes and combines clustering partitions using three differentdata sets in order to reduce the structural redundancy in a 20 ns MD trajectory of a target pro-tein receptor. Previous studies tackled this computational issue using only the RMSD measureof similarity [13, 16, 17]. The present study, in addition to investigating RMSD-based cluster-ing, also provides a novel measure of similarity, which is based on features from the substrate-binding cavity (pairwise RMSD, volume and number of heavy atoms). It addresses the highcomputational cost involved in using MD ensembles for performing virtual screening of largelibraries. We learned that the use of binding cavity properties for clustering MD trajectory is anefficient method to distill significant conformational flexibility within the receptor binding cav-ity. The chosen properties also outperformed other RMSD measures of similarity. This meth-odology can be extended to other proteins/receptor, as long as the binding pocket from theFFR model is known in advance. Further applications may include the investigation of ensem-bles of MD conformations from other target receptor enzymes, as well as with longer MD sim-ulation trajectories. Future directions involve the extension of this approach to the explorationof virtual libraries of compounds where the ensemble of representative MD conformations,shaped by properties of the substrate-binding cavity, can be investigated more effectively.
Supporting InformationS1 Dataset. Protein RMSD data set.(XLS)
S2 Dataset. Cavity RMSD data set.(XLS)
S3 Dataset. Cavity Attributes data set.(XLS)
S1 Fig. Analysis of substrate-binding cavity volumes along 20 ns MD simulation trajectoryobtained from CASTp. In red the substrate-binding cavity average volume at 1,236.9 Å3. Thehigher (yellow line) and lower (green line) volumes of this binding cavity achieved from crystalstructures were taken at 2,032.8 Å3 (PDB ID: 4OXN) and 445.1 Å3 (PDB ID: 2B37), respec-tively.(PNG)
S1 Table. SQD values from Cavity Attributes data set by partitioning and clusteringmethod used.(DOCX)
An Approach for Clustering MD Trajectory Using Cavity-Based Features
PLOS ONE | DOI:10.1371/journal.pone.0133172 July 28, 2015 22 / 25
S2 Table. SQD values from Cavity RMSD data set by partitioning and clustering methodused.(DOCX)
S3 Table. SQD values from Protein RMSD data set by partitioning and clustering methodused.(DOCX)
AcknowledgmentsThis work was supported in part by grants from: Hewlett Packard—PROFACC: RDP; Founda-tion for Research Support of the State of Rio Grande do Sul (FAPERGS)—website: http://www.fapergs.rs.gov.br/: DDAR and CVQ; National Council for Scientific and Technological Devel-opment (CNPQ)—website: http://www.cnpq.br/: ONS. The funders had no role in studydesign, data collection and analysis, decision to publish, or preparation of the manuscript.
Author ContributionsConceived and designed the experiments: RDP CVQ DDAR ONS. Performed the experiments:RDP CVQ. Analyzed the data: RDP CVQ DDAR ONS. Contributed reagents/materials/analy-sis tools: RDP CVQ DDAR ONS. Wrote the paper: RDP CVQ. Revised the manuscript: DDARONS.
References1. Karplus M, McCammon JA. Molecular dynamics simulations of biomolecules. Nat Struct Biol. 2002; 9:
646–652. PMID: 12198485
2. Durrant JD, McCammon JA. Molecular dynamics simulations and drug discovery. BMC Biol. 2011; 9:71. doi: 10.1186/1741-7007-9-71 PMID: 22035460
3. Alonso H, Bliznyuk AA, Gready JE. Combining docking and molecular dynamic simulations in drugdesign. Med Res Rev. 2006; 26: 531–568. PMID: 16758486
4. Machado KS, Winck AT, Ruiz DD, Norberto de Souza O. Mining flexible-receptor docking experimentsto select promising protein receptor snapshots. BMCGenomics. 2010; 11: 1–10.
5. Seiler KP, George GA, HappMP, BodycombeNE, Carrinski HA, Norton S, et al. ChemBank: a small-molecule screening and cheminformatics resource database. Nucleic Acids Res. 2008; 36: D351–D359.PMID: 17947324
6. Chen JH, Linstead E, Swamidass SJ, Wang D, Baldi P. ChemDB update—full-text search and virtualchemical space. Bioinformatics. 2007; 23: 2348–2351. PMID: 17599932
7. Irwin JJ, Sterling T, Mysinger MM, Bolstad ES, Coleman RG. ZINC: a free tool to discover chemistry forbiology. J Chem Inf Model. 2012; 52: 1757–1768. doi: 10.1021/ci3001277 PMID: 22587354
8. Ruddigkeit L, van Deursen R, Blum LC, Reymond JL. Enumeration of 166 billion organic small mole-cules in the chemical universe database GDB-17. J Chem Inf Model. 2012; 52: 2864–2875. doi: 10.1021/ci300415d PMID: 23088335
9. Amaro RE, Li WW. Emerging methods for ensemble-based virtual screening. Curr Top Med Chem.2010; 10: 2–13.
10. Quevedo CV, De Paris R, Ruiz DD, Norberto de Souza O. A strategic solution to optimize moleculardocking simulations using fully-flexible receptor models. Expert Syst Appl. 2014; 41: 7608–7620.
11. Li Y. Bayesian model based clustering analysis: application to a molecular dynamics trajectory of theHIV-1 integrase catalytic core. J Chem Inf Model. 2006; 46: 1742–1750. PMID: 16859306
12. Phillips JL, Colvin ME, Newsam S. Validating clustering of molecular dynamics simulations using poly-mer models. BMC Bioinformatics. 2011; 12: 445–468. doi: 10.1186/1471-2105-12-445 PMID:22082218
13. Landon MR, Amaro RE, Baron R, Ngan CH, Ozonoff D, McCammon JA, et al. Novel druggable hotspots in avian influenza neuraminidase h5n1 revealed by computational solvent mapping of a reducedand representative receptor ensemble. Chem Biol Drug Des. 2008; 71: 106–116. doi: 10.1111/j.1747-0285.2007.00614.x PMID: 18205727
An Approach for Clustering MD Trajectory Using Cavity-Based Features
PLOS ONE | DOI:10.1371/journal.pone.0133172 July 28, 2015 23 / 25
14. Deng J, Lee KW, Sanchez T, Cui M, Neamati N, Briggs JM. Dynamic receptor-based pharmacophoremodel development and its application in designing novel hiv-1 integrase inhibitors. J Med Chem.2005; 48: 1496–1505. PMID: 15743192
15. Chen JY, Lonardi S. Biological data mining. 1 st ed. CRC Press; 1992
16. Shao J, Tanner SW, Thompson N, Cheatham TE. Clusteringmolecular dynamics trajectories: 1.charac-terizing the performance of different clustering algorithms. J ChemTheory Comput. 2007; 3: 2312–2334.
17. Torda AE, van GunsterenWF. Algorithms for clustering molecular dynamics configurations. J ComputChem. 1994; 15: 1331–1340.
18. Hartigan JA, Wong MA. A k-means clustering algorithm. J R Stat Soc Ser C Appl Stat. 1979; 28:100–108.
19. Troyer JM, Cohen FE. Protein conformational landscapes: energy minimization and clustering of a longmolecular dynamics trajectory. Proteins: Struct, Funct, Bioinf. 1995; 23: 97–110.
20. Davies DL, Bouldin DW. A cluster separation measure. IEEE Trans Pattern Anal Mach Intell. 1997;PAMI-1: 224–227.
21. Calinski T, Harabasz J. A dendrite method for cluster analysis. Commun Stat A-Theor. 1974; 3: 1–27.
22. Lyman E, Zuckerman DM. Ensemble-based convergence analysis of biomolecular trajectories. Bio-phys J. 2006; 91: 164–172. PMID: 16617086
23. Morris GM, Huey R, LindstromW, Sanner MF, Belew RK, Goodsel DS, et al. AutoDock4 and AutoDock-Tools4: Automated docking with selective receptor flexibility. J Comput Chem. 2009; 30: 2785–2791.doi: 10.1002/jcc.21256 PMID: 19399780
24. MacQueen J. Somemethods for classification and analysis of multivariate observations. In: Proceed-ings of the fifth Berkeley symposium on mathematical statistics and probability. University of CaliforniaPress; 1967. pp. 281–297.
25. Kaufman L, Rousseeuw PJ. Finding Groups in Data: An Introduction to Cluster Analysis. 1st ed. JohnWilley & Sons; 1990.
26. Dessen A, Quemard A, Blanchard JS, JacobsWR, Sacchettini JC. Crystal structure and function of theisoniazid target ofMycobacterium tuberculosis. Science. 1995; 267:1638–1641.
27. Gargano F, Costa AL, Norberto de Souza O. Effect of temperature on enzyme structure and function: amolecular dynamics simulation study. Annals of the 3rd International Conference of the Brazilian Asso-ciation for Bioinformatics and Computational Biology. 2007. São Paulo, Brazil.
28. Case AC, Darden T, Cheatham TE III, Simmerling C, Wang J, Duke RE, et al. AMBER 9, University ofCalifornia, 2009; San Francisco, CA.
29. Hornak V, Abel R, Okur A, Strockbine B, Roitberg A, Simmerling C. Comparison of multiple amberforce fields and development of improved protein backbone parameters. Proteins: Struct, Funct, Bioinf.2006; 65: 712–725.
30. van GunsterenWF, Berendsen HJ. Computer simulation of molecular dynamics: Methodology, applica-tions, and perspectives in chemistry. Angew Chem Int Ed Engl. 1990; 29: 992–1023.
31. Ryde U. Molecular dynamic simulations of alcohol dehydrogenase with a four- or five-coordinate cata-lytic zinc ion. Proteins. 1995; 21: 40–56. PMID: 7716168
32. Bayly CI, Cielplak P, Cornell WD, Kollman PA. A well-behaved electrostatic potential based methodusing charge restraints for deriving atomic charges—the RESPmodel. J Phys Chem. 1993; 97:10269–10280.
33. Zhang Y, Skolnick J. Spicker: A clustering approach to identify near-native protein folds. J ComputChem. 2004; 25: 865–871. PMID: 15011258
34. Liu ZP, Wu LY, Wang Y, Zhang XS. Protein cavity clustering based on community structure of pocketsimilarity network. Int J Bioinform Res Appl. 2008; 4: 445–460. PMID: 19008186
35. Rozwarski DA, Vilchèze C, Sugantino M, Bittman R, Sacchettini JC. Crystal structure of the Mycobacte-rium tuberculosis enoyl-ACP reductase, InhA, in complex with NAD+ and a C16 fatty acyl substrate. JBiol Chem. 1999; 274: 15582–15589. PMID: 10336454
36. Case DA, Babin V, Berryman JT, Betz RM, Cai Q, Cerutti DS, et al. AMBER 14. University of California.2014; San Francisco, CA.
37. Binkowski TA, Naghibzadeh S, Liang J. CASTp: computed atlas of surface topography of proteins.Nucleic Acids Res. 2006; 31: 3352–3355.
38. Edelsbrunner H, Mücke EP. Three-dimensional alpha shapes. ACM Trans Graph. 1994; 13: 43–72.
39. Richards FM. Areas, volumes, packing and protein structure. Annu Rev Biophys Bio. 1977; 6:151–176.
40. Connolly ML. Analytical molecular surface calculation. J Appl Crystallogr. 1983; 16: 548–558.
An Approach for Clustering MD Trajectory Using Cavity-Based Features
PLOS ONE | DOI:10.1371/journal.pone.0133172 July 28, 2015 24 / 25
41. Team RC R: A language and environment for statistical computing. R Foundation for Statistical Com-puting, Vienna, Austria, 2012. Technical report.
42. Tan PN, Steinbach M, Kumar V. Introduction to Data Mining. Addison-Wesley; 2006
43. Han J, Kamber M, Pei J. Data Mining Concepts and Techniques. Morgan Kaufmann; 2006.
44. Everitt B, Landau S, Leese M. Cluster analysis. 4th ed. Wiley Pblishing; 2009.
45. Jain AK, Dubes RC. Algorithms for clustering data. 1st ed. Prentice HallCollege Div; 1988.
46. Berman HM, Westbrook J, Feng Z, Gilliland G, Bhat TN, Weissing H, et al. The protein data bank.Nucleic Acids Res. 2000; 28: 235–242. PMID: 10592235
47. Pauli I, Santos RN, Rostirolla DC, Martinelli LK, Ducati RG, Timmers LFSM, et al. Discovery of NewInhibitors of Mycobacterium tuberculosis InhA Enzyme Using Virtual Screening and a 3D-Pharmaco-phore-Based Approach. J Chem Inf Model. 2013, 53: 2390–2401. doi: 10.1021/ci400202t PMID:23889525
48. De Paris R, Frantz FA, Norberto de Souza O, Ruiz DD. wFReDoW: a cloud-based web environment tohandle molecular docking simulations of a fully flexible receptor model. BioMed Res. 2013; 2013:1–12.
49. Zhong S, Chen X, Zhu X, Dziegielewska B, Bachman KE, Ellenberger T, et al. Identification and valida-tion of human dna ligase inhibitors using computer-aided drug design. J Med Chem. 2008; 51:4553–4562. doi: 10.1021/jm8001668 PMID: 18630893
50. Cheng LS, Amaro RE, Xu D, Li WW, Arzberger PW, McCammon JA. Ensemble-based virtual screeningreveals potential novel antiviral compounds for avian influenza neuraminidase. J Med Chem. 2008; 51:3878–3894. doi: 10.1021/jm8001197 PMID: 18558668
51. Gohlke H, Hendlich M, Klebe G. Knowledge-based scoring function to predict protein-ligand interac-tions. J Mol Biol. 2000; 295: 337–356. PMID: 10623530
52. Totrov M, Abagyan R. Flexible ligand docking to multiple receptor conformations: a practical alternative.Curr Opin Struct Biol. 2008; 18: 178–184. doi: 10.1016/j.sbi.2008.01.004 PMID: 18302984
53. Doane DP, Seward LE. Applied statistics in business and economics. 4th ed. USA: McGrawHill;2012.
54. Wu X, Kumar V, Quinlan JR, Ghosh J, Yang Q, Motoda H, et al. Top 10 algorithms in data mining.Knowl Inf Syst. 2008; 14: 1–37.
55. Hruschka ER, Campello RJGB, Freitas AA, De Carvalho APLF. A survey of evolutionary algorithms forclustering. IEEE Trans Sys Man Cybern Part C: Appl and Rev. 2009; 39: 133–155.
An Approach for Clustering MD Trajectory Using Cavity-Based Features
PLOS ONE | DOI:10.1371/journal.pone.0133172 July 28, 2015 25 / 25