An analytical solution for the coupled heat and mass transfer during the freezing of high-water...
13
An analytical solution for the coupled heat and mass transfer during the freezing of high-water content materials Mariela C. Olguı ´n a , Viviana O. Salvadori b,c , Rodolfo H. Mascheroni b,c , Domingo A. Tarzia d,e, * a Depto. Matema ´ tica, Fac. de Ciencias Exactas, Ingenierı ´a y Agrimensura, UNR, Rosario, Argentina b CIDCA, Fac. de Ciencias Exactas, UNLP, CONICET, La Plata, Argentina c MODIAL, Depto. Ing. Quı ´mica, Fac. de Ingenierı ´a, UNLP, La Plata, Argentina d Depto. Matema ´ tica, Fac. Ciencias Empresariales, Universidad Austral, Paraguay 1950, S2000FZF Rosario, Argentina e Consejo Nacional de Investigaciones Cientı ´ficas y Te ´cnicas, CONICET, Argentina Received 28 May 2007; received in revised form 25 January 2008 Available online 24 April 2008 Abstract The coupled problem of heat and mass transfer during the solidification of high-water content materials like soils, foods, tissues and phase-change materials is developed. Assuming quasi-steady heat conduction in the frozen region, the system leads to a set of coupled ordinary differential equations. The model takes into account the influence of material characteristics and process variables on the advance of the freezing and sublimation fronts, temperature and water vapour profiles and weight loss. It was validated against the ana- lytical solution of the freezing (without surface ice sublimation) of a semi-infinite medium and was extensively used to perform a para- metric study. Ó 2008 Elsevier Ltd. All rights reserved. 1. Introduction Ice sublimation takes place from the surface of high- water content systems like moist soils, aqueous solutions, vegetable or animal tissues and foods that freeze uncovered or without an impervious and tight packaging material. The rate of both phenomena (solidification and sublima- tion) is determined both by material characteristics (mainly composition, structure, shape and size) and cooling condi- tions (temperature, humidity and rate of the media that surrounds the phase change material). The sublimation process, in spite of its magnitude being much less than that of freezing process, determines fundamental features of the final quality for foods and influences on the structure and utility of frozen tissues. Modelling of these simultaneous processes is very diffi- cult owed to the coupling of the heat and mass transfer bal- ances, the existence of two moving phase-change fronts that advance with very different rates and to the involved physical properties which are, in most cases, variable with temperature and water content. The process with only-solidification (with no sublima- tion) has been extensively studied [1–3]. A large bibliogra- phy on free and moving boundary problems for the heat diffusion equation is given by Tarzia [4]. The system has been modelled both by analytical procedures [2,5], and with numeric methods [1,2,6]. Due to the non-linearity of the problem, solutions usually involve mathematical diffi- culties and analytical methods can only be developed for idealized systems or for those with plain structure and con- stant properties. Numerical methods, instead, allow to con- sider the structural and compositional implicancies through detailed models [1,7], and to produce a data set of predicted data from which to develop approximate solu- tions which only enable to predict process times [1,8,9]. The 0017-9310/$ - see front matter Ó 2008 Elsevier Ltd. All rights reserved. doi:10.1016/j.ijheatmasstransfer.2008.01.031 * Corresponding author. Address: Depto. Matema ´tica, Fac. Ciencias Empresariales, Universidad Austral, Paraguay 1950, S2000FZF Rosario, Argentina. Tel.: +54 341 522 3093; fax: +54 341 522 3001. E-mail address: [email protected] (D.A. Tarzia). www.elsevier.com/locate/ijhmt Available online at www.sciencedirect.com International Journal of Heat and Mass Transfer 51 (2008) 4379–4391
Transcript of An analytical solution for the coupled heat and mass transfer during the freezing of high-water...

Available online at www.sciencedirect.com
www.elsevier.com/locate/ijhmt
International Journal of Heat and Mass Transfer 51 (2008) 4379–4391
An analytical solution for the coupled heat and mass transfer duringthe freezing of high-water content materials
Mariela C. Olguın a, Viviana O. Salvadori b,c,Rodolfo H. Mascheroni b,c, Domingo A. Tarzia d,e,*
a Depto. Matematica, Fac. de Ciencias Exactas, Ingenierıa y Agrimensura, UNR, Rosario, Argentinab CIDCA, Fac. de Ciencias Exactas, UNLP, CONICET, La Plata, Argentina
c MODIAL, Depto. Ing. Quımica, Fac. de Ingenierıa, UNLP, La Plata, Argentinad Depto. Matematica, Fac. Ciencias Empresariales, Universidad Austral, Paraguay 1950, S2000FZF Rosario, Argentina
e Consejo Nacional de Investigaciones Cientıficas y Tecnicas, CONICET, Argentina
Received 28 May 2007; received in revised form 25 January 2008Available online 24 April 2008
Abstract
The coupled problem of heat and mass transfer during the solidification of high-water content materials like soils, foods, tissues andphase-change materials is developed. Assuming quasi-steady heat conduction in the frozen region, the system leads to a set of coupledordinary differential equations. The model takes into account the influence of material characteristics and process variables on theadvance of the freezing and sublimation fronts, temperature and water vapour profiles and weight loss. It was validated against the ana-lytical solution of the freezing (without surface ice sublimation) of a semi-infinite medium and was extensively used to perform a para-metric study.� 2008 Elsevier Ltd. All rights reserved.
1. Introduction
Ice sublimation takes place from the surface of high-water content systems like moist soils, aqueous solutions,vegetable or animal tissues and foods that freeze uncoveredor without an impervious and tight packaging material.The rate of both phenomena (solidification and sublima-tion) is determined both by material characteristics (mainlycomposition, structure, shape and size) and cooling condi-tions (temperature, humidity and rate of the media thatsurrounds the phase change material). The sublimationprocess, in spite of its magnitude being much less than thatof freezing process, determines fundamental features of thefinal quality for foods and influences on the structure andutility of frozen tissues.
0017-9310/$ - see front matter � 2008 Elsevier Ltd. All rights reserved.
doi:10.1016/j.ijheatmasstransfer.2008.01.031
* Corresponding author. Address: Depto. Matematica, Fac. CienciasEmpresariales, Universidad Austral, Paraguay 1950, S2000FZF Rosario,Argentina. Tel.: +54 341 522 3093; fax: +54 341 522 3001.
E-mail address: [email protected] (D.A. Tarzia).
Modelling of these simultaneous processes is very diffi-cult owed to the coupling of the heat and mass transfer bal-ances, the existence of two moving phase-change frontsthat advance with very different rates and to the involvedphysical properties which are, in most cases, variable withtemperature and water content.
The process with only-solidification (with no sublima-tion) has been extensively studied [1–3]. A large bibliogra-phy on free and moving boundary problems for the heatdiffusion equation is given by Tarzia [4]. The system hasbeen modelled both by analytical procedures [2,5], andwith numeric methods [1,2,6]. Due to the non-linearity ofthe problem, solutions usually involve mathematical diffi-culties and analytical methods can only be developed foridealized systems or for those with plain structure and con-stant properties. Numerical methods, instead, allow to con-sider the structural and compositional implicanciesthrough detailed models [1,7], and to produce a data setof predicted data from which to develop approximate solu-tions which only enable to predict process times [1,8,9]. The

Nomenclature
C mass concentration of water, kg/m3
Cp specific heat, J/(kg K)Def effective diffusion coefficient of water, m2/sh heat transfer coefficient, W/(m2 K)k thermal conductivity, W/(m K)Km mass transfer coefficient, m/sLs sublimation heat of water, J/kgLf solidification heat of water, J/kgm geometrical index (=0 for slabs, =1 for infinite
cylinders, =2 for spheres)mf frozen mass by unit volume, kg/m3
ms sublimated mass by unit volume, kg/m3
M molecular weight, kg/molRg universal gas constant, (=8.31 J/(mol K))s position of the moving front, mt time, s
T temperature, Kx spatial coordinate, m
Greek symbols
e porosityq density, kg/m3
Subscripts
a water vapor in the aird dehydrated phasef frozen phasei initial (unfrozen material)if initial freezingo sublimation front temperatures surrounding mediumva water vapour in air within the material
4380 M.C. Olguın et al. / International Journal of Heat and Mass Transfer 51 (2008) 4379–4391
process with only sublimation of the already-frozen systemhas been extensively studied for freeze-drying of food andpharmaceutical materials [10,11].
In the case of freezing with simultaneous ice sublima-tion, published developments are scarce and no analyticalsolution to the coupled problem has been developed. Icesublimation has been surveyed by several authors in differ-ent systems: in freeze-drying [10,12], in geomorphology [13]and in the case of frozen food products several experimen-tal studies have been published: weight losses of lamb [14],tylose and beef [15], potatoes [16] and meat products[17,18]. Additionally there are no experimental data ontemperature and concentration profiles during freezingwith simultaneous ice sublimation and on the rate of freez-ing and dehydration fronts.
On the other hand, theoretical models were proposed todescribe the heat and mass transfer in these processes but,in most of the published works, only semi-empiric ornumerical methods are used. Aguirre Puente and Sukhwal[19] presented a description of the heat and mass balancesto be solved; meanwhile Pham and Willix [14] suggested theuse of simple equations based on drying theory and on theuse of the psychometric chart to calculate weight loss.Campanone [20] and Campanone et al. [21] developed adetailed numerical model that allows to predict tempera-ture and composition profiles, as well as freezing timeand weight loss. Besides, approximate equations weredeveloped to predict freezing time and weight loss in foodfreezing with simultaneous surface dehydration [22,23].
Based on the abovementioned situation, the objectivesof this work were:
� To develop a physical model and to implement therelated quasi-analytical solution that enables us toaccount for the influence of material characteristicsand process variables on the advance of the freezing
and sublimation fronts, temperature and water vapourprofiles and weight loss during the freezing of high-water content materials.� To use the quasi-analytical solution to predict the influ-
ence of material characteristics and freezing conditionson the dependent variables (freezing and sublimationfronts position, weight loss and temperature and compo-sition profiles).
1.1. The physical problem
When high-water content materials like foods, tissues,gels, soils or water solutions of inorganic or organic sub-stances, held in open, permeable or untightly-sealed con-tainers are refrigerated to below their initial solidificationtemperature, two simultaneous physical phenomena takeplace:
� liquid water solidifies (freeze), and� surface ice sublimates.
The rate and extent of these transfers is determined bydifferent factors:
(a) Material characteristics as shape, size, compositionand structure. These last two determine the value ofthose physical properties relevant to heat and masstransfer: heat capacity, density, thermal conductivityand mass diffusivity. In a first instance, all of theseproperties depend on temperature and composition,and the last three of them also on material structure.
(b) Environmental characteristics: Temperature, humid-ity and rate of the refrigerating medium.
(c) Characteristics of the material–environment inter-phase: Mainly type, shape and material of containerand if this is permeable or not to water vapor, as well
M.C. Olguın et al. / International Journal of Heat and Mass Transfer 51 (2008) 4379–4391 4381
as its tightness to material surface (these characteris-tics influence on the resulting heat and mass transfercoefficients and on the ‘‘microclimate” that surroundsmaterial surface).
From a physical point of view, it is usual to considerthese materials as a combination of a solid matrix, an aque-ous phase and a gaseous phase (air and water vapour).
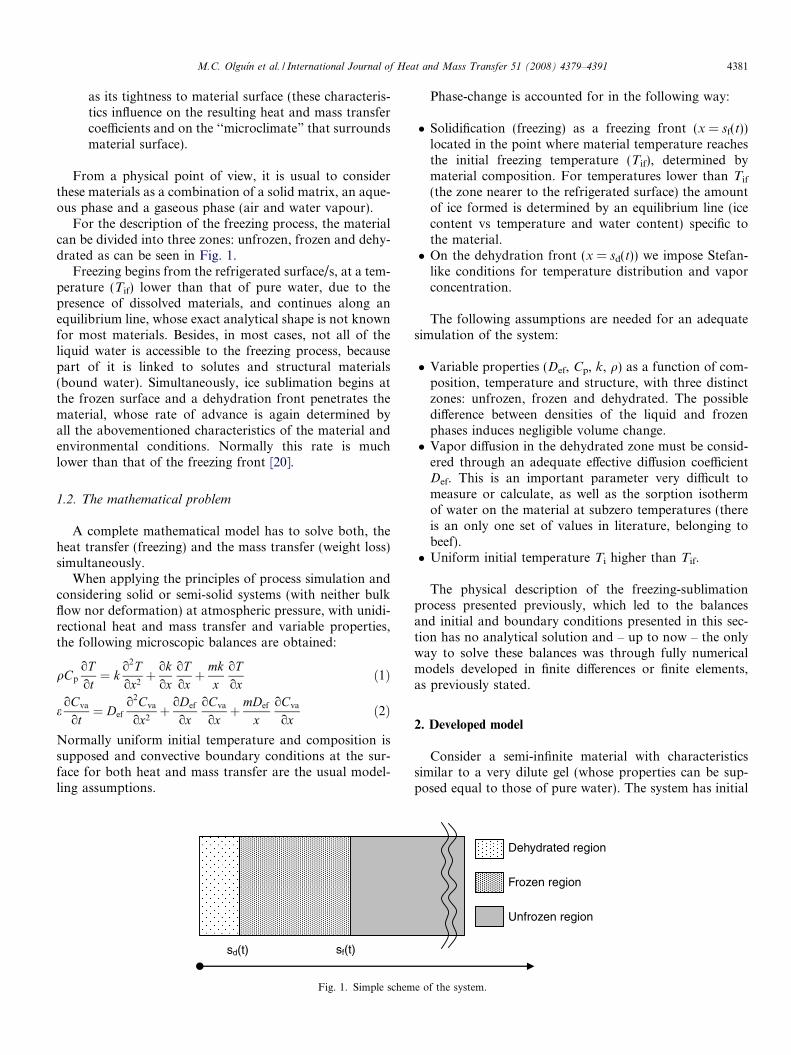
For the description of the freezing process, the materialcan be divided into three zones: unfrozen, frozen and dehy-drated as can be seen in Fig. 1.
Freezing begins from the refrigerated surface/s, at a tem-perature (Tif) lower than that of pure water, due to thepresence of dissolved materials, and continues along anequilibrium line, whose exact analytical shape is not knownfor most materials. Besides, in most cases, not all of theliquid water is accessible to the freezing process, becausepart of it is linked to solutes and structural materials(bound water). Simultaneously, ice sublimation begins atthe frozen surface and a dehydration front penetrates thematerial, whose rate of advance is again determined byall the abovementioned characteristics of the material andenvironmental conditions. Normally this rate is muchlower than that of the freezing front [20].
1.2. The mathematical problem
A complete mathematical model has to solve both, theheat transfer (freezing) and the mass transfer (weight loss)simultaneously.
When applying the principles of process simulation andconsidering solid or semi-solid systems (with neither bulkflow nor deformation) at atmospheric pressure, with unidi-rectional heat and mass transfer and variable properties,the following microscopic balances are obtained:
qCp
oTot¼ k
o2Tox2þ ok
oxoToxþ mk
xoTox
ð1Þ
eoCva
ot¼ Def
o2Cva
ox2þ oDef
oxoCva
oxþ mDef
xoCva
oxð2Þ
Normally uniform initial temperature and composition issupposed and convective boundary conditions at the sur-face for both heat and mass transfer are the usual model-ling assumptions.
sf(t)sd(t)
Fig. 1. Simple schem
Phase-change is accounted for in the following way:
� Solidification (freezing) as a freezing front (x = sf(t))located in the point where material temperature reachesthe initial freezing temperature (Tif), determined bymaterial composition. For temperatures lower than Tif
(the zone nearer to the refrigerated surface) the amountof ice formed is determined by an equilibrium line (icecontent vs temperature and water content) specific tothe material.� On the dehydration front (x = sd(t)) we impose Stefan-
like conditions for temperature distribution and vaporconcentration.
The following assumptions are needed for an adequatesimulation of the system:
� Variable properties (Def, Cp, k, q) as a function of com-position, temperature and structure, with three distinctzones: unfrozen, frozen and dehydrated. The possibledifference between densities of the liquid and frozenphases induces negligible volume change.� Vapor diffusion in the dehydrated zone must be consid-
ered through an adequate effective diffusion coefficientDef. This is an important parameter very difficult tomeasure or calculate, as well as the sorption isothermof water on the material at subzero temperatures (thereis an only one set of values in literature, belonging tobeef).� Uniform initial temperature Ti higher than Tif.
The physical description of the freezing-sublimationprocess presented previously, which led to the balancesand initial and boundary conditions presented in this sec-tion has no analytical solution and – up to now – the onlyway to solve these balances was through fully numericalmodels developed in finite differences or finite elements,as previously stated.
2. Developed model
Consider a semi-infinite material with characteristicssimilar to a very dilute gel (whose properties can be sup-posed equal to those of pure water). The system has initial
Dehydrated region
Frozen region
Unfrozen region
e of the system.

4382 M.C. Olguın et al. / International Journal of Heat and Mass Transfer 51 (2008) 4379–4391
uniform temperature equal to Tif and uncovered flat sur-face which at time t = 0 is exposed to the surrounding med-ium (with constant temperature Ts (lower than Tif) andheat and mass transfer coefficients h and Km). We assumethat Ts < T0(t) < Tif, t > 0 where T0(t) is the unknown sub-limation temperature.
The system behaviour is ruled by balances (1) and (2).To calculate the evolution of temperature and water con-tent in time, we will consider the following free boundaryproblem:
Find the temperatures Td = Td(x, t) and Tf = Tf(x, t), theconcentrations Cva = Cva(x, t), the free boundariessd = sd(t) and sf = sf(t) and the temperature T0 = T0(t) atthe sublimation front x = sd(t) which must satisfy thefollowing:
� Differential equations at the dehydrated region:
qdCpd
oT d
ot¼ kd
o2T d
ox2; 0 < x < sdðtÞ; t > 0 ð3Þ
eoCva
ot¼ Def
o2Cva
ox2; 0 < x < sd tð Þ; t > 0 ð4Þ
� Differential equations at the frozen region:
qfCpf
oT f
ot¼ kf
o2T f
ox2; sdðtÞ < x < sfðtÞ; t > 0 ð5Þ
Free boundary conditions at the sublimation frontx = sd(t):
T dðsdðtÞ; tÞ ¼ T fðsdðtÞ; tÞ ¼ T 0ðtÞ; t > 0 ð6Þ
kf
oT fðsdðtÞ; tÞox
� kd
oT dðsdðtÞ; tÞox
¼ Lsms _sdðtÞ; t > 0 ð7Þ
Def
oCvaðsdðtÞ; tÞox
¼ ms _sdðtÞ ð8Þ
CvaðsdðtÞ; tÞ ¼MP satðT ÞRgT 0ðtÞ
¼ Maexp b� c
T 0ðtÞ
� �RgT 0ðtÞ
ð9Þ
where Cva(sd(t), t) is the equilibrium vapor concentration atT0(t) and the saturation pressure Psat(T) is evaluatedaccording to [24].
� Free boundary conditions at the freezing front x = sf(t):
T fðsfðtÞ; tÞ ¼ T if ; t > 0 ð10Þ
kf
oT fðsfðtÞ; tÞox
¼ mfLf _sfðtÞ; t > 0 ð11Þ
� The convective boundary conditions at the fixed inter-phase x = 0:
kd
oT dð0; tÞox
¼ hðT dð0; tÞ � T sÞ; t > 0 ð12Þ
Def
oCvað0; tÞox
¼ KmðCvað0; tÞ � CaÞ; t > 0 ð13Þ
� The initial conditions at t = 0:
sfð0Þ ¼ sdð0Þ ¼ 0 ð14ÞT ¼ T if for x P 0 ð15Þ
We will solve the system (3)–(15) by using the quasi-steadymethod [2]. In general, it is a good approximation when theStefan number tends to zero, i.e. when the latent heat of thematerial is high with respect to the heat capacity of the so-lid material. This approximation has often been used whenmodelling the freezing of high-water content materials[2,25]. Therefore, the temperatures Tf, Td and the concen-tration Cva are given by the following expressions:
T dðx; tÞ ¼ AðtÞ þ BðtÞx; 0 < x < sdðtÞ; t > 0 ð16ÞCvaðx; tÞ ¼ DðtÞ þ EðtÞx; 0 < x < sdðtÞ; t > 0 ð17ÞT fðx; tÞ ¼ F ðtÞ þ GðtÞx; sdðtÞ < x < sfðtÞ; t > 0 ð18Þ
where A(t), B(t), D(t), E(t), F(t) and G(t) are unknownfunctions to be determined, as well as the free boundariessd (t) and sf(t) and the temperature T0(t). We have nine un-known functions and we must impose nine conditions (Eqs.(6)–(15)). By considering them we obtain the following sys-tem of differential algebraic equations:
kdBðtÞ ¼ hðAðtÞ � T sÞ ð19ÞDef EðtÞ ¼ KmðDðtÞ � CaÞ ð20ÞAðtÞ þ BðtÞsdðtÞ ¼ T 0ðtÞ ð21ÞF ðtÞ þ GðtÞsdðtÞ ¼ T 0ðtÞ ð22Þ
DðtÞ þ EðtÞsdðtÞ ¼ Maexp b� c
T 0ðtÞ
� �RgT 0ðtÞ
ð23Þ
F ðtÞ þ GðtÞsfðtÞ ¼ T if ð24ÞkfGðtÞ � kdBðtÞ ¼ Lsms _sdðtÞ ð25ÞDef EðtÞ ¼ ms _sdðtÞ ð26ÞkfGðtÞ ¼ mf Lf _sfðtÞ ð27Þ
By considering the first six equations of the previous systemwe can obtain, by direct replacement and rearrangement,A(t), B(t), D(t) and E(t) as a function of T0(t) and sd(t),as well as F(t) and G(t) as a function of T0(t), sd(t) andsf(t), given by the following expressions:
AðtÞ ¼T 0ðtÞ þ T s
hkd
sdðtÞ1þ h
kdsdðtÞ
ð28Þ
BðtÞ ¼ hkd
T 0ðtÞ � T s
1þ hkd
sdðtÞð29Þ
DðtÞ ¼Km
DefCasdðtÞ þMa
expðb� cT 0ðtÞÞ
RgT 0ðtÞ
1þ Km
DefsdðtÞ
ð30Þ
EðtÞ ¼ Km
Def
Maexp b� c
T 0ðtÞ
� �RgT 0ðtÞ
� Ca
1þ Km
DefsdðtÞ
ð31Þ
F ðtÞ ¼ T 0ðtÞsfðtÞ � T if sdðtÞsfðtÞ � sdðtÞ
ð32Þ
GðtÞ ¼ T if � T 0ðtÞsfðtÞ � sdðtÞ
ð33Þ
M.C. Olguın et al. / International Journal of Heat and Mass Transfer 51 (2008) 4379–4391 4383
By considering now the last three conditions of the system(28)–(33) and performing mathematical manipulations weobtain the following system of two ordinary differentialequations and one algebraic equation for sd(t), sf(t) andT0(t) given by:
1þ hkf
T s
T if
sfðtÞ þ hsdðtÞ1
kd
� T s
T if kf
� �� T 0ðtÞ
T if
1þ hkf
sfðtÞ þ hsdðtÞ1
kd
� 1
kf
� �� �
¼ LsKm
T if kf
1þ hkf
sfðtÞ� �
ðsfðtÞ � sdðtÞÞ1þ Km
DefsdðtÞ
Maexp b� c
T 0ðtÞ
� �RgT 0ðtÞ
� Ca
24
35 ð34Þ
_sdðtÞ ¼kfT if
msLs
1þ hkf
T s
T ifsfðtÞ þ hsdðtÞ 1
kd� T s
kf T if
� �� T 0ðtÞ
T if1þ h
kfsfðtÞ þ hsdðtÞ 1
kd� 1
kf
� �h i
1þ hkd
sfðtÞ� �
ðsfðtÞ � sdðtÞÞð35Þ
_sfðtÞ ¼kf T if
mf Lf
1� T oðtÞT if
sfðtÞ � sdðtÞð36Þ
sfð0Þ ¼ sdð0Þ ¼ 0 ð37Þ
The system (34)–(37) can be written in an equivalentform given by Eqs. (38)–(41) by defining the followingparameters:
d1 ¼mf Lf
kf T if
; d2 ¼ms
CaKm
; d3 ¼Lsms
hT if
;
d4 ¼Ma
CaRgT if
; d5 ¼mfLf
hT if
; d6 ¼T s
T if
T 0ðtÞ ¼ T if 1� d1ðsfðtÞ � sdðtÞÞ_sfðtÞ½ � ð38Þ
d2 1þ Km
Def
sdðtÞ� �
_sdðtÞ ¼ T ifd4
exp b� cT 0ðtÞ
� �T 0ðtÞ
� 1 ð39Þ
d5 1þ hkd
sdðtÞ þhkf
ðsfðtÞ � sdðtÞÞ� �
_sfðtÞ
¼ 1� d6 þ d3 1þ hkd
sdðtÞ� � T ifd4
exp b� cT 0ðtÞ
� �T 0ðtÞ
� 1
d2 1þ Km
DefsdðtÞ
� � ð40Þ
sdð0Þ ¼ sfð0Þ ¼ 0 ð41Þ
Moreover, functions F(t) and G(t) can be now rewritten asfollows:
F ðtÞ ¼ T 0ðtÞsfðtÞ � T if sdðtÞsfðtÞ � sdðtÞ
¼ T if ½1� d1sfðtÞ_sfðtÞ� ð42Þ
GðtÞ ¼ T if � T 0ðtÞsfðtÞ � sdðtÞ
¼ T ifd1 _sfðtÞ ð43Þ
and, therefore, the temperatures Td(x, t) and Tf(x, t) aregiven by the following expressions:
T dðx; tÞ ¼T 0ðtÞ 1þ h
kdx
� �þ T s
hkdðsdðtÞ � xÞ
1þ hkd
sdðtÞ;
0 < x < sdðtÞ; t > 0 ð44ÞT fðx; tÞ ¼ T if 1� d1 _sfðtÞðsfðtÞ � xÞ½ �;
sdðtÞ < x < sfðtÞ; t > 0 ð45Þ
and the concentration Cva(x, t) is given by:
Cvaðx; tÞ ¼Km
DefCaðsdðtÞ � xÞ þMa
exp b� cT 0ðtÞ
� �T 0ðtÞ
1þ Km
Defx
� �1þ Km
DefsdðtÞ
;
0 < x < sdðtÞ; t > 0 ð46Þ
Moreover, the temperature Td and the concentration Cva
at the fixed surface x = 0 are given by the followingexpressions:
T dð0; tÞ ¼ AðtÞ ¼T 0ðtÞ þ T s
hkd
sdðtÞ1þ h
kdsdðtÞ
ð47Þ
Cvað0; tÞ ¼ Cað1þ d2 _sdðtÞÞ ð48Þ
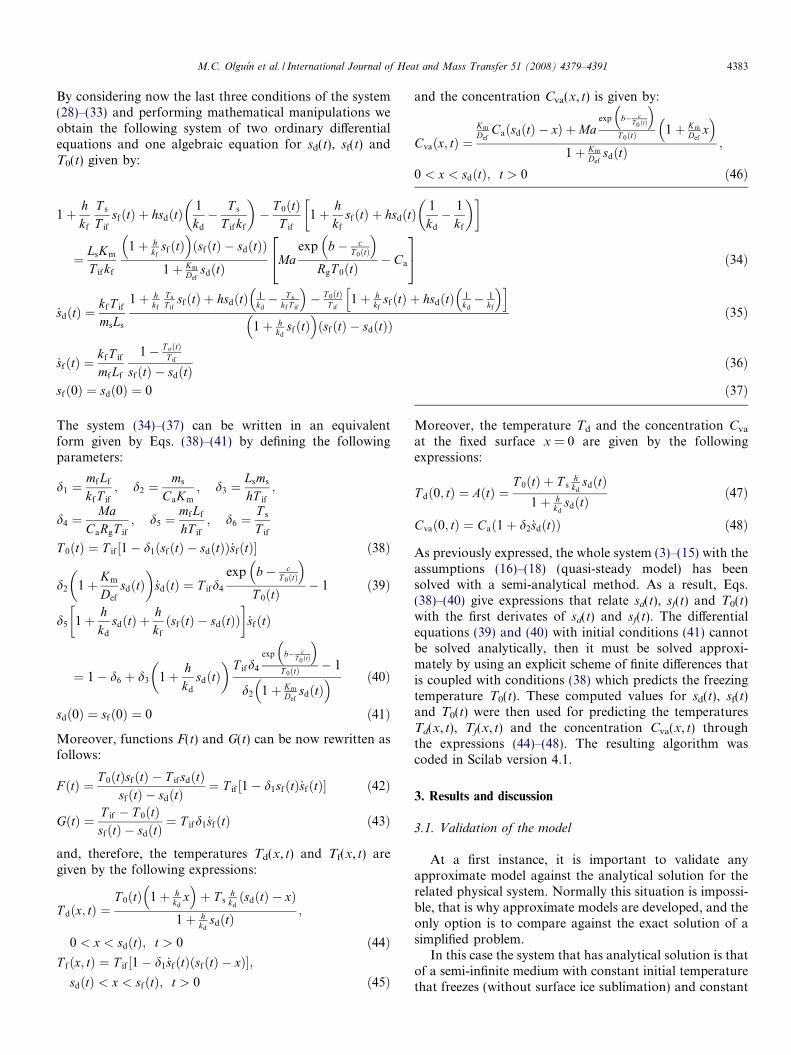
As previously expressed, the whole system (3)–(15) with theassumptions (16)–(18) (quasi-steady model) has beensolved with a semi-analytical method. As a result, Eqs.(38)–(40) give expressions that relate sd(t), sf(t) and T0(t)with the first derivates of sd(t) and sf(t). The differentialequations (39) and (40) with initial conditions (41) cannotbe solved analytically, then it must be solved approxi-mately by using an explicit scheme of finite differences thatis coupled with conditions (38) which predicts the freezingtemperature T0(t). These computed values for sd(t), sf(t)and T0(t) were then used for predicting the temperaturesTd(x, t), Tf(x, t) and the concentration Cva(x, t) throughthe expressions (44)–(48). The resulting algorithm wascoded in Scilab version 4.1.
3. Results and discussion
3.1. Validation of the model
At a first instance, it is important to validate anyapproximate model against the analytical solution for therelated physical system. Normally this situation is impossi-ble, that is why approximate models are developed, and theonly option is to compare against the exact solution of asimplified problem.
In this case the system that has analytical solution is thatof a semi-infinite medium with constant initial temperaturethat freezes (without surface ice sublimation) and constant
4384 M.C. Olguın et al. / International Journal of Heat and Mass Transfer 51 (2008) 4379–4391
surface temperature (very high heat transfer coefficient).This is called the Lame–Clapeyron–Stefan problem andits solution can be found elsewhere [2,26].
To this aim the prediction program was run with a veryhigh heat transfer coefficient h = 3000 W/(m2 K), with avery low mass transfer coefficient Km = 0.000001 m/sand Ts = 263 K, so as to secure getting almost instanta-neously a constant surface temperature and to make neg-ligible the contribution of the dehydrated zone. If theassumptions done during the development of this method
262
264
266
268
270
272
274
0 0.005 0.01 0.015 0
Posit
Tem
pera
ture
(K
)
time
Fig. 3. Temperature profile in the frozen zone. (—-)
0.0E+00
5.0E-03
1.0E-02
1.5E-02
2.0E-02
2.5E-02
3.0E-02
3.5E-02
0 1000 2000 3000 4000
Ti
Fre
ezin
g fr
ont (
m)
Fig. 2. Comparison of the freezing front position provided
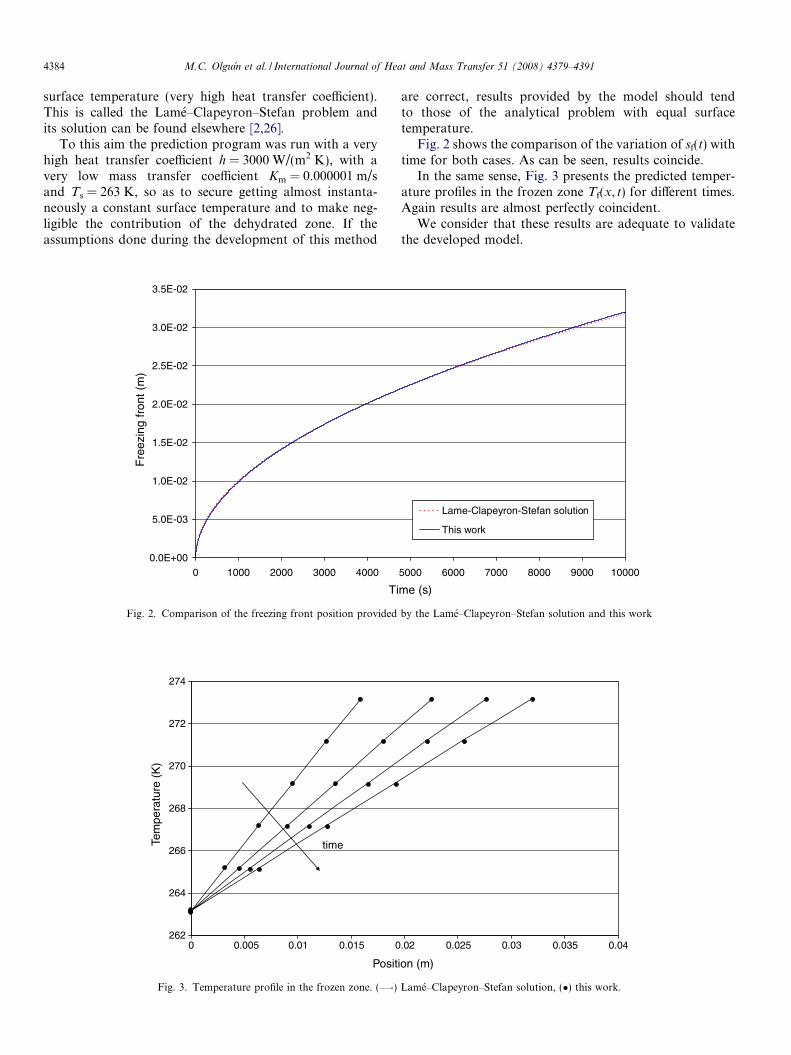
are correct, results provided by the model should tendto those of the analytical problem with equal surfacetemperature.
Fig. 2 shows the comparison of the variation of sf(t) withtime for both cases. As can be seen, results coincide.
In the same sense, Fig. 3 presents the predicted temper-ature profiles in the frozen zone Tf(x, t) for different times.Again results are almost perfectly coincident.
We consider that these results are adequate to validatethe developed model.
.02 0.025 0.03 0.035 0.04
ion (m)
Lame–Clapeyron–Stefan solution, (�) this work.
5000 6000 7000 8000 9000 10000
me (s)
Lame-Clapeyron-Stefan solution
This work
by the Lame–Clapeyron–Stefan solution and this work
M.C. Olguın et al. / International Journal of Heat and Mass Transfer 51 (2008) 4379–4391 4385
3.2. Use of the model
The developed model was extensively used to study theinfluence of system parameters and freezing conditions onthe characteristic dependent variables of the system:Tf(x, t), Td(x, t), sd(t), sf(t) and To(t).
Calculations were performed simulating the freezing of ahigh-water content solid material with physical and ther-mal properties of a very dilute agar–agar gel. So, for mostproperties, values of pure water or ice could be used. Forother properties, like those of the dehydrated phase, valuesfor freeze-dried materials were taken as a valid approach
Table 1Physical properties and other parameters
Physical properties Frozen
q (kg/m3) 1000Cp (J/(kg K)) 1900Def (m2/s) –k (W/(m K)) 1.7
Other parameters
e 0.98Ca (kg/m3) 8.29 �h (W/(m2 K)) 10–150Km (m/s) 0.0072–Lf (J/kg) 3.30 �Ls (J/kg) 2.83 �mf (kg/m3) 980ms (kg/m3) 980M (kg/mol) 0.018Parameters of Eq. (9) and subsequents a = 133Tif (K) 273.16Ts (K) 233–268
0.0E+00
1.0E-02
2.0E-02
3.0E-02
4.0E-02
5.0E-02
6.0E-02
0 1000 2000 3000 4000
Ti
Free
zing
fron
t (m
)
h=10h=25h=75h=100h=150
Fig. 4. Influence of the heat transfer coefficient in the freezing front e
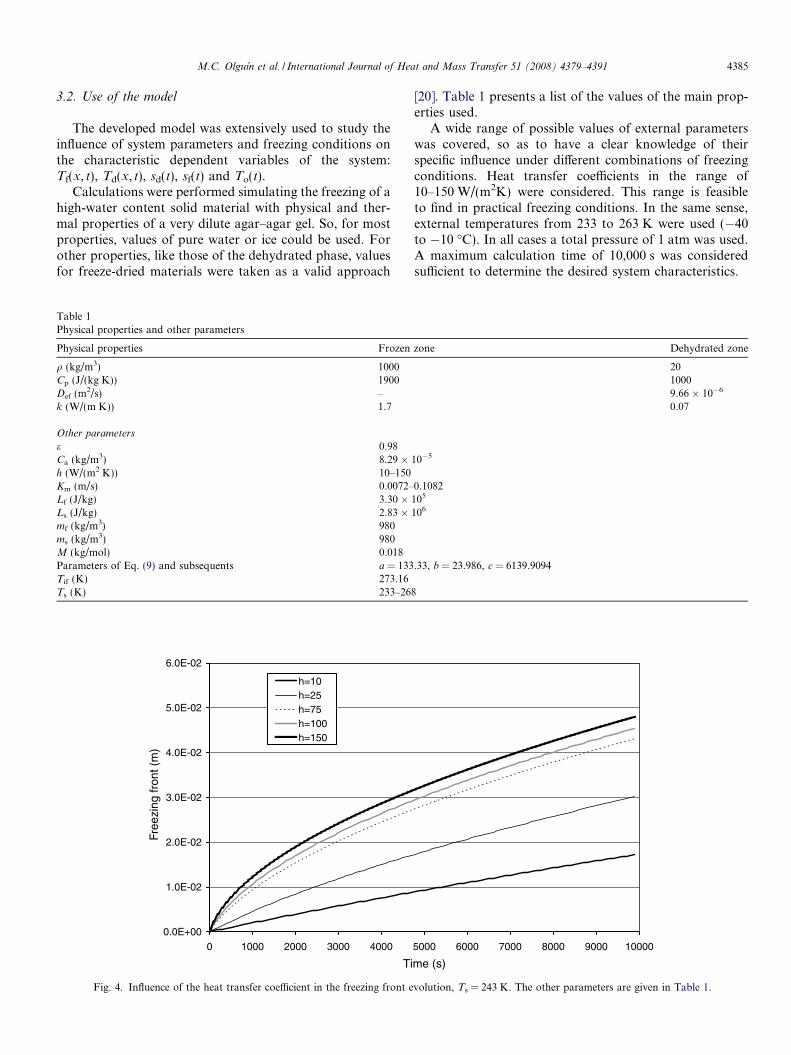
[20]. Table 1 presents a list of the values of the main prop-erties used.
A wide range of possible values of external parameterswas covered, so as to have a clear knowledge of theirspecific influence under different combinations of freezingconditions. Heat transfer coefficients in the range of10–150 W/(m2K) were considered. This range is feasibleto find in practical freezing conditions. In the same sense,external temperatures from 233 to 263 K were used (�40to �10 �C). In all cases a total pressure of 1 atm was used.A maximum calculation time of 10,000 s was consideredsufficient to determine the desired system characteristics.
zone Dehydrated zone
2010009.66 � 10�6
0.07
10�5
0.1082105
106
.33, b = 23.986, c = 6139.9094
5000 6000 7000 8000 9000 10000
me (s)
volution, Ts = 243 K. The other parameters are given in Table 1.
4386 M.C. Olguın et al. / International Journal of Heat and Mass Transfer 51 (2008) 4379–4391
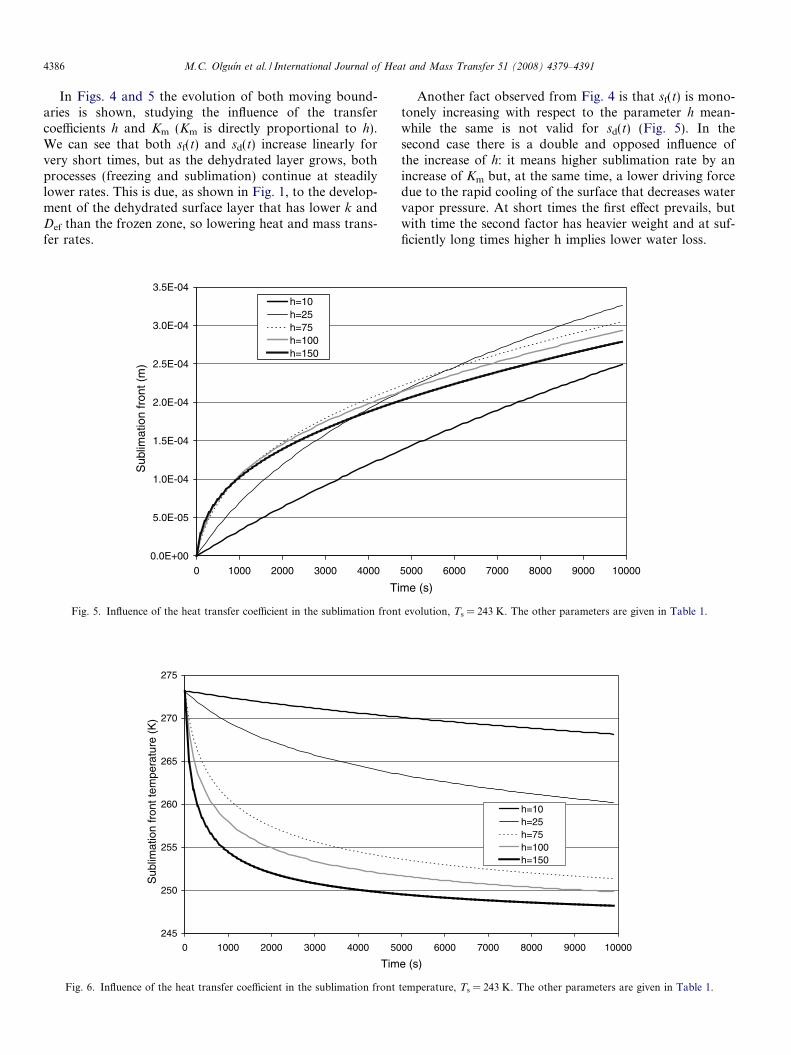
In Figs. 4 and 5 the evolution of both moving bound-aries is shown, studying the influence of the transfercoefficients h and Km (Km is directly proportional to h).We can see that both sf(t) and sd(t) increase linearly forvery short times, but as the dehydrated layer grows, bothprocesses (freezing and sublimation) continue at steadilylower rates. This is due, as shown in Fig. 1, to the develop-ment of the dehydrated surface layer that has lower k andDef than the frozen zone, so lowering heat and mass trans-fer rates.
245
250
255
260
265
270
275
0 1000 2000 3000 4000 50
Tim
Sub
limat
ion
fron
t tem
pera
ture
(K
)
Fig. 6. Influence of the heat transfer coefficient in the sublimation front
0.0E+00
5.0E-05
1.0E-04
1.5E-04
2.0E-04
2.5E-04
3.0E-04
3.5E-04
0 1000 2000 3000 4000
Ti
Sub
limat
ion
fron
t (m
)
h=10h=25h=75h=100h=150
Fig. 5. Influence of the heat transfer coefficient in the sublimation fron
Another fact observed from Fig. 4 is that sf(t) is mono-tonely increasing with respect to the parameter h mean-while the same is not valid for sd(t) (Fig. 5). In thesecond case there is a double and opposed influence ofthe increase of h: it means higher sublimation rate by anincrease of Km but, at the same time, a lower driving forcedue to the rapid cooling of the surface that decreases watervapor pressure. At short times the first effect prevails, butwith time the second factor has heavier weight and at suf-ficiently long times higher h implies lower water loss.
00 6000 7000 8000 9000 10000
e (s)
h=10h=25h=75h=100h=150
temperature, Ts = 243 K. The other parameters are given in Table 1.
5000 6000 7000 8000 9000 10000
me (s)
t evolution, Ts = 243 K. The other parameters are given in Table 1.

M.C. Olguın et al. / International Journal of Heat and Mass Transfer 51 (2008) 4379–4391 4387
Another characteristic of the influence of h is that ahigher h means lower sublimation front temperature To.The effect of the increase in h is more remarkable at lowvalues of this parameter, and tends to an asymptote forhigh-h values (Fig. 6).
When we consider Ts as parameter, we obtain that sf(t)is a monotonely decreasing and sd(t) is a monotonelyincreasing function of Ts (Figs. 7 and 8, respectively). Inthe case of sd(t), initially Ts has no traceable influence,
0.0E+00
5.0E-03
1.0E-02
1.5E-02
2.0E-02
2.5E-02
0 1000 2000 3000 4000
Ti
Fre
ezin
g fr
ont (
m)
Ts=233
Ts=243
Ts=253
Ts=263
Fig. 7. Influence of the surrounding temperature in the evolution of the free
0.0E+00
5.0E-05
1.0E-04
1.5E-04
2.0E-04
2.5E-04
3.0E-04
3.5E-04
0 1000 2000 3000 4000
Ti
Sub
limat
ion
fron
t (m
)
Ts=233
Ts=243
Ts=253
Ts=263
Fig. 8. Influence of the surrounding temperature in the evolution of the sublim
but at higher times there is a clear influence of external tem-perature on its value.
Besides, data given in Figs. 4–8 clearly show that forequal system characteristics and freezing conditions thevalue of sf(t) is – at least – two orders of magnitude higherthan that of sd(t) and that for any real system and normalfreezing times ice sublimation is constrained to a very thinsurface layer. For the examples given in this work the highestvalues of sd(t)attained after 10,000 s were less than 0.3 mm.
5000 6000 7000 8000 9000 10000
me (s)
zing front, h = 10 W/(m2K). The other parameters are given in Table 1.
5000 6000 7000 8000 9000 10000
me (s)
ation front, h = 10 W/(m2K). The other parameters are given in Table 1.

4388 M.C. Olguın et al. / International Journal of Heat and Mass Transfer 51 (2008) 4379–4391
Fig. 9 presents the influence of Ts on To. It shows that alower external temperature always means lower sublima-tion temperature and that its influence increases with time(higher separation between sublimation temperatures fordifferent external temperatures).
Moreover, in Fig. 10, we see the change in the tempera-ture profiles in the dehydrated and frozen zones with timefor a given value of parameters h and Ts. From the figure asharp profile is seen in the dehydrated zone and a moregradual – but always linear – variation in the frozen zone.
265
266
267
268
269
270
271
272
273
274
0 1000 2000 3000 4000 50
Tim
Sub
limat
ion
fron
t tem
pera
ture
(K
)
Ts=233
Ts=243
Ts=253
Ts=263
Fig. 9. Influence of the surrounding temperature in the sublimation
time
sf
time
sf
time
sf
240
245
250
255
260
265
270
275
0 0.01 0.02
Pos
Tem
pera
ture
(K
)
time
sf
Fig. 10. Temperature profiles, in dehydrated and frozen zones, and position oh = 75 W/(m2K), Ts = 243 K. The other parameters are given in Table 1.
Both profiles are each time less steep as moving boundariesadvance towards the interior of the system.
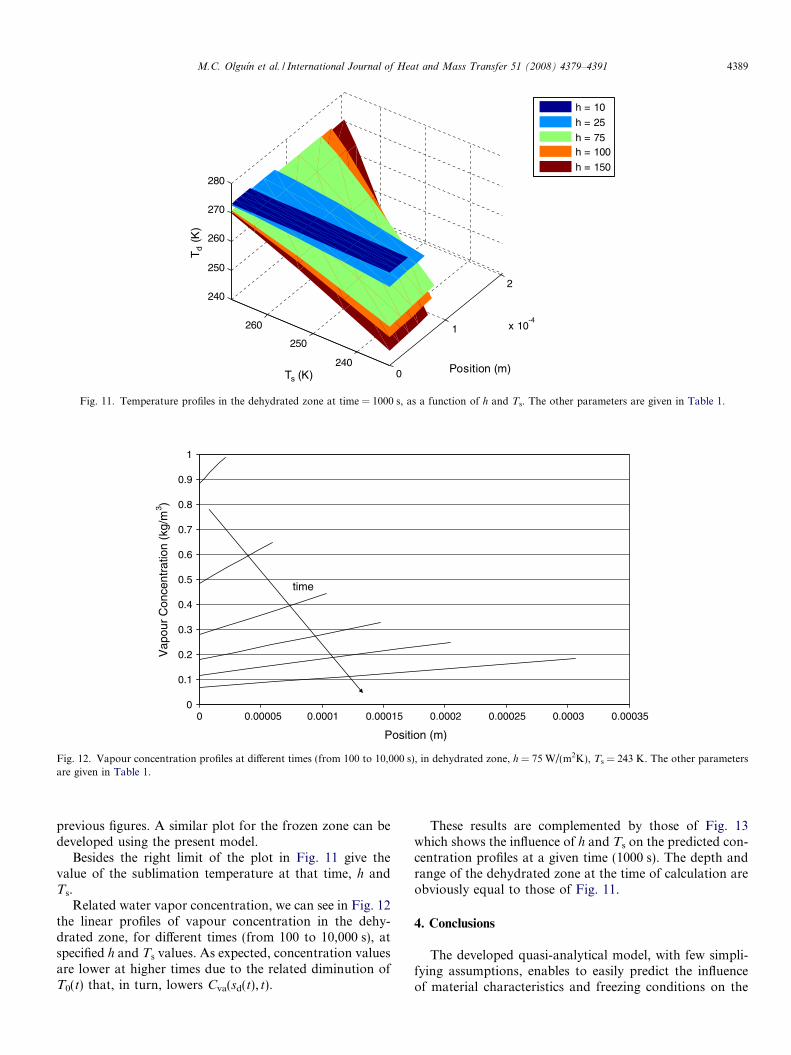
To get a better scope of temperature evolution, Fig. 11presents the influence of h and Ts on the predicted temper-ature profiles at a given time (1000 s) for the dehydratedzone. Plots have the expected trends with lower tempera-tures for higher h and lower Ts, and can be matched toget a complete temperature profile of the system. Plotshows the width and range of the dehydrated zone at thetime of calculation (1000 s) and is equivalent to those of
00 6000 7000 8000 9000 10000
e (s)
front temperature. The other parameters are given in Table 1.
2 4 5
2 5 0
2 5 5
2 6 0
2 6 5
2 7 0
2 7 5
0 0 .0 0 0 1 0 0 0
sd
2 4 5
2 5 0
2 5 5
2 6 0
6 5
2 7 0
2 7 5
0 0 .0 0 0 1 0 0 0 0
sd
0.03 0.04 0.05
ition (m)
2 4 5
2 5 0
2 5 5
2 0
6 5
2 7 0
2 7 5
0 0 . 0 0 1 0 0 0
sd
245
250
255
260
265
270
275
0 0.0003
sd
0.00020.0001
f freezing and sublimation fronts at different times (from 100 to 10,000 s),
0
1
2
x 10-4
240
250
260
240
250
260
270
280
Position (m)Ts (K)
Td (
K)
h = 10
h = 25
h = 75h = 100
h = 150
Fig. 11. Temperature profiles in the dehydrated zone at time = 1000 s, as a function of h and Ts. The other parameters are given in Table 1.
0
0.1
0.2
0.3
0.4
0.5
0.6
0.7
0.8
0.9
1
0 0.00005 0.0001 0.00015 0.0002 0.00025 0.0003 0.00035
Position (m)
Vap
our
Con
cent
ratio
n (k
g/m
3 )
time
Fig. 12. Vapour concentration profiles at different times (from 100 to 10,000 s), in dehydrated zone, h = 75 W/(m2K), Ts = 243 K. The other parametersare given in Table 1.
M.C. Olguın et al. / International Journal of Heat and Mass Transfer 51 (2008) 4379–4391 4389
previous figures. A similar plot for the frozen zone can bedeveloped using the present model.
Besides the right limit of the plot in Fig. 11 give thevalue of the sublimation temperature at that time, h andTs.
Related water vapor concentration, we can see in Fig. 12the linear profiles of vapour concentration in the dehy-drated zone, for different times (from 100 to 10,000 s), atspecified h and Ts values. As expected, concentration valuesare lower at higher times due to the related diminution ofT0(t) that, in turn, lowers Cva(sd(t), t).
These results are complemented by those of Fig. 13which shows the influence of h and Ts on the predicted con-centration profiles at a given time (1000 s). The depth andrange of the dehydrated zone at the time of calculation areobviously equal to those of Fig. 11.
4. Conclusions
The developed quasi-analytical model, with few simpli-fying assumptions, enables to easily predict the influenceof material characteristics and freezing conditions on the

0
1
2
x 10-4
240
250
260
0.2
0.4
0.6
0.8
1
1.2
1.4
Position (m)Temperature (K)
Vap
our
conc
entr
atio
n (k
g/m
3 )
h = 10
h = 25
h = 75h = 100
h = 150
Fig. 13. Vapour concentration profiles in the dehydrated zone at time = 1000 s, as a function of h and Ts. The other parameters are given in Table 1.
4390 M.C. Olguın et al. / International Journal of Heat and Mass Transfer 51 (2008) 4379–4391
evolution of both freezing and sublimation fronts, temper-ature in the frozen and dehydrated zones, temperature atthe sublimation front and vapour concentration in thedehydrated layer.
It can be used to optimize the freezing conditions of cer-tain types of materials as well as a base for the developmentof more detailed models that include a freezing range orinitial temperatures different from that of material freezing.
Acknowledgements
This paper has been partially sponsored by CONICETand project ANPCYT-PAV 120–00005 from Argentina.We also thank the anonymous two referees whose detailedcomments helped us to improve the content of the paper.
References
[1] A.C. Cleland (Ed.), Food Refrigeration Processes, Analysis, Designand Simulation, Elsevier, London, 1990, pp. 95–136.
[2] V.J. Lunardini (Ed.), Heat Transfer with Freezing and Thawing,Elsevier, London, 1991, pp. 1–167.
[3] A.V. Luikov, Systems of differential equations of heat and masstransfer in capillary porous bodies (review), Int. J. Heat MassTransfer 18 (1975) 1–14.
[4] D.A. Tarzia, A bibliography on moving-free boundary problems forthe heat diffusion equation. The Stefan and related problems, MAT –Serie A, # 2, Rosario, 2000, 297 pages. See <www.austral.edu.ar/MAT-SerieA/2>.
[5] E.A. Santillan Marcus, D.A. Tarzia, Explicit solution for freezing ofhumid porous half-space with heat flux condition, Int. J. Eng. Sci. 38(2000) 1651–1665.
[6] R.H. Mascheroni, A. Calvelo, Relationship between heat transferparameters and the characteristic damage variables for the freezing ofbeef, Meat Sci. 4 (1980) 267–285.
[7] A.E. Delgado, D.-W. Sun, Heat and mass transfer models forpredicting freezing processes review, J. Food Eng. 47 (2001) 157–174.
[8] R. Plank, Beitrage zur Berechnung und Bewertung der Gefriergesch-windigkeit von Lebensmitteln, Beiheft zur Zeitschrit fur die gesamteKalte-Industrie 3 (1941) 1–17.
[9] V.O. Salvadori, R.H. Mascheroni, Prediction of freezing and thawingtimes by means of a simplified analytical method, J. Food Eng. 13(1991) 67–78.
[10] J.D. Mellor (Ed.), Fundamentals of Freeze Drying, Academic Press,London, 1978, pp. 16–125.
[11] M. Farid, The moving boundary problems from melting and freezingto drying and frying of food, Chem. Eng. Process. 41 (2002) 1–10.
[12] M. Kochs, Ch. Korber, B. Nunner, I. Heschel, The influence of thefreezing process on vapour transport during sublimation in vacuum-freeze-drying, Int. J. Heat Mass Transfer 34 (1991) 2395–2408.
[13] J. Aguirre Puente, M. Fremond, G. Comini, Freezing of soils –physical study and mathematical models, Int. J. Refrig. 1 (1978) 99–106.
[14] Q.T. Pham, J. Willix, A model for food desiccation in frozen storage,J. Food Sci. 49 (1984) 1275–1281.
[15] R.N. Sukhwal, J. Aguirre Puente, Sublimation des milieux disperses.Considerations theoriques et experimentation, Rev. Gen. Therm. 262(1983) 663–673.
[16] G.P. Lambrinos, J. Aguirre Puente, Deshydratation des milieuxdisperses congeles. Influence des conditions d’entreposage sur lespertes de masse, in: Proceedings of the XVI International Congress ofRefrigeration, Paris, France, August 31–September 7, vol. 2, 1983,pp. 567–573.
[17] L.A. Campanone, L.A. Roche, V.O. Salvadori, R.H. Mascheroni,Monitoring of weight losses in meat products during freezing andfrozen storage, Food Sci. Technol. Int. 8 (2002) 229–238.
[18] L.A. Campanone, L.A. Roche, V.O. Salvadori, R.H. Mascheroni,Structural studies on unpackaged foods during their freezing andstorage, J. Food Sci. 71 (2006) E218–E226.
[19] J. Aguirre Puente, R.N. Sukhwal, Sublimation of ice in frozendispersed media, in: Proceedings of the Third International OffshoreMechanics and Arctic Engineering Symposium, New Orleans, USA,February 12–16, 1983, pp. 38–44.
[20] L.A. Campanone, Transferencia de calor en congelacion y almace-namiento de alimentos. Sublimacion de hielo, calidad, optimizacionde condiciones de proceso, Doctor in Engineering Thesis, UniversidadNacional de La Plata, Argentina, 2001.
[21] L.A. Campanone, V.O. Salvadori, R.H. Mascheroni, Weight lossduring freezing and storage of unpackaged foods, J. Food Eng. 47(2001) 69–79.
[22] L.A. Campanone, V.O. Salvadori, R.H. Mascheroni, Food freezingwith simultaneous surface dehydration. Approximate prediction offreezing time, Int. J. Heat Mass Transfer 48 (6) (2005) 1205–1213.

M.C. Olguın et al. / International Journal of Heat and Mass Transfer 51 (2008) 4379–4391 4391
[23] L.A. Campanone, V.O. Salvadori, R.H. Mascheroni, Food freezingwith simultaneous surface dehydration. Approximate prediction ofweight loss during freezing and storage, Int. J. Heat Mass Transfer 48(6) (2005) 1195–1204.
[24] O. Fennema, L.A. Berny, Equilibrium vapour pressure and wateractivity of food at subfreezing temperature, in: Proceedings of IV
International Congress of Food Science and Technology, vol. 2, 1974,pp. 27–35.
[25] A.L. London, R.A. Seban, Rate of ice formation, Trans. ASME 65(1943) 711–779.
[26] G. Lame, B.P. Clapeyron, Memoire sur la solidification par refroi-dissement d’un globe liquide, Annal. Chim. Phys. 47 (1831) 250–256.