A Mathematical Modeling of Freezing Process in the Batch ...
35
foods Article A Mathematical Modeling of Freezing Process in the Batch Production of Ice Cream Paolo Giudici 1 , Antonietta Baiano 2 , Paola Chiari 1 , Luciana De Vero 1 , Babak Ghanbarzadeh 3 and Pasquale Massimiliano Falcone 4, * Citation: Giudici, P.; Baiano, A.; Chiari, P.; De Vero, L.; Ghanbarzadeh, B.; Falcone, P.M. A Mathematical Modeling of Freezing Process in the Batch Production of Ice Cream. Foods 2021, 10, 334. https://doi.org/ 10.3390/foods10020334 Academic Editors: Epameinondas Xanthakis, Jesus Maria Frias and Alain Le-Bail Received: 3 November 2020 Accepted: 30 January 2021 Published: 4 February 2021 Publisher’s Note: MDPI stays neutral with regard to jurisdictional claims in published maps and institutional affil- iations. Copyright: © 2021 by the authors. Licensee MDPI, Basel, Switzerland. This article is an open access article distributed under the terms and conditions of the Creative Commons Attribution (CC BY) license (https:// creativecommons.org/licenses/by/ 4.0/). 1 Department of Life Sciences, University of Modena and Reggio Emilia, 42122 Reggio Emilia, Italy; [email protected] (P.G.); [email protected] (P.C.); [email protected] (L.D.V.) 2 Dipartimento di Scienze Agrarie, Alimenti, Risorse Naturali e Ingegneria, University of Foggia, 71122 Foggia, Italy; [email protected] 3 Department of Food Science and Technology, University of Tabriz, Tabriz 51666-16471, Iran; [email protected] 4 Department of Agricultural, Food and Environmental Sciences, Marche University Polytechnical, 60131 Ancona, Italy * Correspondence: [email protected]; Tel.: +39-071-220-4138 Abstract: This study deals with the mathematical modeling of crystallization kinetics occurring during batch production of the ice cream. The temperature decrease was recorded in-situ through a computerized wireless system. A robust pattern-recognition algorithm of the experimental cooling curves was developed to determine the initial freezing point. The theoretical freezing point was used to calibrate the whole time-temperature profile. Finally, a modified Gompertz’s function was used to describe the main steps of crystallization kinetics. Derivative analysis of the Gompertz’s function allowed to determine the time-temperature physical markers of dynamic nucleation, ice crystal growth and air whipping. Composition and freezing properties were used as input variables in multivariate analysis to classification purposes of the ice cream mixtures as a function of their ability to produce high-quality ice cream. The numerical analysis of the whole cooling curve was used to build predictive models of the ice cream quality indices. Keywords: Gompertz’s function; ice cream; initial freezing point; supercooling; time-temperature profile 1. Introduction Ice cream is the most widely consumed frozen dairy dessert, with a global market value of $68,072 million in 2016 [1] The meaning of the term “ice cream” varies from country to country, due to different regulations and traditions and, thus, covers a wide range of ingredients and composition, as well as product texture and manufacturing processes. In addition, in the last decades, there is an increasing interest to produce nourishing and healthy ice cream as novelty products by adding fruits, spices, protein-rich constituents, probiotics and prebiotics. Several studies were performed to develop new formulations, new structures and to add health properties to ice cream products, including, for instance, selected lactic acid bacteria with functional effects [2,3]. From a manufacturing point of view, ice cream can be categorized as industrial and artisanal ice cream as a function of the process technologies and production scale. The artisanal ice cream production involves the following operations: preparation of a liquid mixture generally containing ingredients such as milk fat, milk-solids-not-fat (the principal source of protein), sugars (or sweeteners), hydrocolloids (stabilizers and emulsifiers); aging of this mixture; simultaneous whipping and freezing under high-shear dynamic conditions; incorporation of flavoring ingredients to this partially frozen mixture; tempering, shaping and serving of the final product. In the case of the industrial production, another freezing step under static conditions is required after shaping. The first freezing step is carried out Foods 2021, 10, 334. https://doi.org/10.3390/foods10020334 https://www.mdpi.com/journal/foods
-
Upload
khangminh22 -
Category
Documents
-
view
0 -
download
0
Transcript of A Mathematical Modeling of Freezing Process in the Batch ...
foods
Article
A Mathematical Modeling of Freezing Process in the BatchProduction of Ice Cream
Paolo Giudici 1, Antonietta Baiano 2 , Paola Chiari 1, Luciana De Vero 1 , Babak Ghanbarzadeh 3
and Pasquale Massimiliano Falcone 4,*
Citation: Giudici, P.; Baiano, A.;
Chiari, P.; De Vero, L.; Ghanbarzadeh,
B.; Falcone, P.M. A Mathematical
Modeling of Freezing Process in the
Batch Production of Ice Cream. Foods
2021, 10, 334. https://doi.org/
10.3390/foods10020334
Academic Editors:
Epameinondas Xanthakis, Jesus
Maria Frias and Alain Le-Bail
Received: 3 November 2020
Accepted: 30 January 2021
Published: 4 February 2021
Publisher’s Note: MDPI stays neutral
with regard to jurisdictional claims in
published maps and institutional affil-
iations.
Copyright: © 2021 by the authors.
Licensee MDPI, Basel, Switzerland.
This article is an open access article
distributed under the terms and
conditions of the Creative Commons
Attribution (CC BY) license (https://
creativecommons.org/licenses/by/
4.0/).
1 Department of Life Sciences, University of Modena and Reggio Emilia, 42122 Reggio Emilia, Italy;[email protected] (P.G.); [email protected] (P.C.);[email protected] (L.D.V.)
2 Dipartimento di Scienze Agrarie, Alimenti, Risorse Naturali e Ingegneria, University of Foggia, 71122 Foggia,Italy; [email protected]
3 Department of Food Science and Technology, University of Tabriz, Tabriz 51666-16471, Iran;[email protected]
4 Department of Agricultural, Food and Environmental Sciences, Marche University Polytechnical,60131 Ancona, Italy
* Correspondence: [email protected]; Tel.: +39-071-220-4138
Abstract: This study deals with the mathematical modeling of crystallization kinetics occurringduring batch production of the ice cream. The temperature decrease was recorded in-situ through acomputerized wireless system. A robust pattern-recognition algorithm of the experimental coolingcurves was developed to determine the initial freezing point. The theoretical freezing point wasused to calibrate the whole time-temperature profile. Finally, a modified Gompertz’s function wasused to describe the main steps of crystallization kinetics. Derivative analysis of the Gompertz’sfunction allowed to determine the time-temperature physical markers of dynamic nucleation, icecrystal growth and air whipping. Composition and freezing properties were used as input variablesin multivariate analysis to classification purposes of the ice cream mixtures as a function of theirability to produce high-quality ice cream. The numerical analysis of the whole cooling curve wasused to build predictive models of the ice cream quality indices.
Keywords: Gompertz’s function; ice cream; initial freezing point; supercooling; time-temperature profile
1. Introduction
Ice cream is the most widely consumed frozen dairy dessert, with a global marketvalue of $68,072 million in 2016 [1] The meaning of the term “ice cream” varies from countryto country, due to different regulations and traditions and, thus, covers a wide range ofingredients and composition, as well as product texture and manufacturing processes. Inaddition, in the last decades, there is an increasing interest to produce nourishing andhealthy ice cream as novelty products by adding fruits, spices, protein-rich constituents,probiotics and prebiotics. Several studies were performed to develop new formulations,new structures and to add health properties to ice cream products, including, for instance,selected lactic acid bacteria with functional effects [2,3].
From a manufacturing point of view, ice cream can be categorized as industrial andartisanal ice cream as a function of the process technologies and production scale. Theartisanal ice cream production involves the following operations: preparation of a liquidmixture generally containing ingredients such as milk fat, milk-solids-not-fat (the principalsource of protein), sugars (or sweeteners), hydrocolloids (stabilizers and emulsifiers); agingof this mixture; simultaneous whipping and freezing under high-shear dynamic conditions;incorporation of flavoring ingredients to this partially frozen mixture; tempering, shapingand serving of the final product. In the case of the industrial production, another freezingstep under static conditions is required after shaping. The first freezing step is carried out
Foods 2021, 10, 334. https://doi.org/10.3390/foods10020334 https://www.mdpi.com/journal/foods
Foods 2021, 10, 334 2 of 35
using scraped-surface freezers, to decrease the mixture temperature below its freezing point(typically at −5 C) to obtain a soft, semi-frozen texture. In the artisanal process, scraped-surface freezers are batch plants able to incorporate air under atmospheric conditions(overrun below 40%). Instead, in the industrial process, scraped-surface freezers arecontinuous plants able to incorporate air under the pressure to reach an overrun of 100%.The second freezing step required in the industrial production is carried out using forced-air convection freezers to reduce the internal temperature to −25/−30 C (below its glasstransition) thus resulting in a harder texture and a longer shelf-life.
From the qualitative point of view, industrial and artisanal ice creams mainly differ forair content and texture properties [4]. The liquid mixtures used to produce the industrialice cream contain total solids up to 42% by weight and consist of milk fat, milk-solid-not-fat, sweeteners and hydrocolloids (stabilizers and emulsifiers) up to 18%, 8%, 17%, 0.5%by weight, respectively [5]. Their relatively high-fat and hydrocolloid contents togetherwith the low water content are required to decrease the interfacial properties of the liquidmixtures and, therefore, their ability to hold a higher amount of air in the final product.At serving temperatures, the industrial ice cream appears very stiff, icy and greatly stable.The ingredients traditionally used to produce artisanal ice creams (the Italian-style gelatois an example of this category) are represented by milk fat, milk-solid-not-fat, sweetenersand hydrocolloids up to 8%, 7.5%, 16%, 0.2% by weight, respectively, to reach a total solidcontent up to 32% by weight [5]. The artisanal ice cream is served at −13 C/−15 Cresulting in a scoopable and easy-to-melt texture.
Under a microstructural point of view, both industrial and artisanal ice creams can beconsidered three-phase colloidal systems consisting of ice crystals; unfrozen serum phase,that in turn contains clusters of partially crystalline and partially coalesced fat globules,all interacting with hydrocolloids to create a three-dimensional viscoelastic network; aircells, entrapped into the serum phase [6–10]. The two key operations concurring to thedevelopment of the ice cream microstructure are the aging of the starting liquid mixtureand the dynamic freezing performed under shear. Usually, the composition of the startingmixtures and the aging conditions are empirically selected to improve the final physicalproperties (which include colloidal/emulsion stability, density, viscosity, interfacial andsurface tension, specific heat and freezing point), the cooling behavior during the firstfreezing step (extent of supercooling, ice nucleation, ice growth/ripening and air whipping)and, finally, the microstructure of the final product. The aging is usually carried out at−4 C for a time ranging from 4 to 24 h. Under refrigerated aging, proteins increase theirhydration state and milk fat globules undergo nearly complete crystallizing with a ratethat depends on the type of fats and emulsifiers used. More specifically, the emulsifiersdisplace the hydrated proteins at the fat globule interface to provide significant increasesin viscosity. The sweeteners used in the formulation of the ice cream mixture play a majorrole in determining the initial freezing point [11].
Sensory quality and melting resistance are two key quality aspects of the ice creamand they are strictly dependent on what takes place in the barrel of the scraped-surfaceheat exchanger (SSHE) used to produce the ice cream, which is the place in which icenucleation starts. Many tiny ice crystal nuclei are formed, scraped and melt into the bulkof the ice cream mixture where the larger-size crystals grown. Once the product leaves theSSHE, no further nucleation takes place but the existing crystals grow with time and suchphenomenon is accelerated under temperature variation. Ice crystals larger than 40–50 µmresult in coarse or grainy texture if present in sufficient number. Both the rate and extentof water crystallization affect the amount and the size distribution of the ice crystals inthe ice cream. Water crystallization that takes place under dynamic conditions inside theSSHE is the main cause of the formation of a viscoelastic network inside the unfrozenphase, which in turn limits the ice crystal growth and the stable incorporation of air inthe final product. Water crystallization causes the increase of both solute concentrationand viscosity of the unfrozen phase remaining at the end of the cooling process. Instead,mechanical shearing causes structure transition from slurry ice cream mixture to soft-solid
Foods 2021, 10, 334 3 of 35
ice cream by promoting shear-induced destabilization of the milk fat globules and thestable incorporation of finely dispersed air cells (overrun). The increasing of the overallstiffness of the ice cream mixture during freezing is due to the intermolecular interactionsoccurring under high-shear rate among fats, proteins and hydrocolloids from colloidal tothe macroscopic scale.
Thus, the quantitative description of the water crystallization kinetics is of funda-mental importance to understand and manage the ice cream production but it is difficultto describe by mechanistic models. Currently, there are several gaps in both scientificand technical knowledges on the topic. From the scientific point of view, there is a gapbetween the theoretical knowledge based on the thermodynamics of water crystallization(well established within ideal liquid solutions for which both the Clausius-Clapeyron’sand Raoult’s laws can apply satisfactorily) and the knowledge about this phase transitionwithin heterogeneous and high-concentrated liquid systems, such as the ice cream formu-lations. The partial freezing of ice cream mixture occurring under dynamic conditionsinvolves complex thermodynamic and kinetic mechanisms such as heat and mass transfer,supercooling, heterogeneous nucleation, as well as changes in thermo physical properties,surface curvature effects and so forth. Furthermore, multiple re-crystallization/meltingand air incorporation must be considered. The equilibrium temperature at which thewater crystallization takes place in the ice cream mixtures strictly depends on the ability ofcolligative solutes to depress the freezing point. Initial freezing point and freezable waterfraction are the two parameters required to determine the temperature dependence of thefrozen water fraction. The importance of freezing point depression in the ice cream produc-tion has induced researchers to develop models based on mix composition. As recentlyreviewed [5], some empirical models available in literature are based on measurementsperformed on diluted mix and the results are extrapolated aiming to be applied on theundiluted system. Other models are based on the freezing point depression of pure sucrosesolutions and the estimated “sucrose equivalency” of various sweeteners and milk saltswith respect to sucrose. Under the industrial standpoint, batch ice cream production ischaracterized by a low level of innovation, mainly due to the low level of automatic tech-nologies available to control both the freezing and whipping operations. The mechanicalcharacteristics of the scraped-surface freezers, which include shape and number of scrapingblades and their rotational speed, also play a role in the structure formation, determiningthe spatial distribution of shear stress and freezing temperature inside the freezer barrel. Itis widely recognized that ice nucleation and ice growth occur at different rates as a functionof the axial and radial distance from freezing surface: ice nucleation quickly occurs onthe cold surface of the freezer, while ice growth occurs faster inside the bulk [12–16]. Inbatch production the final quality of the ice cream is usually obtained with low throughputand high variability. Concerning managing of freezing operation, the highest level ofcontrolling technology available among the commercial SSHE freezers used in batch icecream production is represented by programmable automatic shutoff systems based on therough ability to measure the desired stiffness in the final product. Stiffness is monitoredby registering the increasing percentage of dasher motor load during freezing: when itachieves the desired set point, then the refrigeration system is automatically shut off, whilethe scraping blades continue to whip the product. Stiffness is a coarse parameter able toinform the producer only about the overall resistance encountered by the rotating blades.Stiffness is a bulk rheological property: different average sizes and size distributions ofthe ice crystals as well as of the air cells can result in the same overall stiffness but indifferent final texture and melting resistance. The traditional approach to manage freezingoperations in batch ice cream production is based on the operator experience and in thetrial-and-error assessment for setting ice cream formulations and freezing time. The timeto shut off the refrigeration system is usually determined by the operator by drawing asmall portion of ice cream and checking temperature. When the ice cream is drawn fromthe freezer, it should be stiff enough to form a “ribbon”, yet soft enough to slowly settleinto the container and to lose its shape slowly.
Foods 2021, 10, 334 4 of 35
The technological aim of freezing in the SSHE is to obtain the rapid formation of smallice crystals and to develop the desired overrun. The drawing temperature of ice cream(−5 to −7 C) from the batch freezer is slightly higher than that used for continuous freezersand residence times in the freezer barrel are longer for batch processing (5–6 min). Thisresults in larger ice crystals. Furthermore, the overrun control in the batch freezer is difficultbecause the scraping blades continue to operate during unloading of the freezer and theair is present at atmospheric pressure. It is useful point out that subjective evaluation ofthe time to shut off the refrigeration system as determined by the operator may producehigh variability both in the size of the ice crystals and in the product yield (overrun).By prolonging the freezing time beyond the set point of desired stiffness, the amount ofthe incorporated air reaches a maximum and then decreases as a balance between therheological, interfacial properties and mechanical stress established inside the freezingmixture [9,10,17,18]; at the meantime, smaller crystals melt determining the increase ofthe bigger ones [5], because of the rising and lowering in temperature as electronicallymodulated to keep constant the desired stiffness in the ice cream mixture before the exitfrom the SSHE. For this reason, it is important to empty the freezer quickly. Shutting offthe refrigeration too soon can result in (i) extended whipping time with possible failure toobtain desired overrun, (ii) smoother texture provided the product does not have to warmexcessively to produce desired overrun and (iii) coarse texture if product warms excessivelyto produce desired overrun. Likewise, failure to turn off the refrigeration soon enoughcan result in (i) stiffer ice cream with a lower temperature, (ii) extended whipping time toobtain desired overrun and (iii) inability to remove the entire product from the barrel.
The above considerations highlight the need to identify, from one hand, the optimaltechnological properties of the starting ice cream mixture and from another hand, an objec-tive strategy to manage the freezing/whipping operations in batch ice cream production.Hard work is required to realize simultaneously the two key technological properties, thatis, the ability to entrap the finely dispersed air cells (referred as to ”whippability”) andthe ability to support fast crystallization of the water molecules aiming to obtain finelydispersed ice crystals. Both these properties depend on the composition of the startingformulations, characteristics of the freezer and desired quality of the ice cream. To optimizethe air incorporation and prevent the excessive growth of the ice crystals, an optimalcomposition of the starting liquid mixture must be considered a technological pre-requisitefor ice cream production. The present work provides a new strategy to evaluate in-situthe optimal technological properties under batch freezing conditions. In particular, thispaper suggests a suitable setup for in-bulk temperature measurement inside the barrel ofthe SSHE for batch production of ice cream and describes a numerical approach to analyzethe time-temperature history (i.e., the whole cooling curve) experienced by the ice creammixture, aiming to characterize the kinetics of water crystallization and air incorporation.The most significant kinetic properties were correlated to the overrun, melting and sensoryproperties providing predictive statistic models.
2. Materials and Methods
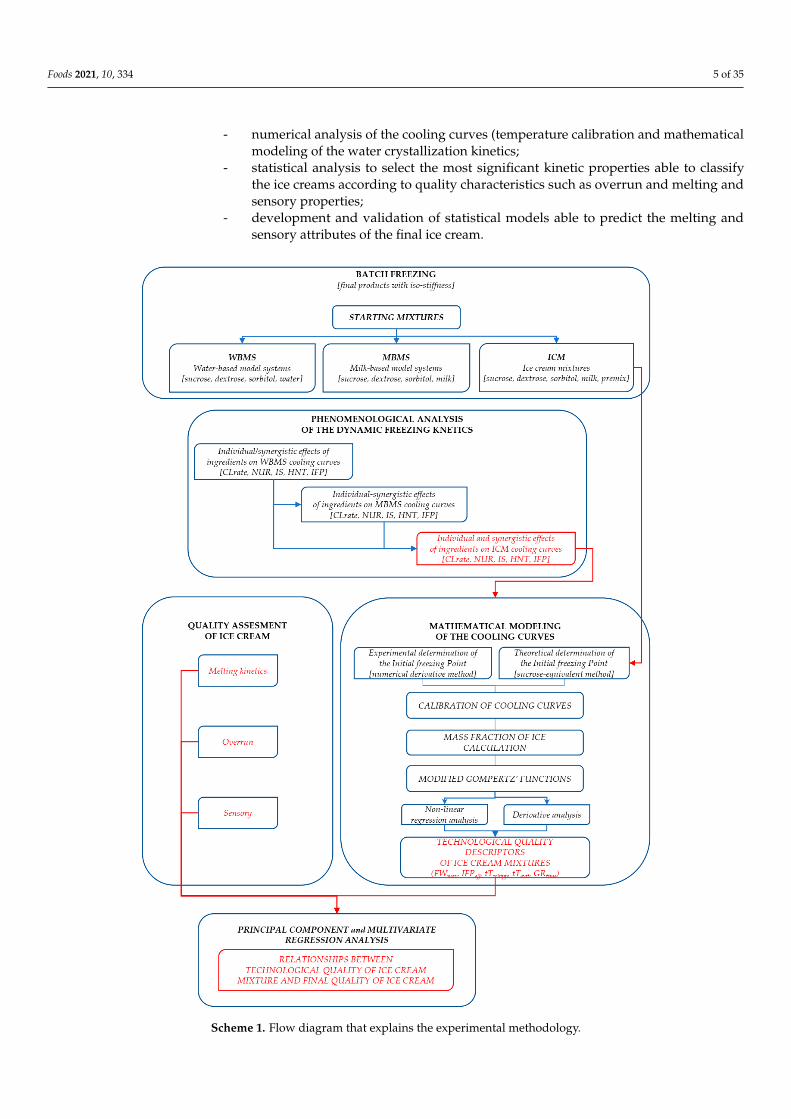
The experimental strategy is reported in general terms in the (Scheme 1) and includesthe following steps:
- preparation of mixtures characterized by different total solid contents and differentlevel of complexity (water-based model systems, milk-based model systems and realice cream mixtures);
- partial freezing of the starting mixtures inside a batch SSHE;- phenomenological analysis of the behavior of model systems and ice cream mixtures
in order to explore the effects on the solute-solvent interactions on the main freezingevents registered along the experimental cooling curve (it was necessary to simplifythe mathematical description of the water crystallization kinetics occurring under theSSHE conditions);
Foods 2021, 10, 334 5 of 35
- numerical analysis of the cooling curves (temperature calibration and mathematicalmodeling of the water crystallization kinetics;
- statistical analysis to select the most significant kinetic properties able to classifythe ice creams according to quality characteristics such as overrun and melting andsensory properties;
- development and validation of statistical models able to predict the melting andsensory attributes of the final ice cream.
Scheme 1. Flow diagram that explains the experimental methodology.

Foods 2021, 10, 334 6 of 35
Two sugars (sucrose and dextrose) and a polyol (sorbitol) of interest as sweeteners inthe ice cream production were selected for their different colligative properties to modulateboth the equilibrium temperature and the crystallization kinetic. The individual andsynergistic colligative effects of such sugars were firstly evaluated in the water- and milk-based solutions. Then, the information acquired with these trials were used to clarify thedynamic behavior of the investigated ice cream mixtures.
2.1. Sugar-Based Model Systems
Three water-based model systems, namely “WSUCR,” “WDEXT”; and “WSORB” wereproduced by adding 300 g of sucrose or dextrose or sorbitol to 1000 g of distilled water.
Similarly, three milk-based model solutions were prepared by replacing water withwhole milk. In the following they are referred as to “MSUCR,” “MDEXT,” “MSORB,”respectively.
Another more complex water-based model system, namely “WSUCR + WSORB, wasproduced by adding 150 g of sucrose and 150 g of sorbitol to 1000 g of distilled.
Similarly, a more complex milk-based model system, namely “MSUCR + MDEXTR,”was produced by adding 150 g of sucrose and 150 g of dextrose to 1000 g of whole milk.
All ingredients were purchased from REIRE s.r.l. (Reggio Emilia, Italy). About 10 Kg ofeach of the 5 solutions were prepared according to the following procedure. The ingredientswere blended under mechanical agitation carried out with a turbomixer (Robot Coupe-94305 Vincennes Cedex-France) for 1 min, then the solution was heated up to 88 C (thetemperature was reached in about 5 min) and finally cooled under 8 C (the temperaturewas reached in about 1.5 min).
Table 1 describes the precise formulation of the model systems.
Table 1. Weight (g) of the ingredients in the model system.
WSUCR WSUCR +WSORB WDEXTR WSORB MSUCR MSUCR +
MDEXTR MDEXTR MSORB
Added Sugars 300 300 300 300 300 300 300 300
Sucrose 300 150 0 0 300 150 0 0Dextrose 0 0 300 0 0 150 300 0Sorbitol 0 150 0 300 0 0 0 300
Water 1000 1000 1000 1000 0 0 0 0Whole Milk 0 0 0 0 1000 1000 1000 1000
Model system 1300 1300 1300 1300 1300 1300 1300 1300
In order to exactly quantify the initial water content and the colligative and not-colligative compounds derives from the ingredients used, the mass balances of all themodel systems were calculated and reported in (Table 2).
Table 2. Mass balance (g/100 g) of the model systems.
WSUCR WSUCR +WSORB WDEXTR WSORB MSUCR MSUCR +
MDEXTR MDEXTR MSORB
Sugars 22.97 22.94 21.69 22.96 26.62 25.98 25.35 26.61
Fats 0.00 0.00 0.00 0.00 1.19 1.19 1.19 1.19MSNF 0.00 0.00 0.00 0.00 2.56 2.55 2.55 2.55NaCl 0.00 0.00 0.00 0.00 0.10 0.10 0.10 0.10
Total Solids (TS) 22.97 22.94 21.69 22.96 30.47 29.83 29.19 30.46Total Water (Mw) 77.03 77.06 78.31 77.04 69.53 70.17 70.81 69.54
As can be inferred from these data, the water concentrations were in the ranges 77.03–78.31 and 69.53–70.81 g/100 g for water-based and milk-based model systems, respectively
Foods 2021, 10, 334 7 of 35
while sugars were in the range 21.69–22.97 and 25.35–26.62 g/100 g for water-based andmilk-based model systems, respectively. In the milk-based systems, the concentrations offats, milk solids non-fat (MSNF, which includes proteins and ashes from whole milk, skimmilk powder and milk proteins) and NaCl were 1.19, 2.56 and 0.10 (g/100 g), respectively.
2.2. Ice Cream Mixtures
All the ice cream mixtures were prepared with variable amounts of sucrose, dextrose,sorbitol but with the same amount of whole milk and of a multicomponent basis. Thecomposition of the multicomponent basis was the following: skimmed-milk powder (30%),dextrose (30%), maltodextrin (18.36%), inulin (10%), milk proteins (5%), sucrose esters(4.35%), carrageenan (0.29%), Tara-seed flour (1.5%) and carboxymethylcellulose (0.5%).All ingredients were purchased from REIRE s.r.l. (Reggio Emilia, Italy).
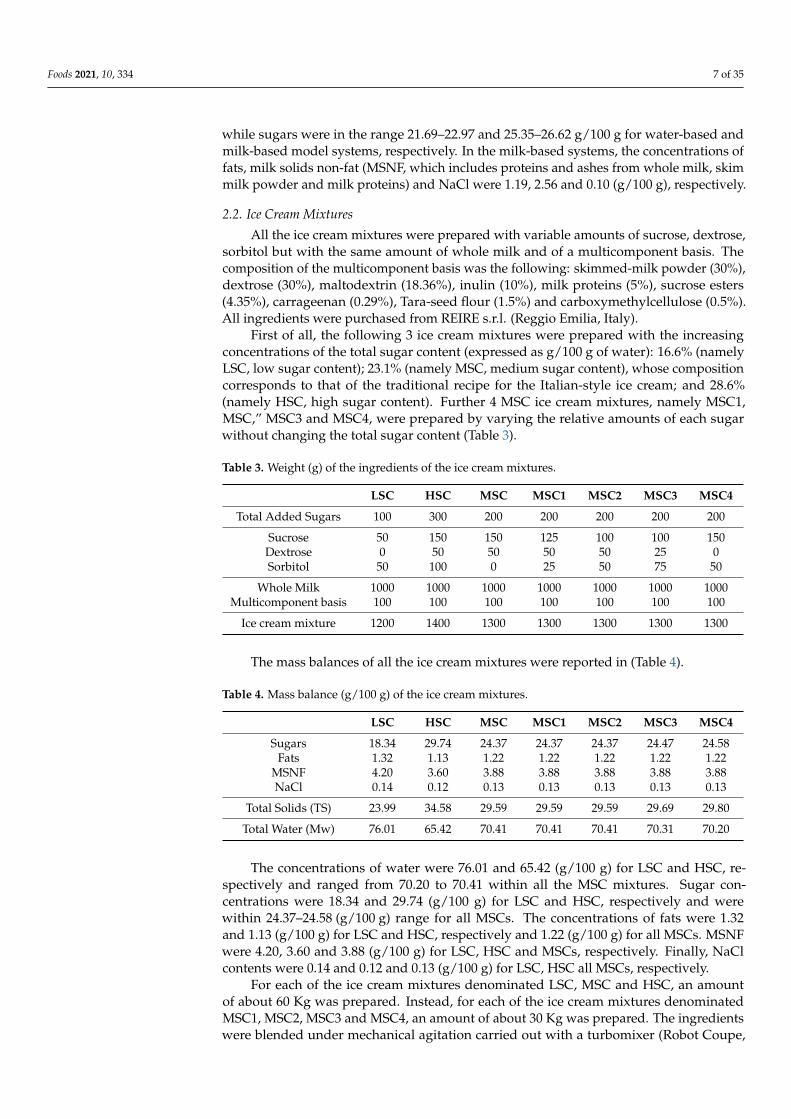
First of all, the following 3 ice cream mixtures were prepared with the increasingconcentrations of the total sugar content (expressed as g/100 g of water): 16.6% (namelyLSC, low sugar content); 23.1% (namely MSC, medium sugar content), whose compositioncorresponds to that of the traditional recipe for the Italian-style ice cream; and 28.6%(namely HSC, high sugar content). Further 4 MSC ice cream mixtures, namely MSC1,MSC,” MSC3 and MSC4, were prepared by varying the relative amounts of each sugarwithout changing the total sugar content (Table 3).
Table 3. Weight (g) of the ingredients of the ice cream mixtures.
LSC HSC MSC MSC1 MSC2 MSC3 MSC4
Total Added Sugars 100 300 200 200 200 200 200
Sucrose 50 150 150 125 100 100 150Dextrose 0 50 50 50 50 25 0Sorbitol 50 100 0 25 50 75 50
Whole Milk 1000 1000 1000 1000 1000 1000 1000Multicomponent basis 100 100 100 100 100 100 100
Ice cream mixture 1200 1400 1300 1300 1300 1300 1300
The mass balances of all the ice cream mixtures were reported in (Table 4).
Table 4. Mass balance (g/100 g) of the ice cream mixtures.
LSC HSC MSC MSC1 MSC2 MSC3 MSC4
Sugars 18.34 29.74 24.37 24.37 24.37 24.47 24.58Fats 1.32 1.13 1.22 1.22 1.22 1.22 1.22
MSNF 4.20 3.60 3.88 3.88 3.88 3.88 3.88NaCl 0.14 0.12 0.13 0.13 0.13 0.13 0.13
Total Solids (TS) 23.99 34.58 29.59 29.59 29.59 29.69 29.80
Total Water (Mw) 76.01 65.42 70.41 70.41 70.41 70.31 70.20
The concentrations of water were 76.01 and 65.42 (g/100 g) for LSC and HSC, re-spectively and ranged from 70.20 to 70.41 within all the MSC mixtures. Sugar con-centrations were 18.34 and 29.74 (g/100 g) for LSC and HSC, respectively and werewithin 24.37–24.58 (g/100 g) range for all MSCs. The concentrations of fats were 1.32and 1.13 (g/100 g) for LSC and HSC, respectively and 1.22 (g/100 g) for all MSCs. MSNFwere 4.20, 3.60 and 3.88 (g/100 g) for LSC, HSC and MSCs, respectively. Finally, NaClcontents were 0.14 and 0.12 and 0.13 (g/100 g) for LSC, HSC all MSCs, respectively.
For each of the ice cream mixtures denominated LSC, MSC and HSC, an amountof about 60 Kg was prepared. Instead, for each of the ice cream mixtures denominatedMSC1, MSC2, MSC3 and MSC4, an amount of about 30 Kg was prepared. The ingredientswere blended under mechanical agitation carried out with a turbomixer (Robot Coupe,
Foods 2021, 10, 334 8 of 35
Vincennes, CEDEX-France) for 1 min, then the solution was heated up to 88 C (thetemperature was reached in about 5 min) and finally cooled under 8 C (the temperaturewas reached in about 1.5 min).
2.3. Aging Operation
Model systems and ice cream mixtures were held at 4.0 ± 0.2 C for 24 h understatic conditions in a cabinet (Multispace 800, Electrolux, Porcia-Pordenone, Italy). Suchoperation allowed the partial crystallization of the milk fat globules and the protein hydra-tion. Both physical phenomena concur to the formation of a viscoelastic network insidethe unfrozen phase during freezing. The aged products were then homogenized with aturbomixer (Robot Coupe-94305, Vincennes, Cedex-France) for 1 min before freezing.
2.4. Freezing and Tempering Operation
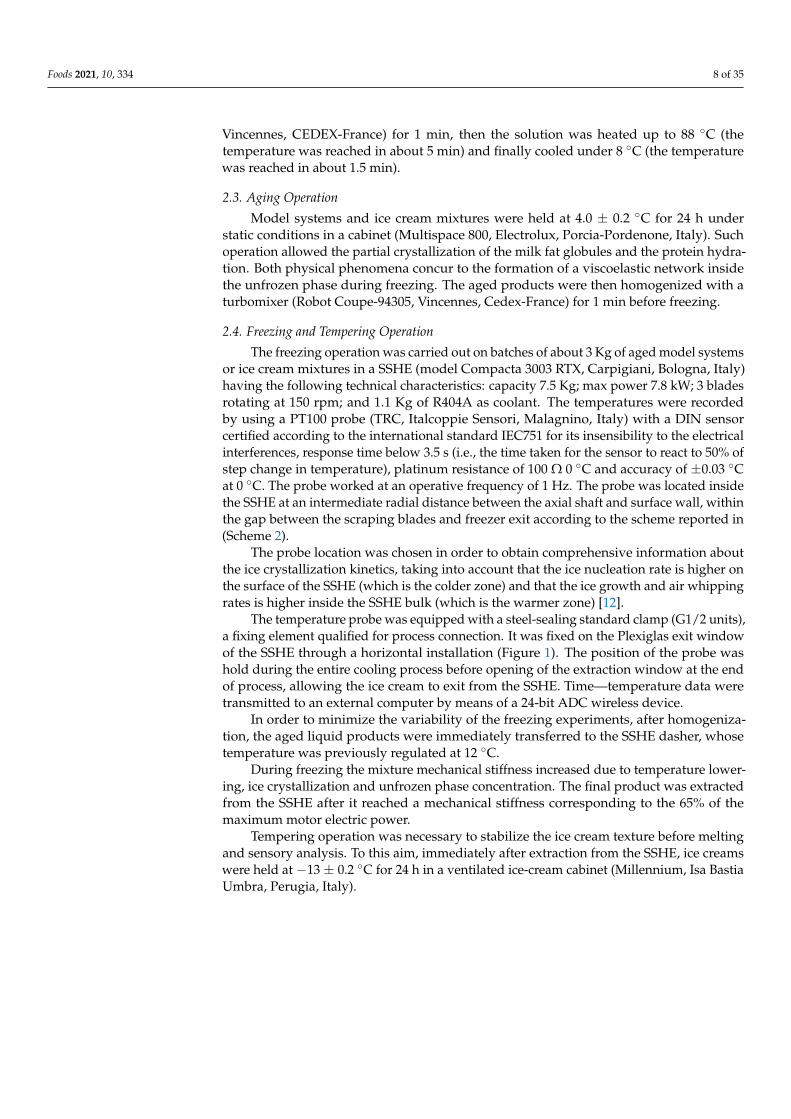
The freezing operation was carried out on batches of about 3 Kg of aged model systemsor ice cream mixtures in a SSHE (model Compacta 3003 RTX, Carpigiani, Bologna, Italy)having the following technical characteristics: capacity 7.5 Kg; max power 7.8 kW; 3 bladesrotating at 150 rpm; and 1.1 Kg of R404A as coolant. The temperatures were recordedby using a PT100 probe (TRC, Italcoppie Sensori, Malagnino, Italy) with a DIN sensorcertified according to the international standard IEC751 for its insensibility to the electricalinterferences, response time below 3.5 s (i.e., the time taken for the sensor to react to 50% ofstep change in temperature), platinum resistance of 100 Ω 0 C and accuracy of ±0.03 Cat 0 C. The probe worked at an operative frequency of 1 Hz. The probe was located insidethe SSHE at an intermediate radial distance between the axial shaft and surface wall, withinthe gap between the scraping blades and freezer exit according to the scheme reported in(Scheme 2).
The probe location was chosen in order to obtain comprehensive information aboutthe ice crystallization kinetics, taking into account that the ice nucleation rate is higher onthe surface of the SSHE (which is the colder zone) and that the ice growth and air whippingrates is higher inside the SSHE bulk (which is the warmer zone) [12].
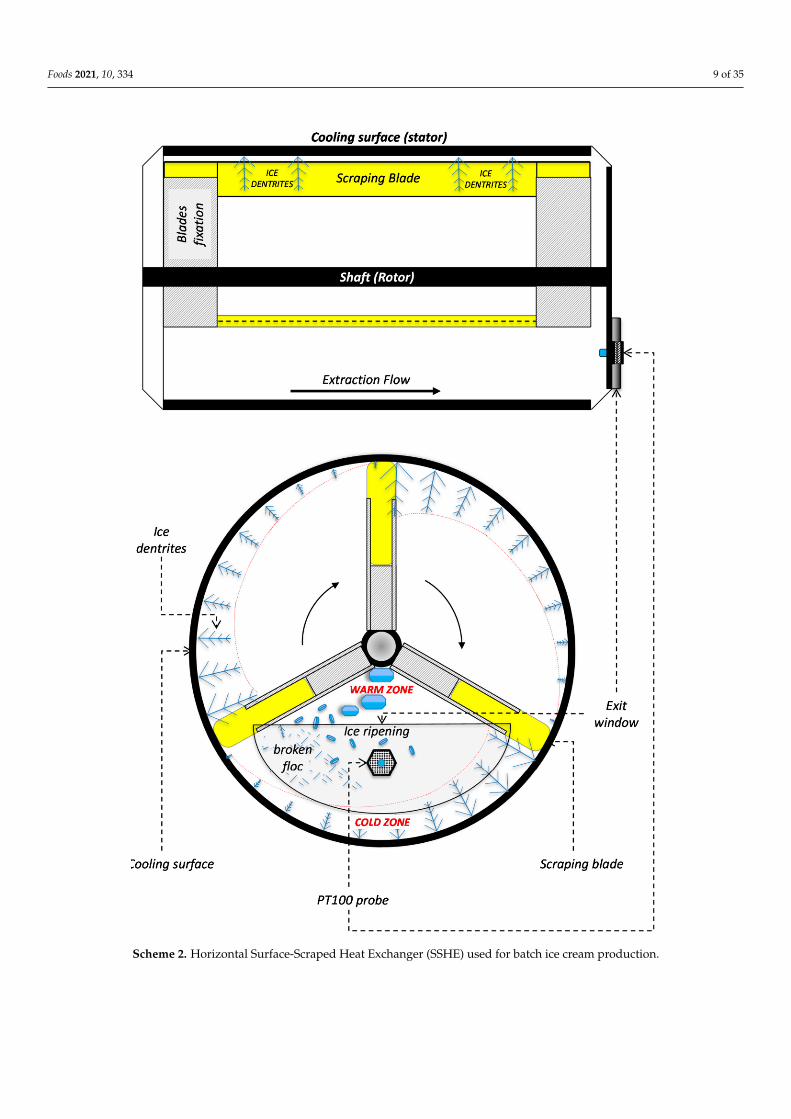
The temperature probe was equipped with a steel-sealing standard clamp (G1/2 units),a fixing element qualified for process connection. It was fixed on the Plexiglas exit windowof the SSHE through a horizontal installation (Figure 1). The position of the probe washold during the entire cooling process before opening of the extraction window at the endof process, allowing the ice cream to exit from the SSHE. Time—temperature data weretransmitted to an external computer by means of a 24-bit ADC wireless device.
In order to minimize the variability of the freezing experiments, after homogeniza-tion, the aged liquid products were immediately transferred to the SSHE dasher, whosetemperature was previously regulated at 12 C.
During freezing the mixture mechanical stiffness increased due to temperature lower-ing, ice crystallization and unfrozen phase concentration. The final product was extractedfrom the SSHE after it reached a mechanical stiffness corresponding to the 65% of themaximum motor electric power.
Tempering operation was necessary to stabilize the ice cream texture before meltingand sensory analysis. To this aim, immediately after extraction from the SSHE, ice creamswere held at −13 ± 0.2 C for 24 h in a ventilated ice-cream cabinet (Millennium, Isa BastiaUmbra, Perugia, Italy).
Foods 2021, 10, 334 9 of 35
Scheme 2. Horizontal Surface-Scraped Heat Exchanger (SSHE) used for batch ice cream production.
Foods 2021, 10, 334 10 of 35
Figure 1. Installation of the temperature probe: PT100 and wireless device (a); external (b,c) andinternal (d) view of the process connection on the exit window of the SSHE.
2.5. Calculation of the Theoretical Freezing Point
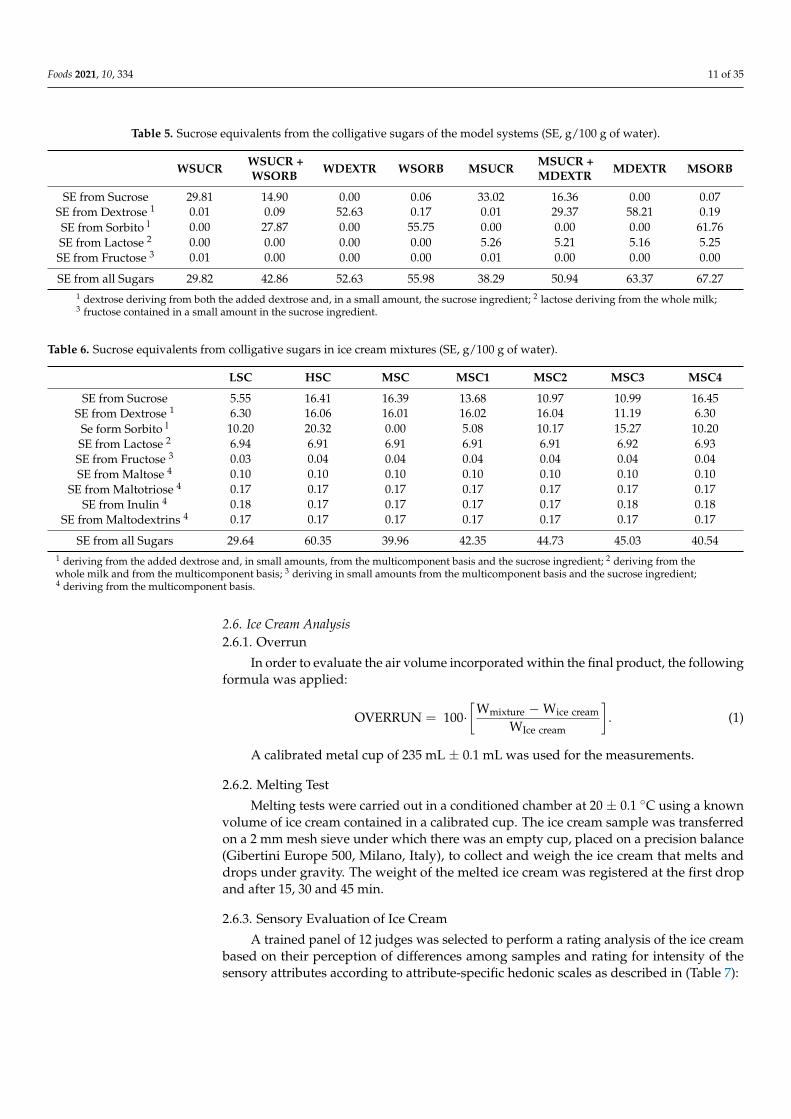
The theoretical freezing point is usually defined as the sub-zero temperature at whichthe water begins to crystallize in a solution of colligative solutes. Freezing point depressionof both model systems and ice cream mixtures was estimated considering their contentsin colligative solutes, according to the well-established sucrose equivalent method [5]. Inorder to consider the contribution of the different sugars contained in the formulations,each of them was converted in sucrose equivalents, that is, the equivalent concentrationsof sucrose that would have the same freezing point depression effects in a pure sucrosesolution. With this aim, the mean molecular weight of all each individual colligative solutewas divided to that of sucrose, then the result was multiplied for the mass fraction ofthe colligative solutes as expressed in g/100 g of water in the investigated solution. Thecontributions of all colligative sugars, MSNF and NaCl were considered. More specifically,the colligative sugars derive from both the added sweeteners, that is, sucrose, dextroseand sorbitol and from the other ingredients that include the milk and/or the multicom-ponent basis. Tables 5 and 6 list the sucrose equivalents of model systems and ice creammixtures, respectively.
Then, the contribution of sugars to the freezing point depression was calculated usingthe polynomial equation with intercept through zero derived from the regression modelwhere g sucrose/100 g water is graphed against freezing point depression [5].
The contributions of MSNF and NaCl to the freezing point depression were calculatedaccording to Goff and Hartel [5] and Potter et al. [19], respectively.
Fats, proteins, large molecular weight carbohydrates (except inulin and maltodex-trins), stabilizers and emulsifiers do not contribute to freezing point depression sincefats are immiscible with the aqueous phase and proteins and polysaccharides are verylarge molecules [5] with a negligible capacity to bind water molecules with respect tomonosaccharides, disaccharides, sugar alcohols and salts.
Foods 2021, 10, 334 11 of 35
Table 5. Sucrose equivalents from the colligative sugars of the model systems (SE, g/100 g of water).
WSUCR WSUCR +WSORB WDEXTR WSORB MSUCR MSUCR +
MDEXTR MDEXTR MSORB
SE from Sucrose 29.81 14.90 0.00 0.06 33.02 16.36 0.00 0.07SE from Dextrose 1 0.01 0.09 52.63 0.17 0.01 29.37 58.21 0.19SE from Sorbito l 0.00 27.87 0.00 55.75 0.00 0.00 0.00 61.76SE from Lactose 2 0.00 0.00 0.00 0.00 5.26 5.21 5.16 5.25SE from Fructose 3 0.01 0.00 0.00 0.00 0.01 0.00 0.00 0.00
SE from all Sugars 29.82 42.86 52.63 55.98 38.29 50.94 63.37 67.271 dextrose deriving from both the added dextrose and, in a small amount, the sucrose ingredient; 2 lactose deriving from the whole milk;3 fructose contained in a small amount in the sucrose ingredient.
Table 6. Sucrose equivalents from colligative sugars in ice cream mixtures (SE, g/100 g of water).
LSC HSC MSC MSC1 MSC2 MSC3 MSC4
SE from Sucrose 5.55 16.41 16.39 13.68 10.97 10.99 16.45SE from Dextrose 1 6.30 16.06 16.01 16.02 16.04 11.19 6.30
Se form Sorbito l 10.20 20.32 0.00 5.08 10.17 15.27 10.20SE from Lactose 2 6.94 6.91 6.91 6.91 6.91 6.92 6.93SE from Fructose 3 0.03 0.04 0.04 0.04 0.04 0.04 0.04SE from Maltose 4 0.10 0.10 0.10 0.10 0.10 0.10 0.10
SE from Maltotriose 4 0.17 0.17 0.17 0.17 0.17 0.17 0.17SE from Inulin 4 0.18 0.17 0.17 0.17 0.17 0.18 0.18
SE from Maltodextrins 4 0.17 0.17 0.17 0.17 0.17 0.17 0.17
SE from all Sugars 29.64 60.35 39.96 42.35 44.73 45.03 40.541 deriving from the added dextrose and, in small amounts, from the multicomponent basis and the sucrose ingredient; 2 deriving from thewhole milk and from the multicomponent basis; 3 deriving in small amounts from the multicomponent basis and the sucrose ingredient;4 deriving from the multicomponent basis.
2.6. Ice Cream Analysis2.6.1. Overrun
In order to evaluate the air volume incorporated within the final product, the followingformula was applied:
OVERRUN = 100·[
Wmixture −Wice cream
WIce cream
]. (1)
A calibrated metal cup of 235 mL ± 0.1 mL was used for the measurements.
2.6.2. Melting Test
Melting tests were carried out in a conditioned chamber at 20 ± 0.1 C using a knownvolume of ice cream contained in a calibrated cup. The ice cream sample was transferredon a 2 mm mesh sieve under which there was an empty cup, placed on a precision balance(Gibertini Europe 500, Milano, Italy), to collect and weigh the ice cream that melts anddrops under gravity. The weight of the melted ice cream was registered at the first dropand after 15, 30 and 45 min.
2.6.3. Sensory Evaluation of Ice Cream
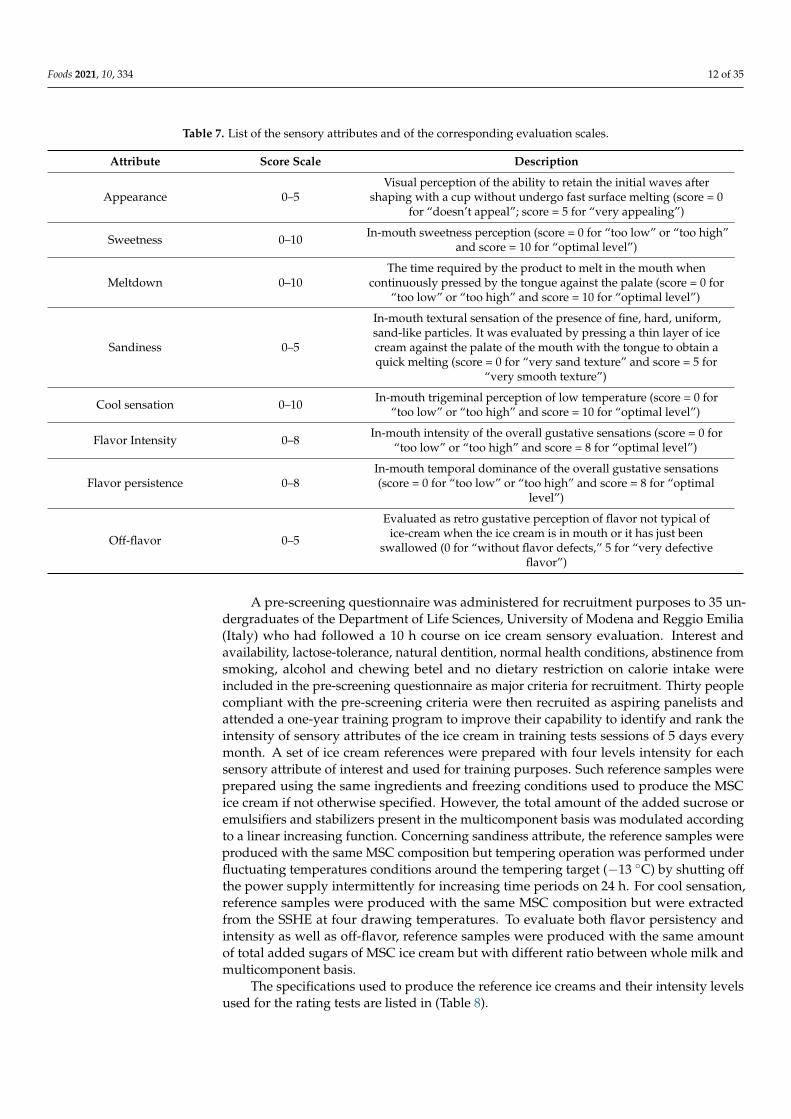
A trained panel of 12 judges was selected to perform a rating analysis of the ice creambased on their perception of differences among samples and rating for intensity of thesensory attributes according to attribute-specific hedonic scales as described in (Table 7):
Foods 2021, 10, 334 12 of 35
Table 7. List of the sensory attributes and of the corresponding evaluation scales.
Attribute Score Scale Description
Appearance 0–5Visual perception of the ability to retain the initial waves after
shaping with a cup without undergo fast surface melting (score = 0for “doesn’t appeal”; score = 5 for “very appealing”)
Sweetness 0–10 In-mouth sweetness perception (score = 0 for “too low” or “too high”and score = 10 for “optimal level”)
Meltdown 0–10The time required by the product to melt in the mouth when
continuously pressed by the tongue against the palate (score = 0 for“too low” or “too high” and score = 10 for “optimal level”)
Sandiness 0–5
In-mouth textural sensation of the presence of fine, hard, uniform,sand-like particles. It was evaluated by pressing a thin layer of icecream against the palate of the mouth with the tongue to obtain aquick melting (score = 0 for “very sand texture” and score = 5 for
“very smooth texture”)
Cool sensation 0–10 In-mouth trigeminal perception of low temperature (score = 0 for“too low” or “too high” and score = 10 for “optimal level”)
Flavor Intensity 0–8 In-mouth intensity of the overall gustative sensations (score = 0 for“too low” or “too high” and score = 8 for “optimal level”)
Flavor persistence 0–8In-mouth temporal dominance of the overall gustative sensations(score = 0 for “too low” or “too high” and score = 8 for “optimal
level”)
Off-flavor 0–5
Evaluated as retro gustative perception of flavor not typical ofice-cream when the ice cream is in mouth or it has just been
swallowed (0 for “without flavor defects,” 5 for “very defectiveflavor”)
A pre-screening questionnaire was administered for recruitment purposes to 35 un-dergraduates of the Department of Life Sciences, University of Modena and Reggio Emilia(Italy) who had followed a 10 h course on ice cream sensory evaluation. Interest andavailability, lactose-tolerance, natural dentition, normal health conditions, abstinence fromsmoking, alcohol and chewing betel and no dietary restriction on calorie intake wereincluded in the pre-screening questionnaire as major criteria for recruitment. Thirty peoplecompliant with the pre-screening criteria were then recruited as aspiring panelists andattended a one-year training program to improve their capability to identify and rank theintensity of sensory attributes of the ice cream in training tests sessions of 5 days everymonth. A set of ice cream references were prepared with four levels intensity for eachsensory attribute of interest and used for training purposes. Such reference samples wereprepared using the same ingredients and freezing conditions used to produce the MSCice cream if not otherwise specified. However, the total amount of the added sucrose oremulsifiers and stabilizers present in the multicomponent basis was modulated accordingto a linear increasing function. Concerning sandiness attribute, the reference samples wereproduced with the same MSC composition but tempering operation was performed underfluctuating temperatures conditions around the tempering target (−13 C) by shutting offthe power supply intermittently for increasing time periods on 24 h. For cool sensation,reference samples were produced with the same MSC composition but were extractedfrom the SSHE at four drawing temperatures. To evaluate both flavor persistency andintensity as well as off-flavor, reference samples were produced with the same amountof total added sugars of MSC ice cream but with different ratio between whole milk andmulticomponent basis.
The specifications used to produce the reference ice creams and their intensity levelsused for the rating tests are listed in (Table 8).

Foods 2021, 10, 334 13 of 35
Table 8. Characteristics of the reference ice creams.
Attribute Production Specifications Used to Obtain the Four Intensity Levels (*)
Appearance andMeltdown
Amount and ratio between total emulsifiers (sucrose esters) and stabilizers inthe multicomponent basis
(34.65 g + 5.35g);6.47:1
(35.65 g + 4.35 g);8.19:1
(36.65 g + 3.35 g);10.94:1
(37.65 g + 2.35 g);16.02:1
SweetnessAmount of total added sucrose
100 g 150 g 200 g 250 g
SandinessDuration of shut down of the power supply of the tempering cabinet
30 min 60 min 90 min 120 min
Cool sensationDrawing temperature from the SSHE
−3 C −5 C −7 C −9 C
Flavor Intensity,Persistency,Off-flavor
Amount and ratio between the whole milk and multicomponent basis(990 g + 110 g);
9:1(1000 g + 100 g);
10:1(1010 g + 90 g);
11.22:1(1020 g + 80 g);
12.75:1(*) Reference samples given from left to right are in the order of increasing attribute intensity.
During training sessions, the reference ice creams were presented in a random orderand the judges were asked to pick the samples with different intensity and rank them ac-cording to the perceived intensity using the attribute-specific hedonic scale. To compensatefor the known variations throughout training test sessions a qualifying test was performed,those who make an acceptable (75 percent correct) were chosen, otherwise the trainingsession was replicated. A series of 12 judgments were obtained from each prospectivepanelist. Twelve judges were selected as panel components based on their abilities to matchat least 5 out 8 of sensory attributes and at least 3 out 4 of rating tests.
During both the training and rating tests sessions, the ice creams were removed at−13 ± 0.2 C from the ventilated cabinet used for tempering and anonym glasses of about100 mL were prepared containing the same amount of product. No more five ice creamsamples were analyzed for each test session. Panelists were asked to firstly evaluate theappearance of the ice cream surface, noting if the ice creams have retained its form andshape. Next, they assessed the in-mouth properties. Immediately after placing a portionof ice cream into the mouth, they roll it between the incisors and bring them togethervery gently, noting the eventual presence of ice crystals and whether grittiness is apparentbetween the teeth. A small portion between the incisors revealed the presence of minutetraces of a gritty or sandy texture. Meltdown intensity was assessed by evaluating the timerequired for the product to soften and melt in the mouth when continuously pressed by thetongue against the palate. When the sample was completely liquefied and warmed to bodytemperature, the detection of the sweetness as well as of flavor intensity or persistency wasdone. It was accomplished by placing a small teaspoon of the ice cream directly into themouth, quickly manipulating the sample between the teeth and palate and noting the tasteand odor sensations as well as any releasing of after taste.
Since the evaluations of each attribute were carried out on evaluation scale specific tothat attribute, the scores assigned by the panelists were re-parameterized on a commonscale by performing standardization of the original scores to show the overall ice-creamprofile in a single figure for comparative purposes. To eliminate both the units and scalingeffects each score was divided by the standard deviation, obtaining a variance of 1 butdifferent means and ranges.
To evaluate the preference among the investigated ice creams, both the highest scoresand optimum score (where defined) were fixed as the highest level of liking degree. Thefinal judgment was calculated by summing all desired sensory attributes (i.e., appearance,cool sensation, sweetness, meltdown, flavor intensity and flavor persistency) and subtract-ing all undesired ones (i.e., sandiness and off-flavor). As a consequence, an overall likinglevel was calculated:
Foods 2021, 10, 334 14 of 35
LIKING LEVEL =12
∑J=1
100·
∑ scoreij − scored
j
∑ scoreimax
/12 (2)
where scoreij was the experimental score provided by the jth judge for the ith attribute;
scoreimax was the maximum score for each ith attribute and scored
j was the experimentalscore assigned by the jth judge to the dth off-flavor attribute.
2.6.4. Data Preprocessing and Statistical Analysis
Model systems were produced in triplicate. Concerning the ice cream mixtures, 18replicates were produced for the samples denominated LSC, MSC and HSC and 9 replicateswere produced for MSC1, MSC2, MSC3 and MSC4 samples.
To reduce the experimental noise, time-temperature data were filtered by using the3-point Savitzky-Golay numerical method [20].
The reproducibility of the time-temperature data was evaluated by overlapping thecooling profile of the independent replicates. More than 1200 values (400 sampling times foreach temperature profile) were used for the descriptive statistical analysis of the differencesmeasured among three replicates. As calculated by doubling the experimental standarderror, the uncertainty of temperature measurement always ranged within the +/−0.2 C.
Principal component analysis (PCA) was performed to classify the ice cream samplesaccording to composition and freezing properties. Multiple regression analysis (MRA) wascarried out to develop predictive models for the following ice cream quality properties:melting rate, overrun, appearance, cool sensation, smoothness, sweetness, meltdown,flavor intensity and flavor persistence. The predictive accuracy of the MRA models wasevaluated by performing the cross-validation on an independent dataset. The originaldataset was split in two subsets namely “calibration dataset” (including 70% of the samplesof the original dataset) from which the MRA models were derived and “validation dataset”(including 30% of the samples of the original dataset) against which the MAR modelswere validated. The goodness of fit for MRA models and for the linear regression betweenpredicted vs. observed data was evaluated calculating the multiple R2 with a statisticalsignificance of p < 0.01.
All statistical analyses were carried out using Statistica 10.0 (StatSoft 2011; Tulsa, OK,USA).
3. Results and Discussion
In this section, the cooling curves registered during the freezing of the model solutionsand of the ice cream mixtures were separately analyzed and discussed.
3.1. Cooling Curves for Water-Based Model Systems
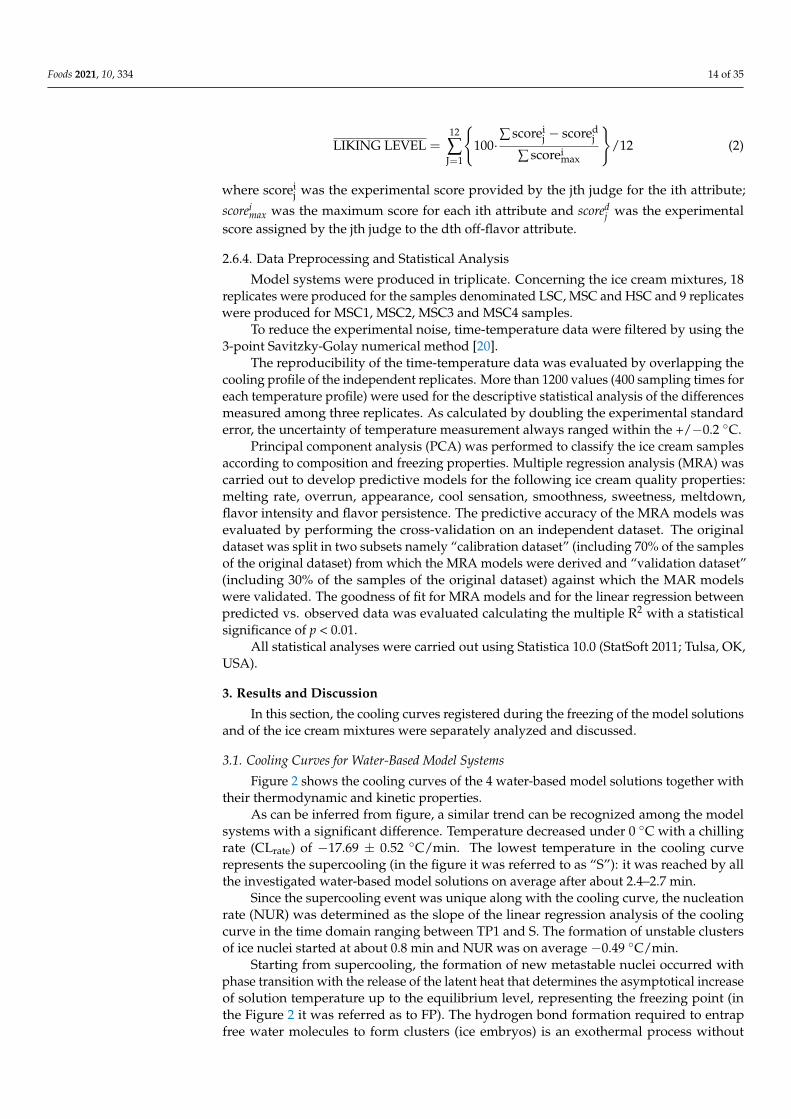
Figure 2 shows the cooling curves of the 4 water-based model solutions together withtheir thermodynamic and kinetic properties.
As can be inferred from figure, a similar trend can be recognized among the modelsystems with a significant difference. Temperature decreased under 0 C with a chillingrate (CLrate) of −17.69 ± 0.52 C/min. The lowest temperature in the cooling curverepresents the supercooling (in the figure it was referred to as “S”): it was reached by allthe investigated water-based model solutions on average after about 2.4–2.7 min.
Since the supercooling event was unique along with the cooling curve, the nucleationrate (NUR) was determined as the slope of the linear regression analysis of the coolingcurve in the time domain ranging between TP1 and S. The formation of unstable clustersof ice nuclei started at about 0.8 min and NUR was on average −0.49 C/min.
Starting from supercooling, the formation of new metastable nuclei occurred withphase transition with the release of the latent heat that determines the asymptotical increaseof solution temperature up to the equilibrium level, representing the freezing point (inthe Figure 2 it was referred as to FP). The hydrogen bond formation required to entrapfree water molecules to form clusters (ice embryos) is an exothermal process without
Foods 2021, 10, 334 15 of 35
phase transition that determines a significant increase in the cooling temperature rate. Theexperimental freezing point represents the equilibrium temperature required by the water-based solutions to form stable clusters of ice crystals able to growth under SSHE dynamicconditions. From this point, the water crystallization follows a steady-state kinetics (i.e.,without changes in temperature).
The “Heterogeneous Nucleation time, HNT” was calculated as the time length be-tween TP1 and FP. HNT values were in the range 1.51 ± 0.06–2.03 ± 0.08 min.
The kinetics (NUR, S) and thermodynamic (FP) parameters were sugar-specific and fol-lowed the order WSUCR, WSUCR + WSORB, WDEXTR and WSORB. This behavior couldbe attributed to the different ability of disaccharides, monosaccharides and sugar alcoholsto form hydrogen bonds with water molecules (colligative behavior), which is in turnrelated to the number of hydroxylic groups and the sugar steric hindrance. These resultsare in agreement with the findings of previous research. The nucleation rate in dextrosesolutions shows a low-order dependence upon supercooling, for supercooling in the range−0.25 C and −1.00 C but it increases markedly with increasing sugar concentration [21].Sucrose significantly slows down the nucleation rate [22]. The highest hygroscopicity ofsorbitol resulted in the lowest FP with respect to other reducing sugars [23].
Figure 2. Cooling curves of the water-based model systems. The absolute uncertainty of 0.18 C was considered for FPtaccording to Jaskulka et al. [24]. In columns, different letters indicate significant differences (p < 0.05) among the water-basedmodel systems.
Foods 2021, 10, 334 16 of 35
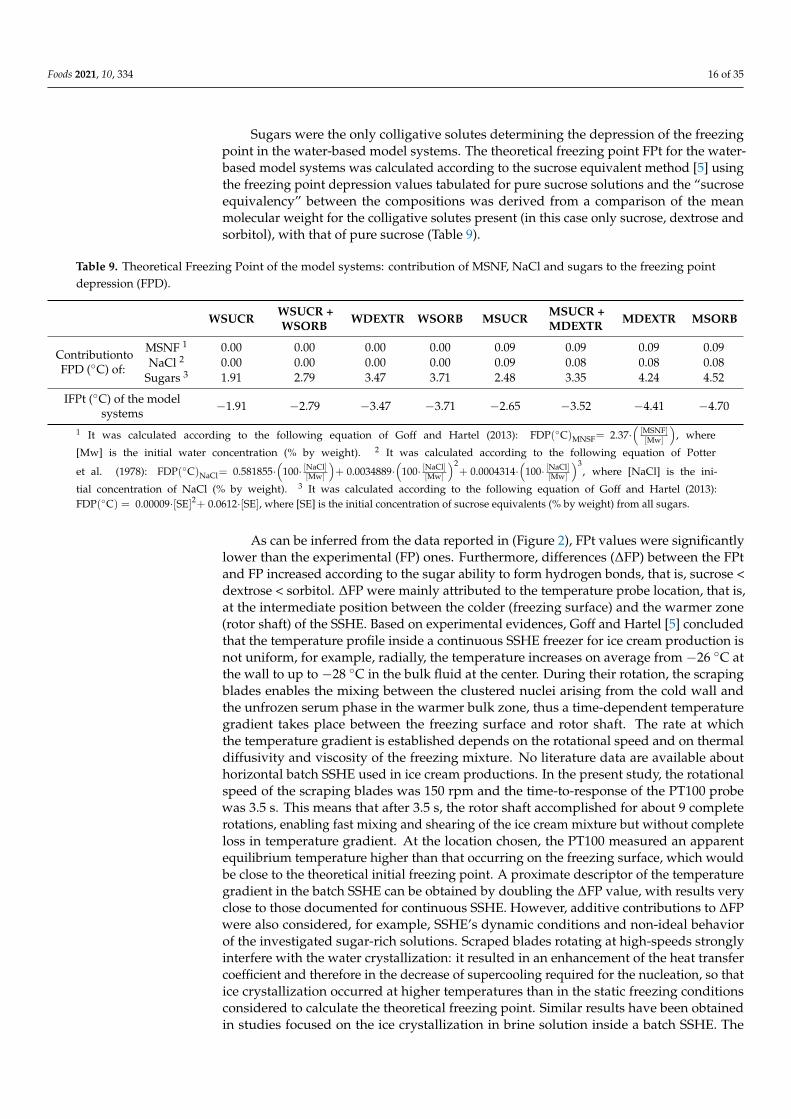
Sugars were the only colligative solutes determining the depression of the freezingpoint in the water-based model systems. The theoretical freezing point FPt for the water-based model systems was calculated according to the sucrose equivalent method [5] usingthe freezing point depression values tabulated for pure sucrose solutions and the “sucroseequivalency” between the compositions was derived from a comparison of the meanmolecular weight for the colligative solutes present (in this case only sucrose, dextrose andsorbitol), with that of pure sucrose (Table 9).
Table 9. Theoretical Freezing Point of the model systems: contribution of MSNF, NaCl and sugars to the freezing pointdepression (FPD).
WSUCR WSUCR +WSORB WDEXTR WSORB MSUCR MSUCR +
MDEXTR MDEXTR MSORB
ContributiontoFPD (C) of:
MSNF 1 0.00 0.00 0.00 0.00 0.09 0.09 0.09 0.09NaCl 2 0.00 0.00 0.00 0.00 0.09 0.08 0.08 0.08
Sugars 3 1.91 2.79 3.47 3.71 2.48 3.35 4.24 4.52
IFPt (C) of the modelsystems −1.91 −2.79 −3.47 −3.71 −2.65 −3.52 −4.41 −4.70
1 It was calculated according to the following equation of Goff and Hartel (2013): FDP(C)MNSF= 2.37·([MSNF][Mw]
), where
[Mw] is the initial water concentration (% by weight). 2 It was calculated according to the following equation of Potter
et al. (1978): FDP(C)NaCl= 0.581855·(
100· [NaCl][Mw]
)+ 0.0034889·
(100· [NaCl]
[Mw]
)2+ 0.0004314·
(100· [NaCl]
[Mw]
)3, where [NaCl] is the ini-
tial concentration of NaCl (% by weight). 3 It was calculated according to the following equation of Goff and Hartel (2013):FDP(C) = 0.00009·[SE]2+ 0.0612·[SE], where [SE] is the initial concentration of sucrose equivalents (% by weight) from all sugars.
As can be inferred from the data reported in (Figure 2), FPt values were significantlylower than the experimental (FP) ones. Furthermore, differences (∆FP) between the FPtand FP increased according to the sugar ability to form hydrogen bonds, that is, sucrose <dextrose < sorbitol. ∆FP were mainly attributed to the temperature probe location, that is,at the intermediate position between the colder (freezing surface) and the warmer zone(rotor shaft) of the SSHE. Based on experimental evidences, Goff and Hartel [5] concludedthat the temperature profile inside a continuous SSHE freezer for ice cream production isnot uniform, for example, radially, the temperature increases on average from −26 C atthe wall to up to −28 C in the bulk fluid at the center. During their rotation, the scrapingblades enables the mixing between the clustered nuclei arising from the cold wall andthe unfrozen serum phase in the warmer bulk zone, thus a time-dependent temperaturegradient takes place between the freezing surface and rotor shaft. The rate at whichthe temperature gradient is established depends on the rotational speed and on thermaldiffusivity and viscosity of the freezing mixture. No literature data are available abouthorizontal batch SSHE used in ice cream productions. In the present study, the rotationalspeed of the scraping blades was 150 rpm and the time-to-response of the PT100 probewas 3.5 s. This means that after 3.5 s, the rotor shaft accomplished for about 9 completerotations, enabling fast mixing and shearing of the ice cream mixture but without completeloss in temperature gradient. At the location chosen, the PT100 measured an apparentequilibrium temperature higher than that occurring on the freezing surface, which wouldbe close to the theoretical initial freezing point. A proximate descriptor of the temperaturegradient in the batch SSHE can be obtained by doubling the ∆FP value, with results veryclose to those documented for continuous SSHE. However, additive contributions to ∆FPwere also considered, for example, SSHE’s dynamic conditions and non-ideal behaviorof the investigated sugar-rich solutions. Scraped blades rotating at high-speeds stronglyinterfere with the water crystallization: it resulted in an enhancement of the heat transfercoefficient and therefore in the decrease of supercooling required for the nucleation, so thatice crystallization occurred at higher temperatures than in the static freezing conditionsconsidered to calculate the theoretical freezing point. Similar results have been obtainedin studies focused on the ice crystallization in brine solution inside a batch SSHE. The
Foods 2021, 10, 334 17 of 35
values of ∆FP were 0.80, 1.20, 1.56 and 1.59 C for WSUCR, WSUCR + WSORB, WDEXTRand WSORB, respectively. to Higher sugar-water interactions determined higher liquidviscosity. In these conditions, the lower shear rate inside the liquid bulk determined lowerrates of mixing and heat transfer from the coldest point (freezing surface of the SSHE) tothe location of the temperature probe.
3.2. Cooling Curves for Milk-Based Model Systems
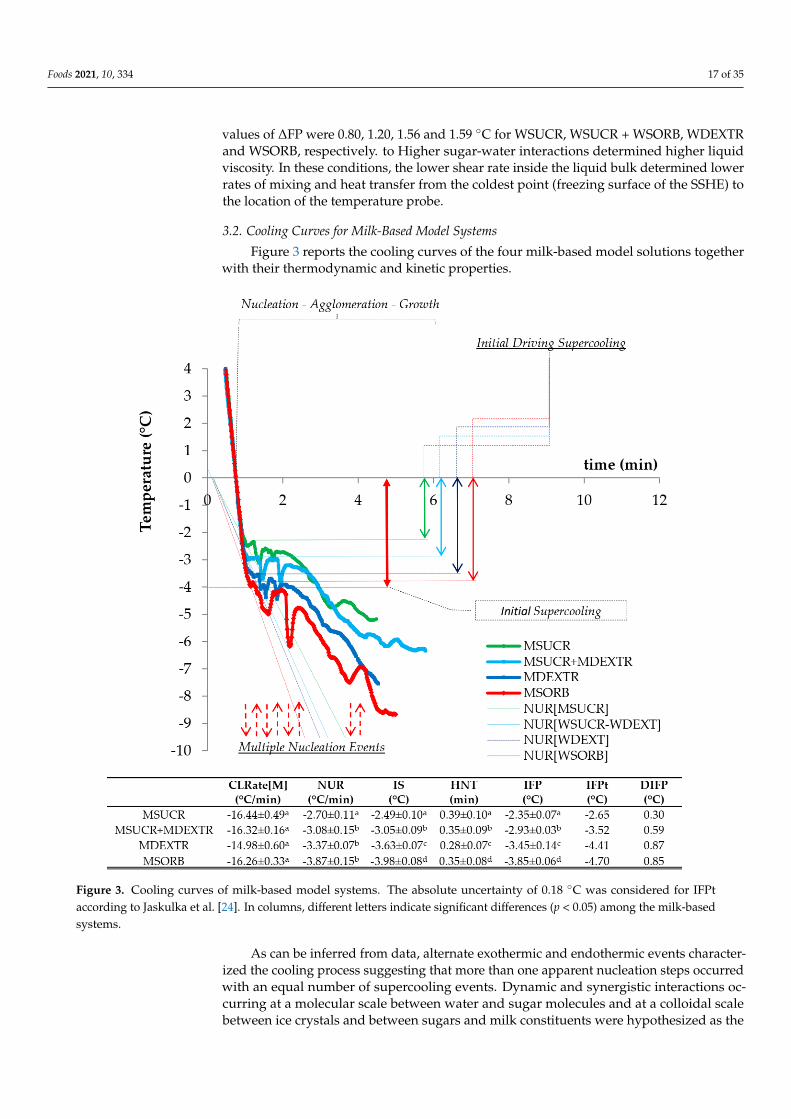
Figure 3 reports the cooling curves of the four milk-based model solutions togetherwith their thermodynamic and kinetic properties.
Figure 3. Cooling curves of milk-based model systems. The absolute uncertainty of 0.18 C was considered for IFPtaccording to Jaskulka et al. [24]. In columns, different letters indicate significant differences (p < 0.05) among the milk-basedsystems.
As can be inferred from data, alternate exothermic and endothermic events character-ized the cooling process suggesting that more than one apparent nucleation steps occurredwith an equal number of supercooling events. Dynamic and synergistic interactions oc-curring at a molecular scale between water and sugar molecules and at a colloidal scalebetween ice crystals and between sugars and milk constituents were hypothesized as the
Foods 2021, 10, 334 18 of 35
main causes of the observed temperature profiles and they could be due to the formationof hydrogen bonds. The formation of large agglomerates of ice crystals was observed infreezing experiments concerning sugar solutions [25].
As can be inferred from figure, the temperature decreased under 0 C with a CLrateof −16.00 ± 0.52 C/min and was significantly lower than that observed in water-basedmodel systems. The presence of milk fat and proteins is responsible for a relatively higherliquid viscosity and a lower heat transfer coefficient of the milk-based model systems. Dueto the occurrence of several apparent nucleation events, the temperature correspondingto the first event was determined as initial supercooling, IS. Starting from the initialsupercooling, the formation of new metastable nuclei occurred during phase transitionwith the release of latent heat that determines an increase of solution temperature up to thefirst equilibrium level, that is, the experimental initial freezing point, IFP. The theoreticalfreezing point, IFPt, for the milk-based model systems were significantly lower than theexperimental ones (Figure 3). However, the difference between IFPt and IFP values, ∆IFP,was on average significantly lower than that observed in the water-based model systems:∆IFP were 0.30, 0.59, 0.87 and 0.85 C for MSUCR, MSUCR + MDEXTR, MDEXTR andMSORB, respectively. An additive contribute of the colloidal milk proteins and salts to theheterogeneous nucleation process was hypothesized, resulting in a decrease of supercoolingrequired for the nucleation, so that the water crystallization occurred at higher temperaturesthan in the static freezing conditions considered to calculate the theoretical freezing point.Experimental evidences were provided by the fact that, differently to the water-basedmodel systems, the experimental temperatures corresponding to the IS were always higherthan the corresponding IFPt (the theoretical freezing point is calculated accounting forsucrose equivalency without ant protein contribute to the equilibrium temperature).
Due to the occurrence of more than one supercooling events, the nucleation rate (NUR)was determined as the slope of the linear regression analysis of the cooling curve in the timedomain ranging between TP1 and IS; while the “Heterogeneous Nucleation time, HNT”was calculated as the time length between TP1 and IFP. NUR was on average−3.25 C/minand the HNT values were in the range 0.28 ± 0.07–0.39 ± 0.10 C/min indicating that theIFP point was reached faster than in water-based models.
Both the kinetic (IS) and thermodynamic (IFP) parameters highlighted sugar-specificeffects on the water crystallization kinetics and were in the following decreasing orderMSUCR, MSUCR + DEXTR, MDEXTR and MSORB.
3.3. Cooling Curve for the Ice Cream Mixtures
As for the milk-based systems, more than one apparent nucleation steps occurredwith an equal number of supercooling events but they occurred in a defined time and withlower temperature fluctuations due to the presence of emulsifiers, which promoted thedestabilization of the milk fat globules and stabilizers, responsible for the higher initialviscosity. After heterogeneous nucleation, that is, an unstable crystallization period duringwhich temperature fluctuation may be registered due to more than ones supercooling andnucleation, the ice nuclei reach a minimum stable size, enough to growth at a macroscopicscale size without changes in temperature. Such equilibrium temperature was kept for verylittle time, because the significant subtraction of water as ice from the liquid mixture causedthe concentration of the unfrozen phase that becomes slurry. Water crystallization requiredlower temperatures to progress when the unfrozen phase concentrates significantly.
In order to simplify the quantitative analysis of the water crystallization kinetics, thefollowing main steps of the cooling curve were individuated:
Chilling, corresponding to the linear part of the cooling curve above 0 C.Initial Freezing Point (IFP) corresponding to the highest temperature (i.e., the first
equilibrium temperature) reached after the first supercooling (kinetic event)Steady-State, part of the cooling curve where the equilibrium temperature remains
constant for a little time since the ice crystallization occurs without significant increase ofthe concentration of the unfrozen phase of the ice cream mixture.
Foods 2021, 10, 334 19 of 35
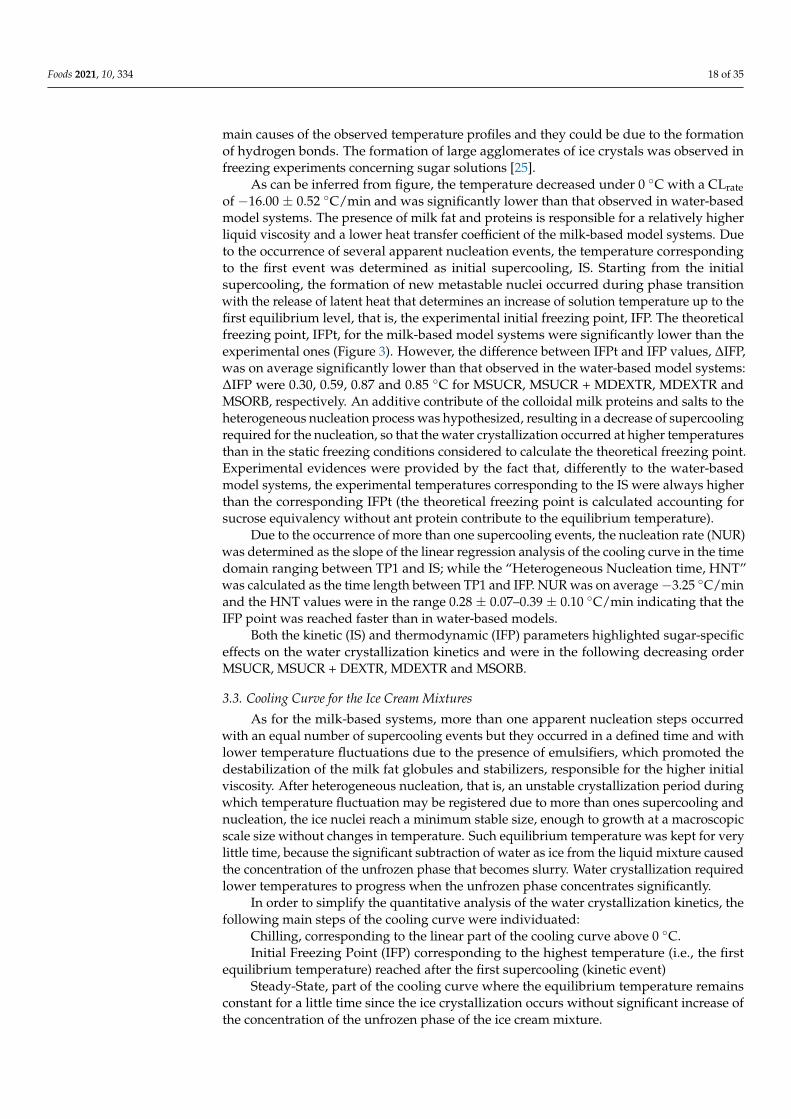
Effective Freezing Point (IFPeff) corresponding to the equilibrium temperature, atwhich the water crystallization kinetics is at its acceleration point and the ice starts toaccumulate significantly and extensively in the ice-cream mixtures.
Dynamic Nucleation, part of the cooling curve below 0 C and IFPeff correspondingto the multiple heterogeneous nucleation (supercooling) events.
Dynamic Ice Crystallization, part of the cooling curve between IFPeff and temperatureat which the ice cream exits (Texit) from the SSHE where the ice crystals growth is limitedby the length of the freezing time as a balance between the mechanical shearing andtechnological properties of the ice cream mixture
As an example, (Figure 4) reports the cooling curves of the HSC ice cream mixtures.
Figure 4. Cooling curves of the HSC ice cream mixtures.
Since more than one nucleation events were observed in the ice cream mixturesduring cooling, both the NUR and HNT were calculated as for the milk-based modelsystems. The kinetic and thermodynamic parameters of the HSC ice cream mixtureswere compared to those of the milk-based model systems since they were preparedwith the same amounts of added sugars. CLrate (−15.41 ± 1.60 C/min) was not sig-nificantly different from those referred to the milk-based model systems, while NUR(−7.80 ± 1.42 C/min) and HNT (0.79 ± 0.16 min) were significantly higher. RegardingIS (−2.34 ± 0.18 C) and IFP (−2.23 ± 0.35 C), no differences were highlighted betweenHSC and MSUCR, while the values found for the ice cream were significantly lower thanthose observed for MSUCR + MDEXTR, MDEXTR and MSORB. The temperature gradient(0.70 ± 0.17 C), expressed in terms of the ∆IFP parameter was not significantly differentto that (0.65 ± 0.27 C) measured on in milk-based model system. However, HSC samplesshowed the highest average value (1.39± 0.17 C) of ∆IFP: it was not significantly differentfrom that (1.29 ± 0.37 C) measured in the water-based model systems. The behavior
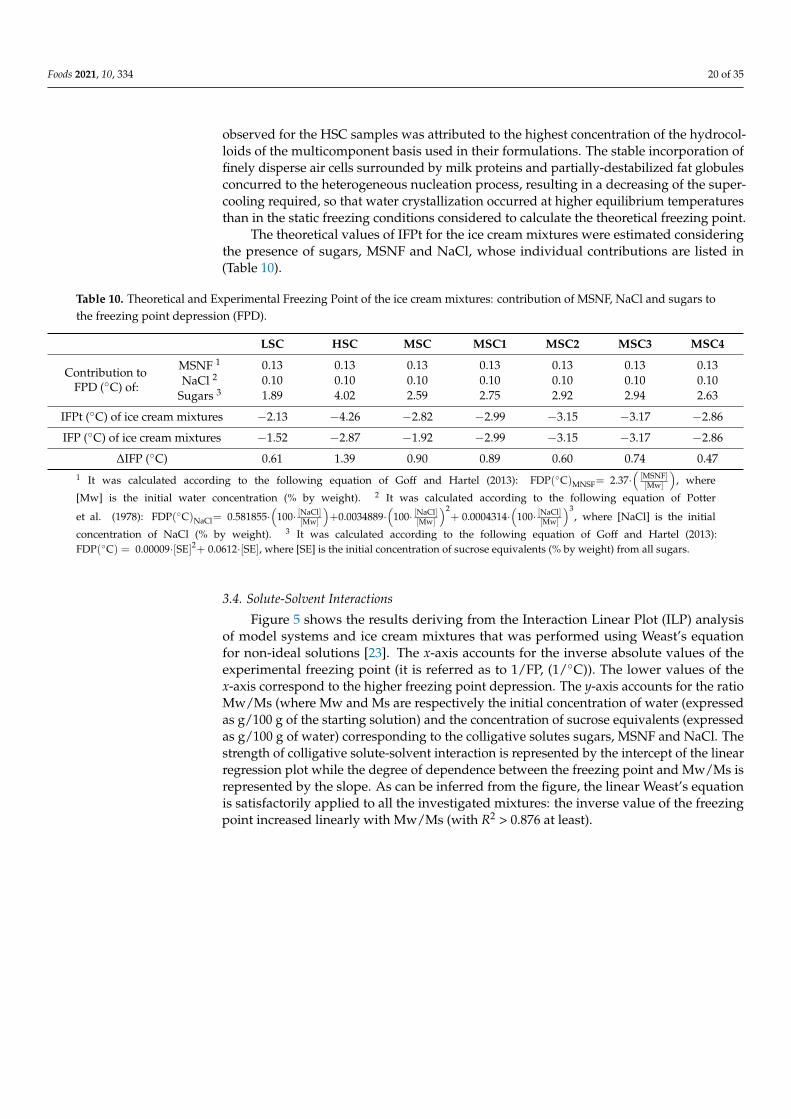
Foods 2021, 10, 334 20 of 35
observed for the HSC samples was attributed to the highest concentration of the hydrocol-loids of the multicomponent basis used in their formulations. The stable incorporation offinely disperse air cells surrounded by milk proteins and partially-destabilized fat globulesconcurred to the heterogeneous nucleation process, resulting in a decreasing of the super-cooling required, so that water crystallization occurred at higher equilibrium temperaturesthan in the static freezing conditions considered to calculate the theoretical freezing point.
The theoretical values of IFPt for the ice cream mixtures were estimated consideringthe presence of sugars, MSNF and NaCl, whose individual contributions are listed in(Table 10).
Table 10. Theoretical and Experimental Freezing Point of the ice cream mixtures: contribution of MSNF, NaCl and sugars tothe freezing point depression (FPD).
LSC HSC MSC MSC1 MSC2 MSC3 MSC4
Contribution toFPD (C) of:
MSNF 1 0.13 0.13 0.13 0.13 0.13 0.13 0.13NaCl 2 0.10 0.10 0.10 0.10 0.10 0.10 0.10
Sugars 3 1.89 4.02 2.59 2.75 2.92 2.94 2.63
IFPt (C) of ice cream mixtures −2.13 −4.26 −2.82 −2.99 −3.15 −3.17 −2.86
IFP (C) of ice cream mixtures −1.52 −2.87 −1.92 −2.99 −3.15 −3.17 −2.86
∆IFP (C) 0.61 1.39 0.90 0.89 0.60 0.74 0.471 It was calculated according to the following equation of Goff and Hartel (2013): FDP(C)MNSF= 2.37·
([MSNF][Mw]
), where
[Mw] is the initial water concentration (% by weight). 2 It was calculated according to the following equation of Potter
et al. (1978): FDP(C)NaCl= 0.581855·(
100· [NaCl][Mw]
)+0.0034889·
(100· [NaCl]
[Mw]
)2+ 0.0004314·
(100· [NaCl]
[Mw]
)3, where [NaCl] is the initial
concentration of NaCl (% by weight). 3 It was calculated according to the following equation of Goff and Hartel (2013):FDP(C) = 0.00009·[SE]2+ 0.0612·[SE], where [SE] is the initial concentration of sucrose equivalents (% by weight) from all sugars.
3.4. Solute-Solvent Interactions
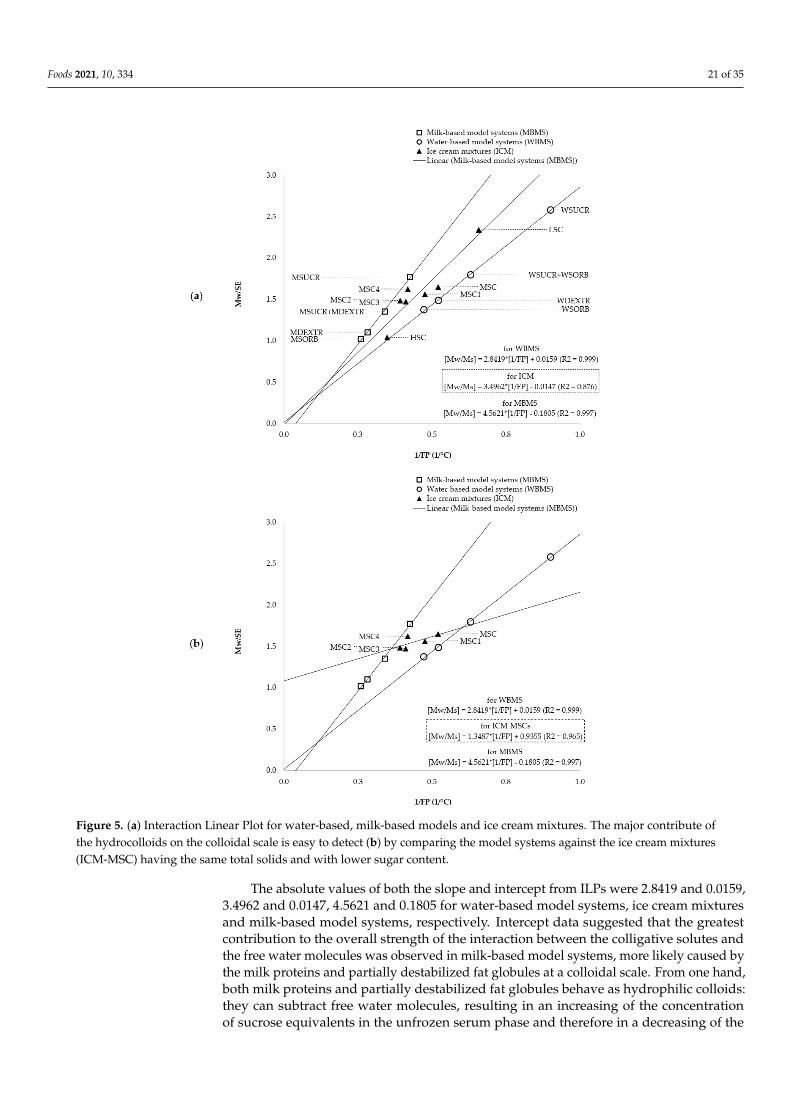
Figure 5 shows the results deriving from the Interaction Linear Plot (ILP) analysisof model systems and ice cream mixtures that was performed using Weast’s equationfor non-ideal solutions [23]. The x-axis accounts for the inverse absolute values of theexperimental freezing point (it is referred as to 1/FP, (1/C)). The lower values of thex-axis correspond to the higher freezing point depression. The y-axis accounts for the ratioMw/Ms (where Mw and Ms are respectively the initial concentration of water (expressedas g/100 g of the starting solution) and the concentration of sucrose equivalents (expressedas g/100 g of water) corresponding to the colligative solutes sugars, MSNF and NaCl. Thestrength of colligative solute-solvent interaction is represented by the intercept of the linearregression plot while the degree of dependence between the freezing point and Mw/Ms isrepresented by the slope. As can be inferred from the figure, the linear Weast’s equationis satisfactorily applied to all the investigated mixtures: the inverse value of the freezingpoint increased linearly with Mw/Ms (with R2 > 0.876 at least).
Foods 2021, 10, 334 21 of 35
Figure 5. (a) Interaction Linear Plot for water-based, milk-based models and ice cream mixtures. The major contribute ofthe hydrocolloids on the colloidal scale is easy to detect (b) by comparing the model systems against the ice cream mixtures(ICM-MSC) having the same total solids and with lower sugar content.
The absolute values of both the slope and intercept from ILPs were 2.8419 and 0.0159,3.4962 and 0.0147, 4.5621 and 0.1805 for water-based model systems, ice cream mixturesand milk-based model systems, respectively. Intercept data suggested that the greatestcontribution to the overall strength of the interaction between the colligative solutes andthe free water molecules was observed in milk-based model systems, more likely caused bythe milk proteins and partially destabilized fat globules at a colloidal scale. From one hand,both milk proteins and partially destabilized fat globules behave as hydrophilic colloids:they can subtract free water molecules, resulting in an increasing of the concentrationof sucrose equivalents in the unfrozen serum phase and therefore in a decreasing of the
Foods 2021, 10, 334 22 of 35
initial freezing point. Furthermore, an additive sugar-specific colligative effect arising fromlactose, MSNF and milk salts concurs to the degree of dependence of Mw/Ms on freezingpoint depression. On the other hand, the colloids can also promote the heterogeneousnucleation step of the water crystallization kinetics that takes place inside the SSHE,resulting in a decreasing of supercooling and therefore in an increasing in the initialfreezing point. As suggested by the experimental cooling curves, both the NUR and ISparameters increased while HNT parameter decreased in the milk-based model systemswith respect to the water-based model systems. Under our experimental conditions, thebalancing between the two effect resulted in lower levels of the freezing point depressionand therefore in higher values of the initial freezing point for the milk-based model systemswith respect to the water-based ones. Despite they have very close levels (i.e., about 1.80)of Mw/Ms, the WSUCR + WSORB samples showed an average value of freezing pointdepression (IFP at −1.58 C) lower than that (IFP at −2.35 C) of the MSUCR ones. Similarresults were observed by comparing MSUCR + MDEXTR against WSORB samples forwhich Mw/Ms was close to 1.38: the sucrose equivalents were 51.85 and 55.99 g/100 g ofwater while the initial freezing point were −2.94 and −2.12 C for MSUCR + MDEXTRand WSORB, respectively.
An intermediate strength of the colligative solute-solvent interaction was observed inthe ice cream mixtures. Such behavior was attributed to the main technological functionsof stabilizers and emulsifiers from the multicomponent basis used in their formulations.Concerning the stabilizers, carrageenan, Tara-seed flour and carboxymethylcellulose arethe hydrocolloids with the greatest water binding capacity and thickening ability, followedby inulin and maltodextrin. Such high molecular weight hydrocolloids have a great abilityto interact with free water molecules through hydration (e.g., carboxymethylcellulose) andgelling (e.g., carrageenan), thus occupying a large solution volume and entangling andinteracting with each other and with milk proteins and partially-destabilized fat globules toform large hydrophilic colloids [5]. The synergic ability to form hydrogen bonds with freewater molecules at a colloidal scale subtracting them from colligative solute interaction inthe unfrozen phase was used to justify the stronger effect on the freezing point depressionobserved in the ice cream mixtures respect to that observed in milk-based model systems.Such results were in agreement with literature: freeze concentration of the unfrozen serumphase results in a polysaccharide concentration several times higher than that was presentin the original mix [5]. Nevertheless, in the case of ice cream mixtures, a counterbalancingeffect of the finely dispersed air bubbles on the degree of dependence of Mw/Ms andthe freezing point depression was hypothesized: the presence of air reduced the slopein ILP. Although MSORB, MDEXTR and HSC samples were respectively characterizedwith 1.38, 1.10 and 1.04 for Mw/Ms, the freezing point depression was in the followingdecreasing order MSORB (−3.85 C), MDEXTR (−3.45 C) and HSC (−2.87 C). Thesucrose esters present in the multicomponent basis used in the formulation of the ice creammixtures promote destabilization of the milk fat globules, enhancing the formation ofsmall and finely dispersed air bubbles inside the unfrozen serum phase. The simultaneouspresence of emulsifiers and stabilizers makes more stable the air whipping process at acolloidal scale. The stable incorporation of finely disperse air cells surrounded by milkproteins and partially-destabilized fat globules occurring in the HSC samples concurredto the heterogeneous nucleation process by decreasing the supercooling required, so thatwater crystallization in the HSC samples occurred at equilibrium temperatures higher thatthose required for water-based model systems. The average value of the HNT parameterwas about 0.68 min, that is, intermediate between those of water-based (0.28 min) andmilk-based (1.73 min) model systems.
Compelling evidence of the destabilizing effects of the emulsifying hydrocolloids, re-sulting in the increase of the interactions on the colloidal scale, is provided in the (Figure 5b)that shows the Weast’s relationship referred either to the model systems obtained by addingan amount of sugars equal to 300 g and to the MSC ice cream mixtures having the sametotal solid content but obtained by adding an amount of sugars equal to 200 g. Regardless

Foods 2021, 10, 334 23 of 35
of their lower concentration of sugars, the MSC samples showed the highest strength ofcolligative solute-solvent interaction (intercept of the Weast’s function was 0.935) but thelowest degree of dependence between the freezing point and Mw/Ms (the slope of theWeast’s function was 1.348).
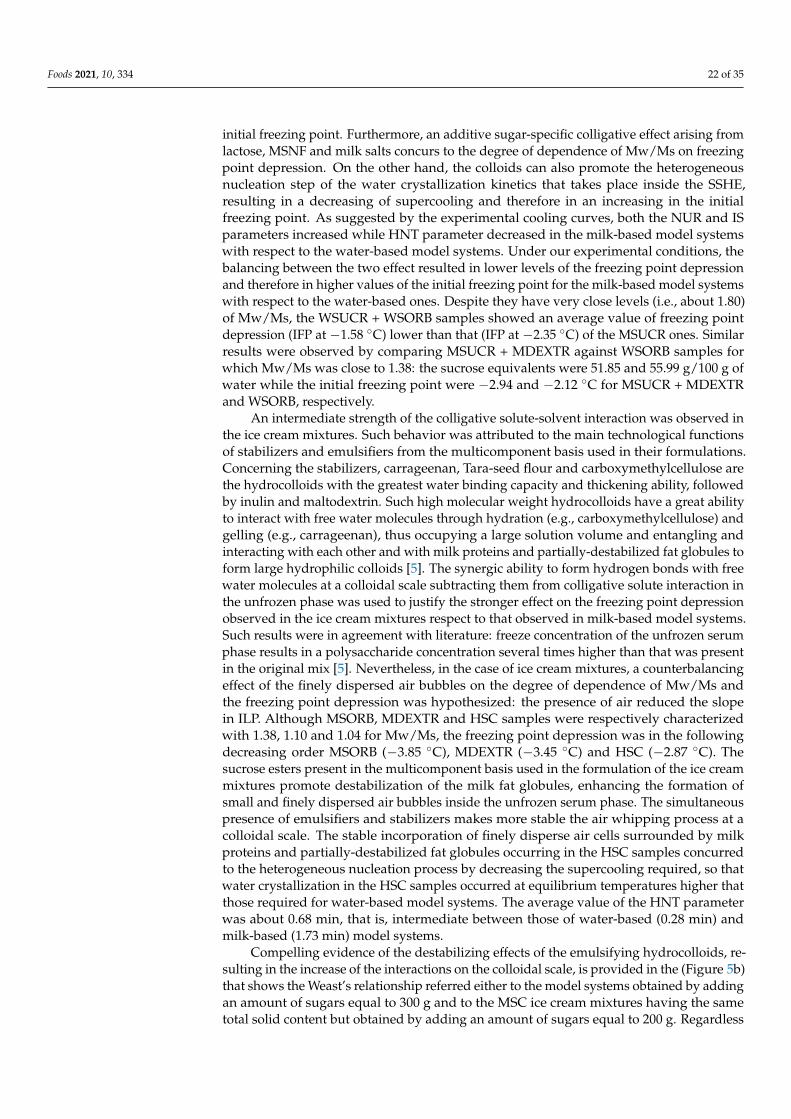
3.5. Modeling of Crystallization Kinetics for Ice Cream Mixtures
The mathematical description of the water crystallization in batch ice cream productionwas performed through a phenomenological modeling of the overall freezing occurringinside the SSHE that include the main freezing steps observed on a macroscopic scale, thatis, the heterogeneous nucleation, ice crystal growth and air incorporation.
From one hand, the improvement of the quality of ice cream produced in batch SSHErequires accurate and quantitative data about the composition of the starting liquid mixtureand its freezing properties but also about the way in which structural and physical changesoccurring under dynamic freezing conditions may affect melting and sensory propertiesof the final ice cream. From another hand, the time-temperature history experienced bythe ice cream mixture inside the SSHE can be used as an accurate fingerprinting of themultiple events taking place on a wide range of scale size and that include heterogeneousnucleation, ice crystal growth, destabilizing of fat globules, cross-linking of hydrocolloidsto form a viscoelastic network and air incorporation.
In order to characterize the water crystallization kinetics that takes place inside theSSHE during ice cream production, the mass fraction of the initial water content was usedas a kinetic descriptor of the temperatures experienced by the ice cream mixtures insidethe SSHE. On the other hand, the direct measurement of the freezing point depression ofthe ice cream mixture under dynamic conditions is difficult to obtain instrumentally as aconsequence of (i) the increased sample viscosity which is responsible of the slowdown ofthe rate of heat transfer and (ii) the dynamic scraping conditions causing the ice nuclei tobe sheared, melted and mixed on the large ice crystals.
The initial freezing point IFP and freezable water fraction WF(t) are the two param-eters required to determine the temperature dependence of the amount of ice that canbe separated inside the SSHE during cooling. Other studies provided evidence that thefreezable water fraction increases with an increase in the molecular weight of solute andthat the temperature dependence of the fraction of frozen water is different between so-lutions with low molecular and high molecular solutes reflecting the difference in theirhydration states [26]. It is widely recognized that the most accurate method to measure theinitial freeing point inside the SSHE is based on the analysis of the temperature profile asregistered in-situ. The initial freezing point was experimentally determined by performingthe first derivative analysis of the cooling curve [27]. They recognized the initial freezingpoint as the first temperature at which the rate of cooling undergoes a significant decreasebecause of the supercooling event. A pure solution under freezing shows a decreasingin the minimum when supercooling takes place and that temperature increases to reachan upper plateau (with zero-slope) where the ice crystals begins to growth. The highesttemperature level reached after supercooling represents the freezing point for that solution.However, the temperature domain with zero slope is not easy to detect in the case ofmulticomponent solutions.
In the present work, the freezable water fraction was based on the numerical analysisof the whole cooling curve throughout three preliminary steps that include (i) the individu-ation of the first supercooling event, (ii) the determination of IFP and (iii) the calibrationof the whole cooling curve. Finally, a re-parameterized Gompertz’s function was used todescribe the water crystallization kinetics by quantifying the time-dependent changes inWF(t).
As an example, (Figure 6a) shows the three steps focused on the individuation ofthe initial freezing point and calibration of the cooling curve for the HSC mixture; while(Figure 6b) shows the superimposition of WF(t) values and those calculated by using the are-parameterized Gompertz’s function.
Foods 2021, 10, 334 24 of 35
Foods 2021, 10, x FOR PEER REVIEW 27 of 40
Foods 2021, 10, x. https://doi.org/10.3390/xxxxx www.mdpi.com/journal/foods
(a)
(b)
Figure 6. Modeling of Crystallization Kinetics of the HSC ice cream mixture: (a) cooling curve calibration; (b) Gompertz’smodel of the ice crystallization kinetics.

Foods 2021, 10, 334 25 of 35
In the first step, derivative analysis of the cooling curve was performed to evaluatethe time corresponding to the first supercooling event according to [27]. In the second step,IFP was numerically individuated as the highest temperature after the first supercooling.Aiming to develop a robust algorithm able to determine automatically the first supercoolingevent on the cooling curve, the following ∆-function was defined and analyzed:
[TCL(t)− (t)]2
Texp (t)≤ 10 (3)
The value of the function is expected to rapidly increase at the first supercooling (sincethe ice nucleation is an exothermal process) before the rate of the increasing can reach anasymptotical level during freezing (Figure 6a). The quadratic form of the function allowedto minimize the local dynamic changes of the experimental temperatures. Finally, the timecorresponding to the IFP temperature was individuated by determining the time-interceptof the regression line passing through at least ten among the highest values estimated usingthe ∆-function.
In the present work, the freezable water fraction WF(t) was estimated according tothe well-established sucrose equivalent method [5] as the mass fraction of the initial waterthat can be virtually converted into the ice at a given equilibrium freezing temperature,by assuming that the ice cream mixture would behave as a pure sucrose solution. Suchan indirect methodology allowed the estimation of this mass fraction in the temperaturedomain ranging between IFP and Texit, which was assumed to include all the equilibriumfreezing temperatures experienced by the ice cream mixture inside the freezer. To thisaim, the whole cooling curve was previously calibrated by algebraically subtracting thedifference calculated between the experimental value of the initial freezing point IFP andthe theoretical value IFPt. The calibration of the experimental temperature profile wasnecessary to compensate the overestimation of the temperature levels measured by thetemperature probe due to the specific location inside the SSHE, that is, at intermediateposition between the colder zone (freezing surface) and warmer zone (shaft rotor) andthe effects exerted by other experimental factors that include the time-of-response of thetemperature probe and the solute-solute and solute-solvent interactions.
During freezing, the concentration of the colligative solutes increases in the unfrozenserum phase, thus causing the progressive reduction of the equilibrium freezing temperature.
In the present work, the temperature dependence of the freezable water fraction wasestablished by coupling the Texp (t) data to the reverse empirical relationship between theFPD values tabulated for pure sucrose solutions with different sucrose concentrations andthe corresponding WF(t). WF(t) was calculated by simulating a 14-point level dataset forthe pure sucrose solutions with each level corresponded to a 5% increase, supposing thatnot over 70% of the initial water can be converted in the ice (such condition must be takeninto account to consider as valid the relationship between IFPt and the concentration ofsucrose equivalents [SE] in a pure sucrose solution). A fourth-order polynomial functionwas fitted to the simulated FPD-WF(t) data.
The assumption that the bulk temperatures of the ice cream mixture correspond toits equilibrium freezing points is supported by several basic studies focused on sugarsolutions which proved that the bulk temperature inside the SSHE is very close to thethermodynamic equilibrium temperatures (freezing point) since the secondary nucleationrate of ice is fast [5,28]. The assumption that the sucrose equivalent method can be suc-cessfully used to estimate the mass fraction of water that can be converted in the ice issupported by pioneering studies [24] on 110 mixes formulated to include a wide variety ofingredients and concentrations. In a comparison between the sucrose equivalent methodand the measurements with an osmometer, the authors found that the theoretical approachunderestimated or overestimated the initial freezing point of about 0.18 C, depending onthe choice of ingredients.
From a macroscopic point of view, the water crystallization kinetics occurring in thebatch SSHE follows a sigmoidal trend as described by the time-dependent changes in the

Foods 2021, 10, 334 26 of 35
freezable water fraction during cooling. As can be inferred from (Figure 6b), the dynamicnucleation occurring within the IFP-IFPeff range can be considered an induction step ofthe whole water crystallization process. In this induction step, cooperative phenomenatake place on a microscopic scale, which include heat and mass transfer, supercooling,crystallization and melting events, before the ice started to growth significantly at theeffective freezing temperature point IFPeff. After this equilibrium temperature, the growthof the ice crystals dominates on the heterogeneous nucleation: the growth rate of WF(t)reaches a maximum level before to decelerate and level off to an upper asymptotic level(on a macroscopic scale) towards the Twhipp point, where the air incorporation dominateson the ice formation until the Texit point.
A re-parameterized Gompertz’s function was proposed as a phenomenological modelto mathematically describe the time-changes in the freezable water fraction WF(t) underthe SSHE dynamic conditions:
WF(t) = WFmax × exp− exp
(GRmax × 2.718
WFmax
)·(HNT− t) + 1
(4)
The three model parameters were estimated by performing a non-linear fitting pro-cedure of the re-parameterized Gompertz’s function. The lack-of-fit was evaluated bycalculating the square relative mean error (E%, always less than 2%):
E % =1n×
√√√√[WF(t)−WF(t)exp
]2
WF(t)(5)
First-, second- and third-order derivative analysis of the modified Gompertz’s functionwas performed to determine the time-temperature onsets corresponding to the watercrystallization kinetics (1) at its maximum acceleration (IFPeff), (2) at its maximum rate(GRtime and GRT) and (3) at its maximum deceleration (tTwhipp and Twhipp).
The Twhipp could be treated as a key freezing parameter useful to decide the optimumtime length required to incorporate an enough amount of the air during freezing andtherefore to decide objectively the shut-off of the refrigeration system. High-shear ratesdue to the high-speed of rotating blades inside the SSHE together with the decrease intemperature promote and sustain the formation of a viscoelastic structure in the unfrozenserum phase through milk fat destabilizing, fat coalescing, protein hydration, hydrocolloidinteraction and air incorporation. An optimal strength of such viscoelastic structure isrequired to keep the maximum overrun: the amount of the incorporated air reaches amaximum and then decreases as a balance between the rheological, interfacial propertiesand mechanical stress established inside the freezing mixture [9,10,17,18].
It is useful to point out that the temperature of the product undergoes intermittentrising and lowering when prolonging the freezing time (tTexit) beyond the set point ofdesired stiffness, due to the fine-modulation of the stiffness target by the electronic system ofthe SSHE: the smaller crystals melt causing the increase of the bigger ones [5,28], negativelyaffecting the ice cream texture.
3.6. Modeling of Ice Cream Melting Kinetics
While freezing is required for the development of the ice cream structure, meltingoccurring when the product is exposed to temperatures higher than the freezing ones isresponsible for its loss. On a macroscopic scale, melting can be considered a hystereticreverse process with respect to the ice crystallization one. Previous research [29,30] high-lighted a sigmoidal trend for the ice cream melting, expressed as the mass of the drip loss(mD) divided by the total mass of the ice cream (m0) and plotted against time, as a result ofcooperative mechanisms occurring on microscopic scale including heat and mass transfer,
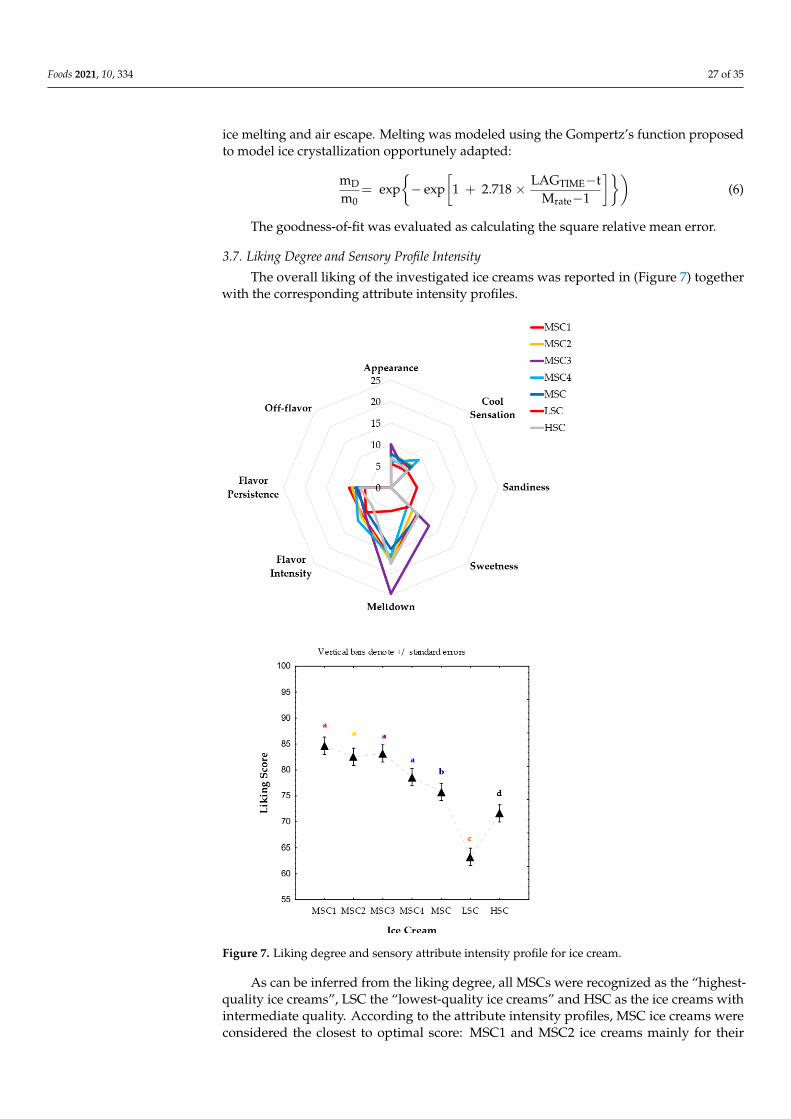
Foods 2021, 10, 334 27 of 35
ice melting and air escape. Melting was modeled using the Gompertz’s function proposedto model ice crystallization opportunely adapted:
mD
m0= exp
− exp
[1 + 2.718 × LAGTIME−t
Mrate−1
])(6)
The goodness-of-fit was evaluated as calculating the square relative mean error.
3.7. Liking Degree and Sensory Profile Intensity
The overall liking of the investigated ice creams was reported in (Figure 7) togetherwith the corresponding attribute intensity profiles.
Figure 7. Liking degree and sensory attribute intensity profile for ice cream.
As can be inferred from the liking degree, all MSCs were recognized as the “highest-quality ice creams”, LSC the “lowest-quality ice creams” and HSC as the ice creams withintermediate quality. According to the attribute intensity profiles, MSC ice creams wereconsidered the closest to optimal score: MSC1 and MSC2 ice creams mainly for their
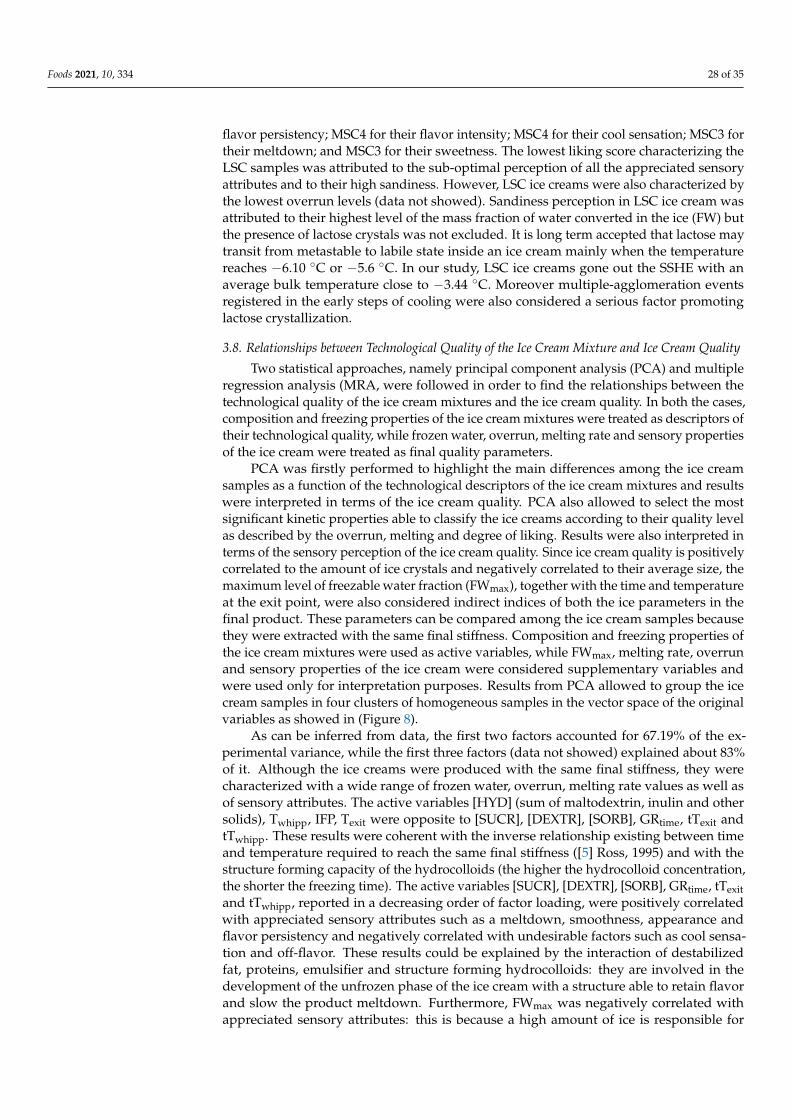
Foods 2021, 10, 334 28 of 35
flavor persistency; MSC4 for their flavor intensity; MSC4 for their cool sensation; MSC3 fortheir meltdown; and MSC3 for their sweetness. The lowest liking score characterizing theLSC samples was attributed to the sub-optimal perception of all the appreciated sensoryattributes and to their high sandiness. However, LSC ice creams were also characterized bythe lowest overrun levels (data not showed). Sandiness perception in LSC ice cream wasattributed to their highest level of the mass fraction of water converted in the ice (FW) butthe presence of lactose crystals was not excluded. It is long term accepted that lactose maytransit from metastable to labile state inside an ice cream mainly when the temperaturereaches −6.10 C or −5.6 C. In our study, LSC ice creams gone out the SSHE with anaverage bulk temperature close to −3.44 C. Moreover multiple-agglomeration eventsregistered in the early steps of cooling were also considered a serious factor promotinglactose crystallization.
3.8. Relationships between Technological Quality of the Ice Cream Mixture and Ice Cream Quality
Two statistical approaches, namely principal component analysis (PCA) and multipleregression analysis (MRA, were followed in order to find the relationships between thetechnological quality of the ice cream mixtures and the ice cream quality. In both the cases,composition and freezing properties of the ice cream mixtures were treated as descriptors oftheir technological quality, while frozen water, overrun, melting rate and sensory propertiesof the ice cream were treated as final quality parameters.
PCA was firstly performed to highlight the main differences among the ice creamsamples as a function of the technological descriptors of the ice cream mixtures and resultswere interpreted in terms of the ice cream quality. PCA also allowed to select the mostsignificant kinetic properties able to classify the ice creams according to their quality levelas described by the overrun, melting and degree of liking. Results were also interpreted interms of the sensory perception of the ice cream quality. Since ice cream quality is positivelycorrelated to the amount of ice crystals and negatively correlated to their average size, themaximum level of freezable water fraction (FWmax), together with the time and temperatureat the exit point, were also considered indirect indices of both the ice parameters in thefinal product. These parameters can be compared among the ice cream samples becausethey were extracted with the same final stiffness. Composition and freezing properties ofthe ice cream mixtures were used as active variables, while FWmax, melting rate, overrunand sensory properties of the ice cream were considered supplementary variables andwere used only for interpretation purposes. Results from PCA allowed to group the icecream samples in four clusters of homogeneous samples in the vector space of the originalvariables as showed in (Figure 8).
As can be inferred from data, the first two factors accounted for 67.19% of the ex-perimental variance, while the first three factors (data not showed) explained about 83%of it. Although the ice creams were produced with the same final stiffness, they werecharacterized with a wide range of frozen water, overrun, melting rate values as well asof sensory attributes. The active variables [HYD] (sum of maltodextrin, inulin and othersolids), Twhipp, IFP, Texit were opposite to [SUCR], [DEXTR], [SORB], GRtime, tTexit andtTwhipp. These results were coherent with the inverse relationship existing between timeand temperature required to reach the same final stiffness ([5] Ross, 1995) and with thestructure forming capacity of the hydrocolloids (the higher the hydrocolloid concentration,the shorter the freezing time). The active variables [SUCR], [DEXTR], [SORB], GRtime, tTexitand tTwhipp, reported in a decreasing order of factor loading, were positively correlatedwith appreciated sensory attributes such as a meltdown, smoothness, appearance andflavor persistency and negatively correlated with undesirable factors such as cool sensa-tion and off-flavor. These results could be explained by the interaction of destabilizedfat, proteins, emulsifier and structure forming hydrocolloids: they are involved in thedevelopment of the unfrozen phase of the ice cream with a structure able to retain flavorand slow the product meltdown. Furthermore, FWmax was negatively correlated withappreciated sensory attributes: this is because a high amount of ice is responsible for
Foods 2021, 10, 334 29 of 35
cold and anesthetic sensation that depress the perception of other sensations. Mrate waspositively correlated with FWmax, due to the lower heat capacity of ice with respect to thatof liquid water and negatively correlated with Meltdown. This apparent inconsistencycould be attributed to the predominant effect of the mechanical shearing of the ice creambetween the tongue and palate. FWmax was positively correlated with Texit, Twhipp and IFPas a result of the opposite effect of time and temperature on the ice growth.
Figure 8. Principal Component Analysis: projection of ice cream samples and variables on the plane.
As suggested by the projections of the samples on the factor plane (Figure 8), the MSCsice cream mixtures were characterized by the lowest values of frozen water and meltingrate and by the best balance between appreciated and undesirable sensory attributes. Thehighest levels of IFP, Texit, Twhipp, FWmax, tTwhipp and tTexit were registered during freezingof the LSC ice cream mixtures, causing the production of ice creams with the lowest-quality.In fact, they were characterized by the highest values of off-flavor, cool sensation, frozenwater and meting rate and by the lowest scores for meltdown, flavor persistence, appearanceand overrun. HSC ice creams showed intermediate quality between MSC and LSC.
It is widely known that the greatest number of ice crystals formed in the mechanicalfreezer are obtained with the highest level of the initial freezing point of the mix, thusresulting in a smoother texture for the ice cream. The initial freezing point also determinesthe amount of water melts at room temperature. In general, the higher is the initial freezingpoint, the lowest is the melting rate at room temperature. However, in this study, anopposite behavior was observed for LSC ice cream mixtures for which a prolonged time offreezing was required to incorporate the air and obtain a given overall stiffness at the exit ofthe SSHE. This unexpected behavior was attributed to an excess of the mechanical energyprovided by the SSHE scraping blades during the prolonged freezing time (as indicatedby higher levels of tTwhipp and tTexit), which was able to cause the overrun loss and morelikely melting of the smaller ice crystals and growth of the larger ones.
Foods 2021, 10, 334 30 of 35
Results from PCA corroborates the idea that some freezing properties obtained fromthe modeling of the cooling curve can be used for classification purposes of the ice creammixtures.
Table 11 lists the multiple regression models able to predict some ice cream qualityindices together with the results from cross-validation analysis. Composition and freezingparameters were used as input predictors.
Table 11. Application of Stepwise Regression Analysis for the prediction of the ice cream quality indices.
Multiple Regression ModelsMultiple
R2 p Calibration Model(70%)
MultipleR2 p Validation Data
(30%)Multiple
R2 p
Mrate = −0.61 HNT−1.45·tTexit + 0.12 CLrate + 0.69 GRtime 0.775 4.4 × 10⁻⁴ Pred = 0.56 + 0.78·Obs 0.775 0.000 Pred=1.11 + 0.56·Obs 0.526 0.000Overrun = 21.54 Twe + 25.03·IFP−5.82·IFPeff-14.33 tTexit 0.717 3.9 × 10⁻³ Pred = 8.39 + 0.72·Obs 0.717 0.000 Pred=19.87 + 0.31·Obs 0.421 0.018Appearance = −2.91·Twe − 0.94·HNT 0.817 5.4 × 10⁻⁵ Pred = 0.61 + 0.82·Obs 0.817 0.000 Pred=0.93 + 0.73·Obs 0.548 0.000Cool sensation = 5.19 − T[IFP-2] − 3.07 GRtime + 2.30·HNT+5.3·tTexit − 7.13IFP + 0.39·CLrate
0.798 1.5 × 10⁻⁴ Pred = 1.18 + 0.79·Obs 0.798 0.000 Pred=2.18 + 0.62·Obs 0.426 0.000
Smoothness = 0.33 tTwhipp 0.792 2.1 × 10⁻⁴ Pred = 1.03 + 0.79·Obs 0.792 0.000 Pred=0.56+ 0.78·Obs 0.401 0.000
Sweetness = 2.65·IFPeff − 2.34·HNT 0.805 1.1 × 10⁻⁴ Pred = 1.46 + 0.80·Obs 0.805 0.000 Pred=2.22 + 0.69·Obs 0.486 0.000Meltdown = −3.80·Twe 0.872 1.2 × 10⁻⁶ Pred = 0.86 + 0.87·Obs 0.872 0.000 Pred=1.10 + 0.85·Obs 0.672 0.000Flavor Intensity = −2.31·GRtime + 1.13·HNT − 0.24·CLrate + 6.35·FAT 0.865 2.2 × 10⁻⁶ Pred = 1.04 + 0.87·Obs 0.865 0.000 Pred=2.15 + 0.71F·Obs 0.709 0.000Flavor Persistence = −1.942·HNT 0.775 0.001 Pred = 1.667 + 0.775·Obs 0.775 0.000 Pred=2.174 + 0.715·Obs 0.523 0.000
To represent the structural changes taking place during the chilling step of cooling andthose occurring during the asymptotic ice formation, CLrate and Twe were also considered.The stepwise analysis retained all temperature- and time-domain freezing properties in thepredictive models, while all composition properties were discarded from the models, exceptfor the fat concentration that affected the Flavor Intensity attribute. As can be inferred fromdata, the predictive models were satisfactorily fitted to the calibration data as suggestedby the multiple R2. The cross-validation of the predictive models provided acceptableresults for most ice cream quality indices with exception of those referred to overrun, coolsensation, smoothness and sweetness, whose multiple R2 were lower than 0.500.
4. Conclusions
A preliminary comparative study of the freezing behavior of water and milk-basedmodel systems and ice cream mixtures was useful to individuate and understand the mainfreezing steps of the water crystallization kinetics and to highlight the strength of theinteractions occurring between the colligative solutes and free water molecules in the SSHEat the conditions required for the batch ice cream production. During the cooling of theice cream mixtures, more than one supercooling events occurred with lower temperaturefluctuations than in the two model systems. This is a consequence of the presence ofstabilizers and emulsifiers, which are responsible respectively for the increase of the bulkviscosity and for the extent of the destabilization of the milk fat globules. The whole coolingcurve was numerically analyzed and the derived parameters used as descriptors of themain freezing processes underlying the conversion of the colloidal structure of the icecream mixture into the soft-solid ice cream.
For the first time, the initial freezing point was numerically individuated in-situ start-ing from the experimental cooling curve registered inside the SSHE and it was identifiedas the point corresponding to the highest temperature reached after the first supercoolingevent. A re-parameterized Gompertz’s function was advantageously used to mathemati-cally describe the water crystallization kinetics together with some key kinetic properties.Time-temperature onsets discriminating heterogeneous nucleation, ice growth and air incor-poration were objectively determined by performing the first and second-order derivativeanalysis of the re-parameterized Gompertz’s model. Composition and freezing propertieswere treated as technological properties of the ice cream mixtures and were used as inputvariables in the multivariate analysis to classify the ice cream mixtures as a function of theirability to produce high-quality ice creams. Statistical models were developed and validatedto predict the final overrun, ice cream melting rate and some sensory attributes such asappearance, cool sensation, sweetness, meltdown, flavor intensity and flavor persistence.
Foods 2021, 10, 334 31 of 35
The proposed methodology represents a powerful and science-based approach over-coming the drawbacks of the usual methods based on trial-and-error assessment for settingice cream formulations and freezing time. The numerical analysis of the experimentaltime-temperature profiles acquired under dynamic freezing conditions could provide anaffordable decision-tool to opportunely select the starting ice cream mixture formulationsable to obtain the desired quality properties in the final product. It also represents the firststep to build robust predictive models of the ice cream quality indices to be transferred atthe industrial level with the perspective to develop a computer-aided tool able to supportthe managing of the freezing time during batch ice cream production. Obviously, thesuccessive step is to collect a large data set of cooling data accounting for a greater numberof ice cream ingredients and their combinations.
Author Contributions: P.G.: He conceived the idea of nondestructive temperature monitoring insidethe scraped-surface freezer; He oversaw overall direction and planning of the experiments. A.B.:She provided an extensive contribution on drafting and provided critical revision of the article. P.C.:She contributed to the design of the experiments; She manufactured the samples and carried outall the experiments; She aided in interpreting the results and contributed to the manuscript. L.D.V.:She conceived and planned training of the sensory panel; She contributed to sample preparation.B.G.: He aided in interpreting the results and provided critical revision of the article. P.M.F.: Hedesigned the models and the computational framework and analyzed the data; He took over most ofdata interpretation, designed the figures, wrote the manuscript and revised it critically for importantintellectual content. All authors provided critical feedback and helped shape the research, analysisand manuscript. All authors have read and agreed to the published version of the manuscript.
Funding: This research received no external funding.
Institutional Review Board Statement: Not applicable.
Informed Consent Statement: Informed consent was obtained from all subjects involved in the study.
Data Availability Statement: Not applicable.
Conflicts of Interest: This manuscript has not been submitted to, nor is under review at, anotherjournal or other publishing venue. The authors have no affiliation with any organization with a director indirect financial interest in the subject matter discussed in the manuscript.
Abbreviations
CLrate, Chilling Ratethe Newtonian cooling rate, that is, the rate at which thesolution experiences a decrease in temperature without icenucleation and growth.
[DEXTR]the initial concentration (% by weight) of the dextrose in theICM.
[HYD]
the initial concentration (% by weight) of all hydrocolloids inthe ICM (i.e., maltodextrin, inulin, sucrose esters,carrageenan, Tara seed flour and carboxymethylcellulosearising from the multicomponent basis used in theformulation of the ice cream mixtures).
[FAT] the initial concentration of fat in the ICM.
FP, Freezing Point (C)
the equilibrium freezing temperature experienced by theWBMS, at which the ice crystal starts to growth with asteady-state kinetics (i.e., without changes in temperature): itwas determined as the highest temperature after the uniquesupercooling event as registered by the lowest experimentaltemperature.
Foods 2021, 10, 334 32 of 35
FPD, Freezing PointDepression (C)
the fall of the equilibrium freezing temperature below 0 Cdue to the presence of colligative solutes.
FPt, TheoreticalFreezing Point
the theoretical equilibrium freezing temperature that theWBMS can virtually experience on cooling if they wouldbehave as a pure sucrose solution having an equivalentconcentration of sucrose.
GRmax
the maximum rate (1/min) of the water crystallization (orequivalently, the maximum Growth Rate of the ice crystals)that takes place during batch ice cream production.
Gpz′first derivative function of the re-parameterized Gompertz’smodel.
Gpz,′ ′second derivative function of the re-parameterizedGompertz’s model.
Gpz′ ′ ′third derivative function of the re-parameterized Gompertz’smodel.
GRtime the freezing time corresponding to GRmax.GRT the freezing temperature corresponding to GRmax.
HNT, HeterogeneousNucleation Time
the time length (min) required to form stable ice nucleithrough one (as experienced by the WBMS) or more thanone (as experienced by the MBMS and ICM) supercoolingevents before to reach respectively FP or IFP.
HSC, High SugarContent
ice cream mixture prepared with the highest content of thecolligative sugars.
ICM Ice Cream Mixture.
IFP, Initial FreezingPoint (C)
the first equilibrium freezing temperature experiencedduring cooling by the investigated MBMS and ICM (it wasdetermined as the highest temperature after the firstsupercooling event as registered on the experimental coolingcurve).
IFPeff, Effective InitialFreezing Point (C)
the equilibrium freezing temperature at which the watercrystallization kinetics is at its acceleration point, after theheterogeneous nucleation step and where the ice starts toaccumulate significantly and extensively in the ICM (it wasestimated by using the re-parameterized Gompertz’ model).
IFPt, TheoreticalFreezing Point
the theorical equilibrium freezing temperature that theinvestigated MBMS and ICM can experience virtually if theywould behave on cooling as a pure sucrose solution havingan equivalent concentration of sucrose.
ILP
Interaction Linear Plot obtained by linear regression analysisof the experimental data corresponding to the inverse valuesof the freezing point depression (x-data) and the ratiobetween Mw/Ms (y-data).
IS, Initial Supercooling(C)
the maximum temperature depression below 0 Cexperienced on cooling by the investigated MBMS and ICMat the point corresponding to the first ice nuclei formation.
LAGTIME the time at which melting of the ice cream accelerates.LSC, Low SugarContent
ice cream mixture prepared with the lowest total sugarcontent.
Foods 2021, 10, 334 33 of 35
MBMSMilk-based model systems (i.e., MSUCR, MSUCR +MDEXTR, MDEXTR, MSORB).
m0 the total mass of the ice cream.mD the mass of the drip loss during melting of the ice cream.Mrate the maximum rate (1/min) of the ice cream melting.
Msthe concentration of the sucrose equivalents (expressed asg/100 of water) corresponding to all the colligative solutes.
MSC, MSC1, MSC2,MSC3 and MSC4
Medium Sugar Content: ice cream mixtures prepared withthe same intermediate total sugar content but varying theconcentration of the individual sugar added as sweeteners,that is, sucrose, dextrose and sorbitol.
MSNF, Milk SolidsNon-Fat
they include all solids in milk other than fat in the ICM.
MSUCR, MDEXT,MSORB
milk-based model systems prepared by adding 300 g ofsucrose or dextrose or sorbitol to 1000 g of whole milk,respectively.
MSUCR + MDEXTRmilk-based model systems prepared by adding 150 g ofsucrose and 150 g of dextrose to 1000 g of whole milk.
Mwthe mass fraction (% by weight) of the initial water of theICM.
nthe number of time-temperature data registered by thePT100 probe inside the SSHE.
NUR, Nucleation Rate(C/min)
the rate of formation of unstable ice nuclei in the uniquesupercooling domain (as experienced by the WBMS) or inthe first supercooling domain (as experienced by the MBMSand ICM).
S, Supercooling (C)the maximum temperature depression below 0 C requiredby the water to begin crystallization in the WBMS.
[SE]
the concentration (% by weight) of the sucrose equivalents ascalculated by summing the individual contribute of allcolligative solutes present in a given solution, provided thatthe it would behave as a pure sucrose solution (“sucroseequivalency” was derived for a comparison of the meanmolecular weights for each colligative solute with that of thesucrose).
[SORB]the initial concentration (% by weight) of the sorbitol in theICM.
SSHEScraped-Surface Heat Exchanger used for batch ice creamproduction.
[SUCR] the concentration (% by weight) of the sucrose.
Texp(t)the experimental temperature (C) at a given time (t)registered by the PT100 inside the SSHE.
TCL (t)
the theoretical temperature (C) at a given time (t), thateither the MBMS and the ICM would experience under apure Newtonian cooling process, that is, without experienceice nucleation and ice growth.
Foods 2021, 10, 334 34 of 35
Texitthe temperature (C) at which the ice cream exits from theSSHE.
TP1
First target point: the temperature at which the formation ofunstable clusters of ice nuclei begins and the cooling curvestarts to deviate from its linear trend experienced during thechilling step of cooling: it was estimated by determining theminimum significant difference between the experimentaltemperature Texp(t) and the theoretical temperature TCL (t).
TS, Total Solidsthe total mass fraction (% by weight) that includes all solidsthat are present in the WBMS, MBMS and ICM.
tTexit the time (min) corresponding to Texit.tTwhipp the time (min) corresponding to Twhipp.
Twethe temperature (C) corresponding to the intermediate timebetween Twhipp and Texit.
Twhipp
the temperature (C) at which the water crystallizationkinetics is at its decelerating point and air incorporationstarts to dominate on the ice growth (it was estimated byusing the re-parameterized Gompertz’ model).
WBMSWater-based model systems (i.e., WSUCR, WSUCR +WSORB, WDEXTR, WSORB)
WF(t), Freezable WaterFraction (%)
the time-dependent changes in mass fraction (% by weight)of the water initially present in the ICM and that can bevirtually converted in the ice during freezing under batchSSHE conditions, as estimated by using the re-parameterizedGompertz’s function.
WF(t)exp, ExperimentalFreezable WaterFraction
the time-dependent changes in mass fraction (% by weight)of the water initially present in the ICM and that can bevirtually converted in the ice during freezing under batchSSHE conditions, as estimated by coupling the experimentaltime-temperature data to the reverse relationship betweenthe freezing point depression values tabulated for puresucrose solutions with different sucrose concentrations andthe corresponding mass fraction of the initial water that canbe converted in the ice.
WFmax the upper asymptotic level of WF(t).
Wice creamthe weight of a standard volume of the just extruded icecream (used for overrun measurements).
Wmixture
the weight of the ice cream mixture after agingcorresponding to the same volume of Wice cream (used foroverrun measurements).
WSUCR, WDEXT,WSORB
water-based model systems prepared by adding 300 g ofsucrose or dextrose or sorbitol to 1000 g of water,respectively.
WSUCR + WSORBwater-based model systems prepared by adding 150 g ofsucrose and 150 g of sorbitol to 1000 g of water.
∆FP the difference between the FPt and FP.
References1. Allied Market Research. Ice Cream Market by Product Type (Impulse Ice Cream, Take-Home Ice Cream and Artisanal Ice Cream):
Global Opportunity Analysis and Industry Forecast, 2017–2023. 2017. Available online: https://www.alliedmarketresearch.com/press-release/ice-cream-market.html (accessed on 17 July 2020).
2. Chernyshova, M.P.; Pristenskiy, D.V.; Lozbiakova, M.V.; Chalyk, N.E.; Bandaletova, T.Y.; Petyaev, I.M. Systemic and skin-targetingbeneficial effects of lycopene-enriched ice cream: A pilot study. J. Dairy Sci. 2019, 102, 14–25. [CrossRef]
3. Solieri, L.; De Vero, L.; Tagliazucchi, D. Peptidomic study of casein proteolysis in bovine milk by Lactobacillus casei PRA205 andLactobacillus rhamnosus PRA331. Int. Dairy J. 2018, 85, 237–246. [CrossRef]
Foods 2021, 10, 334 35 of 35
4. Chiari, P.; Pulvirenti, A.; Giudici, P. Cold dessert: Criteria for their classification. Ind. Alim. 2016, 55, 11–18.5. Goff, H.D.; Hartel, W.R. Ice Cream; Springer: Berlin/Heidelberg, Germany, 2013. [CrossRef]6. Goff, H. Colloidal aspects of ice cream—A review. Int. Dairy J. 1997, 7, 363–373. [CrossRef]7. Dwórznicka, A.K.; Gondek, E.; Laba, S.; Jacubczyk, E.; Samborska, K. Characteristics of Instrumental methods to describe and
asses the recrystallization process in ice cream systems. Foods 2019, 8, 117. [CrossRef] [PubMed]8. Mo, J.; Guo, E.; McCartney, D.G.; Eastwood, D.S.; Bent, J.; Van Dalen, G.; Schuetz, P.; Rockett, P.; Lee, P.D. Time-Resolved
Tomographic Quantification of the Microstructural Evolution of Ice Cream. Materials 2018, 11, 2031. [CrossRef] [PubMed]9. Adapa, S.; Schmidt, K.A.; Jeon, I.J.; Herald, T.J.; Flores, R.A. Mechanisms of ice crystallization and recrystallization in ice cream:
A review. Food Rev. Int. 2000, 16, 259–271. [CrossRef]10. Toker, O.S.; Karaman, S.; Yuksel, F.; Dogan, M.; Kayacier, A.; Yilmaz, M.T. Temperature Dependency of Steady, Dynamic, and
Creep-Recovery Rheological Properties of Ice Cream Mix. Food Bioprocess Technol. 2013, 6, 2974–2985. [CrossRef]11. Da Silva Junior, E.; Da Silva Lannes, S.C. Effect of different sweetener blends and fat types on ice cream properties. Food Sci.
Technol. 2011, 31, 217–220. [CrossRef]12. Cook, K.; Hartel, R.W. Mechanisms of Ice Crystallization in Ice Cream Production. Compr. Rev. Food Sci. Food Saf. 2010, 9, 213–222.
[CrossRef]13. Cebula, D.J.; Russell, A.B. Ice Crystallization Control in Ice Cream. In Proceedings of the International Dairy Federation
international ice cream symposium, Brussels, Belgium, 18–19 September 1998.14. Roos, Y.H. Phase Transitions in Foods. Phase Transit. Foods 1995, 43. [CrossRef]15. Lakhdar, B.M.; Cerecero, R.; Alvarez, G.; Guilpart, J.; Flick, D.; Lallemand, A. Heat transfer with freezing in a scraped surface
heat exchanger. Appl. Therm. Eng. 2005, 25, 45–60. [CrossRef]16. Sodawala, S.; Garside, J. Ice Nucleation on A Cold Surface. In Proceedings of the 1997 Jubilee Research Event, Nottingham, UK,
8–9 April 1997; Institution of Chemical Engineers: Rugby, UK, 1997; pp. 477–480.17. Bolliger, S.; Wildmoser, H.; Kung, B.; Tharp, B. Relationships between ice cream mix viscoelasticity and ice crystal growth in ice
cream. Int. Dairy J. 2000, 10, 791–797. [CrossRef]18. Ndoye, F.; Alvarez, G. Characterization of ice recrystallization in ice cream during storage using the focused beam reflectance
measurement. J. Food Eng. 2015, 148, 24–34. [CrossRef]19. Potter, R.W.; Clynne, M.A.; Brown, D.L. Freezing point depression of aqueous sodium chloride solutions. Econ. Geol. 1978, 73,
284–285. [CrossRef]20. Gorry, P.A. General least-squares smoothing and differentiation by the convolution (Savitzky-Golay) method. Anal. Chem. 1990,
62, 570–573. [CrossRef]21. Omran, A.M.; King, C.J. Kinetics of ice crystallization in sugar solutions and fruit juices. AIChE J. 1974, 20, 795–803. [CrossRef]22. Schwartzberg, H.G.; Liu, Y. Ice crystal growth on chilled scraped surfaces. In Proceedings of the American Institute of Chemical
Engineers Summer National Meeting, San Diego, CA, USA, 19–22 August 1990; pp. 19–22.23. Uraji, T.; Kohno, H.; Yoshimura, H.; Shimoyamada, M.; Watanabe, K. Freezing Point Depression of Polyol-Aqueous Solutions in
the High Concentration Range. Food Sci. Technol. Int. Tokyo 1996, 2, 38–42. [CrossRef]24. Jaskulka, F.J.; Smith, D.E.; Larntz, K. Comparison of the Predictive Ability of Ice Cream Freezing Point Depression Equations.
Milchwissenschaft 1993, 48, 671–675.25. Kobayashi, A.; Shirai, Y.; Nakanishi, K.; Matsuno, R. A method for making large agglomerated ice crystals for freeze concentration.
J. Food Eng. 1996, 27, 1–15. [CrossRef]26. Pradipasena, P.; Tattiakul, J.; Nakamura, K.; Miyawaki, O.; Anuntagool, J. Temperature Dependence of Fraction of Frozen Water
in Solutions of Glucose and its Oligomers, Dextrans, and Potato Starch. Food Sci. Technol. Res. 2007, 13, 286–290. [CrossRef]27. Rahman, M.S.; Guizani, N.; Al-Khaseibi, M.; Al-Hinai, S.A.; Al-Maskri, S.S.; Al-Hamhami, K. Analysis of cooling curve to
determine the end point of freezing. Food Hydrocoll. 2002, 16, 653–659. [CrossRef]28. Qin, F.; Chen, X.D.; Ramachandra, S.; Free, K. Heat transfer and power consumption in a scraped-surface heat exchanger while
freezing aqueous solutions. Sep. Purif. Technol. 2006, 48, 150–158. [CrossRef]29. Koxholt, M.; Eisenmann, B.; Hinrichs, J. Effect of the Fat Globule Sizes on the Meltdown of Ice Cream. J. Dairy Sci. 2001, 84, 31–37.
[CrossRef]30. Muse, M.; Hartel, R. Ice Cream Structural Elements that Affect Melting Rate and Hardness. J. Dairy Sci. 2004, 87, 1–10. [CrossRef]