An Analysis of elastic and inelastic lateral torsional buckling of ...
6
* Corresponding author: [email protected] An Analysis of elastic and inelastic lateral torsional buckling of web-tapered I beams using the finite element method Paulus Karta Wijaya 1,* , Cecilia Lauw Giok Swan 1 , and Ghassani Sadrina Noor 2 1 Universitas Katolik Parahyangan, Civil Engineering Department, Bandung, Indonesia 2 Waskita Karya, Jakarta, Indonesia Abstract. Elastic and inelastic lateral torsional buckling of simply web tapered I beam is studied using the finite element method. The length of the beams is 8000 mm for elastic lateral torsional buckling and 4000 mm for inelastic lateral torsional buckling. The depth of cross section at one end is 500 mm and at the other end it is varied. The thickness of the flange is 16 mm and the thickness of the web is 10 mm. The section of the beams is compact. The beams are loaded by end moments. The ratio of end moments at one end and the moments at the other end are varied. The beams are assumed to have geometric imperfection and the distribution of imperfection follows the shape of the first buckling mode of elastic lateral torsional buckling of the beam. The amplitude of the imperfection is taken one milimeter at the top flange in lateral direction. The load is increased until the beams collapse. The ultimate load is considered as the critical moments of the beams. The results of the analysis are compared to nominal lateral torsional buckling moments using the method presented in the AISC Design Guide 25 (Design Guide for web tapered members). It can be concluded that usually the critical moments of the collapse analysis are close to the critical moments of the design guide. But sometimes it is less than the design guide and it means design guide is sometimes is not on the safe side. 1 Introduction Web tapered steel beams are usually used due to economic aspects. In beam design, one of the consideration is lateral torsional buckling. Study of lateral torsional buckling of web tapered I beams has been made by many researchers. Polyzois [1] studied the modification factor using FEM. The analysis consists of the elastic buckling analysis. Miller [2] studied lateral torsional buckling of web tapered I beams using non- linear finite element method. J.S Park et al [3] studied lateral torsional buckling of stepped beams using the linear finite element method. Vandermeulen et al [4] studied lateral torsional buckling of tapered beams using the linear and nonlinear finite element method, but residual stress was not considered. Zhang and Tong [5] developed a new theory for lateral torsional buckling of web tapered I beams. They formulated total potential energy for lateral torsional buckling of elastic I beams and used the classical variational principle for buckling analysis. Raftoyiannis and Adamakos [6] developed a simple numerical approach for determining elastic critical lateral torsional buckling. Kovac,M. [7] studied elastic lateral torsional buckling of web tapered I beams using the 1D and 3D FEM method. He developed the 1D element and compared it to the 3D shell element model. Naaim et al [8] studied lateral torsional buckling behaviour of the web tapered section with perforation using the finite element method. Patil [9] studied lateral torsional buckling of web tapered cantilever beams using the finite element method. This paper presents the results of a study about lateral torsional buckling of web tapered I beams loaded by end moments. The cross section of the beam is the compact section. The method of analysis is the finite element method. The beam, modelled by the finite element method, is loaded by incremental load until they collapse. For the buckling analysis, geometric imperfection of the beams must be introduced. The residual stress is taken into account. The results of analysis are compared with the critical moment computed using the AISC Steel Design Guide 25. 2 AISC Design Guide 25 The AISC Design Guide 25 (DG 25) [10] provides a method to design web tapered members. In the design guide, there is a method to evaluate the lateral torsional buckling strength of tapered beams. The procedure is ,0 (2019) MATEC Web of Conferences https://doi.org/10.1051/matecconf/20192 258 5805001 SCESCM 2018 01 50 © The Authors, published by EDP Sciences. This is an open access article distributed under the terms of the Creative Commons Attribution License 4.0 (http://creativecommons.org/licenses/by/4.0/).
-
Upload
khangminh22 -
Category
Documents
-
view
1 -
download
0
Transcript of An Analysis of elastic and inelastic lateral torsional buckling of ...

* Corresponding author: [email protected]
An Analysis of elastic and inelastic lateral torsional buckling of web-tapered I beams using the finite element method
Paulus Karta Wijaya1,*, Cecilia Lauw Giok Swan1, and Ghassani Sadrina Noor2
1Universitas Katolik Parahyangan, Civil Engineering Department, Bandung, Indonesia 2Waskita Karya, Jakarta, Indonesia
Abstract. Elastic and inelastic lateral torsional buckling of simply web tapered I beam is studied
using the finite element method. The length of the beams is 8000 mm for elastic lateral torsional
buckling and 4000 mm for inelastic lateral torsional buckling. The depth of cross section at one end
is 500 mm and at the other end it is varied. The thickness of the flange is 16 mm and the thickness
of the web is 10 mm. The section of the beams is compact. The beams are loaded by end moments.
The ratio of end moments at one end and the moments at the other end are varied. The beams are
assumed to have geometric imperfection and the distribution of imperfection follows the shape of
the first buckling mode of elastic lateral torsional buckling of the beam. The amplitude of the
imperfection is taken one milimeter at the top flange in lateral direction. The load is increased until
the beams collapse. The ultimate load is considered as the critical moments of the beams. The
results of the analysis are compared to nominal lateral torsional buckling moments using the method
presented in the AISC Design Guide 25 (Design Guide for web tapered members). It can be
concluded that usually the critical moments of the collapse analysis are close to the critical moments
of the design guide. But sometimes it is less than the design guide and it means design guide is
sometimes is not on the safe side.
1 Introduction
Web tapered steel beams are usually used due to
economic aspects. In beam design, one of the
consideration is lateral torsional buckling. Study of
lateral torsional buckling of web tapered I beams has
been made by many researchers. Polyzois [1] studied the
modification factor using FEM. The analysis consists of
the elastic buckling analysis. Miller [2] studied lateral
torsional buckling of web tapered I beams using non-
linear finite element method. J.S Park et al [3] studied
lateral torsional buckling of stepped beams using the
linear finite element method. Vandermeulen et al [4]
studied lateral torsional buckling of tapered beams using
the linear and nonlinear finite element method, but
residual stress was not considered. Zhang and Tong [5]
developed a new theory for lateral torsional buckling of
web tapered I beams. They formulated total potential
energy for lateral torsional buckling of elastic I beams
and used the classical variational principle for buckling
analysis. Raftoyiannis and Adamakos [6] developed a
simple numerical approach for determining elastic
critical lateral torsional buckling. Kovac,M. [7] studied
elastic lateral torsional buckling of web tapered I beams
using the 1D and 3D FEM method. He developed the 1D
element and compared it to the 3D shell element model.
Naaim et al [8] studied lateral torsional buckling
behaviour of the web tapered section with perforation
using the finite element method. Patil [9] studied lateral
torsional buckling of web tapered cantilever beams using
the finite element method.
This paper presents the results of a study about lateral
torsional buckling of web tapered I beams loaded by end
moments. The cross section of the beam is the compact
section. The method of analysis is the finite element
method. The beam, modelled by the finite element
method, is loaded by incremental load until they
collapse. For the buckling analysis, geometric
imperfection of the beams must be introduced. The
residual stress is taken into account. The results of
analysis are compared with the critical moment
computed using the AISC Steel Design Guide 25.
2 AISC Design Guide 25
The AISC Design Guide 25 (DG 25) [10] provides a
method to design web tapered members. In the design
guide, there is a method to evaluate the lateral torsional
buckling strength of tapered beams. The procedure is
, 0 (2019)MATEC Web of Conferences https://doi.org/10.1051/matecconf/20192258 5805001SCESCM 2018
01 50
© The Authors, published by EDP Sciences. This is an open access article distributed under the terms of the Creative Commons Attribution License 4.0 (http://creativecommons.org/licenses/by/4.0/).
presented briefly in this paper and the result of using this
design guide will be compared to the result of the finite
element analysis. The method of DG 25 presented here is
only for doubly symmetric and compact sections.
First elastic lateral torsional buckling stress, eLTBF ,
is calculated using equation (1) and section properties at
the middle of the unbraced length.
( )
2
2
2
078.01/
+
=
t
b
oxtb
eLTBr
L
hS
J
rL
EF (1)
E stands for the modulus of elasticity, Lb is unbraced
length, rt is effective radius gyration for lateral torsional
buckling, J is torsional constant, Sx is section modulus
about strong axis, ho is distance between flange
centroids.
Determine the location of maximum compressive
flexural stress, maxrf , within the unbraced length. At
this location, calculate the nominal buckling stress
multiplier, eLTB which is equal to max/ reLTB fF .
Calculate the nominal moment, Mn , at various location
along the unbraced length using the following equation
If ( )
2.81.1
2
=
y
reLTB
F
fγ the lateral torsional buckling
limit state does not apply.
If ( )
7.02.8 y
reLTB
F
fγ calculate the nominal lateral
torsional buckling strength
( )xyppn SFMMM 7.03767.0 −−=
( )
−
1.1
reLTB
y
f
F (2)
If ( )
7.0
y
reLTB
F
f
( ) xreLTBbn SfCM = (3)
Cb is the lateral torsional buckling modification factor
for nonuniform moment diagram, fr is flexural stress at
the location considered.
3 Problem statement
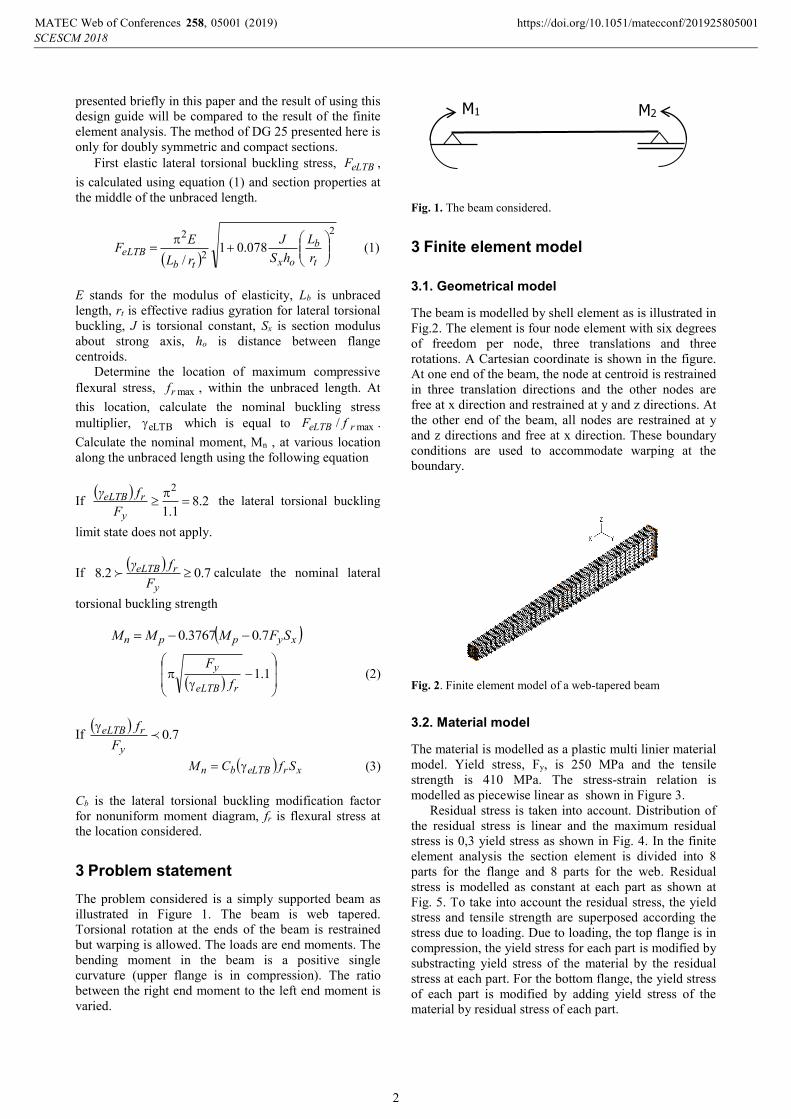
The problem considered is a simply supported beam as
illustrated in Figure 1. The beam is web tapered.
Torsional rotation at the ends of the beam is restrained
but warping is allowed. The loads are end moments. The
bending moment in the beam is a positive single
curvature (upper flange is in compression). The ratio
between the right end moment to the left end moment is
varied.
Fig. 1. The beam considered.
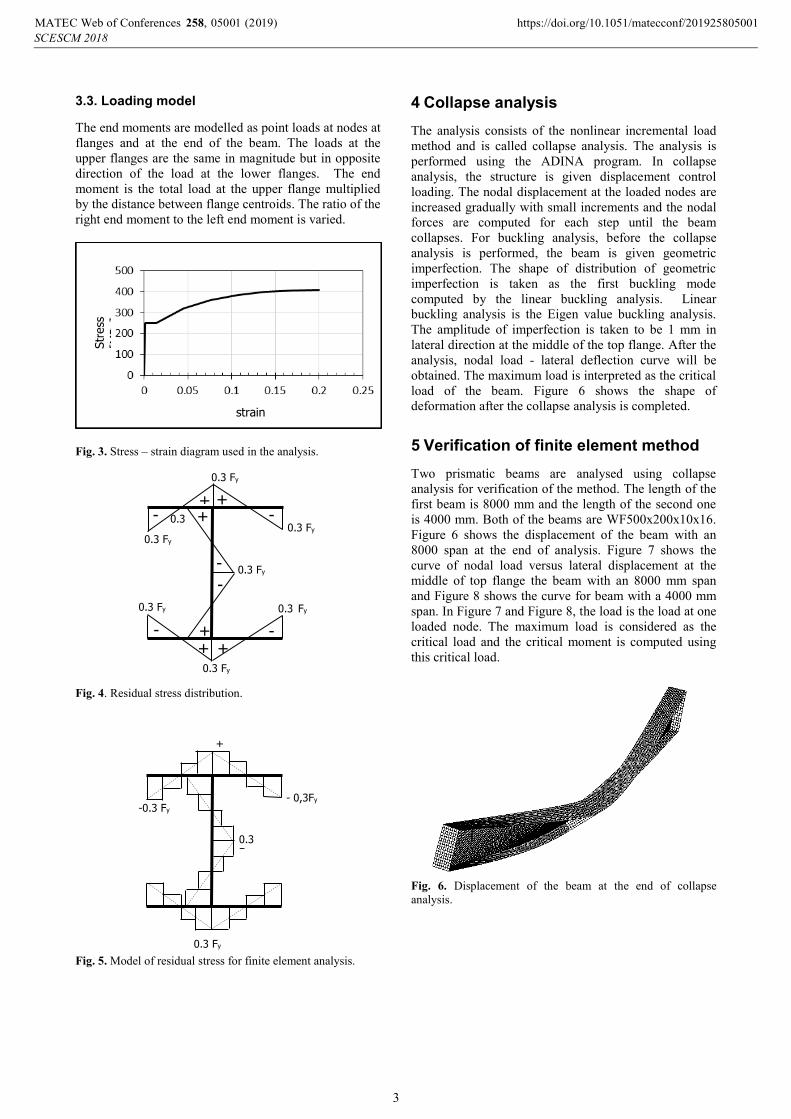
3 Finite element model
3.1. Geometrical model
The beam is modelled by shell element as is illustrated in
Fig.2. The element is four node element with six degrees
of freedom per node, three translations and three
rotations. A Cartesian coordinate is shown in the figure.
At one end of the beam, the node at centroid is restrained
in three translation directions and the other nodes are
free at x direction and restrained at y and z directions. At
the other end of the beam, all nodes are restrained at y
and z directions and free at x direction. These boundary
conditions are used to accommodate warping at the
boundary.
Fig. 2. Finite element model of a web-tapered beam
3.2. Material model
The material is modelled as a plastic multi linier material
model. Yield stress, Fy, is 250 MPa and the tensile
strength is 410 MPa. The stress-strain relation is
modelled as piecewise linear as shown in Figure 3.
Residual stress is taken into account. Distribution of
the residual stress is linear and the maximum residual
stress is 0,3 yield stress as shown in Fig. 4. In the finite
element analysis the section element is divided into 8
parts for the flange and 8 parts for the web. Residual
stress is modelled as constant at each part as shown at
Fig. 5. To take into account the residual stress, the yield
stress and tensile strength are superposed according the
stress due to loading. Due to loading, the top flange is in
compression, the yield stress for each part is modified by
substracting yield stress of the material by the residual
stress at each part. For the bottom flange, the yield stress
of each part is modified by adding yield stress of the
material by residual stress of each part.
M1 M2
, 0 (2019)MATEC Web of Conferences https://doi.org/10.1051/matecconf/20192258 5805001SCESCM 2018
01 50
2
3.3. Loading model
The end moments are modelled as point loads at nodes at
flanges and at the end of the beam. The loads at the
upper flanges are the same in magnitude but in opposite
direction of the load at the lower flanges. The end
moment is the total load at the upper flange multiplied
by the distance between flange centroids. The ratio of the
right end moment to the left end moment is varied.
Fig. 3. Stress – strain diagram used in the analysis.
Fig. 4. Residual stress distribution.
Fig. 5. Model of residual stress for finite element analysis.
4 Collapse analysis
The analysis consists of the nonlinear incremental load
method and is called collapse analysis. The analysis is
performed using the ADINA program. In collapse
analysis, the structure is given displacement control
loading. The nodal displacement at the loaded nodes are
increased gradually with small increments and the nodal
forces are computed for each step until the beam
collapses. For buckling analysis, before the collapse
analysis is performed, the beam is given geometric
imperfection. The shape of distribution of geometric
imperfection is taken as the first buckling mode
computed by the linear buckling analysis. Linear
buckling analysis is the Eigen value buckling analysis.
The amplitude of imperfection is taken to be 1 mm in
lateral direction at the middle of the top flange. After the
analysis, nodal load - lateral deflection curve will be
obtained. The maximum load is interpreted as the critical
load of the beam. Figure 6 shows the shape of
deformation after the collapse analysis is completed.
5 Verification of finite element method
Two prismatic beams are analysed using collapse
analysis for verification of the method. The length of the
first beam is 8000 mm and the length of the second one
is 4000 mm. Both of the beams are WF500x200x10x16.
Figure 6 shows the displacement of the beam with an
8000 span at the end of analysis. Figure 7 shows the
curve of nodal load versus lateral displacement at the
middle of top flange the beam with an 8000 mm span
and Figure 8 shows the curve for beam with a 4000 mm
span. In Figure 7 and Figure 8, the load is the load at one
loaded node. The maximum load is considered as the
critical load and the critical moment is computed using
this critical load.
Fig. 6. Displacement of the beam at the end of collapse
analysis.
strain
Str
ess
[MPa]
- 0,3Fy
+ 0.3Fy
-
0.3 Fy
0.3 Fy
0.3 Fy 0.3 Fy
0.3 Fy
+ - +
-
-
+
0.3 Fy 0.3 Fy
- - + 0.3 Fy
-0.3 Fy
+
+
0.3 Fy
0.3 Fy
, 0 (2019)MATEC Web of Conferences https://doi.org/10.1051/matecconf/20192258 5805001SCESCM 2018
01 50
3
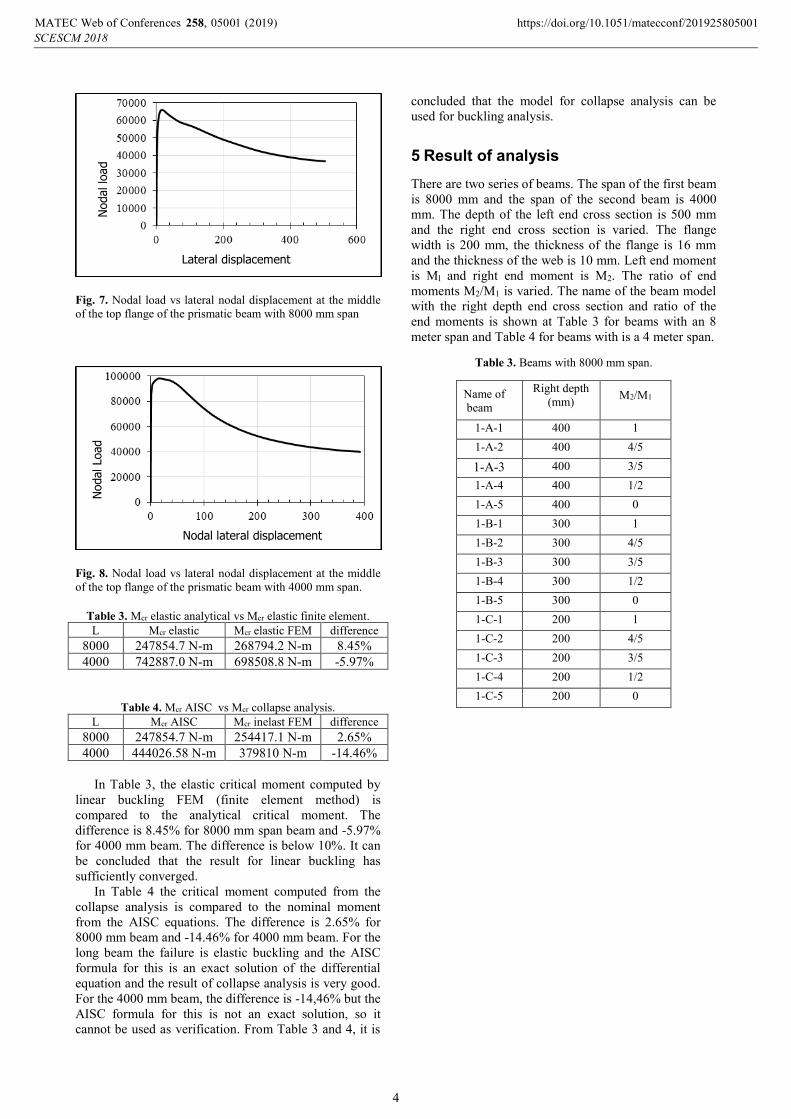
Fig. 7. Nodal load vs lateral nodal displacement at the middle
of the top flange of the prismatic beam with 8000 mm span
Fig. 8. Nodal load vs lateral nodal displacement at the middle
of the top flange of the prismatic beam with 4000 mm span.
Table 3. Mcr elastic analytical vs Mcr elastic finite element. L Mcr elastic Mcr elastic FEM difference
8000 247854.7 N-m 268794.2 N-m 8.45%
4000 742887.0 N-m 698508.8 N-m -5.97%
Table 4. Mcr AISC vs Mcr collapse analysis.
L Mcr AISC Mcr inelast FEM difference
8000 247854.7 N-m 254417.1 N-m 2.65%
4000 444026.58 N-m 379810 N-m -14.46%
In Table 3, the elastic critical moment computed by
linear buckling FEM (finite element method) is
compared to the analytical critical moment. The
difference is 8.45% for 8000 mm span beam and -5.97%
for 4000 mm beam. The difference is below 10%. It can
be concluded that the result for linear buckling has
sufficiently converged.
In Table 4 the critical moment computed from the
collapse analysis is compared to the nominal moment
from the AISC equations. The difference is 2.65% for
8000 mm beam and -14.46% for 4000 mm beam. For the
long beam the failure is elastic buckling and the AISC
formula for this is an exact solution of the differential
equation and the result of collapse analysis is very good.
For the 4000 mm beam, the difference is -14,46% but the
AISC formula for this is not an exact solution, so it
cannot be used as verification. From Table 3 and 4, it is
concluded that the model for collapse analysis can be
used for buckling analysis.
5 Result of analysis
There are two series of beams. The span of the first beam
is 8000 mm and the span of the second beam is 4000
mm. The depth of the left end cross section is 500 mm
and the right end cross section is varied. The flange
width is 200 mm, the thickness of the flange is 16 mm
and the thickness of the web is 10 mm. Left end moment
is Ml and right end moment is M2. The ratio of end
moments M2/M1 is varied. The name of the beam model
with the right depth end cross section and ratio of the
end moments is shown at Table 3 for beams with an 8
meter span and Table 4 for beams with is a 4 meter span.
Table 3. Beams with 8000 mm span.
Name of
beam
Right depth
(mm) M2/M1
1-A-1 400 1
1-A-2 400 4/5
1-A-3 400 3/5
1-A-4 400 1/2
1-A-5 400 0
1-B-1 300 1
1-B-2 300 4/5
1-B-3 300 3/5
1-B-4 300 1/2
1-B-5 300 0
1-C-1 200 1
1-C-2 200 4/5
1-C-3 200 3/5
1-C-4 200 1/2
1-C-5 200 0
Lateral displacement [mm]
Nodal lo
ad
[New
ton]
Nodal lateral displacement [mm]
Nodal Load
[New
ton]
, 0 (2019)MATEC Web of Conferences https://doi.org/10.1051/matecconf/20192258 5805001SCESCM 2018
01 50
4
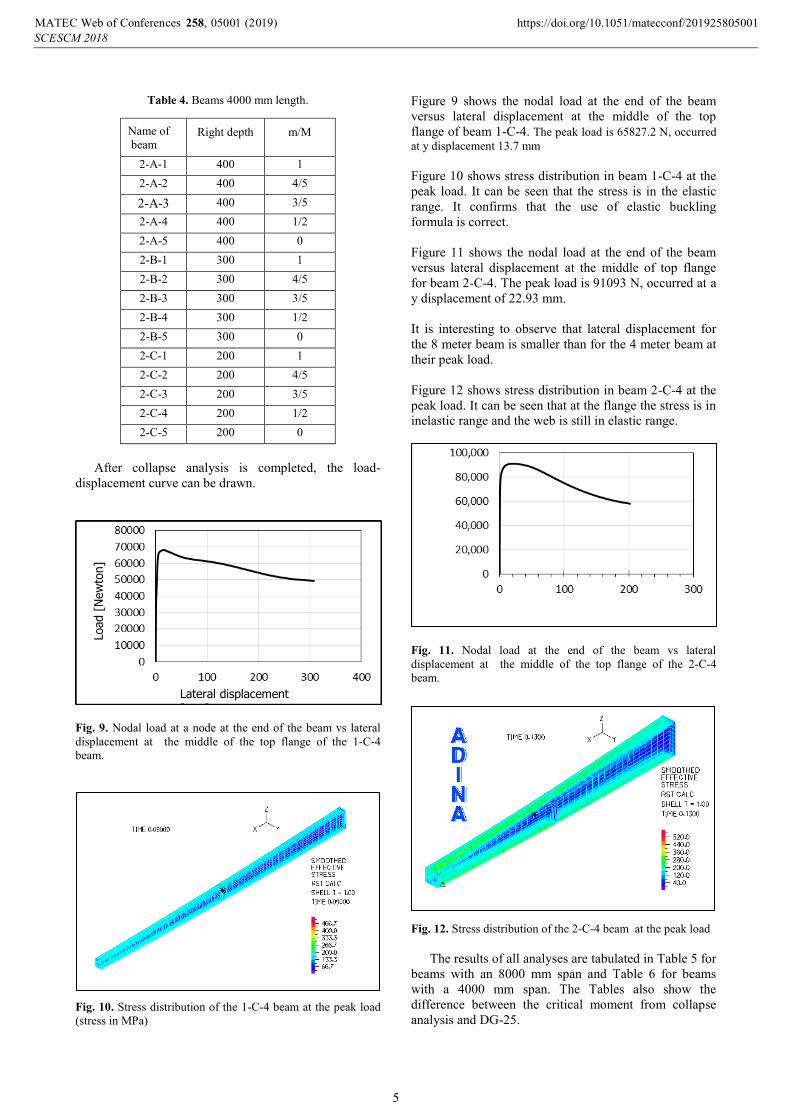
Table 4. Beams 4000 mm length.
Name of
beam Right depth m/M
2-A-1 400 1
2-A-2 400 4/5
2-A-3 400 3/5
2-A-4 400 1/2
2-A-5 400 0
2-B-1 300 1
2-B-2 300 4/5
2-B-3 300 3/5
2-B-4 300 1/2
2-B-5 300 0
2-C-1 200 1
2-C-2 200 4/5
2-C-3 200 3/5
2-C-4 200 1/2
2-C-5 200 0
After collapse analysis is completed, the load-
displacement curve can be drawn.
Fig. 9. Nodal load at a node at the end of the beam vs lateral
displacement at the middle of the top flange of the 1-C-4
beam.
Fig. 10. Stress distribution of the 1-C-4 beam at the peak load
(stress in MPa)
Figure 9 shows the nodal load at the end of the beam
versus lateral displacement at the middle of the top
flange of beam 1-C-4. The peak load is 65827.2 N, occurred
at y displacement 13.7 mm
Figure 10 shows stress distribution in beam 1-C-4 at the
peak load. It can be seen that the stress is in the elastic
range. It confirms that the use of elastic buckling
formula is correct.
Figure 11 shows the nodal load at the end of the beam
versus lateral displacement at the middle of top flange
for beam 2-C-4. The peak load is 91093 N, occurred at a
y displacement of 22.93 mm.
It is interesting to observe that lateral displacement for
the 8 meter beam is smaller than for the 4 meter beam at
their peak load.
Figure 12 shows stress distribution in beam 2-C-4 at the
peak load. It can be seen that at the flange the stress is in
inelastic range and the web is still in elastic range.
Fig. 11. Nodal load at the end of the beam vs lateral
displacement at the middle of the top flange of the 2-C-4
beam.
Fig. 12. Stress distribution of the 2-C-4 beam at the peak load
The results of all analyses are tabulated in Table 5 for
beams with an 8000 mm span and Table 6 for beams
with a 4000 mm span. The Tables also show the
difference between the critical moment from collapse
analysis and DG-25.
Load [
New
ton]
Lateral displacement [mm]
, 0 (2019)MATEC Web of Conferences https://doi.org/10.1051/matecconf/20192258 5805001SCESCM 2018
01 50
5

Table 5. Analysis result of beams with an 8000 mm span
Beam End moment
Ratio Collapse DG-25
Difference
[%]
1-A-1 1 230462400 238079609 3.3
1-A-2 0.8 256316800 257992082 0.7
1-A-3 0.6 287596800 289413623 0.6
1-A-4 0.5 305527600 307297656 0.6
1-A-5 0 394435600 466586941 18.3
1-B-1 1 213843600 196712044 -8.0
1-B-2 0.8 250683200 228350469 -8.9
1-B-3 0.6 276210400 271386705 -1.7
1-B-4 0.5 293778000 298498517 1.6
1-B-5 0 382925600 420322501 9.7
1-C-1 1 185008000 158696402 -14.2 1-C-2 0.8 216705200 188852495 -12.9 1-C-3 0.6 252602000 232262157 -8.1 1-C-4 0.5 272165600 260017822 -4.5 1-C-5 0 368044000 420390179 14.2
Table 6. Analysis result of beams with a 4000 mm span
Beam End
moment Ratio
Collapse DG-25 Difference
[%]
2-A-1 1 347162000 358732789 3.33 2-A-2 0.8 389045600 407908543 4.85 2-A-3 0.6 434292000 481429079 10.85 2-A-4 0.5 457244000 437994830 -4.21 2-A-5 0 557056000 524090000 -5.92 2-B-1 1 294443600 272090000 -7,59 2-B-2 0.8 344190000 340112500 -1.18 2-B-3 0.6 409880000 453483333 4.50 2-B-4 0.5 418188000 521441333 24.7 2-B-5 0 533516000 524090000 1.77 2-C-1 1 216802800 164840000 -23.9 2-C-2 0.8 261571200 206050000 -21.2 2-C-3 0.6 324888400 274680000 -15.4 2-C-4 0.5 364371200 329680000 -9.5 2-C-5 0 505964000 437100977 -13.6
6 Discussion
From Table 5, it can be seen that for beams with an 8000
mm span, most of the critical moments from the collapse
analysis are close to the critical moment from DG-25.
For beam with an 8000 mm span, elastic buckling
formula governs the calculation of the critical moment
and the results of collapse analysis also show that the
stresses at peak load is still in elastic range. The
difference of critical moments computed using the
design guide and the collapse analysis is between -14.2%
to 18.3%. The minus sign means that the DG-25 critical
moment is less than critical moment in the collapse
analysis. If it is assumed that the collapse analysis is the
real one, minus sign means the DG-25 is on the safe
side. For Beams 1-A-5 and 1-C-5 the difference is high
and not on the safe side.
From Table 6, it can be seen that for beams with a
4000 mm span, the critical moment computed by the
collapse analysis is generally greater than the critical
moment of DG-25. The difference is between -23.9% to
24.7%. There is only one beam that the critical moments
of DG-25 is higher and not on the safe side. For beams
with a 4000 mm span, inelastic buckling formula
governs the calculation of the critical moment. The result
of the collapse analysis also shows that the stresses at the
peak load at the flange are in inelastic range.
It can be said that, the DG-25 is usually close to the
collapse analysis and on the safe side, but sometimes it is
higher and not on the safe side. Moreover the critical
moment for the long beam using design guide is more
accurate than for the short beam.
7 Conclusion
The collapse analysis have been made on a series of
web-tapered beams and the conclusions drawn from this
study are,
1. The critical moment for the long beam which is
computed by elastic buckling formula of DG25
is usually close to the collapse analysis but
sometimes it is higher and not on the safe side.
2. The critical moment for the long beam which is
computed by DG25 is more accurate than the
critical moment for the short beam.
The authors wish to thank Parahyangan Catholic University for
its permission to use the licensed Adina Program.
References
1. D. Polyzois, I.G. Raftoyiannis, J. Of Struct. Eng. ,
124, 1208-1216 (1998)
2. B.S. Miller, Thesis, Univ. of Pittsburgh, (2002)
3. J.S. Park, J. M. Stalling, J. Of Struct. Eng. , 129
1457-1465, (2003)
4. T. Vandermeulen, J.P. Jaspart, N. Boissonnade, 5th
Int.Conf. on Adv. In Steel Struct., Singapore,
(2007).
5. L. Zhang, G. S., Tong, J. Constr. Steel Research, 64,
1379-1393, (2008)
6. I.G. Raftoyiannis, T. Adamakos, Op. Constr. And
Build. Tech. J. E 4, 105-112, (2010)
7. M. Kovac, Procedia Engineering, 40 , 217-222,
(2012).
8. Naaim N, F. De’nan, K.K. Choong, F. Azar, MAT.
Web of Conf. , 47 (2016)
9. T. Patil, N.L. Shelke, J. Of Steel Struc. And Constr.,
2 :2 (2016)
10. R.C. Kaehler, AISC Design Guide 25. (2011)
, 0 (2019)MATEC Web of Conferences https://doi.org/10.1051/matecconf/20192258 5805001SCESCM 2018
01 50
6