An advanced multivariate approach for processing X-ray fluorescence spectral and hyperspectral data...
9
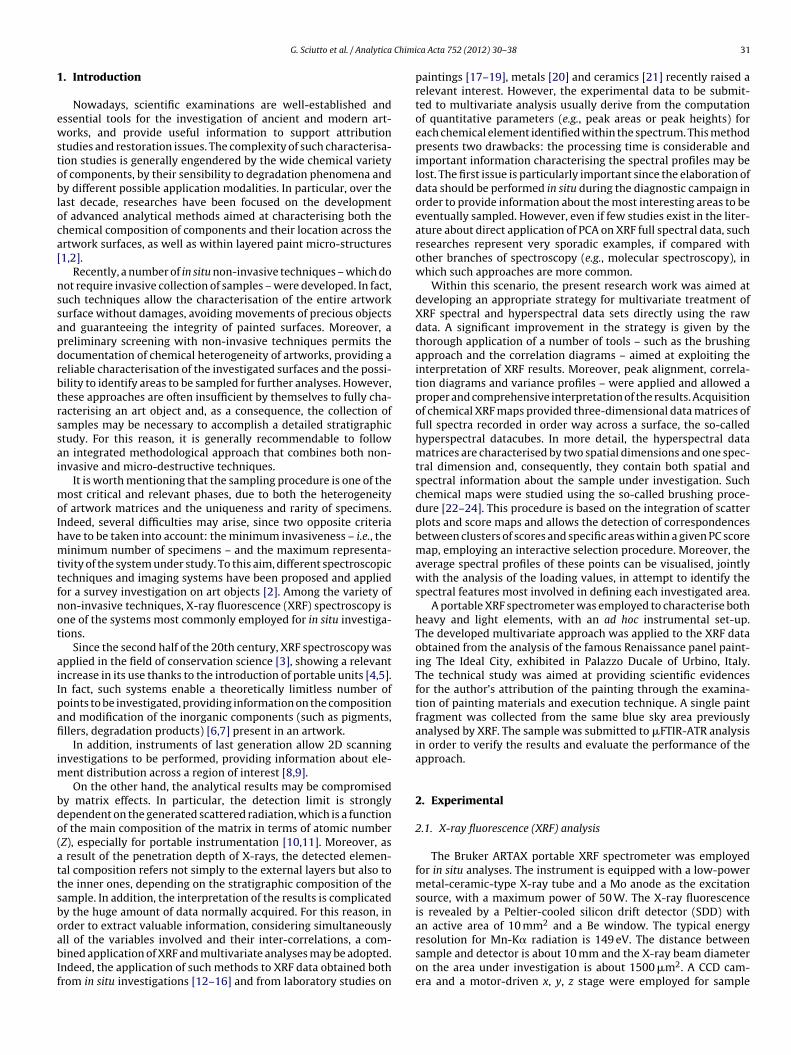
Analytica Chimica Acta 752 (2012) 30–38 Contents lists available at SciVerse ScienceDirect Analytica Chimica Acta jo u rn al hom epa ge: www.elsevier.com/locate/aca An advanced multivariate approach for processing X-ray fluorescence spectral and hyperspectral data from non-invasive in situ analyses on painted surfaces Giorgia Sciutto a , Paolo Oliveri b , Silvia Prati a , Marta Quaranta a , Silvia Bersani a , Rocco Mazzeo a,∗ a Microchemistry and Microscopy Art Diagnostic Laboratory, University of Bologna, Via Guaccimanni 42, 48121 Ravenna, Italy b Department of Pharmacy, University of Genova, Via Brigata Salerno 13, 16147 Genova, Italy h i g h l i g h t s XRF spectroscopy was applied for in situ non-invasive analysis of painted surfaces. Whole spectra, considered as finger- prints, were submitted to multivari- ate analysis. Slight horizontal shifts were cor- rected by a peak-alignment algo- rithm. Multivariate maps and brush- ing allowed the location of multi-element components. The approach helped to overcome common difficulties in interpreta- tion of XRF spectra. g r a p h i c a l a b s t r a c t a r t i c l e i n f o Article history: Received 1 August 2012 Received in revised form 20 September 2012 Accepted 23 September 2012 Available online 2 October 2012 Keywords: X-ray fluorescence (XRF) In situ non-invasive analysis Painting Principal component analysis (PCA) Multivariate hyperspectral elemental maps Brushing a b s t r a c t In the last decades, in situ non-invasive analytical techniques have been widely used for the analysis of paintings. These techniques are useful to extensively map the surface in a non-invasive way, in order to identify the most representative areas to be sampled. When spectroscopic investigations, such as X ray fluorescence (XRF), are conducted, they usually imply the acquisition of a huge amount of measurements. Subsequently, all these data should be processed in situ, in order to immediately support the sampling strategies. To this aim, an appropriate and fast strategy for multivariate treatment of XRF spectral and hyperspectral data sets is presented, able to account for inter-correlation among variables, which is an issue of high importance for elemental analyses. The main advantage of the approach is that XRF spectral profiles are analysed directly, without computation of derived parameters, by means of principal component analysis (PCA). This procedure allows a fast interpretation of results that can be accomplished in situ. Particular attention was paid to the selection of proper spectral pre-treatments to be applied on data together with the use of several chemometric tools (peak alignment, spectra normalisation and exploratory analysis) aimed at improving the interpretation of XRF results. In addition, the application of multivariate exploratory analysis on XRF hyperspectral maps was studied by using an interactive brushing procedure. The multivariate approach was validated on data obtained from the analysis of the famous Renaissance panel painting “The Ideal City”, exhibited in Palazzo Ducale of Urbino, Italy. © 2012 Elsevier B.V. All rights reserved. ∗ Corresponding author. Tel.: +39 0544 937150; fax: +39 0544 937159. E-mail address: [email protected] (R. Mazzeo). 0003-2670/$ – see front matter © 2012 Elsevier B.V. All rights reserved. http://dx.doi.org/10.1016/j.aca.2012.09.035
-
Upload
independent -
Category
Documents
-
view
1 -
download
0
Transcript of An advanced multivariate approach for processing X-ray fluorescence spectral and hyperspectral data...

Asp
GRa
b
h
�
�
�
�
�
a
ARR2AA
KXIPPMB
0h
Analytica Chimica Acta 752 (2012) 30– 38
Contents lists available at SciVerse ScienceDirect
Analytica Chimica Acta
jo u rn al hom epa ge: www.elsev ier .com/ locate /aca
n advanced multivariate approach for processing X-ray fluorescencepectral and hyperspectral data from non-invasive in situ analyses onainted surfaces
iorgia Sciuttoa, Paolo Oliverib, Silvia Prati a, Marta Quarantaa, Silvia Bersania,occo Mazzeoa,∗
Microchemistry and Microscopy Art Diagnostic Laboratory, University of Bologna, Via Guaccimanni 42, 48121 Ravenna, ItalyDepartment of Pharmacy, University of Genova, Via Brigata Salerno 13, 16147 Genova, Italy
i g h l i g h t s
XRF spectroscopy was applied forin situ non-invasive analysis ofpainted surfaces.Whole spectra, considered as finger-prints, were submitted to multivari-ate analysis.Slight horizontal shifts were cor-rected by a peak-alignment algo-rithm.Multivariate maps and brush-ing allowed the location ofmulti-element components.The approach helped to overcomecommon difficulties in interpreta-tion of XRF spectra.
g r a p h i c a l a b s t r a c t
r t i c l e i n f o
rticle history:eceived 1 August 2012eceived in revised form0 September 2012ccepted 23 September 2012vailable online 2 October 2012
eywords:-ray fluorescence (XRF)
n situ non-invasive analysisainting
a b s t r a c t
In the last decades, in situ non-invasive analytical techniques have been widely used for the analysis ofpaintings. These techniques are useful to extensively map the surface in a non-invasive way, in order toidentify the most representative areas to be sampled. When spectroscopic investigations, such as X rayfluorescence (XRF), are conducted, they usually imply the acquisition of a huge amount of measurements.Subsequently, all these data should be processed in situ, in order to immediately support the samplingstrategies. To this aim, an appropriate and fast strategy for multivariate treatment of XRF spectral andhyperspectral data sets is presented, able to account for inter-correlation among variables, which isan issue of high importance for elemental analyses. The main advantage of the approach is that XRFspectral profiles are analysed directly, without computation of derived parameters, by means of principalcomponent analysis (PCA). This procedure allows a fast interpretation of results that can be accomplished
rincipal component analysis (PCA)ultivariate hyperspectral elemental maps
rushing
in situ. Particular attention was paid to the selection of proper spectral pre-treatments to be applied ondata together with the use of several chemometric tools (peak alignment, spectra normalisation andexploratory analysis) aimed at improving the interpretation of XRF results. In addition, the applicationof multivariate exploratory analysis on XRF hyperspectral maps was studied by using an interactivebrushing procedure. The multivariate approach was validated on data obtained from the analysis of thefamous Renaissance panel pain
∗ Corresponding author. Tel.: +39 0544 937150; fax: +39 0544 937159.E-mail address: [email protected] (R. Mazzeo).
003-2670/$ – see front matter © 2012 Elsevier B.V. All rights reserved.ttp://dx.doi.org/10.1016/j.aca.2012.09.035
ting “The Ideal City”, exhibited in Palazzo Ducale of Urbino, Italy.© 2012 Elsevier B.V. All rights reserved.
Chimi
1
ewstobloca[
nssapdrbtrssai
moIhmttfnot
aiIpafi
im
bdo(attsboabIf
G. Sciutto et al. / Analytica
. Introduction
Nowadays, scientific examinations are well-established andssential tools for the investigation of ancient and modern art-orks, and provide useful information to support attribution
tudies and restoration issues. The complexity of such characterisa-ion studies is generally engendered by the wide chemical varietyf components, by their sensibility to degradation phenomena andy different possible application modalities. In particular, over the
ast decade, researches have been focused on the developmentf advanced analytical methods aimed at characterising both thehemical composition of components and their location across thertwork surfaces, as well as within layered paint micro-structures1,2].
Recently, a number of in situ non-invasive techniques – which doot require invasive collection of samples – were developed. In fact,uch techniques allow the characterisation of the entire artworkurface without damages, avoiding movements of precious objectsnd guaranteeing the integrity of painted surfaces. Moreover, areliminary screening with non-invasive techniques permits theocumentation of chemical heterogeneity of artworks, providing aeliable characterisation of the investigated surfaces and the possi-ility to identify areas to be sampled for further analyses. However,hese approaches are often insufficient by themselves to fully cha-acterising an art object and, as a consequence, the collection ofamples may be necessary to accomplish a detailed stratigraphictudy. For this reason, it is generally recommendable to follown integrated methodological approach that combines both non-nvasive and micro-destructive techniques.
It is worth mentioning that the sampling procedure is one of theost critical and relevant phases, due to both the heterogeneity
f artwork matrices and the uniqueness and rarity of specimens.ndeed, several difficulties may arise, since two opposite criteriaave to be taken into account: the minimum invasiveness – i.e., theinimum number of specimens – and the maximum representa-
ivity of the system under study. To this aim, different spectroscopicechniques and imaging systems have been proposed and appliedor a survey investigation on art objects [2]. Among the variety ofon-invasive techniques, X-ray fluorescence (XRF) spectroscopy isne of the systems most commonly employed for in situ investiga-ions.
Since the second half of the 20th century, XRF spectroscopy waspplied in the field of conservation science [3], showing a relevantncrease in its use thanks to the introduction of portable units [4,5].n fact, such systems enable a theoretically limitless number ofoints to be investigated, providing information on the compositionnd modification of the inorganic components (such as pigments,llers, degradation products) [6,7] present in an artwork.
In addition, instruments of last generation allow 2D scanningnvestigations to be performed, providing information about ele-
ent distribution across a region of interest [8,9].On the other hand, the analytical results may be compromised
y matrix effects. In particular, the detection limit is stronglyependent on the generated scattered radiation, which is a functionf the main composition of the matrix in terms of atomic numberZ), especially for portable instrumentation [10,11]. Moreover, as
result of the penetration depth of X-rays, the detected elemen-al composition refers not simply to the external layers but also tohe inner ones, depending on the stratigraphic composition of theample. In addition, the interpretation of the results is complicatedy the huge amount of data normally acquired. For this reason, inrder to extract valuable information, considering simultaneously
ll of the variables involved and their inter-correlations, a com-ined application of XRF and multivariate analyses may be adopted.ndeed, the application of such methods to XRF data obtained bothrom in situ investigations [12–16] and from laboratory studies on
ca Acta 752 (2012) 30– 38 31
paintings [17–19], metals [20] and ceramics [21] recently raised arelevant interest. However, the experimental data to be submit-ted to multivariate analysis usually derive from the computationof quantitative parameters (e.g., peak areas or peak heights) foreach chemical element identified within the spectrum. This methodpresents two drawbacks: the processing time is considerable andimportant information characterising the spectral profiles may belost. The first issue is particularly important since the elaboration ofdata should be performed in situ during the diagnostic campaign inorder to provide information about the most interesting areas to beeventually sampled. However, even if few studies exist in the liter-ature about direct application of PCA on XRF full spectral data, suchresearches represent very sporadic examples, if compared withother branches of spectroscopy (e.g., molecular spectroscopy), inwhich such approaches are more common.
Within this scenario, the present research work was aimed atdeveloping an appropriate strategy for multivariate treatment ofXRF spectral and hyperspectral data sets directly using the rawdata. A significant improvement in the strategy is given by thethorough application of a number of tools – such as the brushingapproach and the correlation diagrams – aimed at exploiting theinterpretation of XRF results. Moreover, peak alignment, correla-tion diagrams and variance profiles – were applied and allowed aproper and comprehensive interpretation of the results. Acquisitionof chemical XRF maps provided three-dimensional data matrices offull spectra recorded in order way across a surface, the so-calledhyperspectral datacubes. In more detail, the hyperspectral datamatrices are characterised by two spatial dimensions and one spec-tral dimension and, consequently, they contain both spatial andspectral information about the sample under investigation. Suchchemical maps were studied using the so-called brushing proce-dure [22–24]. This procedure is based on the integration of scatterplots and score maps and allows the detection of correspondencesbetween clusters of scores and specific areas within a given PC scoremap, employing an interactive selection procedure. Moreover, theaverage spectral profiles of these points can be visualised, jointlywith the analysis of the loading values, in attempt to identify thespectral features most involved in defining each investigated area.
A portable XRF spectrometer was employed to characterise bothheavy and light elements, with an ad hoc instrumental set-up.The developed multivariate approach was applied to the XRF dataobtained from the analysis of the famous Renaissance panel paint-ing The Ideal City, exhibited in Palazzo Ducale of Urbino, Italy.The technical study was aimed at providing scientific evidencesfor the author’s attribution of the painting through the examina-tion of painting materials and execution technique. A single paintfragment was collected from the same blue sky area previouslyanalysed by XRF. The sample was submitted to �FTIR-ATR analysisin order to verify the results and evaluate the performance of theapproach.
2. Experimental
2.1. X-ray fluorescence (XRF) analysis
The Bruker ARTAX portable XRF spectrometer was employedfor in situ analyses. The instrument is equipped with a low-powermetal-ceramic-type X-ray tube and a Mo anode as the excitationsource, with a maximum power of 50 W. The X-ray fluorescenceis revealed by a Peltier-cooled silicon drift detector (SDD) withan active area of 10 mm2 and a Be window. The typical energy
resolution for Mn-K� radiation is 149 eV. The distance betweensample and detector is about 10 mm and the X-ray beam diameteron the area under investigation is about 1500 �m2. A CCD cam-era and a motor-driven x, y, z stage were employed for sample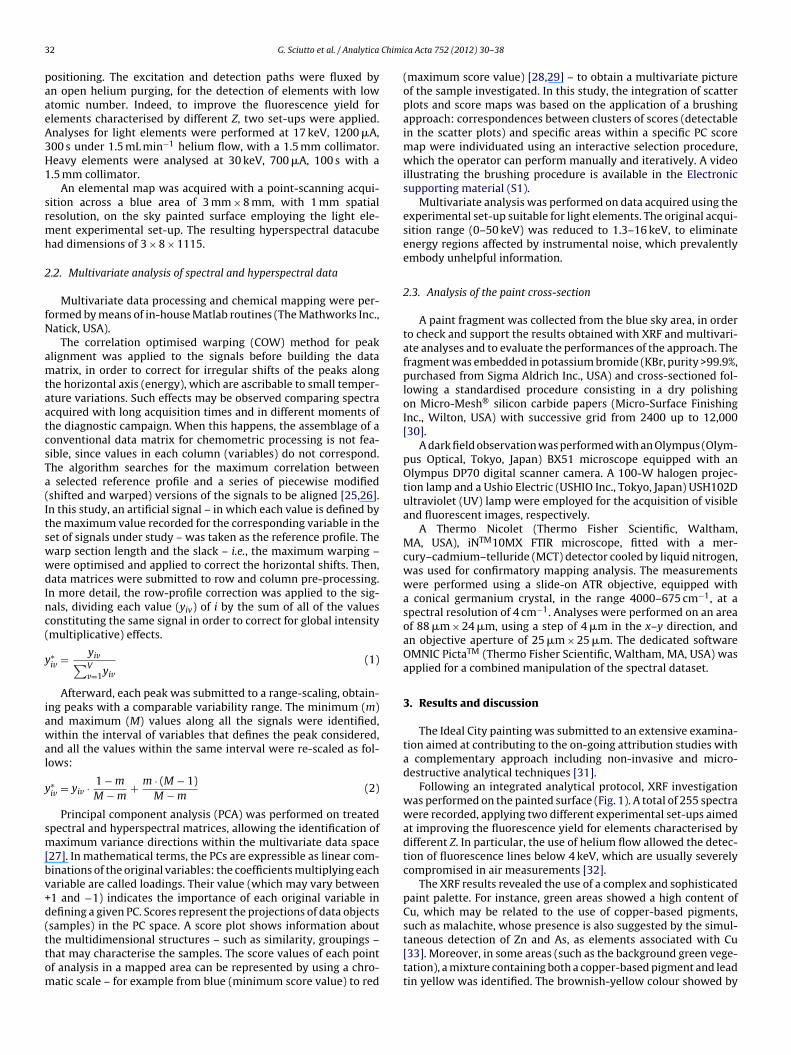
3 Chimi
paaeA3H1
srmh
2
fN
amtaatcsTa(ItswwdInc(
y
iawal
y
sm[bv+d(ttom
2 G. Sciutto et al. / Analytica
ositioning. The excitation and detection paths were fluxed byn open helium purging, for the detection of elements with lowtomic number. Indeed, to improve the fluorescence yield forlements characterised by different Z, two set-ups were applied.nalyses for light elements were performed at 17 keV, 1200 �A,00 s under 1.5 mL min−1 helium flow, with a 1.5 mm collimator.eavy elements were analysed at 30 keV, 700 �A, 100 s with a.5 mm collimator.
An elemental map was acquired with a point-scanning acqui-ition across a blue area of 3 mm × 8 mm, with 1 mm spatialesolution, on the sky painted surface employing the light ele-ent experimental set-up. The resulting hyperspectral datacube
ad dimensions of 3 × 8 × 1115.
.2. Multivariate analysis of spectral and hyperspectral data
Multivariate data processing and chemical mapping were per-ormed by means of in-house Matlab routines (The Mathworks Inc.,atick, USA).
The correlation optimised warping (COW) method for peaklignment was applied to the signals before building the dataatrix, in order to correct for irregular shifts of the peaks along
he horizontal axis (energy), which are ascribable to small temper-ture variations. Such effects may be observed comparing spectracquired with long acquisition times and in different moments ofhe diagnostic campaign. When this happens, the assemblage of aonventional data matrix for chemometric processing is not fea-ible, since values in each column (variables) do not correspond.he algorithm searches for the maximum correlation between
selected reference profile and a series of piecewise modifiedshifted and warped) versions of the signals to be aligned [25,26].n this study, an artificial signal – in which each value is defined byhe maximum value recorded for the corresponding variable in theet of signals under study – was taken as the reference profile. Thearp section length and the slack – i.e., the maximum warping –ere optimised and applied to correct the horizontal shifts. Then,ata matrices were submitted to row and column pre-processing.
n more detail, the row-profile correction was applied to the sig-als, dividing each value (yiv) of i by the sum of all of the valuesonstituting the same signal in order to correct for global intensitymultiplicative) effects.
∗iv = yiv
∑Vv=1yiv
(1)
Afterward, each peak was submitted to a range-scaling, obtain-ng peaks with a comparable variability range. The minimum (m)nd maximum (M) values along all the signals were identified,ithin the interval of variables that defines the peak considered,
nd all the values within the same interval were re-scaled as fol-ows:
∗iv = yiv · 1 − m
M − m+ m · (M − 1)
M − m(2)
Principal component analysis (PCA) was performed on treatedpectral and hyperspectral matrices, allowing the identification ofaximum variance directions within the multivariate data space
27]. In mathematical terms, the PCs are expressible as linear com-inations of the original variables: the coefficients multiplying eachariable are called loadings. Their value (which may vary between1 and −1) indicates the importance of each original variable inefining a given PC. Scores represent the projections of data objectssamples) in the PC space. A score plot shows information about
he multidimensional structures – such as similarity, groupings –hat may characterise the samples. The score values of each pointf analysis in a mapped area can be represented by using a chro-atic scale – for example from blue (minimum score value) to redca Acta 752 (2012) 30– 38
(maximum score value) [28,29] – to obtain a multivariate pictureof the sample investigated. In this study, the integration of scatterplots and score maps was based on the application of a brushingapproach: correspondences between clusters of scores (detectablein the scatter plots) and specific areas within a specific PC scoremap were individuated using an interactive selection procedure,which the operator can perform manually and iteratively. A videoillustrating the brushing procedure is available in the Electronicsupporting material (S1).
Multivariate analysis was performed on data acquired using theexperimental set-up suitable for light elements. The original acqui-sition range (0–50 keV) was reduced to 1.3–16 keV, to eliminateenergy regions affected by instrumental noise, which prevalentlyembody unhelpful information.
2.3. Analysis of the paint cross-section
A paint fragment was collected from the blue sky area, in orderto check and support the results obtained with XRF and multivari-ate analyses and to evaluate the performances of the approach. Thefragment was embedded in potassium bromide (KBr, purity >99.9%,purchased from Sigma Aldrich Inc., USA) and cross-sectioned fol-lowing a standardised procedure consisting in a dry polishingon Micro-Mesh® silicon carbide papers (Micro-Surface FinishingInc., Wilton, USA) with successive grid from 2400 up to 12,000[30].
A dark field observation was performed with an Olympus (Olym-pus Optical, Tokyo, Japan) BX51 microscope equipped with anOlympus DP70 digital scanner camera. A 100-W halogen projec-tion lamp and a Ushio Electric (USHIO Inc., Tokyo, Japan) USH102Dultraviolet (UV) lamp were employed for the acquisition of visibleand fluorescent images, respectively.
A Thermo Nicolet (Thermo Fisher Scientific, Waltham,MA, USA), iNTM10MX FTIR microscope, fitted with a mer-cury–cadmium–telluride (MCT) detector cooled by liquid nitrogen,was used for confirmatory mapping analysis. The measurementswere performed using a slide-on ATR objective, equipped witha conical germanium crystal, in the range 4000–675 cm−1, at aspectral resolution of 4 cm−1. Analyses were performed on an areaof 88 �m × 24 �m, using a step of 4 �m in the x–y direction, andan objective aperture of 25 �m × 25 �m. The dedicated softwareOMNIC PictaTM (Thermo Fisher Scientific, Waltham, MA, USA) wasapplied for a combined manipulation of the spectral dataset.
3. Results and discussion
The Ideal City painting was submitted to an extensive examina-tion aimed at contributing to the on-going attribution studies witha complementary approach including non-invasive and micro-destructive analytical techniques [31].
Following an integrated analytical protocol, XRF investigationwas performed on the painted surface (Fig. 1). A total of 255 spectrawere recorded, applying two different experimental set-ups aimedat improving the fluorescence yield for elements characterised bydifferent Z. In particular, the use of helium flow allowed the detec-tion of fluorescence lines below 4 keV, which are usually severelycompromised in air measurements [32].
The XRF results revealed the use of a complex and sophisticatedpaint palette. For instance, green areas showed a high content ofCu, which may be related to the use of copper-based pigments,such as malachite, whose presence is also suggested by the simul-
taneous detection of Zn and As, as elements associated with Cu[33]. Moreover, in some areas (such as the background green vege-tation), a mixture containing both a copper-based pigment and leadtin yellow was identified. The brownish-yellow colour showed by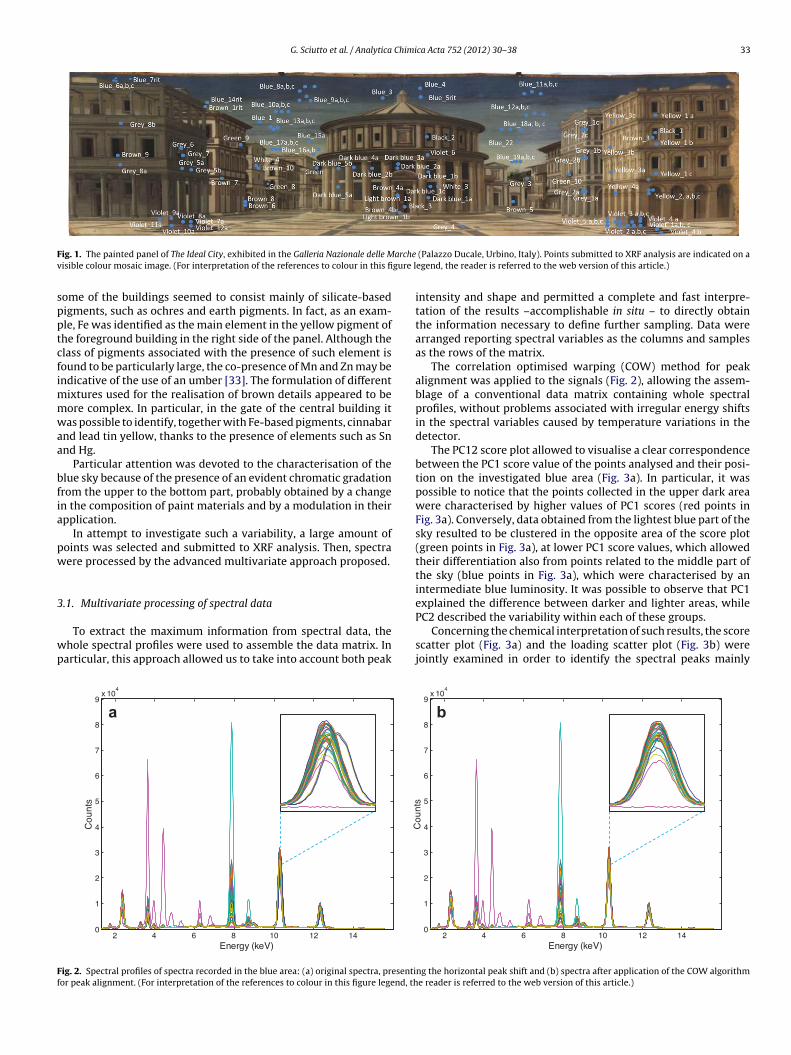
G. Sciutto et al. / Analytica Chimica Acta 752 (2012) 30– 38 33
F archev gure l
spptcfimmwaa
bfia
pw
3
wp
Ff
ig. 1. The painted panel of The Ideal City, exhibited in the Galleria Nazionale delle Misible colour mosaic image. (For interpretation of the references to colour in this fi
ome of the buildings seemed to consist mainly of silicate-basedigments, such as ochres and earth pigments. In fact, as an exam-le, Fe was identified as the main element in the yellow pigment ofhe foreground building in the right side of the panel. Although thelass of pigments associated with the presence of such element isound to be particularly large, the co-presence of Mn and Zn may bendicative of the use of an umber [33]. The formulation of different
ixtures used for the realisation of brown details appeared to beore complex. In particular, in the gate of the central building itas possible to identify, together with Fe-based pigments, cinnabar
nd lead tin yellow, thanks to the presence of elements such as Snnd Hg.
Particular attention was devoted to the characterisation of thelue sky because of the presence of an evident chromatic gradationrom the upper to the bottom part, probably obtained by a changen the composition of paint materials and by a modulation in theirpplication.
In attempt to investigate such a variability, a large amount ofoints was selected and submitted to XRF analysis. Then, spectraere processed by the advanced multivariate approach proposed.
.1. Multivariate processing of spectral data
To extract the maximum information from spectral data, thehole spectral profiles were used to assemble the data matrix. Inarticular, this approach allowed us to take into account both peak
2 4 6 8 10 12 140
1
2
3
4
5
6
7
8
9x 10
4
Energy (keV)
Cou
nts
a
ig. 2. Spectral profiles of spectra recorded in the blue area: (a) original spectra, presentior peak alignment. (For interpretation of the references to colour in this figure legend, th
(Palazzo Ducale, Urbino, Italy). Points submitted to XRF analysis are indicated on aegend, the reader is referred to the web version of this article.)
intensity and shape and permitted a complete and fast interpre-tation of the results –accomplishable in situ – to directly obtainthe information necessary to define further sampling. Data werearranged reporting spectral variables as the columns and samplesas the rows of the matrix.
The correlation optimised warping (COW) method for peakalignment was applied to the signals (Fig. 2), allowing the assem-blage of a conventional data matrix containing whole spectralprofiles, without problems associated with irregular energy shiftsin the spectral variables caused by temperature variations in thedetector.
The PC12 score plot allowed to visualise a clear correspondencebetween the PC1 score value of the points analysed and their posi-tion on the investigated blue area (Fig. 3a). In particular, it waspossible to notice that the points collected in the upper dark areawere characterised by higher values of PC1 scores (red points inFig. 3a). Conversely, data obtained from the lightest blue part of thesky resulted to be clustered in the opposite area of the score plot(green points in Fig. 3a), at lower PC1 score values, which allowedtheir differentiation also from points related to the middle part ofthe sky (blue points in Fig. 3a), which were characterised by anintermediate blue luminosity. It was possible to observe that PC1explained the difference between darker and lighter areas, while
PC2 described the variability within each of these groups.Concerning the chemical interpretation of such results, the scorescatter plot (Fig. 3a) and the loading scatter plot (Fig. 3b) werejointly examined in order to identify the spectral peaks mainly
2 4 6 8 10 12 140
1
2
3
4
5
6
7
8
9x 10
4
Energy (keV)
Cou
nts
b
ng the horizontal peak shift and (b) spectra after application of the COW algorithme reader is referred to the web version of this article.)
34 G. Sciutto et al. / Analytica Chimica Acta 752 (2012) 30– 38
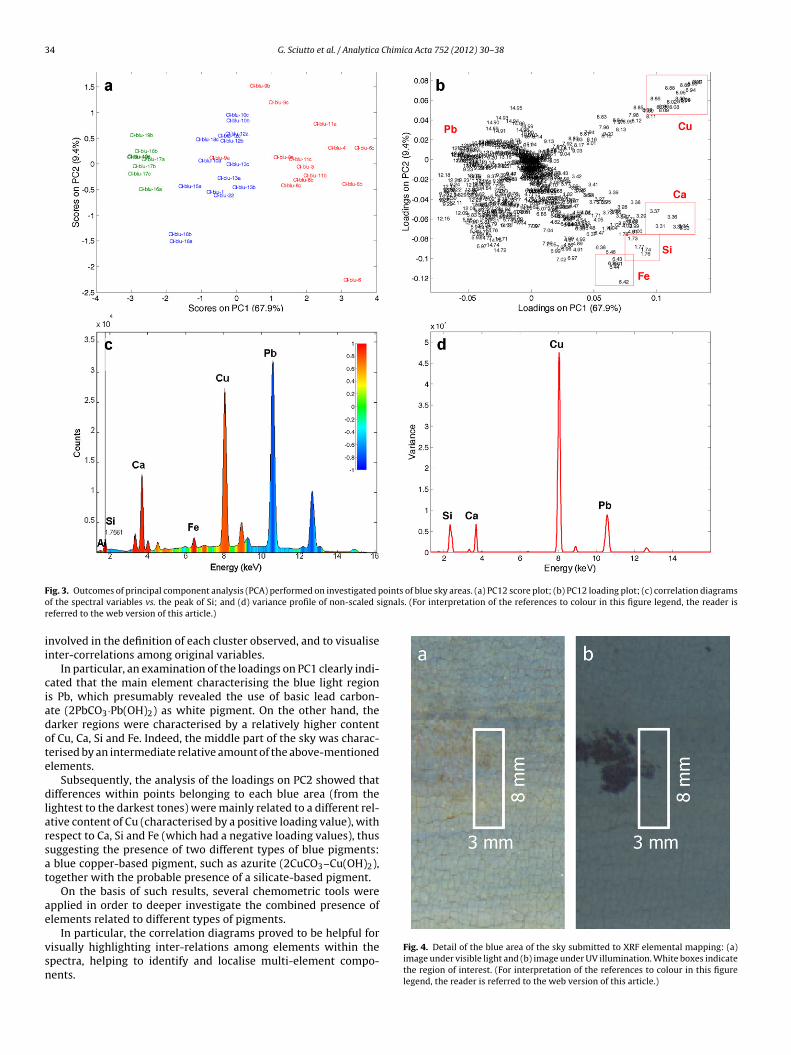
F oints of blue sky areas. (a) PC12 score plot; (b) PC12 loading plot; (c) correlation diagramso ignals. (For interpretation of the references to colour in this figure legend, the reader isr
ii
ciadote
dlarsat
ae
vsn
ig. 3. Outcomes of principal component analysis (PCA) performed on investigated pf the spectral variables vs. the peak of Si; and (d) variance profile of non-scaled seferred to the web version of this article.)
nvolved in the definition of each cluster observed, and to visualisenter-correlations among original variables.
In particular, an examination of the loadings on PC1 clearly indi-ated that the main element characterising the blue light regions Pb, which presumably revealed the use of basic lead carbon-te (2PbCO3·Pb(OH)2) as white pigment. On the other hand, thearker regions were characterised by a relatively higher contentf Cu, Ca, Si and Fe. Indeed, the middle part of the sky was charac-erised by an intermediate relative amount of the above-mentionedlements.
Subsequently, the analysis of the loadings on PC2 showed thatifferences within points belonging to each blue area (from the
ightest to the darkest tones) were mainly related to a different rel-tive content of Cu (characterised by a positive loading value), withespect to Ca, Si and Fe (which had a negative loading values), thusuggesting the presence of two different types of blue pigments:
blue copper-based pigment, such as azurite (2CuCO3–Cu(OH)2),ogether with the probable presence of a silicate-based pigment.
On the basis of such results, several chemometric tools werepplied in order to deeper investigate the combined presence oflements related to different types of pigments.
In particular, the correlation diagrams proved to be helpful forisually highlighting inter-relations among elements within thepectra, helping to identify and localise multi-element compo-ents.
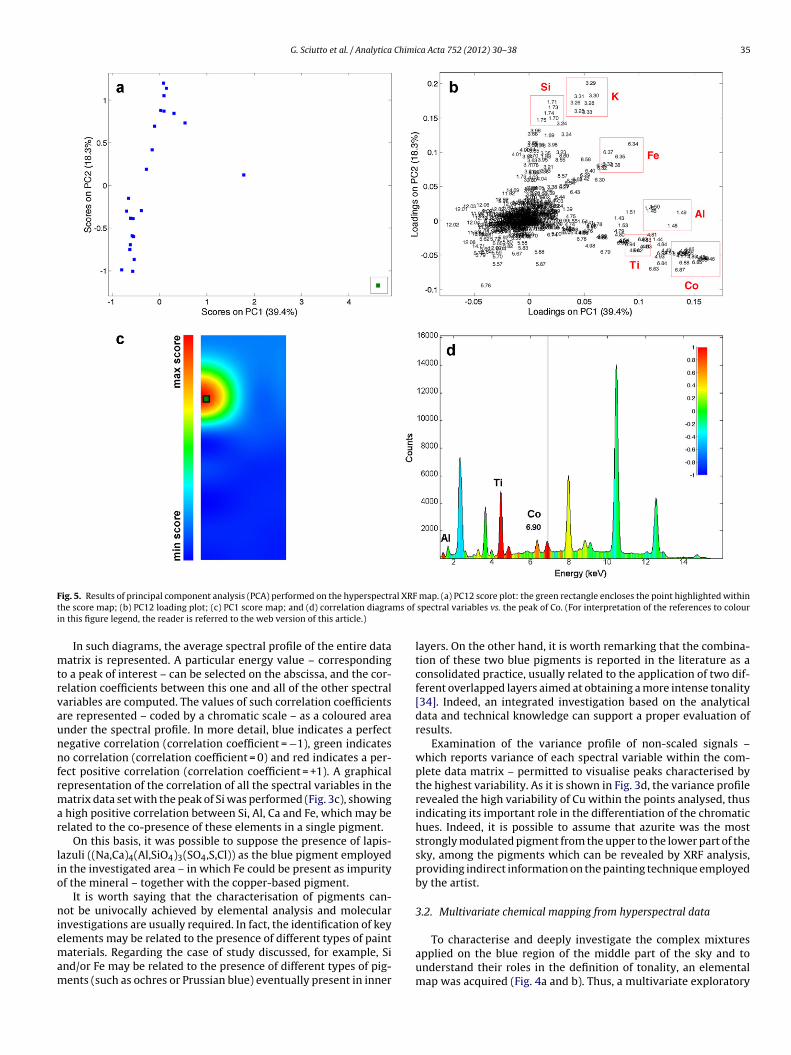
Fig. 4. Detail of the blue area of the sky submitted to XRF elemental mapping: (a)image under visible light and (b) image under UV illumination. White boxes indicatethe region of interest. (For interpretation of the references to colour in this figurelegend, the reader is referred to the web version of this article.)
G. Sciutto et al. / Analytica Chimica Acta 752 (2012) 30– 38 35
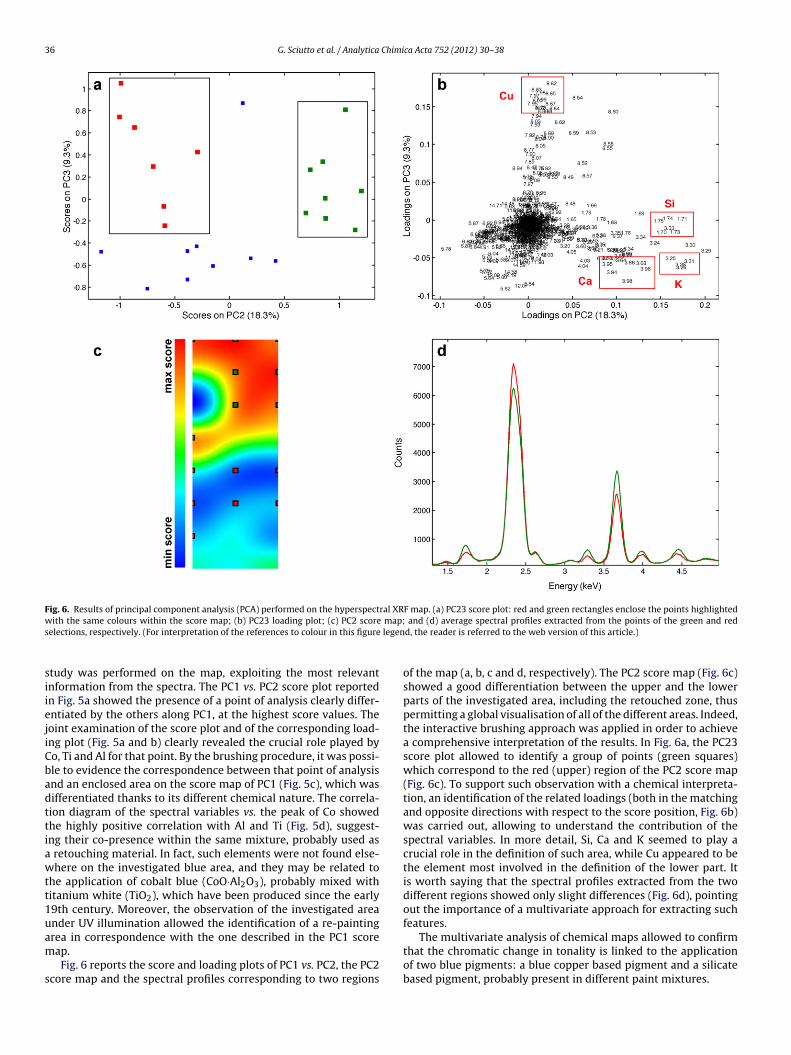
F al XRFt ms of
i
mtrvaunnfrmar
lio
niemam
ig. 5. Results of principal component analysis (PCA) performed on the hyperspectrhe score map; (b) PC12 loading plot; (c) PC1 score map; and (d) correlation diagran this figure legend, the reader is referred to the web version of this article.)
In such diagrams, the average spectral profile of the entire dataatrix is represented. A particular energy value – corresponding
o a peak of interest – can be selected on the abscissa, and the cor-elation coefficients between this one and all of the other spectralariables are computed. The values of such correlation coefficientsre represented – coded by a chromatic scale – as a coloured areander the spectral profile. In more detail, blue indicates a perfectegative correlation (correlation coefficient = −1), green indicateso correlation (correlation coefficient = 0) and red indicates a per-
ect positive correlation (correlation coefficient = +1). A graphicalepresentation of the correlation of all the spectral variables in theatrix data set with the peak of Si was performed (Fig. 3c), showing
high positive correlation between Si, Al, Ca and Fe, which may beelated to the co-presence of these elements in a single pigment.
On this basis, it was possible to suppose the presence of lapis-azuli ((Na,Ca)4(Al,SiO4)3(SO4,S,Cl)) as the blue pigment employedn the investigated area – in which Fe could be present as impurityf the mineral – together with the copper-based pigment.
It is worth saying that the characterisation of pigments can-ot be univocally achieved by elemental analysis and molecular
nvestigations are usually required. In fact, the identification of key
lements may be related to the presence of different types of paintaterials. Regarding the case of study discussed, for example, Sind/or Fe may be related to the presence of different types of pig-ents (such as ochres or Prussian blue) eventually present in inner
map. (a) PC12 score plot: the green rectangle encloses the point highlighted withinspectral variables vs. the peak of Co. (For interpretation of the references to colour
layers. On the other hand, it is worth remarking that the combina-tion of these two blue pigments is reported in the literature as aconsolidated practice, usually related to the application of two dif-ferent overlapped layers aimed at obtaining a more intense tonality[34]. Indeed, an integrated investigation based on the analyticaldata and technical knowledge can support a proper evaluation ofresults.
Examination of the variance profile of non-scaled signals –which reports variance of each spectral variable within the com-plete data matrix – permitted to visualise peaks characterised bythe highest variability. As it is shown in Fig. 3d, the variance profilerevealed the high variability of Cu within the points analysed, thusindicating its important role in the differentiation of the chromatichues. Indeed, it is possible to assume that azurite was the moststrongly modulated pigment from the upper to the lower part of thesky, among the pigments which can be revealed by XRF analysis,providing indirect information on the painting technique employedby the artist.
3.2. Multivariate chemical mapping from hyperspectral data
To characterise and deeply investigate the complex mixturesapplied on the blue region of the middle part of the sky and tounderstand their roles in the definition of tonality, an elementalmap was acquired (Fig. 4a and b). Thus, a multivariate exploratory
36 G. Sciutto et al. / Analytica Chimica Acta 752 (2012) 30– 38
Fig. 6. Results of principal component analysis (PCA) performed on the hyperspectral XRF map. (a) PC23 score plot: red and green rectangles enclose the points highlightedw map;s legen
siiejiCbadttiawtt1uam
s
ith the same colours within the score map; (b) PC23 loading plot; (c) PC2 scoreelections, respectively. (For interpretation of the references to colour in this figure
tudy was performed on the map, exploiting the most relevantnformation from the spectra. The PC1 vs. PC2 score plot reportedn Fig. 5a showed the presence of a point of analysis clearly differ-ntiated by the others along PC1, at the highest score values. Theoint examination of the score plot and of the corresponding load-ng plot (Fig. 5a and b) clearly revealed the crucial role played byo, Ti and Al for that point. By the brushing procedure, it was possi-le to evidence the correspondence between that point of analysisnd an enclosed area on the score map of PC1 (Fig. 5c), which wasifferentiated thanks to its different chemical nature. The correla-ion diagram of the spectral variables vs. the peak of Co showedhe highly positive correlation with Al and Ti (Fig. 5d), suggest-ng their co-presence within the same mixture, probably used as
retouching material. In fact, such elements were not found else-here on the investigated blue area, and they may be related to
he application of cobalt blue (CoO·Al2O3), probably mixed withitanium white (TiO2), which have been produced since the early9th century. Moreover, the observation of the investigated areander UV illumination allowed the identification of a re-painting
rea in correspondence with the one described in the PC1 scoreap.Fig. 6 reports the score and loading plots of PC1 vs. PC2, the PC2core map and the spectral profiles corresponding to two regions
and (d) average spectral profiles extracted from the points of the green and redd, the reader is referred to the web version of this article.)
of the map (a, b, c and d, respectively). The PC2 score map (Fig. 6c)showed a good differentiation between the upper and the lowerparts of the investigated area, including the retouched zone, thuspermitting a global visualisation of all of the different areas. Indeed,the interactive brushing approach was applied in order to achievea comprehensive interpretation of the results. In Fig. 6a, the PC23score plot allowed to identify a group of points (green squares)which correspond to the red (upper) region of the PC2 score map(Fig. 6c). To support such observation with a chemical interpreta-tion, an identification of the related loadings (both in the matchingand opposite directions with respect to the score position, Fig. 6b)was carried out, allowing to understand the contribution of thespectral variables. In more detail, Si, Ca and K seemed to play acrucial role in the definition of such area, while Cu appeared to bethe element most involved in the definition of the lower part. Itis worth saying that the spectral profiles extracted from the twodifferent regions showed only slight differences (Fig. 6d), pointingout the importance of a multivariate approach for extracting suchfeatures.
The multivariate analysis of chemical maps allowed to confirmthat the chromatic change in tonality is linked to the applicationof two blue pigments: a blue copper based pigment and a silicatebased pigment, probably present in different paint mixtures.
G. Sciutto et al. / Analytica Chimica Acta 752 (2012) 30– 38 37
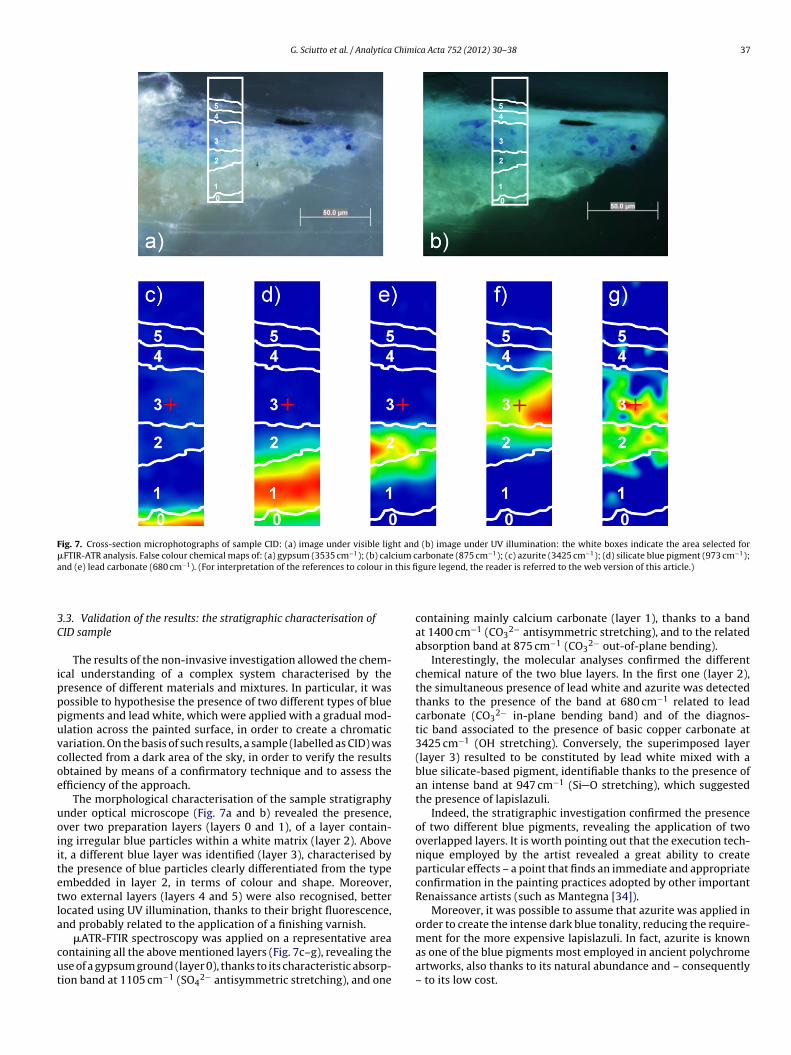
Fig. 7. Cross-section microphotographs of sample CID: (a) image under visible light and (b) image under UV illumination: the white boxes indicate the area selected for�FTIR-ATR analysis. False colour chemical maps of: (a) gypsum (3535 cm−1); (b) calcium carbonate (875 cm−1); (c) azurite (3425 cm−1); (d) silicate blue pigment (973 cm−1);a this fi
3C
ipppuvcoe
uoiitetla
cut
nd (e) lead carbonate (680 cm−1). (For interpretation of the references to colour in
.3. Validation of the results: the stratigraphic characterisation ofID sample
The results of the non-invasive investigation allowed the chem-cal understanding of a complex system characterised by theresence of different materials and mixtures. In particular, it wasossible to hypothesise the presence of two different types of blueigments and lead white, which were applied with a gradual mod-lation across the painted surface, in order to create a chromaticariation. On the basis of such results, a sample (labelled as CID) wasollected from a dark area of the sky, in order to verify the resultsbtained by means of a confirmatory technique and to assess thefficiency of the approach.
The morphological characterisation of the sample stratigraphynder optical microscope (Fig. 7a and b) revealed the presence,ver two preparation layers (layers 0 and 1), of a layer contain-ng irregular blue particles within a white matrix (layer 2). Abovet, a different blue layer was identified (layer 3), characterised byhe presence of blue particles clearly differentiated from the typembedded in layer 2, in terms of colour and shape. Moreover,wo external layers (layers 4 and 5) were also recognised, betterocated using UV illumination, thanks to their bright fluorescence,nd probably related to the application of a finishing varnish.
�ATR-FTIR spectroscopy was applied on a representative areaontaining all the above mentioned layers (Fig. 7c–g), revealing these of a gypsum ground (layer 0), thanks to its characteristic absorp-ion band at 1105 cm−1 (SO4
2− antisymmetric stretching), and one
gure legend, the reader is referred to the web version of this article.)
containing mainly calcium carbonate (layer 1), thanks to a bandat 1400 cm−1 (CO3
2− antisymmetric stretching), and to the relatedabsorption band at 875 cm−1 (CO3
2− out-of-plane bending).Interestingly, the molecular analyses confirmed the different
chemical nature of the two blue layers. In the first one (layer 2),the simultaneous presence of lead white and azurite was detectedthanks to the presence of the band at 680 cm−1 related to leadcarbonate (CO3
2− in-plane bending band) and of the diagnos-tic band associated to the presence of basic copper carbonate at3425 cm−1 (OH stretching). Conversely, the superimposed layer(layer 3) resulted to be constituted by lead white mixed with ablue silicate-based pigment, identifiable thanks to the presence ofan intense band at 947 cm−1 (Si O stretching), which suggestedthe presence of lapislazuli.
Indeed, the stratigraphic investigation confirmed the presenceof two different blue pigments, revealing the application of twooverlapped layers. It is worth pointing out that the execution tech-nique employed by the artist revealed a great ability to createparticular effects – a point that finds an immediate and appropriateconfirmation in the painting practices adopted by other importantRenaissance artists (such as Mantegna [34]).
Moreover, it was possible to assume that azurite was applied inorder to create the intense dark blue tonality, reducing the require-
ment for the more expensive lapislazuli. In fact, azurite is knownas one of the blue pigments most employed in ancient polychromeartworks, also thanks to its natural abundance and – consequently– to its low cost.
3 Chimi
4
tsii
fdpsio–icaalpcmps
tbii
rdXwt
A
tIsM
A
t
R
[[
[
[
[
[
[
[
[[
[
[
[
[
[
[
[
[
[[
[
[
[
8 G. Sciutto et al. / Analytica
. Conclusions
The multivariate methodology presented in this study provedo be an efficient approach to obtain valuable information frompectral and hyperspectral data sets obtained from XRF in situnvestigations, definitely helpful for a fast and straightforwardnterpretation of complex matrices.
In particular, in this study, chemometric processing was per-ormed directly on the whole signals, without any computation oferived parameters, in order to provide a rapid method for in siturocessing of XRF spectra. This approach allows to take into accountpectral features such as peak shape, and it is particularly efficientn the case of overlapping peaks. The conventional approach basedn derived parameters can provide – in the most favourable cases
the same results as the approach presented in this study, butt requires a further computational step, which makes more diffi-ult the obtainment of real-time results. Moreover, the integratedpproach, based on the use of different chemometric tools, allowed
comprehensive interpretation of multivariate results. In particu-ar, the examination of correlation diagrams, together with loadinglots, proved to be extremely suitable for the identification andharacterisation of multi-element components, overcoming com-on difficulties in the interpretation of XRF signals – in which the
resence of one element may be related to the presence of either aingle or various materials.
Concerning the multivariate maps, the integrated and interac-ive use of score maps, score and loading scatter plots, performedy means of the brushing approach, proved to be suitable to chem-
cally characterise the areas under investigation and to achieve thenterpretation of spectral differences.
Indeed, it is possible to conclude that the methodology proposedepresents an advanced, fast and non-expensive exploratory proce-ure for data analysis. It should be applied for in situ processing ofRF signals, thus avoiding the loss of global information connectedith an incomplete processing of data and may be extremely useful
o support the definition of the sampling points.
cknowledgements
The present work was carried out with the support ofhe 7◦ FP (CHARISMA – Cultural Heritage Advanced Researchnfrastructures: Synergy for a Multidisciplinary Approach to Con-ervation/Restoration Project No. 228330) and of the Italianinistry for University and Research (MIUR) (PRIN08).
ppendix A. Supplementary data
Supplementary data associated with this article can be found, inhe online version, at http://dx.doi.org/10.1016/j.aca.2012.09.035.
eferences
[1] S. Prati, E. Jospeh, G. Sciutto, R. Mazzeo, Acc. Chem. Res. 43 (2010) 792–801.[2] C. Miliani, F. Rosi, B.G. Brunetti, A. Sgamellotti, Acc. Chem. Res. 43 (2010)
728–738.[3] M. Mantler, M. Schreiner, X-Ray Spectrom. 29 (2000) 3–17.[4] P. Moioli, C. Seccaroni, X-Ray Spectrom. 29 (2000) 48–52.
[
[
ca Acta 752 (2012) 30– 38
[5] R. Cesareo, S. Ridolfi, M. Marabelli, A. Castellano, G. Buccolieri, M. Donativi,G.E. Gigante, A. Brunetti, M.A. Rosales Medina, in: P.J. Potts, M. West (Eds.),Portable X-ray Fluorescence Spectrometry: Capabilities for In Situ Analysis,Royal Society of Chemistry, Cambridge, 2008, p. 206.
[6] R. Mazzeo, G. Sciutto, S. Prati, M.L. Amadori, Scientific examination of the Man-tegna’s paintings in Sant’Andrea, Mantua: the families of Christ and St. John theBaptist and the baptism of Christ, in: La technique picturale d’Andrea Mantegna,Techne C2RMF, Paris, 2009, pp. 46–66.
[7] R. Mazzeo, M. Menu, M.L. Amadori, I. Bonacini, E. Itié, E. Eveno, E. Joseph, E.Lambert, E. Laval, S. Prati, E. Ravaud, G. Sciutto, Examination of the UominiIllustri: Looking for the Origins of the Portraits in the Studiolo of the DucalPalace of Urbino in Studying Old Master Paintings: Technology and Practice,Archetype Publications, London, 2011, pp. 44–51.
[8] F.P. Hocquet, H. Calvo del Castillo, A. Cervera Xicotencatl, C. Bourgeois, C. Oger,A. Marchal, M. Clar, S. Rakkaa, E. Micha, D. Strivay, Anal. Bioanal. Chem. 399(2011) 3109–3116.
[9] K. Trentelman, M. Bouchard, M. Ganio, C. Namowicz, C. Schmidt Patterson, M.Walton, X-Ray Spectrom. 39 (2010) 159–166.
10] S. Pessanha, A. Guilherme, M.L. Carvalho, Appl. Phys. A 97 (2009) 497–505.11] G. Vittiglio, K. JanssensU, B. Vekemans, F. Adams, A. Oost, Spectrochim. Acta B
54 (1999) 1697–1710.12] F. Rosi, C. Miliani, C. Clementi, K. Kahrim, F. Presciutti, M. Vagnini, V. Manuali,
A. Daveri, L. Cartechini, B.G. Brunetti, A. Sgamellotti, Appl. Phys. A 100 (2010)613–624.
13] F. Rosi, A. Burnstock, K.J. Van den Berg, C. Miliani, B.G. Brunetti, A. Sgamellotti,Spectrochim. Acta A 71 (2009) 1655–1662.
14] M. Sawczak, A. Kaminska, G. Rabczuk, M. Ferretti, R. Jendrzejewski, G. Sliwinski,Appl. Surf. Sci. 255 (2009) 5542–5545.
15] C. Miliani, B. Doherty, A. Daveri, A. Loeschc, H. Ulbricht, B.G. Brunetti, A. Sgamel-lotti, Spectrochim. Acta A 73 (2009) 587–592.
16] A. Pitarch, A. Ramón, A. Álvarez-Pérez, I. Queralt, Anal. Bioanal. Chem. 402(2012) 1481–1492.
17] E. Marengo, M.C. Liparota, E. Robotti, M. Bobba, Anal. Chim. Acta 553 (2005)111–122.
18] D. Lau, C. Villis, S. Furman, M. Livett, Anal. Chim. Acta 610 (2008) 15–24.19] F. Manhas, V. Pereira, M. Izabel, M. Silveira Bueno, J. Coat. Technol. Res. 6 (2009)
445–455.20] M.F. Alberghina, R. Barraco, M. Brai, T. Schillaci, L. Tranchina, Spectrochim. Acta
B 66 (2011) 129–137.21] R.J. Speakman, N.C. Little, D. Creel, M.R. Miller, J.G. Inanez, J. Archaeol. Sci. 38
(2011) 3483–3496.22] G. Sciutto, P. Oliveri, S. Prati, M. Quaranta, S. Lanteri, R. Mazzeo, Anal. Bioanal.
Chem., in press23] O.Y. Rodionova, L.P. Houmøller, A.L. Pomerantsev, P. Geladi, J. Burger, V.L. Doro-
feyev, A.P. Arzamastsev, Anal. Chim. Acta 549 (2005) 151–158.24] H. Grahn, P. Geladi, Techniques and Applications of Hyperspectral Image Anal-
ysis, Wiley, New York, 2007.25] N.P.V. Nielsen, J.M. Carstensen, J. Smedsgaard, J. Chromatogr. A 805 (1998)
17–35.26] R.H. Jellema, Variable shift and alignment, in: S.D. Brown, R. Tauler, B. Walczak
(Eds.), Comprehensive Chemometrics, vol. 2, Elsevier, Amsterdam, 2009, pp.85–108.
27] I.T. Jolliffe, Principal Component Analysis, 2nd ed., Springer Series in Statistics,Springer-Verlag, New York, 2002, pp. 201–207.
28] J. Burger, A. Gowen, Chemom. Intell. Lab. Syst. 108 (2011) 13–22.29] H. Grahn, P. Geladi, Techniques and Applications of Hyperspectral Image Anal-
ysis, John Wiley & Sons, Ltd., West Sussex, 2007.30] R. Mazzeo, E. Joseph, S. Prati, A. Millemaggi, Anal. Chim. Acta 599 (2007)
107–117.31] R. Mazzeo, G. Sciutto, M.L. Amadori, S. Barcelli, S. Bersani, I. Bonacini, B.G.
Brunetti, L. Cartechini, E. Catelli, C. Clementi, M. Quaranta, M. Palmieri, S. Prati,M. Vagnini, Indagini non invasive e micro-invasive per la caratterizzazione deldisegno preparatorio e dei componenti pittorici nel dipinto della Città ideale,in: A. Marchi, M.R. Vallazzi (Eds.), La città ideale, l’utopia del rinascimento adUrbino tra Piero della Francesca e Raffaello, Electa, 2012.
32] H. Bronk, S. Röhrs, A. Bjeoumikhov, N. Langhoff, J. Schmalz, R. Wedell,H.E. Gorny, A. Herold, U. Waldschläger, Fresen. J. Anal. Chem. 371 (2001)307–316.
33] C. Seccaroni, P. Moioli, Fluorescenza X – Prontuario per l’analisi XRF portatileapplicata a superfici policrome, Nardini Editore, Firenze, 2002.
34] E. Rauvaud, M. Eveno, S. Mirabaud, E.L. Lambert, Matériaux et techniques dequadre toiles d’Andrea Mantegna, in: La technique picturale d’Andrea Man-tegna, Techne C2RMF, Paris, 2009, pp. 27–34.