Black painted pottery, Kildehuse II, Odense County, Denmark
8
This article appeared in a journal published by Elsevier. The attached copy is furnished to the author for internal non-commercial research and education use, including for instruction at the authors institution and sharing with colleagues. Other uses, including reproduction and distribution, or selling or licensing copies, or posting to personal, institutional or third party websites are prohibited. In most cases authors are permitted to post their version of the article (e.g. in Word or Tex form) to their personal website or institutional repository. Authors requiring further information regarding Elsevier’s archiving and manuscript policies are encouraged to visit: http://www.elsevier.com/copyright
Transcript of Black painted pottery, Kildehuse II, Odense County, Denmark

This article appeared in a journal published by Elsevier. The attachedcopy is furnished to the author for internal non-commercial researchand education use, including for instruction at the authors institution
and sharing with colleagues.
Other uses, including reproduction and distribution, or selling orlicensing copies, or posting to personal, institutional or third party
websites are prohibited.
In most cases authors are permitted to post their version of thearticle (e.g. in Word or Tex form) to their personal website orinstitutional repository. Authors requiring further information
regarding Elsevier’s archiving and manuscript policies areencouraged to visit:
http://www.elsevier.com/copyright

Author's personal copy
Spectrochimica Acta Part A 79 (2011) 824– 830
Contents lists available at ScienceDirect
Spectrochimica Acta Part A: Molecular andBiomolecular Spectroscopy
jou rn al hom epa ge: www.elsev ier .com/ locate /saa
Black painted pottery, Kildehuse II, Odense County, Denmark
Joanna Trabskaa, Aleksandra Wesełucha-Birczynskab,∗, Janina Zieba-Palusc, Mads Thagård Runged
a Rzeszów University, Institute of Archaeology, Hoffmanowej 8 Str, Rzeszów, Polandb Faculty of Chemistry, Jagiellonian Unversity, ul. Ingardena 3, 30-060 Kraków, Polandc Institute of Forensic Research, Westerplatte 9 Str., Krakówd Odense Bys Museum, Denmark
a r t i c l e i n f o
Article history:Received 3 February 2010Received in revised form 27 March 2010Accepted 26 August 2010
Keywords:Tar/pitchRaman microspectroscopyFTIR microspectroscopySEM/EDSPolarized light microscopy (PLM)
a b s t r a c t
This work aimed at characterization of a black layer covering a Bronze Age (period VI) pot surface. To solveresearch problems plane polarized light microscopy (PLM), scanning microscopy with X-ray microanal-yser (SEM/EDS), Raman and FTIR microspectroscopies were applied. Observation of the black layer underthe PLM suggests that we deal with an opaque, isotropic layer, purposely put on leather-hard, burnishedsurface of a pot. No traces of organic substances that might have modified a pot surface before paintingwere detected. The black layer coats the pot with a continuous 0.2–0.4 �m thick layer. The black layermust have been applied while warm or hot. It is recognized that the black layer is a true painting layer.Spectroscopic analyses (Raman and FTIR) point that birch tar or a birch-pine tar had been applied. Carbonblack should be definitely excluded. The analyzed organic substance is structurally ordered in variousdegrees, due to varying temperature influence. Some Raman spectra reveal, in second-order region of thespectrum (>2000 cm−1), the graphite presence. Scarce points reveal the presence of inorganic admixtures:clay minerals, feldspars and quartz. The next question is: Is it an organic paint or a carbon-based, “mixed”paint? Inorganic admixtures are only casual. Relatively high concentration of alumina is expected to haveappeared due to aluminum mobility in acidic environment and this was provided by organic tar/pitchsubstances. Phosphorus (usually with calcium) mostly concentrates together with clay minerals. Thus,hypothesis on bone powder or ash addition to tar/pitch should be excluded. Some elements may originatenot only from inorganic substances but also from wood ashes.
© 2010 Elsevier B.V. All rights reserved.
1. Introduction
The investigation of the materials and pigments used in archae-ological objects such as ceramic fragments can provide informationrelated to the identification, origin, date, authenticity and alsoconservation of such objects. Raman spectroscopy, among othernondestructive techniques, has been increasingly applied for theanalysis of such objects [1]. Pigment examination is one of the mostactive research areas. Several papers concern also black pigment onexternal parts of pottery fragments [2–5].
Necessity of use of tar and pitch was recognized very earlyand both were applied frequently. Tar is defined as a black sub-stance, semi-liquid when hot and warm, hard when cold, mademostly of birch bark [6], enriched in light hydrocarbons; whereaspitch, which is macroscopically similar but denser and thicker,was made predominantly of bark and pine timber (op. cit.). Both
∗ Corresponding author. Tel.: +48 12 663 2067; fax: +48 12 634 0515.E-mail addresses: [email protected] (J. Trabska),
[email protected] (A. Wesełucha-Birczynska), [email protected](J. Zieba-Palus).
products were manufactured in a process of wood pyrolysis, firstin pits, later (at least in Neolithic [7]) in a double vessel pro-cess, which was described by Albertus Magnus in his treatises [8].Along with tarry substances of various densities, many other use-ful substances were produced, among others turpentine and soot[9].
Tarry substances served a wide variety of purposes, bothpractical (a glue, a trap for birds and other small animals, animpregnate for wood, pottery and leather, a waterproof medium,a medicine, a lubricant, a leaven of wine and beer fermentation[10], flammable mixtures for military purposes [11]) and spiritual(daubing of door and beds [10], filling in a mouth of the deadmouth to prevent their transition to a specter [12]). Their min-eral counterpart, bitumen, was used in the Neolithic of the NearEast for similar purposes [13]. Residues of tarry substances wereidentified on exterior and in interior surfaces of early Neolithicpottery.
Pottery external surfaces may have been covered with tarry sub-stances to seal them or/and to decorate them [7] or to preparea surface for sticking a tree bark ornament [14]. The researchedBronze Age urn from Odense was supposed to belong to intention-ally decorated vessels.
1386-1425/$ – see front matter © 2010 Elsevier B.V. All rights reserved.doi:10.1016/j.saa.2010.08.068

Author's personal copy
J. Trabska et al. / Spectrochimica Acta Part A 79 (2011) 824– 830 825
Fig. 1. Black layer, put on carefully evened surface. Black arrow points at a thin,poorly visible band resulting from penetration of particles of the black substanceinto the core. PLM, one nicol.
2. Materials and methods
2.1. Sampling
Samples of an urn (Bronze Age period VI, Kildehuse II, OdenseCounty) were provided in two, ca. 0.8 mm long and 0.4 mm widepieces.
Raw birch tar, produced in a double-vessel process, was usedas a reference material to estimate a rapidity and evolutionof graphitization processes. Raw tar was heated in an oven inreduced atmosphere, in 600 ◦C for 10 and 30 min and in 750 ◦Cfor 10 min. Graphitization was expected to initiate in the selectedranges.
Fig. 2. Black arrow points at thickness of partially oxidized surface under the paint-ing layer; explanation in the text. PLM, one nicol.
2.2. Plane polarized light microscopy
Plane polarized light microscopy (PLM) was applied with Olym-pus BX 51 apparatus, photographs were taken also with the cameraOlympus DP 25 attached to the microscope
2.3. Scanning electron microscopy
Scanning microscopy with X-ray microanalyser (SEM/EDS) withNano Nova FEI Company apparatus was used. Qualitative analyseswith no standard were performed. Samples were not covered withgold or graphite and spectra were collected at 18 keV.
Fig. 3. (A–D) Raman spectra with the images of analyzed surface. All measurements refer to a central part of an image.
Author's personal copy
826 J. Trabska et al. / Spectrochimica Acta Part A 79 (2011) 824– 830
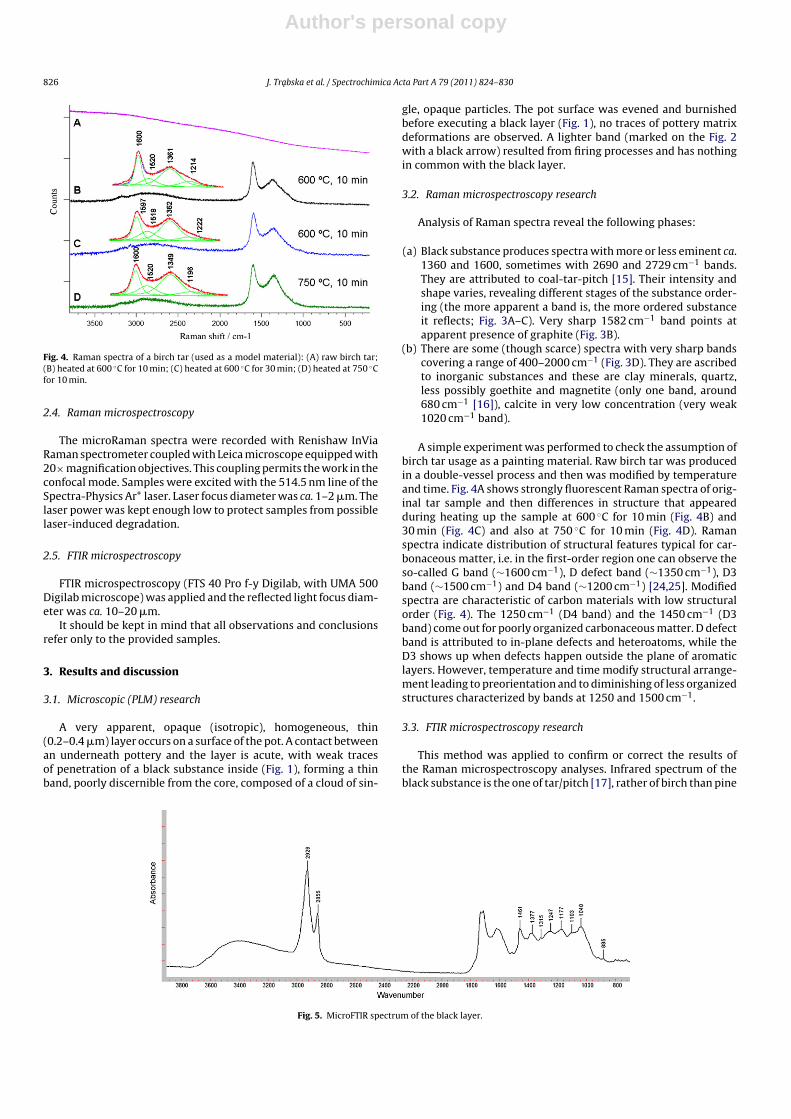
Fig. 4. Raman spectra of a birch tar (used as a model material): (A) raw birch tar;(B) heated at 600 ◦C for 10 min; (C) heated at 600 ◦C for 30 min; (D) heated at 750 ◦Cfor 10 min.
2.4. Raman microspectroscopy
The microRaman spectra were recorded with Renishaw InViaRaman spectrometer coupled with Leica microscope equipped with20× magnification objectives. This coupling permits the work in theconfocal mode. Samples were excited with the 514.5 nm line of theSpectra-Physics Ar+ laser. Laser focus diameter was ca. 1–2 �m. Thelaser power was kept enough low to protect samples from possiblelaser-induced degradation.
2.5. FTIR microspectroscopy
FTIR microspectroscopy (FTS 40 Pro f-y Digilab, with UMA 500Digilab microscope) was applied and the reflected light focus diam-eter was ca. 10–20 �m.
It should be kept in mind that all observations and conclusionsrefer only to the provided samples.
3. Results and discussion
3.1. Microscopic (PLM) research
A very apparent, opaque (isotropic), homogeneous, thin(0.2–0.4 �m) layer occurs on a surface of the pot. A contact betweenan underneath pottery and the layer is acute, with weak tracesof penetration of a black substance inside (Fig. 1), forming a thinband, poorly discernible from the core, composed of a cloud of sin-
gle, opaque particles. The pot surface was evened and burnishedbefore executing a black layer (Fig. 1), no traces of pottery matrixdeformations are observed. A lighter band (marked on the Fig. 2with a black arrow) resulted from firing processes and has nothingin common with the black layer.
3.2. Raman microspectroscopy research
Analysis of Raman spectra reveal the following phases:
(a) Black substance produces spectra with more or less eminent ca.1360 and 1600, sometimes with 2690 and 2729 cm−1 bands.They are attributed to coal-tar-pitch [15]. Their intensity andshape varies, revealing different stages of the substance order-ing (the more apparent a band is, the more ordered substanceit reflects; Fig. 3A–C). Very sharp 1582 cm−1 band points atapparent presence of graphite (Fig. 3B).
(b) There are some (though scarce) spectra with very sharp bandscovering a range of 400–2000 cm−1 (Fig. 3D). They are ascribedto inorganic substances and these are clay minerals, quartz,less possibly goethite and magnetite (only one band, around680 cm−1 [16]), calcite in very low concentration (very weak1020 cm−1 band).
A simple experiment was performed to check the assumption ofbirch tar usage as a painting material. Raw birch tar was producedin a double-vessel process and then was modified by temperatureand time. Fig. 4A shows strongly fluorescent Raman spectra of orig-inal tar sample and then differences in structure that appearedduring heating up the sample at 600 ◦C for 10 min (Fig. 4B) and30 min (Fig. 4C) and also at 750 ◦C for 10 min (Fig. 4D). Ramanspectra indicate distribution of structural features typical for car-bonaceous matter, i.e. in the first-order region one can observe theso-called G band (∼1600 cm−1), D defect band (∼1350 cm−1), D3band (∼1500 cm−1) and D4 band (∼1200 cm−1) [24,25]. Modifiedspectra are characteristic of carbon materials with low structuralorder (Fig. 4). The 1250 cm−1 (D4 band) and the 1450 cm−1 (D3band) come out for poorly organized carbonaceous matter. D defectband is attributed to in-plane defects and heteroatoms, while theD3 shows up when defects happen outside the plane of aromaticlayers. However, temperature and time modify structural arrange-ment leading to preorientation and to diminishing of less organizedstructures characterized by bands at 1250 and 1500 cm−1.
3.3. FTIR microspectroscopy research
This method was applied to confirm or correct the results ofthe Raman microspectroscopy analyses. Infrared spectrum of theblack substance is the one of tar/pitch [17], rather of birch than pine
Fig. 5. MicroFTIR spectrum of the black layer.

Author's personal copy
J. Trabska et al. / Spectrochimica Acta Part A 79 (2011) 824– 830 827
Fig. 6. (A) Compact, plane surface of organic origin (magnification 1000×). (B) EDS analysis made in the central part. (C) EDS analysis of the grainy areas.
[18,19] as a weak but apparent 880 cm−1 band was found, though amixture of pine and birch tar cannot be excluded (op. cit.) due to twoslightly discernible near 1380 cm−1 bands (Fig. 5). Presence of 2855and 2928 cm−1 band proves that tar is more probable than pitch.
3.4. Microscopic and chemical (SEM/EDS) research
Micromorphological analyses of a black surface point at itscompact, homogeneous character; no bubbles, blisters and deep
cracks were observed (Fig. 6A). In several points higher magnifi-cation reveals some lack of homogeneity: subtle flaky structureexists within compact parts (Fig. 7A). The latter are composedmainly of carbon (Figs. 6B and 7B) but other elements have alsobeen detected: alumina, chloride, phosphorus, calcium, potassium,natrium and silica, though in a very low concentration (Fig. 7C,Table 1).
Other components, of specific flaky morphology, are alumosili-cates of chlorite group, serpentinite group and clay minerals. Quartz
Author's personal copy
828 J. Trabska et al. / Spectrochimica Acta Part A 79 (2011) 824– 830
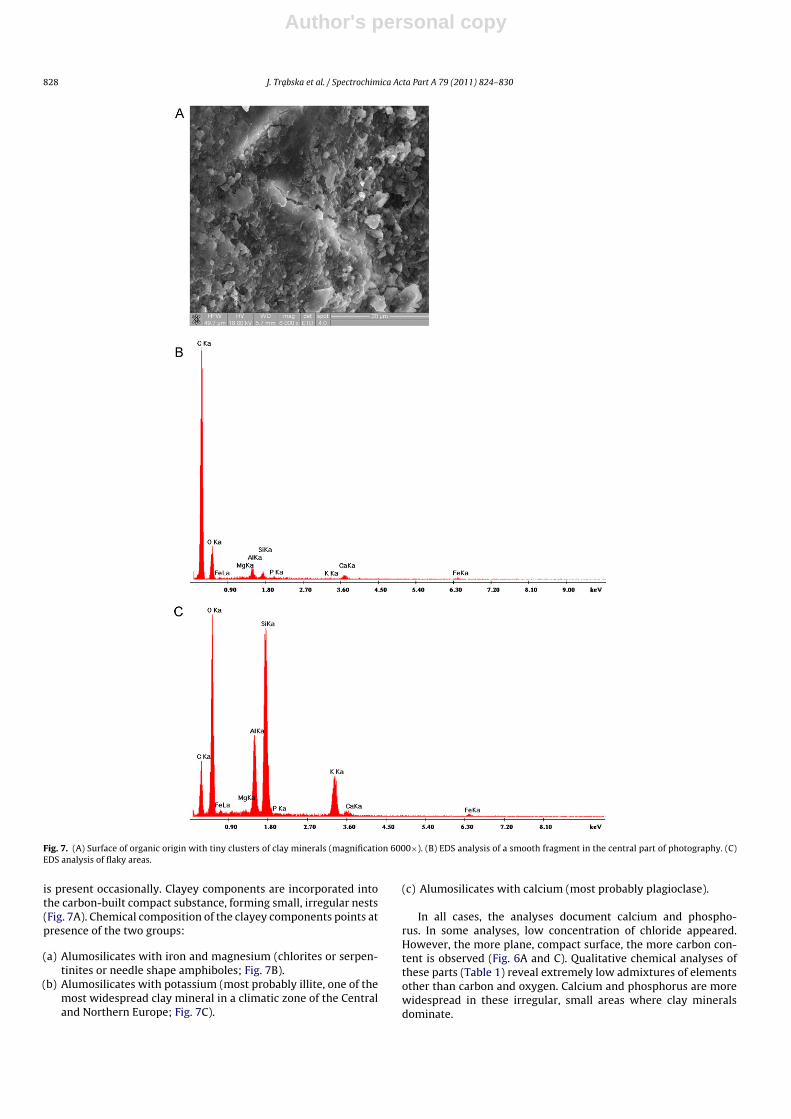
Fig. 7. (A) Surface of organic origin with tiny clusters of clay minerals (magnification 6000×). (B) EDS analysis of a smooth fragment in the central part of photography. (C)EDS analysis of flaky areas.
is present occasionally. Clayey components are incorporated intothe carbon-built compact substance, forming small, irregular nests(Fig. 7A). Chemical composition of the clayey components points atpresence of the two groups:
(a) Alumosilicates with iron and magnesium (chlorites or serpen-tinites or needle shape amphiboles; Fig. 7B).
(b) Alumosilicates with potassium (most probably illite, one of themost widespread clay mineral in a climatic zone of the Centraland Northern Europe; Fig. 7C).
(c) Alumosilicates with calcium (most probably plagioclase).
In all cases, the analyses document calcium and phospho-rus. In some analyses, low concentration of chloride appeared.However, the more plane, compact surface, the more carbon con-tent is observed (Fig. 6A and C). Qualitative chemical analyses ofthese parts (Table 1) reveal extremely low admixtures of elementsother than carbon and oxygen. Calcium and phosphorus are morewidespread in these irregular, small areas where clay mineralsdominate.

Author's personal copy
J. Trabska et al. / Spectrochimica Acta Part A 79 (2011) 824– 830 829
Table 1Semiquantitative chemical EDS analyses of the black layer (wt%).
Element 002/8 002/9 008/1 008/2 010/3 010/4
C 82.47 47.37 22.91 32.27 29.81 38.04O 15.28 38.87 43.03 40.43 38.80 32.05Na 0.23 0.19 0.07 0.26 0.07 0.11Mg 0.14 0.56 2.87 0.88 0.00 1.30Al 0.34 4.35 9.14 6.74 1.69 7.01Si 0.21 4.90 8.24 12.99 27.89 11.75P 0.06 0.35 0.14 0.50 0.12 0.67K 0.11 0.41 0.17 0.94 0.10 1.56Ca 0.80 1.04 0.29 0.73 0.16 0.68Fe 0.36 1.96 13.14 4.27 1.36 6.82Total 100.00 100.00 100.00 100.00 100.00 100.00
4. Discussion
Observation of the black layer under the polarized light micro-scope (PLM) suggests that we deal with an opaque, isotropic layer,purposely put on a leather-hard, burnished surface of a pot: a verysharp contact between the layer and the pot surface points that thepot itself must have been fired and burnished before the actionof painting (Fig. 1). No traces of organic substances that mighthave modified a pot surface before painting (additional sealing,impregnating; e.g. wax, milk casein) were detected. Lighter bandjust under the surface of the pot (ca. 0.6 mm thick), is expected tohave appeared due to changes in firing regime (Fig. 2). The blacklayer reveals all features of a painting layer executed with a densesubstance: it coats the pot with a continuous 0.2–0.4 �m thick layerthat is quite typical thickness of painting layer. Thin, cloudy bandof irregularly penetrating, dispersed opaque spots just beneath thepot surface evidences that the black layer must have been appliedwhile warm or hot (Fig. 1).
When it was recognized that the black layer is a true paintinglayer, not just a casual contamination, and the following procedurewas to identify what the composition of the layer is.
Spectroscopic analyses point that tar/pitch was applied(Figs. 3 and 4; Raman and FTIR). Carbon black should be defi-nitely excluded [20]. The analyzed organic substance is structurallyordered in various degrees due to varying temperature influence(up to ca. 400 ◦C can be considered [15]). Some Raman spectrareveal also more structurally ordered areas, >2000 cm−1, in the so-called second-ordered region of the spectrum (op. cit. 210), pointingat graphite presence and very local higher temperature (ca. 700 ◦C)influence (Fig. 4A–C). This heating (or, more probably, local over-heating) must have obviously taken place in reductive atmosphere.One can estimate the G band area of 600◦ experiment as 29% and37% for 10 min and 30 min, respectively. D3 band for the sameexperiment is 35% and 22%, respectively (Fig. 4B and C). Trans-formation to graphite, while local temperature is enough high,resembling progressed carbonation of the slow wood pyrolysis of450–700 ◦C [26].
Scarce points reveal in the Raman spectra presence of inorganicadmixtures: clay minerals, feldspars and quartz. Most probably theblack substance is a birch tar, not pitch, which is proved by presenceof 2855 and 2928 cm−1 FTIR bands as well as the lack of blisters anddeep cracks (comp. Fig. 5A; also [7]).
The next question is: Is it an organic paint or a carbon-based,“mixed” paint [21]? The problem was solved with the SEM/EDSobservations (Fig. 7): plane, compact areas with high carbon con-tent dominate (Fig. 6A and B) and the areas enriched in inorganicsubstance are scarce and irregular (Figs. 6C and 7A–C). Thus, it canbe stated that the inorganic admixtures are only casual. Compactsurface, without blisters and common cracks, suggests the usage oftarry rather than pitchy substance [7]. Some remarks concerningthe pattern of chemical composition may appear necessary. Rela-
tively high concentration of alumina is expected to have appeareddue to aluminum mobility in acidic environment which was pro-vided by organic tar/pitch substances (Fig. 6C; [22]). Phosphorus(usually with calcium) concentrates mostly in the sheet mineralsoccurrence. Thus, hypothesis on bone powder or ash addition totar/pitch should be excluded. It should be kept in mind that someelements may originate not only from inorganic substances but alsofrom wood ashes. In a 1 m3 of a fresh pine wood, 0.2 kg of potas-sium, 0.03 kg of sodium, 0.09 kg of magnesium, 0.45 kg of calcium,0.13 kg of phosphorus, 0.08 kg of silica and 0.02 kg of sulphur canbe found. Some of them or all can be adsorbed on clay mineralssurfaces (estimation based on data published at Krzysik [23]).
No traces of a tool (a brush? A spatula?) that was used to exe-cute a painting layer were observed. This information should becollected in macroscopic observation of a whole pot.
5. Conclusions
(a) The examined vessel was covered with a black layer purposely.(b) A vessel was fired and its surface thoroughly smoothed before
a process of painting.(c) Black layer carries all features of a painting layer: it is thin and
more or less even.(d) Black substance is a birch or a birch-pine tar, pure, with only
accidental admixtures of clay minerals, chlorite group mineralsand quartz.
(e) Local ordering of tar components was detected in some Ramanspectra: their comparison with reference data and the results ofexperimental works suggest rather influence of a high temper-ature (at least 600 ◦C). However, the process lasted presumablya very short time. It is supposed that graphitization was a casualprocess that occurred either during production or during vesselusage.
(f) It should be stressed here that Raman spectroscopy enables toestimate a range of temperature that influenced tar.
Acknowledgement
The authors would like to express their gratefulness to Mr.Michał Przybycien for providing a raw tar for experimentalresearch.
References
[1] P. Vandenabeele, H.G.M. Edwards, L. Moens, Chem. Rev. 107 (2007) 675–686.[2] J. van der Weerd, G.D. Smith, S. Firth, R.J.H. Clark, J. Archaeol. Sci. 31 (2004)
1429–1437.[3] C. Sandalinas, S. Ruiz-Moreno, A. Lopez-Gil, J. Miralles, J. Raman Spectrosc. 37
(2006) 1146–1153.[4] J. Striova, C. Lofrumento, A. Zoppi, E.M. Castellucci1, J. Raman Spectrosc. 37
(2006) 1139–1145.[5] R.J.H. Clark, L. Curri, G.S. Henshaw, C. Laganara, J. Raman Spectrosc. 28 (1997)
105–109.[6] J.S. Mills, R. White, The Organic Chemistry of Museum Objects, Butterworth,
London, 1986.[7] B. Józwiak, M. Kobusiewicz, J.J. Langer, S. Pietrzak, Sprawozdania Archeolog-
iczne 58 (2006) 355–365.[8] H. Azulewicz, in: W. Brzezinski, W. Piotrowski (Eds.), Proceedings of the
First International Symposium on Wood Tar and Pitch, State ArchaeologicalMuseum, Warszawa, 1997, pp. 221–230.
[9] N. Utkin, in: W. Brzezinski, W. Piotrowski (Eds.), Proceedings of the First Inter-national Symposium on Wood Tar and Pitch, State Archaeological Museum,Warszawa, 1997, pp. 127–136.
[10] K. Bonfield, C. Heron, N. Nemcek, in: W. Brzezinski, W. Piotrowski (Eds.), Pro-ceedings of the First International Symposium on Wood Tar and Pitch, StateArchaeological Museum, Warszawa, 1997, pp. 203–212.
[11] Cz. Sikorski, in: W. Brzezinski, W. Piotrowski (Eds.), Proceedings of theFirst International Symposium on Wood Tar and Pitch, State ArchaeologicalMuseum, Warszawa, 1997, pp. 235–248.
[12] W. Piotrowski, in: W. Brzezinski, W. Piotrowski (Eds.), Proceedings of theFirst International Symposium on Wood Tar and Pitch, State ArchaeologicalMuseum, Warszawa, 1997, pp. 279–296.

Author's personal copy
830 J. Trabska et al. / Spectrochimica Acta Part A 79 (2011) 824– 830
[13] J. Connan, O.P. Nieuwehhuyse, A. Van As, L. Jacobs, Archaeometry 46 (2004)115–124.
[14] J. Langer, J. Rola, in: W. Brzezinski, W. Piotrowski (Eds.), Proceedings of theFirst International Symposium on Wood Tar and Pitch, State ArchaeologicalMuseum, Warszawa, 1997, pp. 35–40.
[15] M.A. Montes-Morán, J.L. Crespo, R.J. Young, R. Garcia, S.R. Moinelo, Fuel ProcessTechnol. 77–78 (2002) 207–212.
[16] F. Ospitali, T. Sabetta, F. Tullini, M.C. Nannetti, G. Di Lonardo, J. Raman Spectrosc.36 (2005) 18–23.
[17] J. Langer, A. Kosko, Folia Praehistorica Posnaniensia IX (1999) 63–78(in Polish).
[18] K. Ruthenberg, in: W. Brzezinski, W. Piotrowski (Eds.), Proceedings of theFirst International Symposium on Wood, Tar and Pitch, State ArchaeologicalMuseum, Warszawa, 1997, pp. 173–180.
[19] K. Ruthenberg, J. Weiner, in: W. Brzezinski, W. Piotrowski (Eds.), Proceedings ofthe First International Symposium on Wood, Tar and Pitch, State ArchaeologicalMuseum, Warszawa, 1997, pp. 29–34.
[20] D.C. Smith, M. Bouchard, M. Lorblanchet, J. Raman Spectrosc. 30 (1999)347–354.
[21] J.D. Stewart, K. Adams, Am. Antiquity 64 (1999) 675–696.[22] A. Kabata-Pendias, H. Pendias, Biogeochemistry of Trace Elements (in Polish),
PWN, Warszawa, 1999.[23] W. Krzysik, Wood Properties (in Polish), PWN, Warszawa, 1978.[24] O. Beyssac, B. Goffe, J.-P. Petitet, E. Froigneux, M. Moreau, J.-N. Rouzaud, Spec-
trochim. Acta A 59 (2003) 2267–2276.[25] O. Urban, J. Jehlicka, J. Pokorny, J.-N. Rouzaud, Spectrochim. Acta A 59 (2003)
2331–2340.[26] Z. Wang, J. Cao, J. Wang, J. Anal. Appl. Pyrol. 84 (2009) 179–184.