Watershed land use effects on lake water quality in Denmark
14
Ecological Applications, 22(4), 2012, pp. 1187–1200 Ó 2012 by the Ecological Society of America Watershed land use effects on lake water quality in Denmark ANDERS NIELSEN, 1,2,3,5 DENNIS TROLLE, 1,2 MARTIN SøNDERGAARD, 1,2 TORBEN L. LAURIDSEN, 1,2 RIKKE BJERRING, 1 JøRGEN E. OLESEN, 2,3 AND ERIK JEPPESEN 1,2,4 1 Department of Bioscience, Aarhus University, Vejlsøvej 25, P.O. Box 314, 8600 Silkeborg, Denmark 2 Sino-Danish Centre for Education and Research (SDC), Beijing, China 3 Department of Agroecology, Aarhus University, Blichers Alle´ 20, P.O. Box 50, 8830 Tjele, Denmark 4 Greenland Climate Research Centre (GCRC), Greenland Institute of Natural Resources, Kivioq 2, P.O. Box 570 3900, Nuuk, Greenland Abstract. Mitigating nutrient losses from anthropogenic nonpoint sources is today of particular importance for improving the water quality of numerous freshwater lakes worldwide. Several empirical relationships between land use and in-lake water quality variables have been developed, but they are often weak, which can in part be attributed to lack of detailed information about land use activities or point sources. We examined a comprehensive data set comprising land use data, point-source information, and in-lake water quality for 414 Danish lakes. By excluding point-source-influenced lakes (n ¼ 210), the strength in relationship (R 2 ) between in-lake total nitrogen (TN) and total phosphorus (TP) concentrations and the proportion of agricultural land use in the watershed increased markedly, from 10–12% to 39–42% for deep lakes and from 10–12% to 21–23% for shallow lakes, with the highest increase for TN. Relationships between TP and agricultural land use were even stronger for lakes with rivers in their watershed (55%) compared to lakes without (28%), indicating that rivers mediate a stronger linkage between landscape activity and lake water quality by providing a ‘‘delivery’’ mechanism for excess nutrients in the watershed. When examining the effect of different near-freshwater land zones in contrast to the entire watershed, relationships generally improved with size of zone (25, 50, 100, 200, and 400 m from the edge of lake and streams) but were by far strongest using the entire watershed. The proportion of agricultural land use in the entire watershed was best in explaining lake water quality, both relative to estimated nutrient surplus at agricultural field level and near-lake land use, which somewhat contrasts typical strategies of management policies that mainly target agricultural nutrient applications and implementation of near-water buffer zones. This study suggests that transport mechanisms within the whole catchment are important for the nutrient export to lakes. Hence, the whole watershed should be considered when managing nutrient loadings to lakes, and future policies should ideally target measures that reduce the proportion of cultivated land in the watershed to successfully improve lake water quality. Key words: freshwater lakes; GIS analysis; land use; nonpoint pollution; water quality; watershed. INTRODUCTION Input of nitrogen (N) and phosphorus (P) from both point and nonpoint sources causes deterioration of the water quality of freshwater ecosystems (Meybeck 1982, Isermann 1990, Kronvang et al. 2005b) and is a major challenge for water quality managers around the world (Smith et al. 1999). Through time, implementation of new and improved technologies has successfully reduced the input of nutrients from point sources in many parts of the world (Carpenter et al. 1998). Nevertheless, losses of nutrients from the watershed often exceed the loading threshold for sustaining a clear-water status in many water bodies (Scheffer and Jeppesen 2007, Taranu and Gregory-Eaves 2008), and nutrients derived from agricultural land have been found to be of particular importance for the lack of recovery of water quality (Downing and McCauley 1992, Duda 1993, Turner and Rabalais 2004). While mitigation of point-source nutrient losses is relatively easy to manage (e.g., redirection of sewage outlets or increased treatment of effluents), mitigation of nonpoint losses from agricul- tural land is more complex, since these are influenced by several interacting factors (e.g., nutrient cycling process- es and complex nutrient transport pathways), which, in turn, are affected by spatial differences in past and present land use and management (Turner 1989, Naveh 2000) and landscape characteristics (Ekholm et al. 2000, Bennett et al. 2001). The strong linkage between freshwater ecosystems and their watershed (Soranno et al. 1996) emphasizes the need for examination and quantification of the influence of watershed character- istics on the water quality of lakes. Manuscript received 10 October 2011; revised 16 January 2012; accepted 23 January 2012. Corresponding Editor (ad hoc): C. B. Craft. 5 E-mail: [email protected] 1187
-
Upload
independent -
Category
Documents
-
view
8 -
download
0
Transcript of Watershed land use effects on lake water quality in Denmark

Ecological Applications, 22(4), 2012, pp. 1187–1200� 2012 by the Ecological Society of America
Watershed land use effects on lake water quality in Denmark
ANDERS NIELSEN,1,2,3,5 DENNIS TROLLE,1,2 MARTIN SøNDERGAARD,1,2 TORBEN L. LAURIDSEN,1,2 RIKKE BJERRING,1
JøRGEN E. OLESEN,2,3 AND ERIK JEPPESEN1,2,4
1Department of Bioscience, Aarhus University, Vejlsøvej 25, P.O. Box 314, 8600 Silkeborg, Denmark2Sino-Danish Centre for Education and Research (SDC), Beijing, China
3Department of Agroecology, Aarhus University, Blichers Alle 20, P.O. Box 50, 8830 Tjele, Denmark4Greenland Climate Research Centre (GCRC), Greenland Institute of Natural Resources, Kivioq 2,
P.O. Box 570 3900, Nuuk, Greenland
Abstract. Mitigating nutrient losses from anthropogenic nonpoint sources is today ofparticular importance for improving the water quality of numerous freshwater lakesworldwide. Several empirical relationships between land use and in-lake water qualityvariables have been developed, but they are often weak, which can in part be attributed to lackof detailed information about land use activities or point sources. We examined acomprehensive data set comprising land use data, point-source information, and in-lakewater quality for 414 Danish lakes. By excluding point-source-influenced lakes (n¼ 210), thestrength in relationship (R2) between in-lake total nitrogen (TN) and total phosphorus (TP)concentrations and the proportion of agricultural land use in the watershed increasedmarkedly, from 10–12% to 39–42% for deep lakes and from 10–12% to 21–23% for shallowlakes, with the highest increase for TN. Relationships between TP and agricultural land usewere even stronger for lakes with rivers in their watershed (55%) compared to lakes without(28%), indicating that rivers mediate a stronger linkage between landscape activity and lakewater quality by providing a ‘‘delivery’’ mechanism for excess nutrients in the watershed.When examining the effect of different near-freshwater land zones in contrast to the entirewatershed, relationships generally improved with size of zone (25, 50, 100, 200, and 400 mfrom the edge of lake and streams) but were by far strongest using the entire watershed. Theproportion of agricultural land use in the entire watershed was best in explaining lake waterquality, both relative to estimated nutrient surplus at agricultural field level and near-lake landuse, which somewhat contrasts typical strategies of management policies that mainly targetagricultural nutrient applications and implementation of near-water buffer zones. This studysuggests that transport mechanisms within the whole catchment are important for the nutrientexport to lakes. Hence, the whole watershed should be considered when managing nutrientloadings to lakes, and future policies should ideally target measures that reduce the proportionof cultivated land in the watershed to successfully improve lake water quality.
Key words: freshwater lakes; GIS analysis; land use; nonpoint pollution; water quality; watershed.
INTRODUCTION
Input of nitrogen (N) and phosphorus (P) from both
point and nonpoint sources causes deterioration of the
water quality of freshwater ecosystems (Meybeck 1982,
Isermann 1990, Kronvang et al. 2005b) and is a major
challenge for water quality managers around the world
(Smith et al. 1999). Through time, implementation of
new and improved technologies has successfully reduced
the input of nutrients from point sources in many parts
of the world (Carpenter et al. 1998). Nevertheless, losses
of nutrients from the watershed often exceed the loading
threshold for sustaining a clear-water status in many
water bodies (Scheffer and Jeppesen 2007, Taranu and
Gregory-Eaves 2008), and nutrients derived from
agricultural land have been found to be of particular
importance for the lack of recovery of water quality
(Downing and McCauley 1992, Duda 1993, Turner and
Rabalais 2004). While mitigation of point-source
nutrient losses is relatively easy to manage (e.g.,
redirection of sewage outlets or increased treatment of
effluents), mitigation of nonpoint losses from agricul-
tural land is more complex, since these are influenced by
several interacting factors (e.g., nutrient cycling process-
es and complex nutrient transport pathways), which, in
turn, are affected by spatial differences in past and
present land use and management (Turner 1989, Naveh
2000) and landscape characteristics (Ekholm et al. 2000,
Bennett et al. 2001). The strong linkage between
freshwater ecosystems and their watershed (Soranno et
al. 1996) emphasizes the need for examination and
quantification of the influence of watershed character-
istics on the water quality of lakes.
Manuscript received 10 October 2011; revised 16 January2012; accepted 23 January 2012. Corresponding Editor (adhoc): C. B. Craft.
5 E-mail: [email protected]
1187
Several studies have attempted to establish empirical
relationships between watershed characteristics and the
water quality of freshwater lakes (Norvell et al. 1979,
Taranu and Gregory-Eaves 2008, Abell et al. 2011).
However, both historical and existing point sources
potentially influence the current water quality of lakes
(Jeppesen et al. 1999), rendering the statistical relations
with watershed characteristics relatively weak (Sliva and
Dudley Williams 2001). In an attempt to improve
relationships Taranu and Gregory-Eaves (2008) consid-
ered only lakes with ,10% urban area in the watershed.
Nevertheless, lakes can be influenced by several other
point sources such as aquaculture and rural area sewage
discharges (Smith et al. 1999) that are not fully
encapsulated by data on land use properties.
Denmark is, as several other lowland countries
worldwide, intensively cultivated (.60% agricultural
land). Today, agriculture is the main contributor of N
(82%) and P (43%) loading to the lakes (Boutrup et al.
2007, OECD 2007, Bjerring et al. 2010). Denmark
experienced a rapidly intensifying agricultural produc-
tion and expanding urbanization from the 1950s to the
1990s, causing deteriorated water quality of freshwater
lakes (Jeppesen et al. 1999). Consequently, political
awareness of these pollution problems has since the mid-
1980s prompted several regional and national aquatic
action plans focusing on reducing the external loading of
both N and P (Jeppesen et al. 1999, Kronvang et al.
2005b). The efficiency of wastewater treatment plants
has been improved by orders of magnitude (Jeppesen et
al. 1999), and leaching, particularly of N, from arable
land has been reduced through changes in agricultural
practices, in particular by lowering total N inputs
(Grant et al. 2000, Grant and Waagepetersen 2003,
Kronvang et al. 2005b). Nevertheless, the external
nutrient input to the lakes is still high and water quality
thus overall poor (Søndergaard et al. 2000). To
successfully improve water quality, it has proven
necessary to reduce even further the nonpoint source
external loading of nutrients to the lakes (Jeppesen et al.
1999, 2005a). A critical prerequisite for managers is,
therefore, to understand how the properties of a
watershed affect the water quality of its lakes.
Through years of intense monitoring activities, a
comprehensive data set has been collected for many
Danish lakes, encompassing spatially distributed water-
shed data as well as lake water quality data. Combined
with data on point-source contributors, this provides a
unique opportunity to further elucidate the interactions
between watershed characteristics (e.g., land use) and
the water quality of freshwater lakes, and we hypoth-
esize that by accounting for external nutrient loading
sources, which are not attributed to diffuse pollution, we
will find stronger and unprecedented significant relations
between watershed characteristics and water quality
attributes. Moreover, we aim to search for statistical
relationships between watershed characteristics and lake
water quality variables by subdividing lakes into
morphological and geological categories and to test the
sensitivity of computed statistical relations when water-shed characteristics are extracted from discrete GIS-
delineated zones in the watershed expanding at variousdistances from the lake shore and inlet streams in
contrast to the entire watershed.
MATERIALS AND METHODS
Study sites
The study lakes (n¼ 414) were distributed nationwidein Denmark (568 N, 108 E; Fig. 1) with a lowland
landscape with loamy and/or sandy soils as thedominant geological features and temperate climatic
conditions. The analysis comprised several data sourcescontributing with site specific watershed properties and
in-lake water quality variables (Table 1), i.e., delineationof watersheds, lake surfaces, and river networks, land
use activity, land cover properties, and information oncropping practices as well as geological characteristics,
potential drainage, and slope characteristics. Further-more, we included data on external nutrient loading,
categorized as a qualitative true/false approach onwhether lakes were influenced by various nutrient pointsources or not.
Watershed properties and lake water quality variables
For all GIS-based data sets representing watershedproperties, we created an ArcGIS (version 9.3.1 editor
license; ESRI, Redlands, California, USA) modelbuilder with a sequential data extraction procedure
using the tabulate area and zonal statistics functionalityincluded in the spatial analyst tool. Prior to data
processing, all GIS data sets (except the agriculturalblock data set) were converted to homogeneous raster
data sets with a grid resolution of 10 3 10 m. Since anagricultural block is a geographical continuous polygon
holding from 1 to 10 crop fields inside, these blocks wereprocessed by the ArcGIS union functionality to calculate
the area ratio between the agricultural block partlocated inside and outside the watershed, respectively.
Consequently, the areal fraction of each distinctagricultural practice (e.g., pasture, crop fields, set asideland, and forest) allocated to each agricultural block was
then adjusted by the computed area ratio. We definedthe agricultural land use as the pooled area proportion
(%) in each watershed (non-lake area) either in rotation(arable crops, rotational grassland, etc.) or as permanent
pasture (cultivated less than every fifth year), and forestland cover as the area proportion (%) of forest (Nielsen
et al. 2000). All processed watersheds were subsequentlysupplemented with water quality variables and morpho-
logical data for each individual lake.
Lake water quality data from 1999 to 2007
We selected only data collected between 1999 and
2007 for three reasons: (1) lake water quality variableshave, on an average national scale, approached a steady
state during this period following a transient state after
ANDERS NIELSEN ET AL.1188 Ecological ApplicationsVol. 22, No. 4

external nutrient loading reductions in the 1980s and
early 1990s (Kronvang et al. 2005b, 2008); (2) prior to
1999 agricultural block data were not systematically
recorded (Kristensen and Larsen 2000); and (3) the set-
aside schemes for arable land were abolished in 2008,
resulting in re-cultivation of approximately 80 000 ha of
land (Levin and Jepsen 2010), which may, in recent
years, have had a transitional effect on the lakes.
Additional prerequisites for variables included in the
statistical analysis were availability of morphological
data on average lake depth and measurements of lake
total alkalinity. In summary, these criteria limited the
number of lakes to a total of 414 (Fig. 1) ranging from
oligotrophic to eutrophic (Table 1).
Only a few of these lakes had complete time series of
water quality variables with reasonable temporal reso-
lution to represent lake dynamics each year from 1999–
2007, and sampling frequencies were generally highest
during the summer months. To avoid overrepresentation
of some lakes in our analysis, we averaged the water
quality variables collected between 15 July and 15
September for all available years during the period
1999–2007 for each individual lake (more than 80% of
the lakes were represented by fewer than four years).
This procedure assumed that changes in watershed
FIG. 1. Spatial location of the 414 Danish lakes included in the statistical analysis. Point-source-influenced lakes (210 lakes)were characterized by significant point-source loading, high density of bird or fish (carp, Cyprinus carpio) communities or by ducksfed for hunting purposes. The nonpoint-source-influenced lakes (204 lakes) were those assumed to be mainly influenced by diffusenutrient loading from the watershed.
June 2012 1189LAND USE EFFECTS ON LAKE WATER QUALITY

property variables over time did not influence in-lake
water quality variables, which were examined for lakes
(n ¼ 20) with continuous measurements each year from
1999 to 2007. By linear regression we tested for relations
between changes in agricultural land use over time and
the in-lake water quality variables: total phosphorus
(TP), total nitrogen (TN), and chlorophyll a (chl a), but
no relations were found (and changes in agricultural
land use were only minor during this period).
Screening procedure and exclusion of individual lakes
We followed a four-step screening procedure: (1)
initially computed individual linear regression analyses
including all selected water quality variables separately
as dependent variables (DV) and agricultural land use
and forest land cover as separate independent variables
(IV), (2) repeated step (1) with log10-transformed water
quality variables after analysis of probability plots and
histograms, (3) categorical selection by identifying lakes
in which water quality was largely attributed to
watershed land uses and associated diffuse pollution,
(4) performance of a principal component analysis
(PCA) based on geological and morphological data in
order to examine if subdivision of lakes into groups
related to watershed properties could improve the
relationships. Additionally, correlations between resid-
uals from computed linear regressions and watershed
and lake characteristics were examined. Step 3 was
based on the GIS-enl (DME 2010) data set comprising a
qualitative external nutrient source contribution from
point sources: wastewater treatment plants, storm water
runoff, aquaculture, rural area sewage, duck feeding,
high density of stocked carp (Cyprinus carpio), or high
natural bird density from a comprehensive national
scrutiny conducted by regional authorities (counties) as
part of the preparations for implementing the European
Union Water Framework Directive (Kaika 2003, Dahlin
et al. 2004). As identified by several studies (e.g., Arnold
and Gibbons 1996, Hatt et al. 2004, Alberti et al. 2007),
urban area land use correlates closely with degraded
quality of water bodies. In accordance with Taranu and
Gregory-Eaves (2008), we therefore introduced an
additional classification criterion using the AIS data
set and excluded lakes with an urban area .10% within
TABLE 1. Overview of included data sets and site-specific parameters.
Data layer Source PurposeTimeseries
Compilationyear
Danish digital surface geological map 1 computation of geological characteristics no 1988
Potential drained area 2 computation of potential drainagecharacteristics
no 2009
Agricultural block data 3 computation of spatially distributedcropping practice
1999–2009
Danish area information system landuse map (AIS)
1 computation of land use and land covercharacteristics
no 1990–1999
Danish national digital elevationmodel (DEM)
4 computation of average watershed slope no 2008
AU water quality database (ODA) 5, 6, 7 computation of in-lake water qualityvariables
1989–2010
GIS layer, external nutrient loading(GIS-enl)
8 categorization of external nutrientloading source identifications
no 2008
Notes: An individual agricultural block was considered a geographical continuous unit having from 1 to 10 crop fields. Thepotential drainage map published by Olesen (2009) expresses the probability of drainage activity, i.e., the likelihood (percentage) ofactual drainage of a certain area. Agricultural land use is defined as the pooled area proportion (percentage) of each watershed(non-lake area) either in rotation (arable crops, rotational grassland, etc.) or as permanent pasture (cultivated less than every fifthyear) and forest land cover as the area proportion (percentage) of forest defined by Nielsen et al. (2000) in each watershed (non-lakearea). Abbreviations are: Min, minimum; Max, maximum; NA, not applicable.
Sources: 1, Nielsen et al. (2000); 2, Olesen (2009); 3, Kristensen and Larsen (2000); 4, Knudsen and Olsen (2009); 5, Søndergaardet al. (1992); 6, Kronvang et al. (1993); 7, Lauridsen et al. (2007); 8, DME (2010).
ANDERS NIELSEN ET AL.1190 Ecological ApplicationsVol. 22, No. 4

the watershed, assuming that these lakes were influenced
considerably by urbanization and associated point
sources.
Nutrient balances at agricultural field scale
In order to examine if variation in water quality in
lakes was better explained by the actual nutrient balance
on agricultural fields than by the overall agricultural
land use in the watershed or if the nutrient balances
could contribute with additional significant explained
variance through a multiple linear regression, we
included an estimated N and P balance on agricultural
field scale aggregated to a mean nutrient balance (kg/ha)
for each individual watershed. These balances were
published by Børgesen et al. (2009) and estimated from
register data on nutrient inputs, crop types, and harvest
yields at field scale. We used data from 2005 since
estimations of nutrient balances for agricultural fields
were only completed for this particular year. Because
nutrient balance data were not available for all
watersheds included and limited to 2005, such data
were not included in the PCA analysis, but was related
in an additional analysis to lake water quality variables
(represented by an average collected from 15 July to 15
September between 1999 and 2007), separated into
shallow (n ¼ 117) and deep (n ¼ 41) lakes.
All statistical analyses were performed using the SAS
statistical software package (version 9.2; SAS Institute
2008), and a significance level criterion of P � 0.05 was
applied in all tests. We used the coefficient of
determination (R2) obtained from linear regressions by
the REG procedure to search for significant relations
between watershed properties and in-lake water quality
variables. The FACTOR procedure was used to perform
PCA as exploratory analysis to identify possible
categorical variables for sub-grouping of data, and the
GLM procedure was used to perform analysis of
covariance (ANCOVA) for comparing linear regressions
(intercept and slope) among identified sub-groups.
Sensitivity analysis - buffer zones
vs. whole watershed approach
GIS-delineated lake shore and riparian zones were
prepared using the data layers from Nielsen et al. (2000)
comprising lake surface polygons and river networks.
The buffer delineation routine was implemented in an
ArcGIS model builder using the buffer functionality in
the ArcGIS analysis tool package; thus, this buffer
delineation is a pseudo representation of real zones
implemented by managers (with no consideration of
landscape formation, etc.). For each watershed we
created five near-freshwater land zones extending 25,
50, 100, 200, and 400 m from the water bodies (both
TABLE 1. Extended.
Spatialresolution Variable Abbreviation N Unit Min Max Mean
200 m sand sand 414 % 0.0 100.0 55.9gravel gravel 414 % 0.0 23.7 0.3loam loam 414 % 0.0 100.0 41.6limestone limestone 414 % 0.0 74.1 0.9
NA potential drainage pot. dr. 414 % 12.2 95.0 48.9
block data agricultural land use agri 414 % 0.0 94.3 45.0
smallest size of vectors 4 mand polygons 200 m2
forest land cover forest 414 % 0.0 88.9 19.6
urban area land use UA 414 % 0.0 82.1 10.2total river length in watershed RL 414 km 0.0 287.2 9.9watershed area (excluding lake) WA 414 ha 4.3 42 745.9 1747.7
8 3 8 m and an approximateaccuracy of 0.1 m
mean slope in watershed slope 414 degrees 0.2 10.0 3.1
NA lake mean depth Z 414 m 0.1 15.0 2.3lake max depth Zmax 196 m 0.3 32.8 4.9lake volume V 406 mill m3 0.0 212.8 3.4lake retention time Rt 191 yr 0.0 18.0 1.0lake surface area A 414 ha 0.1 3954.2 80.0total alkalinity TA 414 mmol/L 0.0 6.3 2.2total phosphorus, Jul–Sep TP 412 mg/L 0.01 4.0 0.2total nitrogen, Jul–Sep TN 413 mg/L 0.3 12.8 1.7chlorophyll a, Jul–Sep chl a 397 lg/L 1.7 1340.0 77.5
NA wastewater treatment plantsstorm water runoffaquaculturerural area sewageduck feedinghigh natural bird densityhigh stocked carp density
June 2012 1191LAND USE EFFECTS ON LAKE WATER QUALITY

lakes and rivers) and extracted watershed attribute date
within each zone by the tabulate area functionality
included in the ArcGIS spatial analyst tool. The
sensitivity analysis included only lakes with river
networks data in their watershed (n¼ 116) as we wanted
to evaluate the differential effect of five zones along
rivers and the near-lake zones on the lake water quality
variables. Watershed properties from each zone size
were related to water quality variables (represented by
an average of water quality variables collected from 15
July to 15 September) divided into two lake depth
categories (shallow, n ¼ 85, and deep, n ¼ 31), and R2-
values were calculated for comparison with relations for
watershed properties of the whole non-lake watershed.
With special focus on relations between agricultural
land use and water quality (TN and TP), we furthermore
sequentially extracted data on the agricultural land use
only within the part of the watersheds not covered by
each of the five different zones (not-near-zone) around
rivers and lakes. In a stepwise multiple linear regression
it was then examined whether the agricultural land use
in each of the zones or in the corresponding not-near-
zone part of the watershed explained most of the
variance in water quality, and if the R2 changed
significantly by adding both variables.
RESULTS
The relationships between watershed characteristics
and log10-transformed lake water quality variables were
overall significant (P , 0.05), ranging from approxi-
mately (R2) 5–12% for both agricultural land use and
forest land cover, being strongest for TN vs. agricultural
land use (Fig. 2 and Table 2). Exclusion of lakes under
influence by other factors than diffuse nutrient loading
(Fig. 2 and Table 2) overall resulted in a doubling of the
explained variation of water quality variables by
agricultural land use or forest land cover. Agricultural
land use generally explained more of the variation in
water quality variables than forest land cover.
Effects of lake subdivision from geological
and morphological attributes
To explore the most important explanatory variables of
variance between lakes, we conducted a PCA analysis for
the subset (n ¼ 96) of lakes where data for all included
variables was available. Correlations between the two
components (PC1 and PC2) and the variables showed that
loam (0.90), potential drainage (0.89), sand (�0.88), andtotal alkalinity (TA; 0.80) were all strongly related to PC1,
whereas watershed area (0.70), lake surface area (0.42),
FIG. 2. Linear regression plots for agricultural land use and forest land cover vs. water quality variables total nitrogen (TN;mg/L), total phosphorus (TP; mg/L), and chlorophyll a (chl a; lg/L). Water quality variables were averaged from 15 July to 15September with no interpolation. Data were averaged over the period 1999–2007, each lake thus being represented by a single datapoint. Step 2 refers to log10-transformed water quality attributes, and step 3 to the application of a filter removing all lakesinfluenced by point sources. Dashed lines are upper and lower 95% confidence intervals.
ANDERS NIELSEN ET AL.1192 Ecological ApplicationsVol. 22, No. 4
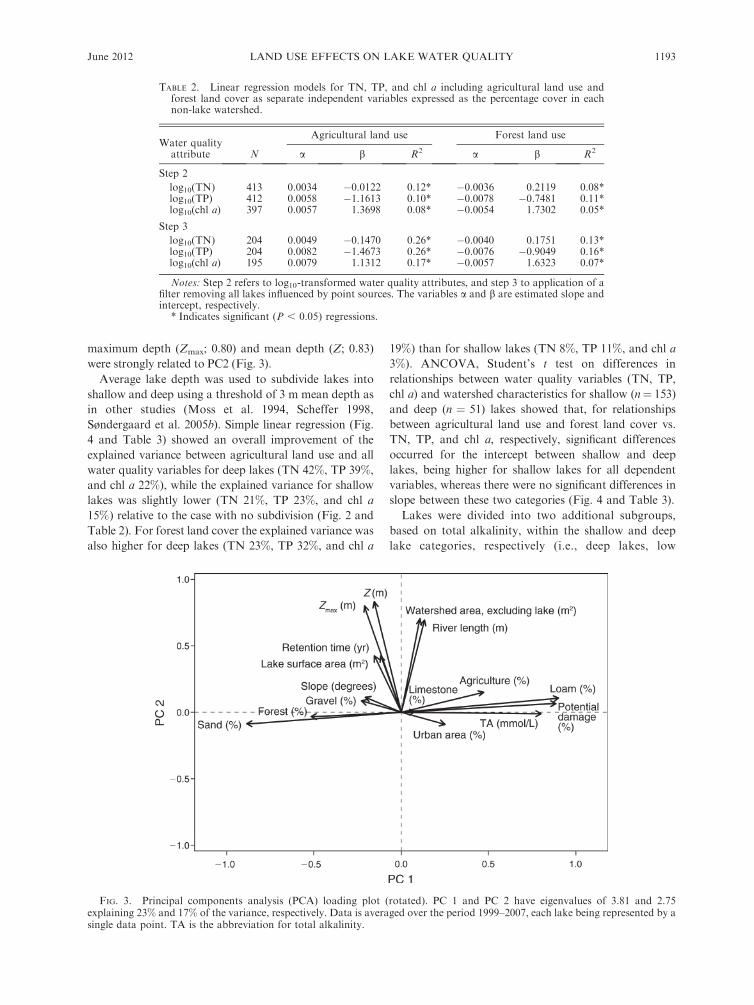
maximum depth (Zmax; 0.80) and mean depth (Z; 0.83)
were strongly related to PC2 (Fig. 3).
Average lake depth was used to subdivide lakes into
shallow and deep using a threshold of 3 m mean depth as
in other studies (Moss et al. 1994, Scheffer 1998,
Søndergaard et al. 2005b). Simple linear regression (Fig.
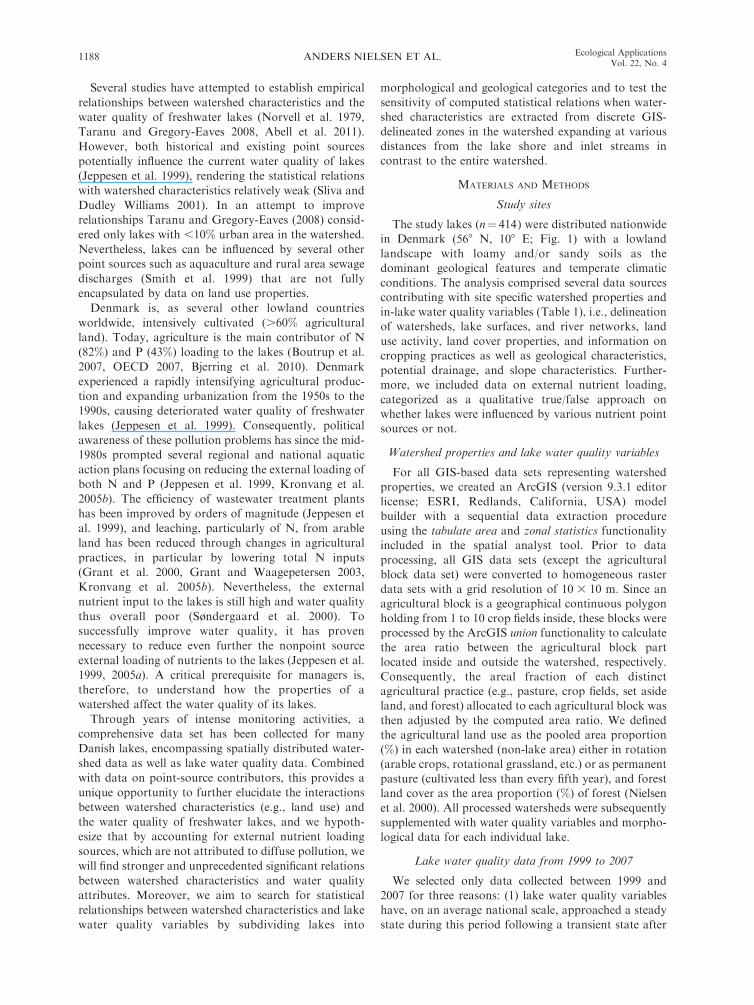
4 and Table 3) showed an overall improvement of the
explained variance between agricultural land use and all
water quality variables for deep lakes (TN 42%, TP 39%,
and chl a 22%), while the explained variance for shallow
lakes was slightly lower (TN 21%, TP 23%, and chl a
15%) relative to the case with no subdivision (Fig. 2 and
Table 2). For forest land cover the explained variance was
also higher for deep lakes (TN 23%, TP 32%, and chl a
19%) than for shallow lakes (TN 8%, TP 11%, and chl a
3%). ANCOVA, Student’s t test on differences in
relationships between water quality variables (TN, TP,
chl a) and watershed characteristics for shallow (n¼ 153)
and deep (n ¼ 51) lakes showed that, for relationships
between agricultural land use and forest land cover vs.
TN, TP, and chl a, respectively, significant differences
occurred for the intercept between shallow and deep
lakes, being higher for shallow lakes for all dependent
variables, whereas there were no significant differences in
slope between these two categories (Fig. 4 and Table 3).
Lakes were divided into two additional subgroups,
based on total alkalinity, within the shallow and deep
lake categories, respectively (i.e., deep lakes, low
TABLE 2. Linear regression models for TN, TP, and chl a including agricultural land use andforest land cover as separate independent variables expressed as the percentage cover in eachnon-lake watershed.
Water qualityattribute N
Agricultural land use Forest land use
a b R2 a b R2
Step 2
log10(TN) 413 0.0034 �0.0122 0.12* �0.0036 0.2119 0.08*log10(TP) 412 0.0058 �1.1613 0.10* �0.0078 �0.7481 0.11*log10(chl a) 397 0.0057 1.3698 0.08* �0.0054 1.7302 0.05*
Step 3
log10(TN) 204 0.0049 �0.1470 0.26* �0.0040 0.1751 0.13*log10(TP) 204 0.0082 �1.4673 0.26* �0.0076 �0.9049 0.16*log10(chl a) 195 0.0079 1.1312 0.17* �0.0057 1.6323 0.07*
Notes: Step 2 refers to log10-transformed water quality attributes, and step 3 to application of afilter removing all lakes influenced by point sources. The variables a and b are estimated slope andintercept, respectively.
* Indicates significant (P , 0.05) regressions.
FIG. 3. Principal components analysis (PCA) loading plot (rotated). PC 1 and PC 2 have eigenvalues of 3.81 and 2.75explaining 23% and 17% of the variance, respectively. Data is averaged over the period 1999–2007, each lake being represented by asingle data point. TA is the abbreviation for total alkalinity.
June 2012 1193LAND USE EFFECTS ON LAKE WATER QUALITY

alkalinity [n¼15] and deep lakes, high alkalinity [n¼36],
and shallow lakes, low alkalinity [n ¼ 47] and shallow
lakes, high alkalinity [n ¼ 106]). Total alkalinity was
selected to implicitly reflect the geological conditions of
the watershed (Shoup 1947, Moyle 1956) because sand
and loam were extracted from the same GIS layer
(Danish Digital Surface Geological Map) as used for
computation of the potential drainage data set by Olesen
(2009), thereby creating problems with intercorrelation
(double representation). A criterion for total alkalinity
(annual average), low (,1 mmol/L), and high (.1
mmol/L), was used (where 1 mmol/L equals 50 mg/L as
CaCO3). The variation explained in water quality
variables based on watershed data was overall similar
to that without subdivision in alkalinity (Fig. 4 and
Table 3). ANCOVA tests for differences in relationships
between water quality variables and watershed charac-
teristics for shallow and deep lakes separated into high
and low alkalinity showed that, for shallow lakes (n ¼153), both agricultural land use and forest land cover vs.
TN and TP exhibited a significant difference in intercept,
which was higher for low alkalinity. Difference in slope
was insignificant. For deep lakes (n ¼ 51), only
agricultural land use vs. TN showed a significant
difference in intercept and no significant difference in
slope. For chl a no significant differences were observed
for either intercept or slope in any of the tests (Table 4).
Examination of the variability in the relations
between watershed and in-lake water quality by
correlation analysis between residuals from computed
linear regressions and watershed characteristics showed
no significant influence of watershed characteristics on
residuals for chl a, whereas residuals for TN (r ¼ 0.16)
and TP (r ¼ 0.25) were significantly related to the
potential drained area of the watershed. Neither lake
surface area, watershed area (excluding lake) nor mean
slope of the watershed were significantly related to the
residuals of TN and TP (Table 5).
Nutrient balances at agricultural field scale
relative to water quality
Inclusion of estimated N and P balances on agricul-
tural field scale aggregated to a mean nutrient balance
(kg/ha) for each individual watershed using 2005 data
(Børgesen et al. 2009) did not yield a better explanatory
factor for the variance in water quality than agricultural
land use in the watershed when comparing N balance
FIG. 4. Linear regression plots for lakes with no influencefrom point-source nutrient pollution; agricultural land use andforest land cover vs. water quality variables. Water qualityvariables were treated as an average from 15 July to 15September with no interpolation. Data were furthermoreaveraged over the period 1999–2007, each lake being repre-sented by a single data point. Regression was computed relativeto average lake depth category (circles and solid lines, shallowlakes [n ¼ 153]; crosses and dashed lines, deep lakes [n ¼ 51]).
TABLE 3. Regression statistics for lakes with no influence from point-source nutrient pollution.
Water qualityattribute Depth N
AgricultureTest for differencebetween groups Forest
Test for differencebetween groups
a b R2 s i a b R2 s i
log10(TN) S 153 0.0040 �0.0593 0.21* 0 þ �0.0030 0.1981 0.08* 0 þD 51 0.0063 �0.3364 0.42* �0.0049 0.0657 0.23*
log10(TP) S 153 0.0075 �1.3565 0.23* 0 þ �0.0064 �0.8580 0.11* 0 þD 51 0.0086 �1.6956 0.39* �0.0082 �1.1070 0.32*
log10(chl a) S 145 0.0075 1.2039 0.15* 0 þ �0.0041 1.6496 0.03* 0 þD 50 0.0078 0.9838 0.22* �0.0078 1.5294 0.19*
Notes: Dependent variables (water quality variables) are TN, TP, and chl a; independent variables are agricultural land use andforest land cover. Water quality variables were treated as an average from 15 July to 15 September with no interpolation. Data werefurthermore averaged over the period 1999–2007, each lake being represented by a single data point. Regression was computedrelative to average lake depth (shallow [S] deep [D]). The symbols þ or 0 indicate if slope (s) or intercept (i ) between groups(shallow/deep) are significant (þ) or not (0). The variables a and b are estimated slope and intercept, respectively.
* Indicates significant (P , 0.05) regressions.
ANDERS NIELSEN ET AL.1194 Ecological ApplicationsVol. 22, No. 4

with TN and chl a, respectively, and P balance with TP
and chl a, respectively (represented by an average
collected from 15 July to 15 September between 1999
and 2007) and separated between shallow (n¼ 117) and
deep (n¼ 41) lakes. Even inclusion of nutrient balancestogether with the agricultural land use, in a multiple
linear regression analysis, did not contribute significant-
ly (P . 0.05) with additional explained variance.
Sensitivity analysis: buffer zones vs. whole-watershed
approach relative to water quality
Sensitivity analysis of discrete areas in the watershed
expanding at various distances from the lake and inlet
stream zones (25, 50, 100, 200, and 400 m) showed a
significant difference in explained variance between deep(n ¼ 31) and shallow (n ¼ 85) lakes (Table 6). The
strongest relationship for deep lakes was generally
observed between agricultural land use in the various
riparian zones and the in-lake TP concentration,whereas variations in TN between lakes were better
explained by agricultural land use within the lake shore
zones. The same pattern was observed for the relation-
ship with forested land cover. The explained variance
increased as the zones expanded in size, but in all casesthe land use for the whole watershed showed a stronger
relation to in-lake water quality variables than any of
the sub-watershed zones. For shallow lakes, all relations
were considerably weaker than for deep lakes (e.g., 400
m lake shore zone TN was 48% for deep lakes and 13%for shallow lakes). For shallow lakes, relations also
improved with increasing buffer size.
Division of lakes into those with river networks within
the watersheds and those without (i.e., deep lakes, no
river network, n¼ 20; deep lakes with river network, n¼31; shallow lakes, no river network, n¼ 68; and shallow
lakes with river network, n¼ 85) showed a significantly
steeper slope for deep lakes with rivers in their watershed
for both TP (intercept ¼ �1.77, P ¼ 0.53 and slope ¼0.011, P¼ 0.05) and chl a (intercept¼ 0.83, P¼ 0.37 and
slope ¼ 0.013, P ¼ 0.01), respectively, related to
agricultural land use. No significant differences in slope
were found for shallow lakes.
With special focus on relations between agricultural land
use in various zones of the watershed and water quality
(TNandTP selected), agricultural landuse (%) within each
of the near-shore zones was identified as having weaker
explanatory power than agricultural land use, in the
remaining part of the watershed, except for the 400-m
near-lake zones. Here, variation in both TN (R2¼ 49%)
and TP (R2¼36%) for deep lakes was better explained by
agricultural land use within the near-lake zone than for the
distant-lake part of the watershed. Considering the change
in R2 when both agricultural land use within near-shore
zones and in the remaining part of the watershed were
included in a multiple linear regression, only the agricul-
tural land use within the 25-m near-river zone added
TABLE 4. Regression line statistics for lakes with no influence from point-source nutrient pollution.
Agriculture Forest
Waterqualityattribute Depth Alk N
Test for differencebetween groups
Test for differencebetween groups
a b R2 s i a b R2 s i
log10(TN) S L 47 0.0041 �0.1187 0.25* 0 þ �0.0012 0.0508 0.02 0 þS H 106 0.0029 0.0220 0.10* �0.0029 0.2350 0.06*D L 15 0.0040 �0.3299 0.29* 0 þ �0.0021 �0.1320 0.10 0 0D H 36 0.0066 �0.3299 0.33* �0.0056 0.1008 0.12*
log10(TP) S L 47 0.0053 �1.4188 0.20* 0 þ �0.0042 �1.1170 0.11* 0 þS H 106 0.0063 �1.2418 0.13* �0.0051 �0.8046 0.05*D L 15 0.0076 �1.7672 0.37* 0 0 �0.0033 �1.4323 0.08 0 0D H 36 0.0068 �1.5682 0.22* �0.0109 �1.0260 0.28*
log10(chl a) S L 47 0.0075 1.2145 0.14* 0 0 �0.0012 1.4919 0.00 0 0S H 106 0.0077 1.1889 0.12* �0.0053 1.7016 0.04D L 15 0.0107 0.8589 0.34* 0 0 �0.0065 1.4272 0.15 0 0D H 36 0.0045 1.1725 0.06 �0.0074 1.5380 0.08
Notes: Dependent variables (water quality variables) are TN, TP, and chl a; independent variables are agricultural land use andforest land cover. Water quality variables were treated as an average from 15 July to 15 September with no interpolation. Data werefurthermore averaged over the period 1999–2007, each lake being represented by a single data point. Regression was computedrelative to average lake depth (shallow [S] deep [D]) and total alkalinity (high [H] low [L]). Grouped by alkalinity (Alk), the symbolsþ or 0 indicates if slope (s) or intercept (i ) between groups (high/low) are significant (þ) or not (0). The variables a and b areestimated slope and intercept, respectively.
* Indicates significant (P , 0.05) regressions.
TABLE 5. Correlation matrix including watershed characteris-tics (Table 1) and residuals from regression analysis withagricultural land use as the independent variable and in-lakeconcentration of TN, TP, and chl a as dependent individualvariables.
VariableResidual
TNResidual
TPResidualchl a
Potential drainage 0.16* 0.25* 0.01Lake surface area 0.02 0.06 0.08Watershed area (excluding
lake area)0.10 0.01 0.04
Mean slope in watershed �0.06 0.03 0.12
* Significant Pearson correlation (P , 0.05).
June 2012 1195LAND USE EFFECTS ON LAKE WATER QUALITY

significantly (P¼0.020) to the variance explained for TP in
shallow lakes (an additional 5.5% on top of the 15.2%
explained by the agricultural land use in the remaining part
of the watershed).
DISCUSSION
Our analyses showed that an increase in the propor-
tion of watershed area in agricultural land use led to
higher TN, TP, and chl a, whereas an increase in forest
land cover lowered the concentrations. These findings
concur with those of many other studies (e.g., Jones et
al. 2004, Galbraith and Burns 2007, Egemose and Jensen
2009), evidencing the key role of nonpoint nutrient
losses in a cultivated landscape (Carpenter et al. 1998,
Fraterrigo and Downing 2008). As hypothesized,
exclusion of lakes with important contribution from
point sources and categorization of lakes into two depth
categories led to overall significant improvements of the
relationships. For example, we found that the variance
in TN and TP explained by both agricultural land use
and forest land cover increased approximately three-fold
for deep lakes compared to shallow lakes. By contrast,
additional division into geological categories (using total
alkalinity as a proxy) did not lead to a further increase in
R2 values. Residuals from computed linear regressions
for both TN (r ¼ 0.16) and TP (r ¼ 0.25) were
significantly, although weakly, related to the potential
drained area of the watershed, which may therefore to
some extent impair the statistical regressions between
land use and lake water quality variables.
Nutrient balance data at agricultural field scale
vs. agricultural land use data
Information on average N and P nutrient surpluses
for agricultural crop fields (Børgesen et al. 2009) was not
a better explanatory factor for the variance in water
quality than the agricultural land use (%) in the
watershed itself, and it did not contribute with
significant additional explained variance in a multiple
linear regression with the proportion of agricultural land
use included. Hence, our results suggest that the
agricultural practice within the watershed impacts lake
water quality irrespective of the nutrient balance at the
cultivated fields. However, the nutrient balance itself is
only a measure of the nutrient excess at crop field level
and not the actual export to receiving waters, which is
influenced by crop and soil processes (soil management,
soil structure, vegetation cover, etc. [Jarvis et al. 2011])
as well as historical accumulated nutrient pools in the
soil (Eriksen et al. 2004, Berntsen et al. 2006) and
turnover and retention along the hydrologic pathways to
export nutrients. A recent analysis of N leaching data
from long-term experiments in Denmark under modest
fertilization has shown that N leaching is more linked to
autumn land cover (catch crops) and soil management
(tillage) in agricultural fields than to nutrient manage-
ment (Askegaard et al. 2011). It is possible that the
TABLE 6. Sensitivity analysis relative to lake shore and riparian buffer zones presented asexplained variance (R2) for regression analyses between average water quality variables andagricultural land use/forest land use, representing a total of 116 lakes (shallow lakes n¼ 85 anddeep lakes n ¼ 31).
Zone Size (m)
Shallow lakes Deep lakes
chl a TN TP chl a TN TP
Agriculture
Whole 0.14* 0.22* 0.15* 0.47* 0.50* 0.57*Lake 400 0.01 0.12* 0.05* 0.37* 0.49* 0.44*
200 0.01 0.12* 0.03 0.28* 0.43* 0.37*100 0.00 0.10* 0.01 0.17* 0.28* 0.27*50 0.00 0.09* 0.01 0.09 0.14* 0.19*25 0.00 0.08* 0.01 0.06 0.08 0.14*
Riparian 400 0.08* 0.11* 0.04 0.36* 0.40* 0.52*200 0.06* 0.07* 0.01 0.27* 0.34* 0.44*100 0.06* 0.05* 0.01 0.19* 0.26* 0.34*50 0.06* 0.04 0.00 0.15* 0.22* 0.28*25 0.05* 0.03 0.00 0.13* 0.19* 0.22*
Forest
Whole 0.06* 0.08* 0.06* 0.34* 0.46* 0.47*Lake 400 0.00 0.03 0.00 0.24* 0.43* 0.37*
200 0.01 0.02 0.00 0.16* 0.34* 0.31*100 0.02 0.01 0.01 0.09 0.23* 0.28*50 0.03 0.00 0.02 0.06 0.14* 0.23*25 0.03 0.00 0.04 0.05 0.11 0.20*
Riparian 400 0.04 0.05* 0.00 0.20* 0.28* 0.33*200 0.02 0.01 0.01 0.18* 0.22* 0.34*100 0.01 0.00 0.02 0.15* 0.14* 0.28*50 0.01 0.00 0.03 0.11 0.08 0.22*25 0.00 0.01 0.04 0.09 0.05 0.18*
* Significant relationships (P , 0.05).
ANDERS NIELSEN ET AL.1196 Ecological ApplicationsVol. 22, No. 4

regulations on nutrient management in Danish agricul-
ture (Kronvang et al. 2008) have lowered excess N
inputs to a level where N surplus has only a minor
influence on N leaching losses, but is rather controlled
by the type of vegetation cover, i.e., if the land area is
agriculturally cultivated or not.
Implications of variability in lake water quality
Overall, we found a considerable variation in the
relationship between lake water quality variables and
watershed characteristics. This is presumably due to
several interacting factors such as nutrient cycling
processes and complex nutrient transport pathways,
which, in turn, are affected by various spatial differences
in historical and present land use management (Turner
1989, Naveh 2000) as well as landscape characteristics
(Ekholm et al. 2000, Bennett et al. 2001). Also, variation
in internal loading (Søndergaard et al. 2005a) and in
interactions between nutrients, fish, plankton, sub-
merged macrophytes, and water clarity (Jeppesen et al.
2005b) may add to the variability. The largest year-to-
year variances in water quality attributes were observed
in the shallow lakes, which is in accordance with findings
of other studies (e.g., Norvell et al. 1979, Taranu and
Gregory-Eaves 2008). Shallow lakes tend to have
alternate states that affect in-lake TP, TN, and chl a
(Moss 1990, Scheffer et al. 1993), and switches between
a clear-water state (dominated by submerged vegetation)
and a turbid (phytoplankton dominated) state will
greatly enhance the year-to-year variability. Moreover,
the intercept of the relationships with agricultural land
use was higher for shallow lakes for all water quality
variables (TP, TN, and chl a), which may be attributed
to the low ratio of water volume to sediment area
(Nagid et al. 2001, Jackson 2003, Jeppesen et al. 2003),
resulting in greater influence of sediment resuspension
(Jeppesen et al. 2003) and internal nutrient loading
(Søndergaard et al. 2003). In addition, an overall shorter
hydraulic retention time in shallow lakes results in lower
nutrient retention (TP and TN) and lower nutrient loss
(TN) (Vollenweider 1970, Windolf et al. 1996).
Sensitivity analysis: buffer zones vs. whole-watershed
approach relative to water quality
Inour study, landscape slope (degrees) of thewatersheds
did not improve any of the relationships (data not shown),
which contrasts the findings of other studies (Ekholm et al.
2000,Chang et al. 2008,Hazlett et al. 2008)where slopehas
been identified as a key variable for the loss of primarily
phosphorus (e.g., associated with erosion). However,
Denmark is a flat country (highest altitude above sea level
is 170 m), so the mean slope of the watershed included in
our analyses may not be an appropriate proxy, as the
riparian areas may locally be comparatively steep and
potentially play a more important role. Inclusion of GIS-
delineated riparian zone data did not, however, lead to an
improvement of the relationships (data not shown). This is
somewhat surprising since buffer zones, with various types
of vegetation, are currently being established by managers
to reduce nutrient runoff with a documented effect (Vol
1993, Sliva and Dudley Williams 2001). For example,
Kronvang et al. (2005a) reported that 5–10 m buffer zones
could significantly enhance nutrient retention in northern
watersheds depending on soil type, and Peterjohn and
Correll (1984) showed that nutrient removal in riparian
forests was of ecological significance for receiving waters.
However, these studies were all of small scale and nutrients
were monitored in the stream or river at the edge of the
buffer. In contrast, our analysis was conducted at
watershed scale and based on lake water quality attributes,
including GIS data sets with a relatively coarse spatial
resolution (ranging from 4–200 m in accuracy). In several
other studies (e.g., Richards et al. 1996, Allan et al. 1997),
analogous large-scale GIS analyses have also been
included as a supplement to local scale field studies when
examining possible linkages between watershed land use
and stream water quality. Similar to our study, Sliva and
Dudley Williams (2001) and Hunsaker and Levine (1995)
found that data representing thewholewatershedprovided
better relationships with stream water quality than data
from near-stream zones; others (e.g., Johnson et al. 1997)
found near-river zones (100 m) to be better predictors of
stream water quality, and yet others (e.g., Amiri and
Nakane 2008) recommend integration of both land use
data from the entire watershed and near-shore zones.
These different findings indicate that the importance of
near-river zonesmay depend on site specific characteristics
not included in large-scale spatial analyses (in our case
watershed GIS analyses). Consequently, we may have
underestimated the influence of these zones because
watershed characteristics were not represented at a
sufficiently detailed spatial scale to correctly mimic the
many transport processes linking nutrient source areas to
the water bodies (Kronvang et al. 2002).
However, the lack of capturing such local processes
may not only reflect scale issues, but also the type of
water body. All studies discussed above examined water
quality in streams or rivers. While water quality in
individual streams or rivers is determined by the local
sub-watershed, lakes are often recipients of several
tributaries and of groundwater. Thereby, lake water
quality becomes an integral of wide ranges of sub-local
watershed processes. It is therefore natural that lake
water quality is linked to the whole watershed, whereas
stream and river water quality is linked more closely to
the local riparian part of the watershed, as documented
in several studies (e.g., Richards et al. 1996, Johnson et
al. 1997). We found stronger relationships between TP
and the relative area of agricultural land use for the
watersheds in which a river network was present, not
least for deep lakes, indicating a closer connection
between the whole watershed and lakes when connected
to streams or rivers. Moreover, we found that agricul-
tural land use within the 25-m river-near zone contrib-
uted significantly (P ¼ 0.020) with minor additional
explained variance of TP in shallow lakes (adding 5.5%
June 2012 1197LAND USE EFFECTS ON LAKE WATER QUALITY

to the 15.2% explained [R2] by the agricultural land use
within the watershed). Thereby measures, such as
traditional best management practices, implemented in
the zones closest to the river should contribute positively
to lake water quality; however, our results suggest that
lake water quality is more strongly linked to the surface
activity in the whole watershed. By contrast, we did not
find stronger relationships for TN in lakes with streams
and rivers inside their watershed. However, studies have
shown that tile drainage systems can account for a large
proportion of TN exported from agricultural fields
(David et al. 1997, Simmelsgaard 1998, Tomer et al.
2003). Approximately 50% of the arable land in Den-
mark is drained with subsurface pipes (Olesen 2009),
thus bypassing the natural soil and groundwater
transport processes. That drainage of agricultural fields
might be of importance for lake water quality (both TN
and TP) was also supported by our analysis of the
residuals from the regressions between land use and lake
water quality variables. This revealed that the potential
drained area in the watershed was significantly and
positively related to residuals in the regressions for both
TN and TP, thus suggesting that lakes in areas with a
high proportion of artificial drainage can exhibit higher
TN and TP concentrations relative to lakes in less
drained areas, even at similar agricultural intensity.
The finding that nutrient concentrations in lakes agree
better with the proportion of agricultural land use in the
entire watershed than with nutrient surplus estimates or
with near-lake/near-connected-stream land use suggests
that policies to reduce nutrient concentrations in lakes
must include measures that reduce the actual agricul-
tural land use proportion in the watershed. This
contrasts the current thinking behind the Danish policies
implemented to ensure adequate quality of aquatic
ecosystems, which mainly target nutrient applications
to the existing agricultural land without considering
changes in land use (Kronvang et al. 2008). Current and
past policies have effectively reduced overuse of
fertilizers and manure and have likely resulted in a
reduction of the nutrient concentrations in streams,
especially for N (Kronvang et al. 2008). While P is still in
surplus at agricultural fields (Grant et al. 2010), the
allowed N application rates are now of a magnitude that
affects the profitability of agricultural systems in Den-
mark (Petersen et al. 2010). Our study emphasizes that a
further reduction in nutrient loadings to Danish lakes
most likely relies on overall reductions in agricultural
land use, for instance in the form of an increase in
forested area or in extensively managed permanent
pastures. This could be supported by the policy in
Denmark to double forested area (Madsen 2002).
Alternatively, current cropland in vulnerable areas could
be converted to perennial energy crops, which have
much lower rates of nutrient losses than arable crops
(Jørgensen 2011), and the Danish policy to shift to
renewable energy may support this (Dalgaard et al.
2011). Targeting the P balance surplus at existing
agricultural fields is also important and should ideally
be lowered to reduce potential losses to Danish lakes,
which are typically P limited (Søndergaard 2007).
CONCLUSIONS
We have shown that the proportion of variance
explained in water quality variables among lakes via
watershed characteristics can be improved considerably
by accounting for influences from point sources and that
division of data sets into deep and shallow lake
categories improved the relationships even further.
Evaluation of relations between land use in lake shore
and riparian zones and, with this, their importance for
mitigating nutrient loadings proved difficult because
lake water quality presumably is an integral of a wide
range of local watershed and tributary processes. Thus,
lake water quality is linked to surface activity in the
whole watershed and agrees better with the proportion
of agricultural land use in the entire watershed than with
near-lake land use. Consequently, future policies to
reduce nutrient concentrations in lakes must include
measures that reduce the actual agricultural land use
proportion in the watershed. To be able to quantify, in
more detail, the importance of small-scale areas (e.g.,
field level and local riparian areas), future studies should
focus on finer scale resolution analyses in order to
account for the many transport processes linking
nutrient source areas with the receiving water bodies.
ACKNOWLEDGMENTS
This study was supported by CRES (Danish StrategicResearch Council), CLEAR (a Villum Kann Rasmussen Centreof Excellence project), EU REFRESH, and EU-WISER. Wethank Anne Mette Poulsen for valuable editorial comments.
LITERATURE CITED
Abell, J. M., D. Ozkundakci, D. P. Hamilton, and S. D. Miller.2011. Relationships between land use and nitrogen andphosphorus in New Zealand lakes. Marine and FreshwaterResearch 62:162–175.
Alberti, M., D. Booth, K. Hill, B. Coburn, C. Avolio, S. Coe,and D. Spirandelli. 2007. The impact of urban patterns onaquatic ecosystems: an empirical analysis in Puget lowlandsub-basins. Landscape and Urban Planning 80:345–361.
Allan, D., D. Erickson, and J. Fay. 1997. The influence ofcatchment land use on stream integrity across multiple spatialscales. Freshwater Biology 37:149–161.
Amiri, B., and K. Nakane. 2008. Entire catchment and bufferzone approaches to modeling linkage between river waterquality and land cover—a case study of YamaguchiPrefecture, Japan. Chinese Geographical Science 18:85–92.
Arnold, C. L., and C. J. Gibbons. 1996. Impervious surfacecoverage: the emergence of a key environmental indicator.Journal of the American Planning Association 62:243–258.
Askegaard, M., J. E. Olesen, I. A. Rasmussen, and K.Kristensen. 2011. Nitrate leaching from organic arable croprotations is mostly determined by autumn field management.Agriculture, Ecosystems and Environment 142:149–160.
Bennett, E. M., S. R. Carpenter, and N. F. Caraco. 2001.Human impact on erodable phosphorus and eutrophication:a global perspective. BioScience 51:227–234.
Berntsen, J., J. E. Olesen, B. M. Petersen, and E. M. Hansen.2006. Long-term fate of nitrogen uptake in catch crops.European Journal of Agronomy 25:383–390.
ANDERS NIELSEN ET AL.1198 Ecological ApplicationsVol. 22, No. 4

Bjerring, R., L. S. Johansson, T. L. Lauridsen, M. Søndergaard,F. Landkildehus, L. Sortkjær, and J. Windolf. 2010. Søer2009. Danmarks Miljøundersøgelser, Aarhus Universitet,Aarhus, Denmark.
Børgesen, C. D., I. T. Kristensen, and R. Grant. 2009.Landbrugsregisterdata anvendt i regionale og landsdækkendeberegninger af N og P tab. Danmarks Miljøundersøgelser,Aarhus Universitet, Aarhus, Denmark.
Boutrup, S., L. v. d. Bijl, P. N. Jensen, L. M. Svendsen, R.Grant, J. Bøgestrand, T. B. Jørgensen, T. Ellermann, G.Ærtebjerg, M. Bruus, B. Søgaard, L. Thorling, and K.Dahlgren, editors. 2007. Vandmiljø og Natur 2006. Tilstandog udvikling—faglig sammenfatning. Danmarks Miljøunder-søgelser, Aarhus Universitet, Aarhus, Denmark.
Carpenter, S. R., N. F. Caraco, D. L. Correll, R. W. Howarth,A. N. Sharpley, and V. H. Smith. 1998. Nonpoint pollutionof surface waters with phosphorus and nitrogen. EcologicalApplications 8:559–568.
Chang, C., W. Kuan, P. Lui, and C. Hu. 2008. Relationshipbetween landscape characteristics and surface water quality.Environmental Monitoring and Assessment 147:57–64.
Dahlin, N. L., F. L. Hansen, E. Krabbe, J. Simonsen, O.Malling, D. F. Møller, N. Reimers, T. Retsloff, and B.Wiklund. 2004. Action plan for biodiversity and natureconservation in Denmark 2004–2009. Danish Government,Copenhagen, Denmark.
Dalgaard, T., J. E. Olesen, S. O. Petersen, B. M. Petersen, U.Jørgensen, T. Kristensen, N. J. Hutchings, S. Gyldenkærne,and J. E. Hermansen. 2011. Developments in greenhouse gasemissions and net energy use in Danish agriculture—How toachieve a CO2-neutral production? Environmental Pollution159:3193–3203.
David, M. B., L. E. Gentry, D. A. Kovacic, and K. M. Smith.1997. Nitrogen balance in and export from an agriculturalwatershed. Journal of Environmental Quality 26:1038–1048.
DME. 2010. Retningslinjer for udarbejdelse af indsatsprogram-mer. Danish Ministry of the Environment, Copenhagen,Denmark.
Downing, J. A., and E. McCauley. 1992. The nitrogen : phos-phorus relationship in lakes. Limnology and Oceanography37:936–945.
Duda, A. M. 1993. Addressing nonpoint sources of waterpollution must become an international priority. WaterScience and Technology 28:1–11.
Egemose, S., and H. S. Jensen. 2009. Phosphorus forms inurban and agricultural runoff: Implications for managementof Danish Lake Nordborg. Lake and Reservoir Management25:410–418.
Ekholm, P., K. Kallio, S. Salo, O. P. Pietilainen, S. Rekolainen,Y. Laine, and M. Joukola. 2000. Relationship betweencatchment characteristics and nutrient concentrations in anagricultural river system. Water Research 34:3709–3716.
Eriksen, J., M. Askegaard, and K. Kristensen. 2004. Nitrateleaching from an organic dairy crop rotation: the effects ofmanure type, nitrogen input and improved crop rotation. SoilUse and Management 20:48–54.
Fraterrigo, J., and J. Downing. 2008. The influence of land useon lake nutrients varies with watershed transport capacity.Ecosystems 11:1021–1034.
Galbraith, L., and C. Burns. 2007. Linking land-use, waterbody type and water quality in Southern New Zealand.Landscape Ecology 22:231–241.
Grant, R., G. Blicher-Mathiesen, P. G. Jensen, B. Hansen, andL. Thorling. 2010. Landovervagningsoplande 2009. NOVA-NA. Danmarks Miljøundersøgelser, Aarhus Universitet,Aarhus, Denmark.
Grant, R., G. Blicher-Mathiesen, V. Jørgensen, A. Kyllings-bæk, H. D. Poulsen, C. Børsting, J. O. Jørgensen, J. S. Schou,E. S. Kristensen, J. Waagepetersen, and H. E. Mikkelsen.2000. Vandmiljøplan II—midtvejsevaluering. DanmarksMiljøundersøgelser, Aarhus Universitet, Aarhus, Denmark.
Grant, R., and J. Waagepetersen. 2003. Vandmiljøplan II—slutevaluering. Danmarks Miljøundersøgelser, DanmarksJordbrugs Forskning. http://www.vmp3.dk/Files/Filer/Slutrapporter/VMPII_Slutevaluering_web.pdf
Hatt, B. E., T. D. Fletcher, C. J. Walsh, and S. L. Taylor. 2004.The influence of urban density and drainage infrastructure onthe concentrations and loads of pollutants in small streams.Environmental Management 34:112–124.
Hazlett, P., K. Broad, A. Gordon, P. Sibley, J. Buttle, and D.Larmer. 2008. The importance of catchment slope to soilwater N and C concentrations in riparian zones: implicationsfor riparian buffer width. Canadian Journal of ForestResearch 38:16–30.
Hunsaker, C. T., and D. A. Levine. 1995. Hierarchicalapproaches to the study of water quality in rivers. BioScience45:193–203.
Isermann, K. 1990. Share of agriculture in nitrogen andphosphorus emissions into the surface waters of WesternEurope against the background of their eutrophication.Nutrient Cycling in Agroecosystems 26:253–269.
Jackson, L. J. 2003. Macrophyte-dominated and turbid statesof shallow lakes: evidence from Alberta Lakes. Ecosystems6:213–223.
Jarvis, S., N. J. Hutchings, F. Brentrup, J. E. Olesen, and K. W.van der Hoek. 2011. Nitrogen flows in farming systemsacross Europe. Oxford University Press, Oxford, UK.
Jeppesen, E., J. P. Jensen, M. Søndergaard, H. Kjeld Sandby,P. H. Møller, H. U. Rasmussen, V. Norby, and S. E. Larsen.2003. Does resuspension prevent a shift to a clear state inshallow lakes during reoligotrophication? Limnology andOceanography 48:1913–1919.
Jeppesen, E., J. P. Jensen, M. Søndergaard, and T. L.Lauridsen. 2005a. Response of fish and plankton to nutrientloading reduction in eight shallow Danish lakes with specialemphasis on seasonal dynamics. Freshwater Biology50:1616–1627.
Jeppesen, E., et al. 2005b. Lake responses to reduced nutrientloading—an analysis of contemporary long-term data from35 case studies. Freshwater Biology 50:1747–1771.
Jeppesen, E., M. Søndergaard, B. Kronvang, J. Jensen, L.Svendsen, and T. Lauridsen. 1999. Lake and catchmentmanagement in Denmark. Hydrobiologia 395–396:419–432.
Johnson, L., C. Richards, G. Host, and J. Arthur. 1997.Landscape influences on water chemistry in Midwesternstream ecosystems. Freshwater Biology 37:193–208.
Jones, J. R., M. F. Knowlton, D. V. Obrecht, and E. A. Cook.2004. Importance of landscape variables and morphology onnutrients in Missouri reservoirs. Canadian Journal ofFisheries and Aquatic Sciences 61:1503–1512.
Jørgensen, U. 2011. Benefits versus risks of growing biofuelcrops: the case of Miscanthus. Current Opinion in Environ-mental Sustainability 3:24–30.
Kaika, M. 2003. The water framework directive: a new directivefor a changing social, political and economic Europeanframework. European Planning Studies 11:18.
Knudsen, T., and B. P. Olsen. 2009. Proceeding of the 2ndNKG Workshop on national DEMS, Copenhagen, Novem-ber 11–13, 2008. KMS, Copenhagen, Denmark.
Kristensen, I. T., and P. E. Larsen. 2000. Utilisation of datacreated in control and administration in psychical planning.Pages 213–221 in C. A. Brebbia, editor. Managementinformation systems 2000: GIS and remote sensing. WessexInstitute of Technology, Southampton, UK.
Kronvang, B., G. Ærtebjerg, R. Grant, P. Kristensen, M.Hovmand, and J. Kirkegaard. 1993. Nationwide monitoringof nutrients and their ecological effects: state of the Danishaquatic environment. Ambio 22:176–187.
Kronvang, B., H. E. Andersen, C. Børgesen, T. Dalgaard, S. E.Larsen, J. Bøgestrand, and G. Blicher-Mathiasen. 2008.Effects of policy measures implemented in Denmark on
June 2012 1199LAND USE EFFECTS ON LAKE WATER QUALITY

nitrogen pollution of the aquatic environment. Environmen-tal Science and Policy 11:144–152.
Kronvang, B., M. Bechmann, H. Lundekvam, H. Behrendt,G. H. Rubæk, O. F. Schoumans, N. Syversen, H. E.Andersen, and C. C. Hoffmann. 2005a. Phosphorus lossesfrom agricultural areas in river basins. Journal of Environ-mental Quality 34:2129–2144.
Kronvang, B., R. Grant, A. Laubel, and M. L. Petersen. 2002.Quantifying sediment and nutrient pathways within Danishagricultural catchments. Agriculture, hydrology and waterquality. CAB International 2002:281–301.
Kronvang, B., E. Jeppesen, D. J. Conley, M. Søndergaard, S. E.Larsen, N. B. Ovesen, and J. Carstensen. 2005b. Nutrientpressures and ecological responses to nutrient loadingreductions in Danish streams, lakes and coastal waters.Journal of Hydrology 304:274–288.
Lauridsen, T., M. Søndergaard, J. P. Jensen, E. Jeppesen, andT. B. Jørgensen. 2007. Undersøgelser i søer. NOVANA ogDEVANO overvagningsprogram. Danmarks Miljøundersø-gelser, Aarhus Universitet, Aarhus, Denmark.
Levin, G., and M. R. Jepsen. 2010. Abolition of set-asideschemes, associated impacts on habitat structure andmodelling of potential effects of cross-farm regulation.Ecological Modelling 221:2728–2737.
Madsen, L. M. 2002. The Danish afforestation programme andspatial planning: new challenges. Landscape and UrbanPlanning 58:241–254.
Meybeck, M. 1982. Carbon, nitrogen, and phosphorus trans-port by world rivers. American Journal of Science 282:401–450.
Moss, B. 1990. Engineering and biological approaches to therestoration from eutrophication of shallow lakes in whichaquatic plant communities are important components.Hydrobiologia 200-201:367–377.
Moss, B., S. McGowan, and L. Carvalho. 1994. Determinationof phytoplankton crops by top-down and bottom-upmechanisms in a group of English lakes, the West MidlandMeres. Limnology and Oceanography 39:1020–1029.
Moyle, J. B. 1956. Relationships between the chemistry ofMinnesota surface waters and wildlife management. Journalof Wildlife Management 20:303–320.
Nagid, E. J., D. E. Canfield, and M. V. Hoyer. 2001. Wind-induced increases in trophic state characteristics of a large (27km2), shallow (1.5 m mean depth) Florida lake. Hydro-biologia 455:97–110.
Naveh, Z. 2000. What is holistic landscape ecology? Aconceptual introduction. Landscape and Urban Planning50:7–26.
Nielsen, K., et al. 2000. Areal informations aystemet–AIS.Energiministeriet, Danmarks Miljøundersøgelser, AarhusUniversitet, Aarhus, Denmark.
Norvell, W. A., C. R. Frink, and D. E. Hill. 1979. Phosphorusin Connecticut lakes predicted by land use. Proceedings ofthe National Academy of Sciences USA 76:5426–5429.
OECD. 2007. OECD Environmental Performance Reviews.Denmark. Organization for Economic Cooperation andDevelopment, Paris, France.
Olesen, S. E. 2009. Kortlægning af potentielt dræningsbehov palandbrugsarealer opdelt efter landskabselement, geologi,jordklasse, gelogisk region samt høj/lavbund. Det Jordbrugs-videnskabelige Fakultet, Tjele, Denmark.
Peterjohn, W. T., and D. L. Correll. 1984. Nutrient dynamics inan agricultural watershed: observations on the role of ariparian forest. Ecology 65:1466–1475.
Petersen, J., M. Haastrup, L. Knudsen, and J. E. Olesen. 2010.Causes of yield stagnation in winter wheat in Denmark. DJFreport plant science. Aarhus University, Aarhus, Denmark.
Richards, C., L. B. Johnson, and G. E. Host. 1996. Landscape-scale influences on stream habitats and biota. CanadianJournal of Fisheries and Aquatic Sciences 53:295–311.
SAS Institute. 2008. SAS version 9.2. SAS Institute, Cary,North Carolina, USA.
Scheffer, M. 1998. Ecology of shallow lakes. Chapman andHall, London, UK.
Scheffer, M., S. H. Hosper, M. L. Meijer, B. Moss, and E.Jeppesen. 1993. Alternative equilibria in shallow lakes.Trends in Ecology and Evolution 8:275–279.
Scheffer, M., and E. Jeppesen. 2007. Regime shifts in shallowlakes. Ecosystems 10:1–3.
Shoup, C. S. 1947. Geochemical interpretation of wateranalyses from Tennessee streams. Transactions of theAmerican Fisheries Society 74:223–229.
Simmelsgaard, S. E. 1998. The effect of crop, N-level, soil typeand drainage on nitrate leaching from Danish Soil. Soil Useand Management 14:30–36.
Sliva, L., and D. Dudley Williams. 2001. Buffer zone versuswhole catchment approaches to studying land use impact onriver water quality. Water Research 35:3462–3472.
Smith, V. H., G. D. Tilman, and J. C. Nekola. 1999.Eutrophication: impacts of excess nutrient inputs on fresh-water, marine, and terrestrial ecosystems. EnvironmentalPollution 100:179–196.
Søndergaard, M. 2007. Nutrient dynamics in lakes—withemphasis on phosphorus, sediment and lake restorations.Dissertation. National Environmental Research Institute,University of Aarhus, Aarhus, Denmark.
Søndergaard, M., J. P. Jensen, and E. Jeppesen. 2003. Role ofsediment and internal loading of phosphorus in shallowlakes. Hydrobiologia 506/509:135–145.
Søndergaard, M., E. Jeppesen, and J. P. Jensen. 2005a. Pond orlake: does it make any difference? Archiv fur Hydrobiologie162:143–165.
Søndergaard, M., E. Jeppesen, J. P. Jensen, and T. Lauridsen.2000. Lake restoration in Denmark. Lakes and Reservoirs:Research and Management 5:151–159.
Søndergaard, M., E. Jeppesen, J. P. Jensen, and S. LildalAmsinck. 2005b. Water framework directive: ecologicalclassification of Danish lakes. Journal of Applied Ecology42:616–629.
Søndergaard, M., P. Kristensen, and E. Jeppesen. 1992.Phosphorus release from resuspended sediment in theshallow and wind-exposed Lake Arresø, Denmark. Hydro-biologia 228:91–99.
Soranno, P. A., S. L. Hubler, S. R. Carpenter, and R. C.Lathrop. 1996. Phosphorus loads to surface waters: a simplemodel to account for spatial pattern of land use. EcologicalApplications 6:865–878.
Taranu, Z., and I. Gregory-Eaves. 2008. Quantifying relation-ships among phosphorus, agriculture, and lake depth at aninter-regional scale. Ecosystems 11:715–725.
Tomer, M. D., D. W. Meek, D. B. Jaynes, and J. L. Hatfield.2003. Evaluation of nitrate nitrogen fluxes from a tile-drainedwatershed in Central Iowa. Journal of EnvironmentalQuality 32:642–653.
Turner, M. G. 1989. Landscape ecology: the effect of pattern onprocess. Annual Review of Ecology and Systematics 20:171–197.
Turner, R. E., and N. N. Rabalais. 2004. Suspended sediment,C, N, P, and Si yields from the Mississippi river basin.Hydrobiologia 511:79–89.
Vol, N. 1993. The use of buffer zones to protect water quality: areview. Water Resources Management 7:257–272.
Vollenweider, R. A. 1970. Scientific fundamentals of theeutrophication of lakes and flowing waters, with particularreference to nitrogen and phosphorus as factors in eutrophi-cation. Organization for Economic Cooperation and Devel-opment, Paris, France.
Windolf, J., E. Jeppesen, J. P. Jensen, and P. Kristensen. 1996.Modelling of seasonal variation in nitrogen retention and in-lake concentration: a four-year mass balance study in 16shallow Danish lakes. Biogeochemistry 33:25–44.
ANDERS NIELSEN ET AL.1200 Ecological ApplicationsVol. 22, No. 4