Altered Hippocampal Place Cell Representation and Theta ...
28
Article Altered Hippocampal Place Cell Representation and Theta Rhythmicity following Moderate Prenatal Alcohol Exposure Highlights d Prenatal alcohol exposure reduces place field spatial tuning and stability d Prenatal alcohol exposure decreases place field directionality on the linear track d Prenatal alcohol exposure increases control of place fields by a proximal cue d Prenatal alcohol exposure slows theta oscillations and alters phase precession Authors Ryan E. Harvey, Laura E. Berkowitz, Daniel D. Savage, Derek A. Hamilton, Benjamin J. Clark Correspondence [email protected] In Brief Harvey et al. demonstrate that prenatal alcohol exposure disrupts hippocampal place cell firing and slows theta oscillations. The findings represent a critical step in developing a complete multi-level understanding of the neurobiological basis of spatial learning and memory impairments after moderate prenatal alcohol exposure. Harvey et al., 2020, Current Biology 30, 3556–3569 September 21, 2020 ª 2020 Elsevier Inc. https://doi.org/10.1016/j.cub.2020.06.077 ll
-
Upload
khangminh22 -
Category
Documents
-
view
5 -
download
0
Transcript of Altered Hippocampal Place Cell Representation and Theta ...

Article
Altered Hippocampal Plac
e Cell Representation andTheta Rhythmicity following Moderate PrenatalAlcohol ExposureHighlights
d Prenatal alcohol exposure reduces place field spatial tuning
and stability
d Prenatal alcohol exposure decreases place field directionality
on the linear track
d Prenatal alcohol exposure increases control of place fields by
a proximal cue
d Prenatal alcohol exposure slows theta oscillations and alters
phase precession
Harvey et al., 2020, Current Biology 30, 3556–3569September 21, 2020 ª 2020 Elsevier Inc.https://doi.org/10.1016/j.cub.2020.06.077
Authors
Ryan E. Harvey, Laura E. Berkowitz,
Daniel D. Savage, Derek A. Hamilton,
Benjamin J. Clark
In Brief
Harvey et al. demonstrate that prenatal
alcohol exposure disrupts hippocampal
place cell firing and slows theta
oscillations. The findings represent a
critical step in developing a complete
multi-level understanding of the
neurobiological basis of spatial learning
and memory impairments after moderate
prenatal alcohol exposure.
ll

ll
Article
Altered Hippocampal Place CellRepresentation and Theta Rhythmicityfollowing Moderate Prenatal Alcohol ExposureRyan E. Harvey,1 Laura E. Berkowitz,1 Daniel D. Savage,1,2 Derek A. Hamilton,1,2 and Benjamin J. Clark1,2,3,*1Department of Psychology, University of New Mexico, 2001 Redondo S Drive, Albuquerque, NM 87106, USA2Department of Neurosciences, University of New Mexico, 900 Camino de Salud, Albuquerque, NM 87131, USA3Lead Contact
*Correspondence: [email protected]://doi.org/10.1016/j.cub.2020.06.077
SUMMARY
Prenatal alcohol exposure (PAE) leads to profound deficits in spatial memory and synaptic and cellular alter-ations to the hippocampus that last into adulthood. Neurons in the hippocampus called place cells dischargeas an animal enters specific places in an environment, establish distinct ensemble codes for familiar andnovel places, and are modulated by local theta rhythms. Spatial memory is thought to critically depend onthe integrity of hippocampal place cell firing. Therefore, we tested the hypothesis that hippocampal placecell firing is impaired after PAE by performing in vivo recordings from the hippocampi (CA1 and CA3) of mod-erate PAE and control adult rats. Our results show that hippocampal CA3 neurons from PAE rats havereduced spatial tuning. Second, CA1 and CA3 neurons from PAE rats are less likely to orthogonalize theirfiring between directions of travel on a linear track and between changes in contextual stimuli in an openarena compared to control neurons. Lastly, reductions in the number of hippocampal place cells exhibitingsignificant theta rhythmicity and phase precession were observed, which may suggest changes to hippo-campal microcircuit function. Together, the reduced spatial tuning and sensitivity to contextual changes pro-vide a neural systems-level mechanism to explain spatial memory impairment after moderate PAE.
INTRODUCTION
Prenatal alcohol exposure (PAE) is detrimental to the developing
nervous system [1] and remains one of the most common devel-
opmental insults [2–4]. Globally, 9.8% of individuals consume
alcohol while pregnant [5]. There is a large body of evidence sup-
porting the conclusion that even a moderate amount of alcohol
exposure during fetal development (blood alcohol concentration
[BAC] 7–120 mg/dL) can disrupt the synaptic and cellular net-
works believed to underlie episodic and spatial memory, result-
ing in significant lifelong deficits in the ability to remember loca-
tions and effectively navigate [6–10].
The hippocampus is critical for the encoding of spatial [11] and
episodic memories [12, 13]. The hippocampal (HPC) subregions
dentate gyrus, CA1, CA2, and CA3 contain neurons called
‘‘place cells’’ that selectively fire at particular positions of an an-
imals path, resulting in receptive fields for particular locations in
space [14, 15]. These receptive fields are referred to as place
fields, and their precise population activity has been thought to
form a ‘‘cognitive map,’’ giving an animal a sense of past, pre-
sent, and future locations [16]. Although the correlation between
a place cell’s firing rate and location is commonly referred to as
rate coding, phase or temporal coding co-occurs, whereby
spikes from single theta-rhythmic place cells systematically
phase shift across successive theta cycles in a phenomenon
known as theta phase precession [17].
3556 Current Biology 30, 3556–3569, September 21, 2020 ª 2020 El
Moderate PAE during the first and second trimester impairs
spatial behavior (reviewed in [7]). In the Morris water task, rats
with moderate PAE are generally unable to quickly adapt to
changes in task demands, such as a change in the escape
location in the water task or recalling a previously learned
location [9, 18–20]. In dry land tasks, moderate PAE impairs
spatial discrimination [21, 22], with greater deficits observed
when the discrimination involves subtle differences in spatial
context [21]. Importantly, spatial flexibility and discrimination
are thought to be reliant on functionally intact hippocampi
and have been associated with HPC place cell activity
[23, 24].
Moderate PAE can also lead to reductions in long-term poten-
tiation (LTP), which is considered to be a mechanism by which
increases in synaptic strength support associative learning [25,
26]. The most prominent reductions in LTP are observed in the
dentate gyrus following perforant path stimulation [27–29] and
may be related to alterations in N-methyl-D-aspartate (NMDA)
subunit composition [27]. Importantly, reductions in LTP or
NMDA receptor function have been linked to a loss in the spatial
stability of HPC place fields [30–36] and their failure to remap or
discriminate spatial contexts [37] (discussed in [38]). Thus, it is
expected that HPC-dependent spatial discrimination, such as
how place cells discriminate directions of locomotion on linear
track environments [39–41] or between spatial context changes
[38], will be disrupted following PAE.
sevier Inc.

llArticle
The linkage between spatial behavior and HPC structural dif-
ferences after moderate PAE is poorly understood but is likely
to involve alterations in HPC place cell activity [7]. Although pre-
vious studies have shown acute alcohol exposure in adult rats
disrupts HPC place cell activity [42, 43], we are unaware of prior
work investigating the impact of developmental alcohol expo-
sure on HPC place cell activity. Thus, in the present study, we
first hypothesized that, because PAE impairs spatial behavior
and HPC function, place cells will have altered spatial tuning,
temporal-spatial stability, theta rhythmicity, and phase coding
in PAE offspring. Second, because previous studies report
decreased LTP, we hypothesize that place cells from rats with
PAE will have decreased directional discrimination on a linear
track environment and differential rate and spatial tuning effects
following contextual stimuli changes between sessions. There-
fore, we recorded from neurons from HPC CA1 and CA3 of adult
rats with moderate PAE (BAC: 60.8 ± 5.8 mg/dL) [44] that
occurred throughout gestation, and saccharin control rats over
three environmental conditions: a linear track; an open field cyl-
inder; and an open field cylinder with a proximal cue rotation (Fig-
ures 1A and 1B). Although firing responses to spatial features
have been observed to differ between CA1 and CA3 subregions
[45–49], the following analyses focus on assessing intraregional
comparisons between PAE and control cell populations. Our re-
sults show that HPC CA3 neurons from PAE rats have reduced
spatial tuning and are less likely to display theta phase preces-
sion. Second, CA1 and CA3 neurons from PAE rats have
reduced theta frequencies and are less likely to orthogonalize
their firing between directions of travel on the linear track and
in contextual stimuli changes between the cylinder sessions
compared to control animals.
RESULTS
Reduction in Spatial Tuning of CA3PlaceCells after PAETo explore how HPC spatial encoding is affected following mod-
erate PAE, we recorded populations of HPC neurons from 9 con-
trol and 8 PAE adult male rats as they ran laps on a linear track or
randomly foraged for scattered food in a cylindrical enclosure
(Figures 1A and 1B). PAE did not disrupt the ability to perform
laps on the linear track, with no group differences observed in
the number of laps completed per session (control median: 41;
PAEmedian: 40). Similarly, therewere no significant group differ-
ences in trial-averaged running speed on the linear track or in the
cylinder (discussed in section Speed-Modulated Intrinsic Theta
Frequency). These findings are consistent with previous studies
that have reported unaffected locomotor behaviors following
moderate PAE [21, 50].
Despite similar behavioral metrics, impairments in the spatial
tuning, measured by spatial information content and sparsity,
were evident in PAE place fields. CA3 place fields in PAE animals
had significantly lower spatial information and higher sparsity in
both linear track and cylinder tests (p < 0.001; Wilcoxon rank-
sum [WRS]; effect sizes [r] R0.19; Figure 1C). In contrast, we did
not observe groupdifferences in spatial tuningbyCA1placefields.
We also investigated group differences in peak firing rate and
spatial coherence, which measures the consistency of spiking
across the place field. In PAE rats, CA1 and CA3 place cells
had significantly diminished peak firing rates in both tasks (p <
0.05;WRS; effect sizes [r]R0.10; Figure 1C). Average firing rates
and bursting across sessions are shown in Figure S1. Further-
more, CA1 and CA3 firing fields in PAE rats had significantly
lower spatial coherence in both tasks (p < 0.05;WRS; effect sizes
[r] R0.08; Figure 1C). However, it is important to note that the
extent of these two CA1 differences were small (effect sizes [r]
0.10–0.14). Together, these results indicate that peak firing and
coherence in both CA1 and CA3 were affected by PAE and mea-
sures of spatial tuning were affected in CA3.
Reduced within-Session Stability by CA1 and CA3 PlaceCells after PAETo investigate whether spatial tuning was stable over time, we
evaluated the within-session spatial stability of place fields on
the linear track and cylinder environments (Figure 2). Within-ses-
sion stability was measured by calculating the spatial correlation
between rate maps generated from the first half of the recording
session versus the second half. CA1 and CA3 PAE place cells
had lower within-session stability compared to control CA1
and CA3 place cells in both linear track and cylinder environ-
ments (p < 0.001; WRS; effect sizes [r] R0.11; Figure 2). To
ensure that these results were not due to poor sampling of the
environment, we assessed running speed and the amount of
exploration across the two halves of each recording session (Fig-
ure S2). Although running speeds and amount of exploration was
similar between groups in the cylinder, running speeds from PAE
rats on the linear track tended to slightly increase (1 cm/s) from
the first to second half of each session compared to control
rats. However, because place cell firing properties tend to scale
with running speed [51, 52], indicating that stable representa-
tions are possible during fast and slow running epochs, and
both groups had a similar amount of exploration between the
two halves, the difference in speed is unlikely to have negatively
affected stability. Together, the decreased spatial stability sug-
gests that PAE negatively affects the ability to create stable
spatial representations over relatively short timescales.
Reduced CA1 and CA3 Place Cell Directionality afterPAEWhen rodents engage in random foraging in an open-field envi-
ronment, place cells exhibit location-specific firing that is often
independent of the direction of travel through the place field
[53]. However, when the animal’s path is restricted, such as in
a linear track, firing rates and peak firing locations significantly
differ in opposite directions of travel [39, 41, 54]. As a result,
place cells express directionality in their firing such that their rep-
resentation of the track in the two directions are distinct or
orthogonal (Figures 3A and 3B). Thus, to determine whether
directional firing on the linear track was impaired after PAE, we
quantified place cell directionality in twoways: first by correlating
rate maps for place fields in each direction of travel and by
computing a directionality index that quantifies the magnitude
of firing rate differences between each direction of travel. We
found that spatial correlations between the two running direc-
tions were significantly higher for CA1 PAE place cells (p <
0.01; WRS; effect size [r] = 0.17; Figures 3A–3C) but were similar
across the two groups for CA3 place cells (p > 0.05; WRS). Indi-
cating that, following PAE, CA1 place cells on the linear track are
less likely to spatially orthogonalize. Similarly, the directionality
Current Biology 30, 3556–3569, September 21, 2020 3557

Figure 1. Experimental Protocol, HPC Place Cell Examples, and Group Comparisons
(A) Ethanol exposure paradigm. Top: ethanol exposure and experimental timeline are shown. Bottom: representative Nissl-stained histological images (43
magnification) show electrode penetration (black arrow) in HPC CA1 and CA3 from control and PAE rats.
(B) Top: environments for assessing HPC place cells. Session 1: 120-cm linear track is shown (black dots indicate reward sites); session 2: 76.5-cm open cylinder
with a salient cue (white) is shown; session 3: 67-cm open cylinder with rotated salient cue is shown. Bottom: place cell rate map examples from each group HPC
subregion exhibiting spatial firing in all 3 sessions are shown. Spatial information content (IC) and peak firing rate (Hz) are shown above each rate map. Color is
scaled with the maximum firing rate for each cell and environment. Running direction on the linear track is shown with a black arrow, and each lap is represented
on the y axis.
(C) Violin and boxplots show group comparisons for spatial IC, sparsity, peaking firing rate, and spatial coherence. Violin plots show the distribution density (violin
outline) and the appended boxplot box ranges from the 1st (Q1) to the 3rd quartile (Q3), the band inside showing the median, and the extremities of the whiskers
showing Q1-1.5*(Q3–Q1) on top and Q3+1.5*(Q3–Q1) on the bottom. *p < 0.05; **p < 0.01; ***p < 0.001. Average firing rates and bursting properties over sessions
are shown in Figure S1.
ll
3558 Current Biology 30, 3556–3569, September 21, 2020
Article

Figure 2. Reduced within-Session Stability by CA1 and CA3 Place Cells after PAE
(A) Control and PAE example place cells from the first and second halves of their respective recording sessions in the cylinder. Note the decreased stability in the
PAE group. Rat’s path (black dots) and neuron’s action potentials (red dots) are shown. Warm colors represent high firing locations. Within-session spatial
correlations (r) are shown above each cell.
(B) Control and PAE example place cells from the first and second halves of their respective recording sessions in the linear track.
(C) CA1 and CA3 place cells from PAE rats have reduced spatial correlations (r) between the first and second halves of a recording session in both cylinder and
linear track environments (median differences: cylinder CA1 0.19; cylinder CA3 0.16; track CA1 0.10; track CA3 0.06). *p < 0.05; **p < 0.01; ***p < 0.001. A
quantification of behavioral stability can be found in Figure S2.
llArticle
index between the two running directions was significantly lower
for CA3 PAE place cells (p < 0.001; WRS; effect size [r] = 0.13;
Figures 3A–3D), indicating that CA3 place cells are less likely
to orthogonalize their firing rates on the linear track in PAE rats.
Together, mechanisms underlying place cell directionality are
disrupted, suggesting that rats with PAE are unable to form
unique complex representations that aid in the disambiguation
of different environmental directions.
Dominant Control by a Proximal Cue over CA1 and CA3Place Fields after PAEWe next sought to determine the sensitivity of PAE place cells to
landmark manipulation by rotating a cue located along the wall
of the open-field cylinder environment (Figure 4A). Importantly,
we did not disorient rats between sessions so as to not disrupt
their internal path integrator, in effect creating a contextual change
by inducing a mismatch between the previously experienced and
the rotated cue position [55–58]. A rotational correlation analysis
was used to assess the response of place cells following the
90-degree cue rotation by finding the angle at which the two rate
maps showed the highest correlation (i.e., rotation angle; Fig-
ure 4A) [55, 59–64]. Consistent with previous literature, cells with
correlations below a moderate correlation of 0.4 were not used
in this analysis, removing 18% of CA1 and 24% of CA3 control
cells and 10% of CA1 and 12% of CA3 PAE cells. The average
rotation angle of CA1 place cells was significantly different be-
tween PAE and control groups (F(1,216) = 6.46; p = 0.01; Fig-
ure 4B), though both groups exhibited angular distributions that
significantly clustered around the expected angle of 90 degrees
(VR 59.6; p% 0.02). Specifically, CA1 control place cells showed
an average rotation angle consistent with cue averaging, whereby
an intermediate angle between the first and second cue positions
was observed (q= 44.8 degrees; Z = 4.00; p = 0.01), althoughCA1
PAE place cells shifted their field locations more closely with the
Current Biology 30, 3556–3569, September 21, 2020 3559

Figure 3. Reduced CA1 and CA3 Place Cell Directionality after PAE(A) Population vectors of place cells sorted by their location of peak firing rate. Each row (y axis) indicates the firing rate of a single cell as a function of position (x
axis). The color indicates firing rate normalized by the peak rate across both running directions for each cell (color bar far right). Note that place cells exhibit
increased firing in either outbound or inbound running directions as indicated by the bright diagonal bands. CA1 place cells in PAE rats show a subtle appearance
of warmer colors along the diagonal in the opposite running direction.
(B) Example control ca1 place cell on the linear track exemplifying bidirectional coding by both the difference in firing rate (directionality index = 0.44) and in firing
position (spatial correlation = �0.08) between the two running directions.
(C) Spatial correlations between rate maps created from the two running directions. Note that PAE CA1 cells are more spatially correlated between the running
directions (median CA1 r: control 0.16; PAE 0.35).
(D)Directionality index, ametric of firing rate difference, between the running directions.Note thatPAECA3 cells havedecreaseddirectionality index values, indicating
that PAE CA3 cells have similar firing rates between the two running directions (median CA3 directionality: control 0.32; PAE 0.19). *p < 0.05; **p < 0.01; ***p < 0.001.
llArticle
cue (q= 82.84degrees;Z=24.38;p<0.001). Similarly, the rotation
angle of CA3 place cells was also significantly different between
groups (F(1,505) = 82.08; p < 0.001). CA3 control place cells had
a wider distribution of rotation angles that were not clustered
around 90 degrees (q= 246.4 degrees, Z = 3.01, p = 0.048; V =
�16.5, p = 0.98). In contrast, CA3 PAE place cells rotated their
fields in correspondence with the cue shift (q= 73.2 degrees,
Z = 31.7, p < 0.001; V = 107.52, p < 0.001). Overall, both CA1
and CA3 PAE place fields were strongly dominated by the prox-
imal cue within the open field.
Next, we measured the sensitivity of place cell activity in cue
manipulation tests by comparing firing rates and spatial tuning
across sessions (Figures 4C and 4D). Control cells from CA1 and
CA3 demonstrated greater rate remapping between the two ses-
sions compared with PAE cells (CA1: p < 0.001, WRS, effect size
[r] = 0.20; CA3: p < 0.001, WRS, effect size [r] = 0.27; Figure 4C).
Finally, we used difference scores to determine whether changes
in spatial tuning between the first and cue-shift cylinder sessions
would be similar between control and PAE place cells. Spatial tun-
ing of CA3 place cells between the two sessions was differentially
changed compared to control cells (D spatial information content:
p < 0.01, WRS, effect size [r] = 0.12;D sparsity: p < 0.05,WRS, ef-
fect size [r] = 0.09; Figure 4D). Specifically, control cells displayed
3560 Current Biology 30, 3556–3569, September 21, 2020
increasedvariabilitybetween the twoconditions.Together, theob-
servations suggest that PAEplace cells were less likely to exhibit a
change in spatial firing andmore rigidly represented their environ-
ment in accordance with the proximal cue despite rotation.
Place Cell Intrinsic Theta Frequency and PhasePrecession Are Disrupted after PAEPlace cells are known to rhythmically fire at theta frequency (4–
12 Hz) and demonstrate a phenomenon known as phase preces-
sion when an animal passes through its place field [17]. During
phase precession, place cells fire at a progressively earlier phase
of the local theta rhythms. Therefore, place cells can simulta-
neously exhibit rate (place) and phase coding, which in effect in-
creases the spatial information contained within any given firing
sequence [66]. Thus, we next investigated whether moderate
PAE alters the theta rhythmicity and/or phase precession of
CA1/CA3 place cells.
Intrinsic Theta FrequencyWefirst investigated intrinsic theta frequencies using amaximum-
likelihood estimation approach [67]. We found that the proportion
of significant theta rhythmicity was reduced in PAE CA1 and CA3
place cells in the cylinder session (CA1: c2 [1, N = 1,691] = 13.92,

Figure 4. Dominant Control by a Proximal Cue over CA1 and CA3 Place Fields after PAE
(A) Example place cells from standard cylinder session 1 (left) and the cue rotation session (middle). The right panel shows the rotational correlation analysis,
where the rate map from the rotation session was rotated in 6-degree bins and a spatial correlation was taken for each correlation. The rotation that resulted in the
highest correlation (red line) was assumed to be the directional displacement between the two sessions.
(B) Polar histograms showing the distribution of place field rotation following the cue rotation. Note that although control CA1 and CA3 cells have mostly wide
distributions, PAE CA1 and CA3 cells display tight distributions clustered around 90 degrees. The orange bar represents mean direction, and the black bar
represents the relative mean vector length of each distribution. Polar plots were created using the CircHist MATLAB package [65].
(C) Normalized firing rate difference between cylinder session one and two. Control CA1 and CA3 place cells are more likely to exhibit rate remapping compared
with PAE cells.
(D) Change in spatial tuning (spatial information content and sparsity) between cylinder session one and two. Spatial information and sparsity differences scores
were created by subtracting values obtained in session 1 from values in session 2. Note the significant group differences in CA3 cell between both spatial tuning
metrics (D spatial information content: control median =�0.07, PAEmedian = 0.01;D sparsity: control median = 0.02, PAEmedian =�0.00). *p < 0.05; **p < 0.01;
***p < 0.001.
llArticle
p < 0.001, effect size [V] = 0.02; CA3: c2 [1, N = 1,1,696] = 32.01,
p < 0.001, effect size [V] = 0.02) and in PAECA3 place cells on the
linear track (c2 [1, N = 1,1,646] = 15.55, p < 0.001, effect size [V] =
0.01), but not in PAE CA1 cells on the linear track (p > 0.05; Fig-
ure 5A), suggesting that environmental and task features on the
linear track, such as the two fixed-goal sites, may be associated
with greater recruitment of theta-rhythmic neurons in CA1.
Additionally, PAE CA1 and CA3 had significantly slower intrinsic
theta frequencies in both linear track and cylinder environments
(p < 0.001; WRS; effect sizes [r] R0.16; Figures 5B–5D).
Speed-Modulated Intrinsic Theta FrequencyPrevious research has shown that the intrinsic frequencies
throughout the hippocampal formation are modulated by
Current Biology 30, 3556–3569, September 21, 2020 3561

Figure 5. Theta Frequency Is Decreased following PAE
(A) CA1 and CA3 place cells from PAE rats have decreased proportions of significant theta rhythmicity.
(B) Normalized maximum likelihood estimate (MLE) spike-time autocorrelations for control and PAE place cells from CA1 and CA3 and both environments,
ordered according to their theta frequency. Warm and cool colors were assigned to the highest and lowest values, respectively, of each autocorrelation.
(C) MeanMLE spike-time correlation fits for all place cells. Note that neurons from the PAE group are approximately 6 ms slower on average for each theta cycle.
All theta rhythmic units are shown in Figure S3.
(D) PAE rats have significantly slower spike-time theta frequency across CA1 andCA3 in both linear track and cylinder environments.Median differences: cylinder
CA1: 0.61 Hz; cylinder CA3: 0.35 Hz; track CA1: 0.79 Hz; track CA3: 0.42 Hz. *p < 0.05; **p < 0.01; ***p < 0.001.
llArticle
running speed (example in Figure 6B, right) [51, 68–73]. To
take speed modulation into account, we first established
that both groups have similar trial average running speeds in
both environments (Figure 6A). Next, we computed the
intrinsic frequency, again using the maximum likelihood esti-
mation approach [67], during epochs of fast (upper 50%)
and slow (lower 50%) running speeds (example in Figure 6B).
Running speed differences between slow and fast epochs
were similar between groups, and the magnitude of speed dif-
ferences between high and low running speeds was not pre-
dictive of the magnitude of theta frequency difference in either
group (Figure S4). However, the frequency shift between the
two speeds was significantly larger for control cells compared
to the PAE cells (p < 0.006; WRS; Figure 6C). To follow up on
this finding, we investigated the proportion of theta rhythmic
neurons with significantly speed-modulated intrinsic fre-
quencies. We found that running speed was a significant co-
variate for theta frequency in a greater proportion of CA1
and CA3 control cells in the cylinder and CA1 control cells
in the track compared to PAE cells (Figure 6D). Because firing
rates of HPC cells have also been found to be modulated
running speed [41, 70, 74–82], we investigated whether PAE
affected this modulation. Despite having decreased speed-
modulated theta frequency, speed-modulated firing rates
were unaffected by PAE (Figure S5). Together, intrinsic theta
frequency from PAE rats was less modulated by running
speed compared to control rats.
3562 Current Biology 30, 3556–3569, September 21, 2020
Theta Phase PrecessionNext, we investigated whether PAE place cells exhibited similar
phase precession (Figures 7A–7D). Although the strength of
theta-phase precession was similar between groups in both en-
vironments, measured by a circular-linear correlation (p > 0.09;
WRS; Figure 7E), the proportion of individual cells that demon-
strated phase precession was significantly reduced in CA3
from PAE rats on the linear track (c2 [1, N = 1,269] = 4.32; p =
0.03; effect size [V] = 0.05) and in the cylinder (c2 [1, N =
1,301] = 14.44; p < 0.001; effect size [V] = 0.01; Figure 7F).
This latter finding suggests that the specific mechanisms under-
lying CA3 phase precession may be altered following PAE,
although mechanisms underlying CA1 phase precession are
spared.
DISCUSSION
The present study established six specific findings regarding the
impact of moderate PAE on HPC place cell firing and theta rhyth-
micity. First, although moderate PAE reduced the consistency of
spiking and peak firing rates of place fields across both CA1 and
CA3 subregions, the spatial tuning of place fields was disrupted
only in CA3. Second, we found that moderate PAE impaired the
within-session stability of HPC place fields in both CA1 and CA3
regions. Third, moderate PAE disrupted the directionality of CA1
and CA3 place cells on the linear track. Fourth, CA1 and CA3
place fields in PAE animals showed greater control by a proximal

Figure 6. Running-Speed-Dependent Theta Frequency
(A) Mean running speed (cm/s) for each session is similar between control and PAE rats (median speeds: control cylinder = 8.35 cm/s; PAE cylinder = 8.17 cm/s;
control track = 9.36 cm/s; PAE track = 9.65 cm/s).
(B) Example cells demonstrating speed-modulated theta rhythmicity. Left: autocorrelogram of spike times using all spikes in the 50% fastest (mean speed 19 cm/
s) and 50% slowest (mean speed 4 cm/s) running epochs. Note that this cell lacks intrinsic theta frequency speed modulation, which is evident in the overlapping
peaks between the running speeds. This example neuron was from a PAE rat recorded from CA3 while the rat foraged in the cylinder. Right: autocorrelogram of
spike times using all spikes in the 50% fastest (mean speed 26 cm/s) and 50% slowest (mean speed 9 cm/s) running epochs is shown. Note that this cell does
display intrinsic theta frequency speed modulation, as the fast runs have an increased intrinsic frequency compared to the slow runs. This example neuron was
from a control rat recorded from CA3 while the rat foraged in the cylinder. Dotted lines indicate the local maxima for each autocorrelogram, and the frequency
differences are displayed above each plot.
(C) Control cells have a larger increase in theta frequency from slow to fast runs compared to PAE cells (medians group differences: CA1 cylinder 0.29; CA3
cylinder 0.14; CA1 track 0.73; CA3 track 0.50).
(D) Running speed is a significant covariate for theta frequency in a greater proportion of CA1 and CA3 control cells in the cylinder and CA1 control cells in the
track compared to PAE cells (cylinder CA1 control: 47%, PAE: 34%; cylinder CA3 control: 53%, PAE: 44%; track CA1 control: 53%, PAE: 35%; track CA3 control:
43%, PAE: 40%). *p < 0.05; **p < 0.01; ***p < 0.001. The relationship between the difference in running speed and theta frequency is shown in Figure S4.
Also see Figure S5.
llArticle
cue. Fifth, we found that PAE slowed intrinsic theta frequencies
among CA1 and CA3 place cells, reduced the number of place
cells expressing significant theta modulation in the cylinder envi-
ronment, and decreased speed modulation of theta frequency.
Finally, PAE reduced the number of place cells exhibiting signif-
icant theta-phase precession in CA3.
Deficits in spatial tuning, stability, and directionality of PAE
place cells are likely associated with the observed deficits in
HPC excitatory signaling at dentate gyrus synapses following
PAE. For instance, moderate PAE has been consistently
linked to impairments in synaptic plasticity at perforant
pathway-dentate gyrus synapses, even well into adulthood
[27–29, 83, 84]. Moreover, a previous study has shown that
NMDA subunit composition can be altered in the dentate gy-
rus of adult mice after moderate PAE [27]. Rate remapping by
CA3 place cells, which was reduced in the present study, is
dependent on the integrity of synaptic plasticity and NMDA re-
ceptor function at perforant pathway synapses [37]. Previous
studies have also reported that moderate PAE can reduce
mGluR5 receptor function in the dentate gyrus [85] and leads
to elevated histamine H3-receptor-mediated inhibition of
glutamate release from perforant path nerve terminals [86].
Likewise, the integrity of input from the entorhinal cortex,
which forms the most prominent source of perforant path
axons, is critical for place cell activity [87], and damage to en-
torhinal cortical cells can produce a similar loss of place field
stability and reduction in spatial tuning [88–90]. CA1 place
cells also receive direct input from layer III entorhinal cells,
but this input is not known to have a strong influence on place
cell remapping [89], and damage to this projection produces
Current Biology 30, 3556–3569, September 21, 2020 3563

Figure 7. CA3 Theta Phase Precession Is Affected by PAE
(A–D) Each panel shows an example place cell demonstrating significant theta-phase precession from control (CA1: A; CA3: C) and PAE (CA1: B; CA3: D) groups
in both environments. Row 1: rat’s path (black dots) and neuron’s action potentials (red dots) are shown. Row 2: rate maps for each lap for the linear track or
overall maps for the cylinder are shown. Warm colors represent high firing locations. The white line represents the mean firing rate across laps for the linear track
examples. Spatial IC and peak firing rate are listed at the top of each example cell. Row 3: distance by theta-phase scatterplots is shown. Row 4: distance by
theta-phase rate maps is shown.
(E) Circular-linear correlations. Control and PAE place cells had similar circular-linear correlations in both brain regions and both environments.
(F) The proportion of cells demonstrating significant theta phase precession. PAE CA3 place cells had significantly reduced proportions of phase precession in
both environments (group differences: cylinder 0.10; track 0.12). *p < 0.05; **p < 0.01; ***p < 0.001.
llArticle
reductions in the spatial tuning of CA1 place cells [91], which
was not observed in the present study.
We also found that HPC place cells recorded in the PAE group
were preferentially controlled by a cue located along the wall of
the cylinder environment. Specifically, when the proximal cue
was rotated by 90 degrees, a large majority of place cells re-
corded in the PAE group rotated their firing fields in the same
angular direction and distance as the cue. In control subjects,
place cells were less likely to rotate their firing fields with the
cue but instead demonstrated cue averaging (i.e., partial angular
rotation) or ’’remapping’’ of their firing fields to largely random lo-
cations. The findings support the conclusion that HPC circuitry in
3564 Current Biology 30, 3556–3569, September 21, 2020
PAE animals can establish strong associations with proximal
cues, but sensitivity to other contextual stimuli, such as distal vi-
sual cues, appears more limited. For instance, between cylinder
tests (standard and rotation), animals were carefully transported
to and from a resting pedestal between sessions with full access
to available visual cues in the recording room. Thus, stimuli
marking the global frame of reference and self-motion cues
(e.g., vestibular, motor, etc.) remained intact between cylinder
sessions. Providing rats with access to visual cues during cue ro-
tations has shown to disrupt cue control, whereby place fields
may shift out of sync with the degree of the cue shift [57, 58].
Furthermore, place fields are also influenced by distal- and

llArticle
self-motion-based cues [57, 61, 92, 93], and the conflict between
these and the proximal cue rotationmay have induced place field
remapping in the control group. Indeed, evidence of proximal
cue influence in the form of cue averaging was observed for
fields in CA1 of the control group (see Figure 4B). Thus, a weak-
ened capacity to establish associations with distal and/or self-
motion cues may be a consequence of moderate PAE. Previous
research suggests that information regarding the distal frame-
work and self-motion cues is largely derived frommedial entorhi-
nal cortex input to the hippocampus and indirect sources from
other parahippocampal regions [94–96]. As already noted above,
perforant path input to the dentate gyrus is weakened in moder-
ate PAE. However, whether deficits are preferential to the medial
perforant pathway has not been systematically investigated after
moderate PAE. A final point is that an enhancement in proximal
cue control may also explain the observed reduction in place
field directionality in the PAE group. Previous work has reported
a similar finding when proximal cues were placed along the sur-
face of a linear track, thereby enhancing the salience of the prox-
imal frame of reference [39].
Several of the present results parallel spatial behavior deficits
previously reported in human fetal alcohol spectrum disorder
(FASD) and animal models of PAE. Specifically, we found that
PAE place cells were less likely to orthogonalize their firing in
opposite directions of travel. This inflexibility in place cell repre-
sentation could explain previous reports of poor spatial discrim-
ination by PAE animals in tasks utilizing narrow maze arms [21,
22]. The rigidity of place cell firing on the linear track may be
extended to explain deficits in tasks requiring PAE animals to
rapidly learn a new spatial location in open environments, such
as theMorris water task [9, 18, 19]. We also found that PAE place
cells expressed reductions in spatial tuning specifically in CA3
and subtle field instability across 20- to 30-min recording ses-
sions in both HPC subregions. Previous studies have found
that reductions in place field tuning and stability are associated
with spatial learning and memory deficits [97, 98]. Thus, similar
findings would be expected, in which reductions in spatial tun-
ing, stability, and directionality would predict spatial learning
and memory deficits observed after moderate PAE. Future
work should be designed to test this hypothesis. In contrast to
deficits in spatial learning after PAE, tests in the Morris water
task with PAE rats have reported a preference for navigation to
spatial locationsmarked by a local cue as opposed to navigation
based on distal cues [9]. Similar observations have been re-
ported in tests of virtual navigation by children with FASD [99].
These findings of intact cue-based navigation parallel our obser-
vation of dominant control by a proximal landmark over PAE
place fields. We have speculated that the results of the present
study, when taken together with prior spatial behavioral results,
point to a functional loss in the neural systems involved in pro-
cessing distal and/or self-motion cues while leaving the proximal
frame of reference intact. Tests of this hypothesis will require that
future studies combine systematic manipulation of distal, self-
motion, and proximal cues with behavior and simultaneous
multi-site recordings from neural circuits involved in these pro-
cesses [100].
Along with changes in place cell rate coding after moderate
PAE, we also identified alterations in place cell theta rhythmicity.
We first found a smaller proportion of PAE CA1 and CA3 place
cells modulated by the theta frequency. Second, those that
were theta rhythmic had reduced intrinsic theta frequency as
well as decreased running speedmodulation compared with con-
trol cells. Likewise, this decrease was paralleled with a subtle
decrease in firing rates of place cells fromPAE rats. This alteration
in theta frequencymay partially explain previously reported spatial
deficits in rodents with PAE (reviewed in [7]), as the integrity of
HPC theta oscillations has been linked to accurate spatialmemory
[16, 101]. Disruption of HPC phase precession has been linked to
spatial memory impairments [102, 103]. Additionally, phase lock-
ing of HPC spiking to particular local field potential theta phases,
although not investigated here, has been associated with learning
in HPC-dependent tasks [104]. Recent evidence suggests that
moderate PAE reduces the number of fast-spiking parvalbumin+
GABAergic interneurons throughout the HPC [105]. Importantly,
these interneurons play a vital role in regulating theta-phase pre-
cession and HPC theta rhythms [106–108]. Consequently, the
reduction of theta frequency may be associated with microcircuit
changes as a result of the reduced number of GABAergic inter-
neurons. Future studies are needed to determine whether HPC
microcircuit function is substantially altered by PAE, which would
result in theta-frequency reductions. Whether other HPC oscilla-
tions (e.g., gamma- or sharp-wave ripples) are disrupted after
PAE is currently unknownand should alsobe investigated in future
studies.
To summarize, the present study establishes a clear linkage
betweenmoderate PAE and deficits in spatial and rhythmic firing
by HPC cell populations. We are unaware of previous work
investigating the developmental impact of alcohol on HPC place
cell activity. Additionally, although structural changes to the hip-
pocampus and deficits in HPC-dependent behavior have been
established after moderate PAE, changes at the level of neural
population activity in vivo have not received similar systematic
investigation. Thus, the findings of the present study represent
a critical step in developing a complete multi-level understand-
ing of the neurobiological basis of spatial learning and memory
impairments after moderate PAE.
STAR+METHODS
Detailed methods are provided in the online version of this paper
and include the following:
d KEY RESOURCES TABLE
d RESOURCE AVAILABILITY
B Lead Contact
B Materials Availability
B Data and Code Availability
d EXPERIMENTAL MODEL AND SUBJECT DETAILS
B Subjects
B Breeding and voluntary ethanol consumption
d METHOD DETAILS
B Surgical procedures
B Apparatus
B Behavioral training
B Recording Procedures
B Histology
B Spike sorting
B Spatial rate map construction
Current Biology 30, 3556–3569, September 21, 2020 3565

llArticle
B Spatial information
B Sparsity
B Spatial correlation
B Spatial coherence
B Directionality Index
B Place cell classification
B Cue rotation analysis
B Instantaneous theta phase, firing phase
B Theta phase precession
B Spike-train theta rhythmicity
B Speed modulated cells
d QUANTIFICATION AND STATISTICAL ANALYSIS
B Data analysis
B Statistical Analysis
SUPPLEMENTAL INFORMATION
Supplemental Information can be found online at https://doi.org/10.1016/j.
cub.2020.06.077.
ACKNOWLEDGMENTS
The authors thank Dr. Suzy Davies and Dr. Jennifer Wagner for supervising the
moderate PAE paradigm and Andre Moezzi, Nicole Graham, Kiana Lujan, Ella
Rappaport, and Chloe Puglisi for their assistance with the rodent husbandry
procedures. The research reported in this publication was supported by Na-
tional Institute on Alcohol Abuse and Alcoholism grants R21 AA024983, P50
AA022534, and T32 AA014127-15.
AUTHOR CONTRIBUTIONS
R.E.H., D.D.S., D.A.H., and B.J.C. conceptualized experiments. B.J.C.
contributed lab resources and supervision. D.D.S. created the animal model
and directed the production of experimental offspring. R.E.H. and L.E.B.
collected and analyzed data with input from B.J.C. R.E.H., L.E.B., and
B.J.C. wrote the initial draft of the paper with D.D.S. and D.A.H. providing re-
view and editing.
DECLARATION OF INTERESTS
The authors declare no competing interests.
Received: February 22, 2020
Revised: May 26, 2020
Accepted: June 23, 2020
Published: July 23, 2020
REFERENCES
1. Guerri, C., and Sanchis, R. (1985). Acetaldehyde and alcohol levels in
pregnant rats and their fetuses. Alcohol 2, 267–270.
2. Day, N.L., Leech, S.L., Richardson, G.A., Cornelius, M.D., Robles, N.,
and Larkby, C. (2002). Prenatal alcohol exposure predicts continued def-
icits in offspring size at 14 years of age. Alcohol. Clin. Exp. Res. 26, 1584–
1591.
3. Green, C.R., Mihic, A.M., Nikkel, S.M., Stade, B.C., Rasmussen, C.,
Munoz, D.P., and Reynolds, J.N. (2009). Executive function deficits in
children with fetal alcohol spectrum disorders (FASD) measured using
the Cambridge Neuropsychological Tests Automated Battery
(CANTAB). J. Child Psychol. Psychiatry 50, 688–697.
4. Thomas, S.E., Kelly, S.J., Mattson, S.N., and Riley, E.P. (1998).
Comparison of social abilities of children with fetal alcohol syndrome to
those of children with similar IQ scores and normal controls. Alcohol.
Clin. Exp. Res. 22, 528–533.
3566 Current Biology 30, 3556–3569, September 21, 2020
5. Popova, S., Lange, S., Probst, C., Gmel, G., and Rehm, J. (2017).
Estimation of national, regional, and global prevalence of alcohol use dur-
ing pregnancy and fetal alcohol syndrome: a systematic review and
meta-analysis. Lancet Glob. Health 5, e290–e299.
6. Berman, R.F., and Hannigan, J.H. (2000). Effects of prenatal alcohol
exposure on the hippocampus: spatial behavior, electrophysiology,
and neuroanatomy. Hippocampus 10, 94–110.
7. Harvey, R.E., Berkowitz, L.E., Hamilton, D.A., and Clark, B.J. (2019). The
effects of developmental alcohol exposure on the neurobiology of spatial
processing. Neurosci. Biobehav. Rev. 107, 775–794.
8. Mira, R.G., Lira, M., Tapia-Rojas, C., Rebolledo, D.L., Quintanilla, R.A.,
and Cerpa, W. (2020). Effect of alcohol on hippocampal-dependent plas-
ticity and behavior: role of glutamatergic synaptic transmission. Front.
Behav. Neurosci. 13, 288.
9. Sutherland, R.J., McDonald, R.J., and Savage, D.D. (2000). Prenatal
exposure to moderate levels of ethanol can have long-lasting effects
on learning and memory in adult offspring. Psychobiology 28, 532–539.
10. Valenzuela, C.F., Morton, R.A., Diaz, M.R., and Topper, L. (2012). Does
moderate drinking harm the fetal brain? Insights from animal models.
Trends Neurosci. 35, 284–292.
11. Morris, R.G.M., Garrud, P., Rawlins, J.N.P., and O’Keefe, J. (1982). Place
navigation impaired in rats with hippocampal lesions. Nature 297,
681–683.
12. Eichenbaum, H., Yonelinas, A.P., and Ranganath, C. (2007). The medial
temporal lobe and recognition memory. Annu. Rev. Neurosci. 30,
123–152.
13. Scoville, W.B., and Milner, B. (1957). Loss of recent memory after bilat-
eral hippocampal lesions. J. Neurol. Neurosurg. Psychiatry 20, 11–21.
14. O’Keefe, J. (1976). Place units in the hippocampus of the freely moving
rat. Exp. Neurol. 51, 78–109.
15. O’Keefe, J., and Dostrovsky, J. (1971). The hippocampus as a spatial
map. Preliminary evidence from unit activity in the freely-moving rat.
Brain Res. 34, 171–175.
16. O’Keefe, J., and Nadel, L. (1978). The Hippocampus as a Cognitive Map
(Clarendon).
17. O’Keefe, J., and Recce, M.L. (1993). Phase relationship between hippo-
campal place units and the EEG theta rhythm. Hippocampus 3, 317–330.
18. Hamilton, D.A., Barto, D., Rodriguez, C.I., Magcalas, C.M., Fink, B.C.,
Rice, J.P., Bird, C.W., Davies, S., and Savage, D.D. (2014). Effects of
moderate prenatal ethanol exposure and age on social behavior, spatial
response perseveration errors and motor behavior. Behav. Brain Res.
269, 44–54.
19. Rodriguez, C.I., Magcalas, C.M., Barto, D., Fink, B.C., Rice, J.P., Bird,
C.W., Davies, S., Pentkowski, N.S., Savage, D.D., and Hamilton, D.A.
(2016). Effects of sex and housing on social, spatial, and motor behavior
in adult rats exposed to moderate levels of alcohol during prenatal devel-
opment. Behav. Brain Res. 313, 233–243.
20. Savage, D.D., Becher, M., de la Torre, A.J., and Sutherland, R.J. (2002).
Dose-dependent effects of prenatal ethanol exposure on synaptic plas-
ticity and learning in mature offspring. Alcohol. Clin. Exp. Res. 26,
1752–1758.
21. Brady, M.L., Allan, A.M., and Caldwell, K.K. (2012). A limited access
mouse model of prenatal alcohol exposure that produces long-lasting
deficits in hippocampal-dependent learning and memory. Alcohol. Clin.
Exp. Res. 36, 457–466.
22. Sanchez, L.M., Goss, J., Wagner, J., Davies, S., Savage, D.D., Hamilton,
D.A., and Clark, B.J. (2019). Moderate prenatal alcohol exposure impairs
performance by adult male rats in an object-place paired-associate task.
Behav. Brain Res. 360, 228–234.
23. Behrens, T.E.J., Muller, T.H., Whittington, J.C.R., Mark, S., Baram, A.B.,
Stachenfeld, K.L., and Kurth-Nelson, Z. (2018). What is a cognitive map?
Organizing knowledge for flexible behavior. Neuron 100, 490–509.
24. Rubin, A., Yartsev, M.M., and Ulanovsky, N. (2014). Encoding of head di-
rection by hippocampal place cells in bats. J. Neurosci. 34, 1067–1080.

llArticle
25. Bliss, T.V., and Lomo, T. (1973). Long-lasting potentiation of synaptic
transmission in the dentate area of the anaesthetized rabbit following
stimulation of the perforant path. J. Physiol. 232, 331–356.
26. McNaughton, B.L., and Morris, R.G.M. (1987). Hippocampal synaptic
enhancement and information storage within a distributed memory sys-
tem. Trends Neurosci. 10, 408–415.
27. Brady, M.L., Diaz, M.R., Iuso, A., Everett, J.C., Valenzuela, C.F., and
Caldwell, K.K. (2013). Moderate prenatal alcohol exposure reduces plas-
ticity and alters NMDA receptor subunit composition in the dentate gyrus.
J. Neurosci. 33, 1062–1067.
28. Sutherland, R.J., McDonald, R.J., and Savage, D.D. (1997). Prenatal
exposure to moderate levels of ethanol can have long-lasting effects
on hippocampal synaptic plasticity in adult offspring. Hippocampus 7,
232–238.
29. Varaschin, R.K., Akers, K.G., Rosenberg, M.J., Hamilton, D.A., and
Savage, D.D. (2010). Effects of the cognition-enhancing agent ABT-239
on fetal ethanol-induced deficits in dentate gyrus synaptic plasticity.
J. Pharmacol. Exp. Ther. 334, 191–198.
30. Agnihotri, N.T., Hawkins, R.D., Kandel, E.R., and Kentros, C. (2004). The
long-term stability of new hippocampal place fields requires new protein
synthesis. Proc. Natl. Acad. Sci. USA 101, 3656–3661.
31. Barnes, C.A. (1979). Memory deficits associated with senescence: a
neurophysiological and behavioral study in the rat. J. Comp. Physiol.
Psychol. 93, 74–104.
32. Barnes, C.A., andMcNaughton, B.L. (1980). Physiological compensation
for loss of afferent synapses in rat hippocampal granule cells during
senescence. J. Physiol. 309, 473–485.
33. Barnes, C.A., Rao, G., and Houston, F.P. (2000). LTP induction threshold
change in old rats at the perforant path–granule cell synapse. Neurobiol.
Aging 21, 613–620.
34. Dieguez, D., Jr., and Barea-Rodriguez, E.J. (2004). Aging impairs the late
phase of long-term potentiation at the medial perforant path-CA3 syn-
apse in awake rats. Synapse 52, 53–61.
35. Rotenberg, A., Mayford, M., Hawkins, R.D., Kandel, E.R., and Muller,
R.U. (1996). Mice expressing activated CaMKII lack low frequency LTP
and do not form stable place cells in the CA1 region of the hippocampus.
Cell 87, 1351–1361.
36. Rotenberg, A., Abel, T., Hawkins, R.D., Kandel, E.R., and Muller, R.U.
(2000). Parallel instabilities of long-term potentiation, place cells, and
learning caused by decreased protein kinase A activity. J. Neurosci.
20, 8096–8102.
37. McHugh, T.J., Jones, M.W., Quinn, J.J., Balthasar, N., Coppari, R.,
Elmquist, J.K., Lowell, B.B., Fanselow, M.S., Wilson, M.A., and
Tonegawa, S. (2007). Dentate gyrus NMDA receptors mediate rapid
pattern separation in the hippocampal network. Science 317, 94–99.
38. Yassa, M.A., and Stark, C.E. (2011). Pattern separation in the hippocam-
pus. Trends Neurosci. 34, 515–525.
39. Battaglia, F.P., Sutherland, G.R., and McNaughton, B.L. (2004). Local
sensory cues and place cell directionality: additional evidence of pro-
spective coding in the hippocampus. J. Neurosci. 24, 4541–4550.
40. Frank, L.M., Stanley, G.B., and Brown, E.N. (2004). Hippocampal plas-
ticity across multiple days of exposure to novel environments.
J. Neurosci. 24, 7681–7689.
41. McNaughton, B.L., Barnes, C.A., and O’Keefe, J. (1983). The contribu-
tions of position, direction, and velocity to single unit activity in the hippo-
campus of freely-moving rats. Exp. Brain Res. 52, 41–49.
42. Matthews, D.B., Simson, P.E., and Best, P.J. (1996). Ethanol alters
spatial processing of hippocampal place cells: a mechanism for impaired
navigation when intoxicated. Alcohol. Clin. Exp. Res. 20, 404–407.
43. White, A.M., and Best, P.J. (2000). Effects of ethanol on hippocampal
place-cell and interneuron activity. Brain Res. 876, 154–165.
44. Davies, S., Ballesteros-Merino, C., Allen, N.A., Porch, M.W., Pruitt, M.E.,
Christensen, K.H., Rosenberg, M.J., and Savage, D.D. (2019). Impact of
moderate prenatal alcohol exposure on histaminergic neurons, histidine
decarboxylase levels and histamine H2 receptors in adult rat offspring.
Alcohol 76, 47–57.
45. Lee, I., Yoganarasimha, D., Rao, G., and Knierim, J.J. (2004).
Comparison of population coherence of place cells in hippocampal sub-
fields CA1 and CA3. Nature 430, 456–459.
46. Leutgeb, S., Leutgeb, J.K., Treves, A., Moser, M.B., and Moser, E.I.
(2004). Distinct ensemble codes in hippocampal areas CA3 and CA1.
Science 305, 1295–1298.
47. Park, E., Dvorak, D., and Fenton, A.A. (2011). Ensemble place codes in
hippocampus: CA1, CA3, and dentate gyrus place cells have multiple
place fields in large environments. PLoS ONE 6, e22349.
48. Roth, E.D., Yu, X., Rao, G., and Knierim, J.J. (2012). Functional differ-
ences in the backward shifts of CA1 and CA3 place fields in novel and
familiar environments. PLoS ONE 7, e36035.
49. Mizuseki, K., Royer, S., Diba, K., and Buzsaki, G. (2012). Activity dy-
namics and behavioral correlates of CA3 and CA1 hippocampal pyrami-
dal neurons. Hippocampus 22, 1659–1680.
50. Patten, A.R., Sawchuk, S., Wortman, R.C., Brocardo, P.S., Gil-Mohapel,
J., and Christie, B.R. (2016). Prenatal ethanol exposure impairs temporal
ordering behaviours in young adult rats. Behav. Brain Res. 299, 81–89.
51. Geisler, C., Robbe, D., Zugaro, M., Sirota, A., and Buzsaki, G. (2007).
Hippocampal place cell assemblies are speed-controlled oscillators.
Proc. Natl. Acad. Sci. USA 104, 8149–8154.
52. McClain, K., Tingley, D., Heeger, D.J., and Buzsaki, G. (2019). Position-
theta-phase model of hippocampal place cell activity applied to quantifi-
cation of running speed modulation of firing rate. Proc. Natl. Acad. Sci.
USA 116, 27035–27042.
53. Muller, R.U., Kubie, J.L., and Ranck, J.B., Jr. (1987). Spatial firing pat-
terns of hippocampal complex-spike cells in a fixed environment.
J. Neurosci. 7, 1935–1950.
54. Muller, R.U., Bostock, E., Taube, J.S., and Kubie, J.L. (1994). On the
directional firing properties of hippocampal place cells. J. Neurosci. 14,
7235–7251.
55. Knierim, J.J., Kudrimoti, H.S., and McNaughton, B.L. (1995). Place cells,
head direction cells, and the learning of landmark stability. J. Neurosci.
15, 1648–1659.
56. Samsonovich, A., and McNaughton, B.L. (1997). Path integration and
cognitive mapping in a continuous attractor neural network model.
J. Neurosci. 17, 5900–5920.
57. Jeffery, K.J., and O’Keefe, J.M. (1999). Learned interaction of visual and
idiothetic cues in the control of place field orientation. Exp. Brain Res.
127, 151–161.
58. Chakraborty, S., Anderson, M.I., Chaudhry, A.M., Mumford, J.C., and
Jeffery, K.J. (2004). Context-independent directional cue learning by hip-
pocampal place cells. Eur. J. Neurosci. 20, 281–292.
59. Aikath, D., Weible, A.P., Rowland, D.C., and Kentros, C.G. (2014). Role of
self-generated odor cues in contextual representation. Hippocampus 24,
1039–1051.
60. Calton, J.L., Stackman, R.W., Goodridge, J.P., Archey, W.B.,
Dudchenko, P.A., and Taube, J.S. (2003). Hippocampal place cell insta-
bility after lesions of the head direction cell network. J. Neurosci. 23,
9719–9731.
61. Harvey, R.E., Rutan, S.A., Willey, G.R., Siegel, J.J., Clark, B.J., and
Yoder, R.M. (2018). Linear self-motion cues support the spatial distribu-
tion and stability of hippocampal place cells. Curr. Biol. 28, 1803–
1810.e5.
62. Muller, R.U., and Kubie, J.L. (1987). The effects of changes in the environ-
ment on the spatial firing of hippocampal complex-spike cells.
J. Neurosci. 7, 1951–1968.
63. Scaplen, K.M., Gulati, A.A., Heimer-McGinn, V.L., and Burwell, R.D.
(2014). Objects and landmarks: hippocampal place cells respond differ-
ently to manipulations of visual cues depending on size, perspective, and
experience. Hippocampus 24, 1287–1299.
Current Biology 30, 3556–3569, September 21, 2020 3567

llArticle
64. Sharp, P.E., Blair, H.T., Etkin, D., and Tzanetos, D.B. (1995). Influences of
vestibular and visual motion information on the spatial firing patterns of
hippocampal place cells. J. Neurosci. 15, 173–189.
65. Zittrell, F. (2019). CircHist: circular histogram in MATLAB. Zenodo.
https://zenodo.org/record/3445084#.Xv6g1Od7lPY.
66. Huxter, J., Burgess, N., and O’Keefe, J. (2003). Independent rate and
temporal coding in hippocampal pyramidal cells. Nature 425, 828–832.
67. Climer, J.R., DiTullio, R., Newman, E.L., Hasselmo, M.E., and Eden, U.T.
(2015). Examination of rhythmicity of extracellularly recorded neurons in
the entorhinal cortex. Hippocampus 25, 460–473.
68. Hinman, J.R., Brandon, M.P., Climer, J.R., Chapman, G.W., and
Hasselmo, M.E. (2016). Multiple running speed signals in medial entorhi-
nal cortex. Neuron 91, 666–679.
69. Jeewajee, A., Barry, C., O’Keefe, J., and Burgess, N. (2008). Grid cells
and theta as oscillatory interference: electrophysiological data from
freely-moving rats. Hippocampus 18, 1175–1185.
70. Maurer, A.P., Vanrhoads, S.R., Sutherland, G.R., Lipa, P., and
McNaughton, B.L. (2005). Self-motion and the origin of differential spatial
scaling along the septo-temporal axis of the hippocampus.
Hippocampus 15, 841–852.
71. Welday, A.C., Shlifer, I.G., Bloom, M.L., Zhang, K., and Blair, H.T. (2011).
Cosine directional tuning of theta cell burst frequencies: evidence for
spatial coding by oscillatory interference. J. Neurosci. 31, 16157–16176.
72. Stensola, H., Stensola, T., Solstad, T., Frøland, K., Moser, M.-B., and
Moser, E.I. (2012). The entorhinal grid map is discretized. Nature 492,
72–78.
73. Petersen, P.C., and Buzsaki, G. (2020). Cooling of medial septum reveals
theta phase lag coordination of hippocampal cell assemblies. Neuron.
Published online June 10, 2020. https://doi.org/10.1016/j.neuron.2020.
05.023.
74. Gois, Z.H.T.D., and Tort, A.B.L. (2018). Characterizing speed cells in the
rat hippocampus. Cell Rep. 25, 1872–1884.e4.
75. Wiener, S.I., Paul, C.A., and Eichenbaum, H. (1989). Spatial and behav-
ioral correlates of hippocampal neuronal activity. J. Neurosci. 9, 2737–
2763.
76. O’Keefe, J., Burgess, N., Donnett, J.G., Jeffery, K.J., and Maguire, E.A.
(1998). Place cells, navigational accuracy, and the human hippocampus.
Philos. Trans. R. Soc. Lond. B Biol. Sci. 353, 1333–1340.
77. Zhang, K., Ginzburg, I., McNaughton, B.L., and Sejnowski, T.J. (1998).
Interpreting neuronal population activity by reconstruction: unified frame-
work with application to hippocampal place cells. J. Neurophysiol. 79,
1017–1044.
78. Czurko, A., Hirase, H., Csicsvari, J., and Buzsaki, G. (1999). Sustained
activation of hippocampal pyramidal cells by ‘space clamping’ in a
running wheel. Eur. J. Neurosci. 11, 344–352.
79. Hirase, H., Czurko, A., Csicsvari, J., and Buzsaki, G. (1999). Firing rate
and theta-phase coding by hippocampal pyramidal neurons during
‘space clamping’. Eur. J. Neurosci. 11, 4373–4380.
80. Ekstrom, A.D., Meltzer, J., McNaughton, B.L., and Barnes, C.A. (2001).
NMDA receptor antagonism blocks experience-dependent expansion
of hippocampal ‘‘place fields’’. Neuron 31, 631–638.
81. Nitz, D., and McNaughton, B. (2004). Differential modulation of CA1 and
dentate gyrus interneurons during exploration of novel environments.
J. Neurophysiol. 91, 863–872.
82. Kropff, E., Carmichael, J.E., Moser, M.-B., and Moser, E.I. (2015). Speed
cells in the medial entorhinal cortex. Nature 523, 419–424.
83. Fontaine, C.J., Patten, A.R., Sickmann, H.M., Helfer, J.L., and Christie,
B.R. (2016). Effects of pre-natal alcohol exposure on hippocampal syn-
aptic plasticity: sex, age and methodological considerations. Neurosci.
Biobehav. Rev. 64, 12–34.
84. Savage, D.D., Rosenberg, M.J., Wolff, C.R., Akers, K.G., El-Emawy, A.,
Staples, M.C., Varaschin, R.K., Wright, C.A., Seidel, J.L., Caldwell,
K.K., and Hamilton, D.A. (2010). Effects of a novel cognition-enhancing
3568 Current Biology 30, 3556–3569, September 21, 2020
agent on fetal ethanol-induced learning deficits. Alcohol. Clin. Exp.
Res. 34, 1793–1802.
85. Galindo, R., Frausto, S., Wolff, C., Caldwell, K.K., Perrone-Bizzozero,
N.I., and Savage, D.D. (2004). Prenatal ethanol exposure reduces
mGluR5 receptor number and function in the dentate gyrus of adult
offspring. Alcohol. Clin. Exp. Res. 28, 1587–1597.
86. Varaschin, R.K., Allen, N.A., Rosenberg, M.J., Valenzuela, C.F., and
Savage, D.D. (2018). Prenatal alcohol exposure increases histamine H3
receptor-mediated inhibition of glutamatergic neurotransmission in rat
dentate gyrus. Alcohol. Clin. Exp. Res. 42, 295–305.
87. Latuske, P., Kornienko, O., Kohler, L., and Allen, K. (2018). Hippocampal
remapping and its entorhinal origin. Front. Behav. Neurosci. 11, 253.
88. Hales, J.B., Schlesiger, M.I., Leutgeb, J.K., Squire, L.R., Leutgeb, S., and
Clark, R.E. (2014). Medial entorhinal cortex lesions only partially disrupt
hippocampal place cells and hippocampus-dependent place memory.
Cell Rep. 9, 893–901.
89. Schlesiger, M.I., Boublil, B.L., Hales, J.B., Leutgeb, J.K., and Leutgeb, S.
(2018). Hippocampal global remapping can occur without input from the
medial entorhinal cortex. Cell Rep. 22, 3152–3159.
90. Van Cauter, T., Poucet, B., and Save, E. (2008). Unstable CA1 place cell
representation in rats with entorhinal cortex lesions. Eur. J. Neurosci. 27,
1933–1946.
91. Brun, V.H., Leutgeb, S.,Wu, H.Q., Schwarcz, R.,Witter, M.P., Moser, E.I.,
and Moser, M.B. (2008). Impaired spatial representation in CA1 after
lesion of direct input from entorhinal cortex. Neuron 57, 290–302.
92. Terrazas, A., Krause, M., Lipa, P., Gothard, K.M., Barnes, C.A., and
McNaughton, B.L. (2005). Self-motion and the hippocampal spatial
metric. J. Neurosci. 25, 8085–8096.
93. Yoganarasimha, D., Yu, X., and Knierim, J.J. (2006). Head direction cell
representations maintain internal coherence during conflicting proximal
and distal cue rotations: comparison with hippocampal place cells.
J. Neurosci. 26, 622–631.
94. McNaughton, B.L., Battaglia, F.P., Jensen, O., Moser, E.I., and Moser,
M.B. (2006). Path integration and the neural basis of the ‘cognitive
map’. Nat. Rev. Neurosci. 7, 663–678.
95. Yoder, R.M., Clark, B.J., and Taube, J.S. (2011). Origins of landmark en-
coding in the brain. Trends Neurosci. 34, 561–571.
96. Neunuebel, J.P., Yoganarasimha, D., Rao, G., and Knierim, J.J. (2013).
Conflicts between local and global spatial frameworks dissociate neural
representations of the lateral and medial entorhinal cortex. J. Neurosci.
33, 9246–9258.
97. Cacucci, F., Yi, M.,Wills, T.J., Chapman, P., andO’Keefe, J. (2008). Place
cell firing correlates with memory deficits and amyloid plaque burden in
Tg2576 Alzheimer mouse model. Proc. Natl. Acad. Sci. USA 105,
7863–7868.
98. Lester, A.W., Moffat, S.D., Wiener, J.M., Barnes, C.A., and Wolbers, T.
(2017). The aging navigational system. Neuron 95, 1019–1035.
99. Hamilton, D.A., Kodituwakku, P., Sutherland, R.J., and Savage, D.D.
(2003). Children with fetal alcohol syndrome are impaired at place
learning but not cued-navigation in a virtual Morris water task. Behav.
Brain Res. 143, 85–94.
100. Knierim, J.J., and Hamilton, D.A. (2011). Framing spatial cognition: neural
representations of proximal and distal frames of reference and their roles
in navigation. Physiol. Rev. 91, 1245–1279.
101. Winson, J. (1978). Loss of hippocampal theta rhythm results in spatial
memory deficit in the rat. Science 201, 160–163.
102. Lenck-Santini, P.P., and Holmes, G.L. (2008). Altered phase precession
and compression of temporal sequences by place cells in epileptic
rats. J. Neurosci. 28, 5053–5062.
103. Robbe, D., and Buzsaki, G. (2009). Alteration of theta timescale dynamics
of hippocampal place cells by a cannabinoid is associated with memory
impairment. J. Neurosci. 29, 12597–12605.

llArticle
104. Kim, J., Delcasso, S., and Lee, I. (2011). Neural correlates of object-in-
place learning in hippocampus and prefrontal cortex. J. Neurosci. 31,
16991–17006.
105. Madden, J.T., Thompson, S.M., Magcalas, C.M., Wagner, J.L., Hamilton,
D.A., Savage, D.D., Clark, B.J., and Pentkowski, N.S. (2020). Moderate
prenatal alcohol exposure reduces parvalbumin expressing GABAergic
interneurons in the dorsal hippocampus of adult male and female rat
offspring. Neurosci. Lett. 718, 134700.
106. Amilhon, B., Huh, C.Y., Manseau, F., Ducharme, G., Nichol, H.,
Adamantidis, A., and Williams, S. (2015). Parvalbumin interneurons of
hippocampus tune population activity at theta frequency. Neuron 86,
1277–1289.
107. Hu, H., Gan, J., and Jonas, P. (2014). Interneurons. Fast-spiking,
parvalbumin+ GABAergic interneurons: from cellular design to microcir-
cuit function. Science 345, 1255263.
108. Royer, S., Zemelman, B.V., Losonczy, A., Kim, J., Chance, F., Magee,
J.C., and Buzsaki, G. (2012). Control of timing, rate and bursts of hippo-
campal place cells by dendritic and somatic inhibition. Nat. Neurosci. 15,
769–775.
109. Climer, J.R., Newman, E.L., and Hasselmo,M.E. (2013). Phase coding by
grid cells in unconstrained environments: two-dimensional phase pre-
cession. Eur. J. Neurosci. 38, 2526–2541.
110. Berens, P. (2009). CircStat: a MATLAB toolbox for circular statistics.
J. Stat. Softw. 31, 1–21.
111. Ahmed, O.J., and Mehta, M.R. (2009). The hippocampal rate code: anat-
omy, physiology and theory. Trends Neurosci. 32, 329–338.
112. Butler, W.N., Hardcastle, K., and Giocomo, L.M. (2019). Remembered
reward locations restructure entorhinal spatial maps. Science 363,
1447–1452.
113. Ravassard, P., Kees, A., Willers, B., Ho, D., Aharoni, D.A., Cushman, J.,
Aghajan, Z.M., and Mehta, M.R. (2013). Multisensory control of hippo-
campal spatiotemporal selectivity. Science 340, 1342–1346.
114. Jammalamadaka, S.R., and Sengupta, A. (2001). Topics in Circular
Statistics (World Scientific).
115. Kempter, R., Leibold, C., Buzsaki, G., Diba, K., and Schmidt, R. (2012).
Quantifying circular-linear associations: hippocampal phase precession.
J. Neurosci. Methods 207, 113–124.
116. Skaggs, W.E., McNaughton, B.L., Wilson, M.A., and Barnes, C.A. (1996).
Theta phase precession in hippocampal neuronal populations and the
compression of temporal sequences. Hippocampus 6, 149–172.
117. Burgess, N., Recce, M., and O’Keefe, J. (1994). A model of hippocampal
function. Neural Netw. 7, 1065–1081.
118. Harris, K.D., Henze, D.A., Hirase, H., Leinekugel, X., Dragoi, G., Czurko,
A., and Buzsaki, G. (2002). Spike train dynamics predicts theta-related
phase precession in hippocampal pyramidal cells. Nature 417,
738–741.
119. Huxter, J.R., Senior, T.J., Allen, K., and Csicsvari, J. (2008). Theta phase-
specific codes for two-dimensional position, trajectory and heading in
the hippocampus. Nat. Neurosci. 11, 587–594.
120. Jeewajee, A., Barry, C., Douchamps, V., Manson, D., Lever, C., and
Burgess, N. (2013). Theta phase precession of grid and place cell firing
in open environments. Philos. Trans. R. Soc. Lond. B Biol. Sci. 369,
20120532.
121. Munn, R.G.K., Mallory, C.S., Hardcastle, K., Chetkovich, D.M., and
Giocomo, L.M. (2020). Entorhinal velocity signals reflect environmental
geometry. Nat. Neurosci. 23, 239–251.
122. Cooper, H., and Hedges, L.V. (1993). The Handbook of Research
Synthesis (Russell Sage Foundation).
Current Biology 30, 3556–3569, September 21, 2020 3569

llArticle
STAR+METHODS
KEY RESOURCES TABLE
REAGENT or RESOURCE SOURCE IDENTIFIER
Deposited Data
Datasets This paper https://doi.org/10.17605/OSF.IO/PM89Y
Experimental Models: Organisms/Strains
Rat: Long-Evans Harlan Industries
Software and Algorithms
Data Acquisition Software Cheetah (Neuralynx) https://neuralynx.com
Analysis Software MATLAB v2017, 2018, 2019 https://www.mathworks.com/
Analysis Software RStudio https://rstudio.com/
Custom Code for Data Analysis This paper https://github.com/ryanharvey1/ephys_tools
Pass Index [109] https://github.com/jrclimer/Pass_Index
Theta-rhythmicity [67] https://github.com/jrclimer/mle_rhythmicity
Circular Statistics Toolbox [110] https://www.mathworks.com/matlabcentral/fileexchange/
10676-circular-statistics-toolbox-directional-statistics
Spike Sorting Klustakwik http://klustakwik.sourceforge.net/
Spike Sorting Kilosort2 https://github.com/MouseLand/Kilosort2
Spike sorting MClust https://github.com/adredish/MClust-Spike-Sorting-Toolbox
Spike sorting Phy https://github.com/cortex-lab/phy
Other
Custom electrodes (8 tetrodes) Custom built
Halo-18 Microdrive (16 tetrodes) Neuralynx https://neuralynx.com/hardware/halo-18-microdrive
Digital Neuralynx recording system, Lynx SX Neuralynx https://neuralynx.com
17um dia nichrome wire California fine wire https://www.calfinewire.com/index.html
RESOURCE AVAILABILITY
Lead ContactFurther information, materials, and protocols used in the manuscript will be made available upon request to the Lead Contact author,
Benjamin J. Clark (e-mail: [email protected]).
Materials AvailabilityThis study did not generate new unique reagents.
Data and Code AvailabilityThe datasets generated during this study are available at OSF: https://doi.org/10.17605/OSF.IO/PM89Y. Custom code is available at
https://github.com/ryanharvey1/ephys_tools
EXPERIMENTAL MODEL AND SUBJECT DETAILS
SubjectsSubjects were 17 male Long-Evans rats obtained from the University of New Mexico Health Sciences Center Animal Resource
Facility (see breeding protocol below). After weaning, all animals were pair-housed in standard plastic cages with water and
food available ad libitum. All cage-mate pairs were matched for age and weight and animals were at least 4 months of age before
testing. Saccharin-exposed control (n = 9) and prenatal-alcohol-exposed (PAE) (n = 8) rats began linear track and cylinder behav-
ioral training at 46 months of age. At this time, rats weights were slowly brought down to approximately 90 percent of their ad li-
bitumweight. Lights weremaintained on a reverse 12 h:12 h light:dark cycle with lights on at 0900 h. All procedures were approved
by the Institutional Animal Care and Use Committee of either the main campus or Health Sciences Center at the University of New
Mexico.
e1 Current Biology 30, 3556–3569.e1–e5, September 21, 2020

llArticle
Breeding and voluntary ethanol consumptionBreeding procedures were conducted at the University of New Mexico Health Sciences Animal Resource Facility. Three to four-
month-old female breeders (Harlan Industries, Indianapolis, IN) were single housed in standard plastic cages and placed on a
12- hour reverse light: dark cycle (lights on from 2100-0900 h) and kept at 22�C with ad libitum food and water. Following a one-
week acclimation period in the animal facility, the breeders were exposed to a voluntary ethanol drinking paradigm (Figure 1A).
Female rats were provided 0.066% (w/v) saccharin in tap water from 1000-1400 h (4 h) each day. On days 12, the saccharin water
contained 0% ethanol, on days 34 saccharin water contained 2.5% ethanol (v/v), and on day 5 and thereafter, saccharin water con-
tained 5% ethanol (v/v). The daily four-hour consumption of ethanol was monitored for at least two weeks and themean daily ethanol
consumption was determined for each female. After two weeks of daily ethanol consumption, females that drank at levels less than
one standard deviation below that of the entire group mean were removed from the study (�1215% of all female rats). The remaining
females were then assigned to either a saccharin control or 5% ethanol drinking group. These breeding females were matched such
that themean pre-pregnancy ethanol consumption by each groupwas similar. As a result, the dams of both groups experience equiv-
alent pre-conceptual exposure to ethanol. Lastly, the female breeders were nulliparous and were not used in multiple rounds of
breeding, while the male rats were experienced breeders.
Female rats werematchedwith amale breeder rat until pregnancy was verified, based on the presence of a vaginal plug. Therewas
no ethanol consumption during breeding. Beginning on gestational day 1, the rat dams were given access to saccharin (Sigma Life
Sciences, St. Louis, Missouri) water containing either 0% (v/v) or 5% (v/v) ethanol (Koptec, King of Prussia, Pennsylvania) for four
hours a day, from 1000-1400 h. The volume of the 0% ethanol saccharin water provided to the control group was matched to the
mean volume of the 5% ethanol saccharin water consumed by the ethanol group. During gestation and including the four-hour
ethanol/saccharin drinking period, rats were provided with ad libitum water and rat chow (Teklad global soy protein-free extruded
food 2920). Daily ethanol consumption was recorded for each rat dam (Table S1). The daily mean ethanol consumption throughout
pregnancy was 1.96 ± 0.14 g/kg) and did not vary significantly during each of the three weeks of gestation. In a separate set of rat
dams, this level of ethanol consumption has been shown to produce a mean peak maternal serum ethanol concentration of 60.8 ±
5.8 mg/dl [44]. Daily ethanol consumption ended at birth, and the litters were weighed and culled to 10 pups. As shown in Table S1,
this moderate exposure paradigm did not affect maternal weight gain, offspring litter size, or birth weight for the offspring used in
these studies. Experimental offspring used in these studies were generated from nine different saccharin control and eight different
ethanol-consuming rat dams bred in four separate breeding rounds.
METHOD DETAILS
Surgical proceduresRats were anesthetized with isoflurane and positioned in a stereotaxic apparatus (David Kopf Instruments) with bregma and lambda
set at the sameD-V plane. The scalp was retracted, and a hole was drilled above the hippocampus. Six additional holeswere drilled in
the frontal, parietal, and occipital bones to hold jewelers screws with a single screw in the parietal plate used for grounding. With the
electrode bundle (see below for fabrication details) positioned dorsal to the hippocampus (Figure 1A), the drive assemblies were
fastened to the skull and jewelers screws with dental acrylic. The scalp was sutured around the electrode drive and the wound
was covered with Neosporin. Buprenorphine was administered postoperatively and the animal was allowed to recover at least
1 week before recording.
ApparatusThe cylinder (diameter: 76.5 cm, height: 40 cm) was positioned on a black plastic surface, and a white cue card covered 100 degrees
of the wall surface (Figure 1B). The linear track (length: 120 cm, width: 9 cm, height: 10 cm) was positioned relative to polarizing distal
cues (white cue cards) to make each running direction distinct. The entire recording area was located within a large Faraday cage to
reduce electrical noise. Eight battery-powered LED lights mounted on the ceiling provided illumination.
Behavioral trainingEach animal was exposed to eachmaze for several days. On the linear track, animals were trained to continuously alternate between
the two ends. Stop locations were rewarded with 1/8 piece of a fruit-loop if animals completed a successful lap without stopping or
alternating the incorrect direction. This training continued until 40 laps could be completed within 15 minutes. For the cylinder, an-
imals were trained to randomly forage for fruit-loop pieces that were semi-randomly dropped into the environment until all locations
were sufficiently sampled. Experimenters were aware of each animals group affiliation (PAE or control) upon initiation of behavioral
training.
Recording ProceduresSingle units and local field potentials (LFP) were recorded from the CA1 and CA3 regions of the dorsal hippocampus using 8 to 16 tet-
rodes each of which consisting of four-channel electrodes constructed by twisting together strands of insulated 12-17 mm nichrome
wire [17].
After surgery, tetrodes were slowly advanced into the CA1 area of the hippocampus. During tetrode advancement and recordings,
the electrode assembly was connected to a multichannel, impedance matching, unity gain preamplifier headstage. The output was
Current Biology 30, 3556–3569.e1–e5, September 21, 2020 e2

llArticle
routed to a data acquisition system with 64 digitally programmable differential amplifiers (Neuralynx, Bozeman, MT, USA). Spike
waveforms above a threshold of 30-40 mV were time-stamped, digitized at 32 kHz, and later imported into MClust for spike sorting.
Continuous wide-band signals from each channel were collected for sessions spike sorted with kilosort2. The rats position was
tracked and sampled at 30 Hz by recording the position of light-emitting diodes that were placed above the head.
Rats were screened each day on a pedestal for identifiable units and HPC theta rhythm visible in the local field potentials.
Once units and theta rhythm were found a typical recording began with �40 laps on a linear track (�10-15 minutes), followed by
an open field cylinder session, and finished with an open field cylinder session with the local cue rotated 90 degrees (Fig-
ure 1B). Linear track sessions in which the rat made less than 15 laps were not included in any analysis. In the cylinder sessions,
rats randomly foraged for fruit-loops until the environment was fully sampled (�15-30 minutes). Depending on the rats motivation,
some sessions were limited to either a single linear track or a linear track and one cylinder session. After each daily recording session,
tetrodes were advanced approximately 62 mm to record different neurons each day. Each rat performed 32 daily sessions on
average.
HistologyRats were euthanized by transcardial perfusionwith normal saline followed by 10%Formalin, and brainswere then placed in Formalin
for 24 hours to ensure adequate fixation. Brains were then placed in 20% sucrose for cryoprotection before they were sectioned at
40 mm on a freezing microtome. Brain sections were mounted on gelatin-coated or charged microscope slides and stained with
Cresyl violet (Figure 1A). The electrode position at the time of each recording was estimated relative to the site of the final electrode
tip location. Electrode tips were marked by applying constant current (4 mA for 4 s) through a wire of each tetrode. Our analyses
included only sessions where the electrode tip was estimated to be located within CA1 and CA3 regions. It is important to note
the possibility that a small number of recordings may have included granule cells or mossy cells from the dentate subregion, given
its proximity to CA3.
Spike sortingSpike sorting was performed first by using unsupervised methods klustakwik http://klustakwik.sourceforge.net/ or kilosort2 https://
github.com/MouseLand/Kilosort2 with manual refinement conducted in MClust https://github.com/adredish/MClust-Spike-
Sorting-Toolbox or Phy https://github.com/cortex-lab/phy. Autocorrelation and cross-correlation functions were used as single unit
identification criteria for bothmethods. Active neurons, defined as having at least 100 spikes and a peak firing rate of 1Hz, were consid-
ered for analysis.
Spatial rate map constructionFirst, position and spiking data were speed filtered; only epochs with instantaneous running speeds of 3 cm/sec or more were
included. Then occupancy normalized firing rate maps were constructed using 3x3cm spatial bins. Maps were then smoothed
with a 5x5 standard deviation Gaussian kernel. For linear track tuning curves, the x coordinate was binned as above while the
y-coordinate was compressed into a single bin.
Spatial informationSpatial information content for each cell, the spatial information content was calculated as:
Information =XNi = 1
Pi
li
llog2
li
l(Equation 1)
Where the environment is divided into spatial bins i = 1;.;N;Pi is the occupancy probability of bin i, li is themean firing rate for bin
i, and l is the overall mean firing rate of the cell [111]
SparsitySparsity for each cell was calculated as:
Sparsity =
�1n
Pi ri�2
1n
Piðr2i Þ
(Equation 2)
Where i is a spatial bin and ri is the firing rate of the cell in bin i of an environment containing a total of n spatial bins [111]. A sparsity
value of 1 implies no sparseness. A sparsity value approaching 0 is indicative of maximal sparseness and implies a greater amount of
spatial information in each spike emitted by that cell.
Spatial correlationThe spatial similarity of place fields across two conditions was calculated using Pearsons correlation. The correlation coefficient was
calculated by comparing the firing rates between all pixels at corresponding locations.
e3 Current Biology 30, 3556–3569.e1–e5, September 21, 2020

llArticle
r =P
m
Pn
�Amn � A
��Bmn � B
�ffiffiffiffiffiffiffiffiffiffiffiffiffiffiffiffiffiffiffiffiffiffiffiffiffiffiffiffiffiffiffiffiffiffiffiffiffiffiffiffiffiffiffiffi�P
m
Pn
�Amn � A
�2s ��P
m
Pn
�Bmn � B
�2� (Equation 3)
Spatial coherenceSpatial coherence was computed as the Fisher z-transformation (the arctangent) of the correlation between the firing rate of each
spatial bin and the average firing rate of the neighboring 3-8 spatial bins [112].
Directionality IndexThe directionality of a cell on the linear track was defined as:
D =
P
iðliF � liB ÞPiðliF + liB Þ
(4)
Where liF is the firing rate in bin i in the forward (or outbound) running direction and liB is the firing rate in the backward (or inbound)
running direction [113]. This equation was also used to compare rate differences between the two cylinder sessions.
Place cell classificationFrom neurons recorded during the linear track sessions, the set of heuristics used to identify a place field were the following 1) Min-
imumpeak firing rate of 1 Hz, 2) Minimum field width of 9 cm, 3) Maximum field width of 78 cm (65%of track length), 4) At least 15 laps
with consistent behavior, 5) At least 100 spikes, 6) Minimum spatial information content of 0.15 bits/spike. Given these criteria, 24.6%
(1459 of 5927) of active (> 100 spikes & > 1Hz peak rate) HPC neurons had at least one place field with a mean of 1.26 ± 0.01 per
neuron. No limit was set on the number of place fields single neurons could have and metrics were obtained from the field with the
highest firing rate. Themedian peak firing rate was 7.52 ± 0.32 Hz, and themean field width was 45.93 ± 0.40 cm. The start and stop
position for each field were taken as the spatial bins where the firing rate drops below 20% of the peak firing rate. From neurons re-
corded in the cylinder sessions, a similar set of heuristics used to identify a place field were the following 1) Minimum peak firing rate
of 1 Hz, 2) Minimum field width of 9 cm, 3) Maximum field width of 49.7 cm (65% of cylinder diameter), 4) At least 100 spikes, 5) Min-
imumspatial information content of 0.15 bits/spike. Given these criteria, 24.1% (1554 of 6448) of HPC active neurons recorded during
the first cylinder session had at least one place field with amean of 1.74 ± 0.02 fields per neuron.While there were no limits set on the
number of place fields single neurons could have, place cell metrics were obtained from the field with the highest firing rate. The me-
dian peak firing rate was 7.25 ± 0.33 Hz, and the mean field width was 31.71 ± 0.25 cm. The field boundaries were drawn using
Matlabs contourc function following a k-means clustering procedure which separated low and high firing locations.
Cue rotation analysisA rotational correlation analysis was used to assess the response of place cells following the 90-degree cue rotation by first
rotating the rate map from the cue rotation session in 6-degree bins while calculating a spatial correlation for each rotation. Next,
the angle at which the two rate maps showed the highest correlation was declared the cells rotation angle. Consistent with previous
literature, cells below a moderate correlation, r < 0.4, were not used in this analysis in an attempt to minimize the impact of
spontaneous remapping which would result in erroneous rotation angles [55, 59–64]. A depiction of this analysis can be found in
Figure 4A.
Instantaneous theta phase, firing phaseA 3rd order Butterworth band-pass filter (412Hz) was applied to the LFP signal from a single channel on each tetrode selected for
phase estimation. The instantaneous theta phase was obtained from the Hilbert transform of the filtered signal. Spike and LFP time-
stamps were then used to linearly interpolate the firing phase from these values.
Theta phase precessionOne-dimensional phase precession of place cells in the linear track was quantified using a circular-linear correlation between theta
firing phase from each place cell and the linear x coordinate as the rat passed through a place field [114, 115]. Phase precession was
quantified for multiple place fields from a single cell. However, metrics for comparison were only taken from the place field with the
highest peak firing rate.
While theta phase precession was initially discovered as in rats while they ran back and forth along a linear track [17], the phenom-
enon also occurs in open spaces [109, 116, 117–120]. Two-dimensional phase precession of place cells in the cylinder was
computed using ‛pass-index’ https://github.com/jrclimer/Pass_Index [109]. Rate maps were smoothed with a pseudo-Gaussian
kernel with a five-bin standard deviation. The value at each bin was then percentile normalized between 0 and 1 which resulted in
the field index map. The trajectory of the animal was sampled evenly along the arc-length of the trajectory at as many points as there
were position tracking samples (30 Hz). The nearest bins were then found by minimizing the difference between the x and y positions
and the center of the bins via the MATLAB function: bsxfun. The omnidirectional pass index was then computed on the field index
Current Biology 30, 3556–3569.e1–e5, September 21, 2020 e4

llArticle
mapswhich resulted in a�1 to 1 vector where�1 represents when the animal was at the beginning of the place field, 0 represents the
center, and +1 represents the end of the place field. A circular-linear correlation between theta firing phase from each cell and the
above vector to quantification of phase precession [114, 115].
Spike-train theta rhythmicityWe assessed the properties of theta-rhythmicity, such as intrinsic theta-frequency, rhythmicity magnitude, and approximated best fit
autocorrelograms, and running speed covariation using a maximum likelihood estimation approach [67, 68] (available at https://
github.com/jrclimer/mle_rhythmicity).
Speed modulated cellsAnalysis of speed modulation of firing rates was similar to previous approaches [82, 121] was adapted from code located at https://
github.com/GiocomoLab/Munn_et_al_2019. Speed scores were calculated as the Pearson correlation between the instantaneous
firing rate of each cell and the running speed of the animal across 200ms time bins. As well, overall slopes and intercepts were deter-
mined for each cell by the fitting of first-degree (linear) polynomials using the polyfit function in MATLAB. To determine if a cell was
speedmodulated, either positively or negatively, a null distribution was created for each cell by shuffling the spike train 100 times in a
random interval 20 s before to 20 s after its true position and calculating a speed score each iteration. Cells were considered speed
modulated if the proportion of permutations with a larger magnitude was < 0.05.
Speed by firing rate tuning curves, shown in Figure S5, were generated by averaging instantaneous firing rates over 2cm/sec speed
bins ranging from 0cm/sec to the 95th percentile of the animal’s running speed for that particular session.
QUANTIFICATION AND STATISTICAL ANALYSIS
Data analysisData analysis was performed by importing position data, LFP data, and spike data into MATLAB and further processing the data with
custom-written software. Statistical analysis was performed in MATLAB and R.
Statistical AnalysisAll statistical tests used were two-sided, and the significance threshold for all tests was set at p < 0.05 unless otherwise stated.
All main tests are shown in Table S2.
The normality of distributions was not assumed, so comparisons were made using non-parametric statistics. For between-group
comparison, Wilcoxon signed-rank orWilcoxon rank-sum tests were used to test the equality of medians. Effect sizes (r) forWilcoxon
tests were calculated with r =Z=ffiffiffin
p[122]. Group comparisons of continuous data were visualized using violin plots to show the dis-
tribution density and overlaid boxplots to show themedian, interquartile range (IQR), and 1.5 times the IQR. IQR = quartile 3 – quartile
1 and is represented by the box length. The uppermost line is quartile 3 + 1.5 IQR, whereas the lowermost line is quartile 1 – 1.5 IQR.
Between-group comparison of proportions were computed using chi-square tests and visualized with bar plots. Effect sizes for these
comparisons were calculated with Cramr’s V.
Angular data were assessed using the Circular Statistics Toolbox [110]. Verification of von mises distributions were performed us-
ing Rayleigh Tests, while a Watson-Williams multi-sample test for equal means was used to compare mean directions between
groups.
e5 Current Biology 30, 3556–3569.e1–e5, September 21, 2020

Current Biology, Volume 30
Supplemental Information
Altered Hippocampal Place Cell
Representation and Theta Rhythmicity
following Moderate Prenatal Alcohol Exposure
Ryan E. Harvey, Laura E. Berkowitz, Daniel D. Savage, Derek A. Hamilton, and BenjaminJ. Clark

0
1
2
3
track cylinder 1 cylinder 2
aver
age
firin
g ra
te (
Hz)
CA1
0
1
2
3
track cylinder 1 cylinder 2
CA3
0.00
0.25
0.50
0.75
1.00
track cylinder 1 cylinder 2
Bur
st in
dex
CA1
0.00
0.25
0.50
0.75
1.00
track cylinder 1 cylinder 2
CA3
Session
Control
PAE
Figure S1: Average firing rate and burst index over recording sessions. Related to Figure 1.While CA1 average firing rates were similar between groups across sessions (all p ≥ 0.03174, WRS), CA1and CA3 cells from both groups displayed decreased average firing rates in the first and second cylindersession compared to the linear track (control: ps < 0.0005, PAE: ps < 0.0001; Paired WRS), but hadsimilar rates between cylinder sessions (control: ps ≥ 0.0303, PAE: ps ≥ 0.4357, Paired WRS). Burst indexwas calculated as the difference between the cell’s burst rate and the expected burst rate derived from ahomogeneous Poisson process with the same average firing rate. Bursts were defined as epochs of spikeswith interspike intervals between 0ms and 10ms. Burst index from CA1 and CA3 cells was similar betweengroups across sessions (all p ≥ 0.01567, WRS). However, control CA3 cells displayed a decrease in burstindex from the linear track to the first and second cylinder sessions (all ps ≤ 0.0009, Paired WRS). Datais represented as median ± standard error of the median. Neurons included met place cell criteria in eachmaze. Family-wise error was maintained at α ≤ 0.05 by adjusting the significance levels for individual teststo α ≤ 0.005.

-7.50
-5.00
-2.50
0.00
2.50
cylinder track
mazetype
Diff
ere
nce
in S
pe
ed
(firs
t-se
cond
hal
f, cm
/sec
)
A p = 0.005ns
-0.30
-0.20
-0.10
0.00
0.10
0.20
cylinder
Diff
ere
nce
in e
xplo
ratio
n(f
irst-
seco
nd h
alf,
prop
ortio
n)
ns
Normalized session duration (arbitrary units)
7.5
8.0
8.5
9.0
B
C Running speed from Cylinder
Runnin
g s
pee
d (
cm/s
ec)
14.0
14.5
15.0
15.5
16.0
16.5
17.0
17.5
D Running speed from linear track
Runnin
g s
pee
d (
cm/s
ec)
Normalized session duration (arbitrary units)
Figure S2: Behavioral stability between the first and second half of the session. Related toFigure 2. (A) Difference in running speed between the first and second halves of each recording session.PAE rats have a larger difference in running speed on the linear between the two halves compared to controlrats (p = 0.005, WRS, effect size (r) = 0.21, Control median = 0.09, n = 64; PAE median = -0.54, n = 111).(B) Difference in the proportion of the cylinder explored between the first and second halves of each recordingsession was similar between groups. Note that both medians are above 0 indicating that exploration washigher in the first half compared to the second half of the session. Linear track data is not shown here becausethe extent of the track was sampled with each lap and rats from both groups completed similar numbers oflaps. (C) Running speed over the duration of the cylinder sessions. (D) Running speed over the duration ofthe linear track sessions. Note the group difference here reflects the significant difference in A where PAErats have a slightly slower running speed at the start of the trial. (C-D) Because all recording sessions hadslightly different recording durations depending on the rat’s motivation, we first calculated mean velocityfrom each session over 1 minute bins. The resulting speed vectors were linearly interpolated as to have asmany points as the longest vector in the set. In effect, we can visualize fluctuations in velocity from the startto the end of each session on the same scale. Data is represented as mean ± standard error. (A-D) Orangerepresents data from PAE rats and black represents data from control animals.

0 200 400 600
0
1
2
3
4
CA1 track
0 200 400 600-1
0
1
2
3
4CA3 track
0 200 400 600
0
1
2
3
4
CA1 cylinder
0 200 400 600-1
0
1
2
3
4CA3 cylinder
time (ms)
Mea
n p
robab
ility
(zs
core
)
Mean mle fits of all cells
ControlPAE
15ms
18ms
33ms66ms
0ms
9ms
9ms6ms
12ms
24ms
33ms48ms
3ms
9ms
9ms6ms
Figure S3: Mean maximum likelihood estimation fits for all cells. Related to Figure 5. WhileFigure 5C shows mean autocorrelogram fits of just spatially modulated cells, here we show mean fits from alltheta rhythmic cells. Note that theta frequency is slightly slower in PAE cells. Dashes and numbers aboveeach peak represent the time (ms) difference between the two groups at each theta peak.

-6
-3
0
3
6
0 10 20 30 40
Control CA1 linear track
-6
-3
0
3
6
0 10 20 30 40
PAE CA1 linear track
-6
-3
0
3
6
0 10 20 30 40
Control CA3 linear track
-6
-3
0
3
6
0 10 20 30 40
PAE CA3 linear track
-6
-3
0
3
6
0 10 20 30 40
Control CA1 cylinder
-6
-3
0
3
6
0 10 20 30 40
PAE CA1 cylinder
-6
-3
0
3
6
0 10 20 30 40
Control CA3 cylinder
-6
-3
0
3
6
0 10 20 30 40
PAE CA3 cylinder
Difference in running speed (fast-slow running, cm/sec)
Diff
eren
ce in
thet
a fr
eque
ncy
(fas
t-sl
ow r
unn
ing,
Hz)
R2 = 0.07
R2 = 0.02
R2 = 1.86e-3
R2 = 7.24e-4
R2 = 0.04
R2 = 0.01
R2 = 0.11
R2 = 7.76e-3
Figure S4: Association between intrinsic theta frequency and running speed. Related toFigure 6. Scatter plots show the relationship between the change in theta frequency (Hz) as a function ofthe magnitude difference between mean fast and slow running speed (cm/s). R-squared (R2) for individualregression analyses are included in each subplot. Note that the change in running speed is a poor predictorof the change in frequency across all groups/conditions (R-squared values are ≤ 0.11). Values that fall alongthe red dashed line indicate no change in theta frequency. Line of best fit and corresponding confidencebounds for each regression are plotted in blue.
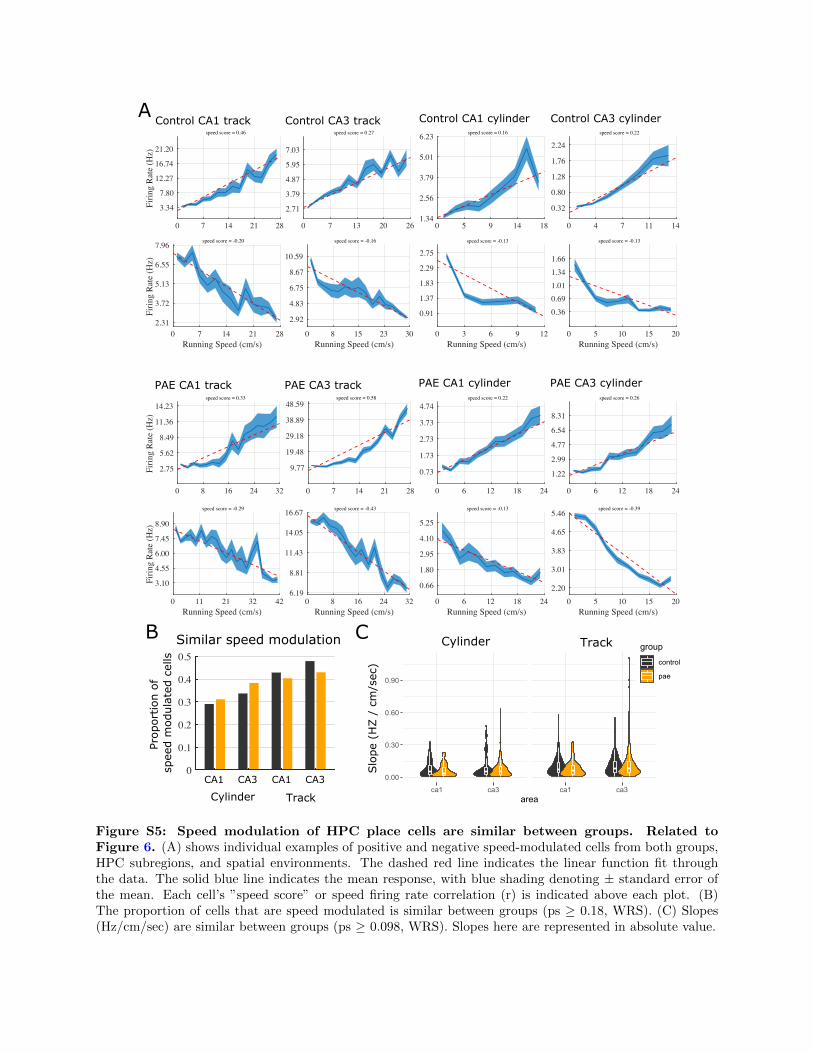
0 7 14 21 28
3.34
7.80
12.27
16.74
21.20F
irin
g R
ate
(Hz)
speed score = 0.46
Control CA1 track
0 7 13 20 26
2.71
3.79
4.87
5.95
7.03
speed score = 0.27
Control CA3 track
0 7 14 21 28
Running Speed (cm/s)
2.31
3.72
5.13
6.55
7.96
Fir
ing
Rat
e (H
z)
speed score = -0.20
0 8 15 23 30
Running Speed (cm/s)
2.92
4.83
6.75
8.67
10.59
speed score = -0.16
0 5 9 14 181.34
2.56
3.79
5.01
6.23speed score = 0.16
Control CA1 cylinder Control CA3 cylinder
0 3 6 9 12
Running Speed (cm/s)
0.91
1.37
1.83
2.29
2.75
speed score = -0.13
0 4 7 11 14
0.32
0.80
1.28
1.76
2.24
speed score = 0.22
0 5 10 15 20
Running Speed (cm/s)
0.36
0.69
1.01
1.34
1.66
speed score = -0.13
PAE CA1 track PAE CA3 track PAE CA1 cylinder PAE CA3 cylinder
0 8 16 24 32
2.75
5.62
8.49
11.36
14.23
Fir
ing
Rat
e (H
z)
speed score = 0.33
0 11 21 32 42
Running Speed (cm/s)
3.10
4.55
6.00
7.45
8.90
Fir
ing
Rat
e (H
z)
speed score = -0.29
0 8 16 24 32
Running Speed (cm/s)
6.19
8.81
11.43
14.05
16.67speed score = -0.43
0 7 14 21 28
9.77
19.48
29.18
38.89
48.59speed score = 0.58
0 6 12 18 24
0.73
1.73
2.73
3.73
4.74speed score = 0.22
0 6 12 18 24
Running Speed (cm/s)
0.66
1.80
2.95
4.10
5.25
speed score = -0.13
0 5 10 15 20
Running Speed (cm/s)
2.20
3.01
3.83
4.65
5.46speed score = -0.39
0 6 12 18 24
1.22
2.99
4.77
6.54
8.31
speed score = 0.26
A
0
0.1
0.2
0.3
0.4
0.5
Cylinder Track
Similar speed modulation
Prop
ortion
of
spee
d m
odula
ted c
ells
CA1 CA1 CA3CA3ca1 ca3 ca1 ca3
0.00
0.30
0.60
0.90
area
group
control
pae
Cylinder TrackB C
Slo
pe
(HZ /
cm
/sec
)
Figure S5: Speed modulation of HPC place cells are similar between groups. Related toFigure 6. (A) shows individual examples of positive and negative speed-modulated cells from both groups,HPC subregions, and spatial environments. The dashed red line indicates the linear function fit throughthe data. The solid blue line indicates the mean response, with blue shading denoting ± standard error ofthe mean. Each cell’s ”speed score” or speed firing rate correlation (r) is indicated above each plot. (B)The proportion of cells that are speed modulated is similar between groups (ps ≥ 0.18, WRS). (C) Slopes(Hz/cm/sec) are similar between groups (ps ≥ 0.098, WRS). Slopes here are represented in absolute value.
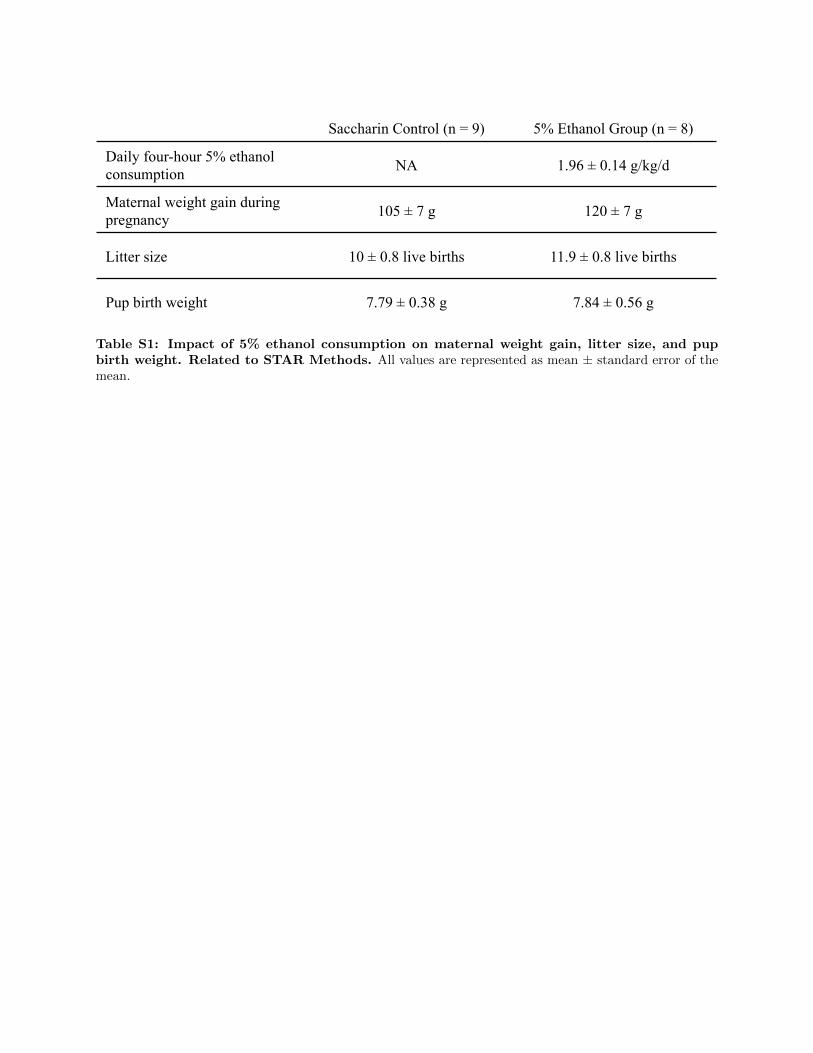
Saccharin Control (n = 9) 5% Ethanol Group (n = 8)
Daily four-hour 5% ethanol consumption NA 1.96 ± 0.14 g/kg/d
Maternal weight gain during pregnancy 105 ± 7 g 120 ± 7 g
Litter size 10 ± 0.8 live births 11.9 ± 0.8 live births
Pup birth weight 7.79 ± 0.38 g 7.84 ± 0.56 g
Table S1: Impact of 5% ethanol consumption on maternal weight gain, litter size, and pupbirth weight. Related to STAR Methods. All values are represented as mean ± standard error of themean.

Dependent Variable n Parameter estimate Test Test statistic P-value Effect
measure Effect
size Number of laps C: 64, P: 111 C: 41, P: 40 Wilcoxon rank sum test 4182 0.05036 r 0.147
Linear track velocity C: 64, P: 111 C: 9.35, P: 9.64 Wilcoxon rank sum test 3292 0.4214 r 0.060 Cylinder velocity C: 57, P: 100 C: 8.35, P: 8.16 Wilcoxon rank sum test 3041 0.4868 r 0.055
Spatial Information Content linear track CA1 C: 220, P: 421 C: 0.51, P: 0.51 Wilcoxon rank sum test 48178 0.4015 r 0.033 Spatial Information Content linear track CA3 C: 215, P: 1049 C: 0.64, P: 0.40 Wilcoxon rank sum test 147395 1.234e-12 r 0.199
Spatial Information Content cylinder CA1 C: 162, P: 306 C: 0.72, P: 0.72 Wilcoxon rank sum test 24899 0.9356 r 0.003 Spatial Information Content cylinder CA3 C: 247, P: 839 C: 1.29, P: 0.61 Wilcoxon rank sum test 145298 <2.2e-16 r 0.291
Sparsity linear track CA1 C: 220, P: 421 C: 0.54, P: 0.55 Wilcoxon rank sum test 45640 0.7636 r 0.011 Sparsity linear track CA3 C: 215, P: 1049 C: 0.47, P: 0.60 Wilcoxon rank sum test 79562 9.765e-12 r 0.191
Sparsity cylinder CA1 C: 162, P: 306 C: 0.31, P: 0.33 Wilcoxon rank sum test 24907 0.931 r 0.004 Sparsity cylinder CA3 C: 247, P: 839 C: 0.20, P: 0.35 Wilcoxon rank sum test 64267 <2.2e-16 r 0.275
Peak firing rate linear track CA1 C: 220, P: 421 C: 7.62, P: 6.19 Wilcoxon rank sum test 51947 0.01134 r 0.100 Peak firing rate linear track CA3 C: 215, P: 1049 C: 11.38, P: 8.17 Wilcoxon rank sum test 137478 4.026e-07 r 0.142
Peak firing rate cylinder CA1 C: 162, P: 306 C: 6.83, P: 5.48 Wilcoxon rank sum test 28043 0.01931 r 0.108 Peak firing rate cylinder CA3 C: 247, P: 839 C: 9.44, P: 7.39 Wilcoxon rank sum test 120978 6.149e-05 r 0.121
Coherence linear track CA1 C: 220, P: 421 C: 2.51, P: 2.42 Wilcoxon rank sum test 50907 0.03893 r 0.081 Coherence linear track CA3 C: 215, P: 1049 C: 2.70, P: 2.42 Wilcoxon rank sum test 145828 1.2e-11 r 0.190
Coherence cylinder CA1 C: 162, P: 306 C: 2.19, P: 2.02 Wilcoxon rank sum test 29192 0.001551 r 0.146 Coherence cylinder CA3 C: 247, P: 839 C: 2.24, P: 2.07 Wilcoxon rank sum test 126441 1.38e-07 r 0.159
Stability linear track CA1 C: 220, P: 421 C: 0.79, P: 0.69 Wilcoxon rank sum test 56229 8.362e-06 r 0.175 Stability linear track CA3 C: 215, P: 1049 C: 0.83, P: 0.77 Wilcoxon rank sum test 132852 3.806e-05 r 0.115
Stability cylinder CA1 C: 162, P: 306 C: 0.43, P: 0.24 Wilcoxon rank sum test 30629 2.699e-05 r 0.194 Stability cylinder CA3 C: 247, P: 839 C: 0.52, P: 0.36 Wilcoxon rank sum test 129414 2.615e-09 r 0.180
Spatial correlation linear track CA1 C: 220, P: 421 C: 0.16, P: 0.35 Wilcoxon rank sum test 20555 0.0001676 r 0.171 Spatial correlation linear track CA3 C: 215, P: 1049 C: 0.21, P: 0.19 Wilcoxon rank sum test 67057 0.8464 r 0.006
Directionality index linear track CA1 C: 220, P: 421 C: 0.30, P: 0.24 Wilcoxon rank sum test 28819 0.06507 r 0.084 Directionality index linear track CA3 C: 215, P: 1049 C: 0.32, P: 0.19 Wilcoxon rank sum test 81396 1.495e-05 r 0.138 Mean angle of Rotation cylinder CA1 C: 96, P: 148 C: 44.80, P: 82.84 Watson Williams 6.466 0.0117 na na Mean angle of rotation cylinder CA3 C: 108, P: 398 C: 246.40, P: 73.20 Watson Williams 82.087 <2.2e-16 na na
Distribution of angles CA3 control 108 na Rayleigh test of nonuniformity 24.380 9.4667e-12 na na Distribution of angles CA1 PAE 148 na Rayleigh test of nonuniformity 3.012 0.0488 na na
Distribution of angles CA3 PAE 398 na Rayleigh test of nonuniformity 31.677 9.4583e-15 na na Distribution of angles around 90 CA1 control 96 na V test of nonuniformity 11.719 0.0230 na na Distribution of angles around 90 CA3 control 108 na V test of nonuniformity 59.602 2.1244e-12 na na
Distribution of angles around 90 CA1 PAE 148 na V test of nonuniformity -16.531 0.9878 na na Distribution of angles around 90 CA3 PAE 398 na V test of nonuniformity 107.529 1.2434e-14 na na
Normalized delta firing rate CA1 C: 96, P: 148 C: 0.27, P: 0.18 Wilcoxon rank sum test 29859 1.939e-05 r 0.199 Normalized delta firing rate CA3 C: 108, P: 398 C: 0.43, P: 0.18 Wilcoxon rank sum test 142264 <2.2e-16 r 0.275
Delta spatial information content CA1 C: 96, P: 148 C: 0.08, P: 0.04 Wilcoxon rank sum test 7512 0.2792 r 0.068 Delta spatial information content CA3 C: 108, P: 398 C: -0.07, P: 0.02 Wilcoxon rank sum test 26962 0.003245 r 0.120
Delta sparsity CA1 C: 96, P: 148 C: -0.02, P: -0.00 Wilcoxon rank sum test 6532 0.4595 r 0.046 Delta sparsity CA3 C: 108, P: 398 C: 0.02, P: -0.00 Wilcoxon rank sum test 36150 0.02879 r 0.089
Proportion of sig. theta cylinder ca1 C: 162, P: 306 C: 0.89, P: 0.74 Chi-squared 13.928 1.8988e-04 V 0.020 Proportion of sig. theta cylinder ca3 C: 247, P: 839 C: 0.95, P: 0.84 Chi-squared 32.012 1.5319e-08 V 0.018
Proportion of sig. theta linear track ca1 C: 220, P: 421 C: 0.84, P: 0.85 Chi-squared 0.8192 0.3654 V 0.001 Proportion of sig. theta linear track ca3 C: 215, P: 1049 C: 0.94, P: 0.85 Chi-squared 15.554 8.0171e-05 V 0.009
Theta frequency cylinder ca1 C: 162, P: 306 C: 8.42, P: 7.81 Wilcoxon rank sum test 14755 7.215e-10 r 0.360 Theta frequency cylinder ca3 C: 247, P: 839 C: 8.47, P: 8.12 Wilcoxon rank sum test 75874 4.921e-10 r 0.226
Theta frequency linear track ca1 C: 220, P: 421 C: 8.44, P: 7.65 Wilcoxon rank sum test 21929 5.534e-13 r 0.378 Theta frequency linear track ca3 C: 215, P: 1049 C: 8.41, P: 7.99 Wilcoxon rank sum test 51565 1.983e-05 r 0.158
Frequency difference cylinder ca1 C: 89, P: 117 C: 0.80, P: 0.51 Wilcoxon rank sum test 6382 0.005565 r 0.193 Frequency difference cylinder ca3 C: 179, P: 408 C: 0.78, P: 0.64 Wilcoxon rank sum test 42457 0.001688 r 0.129
Frequency difference linear track ca1 C: 106, P: 173 C: 1.02, P: 0.29 Wilcoxon rank sum test 12510 3.277e-07 r 0.305 Frequency difference linear track ca3 C: 115, P: 345 C: 1.19, P: 0.69 Wilcoxon rank sum test 24804 5.76e-05 r 0.187
Proportion speed modulated frequency cylinder ca1 C: 125, P: 170 C: 0.47 ,P: 0.34 Chi-squared 5.151 0.0232 V 0.012 Proportion speed modulated frequency cylinder ca3 C: 219, P: 552 C: 0.52, P: 0.43 Chi-squared 5.251 0.0219 V 0.004
Proportion speed modulated frequency track ca1 C: 129, P: 243 C: 0.52, P: 0.35 Chi-squared 10.422 0.0012 V 0.019 Proportion speed modulated frequency track ca3 C: 145, P: 580 C: 0.43, P: 0.40 Chi-squared 0.462 0.4967 V 4.52e-04 Proportion of sig. phase precession cylinder ca1 C: 162, P: 306 C: 0.25, P: 0.17 Chi-squared 2.489 0.1146 V 0.072 Proportion of sig. phase precession cylinder ca3 C: 247, P: 839 C: 0.37, P: 0.27 Chi-squared 14.183 0.0001658 V 0.096
Proportion of sig. phase precession linear track ca1 C: 220, P: 421 C: 0.28, P: 0.21 Chi-squared 2.49 0.1146 V 0.06 Proportion of sig. phase precession linear track ca3 C: 215, P: 1049 C: 0.49, P: 0.37 Chi-squared 4.706 0.03005 V 0.06
Circular-linear correlation cylinder ca1 C: 162, P: 306 C: -0.01, P: -0.01 Wilcoxon rank sum test 25599 0.5594 r 0.026 Circular-linear correlation cylinder ca3 C: 247, P: 839 C: -0.04, P: -0.02 Wilcoxon rank sum test 95289 0.05462 r 0.058
Circular-linear correlation linear track ca1 C: 220, P: 421 C: 0.01, P: 0.01 Wilcoxon rank sum test 46199 0.9604 r 0.001 Circular-linear correlation linear track ca3 C: 215, P: 1049 C: 0.01, P: 0.00 Wilcoxon rank sum test 116127 0.4909 r 0.019
Table S2: Table showing each statistical test conducted from the main texts. Related to STARMethods. n = sample sizes, c = control, p = PAE