Identification of altered regulatory interactions in disease
107
TESI DOCTORAL UPF / 2015 Identification of altered regulatory interactions in disease Marta Bleda Latorre Department of Experimental and Health Sciences Department of Computational Genomics, Principe Felipe Research Centre (CIPF), Valencia THESIS SUPERVISOR Dr. Joaquín Dopazo Blázquez Department of Computational Genomics, Principe Felipe Research Centre (CIPF), Valencia
-
Upload
khangminh22 -
Category
Documents
-
view
1 -
download
0
Transcript of Identification of altered regulatory interactions in disease

TESI DOCTORAL UPF / 2015
Identification of altered regulatory interactions in disease
Marta Bleda Latorre
Department of Experimental and Health Sciences
Department of Computational Genomics, Principe Felipe Research Centre (CIPF), Valencia
THESIS SUPERVISOR
Dr. Joaquín Dopazo Blázquez
Department of Computational Genomics, Principe Felipe Research Centre (CIPF), Valencia


iii
Als meus pares. A la iaia i al iaiu.
A Nacho.


v
“If you torture the data long enough, it will confess.”
Ronald H. Coase


vii
Acknowledgments
Aquesta tesi representa un moment important a la historia de la meva vida, un període de temps en el que he crescut tant personal com professionalment. I això és possible perquè, d’una manera o d’una altra, hi ha hagut gent al meu voltant que ha capgirat la meva vida i m’han ajudat a ser qui sóc avui. A totes aquestes persones que han estat, que hi són i que hi seran m’agradaria donar-los les gràcies.
En primer lloc, vull donar les gràcies als meus pares, l’Andreu i la Dolors. No puc imaginar-me la vida amb uns pares millors. Gràcies per ensenyar-me el món com ho heu fet i educar-me en l’esforç i la constància. Per deixar que m’equivoqui una i altra vegada i tenir sempre una mà preparada per ajudar-me a aixecar. Per acceptar i recolzar-me en totes les decisions que he pres i fer possibles molts dels meus somnis. Per ser el meu referent. Per la vostra paciència i insistència infinites, la confiança i l’amor. Us estimo.
A la iaia i al iaiu, que m’han pujat des de petita i que tant de carinyu m’han transmès. Sempre recordaré els passejos amb la motillo del iaiu quan jo no tenia ni deu anys i el seu riure, sempre feliç i fent cançons de la primera paraula que sentia. I a la iaia remugant i amb la seva sabatilla implacable però sempre cuinant els millors menjars.
Durant la meva infància i adolescència hi va haver tres persones a les que mai oblidaré. Crec que vaig tenir molta sort al coneixe’ls. Aquestes persones es van convertir en els meus millors amics i, afortunadament, encara avui segueixen sent-ho. M’agradaria recordar-los per ordre d’aparició a la meva vida.

viii
A Raúl no recuerdo cómo le conocí, desde que soy consciente, él siempre ha estado ahí. Me gusta pensar en lo fáciles que eran las cosas cuando éramos pequeños y salíamos corriendo del colegio a mediodía para ir a su casa a jugar a las tortugas ninja, o cuando jugábamos al bote-bote torturando a tu hermana Silvia para que le tocara a ella siempre.
La Maitane va aparèixer a la meva vida gràcies a l’esplai. Amb ella he viscut experiències memorables que van des del més cursi al més divertit. Per mi, ella sempre ha estat un model de constància, fidelitat i sinceritat, i me n’alegro d’haver conegut a una persona tan meravellosa com ella. Tot i que les circumstàncies van fer que perdéssim el contacte durant una temporada, els nostres camins es van tornar a trobar i espero i desitjo que, malgrat la distància, no es tornin a separar mai més.
A Irene y a mi siempre nos preguntan si somos hermanas por lo parecidas que somos. Me parece gracioso que mi doble se haya convertido en mi mejor amiga. Con ella he vivido las aventuras más divertidas y las más salvajes. Ella apareció en bachillerato y me dio la oportunidad de tener algo que nunca hubiera imaginado por aquel entonces, un grupo de amigos. Desde aquel momento, hemos pasado juntas grandes acontecimientos que van desde los conciertos de Obrint Pas con el profe de filosofía a las interminables semanas de estudio en la universidad. Todos y cada uno de esos momentos fueron geniales a su lado.
Quan vaig entregar la sol·licitud al màster de bioinformàtica de la UPF no esperava que m’acceptessin. Recordo que em donava certa pena el fet d’abandonar el laboratori i la bata però, vist des de lluny, aquesta va ser una de les millor decisions que he pres. Durant aquell any vaig conèixer a gent meravellosa i intel·ligent amb els que vaig compartir moments molt divertits entre laptops i birres. Al Javi, al Xavi, la Marta, al Ramon, al Jose, al Gabriel i a la Leo vull donar-los les gràcies per un any divertidíssim. Espero que ens tonem a trobar aviat.

ix
Y, de repente, llegó Valencia, y en cuestión de un mes me había ido de casa. Por suerte allí me esperaba otra familia dividida en dos laboratorios: el biolabo y el frikilabo. Gracias a todos por los grandes momentos y por vuestro cariño. Me gustaría hacer una mención especial al pasillo de las chicas, a Luz, Patricia, Alicia, Rosa, Patri y Eva, gracias por el tiempo que hemos compartido tanto en los momentos más divertido como en los más estresantes, los consejos y los cotilleos. También agradecer la inestimable ayuda y los ratos divertidos que hemos pasado con otros miembros del departamento: Cristina, Paco, Pakolo, Josete, Roberto, Pablo, David, Joaquín, Javier, Marc y Ana.
I would like to thank Stefan for his confidence in me and for giving me all the necessary time and support to finish this thesis. He is a great person and an excellent scientist and I am really proud of being part of his team. Thanks to Matthias for being an exceptional colleague, it is a truly pleasure to work with you. Thanks also to Nick, Charaka, Jennifer, Carmen, Katherine, Mark, Joanna, Mike and the Department of Haematology for their support and encouragement.
Gracias a Nacho, una de las personas más importantes para mi. Desde aquella primera cerveza en la Malvarrosa supe que nos íbamos a llevar bien. Nunca había conocido a nadie con quien pudiera compartir tantas cosas, por eso todo siempre fue y ha sido tan fácil contigo, porqué me conoces más que yo misma. Y después de cinco años maravillosos no me canso ni un día de despertarme a tu lado. Me siento muy afortunada de tener a mi lado a una persona como tú, con un corazón enorme, atento e infinitamente inteligente. En breve empezaremos una nueva etapa en nuestro camino, una mucho más fascinante y enriquecedora, si cabe, y no me imagino a una persona más perfecta para recorrer ese camino junto a mi. Nunca podría agradecerte suficientemente lo mucho que haces por mi, ni todo lo que he crecido y aprendido a tu lado. Aún así, gracias. Te quiero.

x
Por último, me gustaría agradecer a Ximo todo el tiempo y el esfuerzo que ha invertido en mi. Gracias por darme la oportunidad de estar en tu equipo y abrirme las puertas del mundo de la investigación. Sin ti, hubiera sido muy complicado. Gracias por la confianza que siempre has tenido en mi, por la libertad que siempre me has dado para desarrollar mis ideas y por permitirme participar en multitud de ambiciosos proyectos. Has sido un jefe maravilloso y me siento orgullosa de haber estado al lado de unos de los mejores científicos que conozco. Gracias Ximo.

xi
Abstract Gene regulation is a complex biological process that requires the coordinated interaction of different molecules. The integrity of the underlying mechanisms ensures the correct expression of genes that maintain cell differentiation and stability in a healthy cell. Alterations in the regulatory elements involved can disrupt the process and unbalance gene products causing diseases such as cancer, cardiovascular problems or autoimmune disorders. Although high-throughput sequencing technologies have allowed a better understanding of the gene regulatory mechanisms, there is still much uncertainty about its role in diseases. In this thesis, I present the contributions I have made to the analysis of genomic information for the identification of altered regulatory elements in disease. I start describing a solution for the fast and easy extraction of biological data including regulatory information. Then, I propose two different approaches for the analysis and prioritization of regulatory elements involved in diseases and, finally, I discuss the most relevant implications of this work and how it has evolved since their publication.


xiii
Resum La regulació gènica és un procés biològic complex que requereix de la interacció coordinada de diferents molècules. La integritat dels mecanismes subjacents assegura la correcta expressió dels gens que mantenen la diferenciació cel·lular i l’estabilitat a una cèl·lula sana. Les alteracions als elements reguladors que hi intervenen poden pertorbar el procés i desequilibrar els productes gènics causant malalties com càncer, problemes cardiovasculars o trastorns autoimmunes. Encara que les tecnologies d’alt rendiment han permès un millor coneixement dels mecanismes de regulació gènica, encara hi ha incertesa sobre el seu paper a les malalties. En aquesta tesi, presento les contribucions que he fet a l’anàlisi de la informació genòmica per la identificació d’elements reguladors alterats en malalties. Començo descrivint una solució per a l’extracció ràpida y fàcil de dades biològiques incloent informació reguladora. A continuació, proposo dos mètodes diferents per l’anàlisi i la priorització d’elements reguladors implicats en malalties i, finalment, exposo les implicacions més rellevants d’aquest treball i l’evolució que han tingut des de la seva publicació.


xv
Preface The central dogma of biology taught us that that genes are encoded in DNA, that DNA is transcribed into messenger RNA, and that messenger RNA is finally translated into protein to carry out a biological function. Early research in molecular biology discovered the basic mechanisms that coordinate and regulate these molecules to maintain a healthy cell status. This knowledge has significantly grown over the past two decades revealing an unexpected complexity behind gene regulation. Epigenetics, transcriptional regulation, splicing, transport through the cell, translation or post-translational modifications are only some examples of the mechanisms that the cell can use to control the balance of genetic products.
All these processes are accurately coordinated to keep gene expression within tight margins of variability. The integrity of these mechanisms will ensure and maintain cell differentiation and stability in healthy cells, while deregulation of these processes may have pathogenic consequences in the system.
During the last ten years, high-throughput sequencing technologies have allowed the better characterization of these mechanisms, however, how deregulation in these processes may lead to disease is still not fully understood. This sequencing revolution has also boosted the analysis of many samples. The combination of genome wide data with previous knowledge in gene regulation is a promising way of identifying unregulated mechanisms and interpreting the functional consequences in a disease dataset.


xvii
Table of contents
Acknowledgments ..................................................................... vii Abstract ...................................................................................... xi Resum ...................................................................................... xiii Preface ...................................................................................... xv Chapter 1 -‐ INTRODUCTION ........................................................ 1 Control of gene regulation ........................................................................... 1 1.11.1.1 Transcriptional regulation by transcription factors ............................. 3 1.1.2 Post-‐transcriptional regulation by microRNAs ...................................... 6 1.1.3 Latest findings in gene regulation .............................................................. 10 1.1.4 Effects of the incorrect regulation and diseases ................................... 12 1.1.5 Biological networks .......................................................................................... 13 Bioinformatics in gene regulatory networks ..................................... 17 1.21.2.1 Genome-‐wide high throughput technologies applied to GRN ........ 17 1.2.2 Databases and resources ................................................................................ 23 1.2.3 Methodologies for the analysis of gene regulatory networks ........ 28
Chapter 2 -‐ OBJECTIVES .............................................................. 35 Chapter 3 -‐ RESULTS ................................................................... 39 3.1 CellBase, a comprehensive collection of RESTful web services for
retrieving relevant biological information from heterogeneous sources ........................................................................................................... 39
3.2 Inferring the regulatory network behind a gene expression experiment .................................................................................................... 47
3.3 Analysis of high-‐resolution regulatory interactions for variant and gene prioritization ............................................................................. 55
Chapter 4 -‐ DISCUSSION ............................................................. 71 Chapter 5 -‐ Conclusions ............................................................. 79 List of communications .............................................................. 81 Bibliography .............................................................................. 83


xix
Abbreviations
API Application Programming Interface
GRN Gene Regulatory Networks
miRNA microRNA
mRNA Messenger RNA
NGS Next-Generation Sequencing
PPI Protein-protein interaction
TF Transcription Factor
TFBS Transcription Factor Binding Site
TSS Transcription Start Site
WES Whole Exome Sequencing
WGS Whole Genome Sequencing
WS Web Services


Chapter 1
INTRODUCTION


1
Chapter 1
INTRODUCTION
Control of gene regulation 1.1
The genome encodes for thousands of genes whose products enable cell survival and numerous cellular functions. These genes are expressed differently in each cell type due to the action multiple factors, such as epigenetic factors and regulatory elements, that control gene expression and the generated products. This multifactorial control is crucial for the normal development and maintenance of healthy cells and tissues. Figure 1 summarizes some of the strategies used by the cell to control gene expression.
Figure 1. Steps in the eukaryotic control of gene expression. The eukaryotic cell can control gene products at different levels: controlling when and how much a gene is transcribed (1), determining the splicing and processing of messenger RNAs (mRNAs) (2) and selecting the ones that will be transported from the nucleus to the cytoplasm (3). Once in the cytoplasm, a translational control checks the integrity of the mRNA (4) and decides whether it should move forward in the translation to an active protein (6) or should be degraded (5). (c) 2015 from Molecular Biology of the Cell, Sixth Edition by Alberts et al. Reproduced by permission of Garland Science/Taylor & Francis LLC.

2
Histone modifications constitute the first level of epigenetic regulation. DNA is folded inside the nucleus creating a structure called chromatin. The state of chromatin can dynamically change from euchromatin, when DNA can be actively accessed and transcribed, to heterochromatin, where the DNA is more tightly packed impeding other molecules to bind. To create chromatin, DNA is wrapped around histone proteins forming small and compact structure, called nucleosome. The tails of these histone proteins remain exposed and can be modified by different covalent post-translational modifications that will dictate the transition between chromatin states (Jenuwein & Allis, 2001).
The next level of epigenetic regulation of gene expression is DNA methylation. It has been observed that DNA methylation tends to occur, almost exclusively, in the cytosines present in a particular genetic pattern (McGhee & Ginder, 1979). This pattern consists of a cytosine followed by a guanine (CpG) and it is relatively infrequent in our genome. CpG-rich regions, also known as CpG islands, can be found particularly in promoters and its methylation state has been associated to transcriptional activity (Cedar, 1988).
Transcriptional initiation is considered one of the most important mechanisms of regulation. In this step, DNA-encoded information is transformed into messenger RNA (mRNA) after the recruitment of the necessary machinery. This stage is regulated by transcription factors (TFs) (Lewin et al., 2008), proteins that are able to modulate gene transcription by binding to cis-regulatory elements of genes, termed transcription factor binding sites (TFBSs) (Elnitski et al., 2006). The generated mRNAs are capped, polyadenilated and their introns are removed. Once processed, the mRNA leaves the nucleus and, if it is considered to be stable, translation will be initiated, otherwise it will be sent to degradation. Ribosomes are the molecular units in charge of translation. They must recognise and initiate translation from the correct methionine codon, as failing to do so may generate unstable proteins.

3
At post-transcriptional level, a large and growing class of gene regulators have been characterized during the last years, called microRNAs (miRNAs). miRNAs are short non-coding RNAs that negatively regulate gene expression after transcription by either destabilizing mature mRNAs or reducing the efficiency of translation.
Although many efforts have been concentrated on the study of gene regulation during the last decades, its details still remain poorly understood. A better understanding of gene regulation may solve some key fundamental questions in biology and shed light on the mechanisms that occur in diseases when these processes are deregulated. This thesis is focused on the study of TFs and miRNAs regulation and how these elements can be involved in disease.
1.1.1 Transcriptional regulation by transcription factors
In eukaryotes transcription requires from specific molecules to be activated. These molecules are, commonly, TFs that act at DNA level by binding to the promoter region of the target genes. TFs can recognize specific sequences in the promoter region of a gene using their DNA-binding domain. This positioning causes the attraction of RNA polymerase II at the promoter, which recognises a particular motif called TATA box. This interaction will only happen if the chromatin is accessible, however, the promoter region is likely to be packed in nucleosomes, making the TF and the RNA polymerase incapable of accessing the DNA. In this moment, a series of chromatin remodelling changes are triggered in the promoter moving nucleosomes and making chromatin accessible (Li et al., 2007). The bond TF may interact with other proteins (termed cofactors) that act as co-activators or co-repressors and will, ultimately, determine if transcription is going to be initiated or repressed (Latchman, 2001). Additionally, TFs may bind to enhancers located in distal regions of the genome by bringing upstream regions of the DNA closer.

4
Figure 2. Transcription initiation. Transcription factors promote the remodelling of the chromatin to make it accessible. The TF can bind to either proximal or distal TFBSs, causing the recruitment of the RNA polymerase and other necessary cofactors that will modulate the final outcome of transcription. Adapted from Wasserman & Sandelin, 2004.
In 2009, Vaquerizas and his colleagues carried out a census of the human transcription factors and were able to identify 1,391 sequence-specific DNA-binding TFs (Vaquerizas et al., 2009). Nearly four years later, another survey was made in order to classify experimentally validated TFs suggesting a slightly bigger number, 1,558 (Wingender et al., 2012). Although these numbers keep being updated, very little is still known about the specific biological processes these TFs are involved in. Vaquerizas work showed that there is a substantial amount of publications citing TFs, however, these studies seem to be focused on the study of cancer, what biases the characterization of the normal processes that TFs mediate.

5
The same study also confirmed what was already observed previously in yeast (Ghaemmaghami et al., 2003), that the expression levels of TFs are significantly lower than the expression of other genes. Biologically, this can be explained by the fact that a single TF molecule can promote the transcription of multiple copies of the same target gene. Moreover, keeping expression low increments the specificity of the TF to find the highest affinity binding sites, reducing the interactions with non-functional sites. Moreover, TFs seem to have an uneven distribution across different tissues that correlate with the complexity of the cell type. Some TFs tend to be expressed in all or almost all tissues, being also involved in a broader number of processes, while other TFs have a more specific expression restricted to a single or few tissues with similar cellular composition.
One of the most interesting aspects of TFs is their combinatorial effect. The final transcriptional output of a gene is determined not only by a TF in isolation but by the coordinated action of different TFs. In fact, it is estimated that 75% of TFs heterodimerize with other TFs (Walhout, 2006). It is thought that this combinatorial activity may be related with a more accurate and flexible regulation in different tissues. Ravasi and colleagues began to approach this problem by observing how different combinations of TFs can determine specific expression in a tissue (Ravasi et al., 2010). They concluded that the identity of a tissue could be determined by the set of interactions that happen between TFs.
The whole set of TFs is grouped into families according to their DNA-binding domain. Examples of motifs inside binding domains are zinc fingers, steroid receptors, Helix-Turn-Helix, Helix-Loop- Helix and leucine zippers. Although DNA-binding domains are highly conserved regions, the small changes observed on them through evolution are considered one of the driving forces that shaped eukaryotic evolution (de Mendoza et al., 2013). The three-dimensional structure generated by the sequence of amino acids in the DNA-binding domain is the one in charge of the recognition of

6
TFBSs. The length of the average TFBS is between 5-15 base pairs (bp) and they are generally located proximal to the transcription start site (TSS). It was previously suggested that these domains were able to bind to different sequences in the DNA (Badis et al., 2009) and this is still a matter of discussion (Morris et al., 2011; Zhao & Stormo, 2011). A more recent study concluded that TFs can bind to DNA in many different ways and this is due to their ability to bind using monomeric and dimeric configurations (Jolma et al., 2013).
Many publications in the last years have been focused on the identification and characterization of TFBSs. To do so, researchers have combined experimental techniques, such as chromatin immunoprecipitation combined with microarray technology or DNA sequencing (ChIP-chip or ChIP-Seq, respectively), with computational methods to find the sequence of nucleotides that determines the binding site. The search of TFBSs at a genome-wide level has been highly benefitted by computational approaches. Databases such as JASPAR (Mathelier et al., 2014) or TRANSFAC (Matys et al., 2006) create sequence patterns from experimentally characterized binding sites and present collections of DNA-binding preferences modelled as matrices. The probability of each of the four nucleotides inside the motif sequence is represented by position weight matrices, which are used for scanning genomic sequences with computational algorithms and record all putative genomic positions that can be a binding site for a TF.
1.1.2 Post-‐transcriptional regulation by microRNAs
miRNAs are functional short non-coding single-stranded RNA molecules with an average length of 22 nucleotides. They represent around 4% of the genes in human with 1,881 different sequences according to miRBase (Kozomara & Griffiths-Jones, 2014). miRNAs act as post-transcriptional negative regulators of the expression of their target mRNAs by binding to complementary or partial-complementary regions of the sequence of these targets.

7
miRNAs have a peculiar biogenesis (Figure 3) that has been extensively described (Filipowicz et al., 2008; He & Hannon, 2004; Kim, 2005). The product of the transcription of a miRNA gene, called pri-miRNA, folds on itself to form a hairpin structure. Inside the nucleus, Drosha endonuclease cleaves the pri-miRNA to create the pre-miRNA that is about 70 nucleotides long. Once exported to the cytoplasm pre-miRNA is cleaved once again by a helicase enzyme, named Dicer. The result is a transient double-stranded RNA duplex. Through the association with Argonaute proteins, one of the strands of the duplex is coupled into the RNA-induced silencing complex (RISC). The miRNA directs RISC to its target mRNA which is identified by sequence complementarity. Depending on the complementarity between the miRNA and the target, regulation over transcripts can be carried out in two different ways. miRNAs that bind with perfect (or near) complementarity to the seed region, located 6-8 nucleotides at the 5’ end of the miRNA, induce target-mRNA cleavage. Otherwise, if complementarity is not perfect, the miRNA will tend to bind the 3’-untranslated region (3’UTR) of their target gene and, then, block the expression of the target gene at the level of protein translation by preventing 60S ribosome subunit to join.
Although some studies have reported that miRNA genes are transcribed by RNA polymerase III (Borchert et al., 2006), the general rule says that they are transcribed by RNA polymerase II (Cai, Hagedorn, & Cullen, 2004; Y. Lee et al., 2004). Interestingly, only 50% of the miRNA genes can be found in intergenic regions and derive from independent transcriptional units (Saini et al., 2007). The majority of the other half is located in introns of protein-coding genes and a small fraction is inside exons (Rodriguez et al., 2004). It has been shown that the expression of these intronic miRNAs correlate with the expression of their host genes, suggesting not only a coordinated transcription of both elements (Baskerville & Bartel, 2005) but also a common functionality.

8
Figure 3. miRNA biogenesis. Adapted from Filipowicz et al., 2008.

9
Early efforts to clone miRNAs found that only one of the strands of the double stranded miRNA (ds-miRNA) was functional while the other was simply inert. However, some years later deep sequencing showed that this “inert” strand, despite being less abundant in the cell, was still accumulated and associated with Argonaute proteins with a considerable impact in mRNA regulation (Okamura et al., 2008). It is yet unknown the mechanism that determines which arm of the ds-miRNA is going to be used by the cell but it is believed that this switch is probably related with the thermodynamic stability of the ds-miRNA (Khvorova et al., 2003).
From an evolutionary standpoint, miRNAs, like TFs, are very well conserved. Some of the most striking examples are miRNA let-7, which has been conserved in almost all bilaterally symmetrical animals (Pasquinelli et al., 2000); miR-1, a muscle specific miRNA conserved in nematodes, flies and mammals (Sokol & Ambros, 2005); and miR-7, conserved in flies and mammals and located in the same intron of the same host gene (Chen & Rajewsky, 2007). This high degree of sequence conservation led to the assumption that expression was also preserved across species, however, more recent studies showed that the expression of the same miRNA can vary in different species depending on timing and location (Ason et al., 2006).
The evolution of miRNAs is closely related with the evolution of miRNA targets and, more specifically, with the 3’UTR sequences. Surprisingly, only 10% of the target regions are conserved across species and it has been observed that conserved and non-conserved target sites have different expression patterns. Genes with non-conserved target sites are expressed in tissues where the interacting miRNA is not, while genes carrying conserved target regions are co-expressed with the regulatory miRNA (Niwa & Slack, 2007), what suggests that non-conserved binding sites may not have an important role. This relationship between miRNAs, targets and its coordinated expression is considered to be a central mechanism for

10
the development and the maintenance of tissue specificity (Bartel, 2009).
The function of a miRNA is also determined by the function of the genes that it regulates. Since a single miRNA can regulate many different targets the functions associated will be broad and varied. This phenomenon affects researchers when trying to define the function of a particular miRNA. Performing a knockout of the regulator will highlight many changes making impossible to distinguish direct from indirect effects. The correct approach is to block the interaction. This can be achieved using antisense RNAs that hybridize with the target 3’UTR preventing the original miRNA from binding. Another used technique is creating mutated target regions that interfere with the complementary of the regulator (Bartel, 2009).
Since the discovery of miRNAs and the increasing evidence that miRNA play critical roles in multiple biological processes (Ambros, 2004; Bartel, 2004; Bushati & Cohen, 2007), databases related with miRNAs and computational algorithms for the prediction of their targets have been rapidly developed. Experimental target predictions through classical genetic techniques are tedious and slow and, inevitably, many computational techniques to determine miRNA targets have been developed. These computational approaches generally rely, first, on the identification of potential target regions that exhibit a high level of complementarity and, then, an exhaustive filtering based, mainly, on conservation and RNA structure stability. Some of the most popular algorithms for target prediction are miRanda (John et al., 2004), TargetScan (Lewis et al., 2005), Rna22 (Miranda et al., 2006), PicTar (Krek et al., 2005) and PITA (Kertesz et al., 2007).
1.1.3 Latest findings in gene regulation
Next-generation sequencing (NGS) technologies have had an unquestionable repercussion on the study of gene regulatory

11
mechanisms. This technological improvement did not only revolution the way in which we conduct experiments in molecular biology but also dropped the sequencing costs per genome from $100 millions, in 2001, to nearly $1,000 nowadays. This fall in sequencing prices allowed researchers to include many more samples in their studies what increased the reliability of the results. At that moment many large scale projects were also launched such as the 1,000 Genomes Project (The 1000 Genomes Project Consortium, 2012), the Encyclopedia of DNA Elements (ENCODE) Project (ENCODE Project Consortium, 2012), the Cancer Genome Atlas (Weinstein et al., 2013) or the Roadmap Epigenomics (Bernstein et al., 2010), which generated an unprecedented amount of genomic data at population level.
With all this information, novel hypothesis and biological questions have been formulated oriented to better understand molecular processes and how defects in gene regulation can lead to disease. One of the first questions addressed was how well TF binding to promoter region could predict gene expression. Ouyang and colleagues demonstrated using ChIP-Seq and RNA-Seq data that the binding of sequence-specific TFs can successfully predict the absolute transcript abundance of the targeted gene and that some TFs have dual effect: can activate and also repress different sets of genes (Ouyang et al., 2009). They also confirmed the cooperative behaviour of TFs supported by the fact that different binding sites for different TFs can be found in the same promoter.
The publications of the findings by the ENCODE Consortium in 2012 gave a boost to the research in gene regulation with the characterization of coding and non-coding regions, TF binding, DNA methylation and chromatin accessibility in 82 human cell lines and tissues (Qu & Fang, 2013). 119 TFs were deeply studied in some of these publications leading to the identification of their TFBSs from ChIP-Seq data. In one of the studies, a functional test was applied to assess the amount of TFBSs that had a real impact in promoter activity (Whitfield et al., 2012). They found that 70% of

12
the 455 putative TFBSs analysed had a verified functional activity in, at least, one of the four cell types used. They also concluded that functional TFBSs tended to be more conserved and closer to the TSS than TFBSs with unverified functionality.
Wang and colleagues studied the cooperativity of TFs in a particular binding site (J. Wang et al., 2012). Two scenarios were considered, first, two TFs that bind to neighbouring regions (also known as co-binding) and, second, two TFs that interact with each other but only one binds to DNA (called tethered binding). Experiments showed that both models were real and functional, however, tethered binding appeared to be slightly more frequent than co-binding.
Interestingly, the architecture of the human regulatory network from a topological point of view was also studied using ENCODE data (Gerstein et al., 2012). In this work, researchers added a new layer of information to the transcriptional regulatory network by including the interactions between TFs and miRNAs and also physical protein-protein interactions (PPIs). This topological study highlighted the different patterns of co-association between TFs when they act in gene-proximal or distal regions. Moreover, TFs with more interactions tend to regulate more miRNAs and be more regulated from them.
1.1.4 Effects of the incorrect regulation and diseases
As we have seen, gene regulation is a complex and not fully understood process but what is clear about it, is that is an extremely important mechanism to guarantee the correct expression of genes and, consequently, the integrity of a healthy cell. It is then reasonable to think that any alteration in the processes that control gene expression could have a negative impact on the cell and, eventually lead to diseases such as cancer, cardiovascular problems, autoimmune or neurological disorders (T. I. Lee & Young, 2013).

13
Genetic mutations in regulatory elements and regions have been previously associated with these disorders as they can modify the expression of the genes. The genome instability caused by mutations in regulatory elements has been observed in different types of cancer (Barbieri et al., 2012; Huang et al., 2013; Jiang, 2014; Liu et al., 2011; Lubbe et al., 2012). Some publications have shown that many TFs are oncogenes and that mutations in TFs can contribute to the development of cancer (Furney et al., 2006). The TF MYC is a clear example of this. Mutations in this gene can make it to be constitutively expressed what leads to an uncontrolled amplification of other transcriptionally active genes. This misregulation causes pathological growth, proliferation, cell transformation and apoptosis (Littlewood et al., 2012).
Similarly, miRNAs can function as either tumour suppressors or oncogenes. In the first case, the expression of a miRNA that regulates an oncogene is reduced or absent, this increases the translation of the oncogene leading to tumour formation. In the second scenario, the expression of a miRNA that targets a tumour-suppressor gene is, for some reason, amplified. This inhibits the translation of the tumour-suppressor gene causing, eventually, cancer (Esquela-Kerscher & Slack, 2006).
1.1.5 Biological networks
Biological functions, like gene regulation, are generally determined by the coordinated and timed interaction of a big number of components and molecules. The avalanche of biological data generated by the improved sequencing technologies and the dropping costs, has provided researchers with a substantial amount of information to tackle new hypothesis and unravel the mechanisms undergoing in complex systems. Currently, one of the biggest challenges of biology is the understanding of the dynamics and structure of the intricate collection of molecular interactions that prompt to biological functions.

14
Therefore, in the last decade biologists have been forced to move towards a different view of biology, a view that does no longer investigate one single gene or protein at a time, but tries to understand the behaviour of the interaction among multiple molecules in a functional system. This more integrative view is called systems biology. Some of the benefits of systems biology are the flexibility that offers to integrate multiple types of data as well as possibility to create computational models of the biological processes. These computational models are extremely powerful tools for research, not only because they easy the understanding of complex systems, but also because they are great instruments to predict what happens to the system when perturbations occur (Ideker et al., 2003).
Characteristics of biological networks
In biological networks, interactions can be represented using abstract models called graphs or networks, where nodes symbolize molecular components and edges the relationships between them. Nodes can represent multiple physical entities like genes, RNAs, proteins, metabolites or even small molecules. Interactions between molecules can be directed or undirected. Directed interactions between two nodes are drawn using arrows that show what is the directionality of the connection, for example, in a transcriptional network the flow would go from the TF to the target gene. Undirected interactions, on the other hand, show links between nodes and a reciprocal effect is assumed. This is the case of PPIs, where two proteins can bind physically without any particular directionality.
During the last decade and due to a massive increase in the generated biological data, the assembly of large-scale biological networks has been possible. To date, some of them have been sufficiently well characterized to understand how they behave and how the system is buffered against perturbations. Topological studies of different biological networks showed that nodes are not

15
randomly organized but rather follow what is called a scale-free configuration (Barabási & Albert, 1999; Barabási & Oltvai, 2004). This organization is characterized for having a few nodes with many connections and a high number of nodes with few interactions. Highly connected nodes are called hubs and are the ones in charge of keeping the network together.
Another important feature of biological networks is modularity. Biological functions are carried out by a discrete number of elements that work together in a particular time and place, what we call functional module (Hartwell et al., 1999). Topologically, modules can be distinguished by a high interconnectivity between the nodes involved. This connectivity can be measured using a topological parameter termed clustering coefficient what can be used to find new modules in a biological network when compared to randomly expected values.
These characteristics provide biological networks with a high degree of robustness, making the system relatively secure against perturbations. The key of their strength lies in the not uniform distribution of the interactions. Having a small percentage of nodes with a high number of connections reduces the probability that these central molecules are altered by random perturbations. It will be much more likely that nodes with a small number of interactions suffer from random failures, what would keep the main component of the network intact. Unfortunately, this configuration is not indestructible, if the failure occurs in one of the hub nodes, network structure will be entirely affected by the disaggregation of the components (Barabási & Oltvai, 2004).
Research in systems biology started in simpler organisms like Escherichia coli and Saccharomyces cerevisiae, and has been improving in the latest years to develop human models of different biological networks (Barabási et al., 2011). The first map of physical PPIs, also called interactome, was generated in yeast (Uetz et al., 2000) and, since then, major efforts have been directed to

16
achieve a more comprehensive and curated PPI network in human (Kerrien et al., 2012; Licata et al., 2012; Szklarczyk et al., 2015). Metabolic networks were the first type of systems studied and they are, probably, the most inclusive of all biological networks. Various studies have been published offering comprehensive descriptions of human biochemical reactions (Duarte et al., 2007; Ma et al., 2007). Regulatory networks have been typically centered on the effects of TFs over gene expression. However, post-translational modifications have recently been included in this model (Barabasi et al., 2011; Vidal et al., 2011). miRNA-gene networks did not appear until the development of computational algorithms for the prediction of targets, as explained in section 1.1.2.
Gene regulatory networks
In gene regulatory networks (GRN) involving TFs and miRNAs, nodes represent different types of molecules: proteins, as TFs; DNA, as the TFBS of the target gene; and RNA, as the miRNA and its target gene. Fortunately, it is not necessary to explicitly represent all these levels of information in the network; the usage of a conceptual node that represents the gene is completely understandable. Working with different types of biochemical interactions and molecules means that the generated networks will vary among tissues and time, what adds more accuracy to the characterization of the studied phenotypes.

17
Bioinformatics in gene regulatory networks 1.2
Technological advances in the field of genomics have revolutionized the way in which we study biological systems. The appearance of DNA microarrays more than two decades ago left gene-by-gene approaches behind to give way to genome-wide strategies. This new generation of analysis opened the doors to a completely different way of studying gene regulation. More recently, with the arrival of NGS technologies, researchers have been able to study GRN in a more accurate and meaningful way.
This section is an overview of these technologies and how they have been applied to the study of gene regulatory networks. It will also cover the importance of databases and resources to make an integrative understanding of the molecular mechanisms and explore some of the statistical methods that have been used in this thesis for the study of GRN.
1.2.1 Genome-‐wide high throughput technologies applied to GRN
As mentioned earlier, diverse concentrations of proteins and non-coding RNAs are crucial to maintain the identity and differentiation of cells. The abundance of transcripts derived from genes is generally used as a measure of gene expression. This transcriptional activity can be used to compare gene expression across different tissues, phenotypes, treatments or time points. DNA microarrays represented a massive improve by enabling the investigation of thousands of genes at the same time and pushing forward the characterization of the regulation in gene-expression networks and how they malfunction in disease.

18
In an expression microarray (Figure 4) single stranded DNA copy (cDNA) from known genes is attached to a solid surface, made of glass or silicon. Between 4,000 and 50,000 cDNAs can be fitted into a single slide (Butte, 2002). These small cDNAs, also known as probesets, have been designed to represent the most unique part in a transcript, so even different isoforms from the same gene can be detected. RNA is extracted from the biological samples we want to study and transformed into cDNA containing a fluorescent label. This cDNA is then hybridised with the microarray for a period of time and washed to clean any unbound molecules. A laser light scans the microarray to measure fluorescence for every probeset. Light intensity is used as a measurement of transcript abundance (i.e. expression).
Many computational efforts have been focused on the development of reverse engineering methods to reconstruct GRNs since the birth of microarrays and, generally, all of them require experimental
Figure 4. Microarray experimental process. The general protocol for the preparation of a DNA microarray requires the isolation of the mRNA, transformation of the RNA to cDNA adding a fluorescent label and hybridization with the microarray, where thousands of probesets representing the genome have been arranged. The microarray is scanned using a laser light and intensities are processed by a computer to measure transcript abundance. Adapted from (Butte, 2002)

19
information and some prior biological knowledge. In general terms, for the generation of GRN, biologists use experimental data from systems or pathways to construct preliminary models that match the cell in a particular condition. Then, they modify the conditions and test the competence of the model under different conditions (W.-P. Lee & Tzou, 2009). The model is modified until it fully represents the data. Clearly, an automatization of this procedure is essential to have a genome-wide representation of cell's regulation.
According to Schlitt and Brazma (Schlitt & Brazma, 2007), the most important models for learning and inference of the regulatory structure are linear correlation based methods and probability based methods. In linear correlation based methods such as coexpression (Tavazoie et al., 1999), connections between genes are built if their expression values correlate over a certain threshold. Although this is one of most extensively used methods, it is also the one that introduces the highest level of confounding. Using coexpression the relationship between genes does not generally represent causality or direct interaction but corregulation or even noise, moreover, genes whose expression is constant or invariable will not be considered. Besides, they are only able to measure linear relationships, what is not the general behaviour of GRNs, so non-linear associations will go unnoticed. On the contrary, probabilistic based methods can handle non-linear relationships and deal with noise. Edges in probabilistic methods represent causal associations and consider directionality in the edge. The most representative methods in this group are Bayesian networks (Friedman et al., 2000; Friedman, 2004; Hartemink et al., 2001; Sachs al., 2005) and mutual information networks (Basso et al., 2005; Butte & Kohane, 2000; Steuer et al., 2002).
With time, these entirely computational approaches evolved to integrate further relevant regulatory information such as promoter information or transcription binding data from ChIP-chip, what added more reliability to the results obtained.

20
Ten years ago the first two studies using DNA pyrosequencing were published (Margulies et al., 2005; Shendure et al., 2005), opening up the doors to a whole new way, more practical and also cost-competitive, of studying molecular biology (Shendure & Ji, 2008). This DNA sequencing technique (called often next generation sequencing or NGS) relies on the detection of pyrophosphate release during the incorporation of nucleotides rather than chain termination with dideoxynucleotides as happens with Sanger sequencing. NGS technologies have proven to be powerful enough to investigate cell’s behaviour from many different angles (see Figure 5) as they can be applied to the study of gene expression (RNA-Seq), genetic variants (whole exome or whole genome sequencing, also WES and WGS, respectively), protein binding to DNA (ChIP-Seq), DNA (bisulphite sequencing) and histone (ChIP-Seq) methylation or three-dimensional genome conformation (Hi-C).
The workflow for the analysis of NGS data starts with the preparation of the library, which contains randomly fragmented pieces of DNA. These fragments will come from diverse experiments depending on the technology we want to apply. For example, in whole exome or whole genome sequencing no further processing is required apart from the fragmentation of the DNA. In RNA-Seq, coding mRNA is separated from non-coding RNA by capturing the 3’ polyadenilated tail and then, converted into cDNA to be fragmented (Chu & Corey, 2012). DNA fragments in ChIP-Seq will correspond to the DNA segments that coprecipitate with the binding protein (a TF, for instance) using chromatin immunoprecipitation. Once the DNA fragments are ready, the following steps in the process are very similar among techniques. First, common adapters are ligated to both sides of DNA fragments. These adaptor sequences contain barcodes and primers that will allow the hybridization with a surface, which can be either beats or solid plates. Once attached to the surface the DNA is PCR-amplified in clusters and ready to be sequenced. Sequencing will vary depending on the technology but, in general, it consists on the

21
addition of fluorescent nucleotides that emit different colour light as soon as they are incorporated to the single stranded DNA by a polymerase. A computer records the colour change at each cycle associating them to the corresponding nucleotide. The final output of the sequencing is a file containing the raw reads of all fragments associated to a quality score. These reads are quality controlled and aligned into a reference genome. At this stage, different analysis methodologies are applied according to the purpose of the analysis.
Figure 5. NGS technologies and their applications. NGS technologies can be used to study a wide variety of biological information. Combinations of different types of data are used to build integrative models of biological functions. Adapted from Shyr & Liu, 2013.
The NGS technologies that have had the highest influence towards the analysis of GRNs have been RNA-Seq, ChIP-Seq with TFs and WGS. The first two, RNA-Seq and ChIP-Seq have been extensively used in combination to measure gene expression, including the

22
expression of new isoforms, and to build maps of TF binding at a genome-wide level (Furey, 2012; Park, 2009; Wang et al., 2009).
As said before, when a TF binds into the upstream region of a gene recruiting all the transcriptional machinery, the target gene can be either activated or repressed. Using this information, many studies have combined RNA-Seq and ChIP-Seq to assess how useful is TF binding to promoter region to predict gene expression by comparing the bound and unbound states (Cheng et al., 2011, 2012; Ouyang et al., 2009). However, this is not an easy task and Wang and colleagues published some of the difficulties of dealing with these data (S. Wang et al., 2013). One of the problems lies in the difficulty of relating a TF binding with a particular genes’ expression since this is not a one-to-one relationship. This happens because the gene can be regulated by different TFs and these, in turn, are likely to regulate several genes. Moreover, delimiting the region where the TF can bind is not straightforward considering it can happen between the proximal region of TSS and hundreds of kilobases upstream. The last obstacle is the fact that not all TFBSs in a ChIP-Seq experiment are functional, what adds noise to the experiment.
The other two technologies that have provided a new dimension to the study of GRNs are WES and WGS, which are able to detect any genomic variation at exome or genome (including non-coding regions) level, respectively. Although regulatory elements like TFs, miRNAs and TFBSs are highly conserved regions (Chen & Rajewsky, 2007), it is quite common to find variants affecting these regions (Garfield et al., 2012; Zheng et al., 2011). Thus, some research have been addressed to characterize how vulnerable is gene regulation to this changes. In this respect, some authors found important consequences of variation affecting binding (Kasowski et al., 2010; Zheng et al., 2010), gene expression (Majewski & Pastinen, 2011) and also producing disease phenotypes (Manolio, 2010). However, the one if the biggest challenge when analysing

23
variation in regulatory elements lies in the fact that not all variants are going to have a functional effect, as stated in these studies.
Despite the unquestionable benefits that NGS technologies have provided to biological research, the tremendous amount of data that they produce difficult the search of causal genes. Technical artifacts, neutral variability or poor experimental designs are some of the factors that add noise to our study, making hard the differentiation between noise and true causal hits. To solve this issue, some prioritization strategies are needed. Prioritization is generally based on some basic principles; for example, causal genes are expected to interact with other disease genes, carry deleterious mutations that could affect functionality or be expressed in tissues involved in the disease.
1.2.2 Databases and resources
Research in bioinformatics is often based on public resources and datasets, what require from comprehensive and reliable sources of information. Large-scale projects like those mentioned in section 1.1.3 have provided the scientific community with an invaluable assortment of data that includes genomic mutations, TF binding, expression, histone modifications and copy number variation among others. Most of these projects have made public not only the raw datasets but also other processed and clean information derived from their analysis. Big repositories like Ensembl (Cunningham et al., 2014) or the University of California, Santa Cruz (UCSC) (Rosenbloom et al., 2014) have integrated this information in their databases making it even more easy to query and visualize using their genome browsers. In addition to large-scale projects data, these repositories include updated annotations of genomic elements (e.g. genes, transcripts, SNPs, etc.) and some of their features (e.g. nucleotide conservation, variant population frequencies, etc.). Merging all this information in a common resource is definitely necessary if we want to study GRNs in an integrative way.
24
Databases in GRN
Unfortunately, when talking about GRNs, there is very little information that has been included in these big resources apart from this coming from large-scale projects, compared to the numerous smaller databases that have been created in the last years. One example is miRBase (Kozomara & Griffiths-Jones, 2014), the main resource for miRNAs with over 17,000 distinct mature miRNA sequences in more than 140 species. miRBase contains detailed annotations about the primary and the mature forms of miRNAs as well as their own computationally predicted miRNA targets and cross-references to other databases. Unfortunately, miRBase data are not stored in Ensembl.
Resources storing miRNA targets can be divided in two categories: manually curated or computationally predicted. Resources that provide targets identified by manual curation are limited, mainly, due to the tediousness associated with the collection process. To get the curated interactions, researchers need to review hundreds to thousands of articles and/or validate experimentally their findings. This makes the information extremely valuable but, at the same time, limits their growing capacity. On the other hand, computational mining sources tend to be larger because they take advantage of target finding algorithms (one o combinations of them) to automatically screen the genome for miRNA binding sites, as explained in section 1.1.2. The main problem of computationally predicted interactions is the high rate of false positives generated by the algorithm. Although many strategies have been focused on the minimization of this rate by using conservation or structural information, this is still a concern. Table 1 summarizes some of the miRNA target resources.
Despite some researchers have made big efforts to put together information about TF regulatory interactions, databases containing TF targets are less abundant than miRNA target resources. Only few literature-curated databases stand out in TF research. One of
25
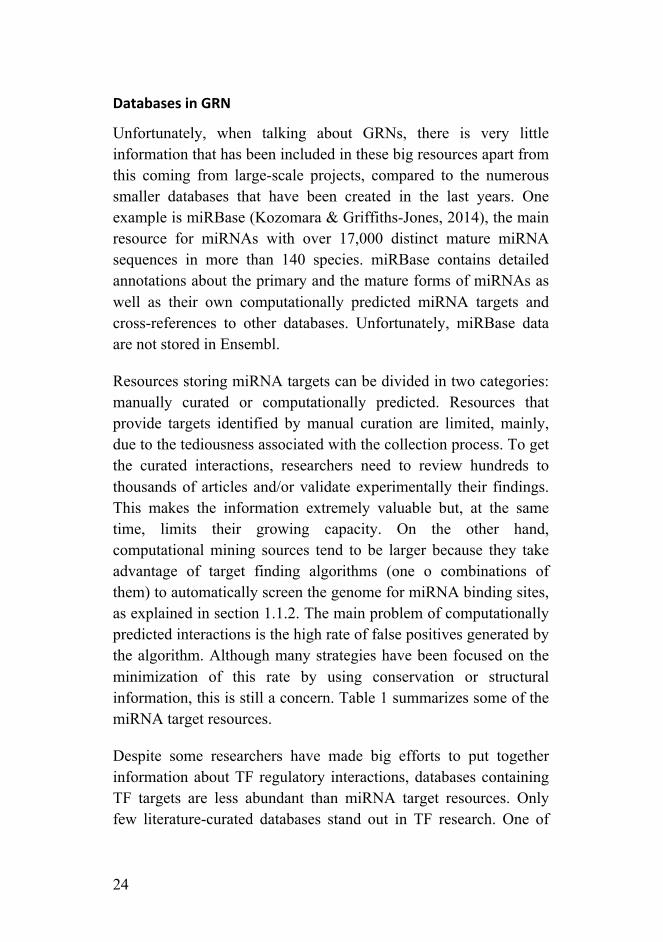
them is ORegAnno (Montgomery et al., 2006), unfortunately, is not updated since 2010. PAZAR is also a great resource of curated interactions that has been growing since 2007 and, according to the latest update contains 708 TFs that regulate more than 1,200 genes (Portales-Casamar et al., 2009). A slightly greater curated database was published recently containing 748 TFs that regulate nearly 2,000 genes (Han et al., 2015). Computational resources generally rely on the position weight matrices stored in TRANSFAC and JASPAR to scan the genome for possible binding sites, however, they are not very popular.
The problems of working with multiple databases
Just dealing with TFs and miRNA we can see that numerous small but interesting resources have been created. The same happens with other basic and essential types of data like protein information from UniProt (The UniProt Consortium, 2014), InterPro (Mitchell et al., 2014) or PDB (Berman et al., 2000); pathway data from Reactome (Joshi-Tope et al., 2005) or KEGG (Ogata et al., 1999); or other specialised data like drug targets from DrugBank (Law et al., 2014) or gene-disease associations from DisGeNET (Pinero et al., 2015).
Database Type Last update Reference MicroCosm Computational - Unpublished
miRBase Computational 2014 Kozomara & Griffiths-Jones, 2014
PicTar Computational 2007 Krek et al., 2005 TargetScan Computational 2015 Agarwal et al., 2015
miRecords Computational and curated
2013 Xiao et al., 2009
miRNAMap Computational and curated
2007 Hsu et al., 2008
miRWalk Computational and curated
2011 Dweep et al., 2011
miRTarBase Curated 2013 Hsu et al., 2014 Tarbase Curated* 2014 Vergoulis et al., 2012
Table 1. List of some of the available databases providing miRNA targets. The year of the last update is based on the information given in the different websites. * Requires licence (free for academy).

26
As mentioned earlier, working with complex diseases requires of a whole genome picture of the cell’s state to, ultimately, understand the problems underlying, and integrative analysis will definitely help in this search. However, the task can become difficult if researchers need to query many databases for hundreds of thousands identifiers. Downloads containing all the information in the database are generally available, so researchers can download them and write custom scripts to parse the contents of each repository, but this can be sometimes tedious, error prone and time consuming depending on the number of resources to query.
One of the biggest issues when dealing with multiple databases is handling identifiers. Every database tends to create its own identifier what makes difficult the integration process. For example, the breast cancer 2 gene in human has an official symbol given by The HUGO Gene Nomenclature Committee (HGMD) (Gray et al., 2015) that is BRCA2, but HGMD also has an identifier for this gene, 1101. Ensembl calls this gene ENSG00000139618, for the National Center for Biotechnology Information (NCBI) it is 675, for UniProt it can be either P51587 or BRCA2_HUMAN and for the Online Mendelian Inheritance in Man database (or OMIM) it is 600185. Many efforts have been directed to cross-reference all this resources but dealing with identifiers is still painful. Although some of these identifiers have been used widely and have been accepted as a standard, such as the HGNC symbol or the Ensembl identifier, still many small databases are resistant to use them, at least correctly.
Curated databases are the ones behind in this matter. Since researchers need to review old articles, they sometimes annotate genes or regulatory features using synonyms or obsolete identifiers. miRBase has also added some difficulties to this task by making their identifiers change overtime. For example, the current miRNA precursor hsa-mir-29b-1 has been also named as hsa-mir-102-7.1, hsa-mir-102-2 and hsa-mir-29b-2. A miRNA target database that used an older version of miRBase annotation to compute the

27
interactions is likely to have them annotated with an unused identifier, what will make impossible the integration with other resources unless the correspondences between old names and current names are considered.
The need of exploiting cross-comparisons between large datasets motivated the development of standards that provide guidelines about the report of interaction networks. This is something the community really wanted, as it would foster the reuse, integration and exchange of data reducing developing time (Klipp et al., 2007). Some standards were then created for pathway analysis such as the Systems Biology Markup Language (SBML; Bornstein et al., 2008), Biological Pathways Exchange (BioPAX, Demir et al., 2010) or the Cell Markup Language (CellML, Cuellar et al., 2003). Unfortunately, almost all of them are based on complicated and somehow ambiguous XML formats what makes its implementation complicated. Today, very few databases use these standards to share their data (Brazma et al., 2006).
The other big issue is accessibility. When working at genome-wide level we want to interrogate databases for information about thousands (if not more) of features. For this reason, we need them to be programmatically accessible and quick. Thus, repositories that offer exclusively online searches are definitely not useful. Other databases provide links to text files containing all the information stored but can require the user some programming skills to parse them. This can be doable when working with a handful of repositories, however, trying to parse, restructure and integrate more than this, can be time consuming and error prone.
Ensembl’s BioMart, is an intermediate solution to avoid programming and still getting a moderately big amount of data. However, searches containing more than a hundred thousand queries can become extremely slow. Application programming interfaces (APIs) have become a real solution to this problem allowing the user to access programmatically to all the resources

28
stored in a repository’s server. Ensembl, for example, provides an API written in Perl to query their MySQL biological database. This API is quite comprehensive and users can retrieve any biological information stored just by writing a piece of code. Nevertheless, for some researchers, programming in Perl is still a complicated and unknown task.
At the same time in the area of computer science, the development of APIs moved forward with the creation of a software architecture suitable for the interchange of big amounts of data, called Representational State Transfer (REST). REST is a very simple design that takes advantage of Hypertext Transfer Protocol (HTTP) to develop web services (WS), so that we can retrieve data using a simple URL. This type of WS is called RESTful APIs. Fortunately, these technologies are every day more and more integrated in biological repositories such as Ensembl, which started providing this service in 2014 (Yates et al., 2015).
1.2.3 Methodologies for the analysis of gene regulatory networks
High-throughput technologies generally result in a large amount of data that needs to be processed and analysed to understand its biological meaning. Identifying regulatory elements that could be affected in specific phenotypes or conditions is possible using these data, and this is one of the purposes of this thesis. This section will cover some of the methodologies and strategies used in this thesis to tackle the problem.
Over-‐representation and set enrichment analysis
These methods were initially used in transcriptomic analysis to identify functional categories over-represented in lists of genes. In the over-representation analysis a list of genes resulting, for instance, from a differential expression (DE) analysis is compared against the list of genes involved in a particular biological function (for example, a Gene Ontology term). The statistical evaluation will

29
estimate if there is a significant representation of this functionality in the DE-genes compared to what is expected by chance. The operation is repeated for the rest of terms resulting in a list of over-represented functions in the problem gene list. Alternatively, we can have an input gene list sorted by some criteria like gene expression values. In this situation, set enrichment analysis can use this ranked information to identify enrichment of biological functions in genes located that at the top or bottom of the list (Backes et al., 2007).
These statistical approaches can be applied to the study of GRN. In this case, sets of genes are grouped because they share a common regulator, instead of a common biological function. In an over-representation analysis the test in going to check for significant enrichment of a particular regulatory element in the input list of genes compared to what is expected at genome level. Figure 6 exemplifies this process.
Figure 6. Over-representation analysis. Our gene list contains targets for GATA1 (orange circles) and SP1 (blue circles) transcription factors (TFs). For each TF, we extract the proportion of targets in the gene list and in the genome to construct the contingency table. Fisher's exact test is used to determine if there is a non-random association between the gene list and the specific regulation of a TF.

30
Similarly, the set enrichment analysis (Figure 7) will be able to detect common of regulatory elements considering the order of the input gene list.
Figure 7. Set enrichment analysis. In this example, the list of genes comes from a differential expression analysis comparing conditions A and B where genes have been sorted according to the statistical value resulting from the comparison. The list is then divided into segments keeping the order. In each segment, every regulator (in the example, TF1, TF2 and TF3) is tested for over-representation in the segment. Here, TF1 is completely uncorrelated with the arrangement while TF2 and TF3 are clearly associated to a high expression in the experimental conditions B and a high expression in condition A, respectively.
Rare variant analysis
As explained in section 1.2.1, WES and WGS studies have become highly popular in the latest years due to their ability to identify any genomic variant at a genome-wide level. The application of these techniques has proven to be extremely successful in the identification of genomic variants associated with traits or diseases. These studies have generally analysed the variability found at high to moderately high frequency in a population (minor allele frequency (MAF) > 5%). Unfortunately, despite the great success of these analyses, there is still a very high proportion of the heritability in multiple traits and diseases that cannot be explained with the results obtained. This missing heritability is thought to be hidden in rare (0.5% ≤ MAF < 5%) and very rare (MAF < 5%) variants with moderate to low penetrance (Manolio et al., 2009). WES and WGS are able to detect variability in this spectrum, and some statistical approaches have been put in place to boost these analysis.

31
The low frequency of these variants complicates its study in a one-by-one basis, as we would need tens to hundreds of thousand samples to achieve enough power. Thus, the common strategy followed in rare variant analysis tests is the aggregation of variants in a region. This way, every defined region is tested for an accumulation of rare variants in samples with a given trait or disease. There are several types of aggregation tests and each one of them assumes different genetic models. Consequently, the power of the tests will depend on the way we have decided to filter variants and the true disease model underlying (S. Lee et al., 2014). For example, burden tests will be more suitable if a large proportion of causal variants are expected within the tested region. On the contrary, if what we expect is the presence of disease-associated and non-associated variants in a region, the best choice is a variance-component test (Basu & Pan, 2011; Wu et al., 2011). Typically, we have no information on how variants are distributed across regions, so the best strategy many times is to try multiple methods.
Visualization
The popularization of experimental techniques for the investigation of molecular interactions and the publication of the first interaction maps lead to the development of graph viewers that could represent biological networks in a simplified way. Network visualization cannot be put on the same level as statistical methods, but they have, definitely, helped with the interpretation of the results.


Chapter 2
OBJECTIVES


35
Chapter 2
OBJECTIVES
In the light of the concepts reviewed in the previous chapter, the general objective of this work is to provide the scientific community with some tools for the analysis of genomic information with the objective of identifying altered regulatory elements in disease or any other phenotype. More specifically, the main goals can be summarized as follows:
1. Develop a resource that integrates heterogeneous biologicalinformation and allows the efficient and fast retrieval ofdata.
2. Implement a tool capable of identifying altered regulatoryelements from a gene expression analysis.
3. Design a methodology for the analysis of the impact ofgenomic variants in regulatory regions.


37
Chapter 3
RESULTS


39
Chapter 3
3.1. CellBase, a comprehensive collection of RESTful web services for retrieving relevant biological information from heterogeneous sources
Marta Bleda, Joaquin Tarraga, Alejandro de Maria, Francisco Salavert, Luz Garcia-Alonso, Matilde Celma, Ainoha Martin, Joaquin Dopazo and Ignacio Medina. CellBase, a comprehensive collection of RESTful web services for retrieving relevant biological information from heterogeneous sources. Nucleic Acids Research (2012) 40 (W1): W609-W614 first published online June 12, 2012 doi:10.1093/nar/gks575
Access to full text: http://nar.oxfordjournals.org/content/40/W1/W609.full


47
3.2. Inferring the regulatory network behind a gene expression experiment
Marta Bleda, Ignacio Medina, Roberto Alonso, Alejandro De Maria, Francisco Salavert and Joaquin Dopazo. Inferring the regulatory network behind a gene expression experiment. Nucleic Acids Research (2012) 40 (W1): W168-W172 first published online June 11, 2012 doi:10.1093/nar/gks573
Access to full text: http://nar.oxfordjournals.org/content/40/W1/W168.full


55
3.3. Analysis of high-‐resolution regulatory interactions for variant and gene prioritization
Marta Bleda and Joaquin Dopazo. Analysis of high-resolution regulatory interactions for variant and gene prioritization.
This manuscript was under preparation at the time the thesis was submitted.


57
Analysis of high-resolution regulatory interactions for variant and gene prioritization
Marta Bleda1,†, Ignacio Medina2 and Joaquín Dopazo1,3,4,*
1 Department of Computational Genomics, Centro de Investigación Príncipe Felipe (CIPF), Valencia, 46012, Spain
2 HPC Service, University of Cambridge, Cambridge, CB3 0RB UK3 Centre for Biomedical Network Research on Rare Diseases (CIBERER),
Valencia, Spain 4 Functional Genomics Node at CIPF, Instituto Nacional de Bioinformatica
(INB), Valencia, Spain
† Current address: Department of Medicine, University of Cambridge, Cambridge, UK
* To whom correspondence should be addressed. Tel: +34 96 328 96 80;Fax: +34 96 328 97 01; Email: [email protected]
Abstract
Next-generation sequencing can catalogue in detail the genomic variation in population samples. However, the amount of variants obtained and the poor characterization of some regions of the genome, make difficult the evaluation and identification of causal variants, particularly in non-coding DNA, where many important regulatory regions lie. Moreover, causal variants can be distributed across interacting partners making difficult the localization of the altered mechanism in a disease. Here, we present a methodology for the prioritization of variants and genes based on the analysis of the genetic variability observed in regulatory interactions. To avoid the lack of power due to scattered variants, we collapse the effect of the variants found in interacting regulatory elements.

58
Introduction
Genome regulation is a complex process that requires the coordination of different molecules. The integrity of the steps involved in this process is crucial to maintain the stability of a healthy cell and its differentiation state. These mechanisms are highly conserved and require the appropriate expression levels of the genes involved for its correct functioning (T. I. Lee and Young 2013). Genetic variation can alter the expression of these genes either by changing the sequence and the structure of the resulting protein or by modifying binding sites involved in the regulation of these genes (Dermitzakis 2008).
Transcription factors (TFs) and microRNAs (miRNAs) are some of the main regulatory molecules that orchestrate gene regulation. These regulatory elements, alone or in combination with other regulators, can control the expression of tens to hundreds of genes. TFs interact with the transcriptional machinery by binding to cis regulatory elements in the DNA (promoters, enhancers, etc.) and altering the rate at which a gene is transcribed (Martinez and Walhout 2009). The interaction is mediated by a DNA binding domain located at the TF that is able to recognise specific sequences in the DNA called transcription factor binding sites (TFBSs). The final transcriptional output will also depend on the action of other TFs that bind with the first, termed cofactors. The combination of TFs that interact is thought to have a main role in gene regulation by determining the expression in different tissues (Ravasi et al. 2010). miRNAs are small (~22nt long) non-coding RNAs that act at post-transcriptional level by hybridizing to complementary region located at the 3’UTR of target mRNAs. The interaction generally has a repressive effect on the expression of the target gene either by destabilizing the RNA or by repressing its translation (Filipowicz et al. 2008).
The high conservation of the interacting regions involved in gene regulation by TFs and miRNAs demonstrate the importance of

59
these sites (de Mendoza et al. 2013; Pasquinelli et al. 2000; Sokol and Ambros 2005; Chen and Rajewsky 2007). In fact, mutations in these binding locations have been associated with pathologies such as cancer, cardiovascular diseases, immune and neurological disorders (T. I. Lee and Young 2013).
Next-generation sequencing (NGS) allows the characterization of genomic variants across the entire genome what has opened the doors to explore new hypothesis about the effect of mutations in gene regulatory elements. Unfortunately, the large amount of variants that can be found using this technology difficults its interpretation and the identification of causal mutations. Many of the causal variants in complex disorders with poorly characterized heritability are expected to be in a very low frequency, what makes impossible for these variants to reach a genome-wide significance level in association studies (Manolio et al. 2009). To overcome this difficulty, aggregation tests have been suggested as an alternative to single variant analysis. In these tests, sets of regions are defined (generally, genes) and rare variants found in these regions are tested together for association with disease (S. Lee et al. 2014).
Here, we propose an approach to study the accumulation of genetic variants affecting the interaction of regulatory elements. We hypothesize that different genomic variants located in interacting sites may affect the correct binding and, thus, alter the correct regulatory effect producing similar malfunction. At the transcriptional level, mutations in TFBSs, DNA binding domains and the interacting domains between TFs and cofactors are subject of interest. At the post-transcriptional level, mutations that fall in miRNAs and inside targets at the 3’UTR region of the transcripts regulated by these miRNAs are analysed and considered in the affected regulatory network. We suggest that variants found in interacting and cooperating regions are likely to have a similar impact on the phenotype and should be considered in combination. An implementation of this approach is freely available at http://bioinfo.hpc.cam.ac.uk/web-apps/regVar.

60
Results and discussion
As stated earlier, some studies have demonstrated the pathogenic effect of individual genomic variants lying in regulatory regions. These locations tend to be highly conserved, what suggest the importance of their structure and functionality. Although not many variants are expected to fall in these sites, some variability can still be found in healthy population. Therefore, we speculate that the variability observed in healthy individuals is neutral or is, somehow buffered. To confirm this assumption, we have compared the effects of genomic variants located in regulatory regions from a healthy population against mutations found in cancers.
Assuming that the effect of variants could be distributed across its interactors, we have defined a regulatory unit as the minimum set of interactions needed for a regulatory event to happen. We have created two different types of regulatory units depending on the nature of the interactions. The first type is constituted by TFs, TFBSs and cofactors. The essential elements in this type of interactions are the DNA binding domains of the TF, the TFBS and the interacting domains between the TF and the cofactors (Figure 1A,B). miRNAs and their target binding sites, generally located at 3’ UTR regions of genes, form the second type of regulatory units (Figure 1B). Only variants affecting these essential regions are considered in the analysis.
Figure 8. Essential regions in regulatory interactions. For the analysis only variants affecting the essential sites of regulatory interactions are considered for further testing. (A) The DNA binding domain of a TF interacts with the promoter region of the target gene by binding the TFBS. (B) Cofactors modulate the final outcome in a regulatory event by interacting with the TF. This bond only involves specific interacting domains of each protein. (C) miRNAs bind to target sequences located at the 3’ UTR of their target genes. Variants located in red coloured regions are the ones that are included in the analysis.
A
B
C

61
We extracted the regulatory variants observed in all these regulatory regions from 1,000 Genomes Project (The 1000 Genomes Project Consortium 2012) control samples and COSMIC (Forbes et al. 2014) cancer dataset to evaluate their neutrality. After filtering, we identified 65,530 regulatory variants in healthy population and 12,401 variants in cancer samples. The functional annotation of the variants showed significantly different results (Figure 2).
The majority of regulatory variants in healthy population lay in intronic regions without affecting splice sites or miRNAs. Only 11% of the annotations were located in coding sequence regions in controls. Also, healthy samples showed a fraction of annotations (6%) representing variants located upstream of the gene but none of these appeared to affect a TFBS. In contrast, upstream and missense variation appeared over-represented in the cancer dataset. Unlike healthy population, cancer variation showed a moderately high proportion of annotations related with regulatory effects such as non-coding transcript variants, TFBS variants and regulatory region variants. Although a minimum fraction of variants was also found
Figure 9. Results of the annotation of the genomic variation found in regulatory units of healthy (A) and cancer (B) samples. Pie charts at left represent all annotations and pie charts at right coding annotations.

62
in TFBSs in the healthy dataset, this proportion was significantly under-represented compared to the amount in cancer. Interestingly, nearly half of the annotations in TFBS were also annotated as TFBS ablation.
We also evaluated the conservation of the regulatory variants obtained from each dataset (Figure 3). PhastCons (Siepel et al. 2005) scores, that measure the probability of negative selection, were retrieved for all the variants located in these regulatory regions in both datasets. Regulatory variants in the cancer dataset were located in nucleotides with a significantly (p-value < 2e-16) higher selective pressure, suggesting that variants in healthy individuals affect
mainly neutral positions, while most of variants in the cancer dataset lie in more evolutionary conserved positions, as expected.
Data and methods
Construction of the high-resolution gene regulatory network
Protein annotations were extracted from UniProt (The UniProt Consortium 2014) and the mappings of the domains they match were obtained from InterPro v53 (Mitchell et al. 2014). The list of genes that act as transcription factors and their DNA binding domains was extracted from AnimalTFDB (Zhang et al. 2015), which have characterized and curated the DNA binding domains of 1,691 human TFs representing 71 animal TF families. Peptide positions covered by DNA binding domains were transformed to their corresponding genomic locations for each TF protein using Ensembl’s REST API (Yates et al. 2015). After merging this information, we ended up with 1,317 TFs containing at least one of
Figure 10. Probability of negative selection in healthy (1000G) and cancer (COSMIC) variants.

63
the DNA binding domains. 86 of these proteins presented two DNA binding domains.
TFBSs were extracted programmatically from CellBase (M. Bleda et al. 2012). These TFBSs come originally from Ensembl (Cunningham et al. 2014), that provides a processed dataset of ChIP-Seq hits from ENCODE (ENCODE Project Consortium 2012). CellBase associates TFBSs located in the promoter region of a transcript (5 kb upstream and 500 bp downstream the transcription start site) as putative regulators of the gene.
Interactions between TFs and cofactors were collected from TcoF-DB (Schaefer, Schmeier, and Bajic 2011). This database contains evidence-based PPIs between TFs and other proteins, where non-TF proteins were filtered to keep only those that are likely to act as cofactors. INstruct (Meyer et al. 2013) information was used to identify the interacting domains in each TF-cofactor interaction. We used InterPro to get the peptide regions containing these domains and map them to their genomic coordinates.
We extracted miRNAs and their coordinates from CellBase. These miRNAs come originally from miRBase version 21 and were mapped to Ensembl’s annotation to get the genomic coordinates. In the final dataset we end up with 2,165 miRNAs. miRNA targets used for the high-resolution regulatory network were collected from UCSC (Karolchik et al. 2004) which contains a filtered dataset of conserved miRNA targets sites from TargetScan version 5.1 (Agarwal et al. 2015) that have been previously mapped to the 3’UTR region of the target genes. 235 miRNAs were finally used. These miRNAs regulate 9,348 genes.
To build the regulatory units we considered the interactions from the sources mentioned above. We recovered 81,903 transcriptional regulatory units formed by TFs, TFBSs and cofactors and 92,987 post-transcriptional regulatory units including miRNA-target

64
interactions. In total, 174,890 regulatory units have been considered for this study.
Healthy and cancer datasets
Healthy variants were extracted from the 1,000 Genomes Project Phase 3 (The 1000 Genomes Project Consortium 2012) corresponding to the whole-genome sequencing of 2,504 individuals. Cancer variants used were obtained from COSMIC (Forbes et al. 2014) and include coding and non-coding mutations. Both datasets were annotated using the variant annotation functionality in CellBase (Bleda et al. 2012).
Implementation
We also implemented a standalone program that takes a variant call format (VCF) file containing the genotypes of the samples we want to study. If a case-control VCF is provided, users must also include a pedigree file with the six first columns of a PED file format as specified in PLINK (Purcell et al. 2007). For each regulatory unit, the tool evaluates if there is an accumulation of variants in cases compared to controls by running a burden test, as implemented in RvTests (http://zhanxw.github.io/rvtests/). If no PED file is provided, it assumes that all samples in the VCF are cases. In this scenario, the proportion of variants found in regulatory units is be compared against the proportion of variants in 1,000 genomes project (The 1000 Genomes Project Consortium 2012) and significance is evaluated using a Fisher’s exact test. In both cases, a list of significant regulatory units is obtained. A network file is generated containing the resulting significant interactions as well as the list of enriched functionalities (as Gene ontology terms) in these genes.
Conclusions
Here we presented an overview of the mutation status in essential regions for regulatory interactions by comparing the variants

65
present in healthy and cancer samples. This suggested that although some genomic variability is present in regulatory essential sites for both datasets, variants in the control dataset have a neutral effect while variants present in cancers are damaging. This could mean that our catalogue of essential regulatory regions is not completely clean and includes non-functional positions.
We also propose a methodology for the analysis and prioritization of regulatory elements affected by damaging genomic variation. The methodology has been implemented in a standalone program that allows the analysis of standard VCF and provides information about the functional impact of the variants observed.
References
Agarwal, Vikram, George W Bell, Jin-Wu Nam, and David P Bartel. 2015. “Predicting Effective microRNA Target Sites in Mammalian mRNAs.” eLife 4 (August). eLife Sciences Publications Limited: e05005. doi:10.7554/eLife.05005.
Bleda, M., J. Tarraga, A. de Maria, F. Salavert, L. Garcia-Alonso, M. Celma, A. Martin, J. Dopazo, and I. Medina. 2012. “CellBase, a Comprehensive Collection of RESTful Web Services for Retrieving Relevant Biological Information from Heterogeneous Sources.” Nucleic Acids Research 40 (W1): W609–14. doi:10.1093/nar/gks575.
Bleda, Marta, Joaquin Tarraga, Alejandro De Maria, Francisco Salavert, Luz Garcia-Alonso, Matilde Celma, Ainoha Martin, Joaquin Dopazo, and Ignacio Medina. 2012. “CellBase, a Comprehensive Collection of RESTful Web Services for Retrieving Relevant Biological Information from Heterogeneous Sources.” Nucleic Acids Research 40 (W1).
Chen, Kevin, and Nikolaus Rajewsky. 2007. “The Evolution of Gene Regulation by Transcription Factors and microRNAs.” Nature Reviews. Genetics 8 (2): 93–103. doi:10.1038/nrg1990.
Cunningham, Fiona, M Ridwan Amode, Daniel Barrell, Kathryn Beal, Konstantinos Billis, Simon Brent, Denise Carvalho-Silva, et al. 2014. “Ensembl 2015.” Nucleic Acids Research 43 (D1): D662–69. doi:10.1093/nar/gku1010.

66
De Mendoza, Alex, Arnau Sebé-Pedrós, Martin Sebastijan Šestak, Marija Matejcic, Guifré Torruella, Tomislav Domazet-Loso, and Iñaki Ruiz-Trillo. 2013. “Transcription Factor Evolution in Eukaryotes and the Assembly of the Regulatory Toolkit in Multicellular Lineages.” Proceedings of the National Academy of Sciences of the United States of America 110 (50): E4858–66. doi:10.1073/pnas.1311818110.
Dermitzakis, Emmanouil T. 2008. “From Gene Expression to Disease Risk.” Nature Genetics 40 (5): 492–93. doi:10.1038/ng0508-492.
ENCODE Project Consortium, . 2012. “An Integrated Encyclopedia of DNA Elements in the Human Genome.” Nature 489 (7414): 57–74. doi:10.1038/nature11247.
Filipowicz, Witold, Suvendra N Bhattacharyya, and Nahum Sonenberg. 2008. “Mechanisms of Post-Transcriptional Regulation by microRNAs: Are the Answers in Sight?” Nature Reviews. Genetics 9 (2). Nature Publishing Group: 102–14. doi:10.1038/nrg2290.
Forbes, Simon A, David Beare, Prasad Gunasekaran, Kenric Leung, Nidhi Bindal, Harry Boutselakis, Minjie Ding, et al. 2014. “COSMIC: Exploring the World’s Knowledge of Somatic Mutations in Human Cancer.” Nucleic Acids Research 43 (Database issue): D805–11. doi:10.1093/nar/gku1075.
Karolchik, Donna, Angela S Hinrichs, Terrence S Furey, Krishna M Roskin, Charles W Sugnet, David Haussler, and W James Kent. 2004. “The UCSC Table Browser Data Retrieval Tool.” Nucleic Acids Research 32 (Database issue): D493–96. doi:10.1093/nar/gkh103.
Lee, Seunggeung, Gonçalo R Abecasis, Michael Boehnke, and Xihong Lin. 2014. “Rare-Variant Association Analysis: Study Designs and Statistical Tests.” American Journal of Human Genetics 95 (1): 5–23. doi:10.1016/j.ajhg.2014.06.009.
Lee, Tong Ihn, and Richard A Young. 2013. “Transcriptional Regulation and Its Misregulation in Disease.” Cell 152 (6): 1237–51. doi:10.1016/j.cell.2013.02.014.
Manolio, Teri A, Francis S Collins, Nancy J Cox, David B Goldstein, Lucia A Hindorff, David J Hunter, Mark I McCarthy, et al. 2009. “Finding the Missing Heritability of Complex Diseases.” Nature 461 (7265): 747–53. http://www.ncbi.nlm.nih.gov/pubmed/19812666.
Martinez, Natalia J, and Albertha J M Walhout. 2009. “The Interplay between Transcription Factors and microRNAs in Genome-Scale Regulatory Networks.” BioEssays : News and Reviews in Molecular,

67
Cellular and Developmental Biology 31 (4): 435–45. doi:10.1002/bies.200800212.
Meyer, Michael J, Jishnu Das, Xiujuan Wang, and Haiyuan Yu. 2013. “INstruct: A Database of High-Quality 3D Structurally Resolved Protein Interactome Networks.” Bioinformatics (Oxford, England) 29 (12): 1577–79. doi:10.1093/bioinformatics/btt181.
Mitchell, Alex, Hsin-Yu Chang, Louise Daugherty, Matthew Fraser, Sarah Hunter, Rodrigo Lopez, Craig McAnulla, et al. 2014. “The InterPro Protein Families Database: The Classification Resource after 15 Years.” Nucleic Acids Research 43 (D1): D213–21. doi:10.1093/nar/gku1243.
Pasquinelli, A E, B J Reinhart, F Slack, M Q Martindale, M I Kuroda, B Maller, D C Hayward, et al. 2000. “Conservation of the Sequence and Temporal Expression of Let-7 Heterochronic Regulatory RNA.” Nature 408 (6808). Macmillian Magazines Ltd.: 86–89. doi:10.1038/35040556.
Purcell, Shaun, Benjamin Neale, Kathe Todd-Brown, Lori Thomas, Manuel A R Ferreira, David Bender, Julian Maller, et al. 2007. “PLINK: A Tool Set for Whole-Genome Association and Population-Based Linkage Analyses.” American Journal of Human Genetics 81 (3): 559–75. doi:10.1086/519795.
Ravasi, Timothy, Harukazu Suzuki, Carlo Vittorio Cannistraci, Shintaro Katayama, Vladimir B Bajic, Kai Tan, Altuna Akalin, et al. 2010. “An Atlas of Combinatorial Transcriptional Regulation in Mouse and Man.” Cell 140 (5): 744–52. doi:10.1016/j.cell.2010.01.044.
Schaefer, Ulf, Sebastian Schmeier, and Vladimir B Bajic. 2011. “TcoF-DB: Dragon Database for Human Transcription Co-Factors and Transcription Factor Interacting Proteins.” Nucleic Acids Research 39 (Database issue): D106–10. doi:10.1093/nar/gkq945.
Siepel, Adam, Gill Bejerano, Jakob S Pedersen, Angie S Hinrichs, Minmei Hou, Kate Rosenbloom, Hiram Clawson, et al. 2005. “Evolutionarily Conserved Elements in Vertebrate, Insect, Worm, and Yeast Genomes.” Genome Research 15 (8): 1034–50. doi:10.1101/gr.3715005.
Sokol, Nicholas S, and Victor Ambros. 2005. “Mesodermally Expressed Drosophila microRNA-1 Is Regulated by Twist and Is Required in Muscles during Larval Growth.” Genes & Development 19 (19): 2343–54. doi:10.1101/gad.1356105.
The 1000 Genomes Project Consortium, . 2012. “An Integrated Map of Genetic Variation from 1,092 Human Genomes.” Nature 491

68
(7422). Nature Publishing Group, a division of Macmillan Publishers Limited. All Rights Reserved.: 56–65. doi:10.1038/nature11632.
The UniProt Consortium. 2014. “UniProt: A Hub for Protein Information.” Nucleic Acids Research 43 (D1): D204–12. doi:10.1093/nar/gku989.
Yates, Andrew, Kathryn Beal, Stephen Keenan, William McLaren, Miguel Pignatelli, Graham R S Ritchie, Magali Ruffier, Kieron Taylor, Alessandro Vullo, and Paul Flicek. 2015. “The Ensembl REST API: Ensembl Data for Any Language.” Bioinformatics (Oxford, England) 31 (1): 143–45. doi:10.1093/bioinformatics/btu613.
Zhang, Hong-Mei, Teng Liu, Chun-Jie Liu, Shuangyang Song, Xiantong Zhang, Wei Liu, Haibo Jia, Yu Xue, and An-Yuan Guo. 2015. “AnimalTFDB 2.0: A Resource for Expression, Prediction and Functional Study of Animal Transcription Factors.” Nucleic Acids Research 43 (Database issue): D76–81. doi:10.1093/nar/gku887.

Chapter 4
DISCUSSION


71
Chapter 4
DISCUSSION This thesis is divided into two main topics that have been covered in the results section. First, it shows the development of a biological database that includes regulatory information from different sources together with a set of WS that speed up the retrieval of the data, as is reported in section 3.1. Second, it presents two approaches for the detection of putatively damaged regulatory elements or regulatory interactions in an expression or variant dataset, corresponding to sections 3.2 and 3.3.
4.1 Development of a high-‐performance biological database containing regulatory information
During the last years, the massive growth in data production generated by NGS technologies has originated an explosion in the number and size of biological databases. As explained in section 1.2.2, this increase has challenged researchers to join and integrate data from different resources, deal with different identifiers and go through scalability and performance issues. The project presented in section 3.1, called CellBase, proposes a new approach for data integration in a single database and introduced a new paradigm in the way biological information is queried through the use of RESTful WS.
Currently, RESTful WS are used by many other repositories to easily serve their information and have become the preferred option to build APIs. However, at the time CellBase was published, this

72
was not a widespread practise in the area of biological databases, what makes CellBase one of the pioneers in this field.
Since its publication, CellBase has been under a heavy development what has improved not only the quality and quantity of the biological data stored, but also the underlying implementation. Currently, after several releases, this is still an ongoing project with many users and active developers. CellBase is open-source and freely hosted at GitHub under the OpenCB project and contains more than 50,000 lines of code.
One of the biggest improvements carried out during the last year has been the migration from a MySQL relational database to a document oriented NoSQL database. We chose MongoDB as the implementation for the non-relational database. Some of the main advantages of NoSQL databases over relational databases are their high-performance, scalability, horizontal sharding and the flexibility. All more and more necessary nowadays with the increase of data and complexity and the need of distributed computing. This gain in scalability and performance has made easier the addition of new features to CellBase.
Users can now install a whole instance of CellBase in their servers with the newly developed command line interface (CLI). This CLI has been written in Java and allow users to download all the data source files, build and load the database. New RESTful WS have been added and others have been changed to improve the user experience and to accommodate new biological data queries. CellBase code is stored in GitHub and all these changes have been tracked in a GitHub wiki: https://github.com/opencb/cellbase/wiki. An updated list of the WS available can be found here: http://bioinfo.hpc.cam.ac.uk/cellbase/webservices/.
As mentioned before, CellBase has also increased the quantity and the quality of biological information. Today, data are available for 36 different species including some plants and bacteria. It contains

73
clinical information about genomic variants from ClinVar (Landrum et al., 2014) and systems biology information has been updated with data from Reactome (Croft et al., 2014) and IntAct (Kerrien et al., 2012). But one of the most important new features is the variant annotation functionality. Now, CellBase is able to annotate genomic variants using the information stored with a 99.9997% similarity with Ensembl VEP (McLaren et al., 2010), one of the most widely used annotators today, while being about 10x faster and adding some extra variant annotation such as genomic conservation scores, gene expression or protein variants and interactions.
The design of the API in CellBase makes the development of biological applications really easy what has powered its usage over time. It was initially used by other projects developed at Dr. Dopazo’s department such as Genome Maps (Medina et al., 2013) or Babelomics (Alonso et al., 2015). CellBase is also used by some other big projects, some of the most important include:
• The EMBL-EBI European Variation Archive (EVA), a new project that aims to store all public variation data for all species and where CellBase is used to query genome information and annotate variants.
• The International Cancer Genome Consortium (ICGC), whose aim is to obtain a comprehensive description of genomic, transcriptomic and epigenomic changes in more than 50 different tumor types and subtypes. They use CellBase to retrieve genome annotations and the sequences of reference genomes.
• Genomics England (GEL), also known as the 100,000 genomes project, that aims to sequence this amount of genomes from rare diseases and cancer patients. They also rely on CellBase to annotate variants.

74
CellBase is probably the achievement in this thesis with the biggest impact on the scientific community. Although we have put much effort on the design of the WS and the construction of the database, this work does not expect to replace other big repositories such as Ensembl. On the contrary, we highly depend Ensembl’s data to feed CellBase and our aim is to provide a faster and easier programmatic access to all their biological information and, at the same time, extend their data with other data sources.
4.2 Detection of putatively damaged regulatory elements and interactions in a genomic dataset
The introductory chapter of this thesis presents some of the main characters involved in gene regulation and how damaged regulatory mechanisms compromise the stability of healthy cells with negative consequences. It is therefore necessary the development of methodologies able to interpret genome-wide data for the identification of possible genomic alterations caused by an incorrect regulation. For this purpose, it is important the use of regulatory data stored in biological databases and its integration with genomic information. This integration can benefit research in systems biology for complex systems.
Following these guidelines, the work described in sections 3.2 and 3.3 proposes two methodologies able to interpret genomic information and put them in context of known regulatory information.
First, we suggest a method for the detection of candidate regulatory elements likely to be deregulated given a gene expression experiment. This methodology, called RENATO, is presented in the form of a web tool that facilitates the analysis for the user. In addition to the candidate regulatory elements, it offers a useful graphical representation of the significant results, what aids in the biological interpretation.

75
Second, we propose a different approach designed to prioritize regulatory genes and interactions taking into account the accumulation of genomic variants.
The most interesting aspect of this approach lies in the way that important genomic locations for gene regulation have been considered. In contrast to other methods that use genomic variants localized in the whole regulatory element or target, here we only take into count genomic variants affecting regions directly involved in a regulatory interaction. This adds an extra level of specificity in the analysis and benefits the prioritization. Besides, regions are aggregated considering gene regulatory partners, what solves the problem of the lack of statistical power in association due to the scattered distribution of genomic variants.
The study of variability in the essential regulatory regions in healthy and cancer datasets demonstrates the accuracy of these regions, but it also reveals the neutrality of part of the positions included in the analysis.


Chapter 5
CONCLUSIONS


79
Chapter 5
Conclusions The ultimate goal of this thesis was to provide tools and methodologies for the analysis of genomic information that aid in the identification of altered regulatory elements in disease or any other phenotype.
The main contributions of this thesis can be summarized as follows:
1. We developed CellBase, a new approach for data integration in a single database that introduced a new paradigm in the way biological information is queried through the use of RESTful WS.
• Regulatory information from different sources was included and integrated with other biological annotations.
• The usage of a document oriented NoSQL database has proven the scalability and efficiency of the design.
• RESTful WS have facilitated the programmatic retrieval of biological information and encouraged the development of applications.
2. We implemented RENATO, a method for the detection of candidate regulatory elements likely to be deregulated given a gene expression experiment.
• RENATO is available as a web application and provides a useful graphical representation of significant results.

80
3. We developed a methodology designed to prioritize regulatory genes and interactions based on the accumulation of genomic variants.
• The subset of essential regulatory regions considered in the analysis demonstrated a high accuracy in the determination of the functional impact of the variants.
• The methodology was implemented and is available as a standalone program. The implementation can detect a significant accumulation of variants in regulatory regions from either a case-control or a population experiment.

81
List of communications
1. Medina I, De Maria A, Bleda M, et al. VARIANT: Command Line, Web service and Web interface for fast and accurate functional characterization of variants found by Next-Generation Sequencing. Nucleic Acids Res. 2012.
2. Bleda M, Medina I, Alonso R, De Maria A, Salavert F, Dopazo J. Inferring the regulatory network behind a gene expression experiment. Nucleic Acids Res. 2012.
3. Bleda M, Tarraga J, De Maria A, et al. CellBase, a comprehensive collection of RESTful web services for retrieving relevant biological information from heterogeneous sources. Nucleic Acids Res. 2012;40(W1).
4. Fernández RM, Bleda M, Núñez-Torres R, et al. Four new loci associations discovered by pathway-based and network analyses of the genome-wide variability profile of Hirschsprung’s disease. Orphanet J Rare Dis. 2012;7(1):103.
5. González CY, Bleda M, Salavert F, Sánchez R, Dopazo J, Medina I. Multicore and cloud-based solutions for genomic variant analysis. In: Euro-Par 2012: Parallel Processing Workshops. Springer Berlin Heidelberg; 2013:273-284.
6. Medina I, Salavert F, Sanchez R, et al. Genome Maps, a new generation genome browser. Nucleic Acids Aesearch. 2013.
7. Fernández RM, Bleda M, Luzón-Toro B, et al. Pathways systematically associated to Hirschsprung’s disease. Orphanet J Rare Dis. 2013;8(1):187.

82
8. Luzon-Toro B, Bleda M, Fernandez R, et al. Systems biology approaches to the search for disease genes in Hirschsprung‘s disease. 2014.
9. Alonso R, Salavert F, Garcia-Garcia F, et al. Babelomics 5.0: functional interpretation for new generations of genomic data. Nucleic Acids Res. 2015;43(W1):W117-21. doi:10.1093/nar/gkv384.

83
Bibliography
Agarwal, V., Bell, G. W., Nam, J.-W., & Bartel, D. P. (2015). Predicting effective microRNA target sites in mammalian mRNAs. eLife, 4, e05005. doi:10.7554/eLife.05005
Alonso, R., Salavert, F., Garcia-Garcia, F., Carbonell-Caballero, J., Bleda, M., Garcia-Alonso, L., … Dopazo, J. (2015). Babelomics 5.0: functional interpretation for new generations of genomic data. Nucleic Acids Research, 43(W1), W117–21. doi:10.1093/nar/gkv384
Ambros, V. (2004). The functions of animal microRNAs. Nature, 431(7006), 350–5. doi:10.1038/nature02871
Ason, B., Darnell, D. K., Wittbrodt, B., Berezikov, E., Kloosterman, W. P., Wittbrodt, J., … Plasterk, R. H. A. (2006). Differences in vertebrate microRNA expression. Proceedings of the National Academy of Sciences of the United States of America, 103(39), 14385–9. doi:10.1073/pnas.0603529103
Backes, C., Keller, A., Kuentzer, J., Kneissl, B., Comtesse, N., Elnakady, Y. A., … Lenhof, H.-P. (2007). GeneTrail--advanced gene set enrichment analysis. Nucleic Acids Research, 35(Web Server issue), W186–92. doi:10.1093/nar/gkm323
Badis, G., Berger, M. F., Philippakis, A. A., Talukder, S., Gehrke, A. R., Jaeger, S. A., … Bulyk, M. L. (2009). Diversity and complexity in DNA recognition by transcription factors. Science (New York, N.Y.), 324(5935), 1720–3. doi:10.1126/science.1162327
Barabási, A.-L., & Albert, R. (1999). Emergence of scaling in random networks. Science (New York, N.Y.), 286(5439), 509–12
Barabási, A.-L., Gulbahce, N., & Loscalzo, J. (2011). Network medicine: a network-based approach to human disease. Nature Reviews. Genetics, 12(1), 56–68. doi:10.1038/nrg2918

84
Barabási, A.-L., & Oltvai, Z. N. (2004). Network biology: understanding the cell’s functional organization. Nature Reviews. Genetics, 5(2), 101–13. doi:10.1038/nrg1272
Barbieri, C. E., Baca, S. C., Lawrence, M. S., Demichelis, F., Blattner, M., Theurillat, J.-P., … Garraway, L. A. (2012). Exome sequencing identifies recurrent SPOP, FOXA1 and MED12 mutations in prostate cancer. Nature Genetics, 44(6), 685–9. doi:10.1038/ng.2279
Bartel, D. P. (2004). MicroRNAs: genomics, biogenesis, mechanism, and function. Cell, 116(2), 281–97.
Bartel, D. P. (2009). MicroRNAs: target recognition and regulatory functions. Cell, 136(2), 215–33. doi:10.1016/j.cell.2009.01.002
Baskerville, S., & Bartel, D. P. (2005). Microarray profiling of microRNAs reveals frequent coexpression with neighboring miRNAs and host genes. RNA (New York, N.Y.), 11(3), 241–7. doi:10.1261/rna.7240905
Basso, K., Margolin, A. A., Stolovitzky, G., Klein, U., Dalla-Favera, R., & Califano, A. (2005). Reverse engineering of regulatory networks in human B cells. Nature Genetics, 37(4), 382–90. doi:10.1038/ng1532
Basu, S., & Pan, W. (2011). Comparison of statistical tests for disease association with rare variants. Genetic Epidemiology, 35(7), 606–19. doi:10.1002/gepi.20609
Berman, H. M., Westbrook, J., Feng, Z., Gilliland, G., Bhat, T. N., Weissig, H., … Bourne, P. E. (2000). The Protein Data Bank. Nucleic Acids Research, 28(1), 235–242. doi:10.1093/nar/28.1.235
Bernstein, B. E., Stamatoyannopoulos, J. a, Costello, J. F., Ren, B., Milosavljevic, A., Meissner, A., … Thomson, J. a. (2010). The NIH Roadmap Epigenomics Mapping Consortium. Nature Biotechnology, 28(10), 1045–8. doi:10.1038/nbt1010-1045
Borchert, G. M., Lanier, W., & Davidson, B. L. (2006). RNA polymerase III transcribes human microRNAs. Nature Structural & Molecular Biology, 13(12), 1097–101. doi:10.1038/nsmb1167
Bornstein, B. J., Keating, S. M., Jouraku, A., & Hucka, M. (2008). LibSBML: an API library for SBML. Bioinformatics (Oxford, England), 24(6), 880–1. doi:10.1093/bioinformatics/btn051
Brazma, A., Krestyaninova, M., & Sarkans, U. (2006). Standards for systems biology. Nature Reviews. Genetics, 7(8), 593–605. doi:10.1038/nrg1922

85
Bushati, N., & Cohen, S. M. (2007). microRNA functions. Annual Review of Cell and Developmental Biology, 23, 175–205. doi:10.1146/annurev.cellbio.23.090506.123406
Butte, A. (2002). The use and analysis of microarray data. Nature Reviews. Drug Discovery, 1(12), 951–60. doi:10.1038/nrd961
Butte, A. J., & Kohane, I. S. (2000). Mutual information relevance networks: functional genomic clustering using pairwise entropy measurements. Pacific Symposium on Biocomputing. Pacific Symposium on Biocomputing, 418–29.
Cai, X., Hagedorn, C. H., & Cullen, B. R. (2004). Human microRNAs are processed from capped, polyadenylated transcripts that can also function as mRNAs. RNA (New York, N.Y.), 10(12), 1957–66. doi:10.1261/rna.7135204
Cedar, H. (1988). DNA methylation and gene activity. Cell, 53(1), 3–4. doi:10.1016/0092-8674(88)90479-5
Chen, K., & Rajewsky, N. (2007). The evolution of gene regulation by transcription factors and microRNAs. Nature Reviews. Genetics, 8(2), 93–103. doi:10.1038/nrg1990
Cheng, C., Alexander, R., Min, R., Leng, J., Yip, K. Y., Rozowsky, J., … Gerstein, M. (2012). Understanding transcriptional regulation by integrative analysis of transcription factor binding data. Genome Research, 22(9), 1658–67. doi:10.1101/gr.136838.111
Cheng, C., Yan, K.-K., Yip, K. Y., Rozowsky, J., Alexander, R., Shou, C., & Gerstein, M. (2011). A statistical framework for modeling gene expression using chromatin features and application to modENCODE datasets. Genome Biology, 12(2), R15. doi:10.1186/gb-2011-12-2-r15
Chu, Y., & Corey, D. R. (2012). RNA sequencing: platform selection, experimental design, and data interpretation. Nucleic Acid Therapeutics, 22(4), 271–4. doi:10.1089/nat.2012.0367
Croft, D., Mundo, A. F., Haw, R., Milacic, M., Weiser, J., Wu, G., … D’Eustachio, P. (2014). The Reactome pathway knowledgebase. Nucleic Acids Research, 42(Database issue), D472–7. doi:10.1093/nar/gkt1102
Cuellar, A. A., Lloyd, C. M., Nielsen, P. F., Bullivant, D. P., Nickerson, D. P., & Hunter, P. J. (2003). An Overview of CellML 1.1, a Biological Model Description Language. SIMULATION, 79(12), 740–747. doi:10.1177/0037549703040939

86
Cunningham, F., Amode, M. R., Barrell, D., Beal, K., Billis, K., Brent, S., … Flicek, P. (2014). Ensembl 2015. Nucleic Acids Research, 43(D1), D662–669. doi:10.1093/nar/gku1010
De Mendoza, A., Sebé-Pedrós, A., Šestak, M. S., Matejcic, M., Torruella, G., Domazet-Loso, T., & Ruiz-Trillo, I. (2013). Transcription factor evolution in eukaryotes and the assembly of the regulatory toolkit in multicellular lineages. Proceedings of the National Academy of Sciences of the United States of America, 110(50), E4858–66. doi:10.1073/pnas.1311818110
Demir, E., Cary, M. P., Paley, S., Fukuda, K., Lemer, C., Vastrik, I., … Bader, G. D. (2010). The BioPAX community standard for pathway data sharing. Nature Biotechnology, 28(9), 935–42. doi:10.1038/nbt.1666
Duarte, N. C., Becker, S. A., Jamshidi, N., Thiele, I., Mo, M. L., Vo, T. D., … Palsson, B. Ø. (2007). Global reconstruction of the human metabolic network based on genomic and bibliomic data. Proceedings of the National Academy of Sciences of the United States of America, 104(6), 1777–82. doi:10.1073/pnas.0610772104
Dweep, H., Sticht, C., Pandey, P., & Gretz, N. (2011). miRWalk--database: prediction of possible miRNA binding sites by “walking” the genes of three genomes. Journal of Biomedical Informatics, 44(5), 839–47. doi:10.1016/j.jbi.2011.05.002
Elnitski, L., Jin, V. X., Farnham, P. J., & Jones, S. J. M. (2006). Locating mammalian transcription factor binding sites: a survey of computational and experimental techniques. Genome Research, 16(12), 1455–64. doi:10.1101/gr.4140006
ENCODE Project Consortium, . (2012). An integrated encyclopedia of DNA elements in the human genome. Nature, 489(7414), 57–74. doi:10.1038/nature11247
Esquela-Kerscher, A., & Slack, F. J. (2006). Oncomirs - microRNAs with a role in cancer. Nature Reviews. Cancer, 6(4), 259–69. doi:10.1038/nrc1840
Filipowicz, W., Bhattacharyya, S. N., & Sonenberg, N. (2008). Mechanisms of post-transcriptional regulation by microRNAs: are the answers in sight? Nature Reviews. Genetics, 9(2), 102–14. doi:10.1038/nrg2290
Friedman, N. (2004). Inferring cellular networks using probabilistic graphical models. Science (New York, N.Y.), 303(5659), 799–805. doi:10.1126/science.1094068

87
Friedman, N., Linial, M., Nachman, I., & Pe’er, D. (2000). Using Bayesian networks to analyze expression data. Journal of Computational Biology : A Journal of Computational Molecular Cell Biology, 7(3-4), 601–20. doi:10.1089/106652700750050961
Furey, T. S. (2012). ChIP-seq and beyond: new and improved methodologies to detect and characterize protein-DNA interactions. Nature Reviews. Genetics, 13(12), 840–52. doi:10.1038/nrg3306
Furney, S. J., Higgins, D. G., Ouzounis, C. A., & López-Bigas, N. (2006). Structural and functional properties of genes involved in human cancer. BMC Genomics, 7(1), 3. doi:10.1186/1471-2164-7-3
Garfield, D., Haygood, R., Nielsen, W. J., & Wray, G. A. (2012). Population genetics of cis-regulatory sequences that operate during embryonic development in the sea urchin Strongylocentrotus purpuratus. Evolution & Development, 14(2), 152–67. doi:10.1111/j.1525-142X.2012.00532.x
Gerstein, M. B., Kundaje, A., Hariharan, M., Landt, S. G., Yan, K.-K., Cheng, C., … Snyder, M. (2012). Architecture of the human regulatory network derived from ENCODE data. Nature, 489(7414), 91–100. doi:10.1038/nature11245
Ghaemmaghami, S., Huh, W.-K., Bower, K., Howson, R. W., Belle, A., Dephoure, N., … Weissman, J. S. (2003). Global analysis of protein expression in yeast. Nature, 425(6959), 737–41. doi:10.1038/nature02046
Gray, K. A., Yates, B., Seal, R. L., Wright, M. W., & Bruford, E. A. (2015). Genenames.org: the HGNC resources in 2015. Nucleic Acids Research, 43(Database issue), D1079–85. doi:10.1093/nar/gku1071
Han, H., Shim, H., Shin, D., Shim, J. E., Ko, Y., Shin, J., … Lee, I. (2015). TRRUST: a reference database of human transcriptional regulatory interactions. Scientific Reports, 5, 11432. doi:10.1038/srep11432
Hartemink, A. J., Gifford, D. K., Jaakkola, T. S., & Young, R. A. (2001). Using graphical models and genomic expression data to statistically validate models of genetic regulatory networks. Pacific Symposium on Biocomputing. Pacific Symposium on Biocomputing, 422–33.
Hartwell, L. H., Hopfield, J. J., Leibler, S., Murray, A. W., & others. (1999). From molecular to modular cell biology. Nature, 402(6761), 47.
He, L., & Hannon, G. J. (2004). MicroRNAs: small RNAs with a big role in gene regulation. Nature Reviews. Genetics, 5(7), 522–31. doi:10.1038/nrg1379

88
Hsu, S.-D., Chu, C.-H., Tsou, A.-P., Chen, S.-J., Chen, H.-C., Hsu, P. W.-C., … Huang, H.-D. (2008). miRNAMap 2.0: genomic maps of microRNAs in metazoan genomes. Nucleic Acids Research, 36(Database issue), D165–9. doi:10.1093/nar/gkm1012
Hsu, S.-D., Tseng, Y.-T., Shrestha, S., Lin, Y.-L., Khaleel, A., Chou, C.-H., … Huang, H.-D. (2014). miRTarBase update 2014: an information resource for experimentally validated miRNA-target interactions. Nucleic Acids Research, 42(Database issue), D78–85. doi:10.1093/nar/gkt1266
Huang, F. W., Hodis, E., Xu, M. J., Kryukov, G. V, Chin, L., & Garraway, L. A. (2013). Highly recurrent TERT promoter mutations in human melanoma. Science (New York, N.Y.), 339(6122), 957–9. doi:10.1126/science.1229259
Ideker, T., Galitski, T., & Hood, L. (2003). A NEW APPROACH TO DECODING LIFE: Systems Biology.
Jenuwein, T., & Allis, C. D. (2001). Translating the histone code. Science (New York, N.Y.), 293(5532), 1074–80. doi:10.1126/science.1063127
Jiang, X. (2014). Harnessing the immune system for the treatment of breast cancer. Journal of Zhejiang University. Science. B, 15(1), 1–15. doi:10.1631/jzus.B1300264
John, B., Enright, A. J., Aravin, A., Tuschl, T., Sander, C., & Marks, D. S. (2004). Human MicroRNA targets. PLoS Biology, 2(11), e363. doi:10.1371/journal.pbio.0020363
Jolma, A., Yan, J., Whitington, T., Toivonen, J., Nitta, K. R., Rastas, P., … Taipale, J. (2013). DNA-binding specificities of human transcription factors. Cell, 152(1-2), 327–39. doi:10.1016/j.cell.2012.12.009
Joshi-Tope, G., Gillespie, M., Vastrik, I., D’Eustachio, P., Schmidt, E., de Bono, B., … others. (2005). Reactome: a knowledgebase of biological pathways. Nucleic Acids Research, 33(suppl 1), D428.
Kasowski, M., Grubert, F., Heffelfinger, C., Hariharan, M., Asabere, A., Waszak, S. M., … Snyder, M. (2010). Variation in transcription factor binding among humans. Science (New York, N.Y.), 328(5975), 232–5. doi:10.1126/science.1183621
Kerrien, S., Aranda, B., Breuza, L., Bridge, A., Broackes-Carter, F., Chen, C., … Hermjakob, H. (2012). The IntAct molecular interaction database in 2012. Nucleic Acids Research, 40(Database issue), D841–6. doi:10.1093/nar/gkr1088

89
Kertesz, M., Iovino, N., Unnerstall, U., Gaul, U., & Segal, E. (2007). The role of site accessibility in microRNA target recognition. Nature Genetics, 39(10), 1278–84. doi:10.1038/ng2135
Khvorova, A., Reynolds, A., & Jayasena, S. D. (2003). Functional siRNAs and miRNAs Exhibit Strand Bias. Cell, 115(2), 209–216. doi:10.1016/S0092-8674(03)00801-8
Kim, V. N. (2005). MicroRNA biogenesis: coordinated cropping and dicing. Nature Reviews. Molecular Cell Biology, 6(5), 376–85. doi:10.1038/nrm1644
Klipp, E., Liebermeister, W., Helbig, A., Kowald, A., & Schaber, J. (2007). Systems biology standards--the community speaks. Nature Biotechnology, 25(4), 390–1. doi:10.1038/nbt0407-390
Kozomara, A., & Griffiths-Jones, S. (2014). miRBase: annotating high confidence microRNAs using deep sequencing data. Nucleic Acids Research, 42(Database issue), D68–73. doi:10.1093/nar/gkt1181
Krek, A., Grün, D., Poy, M. N., Wolf, R., Rosenberg, L., Epstein, E. J., … Rajewsky, N. (2005). Combinatorial microRNA target predictions. Nature Genetics, 37(5), 495–500. doi:10.1038/ng1536
Landrum, M. J., Lee, J. M., Riley, G. R., Jang, W., Rubinstein, W. S., Church, D. M., & Maglott, D. R. (2014). ClinVar: public archive of relationships among sequence variation and human phenotype. Nucleic Acids Research, 42(Database issue), D980–5. doi:10.1093/nar/gkt1113
Latchman, D. S. (2001). Transcription factors: bound to activate or repress. Trends in Biochemical Sciences, 26(4), 211–213. doi:10.1016/S0968-0004(01)01812-6
Law, V., Knox, C., Djoumbou, Y., Jewison, T., Guo, A. C., Liu, Y., … Wishart, D. S. (2014). DrugBank 4.0: shedding new light on drug metabolism. Nucleic Acids Research, 42(Database issue), D1091–7. doi:10.1093/nar/gkt1068
Lee, S., Abecasis, G. R., Boehnke, M., & Lin, X. (2014). Rare-Variant Association Analysis: Study Designs and Statistical Tests. American Journal of Human Genetics, 95(1), 5–23. doi:10.1016/j.ajhg.2014.06.009
Lee, T. I., & Young, R. A. (2013). Transcriptional regulation and its misregulation in disease. Cell, 152(6), 1237–51. doi:10.1016/j.cell.2013.02.014

90
Lee, W.-P., & Tzou, W.-S. (2009). Computational methods for discovering gene networks from expression data. Briefings in Bioinformatics, 10(4), 408–23. doi:10.1093/bib/bbp028
Lee, Y., Kim, M., Han, J., Yeom, K.-H., Lee, S., Baek, S. H., & Kim, V. N. (2004). MicroRNA genes are transcribed by RNA polymerase II. The EMBO Journal, 23(20), 4051–60. doi:10.1038/sj.emboj.7600385
Lewin, B. (2008). Genes IX (Ninth edit.). Jones and Bartlett Publishers Sudbury , MA, USA.
Lewis, B. P., Burge, C. B., & Bartel, D. P. (2005). Conserved seed pairing, often flanked by adenosines, indicates that thousands of human genes are microRNA targets. Cell, 120(1), 15–20. doi:10.1016/j.cell.2004.12.035
Li, B., Carey, M., & Workman, J. L. (2007). The role of chromatin during transcription. Cell, 128(4), 707–19. doi:10.1016/j.cell.2007.01.015
Licata, L., Briganti, L., Peluso, D., Perfetto, L., Iannuccelli, M., Galeota, E., … Cesareni, G. (2012). MINT, the molecular interaction database: 2012 update. Nucleic Acids Research, 40(Database issue), D857–61. doi:10.1093/nar/gkr930
Littlewood, T. D., Kreuzaler, P., & Evan, G. I. (2012). All things to all people. Cell, 151(1), 11–3. doi:10.1016/j.cell.2012.09.006
Liu, G., Gramling, S., Munoz, D., Cheng, D., Azad, A. K., Mirshams, M., … Reisman, D. (2011). Two novel BRM insertion promoter sequence variants are associated with loss of BRM expression and lung cancer risk. Oncogene, 30(29), 3295–304. doi:10.1038/onc.2011.81
Lubbe, S. J., Pittman, A. M., Olver, B., Lloyd, A., Vijayakrishnan, J., Naranjo, S., … Houlston, R. S. (2012). The 14q22.2 colorectal cancer variant rs4444235 shows cis-acting regulation of BMP4. Oncogene, 31(33), 3777–84. doi:10.1038/onc.2011.564
Ma, H., Sorokin, A., Mazein, A., Selkov, A., Selkov, E., Demin, O., & Goryanin, I. (2007). The Edinburgh human metabolic network reconstruction and its functional analysis. Molecular Systems Biology, 3(1), 135. doi:10.1038/msb4100177
Majewski, J., & Pastinen, T. (2011). The study of eQTL variations by RNA-seq: from SNPs to phenotypes. Trends in Genetics : TIG, 27(2), 72–9. doi:10.1016/j.tig.2010.10.006

91
Manolio, T. A. (2010). Genomewide association studies and assessment of the risk of disease. The New England Journal of Medicine, 363(2), 166–76. doi:10.1056/NEJMra0905980
Manolio, T. A., Collins, F. S., Cox, N. J., Goldstein, D. B., Hindorff, L. A., Hunter, D. J., … Visscher, P. M. (2009). Finding the missing heritability of complex diseases. Nature, 461(7265), 747–53. doi:10.1038/nature08494
Margulies, M., Egholm, M., Altman, W. E., Attiya, S., Bader, J. S., Bemben, L. A., … Rothberg, J. M. (2005). Genome sequencing in microfabricated high-density picolitre reactors. Nature, 437(7057), 376–80. doi:10.1038/nature03959
Mathelier, A., Zhao, X., Zhang, A. W., Parcy, F., Worsley-Hunt, R., Arenillas, D. J., … Wasserman, W. W. (2014). JASPAR 2014: an extensively expanded and updated open-access database of transcription factor binding profiles. Nucleic Acids Research, 42(Database issue), D142–7. doi:10.1093/nar/gkt997
Matys, V., Kel-Margoulis, O. V, Fricke, E., Liebich, I., Land, S., Barre-Dirrie, A., … Wingender, E. (2006). TRANSFAC and its module TRANSCompel: transcriptional gene regulation in eukaryotes. Nucleic Acids Research, 34(Database issue), D108–10. doi:10.1093/nar/gkj143
McGhee, J. D., & Ginder, G. D. (1979). Specific DNA methylation sites in the vicinity of the chicken beta-globin genes. Nature, 280(5721), 419–20.
McLaren, W., Pritchard, B., Rios, D., Chen, Y., Flicek, P., & Cunningham, F. (2010). Deriving the consequences of genomic variants with the Ensembl API and SNP Effect Predictor. Bioinformatics (Oxford, England), 26(16), 2069–70. doi:10.1093/bioinformatics/btq330
Medina, I., Salavert, F., Sanchez, R., de Maria, A., Alonso, R., Escobar, P., … Dopazo, J. (2013). Genome Maps, a new generation genome browser. Nucleic Acids Research, 41(Web Server issue), W41–6. doi:10.1093/nar/gkt530
Miranda, K. C., Huynh, T., Tay, Y., Ang, Y.-S., Tam, W.-L., Thomson, A. M., … Rigoutsos, I. (2006). A pattern-based method for the identification of MicroRNA binding sites and their corresponding heteroduplexes. Cell, 126(6), 1203–17. doi:10.1016/j.cell.2006.07.031
Mitchell, A., Chang, H.-Y., Daugherty, L., Fraser, M., Hunter, S., Lopez, R., … Finn, R. D. (2014). The InterPro protein families database:

92
the classification resource after 15 years. Nucleic Acids Research, 43(D1), D213–221. doi:10.1093/nar/gku1243
Montgomery, S. B., Griffith, O. L., Sleumer, M. C., Bergman, C. M., Bilenky, M., Pleasance, E. D., … Jones, S. J. M. (2006). ORegAnno: an open access database and curation system for literature-derived promoters, transcription factor binding sites and regulatory variation. Bioinformatics (Oxford, England), 22(5), 637–40. doi:10.1093/bioinformatics/btk027
Morris, Q., Bulyk, M. L., & Hughes, T. R. (2011). Jury remains out on simple models of transcription factor specificity. Nature Biotechnology, 29(6), 483–4. doi:10.1038/nbt.1892
Niwa, R., & Slack, F. J. (2007). The evolution of animal microRNA function. Current Opinion in Genetics & Development, 17(2), 145–50. doi:10.1016/j.gde.2007.02.004
Ogata, H., Goto, S., Sato, K., Fujibuchi, W., Bono, H., & Kanehisa, M. (1999). KEGG: Kyoto encyclopedia of genes and genomes. Nucleic Acids Research, 27(1), 29.
Okamura, K., Phillips, M. D., Tyler, D. M., Duan, H., Chou, Y., & Lai, E. C. (2008). The regulatory activity of microRNA* species has substantial influence on microRNA and 3’ UTR evolution. Nature Structural & Molecular Biology, 15(4), 354–63. doi:10.1038/nsmb.1409
Ouyang, Z., Zhou, Q., & Wong, W. H. (2009). ChIP-Seq of transcription factors predicts absolute and differential gene expression in embryonic stem cells. Proceedings of the National Academy of Sciences of the United States of America, 106(51), 21521–6. doi:10.1073/pnas.0904863106
Park, P. J. (2009). ChIP-seq: advantages and challenges of a maturing technology. Nature Reviews. Genetics, 10(10), 669–80. doi:10.1038/nrg2641
Pasquinelli, A. E., Reinhart, B. J., Slack, F., Martindale, M. Q., Kuroda, M. I., Maller, B., … Ruvkun, G. (2000). Conservation of the sequence and temporal expression of let-7 heterochronic regulatory RNA. Nature, 408(6808), 86–9. doi:10.1038/35040556
Pinero, J., Queralt-Rosinach, N., Bravo, A., Deu-Pons, J., Bauer-Mehren, A., Baron, M., … Furlong, L. I. (2015). DisGeNET: a discovery platform for the dynamical exploration of human diseases and their genes. Database, 2015(0), bav028–bav028. doi:10.1093/database/bav028

93
Portales-Casamar, E., Arenillas, D., Lim, J., Swanson, M. I., Jiang, S., McCallum, A., … Wasserman, W. W. (2009). The PAZAR database of gene regulatory information coupled to the ORCA toolkit for the study of regulatory sequences. Nucleic Acids Research, 37(Database issue), D54–60. doi:10.1093/nar/gkn783
Qu, H., & Fang, X. (2013). A brief review on the Human Encyclopedia of DNA Elements (ENCODE) project. Genomics, Proteomics & Bioinformatics, 11(3), 135–41. doi:10.1016/j.gpb.2013.05.001
Ravasi, T., Suzuki, H., Cannistraci, C. V., Katayama, S., Bajic, V. B., Tan, K., … Hayashizaki, Y. (2010). An atlas of combinatorial transcriptional regulation in mouse and man. Cell, 140(5), 744–52. doi:10.1016/j.cell.2010.01.044
Rodriguez, A., Griffiths-Jones, S., Ashurst, J. L., & Bradley, A. (2004). Identification of mammalian microRNA host genes and transcription units. Genome Research, 14(10A), 1902–10. doi:10.1101/gr.2722704
Rosenbloom, K. R., Armstrong, J., Barber, G. P., Casper, J., Clawson, H., Diekhans, M., … Kent, W. J. (2014). The UCSC Genome Browser database: 2015 update. Nucleic Acids Research, 43(D1), D670–681. doi:10.1093/nar/gku1177
Sachs, K., Perez, O., Pe’er, D., Lauffenburger, D. A., & Nolan, G. P. (2005). Causal protein-signaling networks derived from multiparameter single-cell data. Science (New York, N.Y.), 308(5721), 523–9. doi:10.1126/science.1105809
Saini, H. K., Griffiths-Jones, S., & Enright, A. J. (2007). Genomic analysis of human microRNA transcripts. Proceedings of the National Academy of Sciences of the United States of America, 104(45), 17719–24. doi:10.1073/pnas.0703890104
Schlitt, T., & Brazma, A. (2007). Current approaches to gene regulatory network modelling. BMC Bioinformatics, 8 Suppl 6(Suppl 6), S9. doi:10.1186/1471-2105-8-S6-S9
Shendure, J., & Ji, H. (2008). Next-generation DNA sequencing. Nature Biotechnology, 26(10), 1135–45. doi:10.1038/nbt1486
Shendure, J., Porreca, G. J., Reppas, N. B., Lin, X., McCutcheon, J. P., Rosenbaum, A. M., … Church, G. M. (2005). Accurate multiplex polony sequencing of an evolved bacterial genome. Science (New York, N.Y.), 309(5741), 1728–32. doi:10.1126/science.1117389
Shyr, D., & Liu, Q. (2013). Next generation sequencing in cancer research and clinical application. Biological Procedures Online, 15(1), 4. doi:10.1186/1480-9222-15-4
94
Sokol, N. S., & Ambros, V. (2005). Mesodermally expressed Drosophila microRNA-1 is regulated by Twist and is required in muscles during larval growth. Genes & Development, 19(19), 2343–54. doi:10.1101/gad.1356105
Steuer, R., Kurths, J., Daub, C. O., Weise, J., & Selbig, J. (2002). The mutual information: detecting and evaluating dependencies between variables. Bioinformatics (Oxford, England), 18 Suppl 2, S231–40. Retrieved from http://www.ncbi.nlm.nih.gov/pubmed/12386007
Szklarczyk, D., Franceschini, A., Wyder, S., Forslund, K., Heller, D., Huerta-Cepas, J., … von Mering, C. (2015). STRING v10: protein-protein interaction networks, integrated over the tree of life. Nucleic Acids Research, 43(Database issue), D447–52. doi:10.1093/nar/gku1003
Tavazoie, S., Hughes, J. D., Campbell, M. J., Cho, R. J., & Church, G. M. (1999). Systematic determination of genetic network architecture. Nature Genetics, 22(3), 281–5. doi:10.1038/10343
The 1000 Genomes Project Consortium, . (2012). An integrated map of genetic variation from 1,092 human genomes. Nature, 491(7422), 56–65. doi:10.1038/nature11632
The UniProt Consortium. (2014). UniProt: a hub for protein information. Nucleic Acids Research, 43(D1), D204–212. doi:10.1093/nar/gku989
Uetz, P., Giot, L., Cagney, G., Mansfield, T. A., Judson, R. S., Knight, J. R., … Rothberg, J. M. (2000). A comprehensive analysis of protein-protein interactions in Saccharomyces cerevisiae. Nature, 403(6770), 623–7. doi:10.1038/35001009
Vaquerizas, J. M., Kummerfeld, S. K., Teichmann, S. A., & Luscombe, N. M. (2009). A census of human transcription factors: function, expression and evolution. Nature Reviews. Genetics, 10(4), 252–63. doi:10.1038/nrg2538
Vergoulis, T., Vlachos, I. S., Alexiou, P., Georgakilas, G., Maragkakis, M., Reczko, M., … Hatzigeorgiou, A. G. (2012). TarBase 6.0: capturing the exponential growth of miRNA targets with experimental support. Nucleic Acids Research, 40(Database issue), D222–9. doi:10.1093/nar/gkr1161
Walhout, A. J. M. (2006). Unraveling transcription regulatory networks by protein-DNA and protein-protein interaction mapping. Genome Research, 16(12), 1445–54. doi:10.1101/gr.5321506
Wang, J., Zhuang, J., Iyer, S., Lin, X., Whitfield, T. W., Greven, M. C., … Weng, Z. (2012). Sequence features and chromatin structure

95
around the genomic regions bound by 119 human transcription factors. Genome Research, 22(9), 1798–812. doi:10.1101/gr.139105.112
Wang, S., Sun, H., Ma, J., Zang, C., Wang, C., Wang, J., … Liu, X. S. (2013). Target analysis by integration of transcriptome and ChIP-seq data with BETA. Nature Protocols, 8(12), 2502–15. doi:10.1038/nprot.2013.150
Wang, Z., Gerstein, M., & Snyder, M. (2009). RNA-Seq: a revolutionary tool for transcriptomics. Nature Reviews. Genetics, 10(1), 57–63. doi:10.1038/nrg2484
Wasserman, W. W., & Sandelin, A. (2004). Applied bioinformatics for the identification of regulatory elements. Nature Reviews. Genetics, 5(4), 276–87. doi:10.1038/nrg1315
Weinstein, J. N., Collisson, E. A., Mills, G. B., Shaw, K. R. M., Ozenberger, B. A., Ellrott, K., … Stuart, J. M. (2013). The Cancer Genome Atlas Pan-Cancer analysis project. Nature Genetics, 45(10), 1113–20. doi:10.1038/ng.2764
Whitfield, T. W., Wang, J., Collins, P. J., Partridge, E. C., Aldred, S. F., Trinklein, N. D., … Weng, Z. (2012). Functional analysis of transcription factor binding sites in human promoters. Genome Biology, 13(9), R50. doi:10.1186/gb-2012-13-9-r50
Wingender, E., Schoeps, T., & Donitz, J. (2012). TFClass: an expandable hierarchical classification of human transcription factors. Nucleic Acids Research, 41(D1), D165–D170. doi:10.1093/nar/gks1123
Wu, M. C., Lee, S., Cai, T., Li, Y., Boehnke, M., & Lin, X. (2011). Rare-variant association testing for sequencing data with the sequence kernel association test. American Journal of Human Genetics, 89(1), 82–93. doi:10.1016/j.ajhg.2011.05.029
Xiao, F., Zuo, Z., Cai, G., Kang, S., Gao, X., & Li, T. (2009). miRecords: an integrated resource for microRNA-target interactions. Nucleic Acids Research, 37(Database issue), D105–10. doi:10.1093/nar/gkn851
Yates, A., Beal, K., Keenan, S., McLaren, W., Pignatelli, M., Ritchie, G. R. S., … Flicek, P. (2015). The Ensembl REST API: Ensembl Data for Any Language. Bioinformatics (Oxford, England), 31(1), 143–5. doi:10.1093/bioinformatics/btu613
Zhao, Y., & Stormo, G. D. (2011). Quantitative analysis demonstrates most transcription factors require only simple models of specificity. Nature Biotechnology, 29(6), 480–3. doi:10.1038/nbt.1893

96
Zheng, W., Gianoulis, T. A., Karczewski, K. J., Zhao, H., & Snyder, M. (2011). Regulatory variation within and between species. Annual Review of Genomics and Human Genetics, 12, 327–46. doi:10.1146/annurev-genom-082908-150139
Zheng, W., Zhao, H., Mancera, E., Steinmetz, L. M., & Snyder, M. (2010). Genetic analysis of variation in transcription factor binding in yeast. Nature, 464(7292), 1187–91. doi:10.1038/nature08934