Algorithm for haplotype resolution and block partitioning for partial XOR-genotype data
9
Algorithm for haplotype resolution and block partitioning for partial XOR-genotype data Nadezhda Sazonova a, * , Edward Sazonov a , E. James Harner b a Department of Electrical and Computer Engineering, Clarkson University, Potsdam, NY 13676, USA b Department of Statistics, West Virginia University, Morgantown, WV 26505, USA article info Article history: Received 10 November 2008 Available online 20 August 2009 Keywords: XOR-haplotyping XOR-genotype Haplotype Haplotype block Genetic algorithm abstract Problems of haplotyping and block partitioning have been extensively studied with regard to the regular genotype data, but more cost-efficient data called XOR-genotypes remain under-investigated. Previous studies developed methods for haplotyping of short-sequence partial XOR-genotypes. In this paper we propose a new algorithm that performs haplotyping of long-range partial XOR-genotype data with pos- sibility of missing entries, and in addition simultaneously finds the block structure for the given data. Our method is implemented as a fast and practical algorithm. We also investigate the effect of the percentage of fully genotyped individuals in a sample on the accuracy of results with and without the missing data. The algorithm is validated by testing on the HapMap data. Obtained results show good prediction rates both for samples with and without missing data. The accuracy of prediction of XOR sites is not signifi- cantly affected by the presence of 10% or less missing data. Ó 2009 Elsevier Inc. All rights reserved. 1. Introduction Single nucleotide polymorphisms (SNPs) are the most common type of mutations expressed by changes in a single position within DNA sequence, which are observed in at least 1% of the population. Most SNPs are bi-allelic meaning that they are defined by only two possible nucleotides (alleles) at their specific positions. Variation in the human genome underlies the differentiating features present in the population. Humans are diploid organisms, i.e., each chro- mosome is made of two distinct copies which are separately called haplotypes. A pair of haplotypes (inherited from the mother and the father) is a result of genotype decomposition and is considered to be a genotype with a known phase, i.e., genotypes with alleles assigned to one of the two chromosomes. Knowledge of haplotypes decomposition of any genotype is ex- tremely valuable in the large-scale analysis of complex human dis- eases, which are affected by combinations of multiple linked mutations and a set of environmental factors. For this reason, hap- lotype-based analysis has proven to be much more powerful in mapping complex human diseases than single-locus (SNP) based studies. Available molecular technologies do not allow cheap and efficient haplotype sequencing (also called haplotyping or haplo- type resolution). Thus, the problem of haplotyping heavily relies on computational methods. Recent studies have demonstrated that the human genome has discrete block structures with limited hap- lotype diversity within each block. Using haplotypes partitioned into blocks allows yet another significant improvement in the pro- cess of mapping complex human diseases since it narrows the study of the genotype (or a pair of haplotypes) to the analysis of a specific region. There has been significant effort done in developing haplotyp- ing and block partitioning methods [1–15], which resulted in fast and efficient algorithms. The demand for a new type of genotype data characterized by some degree of incompleteness has appeared more recently. This type of data can be produced in an extremely cost-efficient way. In particular, there is a number of less expensive molecular technologies (such as Denaturing High-Performance Liquid Chromatography (DHPLC) [16]) that produce genotypes with partial information with regard to SNPs: they can only distin- guish if a particular SNP position is heterozygous or homozygous for a given individual, but provide no information regarding the type of allele (out of the two possible) it carries at each position. This DHPLC method permits significant reduction of the cost of genotyping compared to conventionally used genotyping methods. Genotypes produced as a result of such partial genotyping technol- ogies are called XOR-genotypes. Efficient methods of haplotyping and block partitioning for XOR-genotypes are still under investiga- tion. Thus, it is essential to develop effective computational meth- ods that can use XOR-genotypes for haplotyping and block partitioning. Up to date there exists only one strategy [17–19] that was developed to solve the problem of XOR-haplotyping. The core of 1532-0464/$ - see front matter Ó 2009 Elsevier Inc. All rights reserved. doi:10.1016/j.jbi.2009.08.009 * Corresponding author. Address: Department of Electrical and Computer Engineering, Clarkson University, 8 Clarkson Ave., Potsdam, NY 13699, USA. E-mail address: [email protected] (N. Sazonova). Journal of Biomedical Informatics 43 (2010) 51–59 Contents lists available at ScienceDirect Journal of Biomedical Informatics journal homepage: www.elsevier.com/locate/yjbin
-
Upload
independent -
Category
Documents
-
view
2 -
download
0
Transcript of Algorithm for haplotype resolution and block partitioning for partial XOR-genotype data

Journal of Biomedical Informatics 43 (2010) 51–59
Contents lists available at ScienceDirect
Journal of Biomedical Informatics
journal homepage: www.elsevier .com/locate /y jb in
Algorithm for haplotype resolution and block partitioning for partialXOR-genotype data
Nadezhda Sazonova a,*, Edward Sazonov a, E. James Harner b
a Department of Electrical and Computer Engineering, Clarkson University, Potsdam, NY 13676, USAb Department of Statistics, West Virginia University, Morgantown, WV 26505, USA
a r t i c l e i n f o
Article history:Received 10 November 2008Available online 20 August 2009
Keywords:XOR-haplotypingXOR-genotypeHaplotypeHaplotype blockGenetic algorithm
1532-0464/$ - see front matter � 2009 Elsevier Inc. Adoi:10.1016/j.jbi.2009.08.009
* Corresponding author. Address: Department oEngineering, Clarkson University, 8 Clarkson Ave., Po
E-mail address: [email protected] (N. Sazono
a b s t r a c t
Problems of haplotyping and block partitioning have been extensively studied with regard to the regulargenotype data, but more cost-efficient data called XOR-genotypes remain under-investigated. Previousstudies developed methods for haplotyping of short-sequence partial XOR-genotypes. In this paper wepropose a new algorithm that performs haplotyping of long-range partial XOR-genotype data with pos-sibility of missing entries, and in addition simultaneously finds the block structure for the given data. Ourmethod is implemented as a fast and practical algorithm. We also investigate the effect of the percentageof fully genotyped individuals in a sample on the accuracy of results with and without the missing data.The algorithm is validated by testing on the HapMap data. Obtained results show good prediction ratesboth for samples with and without missing data. The accuracy of prediction of XOR sites is not signifi-cantly affected by the presence of 10% or less missing data.
� 2009 Elsevier Inc. All rights reserved.
1. Introduction
Single nucleotide polymorphisms (SNPs) are the most commontype of mutations expressed by changes in a single position withinDNA sequence, which are observed in at least 1% of the population.Most SNPs are bi-allelic meaning that they are defined by only twopossible nucleotides (alleles) at their specific positions. Variation inthe human genome underlies the differentiating features presentin the population. Humans are diploid organisms, i.e., each chro-mosome is made of two distinct copies which are separately calledhaplotypes. A pair of haplotypes (inherited from the mother andthe father) is a result of genotype decomposition and is consideredto be a genotype with a known phase, i.e., genotypes with allelesassigned to one of the two chromosomes.
Knowledge of haplotypes decomposition of any genotype is ex-tremely valuable in the large-scale analysis of complex human dis-eases, which are affected by combinations of multiple linkedmutations and a set of environmental factors. For this reason, hap-lotype-based analysis has proven to be much more powerful inmapping complex human diseases than single-locus (SNP) basedstudies. Available molecular technologies do not allow cheap andefficient haplotype sequencing (also called haplotyping or haplo-type resolution). Thus, the problem of haplotyping heavily relieson computational methods. Recent studies have demonstrated that
ll rights reserved.
f Electrical and Computertsdam, NY 13699, USA.
va).
the human genome has discrete block structures with limited hap-lotype diversity within each block. Using haplotypes partitionedinto blocks allows yet another significant improvement in the pro-cess of mapping complex human diseases since it narrows thestudy of the genotype (or a pair of haplotypes) to the analysis ofa specific region.
There has been significant effort done in developing haplotyp-ing and block partitioning methods [1–15], which resulted in fastand efficient algorithms. The demand for a new type of genotypedata characterized by some degree of incompleteness has appearedmore recently. This type of data can be produced in an extremelycost-efficient way. In particular, there is a number of less expensivemolecular technologies (such as Denaturing High-PerformanceLiquid Chromatography (DHPLC) [16]) that produce genotypeswith partial information with regard to SNPs: they can only distin-guish if a particular SNP position is heterozygous or homozygousfor a given individual, but provide no information regarding thetype of allele (out of the two possible) it carries at each position.This DHPLC method permits significant reduction of the cost ofgenotyping compared to conventionally used genotyping methods.Genotypes produced as a result of such partial genotyping technol-ogies are called XOR-genotypes. Efficient methods of haplotypingand block partitioning for XOR-genotypes are still under investiga-tion. Thus, it is essential to develop effective computational meth-ods that can use XOR-genotypes for haplotyping and blockpartitioning.
Up to date there exists only one strategy [17–19] that wasdeveloped to solve the problem of XOR-haplotyping. The core of

52 N. Sazonova et al. / Journal of Biomedical Informatics 43 (2010) 51–59
this strategy is the construction of the perfect phylogeny tree outof collection of XOR-genotypes (using GREAL – an implementationof the algorithm for Graph Realization). The constructed phyloge-netic tree is then used to select few individuals which need to befully genotyped. The phylogenetic tree and selected fully geno-typed individuals are then applied to the rest of the sample tomake complete haplotype inference. This algorithm also requiresavailability of full genotypes for completely homogeneous individ-uals. Although this strategy requires at most three heterogeneousindividuals to be fully genotyped, there is still room for furtherimprovement. First, the Perfect Phylogeny assumption used inGREAL is only valid within short sequences of SNPs or blocks,which usually are limited by 30 SNPs [18] and almost never exceedsize of 100 SNPs. Thus, GREAL is not well suited for the long-rangegenotype data. Second, a special selection of individuals to be fullygenotyped is performed as one of the steps. Thus, no arbitrarilymixed collections of XOR and full genotypes are assumed, whichmay be required to be practical in real world applications. Third,the strategy was implemented as several steps that need to be con-ducted separately: application of GREAL, introduction of the fullygenotyped sequences, resolution of the rest of the sample. A directXOR-genotypes-to-haplotypes algorithm would be preferred forpractical applications. Forth, the utility of the XOR-haplotypingcould be further improved by taking into consideration missingdata that is often an unavoidable component of the real datasamples.
This paper describes a new method for performing XOR-haplo-typing. Our algorithm XOR-HAPLOGEN is designed to introduce anumber of substantial improvements over existing methods: theproposed algorithm is able to process very long sequences of SNPs(the size of the input genotype matrix is currently limited by approx-imately 350,000 entries); the algorithm can process arbitrarilymixed XOR-genotype data (part of the data can be represented byXOR and part by the full genotype sequences); XOR-HAPLOGEN pro-duces the haplotype matrix for the entire set of input individuals to-gether with a block structure and its profile (lists of haplotypepatterns, their frequencies for each block and block boundaryscores); finally, XOR-HAPLOGEN also incorporates missing data intothe model and, thus, is able to infer missing data entries. XOR-HAPL-OGEN is an improved version of our earlier developed algorithmHAPLOGEN [20] for haplotyping and block partitioning that wasoriginally designed for use on a fully genotyped set of individualsand showed accuracy and speed comparable to that of existingmethods for haplotype resolution [11,13–15]. Procedurally XOR-HAPLOGEN is an extended version of HAPLOGEN to enable it to pro-cess XOR-genotypes in addition to regular genotypes. XOR-HAPLO-GEN is implemented as an R-package and has polynomial timecomplexity O(n3m2), where n is the number of individuals and m isthe length of genotypes in a sample. The proposed algorithm is de-signed to process any number of XOR-genotypes with the onlyrequirement that there would be a non-empty set of fully genotypedindividuals in the sample. XOR-HAPLOGEN achieves good accuracyin haplotype decomposition with and without presence of missingdata and is not significantly affected by the percentage of fully gen-otyped individuals in a sample.
Operation of XOR-HAPLOGEN is loosely based on the principlesof genetic algorithms: the population of potential solutions is en-coded as binary strings; evolution of the population is performedby application of genetic operations such as mutation and selectionbased on the fitness value of each individual.
The rest of the paper is organized as follows: Section 2 describesthe main assumptions and concepts used in the proposed algo-rithm. Section 3 explains the proposed algorithm in details andSection 4 provides results from validating the algorithm on pub-licly available data sets. Conclusions and directions for future workare given in Section 5.
2. Assumptions and underlying concepts
The genotype data used for this study are encoded by a geno-type matrix with entries from the set {0, 1, 2, 3, 9}, where 0 or 1encode homogeneous sites with known alleles, 2 encodes hetero-geneous sites, 3 encodes homogeneous sites with unknown al-leles and 9 encodes sites with missing data. The goal of XOR-HAPLOGEN is to produce a (0, 1) haplotype matrix where everytwo rows correspond to a particular genotype. Additionally thealgorithm computes the block structure with the complete pro-files (list of distinct patterns and their frequencies) for eachblock. The assumptions (parsimony principle) and the basic ap-proach (block identification criteria and block-extension algo-rithm) described below are inherited from the previous versionof the algorithm, i.e., HAPLOGEN.
2.1. Parsimony principle
The first basic assumption that defines the framework of theproposed approach is the principle of pure parsimony which isa widely used, empirically supported idea [1]. The principle ofpure parsimony aims at achieving the minimum number of dis-tinct haplotypes to resolve the input genotypes. In XOR-HAPLO-GEN this principle is reflected in the fitness function evaluatingthe quality of a potential solution and in the selection of the bestsolution from the population of potential solutions.
2.2. Block identification criteria
The second assumption is represented by the operationaldescription of a block, which is thelinkage disequilibrium (LD)-basedblock identification criterion. Since blocks exhibit low haplotypediversity they also tend to have high degree of LD. On the otherhand, regions with high LD tend to have limited haplotype diver-sity [2]. Haplotype diversity, in turn, is represented by a numberof common (covering more than 80% of the data) haplotype pat-terns in a block.
Most popular measures commonly used to evaluate the de-gree of linkage disequilibrium are r2 and D0 [21] which arepair-wise LD measures. The obvious deficiency of these measuresis that they are limited to two loci. Several approaches have beendeveloped to amend this deficiency, but most of them either donot describe multilocus LD directly or are computationally ineffi-cient. The multilocus LD measure called the Normalized EntropyDifference e (NED) [21] overcomes these limitations. A sequenceof m bi-allelic loci can be seen as a system with the possible hap-lotypes as its states. This sequence can assume 2m states (haplo-types) of which only few are present. The NED (e) measures thedegree of deviation of the entropy of the loci sequence from itsequilibrium state, is defined as [21]:
e ¼ SE � SB
SE¼ DS
SE¼ 1� SB
SEð1Þ
where SE is the entropy in the equilibrium case and SB is the actualentropy of the loci sequence, computed as suggested in [21].
XOR-HAPLOGEN uses e throughout the process of block parti-tioning in order to detect valid blocks. It is also possible to assessthe significance of this LD coefficient. It has been shown [21] thatthe statistic 2nDS approximately follows v2 distribution with2m � (m � 1) degrees of freedom and can be used to test the signif-icance of the deviation of the system from its linkage equilibriumwithin any particular block.

Fig. 1. Outline of algorithm XOR-HAPLOGEN.
N. Sazonova et al. / Journal of Biomedical Informatics 43 (2010) 51–59 53
2.3. Block-extension algorithm
In XOR-HAPLOGEN the block structure of a haplotype decompo-sition is determined by the block-extension algorithm, which isbased on the fact that blocks are usually quite long [2,5] and isimplemented by sequentially combining smaller-size blocks intothe bigger ones. The block-extension algorithm is applied to thecurrently available haplotype decomposition.
The block-extension algorithm is a greedy algorithm whichincorporates the idea similar to one in the hierarchical clustering:initially every 1 position (SNP) is considered to be a block, then ateach iteration pairs of blocks merge into longer blocks if a specificcriterion is met. Overlapping blocks are also considered and theirstrength is compared in order to form the strongest block out ofseveral consecutive overlapping blocks. The procedure is itera-tively repeated until merging is no longer efficient, i.e., the forma-tion of longer blocks does not satisfy criterion’s threshold in any ofthe proposed merges. The block-extension algorithm can be usedwith any block identification criterion that allows equivalent com-parison for the blocks of different lengths. NED is chosen as one ofsuch possible criteria. However, it should be pointed out that theNED criterion used for block identification has certain limitations.Namely, the asymptotic distribution of its value works best forthe blocks usually not exceeding length of 8–10 SNPs, but for long-er sequences the NED is always insignificant. To amend this limita-tion the block-extension algorithm can be applied using anadditional block identification criterion called coverage of the com-mon patterns: 4 or 5 patterns with the highest frequencies within ablock are assessed on their coverage of the data. The admissiblethreshold is set to 80% and the overlapping blocks are comparedin their coverage to create the one with the highest coverage.The number of the most frequent patterns (4 or 5) is fixed in ad-vance, however, a greater number of common patterns is not prac-tical [5,13].
Due to these considerations, the block-extension algorithm isdivided into two parts: first, the NED-based and then the cover-age-based block-extension algorithms are applied. NED-basedalgorithm produces blocks that in general do not exceed lengthof 10 SNPs, and the coverage-based algorithm then uses thesesmaller-size blocks to create possibly longer blocks each providingat least 80% coverage.
3. XOR-HAPLOGEN
The outline of XOR-HAPLOGEN algorithm is illustrated in Fig. 1and described below in details. Procedurally, the algorithm is acombination of two levels of optimization search represented bythe inner and outer loops with different optimization criteria foreach level. The goal of each iteration of the outer loop is to producean updated block structure based on the current haplotype decom-position, and the goal of each iteration of the inner loop is to com-pute the updated haplotype decomposition and evaluate how wellit satisfies the optimization criterion given the current block struc-ture. Thus, the best haplotype decomposition for a given blockstructure is found by the series of inner (lower-level) iterationswithin every outer iteration, and the best haplotype decompositiontogether with the block structure are found by the series of theouter (upper-level) iterations.
Genetic search is performed at the inner loop level and can bedescribed as follows. The individuals are (0, 1)-strings representingdistinct haplotype patterns within each block. At each iteration ofthe inner loop there are as many populations as there are blocks.Thus, inner loop provides multiple independent genetic searches(one for each block) simultaneously. The size of a population with-in any particular block is not fixed in advance and changes from
iteration to iteration as will be discussed further in Sections 3.1through 3.4. The selection and reconstruction process used in theinner loop are performed in such a way so that the haplotype pop-ulation is possibly reduced from one generation to another (toguarantee the parsimonious principle). Every iteration of the innerloop consists of the following steps: mutation, fitness evaluation ofthe haplotype patterns, selection of patterns, reconstruction ofhaplotype pairs and, finally, selection of the best solutions (i.e.,haplotype resolution within each block). The number of inner loopiterations is proportional to the number of genotypes in the data.
The purpose of the outer loop is to deal with the whole-lengthgenotypes and haplotypes. An iteration of the outer loop performsmatching of the haplotype patterns in the adjacent blocks to obtainwhole-length haplotype decompositions. The outer loop also re-views and adjusts block structure, evaluates the whole-lengthsolution and selects the best global solution by comparing the cur-rent global solution (given by haplotypes decomposition and blockpartitioning of the entire genotype sample) to the best previoussolution. The number of blocks, as well as their boundaries, variesfrom one outer loop iteration to another. The number of outer loopiterations is proportional to the length of the SNP sequence of thedata.
3.1. Initialization
Each haplotype is represented by a binary string of length m.Initialization is done by randomly obtaining a feasible decomposi-tion, i.e., for each ambiguous (heterogeneous) position of eachgenotype permutations (0, 1) and (1, 0) are randomly assignedwith equal probabilities to the pair of haplotypes. For XOR-geno-types their homogeneous positions are assigned equal values (0or 1) to both alleles, this is done randomly with equal probabilitieswith regard to 0 and 1. Special care is taken at this stage in the sites

Fig. 2. Example exhibiting relationship between set of genotypes (X) and currentlyresolving patterns (Y) in a block.
54 N. Sazonova et al. / Journal of Biomedical Informatics 43 (2010) 51–59
with missing data. Namely, the initialization at sites with missingdata is performed randomly so as to assign with equal probabilitiesone of the four possible values (0, 0), (1, 1), (1, 0) or (0, 1) to thepair of haplotypes. Although at the initialization step allele fre-quencies at XOR, heterogeneous and missing data sites are closeto 0.5, they are optimized during genetic search as a result of hap-lotypes pattern selection/haplotypes reconstruction and mutation.Current block structure is found by applying the block-extensionalgorithm to the trivial block structure where each SNP positionis considered to be a block.
3.2. Fitness evaluation
The fitness function f(h) of a haplotype pattern h is the probabil-ity of occurrence of this haplotype given the genotype data and thecurrent block partition. Random mating is assumed. Within eachblock, the probability of a haplotype pattern hib given the genotypedata G can be described as:
PðhibjGÞ ¼X
g2Gib
Y
j2Ig
p1fai
j¼1g
j ð1� pjÞ1fai
j¼0g; ð2Þ
where Gib is the collection of genotypes g that are compatible withinthe current block (i.e., could be used for genotype reconstructioninto haplotypes) with pattern hib. For every such genotype g theprobability of the pattern hib (where Ig is the collection of indicesof ambiguous, missing and homogeneous XOR sites in genotype gwithin block b) is
Y
j2Ig
p1fai
j¼1g
j ð1� pjÞ1fai
j¼0g: ð3Þ
Here pj is the probability of the allele 1 in the jth position ofhaplotype hi (respectively, (1 � pj) is the probability of allele 0). Itis clear that the greater the number of genotypes compatible withhib, the greater is the probability of this pattern given the data. Con-tribution of the entirely homogeneous fully genotyped individualsto the fitness of the corresponding haplotype pattern is doubled.Selection of the patterns with high fitness f(hib) = P(hib|G) will guar-antee the parsimonious principle where the frequencies of haplo-types should be maximized in order to provide a minimum set ofdistinct haplotypes. Estimation of the relative frequency pj of theallele 1 at each site is performed using a Bayesian approach byusing the Beta distribution as a prior distribution.
3.3. Selection of the set of fittest patterns within each block
Selection of the fittest subpopulation within each block is per-formed based on the fact that every genotype can be potentially re-solved (‘‘covered”) by at least one pattern out of the selected ones.A subset of individuals (haplotype patterns) in the current popula-tion is selected randomly without replacement according to theirfitness values. The exact size of this subset is not known in ad-vance, but is determined in the selection process itself as describedbelow.
Selection of patterns within blocks is proportional to the fitnessof a pattern within a block given by
PðhibjGÞ ¼X
g2Gib
Y
j2Ig
p1fai
j¼1g
j ð1� pjÞ1fai
j¼0g: ð4Þ
Fig. 2 provides a simple example to explain the goal of the selec-tion step. Relationship between genotypes within any particularblock and haplotype patterns currently resolving these genotypescan be represented as a bipartite graph (X, Y), where X is the setof genotypes and Y is the set of currently available patterns. Everyedge xy represents a possibility of resolving genotype x with pat-
tern y. There are at least 2|X| edges since every genotype is cur-rently resolved by two patterns and can be potentially resolvedby some other patterns. A subset of Y represented by black filledvertices is an example of a minimal set covering all X vertices.The goal is to select such a subset of haplotypes patterns.
The sought subset of Y is found in the following manner: allgenotypes (vertices of X) are marked as ‘‘covered” (i.e., potentiallycovered) by the first randomly selected haplotype pattern; if everynext selected pattern does not provide any additional coverage, itis removed from further consideration (and is not selected); other-wise, new vertices are also marked as ‘‘covered” and the pattern isconsidered to be selected; this process continues until all geno-types are covered by potentially resolving patterns.
3.4. Reconstruction of haplotype patterns within each block
A subset of the fittest haplotype patterns in the current popula-tion is used to construct the next generation of haplotypes for eachblock. The new generation is built by one-by-one consideration ofthe genotypes. In this process the patterns selected at previousstep are used to resolve as many as possible genotypes in the sam-ple. In case of multiple applicable patterns random selection of oneof them proportional to the fitness value is performed.
Reconstruction is the last step in each inner loop iteration. Afterthat the selection of the best solutions (one for each block) is per-formed by computing the number of common haplotypes, ncom-pat, in each block of the current haplotypes decomposition andcomparing it to its previous best value. Solution corresponding tothe minimum of the two values is selected as the best for eachblock.
3.5. Matching of the pairs of haplotypes in consecutive blocks
Inter-block transitions (connections between adjacent blocks)present the choice of the best pairing (tiling) of the four haplotypepatterns at the block boundary for every genotype. Matching of thepairs of block is based on the observed fact that haplotype blocksexhibit long-range dependency [5,13]. If a certain genotype decom-poses into the haplotype patterns h1a and h1b in the first block a (inan adjacent pair of blocks) and patterns h2a and h2b in the secondblock b, then there are only 2 possible options for the pairing:{(h1a, h2a),(h1b, h2b)} and {(h1a, h2b), (h1b, h2a)}. The choice is based

N. Sazonova et al. / Journal of Biomedical Informatics 43 (2010) 51–59 55
on selecting the greater of the two probabilities P((h1a, h2a),(h1b, h2b)) = P(h1a, h2a) � P(h1b, h2b) and P((h1a, h2b), (h1b , h2a)) =P(h1a, h2b) � P(h1b, h2a). Each of the probabilities P(hia, hjb) = Pij isestimated by computing the fraction of genotypes which thesetwo consecutive patterns can potentially resolve at the same time.
3.6. Adjustment of the block structure
After the selection step, reconstruction and inter-block transi-tions are performed to update the block structure. The currentblock structure could be completely reset (reinitialized) with prob-ability 0.5 (probability of reinitialization). If the block structure isreinitialized then the block-extension algorithm is applied to thesingle SNPs as the next step. Otherwise (if not reinitialized), theblock structure is updated in such a way as to guarantee that theformer blocks no longer satisfying the threshold for the block iden-tification are destroyed and new blocks are created by using theblock-extension algorithm. The threshold for block destruction isset to be slightly higher (90% coverage) than the one for block cre-ation (80%) since this allows for the search of more efficient blocksboundaries, i.e., those providing higher average coverage.
3.7. Evaluation of the current solution
The new solution in the form of the block structure (defined bythe boundaries and the patterns within each block) and the whole-length haplotype decomposition for the entire genotype sample isevaluated according to the parsimonious principle. In each itera-tion, the current solution is compared to the current best solutionusing two criteria: the total number of common patterns across allblocks, totcompat, and the number of distinct whole-length haplo-types (common and rare), ds. Selection of the best solution is de-fined by the minimum of both of these criteria. The totcompatcriterion is used to find the best block structure described by thelong blocks with high coverage. The ds criterion is needed to pre-dict the best set of the whole-length haplotypes and was used byother parsimony-based haplotype decomposition studies [5,22].At this step it is also decided whether to continue search or to ter-minate the algorithm.
Table 1Performance of XOR-HAPLOGEN for different levels of full genotyping in the CEUsample.
Percentage fullygenotyped (%)
Average errXOR Average errall sites* Average swr
3.8. Mutation
This step is used to contribute to the variability of the popula-tion(s). Mutation is applied to the pairs of individuals (haplotypes)corresponding to the same genotype and performed separately forthe heterogeneous and for homogeneous XOR sites. Mutation forheterogeneous sites is accomplished by switching 0 and 1 betweenchromosomes with some probability. Mutation for the XOR sites isa change of the allele (0 to 1, or 1 to 0) on both chromosomessimultaneously. The probability of a mutation is determined bythe second order Markov chain transition probabilities estimatedfrom the current generation of haplotypes. To ensure that goodpatterns found in previous iteration are not lost during mutation,it is only applied to the haplotype pairs with low coverage.
10 0.1119 0.1005 0.169620 0.0655 0.0522 0.107830 0.0675 0.0474 0.085640 0.0591 0.0357 0.071950 0.0509 0.0255 0.058860 0.0515 0.0207 0.040770 0.0550 0.0163 0.038180 0.0336 0.0056 0.025690 0.0325 0.0023 0.0210
100 0.0000 0.0000 0.0180
* This error is a fraction of incorrectly inferred homogeneous sites out of allhomogeneous sites (either in the XOR or fully genotyped form).
3.9. Calculation of scores for the block boundaries
The proposed algorithm also calculates estimates of probabilityof a border between every two adjacent SNPs to be a block bound-ary. This facilitates strength assessment of any particular blockboundary. Since the algorithm goes through a series of iterations,each score is calculated as a proportion of the time the algorithmselects this position as a block boundary in its current bestsolution:
Scores ¼X
iter
bbest; ð5Þ
where bbest is a (0, 1)-vector representing current outer loop itera-tion’s best block boundaries solution: 1 at position j indicates thatthere is a block boundary to the left of that position, otherwise itis 0.
4. Results
We used the HapMap data described in [23,24] and publiclyavailable at http://www.hapmap.org to test XOR-HAPLOGEN. Inparticular XOR-HAPLOGEN was applied to the CEU data whichwere collected in 1980 from US residents with northern and wes-tern European ancestry by the Centre d’Etude du PolymorphismeHumain (CEPH) and consist of the genotypes of 30 family trios.The HapMap web site provides the phased data which were ob-tained using the PHASE software. The program PHASE implementsmethods for estimating haplotypes from population genotype data[8]. The phasing process used the trio information where availableso that the published haplotypes are of a very high accuracy [24].The HapMap Consortium reported extremely low estimated switchrate (error occur every 8 Mb in CEU as given in [24]) which for allpractical purposes can be regarded as negligible. We randomly se-lected a chromosome (chromosome 2) and took first 500 positionshaving the same location (first 500 positions) along the selectedchromosome. These data contained 2.2% of loci that were homoge-neous for all 30 genotypes. None of the loci was heterogeneous forall genotypes in the sample. On average, any given genotype had21% of heterogeneous loci.
4.1. Testing samples without missing data
The CEU data for 30 individuals were then used to test the XOR-HAPLOGEN algorithm in a scenario without missing data. A set ofgenotypes was selected randomly to be represented by XOR encod-ing such that the true homogeneous alleles were hidden. Differentpercentages of fully genotyped sequences were tested that gaverise to 10 data sets containing from 10% to 100% of fully genotypedindividuals. As an example, the 10% (3 genotypes) of fully geno-typed sample corresponds to 90% (27 genotypes) of the individualsencoded as XOR-genotypes. To eliminate genotype-specific effectson the result of prediction, for each percentage of included fullgenotypes we generated 10 samples with random selection of indi-viduals to be XOR-genotyped. Several prediction errors were eval-uated for each data set. The prediction error for the XOR positions(errXOR) was computed as the fraction of incorrectly predicted XORsites out of the number of all XOR sites. To assess the amount of theincorrectly inferred homogeneous sites within the entire data (as

Table 2Performance of XOR-HAPLOGEN for samples with different percentages of fullgenotypes in the presence of 10% missing data in the CEU data.
Percentage fullygenotyped (%)
AverageerrXOR
Averageerrall
Averageswr
Averageerrmiss
10 0.1147 0.1032 0.1909 0.179620 0.0700 0.0558 0.1259 0.131830 0.0648 0.0454 0.1033 0.121440 0.0581 0.0351 0.0956 0.115450 0.0550 0.0275 0.0793 0.105360 0.0544 0.0220 0.0686 0.096270 0.0595 0.0177 0.0619 0.091980 0.0438 0.0072 0.0504 0.081390 0.0547 0.0038 0.0399 0.0772
100 0.0000 0.0000 0.0327 0.0726
56 N. Sazonova et al. / Journal of Biomedical Informatics 43 (2010) 51–59
given by all homogeneous sites) the prediction error for all homo-geneous sites (errall) was computed as the fraction of incorrect XORsites out of the total number of homogeneous sites. Additionallythe switch rate [13] for the heterogeneous sites (swr) was com-puted to reflect the accuracy of the heterogeneous sites prediction.The average (computed over 10 samples) prediction errors for eachpercentage of included full genotypes are reported in Table 1.
4.2. Testing samples with missing data
In the next step XOR-HAPLOGEN was tested on the same datasets with some of the data being masked as ‘‘missing”. The levelof the missing data was set at 10%. The sites to be masked as miss-ing data were randomly selected for each individual. The same 10samples with varying percentages of full genotypes were used asfor the case without missing data. To evaluate the solution thesame three error rates were computed for each sample: errXOR, er-rall, swr). In addition, the prediction rate for missing sites errmiss wascomputed as a fraction of incorrectly inferred alleles at the missingdata sites between the switches (used in computing the switchrate) out of the total number of missing data sites. The average val-ues of each prediction error after running XOR-HAPLOGEN algo-rithm on all the samples are given in Table 2.
4.3. Discussion
Algorithm’s results consist of predicted XOR and heterogeneoussites and predicted block structure. Although attractiveness of theresults depends on one’s threshold for acceptable amount of errorand the availability of fully genotyped data, the overall error levelsare encouraging. For example, the prediction error for XOR sites insamples without missing data (column 2 of Table 1) dropped sig-
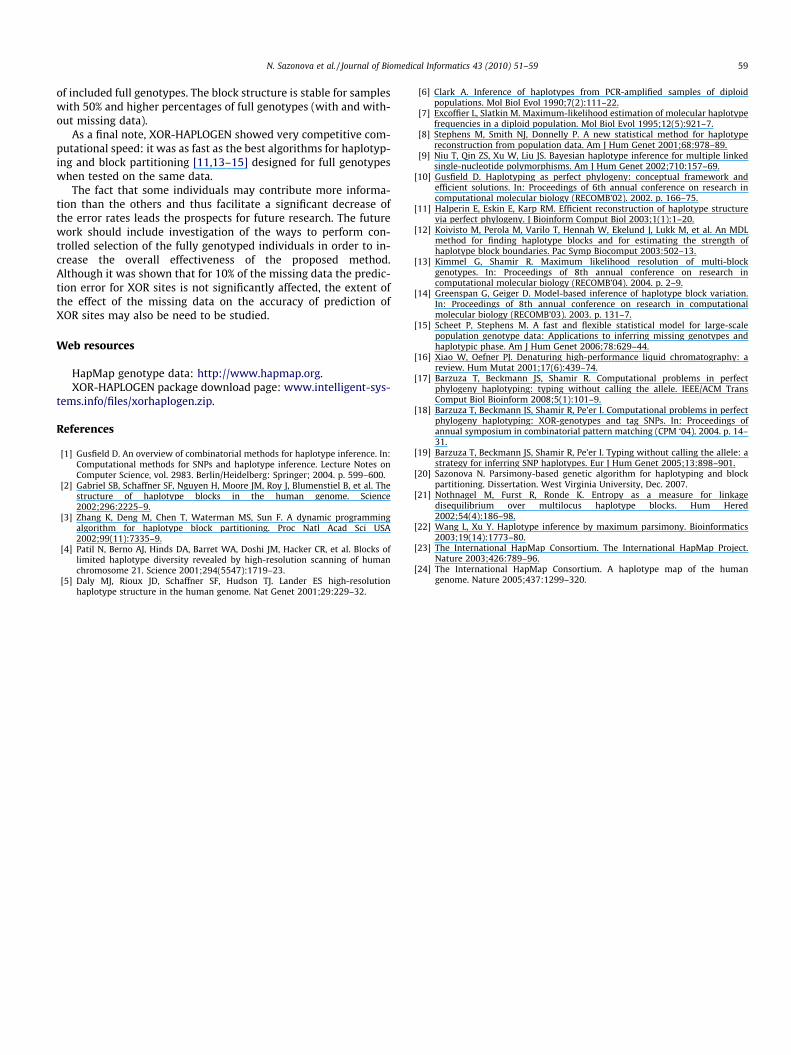
Fig. 3. Prediction errors for XOR sites for samples with and without the presence of 10missing data (b).
nificantly from 11.19% (at 10% full genotyping) to less than 6.55%for the samples with only 20% or more of full genotypes. As canbe expected, in the samples with missing data the overall errorrates are higher due to the loss of information (Table 1 and 2).Fig. 3 illustrates the average prediction errors for XOR sites (inset(a)) and the average switch rates for samples with and withoutmissing data (inset (b)) in a comparative fashion. These graphs re-veal one important detail: prediction errors for XOR sites are prac-tically not affected by the presence of missing data for sampleswith 70% or less of full genotypes unlike the switch rates, whichexhibit consistently lower rates for the samples without missingdata. The overall difference between the switch rates across all per-centages of full genotyping for samples with and without missingdata is within 1.5–3% range.
Next, the stability of the block structure for samples with differ-ent percentages of included full genotypes was evaluated. Figs. 4and 5 show the average block boundary scores calculated from10 generated samples for each percentage of included full geno-types for groups with no missing and missing data, respectively.These figures show a significant amount of noise from the loss ofinformation in homogeneous sites for the data sets with very lowpercentages of fully genotyped individuals. The noise graduallydiminishes to reveal a very distinct block structure as the numberof fully genotyped individuals in sample grows. This fact can bedemonstrated by plotting a fraction of loci with low scores (forexample, with scores less than 0.1 as shown in Fig. 6(a)) and themedian scores (Fig. 6(b)) against the percentage of full genotyping.Thus, noise reduction is shown by increasing fraction of loci withlow scores and decreasing score median. As can be expected, thefraction of loci with low scores is higher and the score median islower for samples with missing data due to the additional noisecreated by the lost alleles.
Despite the noise the highest block boundary scores seem to bein a very good consistency even for the lowest percentages of fullygenotyped individuals in a sample (when compared to the 100%baseline). For example, from Figs. 4 and 5 it is clear that, amongothers, the peaks of block boundary scores occurring around30th, 47–50th, 120th, 150th and 170th positions stand out formost percentages above 0.25 threshold of full genotyping for bothmissing and no missing data. In addition, as can be seen from Fig. 5missing data contributes to less distinct patterns in block boundaryscores when they are compared for the same percentages of fullgenotypes in Fig. 4 (no missing data).
The consistency of the patterns of possible block boundarieswith each other and with the 100% baseline can be shown by com-puting cross-correlation function for every pair of signals (blockboundary scores) corresponding to two different levels of fullgenotyping. Cross-correlation serves as the measure of similarity
% missing data (a), switch rates for samples with and without the presence of 10%

Fig. 4. Block boundaries scores for samples with different percentages of full genotypes for the CEU XOR data.
Fig. 5. Block boundaries scores for samples with different percentages of full genotypes for CEU XOR data with 10% missing sites.
N. Sazonova et al. / Journal of Biomedical Informatics 43 (2010) 51–59 57

Fig. 6. Noise reduction in block boundaries scores shown as: (a) increasing number of loci with score less than 0.1, (b) decreasing median of the scores.
58 N. Sazonova et al. / Journal of Biomedical Informatics 43 (2010) 51–59
between two signals. Fig. 7 shows plots of cross-correlation func-tions for comparing samples of length 200 with 10% and 100% offull genotyping with (inset (b)) and without (inset (a)) missingdata. The cross-correlation is highest when the two signals arenot shifted with respect to each other (lag 200, equal to signals’length). Similar plotting of every pair of signals within each group(missing and no missing data) exhibits exactly the same behaviorof the cross-correlation function.
Therefore, it can be concluded that the block structure producedby the algorithm shows satisfactory pattern consistency even ifpercentage of fully genotyped individual included in a sample islow. Overall block boundary scores tend to clear up from most ofthe noise when the percentage of full genotypes is greater or equalthan 50%.
XOR-HAPLOGEN took about 3.5 minutes to process each dataset on the 2.3 GHz processor (either with or without the missingdata) which was within the range of the running time of the bestalgorithms for regular (full-genotype) haplotyping and block parti-tioning [11,13,15]. The acceptable level of the prediction accuracy(which itself depends on the percentage of the fully genotypedindividuals in the sample) in general should depend on the allowedcost-error trade-off. For this particular set of samples the predic-tion errors for XOR sites errXOR’s decrease significantly for samplewith greater than 10% of full genotypes (with or without missingdata). Thus it is preferable to use more than 10% of the fully geno-typed individuals in a sample. Error rates errall and swr drop to lowvalues and the block structure becomes stable for samples with50% and higher percentages of full genotypes. Thus samples with50% or more of full genotypes are the preferred choice for practicalapplications.
Fig. 7. Cross-correlation functions for the samples of length 200 with 10% an
5. Conclusions
The proposed algorithm for XOR-haplotyping possesses severalnew valuable features that increase its practicality. XOR-HAPLO-GEN can process large data sets (up to 350,000 entries of the geno-type matrix) and, in particular, is suitable for processing long SNPsequences taking into consideration haplotype block structure.XOR-HAPLOGEN can also be applied to the data with missing val-ues. The algorithm is designed to infer haplotype resolution andconstruct block structure for XOR-genotype data samples withsome non-empty subset of individuals represented by full geno-types. In testing the algorithm on the CEU data, with samplesincluding different percentages of full genotypes and also withand without presence of the 10% missing data, the algorithm wasable to produce haplotype resolution with low prediction errorsfor XOR sites (3.25–11.19% for samples without missing data,5.47–11.47% for samples with missing data), heterogeneous (2.1–16.96% and 3.99–19.09%, respectively) and missing data sites(7.72–17.96% for 10% missing data). The accuracy of predictionwas proportional to the percentage of fully genotyped individualsin a sample. While missing data contribute in some degree to theprediction error, the prediction errors for XOR sites are not af-fected. The prediction of XOR sites is accurate for samples withmore than 10% of fully genotyped individuals. XOR-HAPLOGENmay be the first algorithm that allows processing of long-rangeSNP sequences with flexible amount of XOR-genotypes and possi-bility of missing data. Due to this fact the comparison of the resultsto other algorithms was not possible.
The proposed algorithm XOR-HAPLOGEN also produces theblock structure which shows consistency for different percentages
d 100% of full genotypes (a) without missing data, (b) with missing data.
N. Sazonova et al. / Journal of Biomedical Informatics 43 (2010) 51–59 59
of included full genotypes. The block structure is stable for sampleswith 50% and higher percentages of full genotypes (with and with-out missing data).
As a final note, XOR-HAPLOGEN showed very competitive com-putational speed: it was as fast as the best algorithms for haplotyp-ing and block partitioning [11,13–15] designed for full genotypeswhen tested on the same data.
The fact that some individuals may contribute more informa-tion than the others and thus facilitate a significant decrease ofthe error rates leads the prospects for future research. The futurework should include investigation of the ways to perform con-trolled selection of the fully genotyped individuals in order to in-crease the overall effectiveness of the proposed method.Although it was shown that for 10% of the missing data the predic-tion error for XOR sites is not significantly affected, the extent ofthe effect of the missing data on the accuracy of prediction ofXOR sites may also be need to be studied.
Web resources
HapMap genotype data: http://www.hapmap.org.XOR-HAPLOGEN package download page: www.intelligent-sys-
tems.info/files/xorhaplogen.zip.
References
[1] Gusfield D. An overview of combinatorial methods for haplotype inference. In:Computational methods for SNPs and haplotype inference. Lecture Notes onComputer Science, vol. 2983. Berlin/Heidelberg: Springer; 2004. p. 599–600.
[2] Gabriel SB, Schaffner SF, Nguyen H, Moore JM, Roy J, Blumenstiel B, et al. Thestructure of haplotype blocks in the human genome. Science2002;296:2225–9.
[3] Zhang K, Deng M, Chen T, Waterman MS, Sun F. A dynamic programmingalgorithm for haplotype block partitioning. Proc Natl Acad Sci USA2002;99(11):7335–9.
[4] Patil N, Berno AJ, Hinds DA, Barret WA, Doshi JM, Hacker CR, et al. Blocks oflimited haplotype diversity revealed by high-resolution scanning of humanchromosome 21. Science 2001;294(5547):1719–23.
[5] Daly MJ, Rioux JD, Schaffner SF, Hudson TJ. Lander ES high-resolutionhaplotype structure in the human genome. Nat Genet 2001;29:229–32.
[6] Clark A. Inference of haplotypes from PCR-amplified samples of diploidpopulations. Mol Biol Evol 1990;7(2):111–22.
[7] Excoffier L, Slatkin M. Maximum-likelihood estimation of molecular haplotypefrequencies in a diploid population. Mol Biol Evol 1995;12(5):921–7.
[8] Stephens M, Smith NJ, Donnelly P. A new statistical method for haplotypereconstruction from population data. Am J Hum Genet 2001;68:978–89.
[9] Niu T, Qin ZS, Xu W, Liu JS. Bayesian haplotype inference for multiple linkedsingle-nucleotide polymorphisms. Am J Hum Genet 2002;710:157–69.
[10] Gusfield D. Haplotyping as perfect phylogeny: conceptual framework andefficient solutions. In: Proceedings of 6th annual conference on research incomputational molecular biology (RECOMB’02). 2002. p. 166–75.
[11] Halperin E, Eskin E, Karp RM. Efficient reconstruction of haplotype structurevia perfect phylogeny. J Bioinform Comput Biol 2003;1(1):1–20.
[12] Koivisto M, Perola M, Varilo T, Hennah W, Ekelund J, Lukk M, et al. An MDLmethod for finding haplotype blocks and for estimating the strength ofhaplotype block boundaries. Pac Symp Biocomput 2003:502–13.
[13] Kimmel G, Shamir R. Maximum likelihood resolution of multi-blockgenotypes. In: Proceedings of 8th annual conference on research incomputational molecular biology (RECOMB’04). 2004. p. 2–9.
[14] Greenspan G, Geiger D. Model-based inference of haplotype block variation.In: Proceedings of 8th annual conference on research in computationalmolecular biology (RECOMB’03). 2003. p. 131–7.
[15] Scheet P, Stephens M. A fast and flexible statistical model for large-scalepopulation genotype data: Applications to inferring missing genotypes andhaplotypic phase. Am J Hum Genet 2006;78:629–44.
[16] Xiao W, Oefner PJ. Denaturing high-performance liquid chromatography: areview. Hum Mutat 2001;17(6):439–74.
[17] Barzuza T, Beckmann JS, Shamir R. Computational problems in perfectphylogeny haplotyping: typing without calling the allele. IEEE/ACM TransComput Biol Bioinform 2008;5(1):101–9.
[18] Barzuza T, Beckmann JS, Shamir R, Pe’er I. Computational problems in perfectphylogeny haplotyping: XOR-genotypes and tag SNPs. In: Proceedings ofannual symposium in combinatorial pattern matching (CPM ‘04). 2004. p. 14–31.
[19] Barzuza T, Beckmann JS, Shamir R, Pe’er I. Typing without calling the allele: astrategy for inferring SNP haplotypes. Eur J Hum Genet 2005;13:898–901.
[20] Sazonova N. Parsimony-based genetic algorithm for haplotyping and blockpartitioning. Dissertation. West Virginia University, Dec. 2007.
[21] Nothnagel M, Furst R, Ronde K. Entropy as a measure for linkagedisequilibrium over multilocus haplotype blocks. Hum Hered2002;54(4):186–98.
[22] Wang L, Xu Y. Haplotype inference by maximum parsimony. Bioinformatics2003;19(14):1773–80.
[23] The International HapMap Consortium. The International HapMap Project.Nature 2003;426:789–96.
[24] The International HapMap Consortium. A haplotype map of the humangenome. Nature 2005;437:1299–320.