AIRPORT MASTER PLAN UPDATE - Port of Benton
138
AIRPORT MASTER PLAN UPDATE Final Report PROSSER AIRPORT Prosser, Washington
-
Upload
khangminh22 -
Category
Documents
-
view
0 -
download
0
Transcript of AIRPORT MASTER PLAN UPDATE - Port of Benton

AIRPORT MASTER PLAN UPDATEFinal Report
PROSSER AIRPORT Prosser, Washington
AIRPORT MASTER PLAN UPDATEPROSSER AIRPORT (S40)
Final ReportJuly 2019
Prepared for the:
Port CommissionersPort of Benton, Washington
Robert D. Larson Jane F. Hagarty Roy D. Keck
Diahann Howard, PPM Port of Benton Interim Executive Director
And for the
State of WashingtonDepartment of Transportation
Aviation Division
US Department of TransportationFederal Aviation AdministrationSeattle Airports District Office
The preparation of this document may have been supported, in part, through the Airport Improvement Program financial assistance from the Federal Aviation Administration as provided under Title 49 U.S.C., Section 47104. The contents do not necessarily reflect
the official views or policy of the FAA. Acceptance of this report by the FAA does not in any way constitute a commitment on the part of the U.S. to participate in any development depicted therein nor does it indicate that the proposed development is environmentally
acceptable or would have justification in accordance with appropriate public laws.

AIRPORT MASTER PLAN UPDATE
PROSSER AIRPORT - S40
i
TABLE OF CONTENTS
TABLE OF CONTENTSCHAPTER 1 - INTRODUCTION 1-1
1.1 PURPOSE 1-11.2 OBJECTIVES AND ISSUES 1-11.2.1 OBJECTIVES 1-11.2.2 ISSUES 1-2
1.3 PLANNING PROCESS 1-21.3.1 PROJECT PARTICIPANTS 1-21.3.2 PROJECT PHASE ONE 1-31.3.3 PROJECT PHASE TWO 1-31.3.4 PROJECT PHASE THREE 1-31.3.5 PROJECT PHASE FOUR 1-31.3.6 PROJECT PHASE FIVE 1-3
1.4 CONSULTANT AGREEMENT AND STUDY DOCUMENTATION 1-31.4.1 REFERENCE DOCUMENTS 1-41.4.2 NARRATIVE REPORT CONTENT 1-5
CHAPTER 2 - EXISTING CONDITIONS 2-12.0 INTRODUCTION 2-12.1 BRIEF AREA HISTORY 2-12.2 BRIEF AIRPORT HISTORY 2-12.3 AIRPORT ROLE 2-12.3.1 FEDERAL PLANNING 2-32.3.2 STATE PLANNING 2-32.3.3 PREVIOUS AIRPORT PLANNING 2-5
2.4 AIRPORT INVENTORY 2-92.4.1 RUNWAY 8-26 2-92.4.2 TAXIWAYS AND APRONS 2-122.4.3 AIRPORT SERVICES AND ACCESS 2-12
2.5 ENVIRONMENTAL 2-132.5.1 AIRPORT AREA ZONING AND LAND USE 2-132.5.2 CLIMATE 2-142.5.3 WIND 2-142.5.4 NEPA 2-142.5.5 SUSTAINABILITY 2-21
2.6 AREA AIRSPACE, AIRPORTS, AND NAVIGATIONAL AIDS 2-222.6.1 AIRSPACE 2-222.6.2 AREA AIRPORTS AND NAVIGATIONAL AIDS 2-22
2.7 BASED AIRCRAFT AND OPERATIONS 2-232.8 AIRFIELD DESIGN STANDARDS 2-24

AIRPORT MASTER PLAN UPDATE
PROSSER AIRPORT - S40
ii
2.8.1 DESIGN STANDARDS CRITERION 2-242.8.2 DESIGN STANDARDS 2-252.8.3 FAR PART 77 2-25
2.9 FINANCIAL/ECONOMIC DEVELOPMENT 2-272.10 CONSTRAINTS TO AND OPPORTUNITIES FOR AVIATION GROWTH 2-29
CHAPTER 3 - AVIATION ACTIVITY FORECASTS 3-13.1 CHAPTER SUMMARY 3-13.2 INTRODUCTION 3-13.3 BACKGROUND 3-33.3.1 COMMUNITY PROFILE 3-33.3.2 AVIATION PROFILE - USERS 3-53.3.3 AVIATION PROFILE – TERMINAL AREA FORECAST 3-53.3.4 AVIATION PROFILE – OTHER PLANNING STUDIES 3-73.3.5 AVIATION PROFILE – TRAFFIC FLOW MANAGEMENT SYSTEM COUNTS 3-83.3.6 CATCHMENT AREA 3-10
3.4 BASED AIRCRAFT FORECASTS 3-123.4.1 BASED AIRCRAFT FORECAST METHODOLOGIES 3-15
3.5 AIRCRAFT OPERATIONS FORECASTS 3-173.6 CRITICAL AIRCRAFT 3-223.6.1 DESIGN GROUP II 3-22
3.7 CHAPTER SUMMARY 3-23CHAPTER 4 - FACILITY REQUIREMENTS 4-1
4.0 INTRODUCTION 4-14.1 AIRPORT ROLE AND SERVICE LEVEL 4-14.1.1 DESIGN STANDARDS 4-14.1.2 ULTIMATE DESIGN STANDARDS 4-1
4.2 AIRSIDE RECOMMENDATIONS 4-24.2.1 WIND ANALYSIS 4-24.2.2 INSTRUMENT APPROACH CAPABILITY 4-24.2.3 RUNWAY LENGTH 4-54.2.4 RUNWAY DESIGN STANDARDS 4-64.2.5 TAXIWAYS AND APRONS 4-74.2.6 NAVIGABLE AIRSPACE 4-84.2.7 AIRSPACE CAPACITY 4-9
4.3 LANDSIDE RECOMMENDATIONS 4-94.3.1 BASED AIRCRAFT APRON AREA 4-94.3.2 ITINERANT AIRCRAFT APRON AREA 4-94.3.3 TERMINAL/FBO BUILDING AREA 4-104.3.4 AIRCRAFT HANGAR AREA 4-114.3.5 AIRCRAFT FUELING 4-11

AIRPORT MASTER PLAN UPDATE
PROSSER AIRPORT - S40
iii
4.3.6 SUPPORT FACILITIES AND INFRASTRUCTURE 4-124.3.7 AUTOMOBILE PARKING AND ACCESS 4-124.3.8 SNOW REMOVAL AND AIRFIELD MAINTENANCE EQUIPMENT 4-12
4.4 SECURITY 4-124.5 SUMMARY 4-13
CHAPTER 5 - ALTERNATIVES ANALYSIS 5-15.0 INTRODUCTION 5-15.1 ALTERNATIVES INTRODUCTION 5-15.2 ALTERNATIVE NO. 1A: EXISTING AND FUTURE FAA DESIGN STANDARDS 5-25.3 ALTERNATIVE NO. 1B: EXISTING AND FUTURE FAA DESIGN STANDARDS WITH GPS APPROACHES TO BOTH RUNWAY ENDS 5-25.4 ALTERNATIVE NO. 1C: EXISTING AND FUTURE FAA DESIGN STANDARDS WITH GPS APPROACHES TO BOTH RUNWAY ENDS AND A WESTERLY RUNWAY EXTENSION TO 4,000 FEET 5-35.5 ALTERNATIVE NO. 2A: ULTIMATE FAA DESIGN STANDARDS 5-75.6 ALTERNATIVE NO. 2B: ULTIMATE FAA DESIGN STANDARDS WITH GPS APPROACHES TO BOTH RUNWAY ENDS 5-75.7 ALTERNATIVE NO. 2C: ULTIMATE FAA DESIGN STANDARDS WITH GPS APPROACHES TO BOTH RUNWAY ENDS AND A WESTERLY RUNWAY EXTENSION TO 4,000 FEET 5-85.8 ALTERNATIVE NO. 5 SERIES: LANDSIDE DEVELOPMENT 5-125.8.1 LANDSIDE CONFIGURATION NO. 1A: SETBACK FOR VISUAL OPERATIONS 5-135.8.2 LANDSIDE CONFIGURATION NO. 1B: SETBACK FOR GPS APPROACH 5-135.8.3 LANDSIDE CONFIGURATION NO. 2A: SETBACK FOR VISUAL OPERATIONS 5-135.8.4 LANDSIDE CONFIGURATION NO. 2B: SETBACK FOR GPS APPROACH 5-14
5.9 SUMMARY 5-175.10 TAC AND PORT PREROGATIVE 5-19
CHAPTER 6 - PHASED DEVELOPMENT 6-16.0 INTRODUCTION 6-16.1 SHORT-TERM IMPROVEMENTS 6-16.2 INTERMEDIATE-TERM IMPROVEMENTS 6-56.3 LONG-TERM IMPROVEMENTS 6-96.4 FINANCIAL 6-126.5 SUMMARY 6-13
CHAPTER 7 - AIRPORT MASTER PLAN DRAWINGS 7-17.0 INTRODUCTION 7-17.1 COVER 7-17.2 AIRPORT LAYOUT PLAN AND DATA SHEET 7-17.3 AIRPORT AIRSPACE PLAN (PART 77) 7-17.4 RUNWAY PLAN AND PROFILES 7-27.5 TERMINAL AREA PLAN 7-27.6 LAND USE PLAN 7-27.7 AIRPORT PROPERTY INVENTORY MAP 7-2

AIRPORT MASTER PLAN UPDATE
PROSSER AIRPORT - S40
iv
LIST OF TABLES AND FIGURES
LIST OF TABLES
TABLE 2.1 PROSSER AIRPORT MAJOR MILESTONES 2-2TABLE 2.2 PAVEMENT CONDITION INDEX INVENTORY 2-4TABLE 2.3 HISTORICAL FAA AND WSDOT GRANT FUNDING 2-7TABLE 2.4 APRON AREAS AND TIE-DOWN INVENTORY 2-12TABLE 2.5 PROSSER CLIMATE DATA 2-16TABLE 2.6 WIND INFORMATION 2-16TABLE 2.7 DESIGN STANDARDS CRITERIA 2-24TABLE 2.8 SELECT PROSSER AIRPORT DESIGN STANDARDS 2-28TABLE 3.1 DESCRIPTION OF DATA SOURCES 3-2TABLE 3.2 WASHINGTON OFFICE OF FINANCIAL MANAGEMENT 2012 POPULATION PROJECTIONS 3-4TABLE 3.3 FAA TAF FOR S40 – FORECAST ISSUED JANUARY 2016 3-6TABLE 3.4 2015 ITINERANT OPERATIONS COUNTS 3-7TABLE 3.5 GROWTH RATE COMPARISON 2005-2015 3-8TABLE 3.6 FAA TFMSC RECORDS – OPERATIONS BY AIRCRAFT REFERENCE CODE 3-8TABLE 3.7 TFMSC DESCRIPTIVE STATISTICS 3-10TABLE 3.8 NEARBY AIRPORTS 3-11TABLE 3.9 CORRELATION ANALYSIS VARIABLES AND SOURCES 3-12TABLE 3.10 NATIONAL BASED AIRCRAFT DATA 3-13TABLE 3.11 HISTORICAL BASED AIRCRAFT COUNTS 3-14TABLE 3.12 NATIONAL GENERAL AVIATION AND AIR TAXI FLEET 2015-2035 3-14TABLE 3.13 HISTORICAL AIRCRAFT OPERATIONS COUNTS 3-17TABLE 3.14 NATIONAL GA OPERATIONS AND PILOTS BY TYPE 2015-2035 3-18TABLE 3.15 NATIONAL GA HOURS FLOWN BY CLASS 2015-2035 3-19

AIRPORT MASTER PLAN UPDATE
PROSSER AIRPORT - S40
v
TABLE 3.16 PREFERRED AIRCRAFT OPERATIONS FORECAST 3-20TABLE 3.17 2015 ITINERANT OPERATIONS BY AIRCRAFT REFERENCE CODE 3-22TABLE 3.18 2015 LOCAL OPERATIONS BY AIRCRAFT REFERENCE CODE 3-23TABLE 3.19 2035 OPERATIONS COUNTS BY AIRCRAFT REFERENCE CODE 3-23TABLE 3.20 AVIATION ACTIVITY FORECAST SUMMARY 3-23TABLE 4.1 RNAV INSTRUMENT APPROACH PROCEDURE FOR ≥1 STATUTE MILE NON-PRECISION, STRAIGHT-IN 4-4TABLE 4.2 SELECT AIRPORT DESIGN STANDARDS 4-7TABLE 4.3 BASED AIRCRAFT APRON RECOMMENDATIONS 4-10TABLE 4.4 ITINERATE AIRCRAFT PARKING AREA RECOMMENDATIONS 4-10TABLE 4.5 TERMINAL/FBO BUILDING RECOMMENDATIONS 4-11TABLE 4.6 HANGAR AREA RECOMMENDATIONS 4-11TABLE 4.7 AUTOMOBILE PARKING AREA RECOMMENDATIONS 4-12TABLE 4.8 SUMMARY OF RECOMMENDATIONS 4-14TABLE 6.1 HISTORICAL FINANCIAL DATA; SELECT 6-12TABLE 6.2 FORECAST FINANCIAL DATA; SELECT 6-13

AIRPORT MASTER PLAN UPDATE
PROSSER AIRPORT - S40
vi
LIST OF FIGURES
FIGURE 2-1 WASHINGTON STATE PUBLIC USE AIRPORTS 2-3FIGURE 2-2 2012 PAVEMENT CONDITIONS INDICES AT THE PROSSER AIRPORT 2-6FIGURE 2-3 PROSSER AIRPORT VICINITY MAP 2-9FIGURE 2-4 BENTON COUNTY ZONING MAP 2-10FIGURE 2-5 CITY OF PROSSER ZONING MAP 2-11 FIGURE 2-6 CITY OF PROSSER COMPREHENSIVE PLAN LAND USE MAP 2-15FIGURE 2-7 SAFETY ZONE EXHIBIT 2-17FIGURE 2-8 US AIRSPACE CLASSIFICATIONS 2-22FIGURE 2-9 SEATTLE SECTIONAL AERONAUTICAL CHART 2-23FIGURE 2-10 REPRESENTATIVE AIRCRAFT BY WINGSPAN 2-26FIGURE 2-11 SELECT AIRPORT DESIGN CRITERION 2-27FIGURE 3-1 CITY OF PROSSER AND BENTON COUNTY ECONOMY 3-4FIGURE 3-2 FAA TAF FOR S40 - FORECAST ISSUED JANUARY 2016 3-6FIGURE 3-3 FAA TFMSC RECORDS - OPERATIONS BY AIRCRAFT REFERENCE COCE 3-9FIGURE 3-4: PROSSER AIRPORT BASED AIRCRAFT OPERATIONS FORECASTS 3-16FIGURE 3-5 S40 AIRCRAFT OPERATIONS FORECASTS 3-21FIGURE 3-6 COMPARISON OF AIRPORT PLANNING AND TAF FORECASTS 3-24FIGURE 3-7 COMPARISON OF AIRPORT PLANNING AND TAF FORECASTS 3-25FIGURE 4-1 TRADITIONAL ILS APPROACH VISUALIZATION 4-3FIGURE 4-2 GPS APPROACH VISUALIZATION 4-4FIGURE 4-3 REQUIRED RUNWAY 8-26 LENGTH (CHART VISUALIZATION) 4-6FIGURE 5.1 ALTERNATIVE NO. 1A 5-4FIGURE 5.2 ALTERNATIVE NO. 1B 5-5FIGURE 5.3 ALTERNATIVE NO. 1C 5-6

AIRPORT MASTER PLAN UPDATE
PROSSER AIRPORT - S40
vii
FIGURE 5.4 ALTERNATIVE NO. 2A 5-9FIGURE 5.5 ALTERNATIVE NO. 2B 5-10FIGURE 5.6 ALTERNATIVE NO. 2C 5-11FIGURE 5.7 ALTERNATIVE NO. 3A 5-15FIGURE 5.8 ALTERNATIVE NO. 4A 5-16FIGURE 6-1 SHORT-TERM IMPROVEMENTS 6-4FIGURE 6-2 INTERMEDIATE-TERM IMPROVEMENTS 6-8FIGURE 6-3 LONG-TERM IMPROVEMENTS 6-11

AIRPORT MASTER PLAN UPDATE 1-1
PROSSER AIRPORT - S40C
hapter 1 Introduction
Chapter 2
Existing Conditions
Chapter 3
Aviation Activity Forecasts
Chapter 4
Facility Requirem
entsC
hapter 5 Alternatives Analysis
Chapter 6
Phased Developm
ent and C
ost Estimates
Chapter 7
Airport Layout Plan and D
rawings
The Port of Benton as owner, operator, and sponsor of the Prosser Airport (Airport) initiates an update of its Airport Master Plan (Plan). The Plan assesses the Airport’s existing and future role and provides direction and guidance related to short- and long-term development. More specifically, the Plan was developed in collaboration with the Port of Benton and provides for compliance with current Federal Aviation Administration (FAA) design standards. This project will be managed by a Technical Advisory Committee (TAC) and the Director of Airports and Operations, John Haakenson, and will look at the airside and landside facilities and make recommendations to guide future development.The Plan is as much about the planning process as it is the resulting document. During development of the Plan update, the project process involves Federal and State agencies, airport users, tenants as well as the general public. Select stakeholders were assembled into a TAC, which met at key points during the planning process. The TAC commented on Plan elements as they were developed and provided feedback to the Airport and the consultant team. In addition to the TAC and the Port of Benton, the FAA and the Washington State Department of Transportation (WSDOT) Aeronautics Division also provided input.The Prosser Airport is an economic generator for the community, and public outreach is a key part of the planning process. The remainder of this chapter describes plan purpose, objectives and issues as well as identifies the four-phase planning process created for this planning effort.
1.1 PURPOSE
The purpose of this planning effort is to objectively assess the needs of Prosser Airport from an aviation perspective. The deliverable resulting from the planning process is the Master Plan Update narrative report and ALP adopted by the Port of Benton.
1.2 OBJECTIVES AND ISSUES
Assessing aviation needs, evaluating alternatives, and adopting a Master Plan Update is a complex task. Some basic questions that were evaluated includes:
1. Which aviation services are the most attractive to new business and existing users and why?
2. What costs are required to provide and implement additional aviation infrastructure?
3. What kinds of visitors or companies are likely to be interested in the Airport?
4. What will the basic needs for the Airport be, now and in the future?
5. How might the Airport benefit its community by attracting businesses that provide higher income jobs and quality goods and services?
Answers to the above questions help guide the community to establish a plan that contributes to achieving community goals. It often boils down to economic development efforts, and how a community or region uses its resources, including the Airport, to achieve its community and economic development goals.
1.2.1 OBJECTIVESThe master planning process intends to be an integral part of the community’s overall plan. Coordinated planning that enhances the Airport, the Port of Benton, and the City of Prosser is the overall aim. Specifically, the objectives of this study are to:
1. Comply with FAA design standards.2. Maximize aviation development opportunities.3. Be environmentally-responsive.4. Orient the Plan and surrounding properties to be
integral to the existing operations and facilities. 5. Focus on future development of the Airport and to
contribute to the image and commercial activity of the Airport.
6. Develop the Airport and associated properties in a coordinated and comprehensive manner, taking maximum advantage of the assets of the Port of Benton.
7. Orient the planning and development of the Airport in order to achieve the highest and best use of the site. Evaluate specific users and uses on a case-by-case basis. Highest and best use should be interpreted in terms of the following factors: use of physical site assets, economic benefit, jobs created and salaries, fiscal impact and contribution to the overall objectives of the Port of Benton and the City of Prosser.
8. Evaluate Airport development relative to both long and short-term costs and benefits, accommodating a range of potential aviation uses.
9. Consider regional economic goals in preparing a development strategy for the Airport.
10. Minimize off-site impacts, particularly those affecting surrounding, neighboring areas.
CHAPTER 1 - INTRODUCTION

AIRPORT MASTER PLAN UPDATE 1-2
PROSSER AIRPORT - S40C
hapter 1 Introduction
Chapter 2
Existing Conditions
Chapter 3
Aviation Activity Forecasts
Chapter 4
Facility Requirem
entsC
hapter 5 Alternatives Analysis
Chapter 6
Phased Developm
ent and C
ost Estimates
Chapter 7
Airport Layout Plan and D
rawings
1.2.2 ISSUESThe previous Master Plan Process was most recently completed at Prosser Airport in July 2006. FAA and WSDOT determined that an update to the plan would be beneficial given current activity and economic conditions. The Port of Benton consulted with FAA, WSDOT and the master plan consultant to identify potential issues and create a work plan to evaluate issues, grant assurance compliance and plan for future growth. Some of those issues are as follows and will be given particular attention throughout the planning process. Issue Number One: Protect Airspace/Dispose of Obstructions to Navigable Airspace
The grant assurances noted above relate to maintenance of sufficiently clear airspace for unobstructed aircraft operations at the Prosser Airport. Providing and maintaining clearance of existing airspace is addressed along with the potential future airspace needs. Future Airport improvements may expand the Airport’s need for unobstructed airspace and require coordination with various Agencies.
Issue Number Two: Ensure Runway Length Adequacy
This issue, and the remaining issues, are somewhat related and have the potential to substantially change Prosser Airport in the long-term. In general, and as discussed in the upcoming sections, runway lengths are determined based upon the requirements for the aircraft that use them. Now and possibly in the future, a sufficient quantity of demanding aircraft may use the Airport in a frequency to suggest an increase in runway length is needed.
Issue Number Three: Identify Airfield Design Standards/Ensure Adequacy
Similar to the runway length adequacy concern of the previous issue, a sufficient number of aircraft may now, or in the future, use the Airport, triggering modifications of the Airport’s design standards, including pavement strength, length, widths, separations, and other physical, on-the-ground features.
Issue Number Four: Identify and Address Landside Needs
This final issue is somewhat of a catch-all for other issues. Landside in this context relates to aircraft parking aprons, tie-down and hangar spaces, aircraft fueling and other services provided to the flying public, automobile access and parking, and
other important features which serve to support the airside of the Airport.
1.3 PLANNING PROCESS
The Master Plan Update develops through a planning process which begins with the collection of data and mapping efforts used in the study and develops the associated Airport Layout Plan (ALP) drawings for the Airport. The documentation of the Master Plan Update planning process and the ALP drawings is prepared in accordance with FAA guidelines, policies and procedures and applicable federal and state laws and standards. Previous reports and associated work are reviewed, as necessary.The project process is engaged in full coordination with the Port of Benton, federal, state, and local planning agencies, the representatives of which are consulted for input and invited to attend progress meetings, public meetings or other meetings associated with the process. The end result provides a planning document recommending a responsive course of action and a scheduled plan, complete with current cost estimates for facility improvements.Prior to initiation of this project, the prerequisite project scope of services, budget and schedule were reviewed in detail for appropriateness and economic responsibility prior to being approved by the FAA. The planning process and its project workflow consist of four project phases, described as below and in upcoming pages.
1.3.1 PROJECT PARTICIPANTSThe Port of Benton Commissioners make final decisions about the future of the Prosser Airport through the course of the master planning process. Various airport constituencies, including the general public, and nearby home and business owners are consulted through the public participation process. John Haakenson, Director of Airports and Operations, is the primary information conduit for the master plan consultant. FAA is responsible for reviewing and approving the aviation activity forecasts and internally circulating the Plan for integration in the National Airspace System (NAS). FAA and WSDOT are advised on project progress and documents at key project points. The airport master plan consultant prepares project documentation, guides project progress, soliciteds guidance, and works to build consensus from Plan participants at key project points.

AIRPORT MASTER PLAN UPDATE 1-3
PROSSER AIRPORT - S40C
hapter 1 Introduction
Chapter 2
Existing Conditions
Chapter 3
Aviation Activity Forecasts
Chapter 4
Facility Requirem
entsC
hapter 5 Alternatives Analysis
Chapter 6
Phased Developm
ent and C
ost Estimates
Chapter 7
Airport Layout Plan and D
rawings
1.3.2 PROJECT PHASE ONE Phase One project activities includes the drafting of Chapter Two: Inventory and Chapter Three: Forecasts of Aviation Demand. Efforts associated with Chapter Two involves information acquisition not limited to; existing facilities and previous improvements, aerial and land based surveys, identifying land uses, airspace and navigational aids, along with gathering socioeconomic, environmental, and financial data. Efforts associated with Chapter Three include evaluation and formulation of socioeconomic and aviation activity projections culminating in aviation activity forecasts specific to three future periods of time: Short, the initial five-year period, Intermediate, the following five-year period, and Long term, the last 10-year period of the 20-year planning horizon. FAA and WSDOT reviews and comments on these first three chapters, and approves the Aviation Activity Forecasts. Comments are also solicited and addressed from the TAC, Public, and Port Commissioners.
1.3.3 PROJECT PHASE TWO With FAA approval of the Aviation Activity Forecasts, the planning process then moves to Phase Two. Chapter Four: Facility Requirements are initially developed using information gathered in previous work with the Airport and the Port of Benton. Efforts associated with Chapter Four involve evaluation of the Airport’s service capabilities along with physical airside and landside requirements and an appraisal of grant assurance compliance and airport security requirements. Chapter Five: Alternatives Analysis considers various airfield and landside improvement alternatives which may meet demand over the three planning periods. These alternatives are presented to the TAC for consideration and comment. FAA and WSDOT reviews and comments on Chapters Four and Five. Comments are also solicited and addressed from the TAC and Port Commissioners. The Port of Benton, together with input from the TAC, Planning Consultant, and FAA, ultimately select the preferred alternative(s) as presented in this Plan. This is the most crucial and important step in the creation of this Plan and execution of its process.
1.3.4 PROJECT PHASE THREE Phase Three work includes creation of Chapter Six.Chapter Six: Phased Development and Cost Estimates which sequences and provides cost estimates for Airport improvements pursuant to the preferred alternative(s). This phase also includes development of Chapter Seven: Airport Layout Plan and Drawings, which depict
existing and future airport features and improvements per FAA’s Standard Operating Procedures 2.00 Airport Layout Plan checklist. FAA and WSDOT review these chapters and provide comments, resulting in the Pre-Draft Plan. The pre-draft narrative describes and illustrates the recommended course of action, over the 20-year planning period. Comments are solicited from the TAC and Director of Airports and Operations and addressed prior to presenting the Pre-Draft Plan to the public with the Port of Benton to discuss the document and its recommendations. Once comments from FAA, WSDOT, the TAC, and Port of Benton are sufficiently addressed, Phase Three concludes, with the Draft Airport Master Plan.
1.3.5 PROJECT PHASE FOUR The Plan process then moves to its final phase. with the approval of the Draft Master Plan. The Draft Master Plan narrative and associated ALP drawings are submitted to FAA for coordination. Coordination or ‘airspacing’, is an FAA internal, multi-jurisdictional 2 to 3-month process. It consists of an internal review process wherein the Plan and ALP drawings are reviewed for continuity and conformity to FAA standards and specifications, and principal changes are included in the National Airspace System.
1.3.6 PROJECT PHASE FIVE The fifth and final project milestone involves the Port of Benton Commissioners concurrence with the Final Airport Master Plan. Upon completion of the Plan narrative report, full-size (24” x 36”) copies of the ALP Drawings are signed by the Port of Benton and the FAA, and are kept on file along with the narrative report at the respective offices of the FAA Seattle Airport District Office, the Port of Benton and the master plan consultant.
1.4 CONSULTANT AGREEMENT AND STUDY DOCUMENTATION
The Port of Benton entered into an agreement with J-U-B ENGINEERS, Inc. in August 2015 to conduct the master planning effort and to prepare this document.

AIRPORT MASTER PLAN UPDATE 1-4
PROSSER AIRPORT - S40C
hapter 1 Introduction
Chapter 2
Existing Conditions
Chapter 3
Aviation Activity Forecasts
Chapter 4
Facility Requirem
entsC
hapter 5 Alternatives Analysis
Chapter 6
Phased Developm
ent and C
ost Estimates
Chapter 7
Airport Layout Plan and D
rawings
1.4.1 REFERENCE DOCUMENTS This study is prepared in accordance with these documents:Previous Airport Documents (Various Years)Various Local and State Resources and WebsitesWSDOT Aviation Documents (System Plan, Pavements, Economic, Land Use)Various Airport Cooperative Research Program (ACRP) Documents
FAA Terminal Area Forecast (TAF) and Other FAA Forecast Approval-Related GuidanceFAA Memoranda, Regional and Interim Guidance
FAA SOP 2.0 Standard Procedure for FAA Review and Approval of Airport Layout Plan (ALPs)
FAA SOP 3.0 Standard Operating Procedure for FAA Review and Approval of Exhibit ‘A’ Airport Property Inventory Maps
FAA SOP 6.0 Standard Operating Procedure for FAA Review and Approval of Airport Improvement Program (AIP) Grant Application
FAA SOP 8.0 Standard Operating Procedure for Runway Safety Area Determination
150/5190-4A A Model Zoning Ordinance to Limit Height of Objects around Airports
150/5070-6B Airport Master Plans150/5190-7 Exclusive Rights and Minimum
Standards for Commercial Aeronautical Activities
150/5300-13A (1) Airport Design150/5340-1L Standards for Airport Markings150/5340-18F Airport Sign System Standards150/5300-16A General Guidance and
Specifications for Aeronautical Surveys
150/5300-17C General Guidance and Specifications for Aeronautical Survey Airport Imagery Acquisition and Submission to NGS
150/5300-18B General Guidance and Specifications for Submission of Aeronautical Surveys to NGS; Field Data and Collection and GIS Standards
150/5020-1 Noise Control and Compatibility Planning for Airports
150/5050-4 Citizen Participation in Airport Planning
150/5230-4B Aircraft Fuel Storage, Handling and Dispensing on Airports
150/5325-4B Runway Length Requirements for Airport Design
150/5340-5D Segmented Circle Airport Marker System
150/5390-2C Heliport Design5190.6B Airport Compliance Manual5200.8 Runway Safety Area Program5100.38C Airport Improvement Program
Handbook5100.37B Land Acquisition and Relocation
Assistance for Airport Projects5090.3C Field Formulation of the National
Plan of Integrated Airport Systems (NPIAS)
5050.4B NEPA Implementing Instruction for Airport Actions
1050.1F Environmental Impacts; Policies and Procedures
Various FAA Advisory Circulars for Landing and Visual Aids, Pavements Design and Maintenance
Environmental Desk Reference for Airport Actions

AIRPORT MASTER PLAN UPDATE 1-5
PROSSER AIRPORT - S40C
hapter 1 Introduction
Chapter 2
Existing Conditions
Chapter 3
Aviation Activity Forecasts
Chapter 4
Facility Requirem
entsC
hapter 5 Alternatives Analysis
Chapter 6
Phased Developm
ent and C
ost Estimates
Chapter 7
Airport Layout Plan and D
rawings
1.4.2 NARRATIVE REPORT CONTENT This narrative report presents these chapters:
Chapter 1 IntroductionChapter 2 Existing ConditionsChapter 3 Forecasts of Aviation DemandChapter 4 Facility Requirements Chapter 5 Alternatives AnalysisChapter 6 Phased Development and Cost
EstimatesChapter 7 Airport Layout Plan and
Drawings
Appendices:Appendix A Planning for ComplianceAppendix B Airport Recycling PlanAppendix C RPZ MemorandumAppendix D Public Involvement Summary
These ALP Drawings are found in Chapter 7:
Cover and IndexExhibit 2 Airport Layout PlanExhibit 3 Technical Data Exhibit 4 Airport Airspace PlanExhibit 5 Inner Portion of Runway 8
Approach Surface DrawingExhibit 6 Inner Portion of Runway 26
Approach Surface DrawingExhibit 7 Terminal Area Plan Exhibit 8 Land Use PlanExhibit 9 Airport Property Inventory Map
(Exhibit A)

AIRPORT MASTER PLAN UPDATE 2-1
PROSSER AIRPORT - S40C
hapter 1 Introduction
Chapter 2
Existing Conditions
Chapter 3
Aviation Activity Forecasts
Chapter 4
Facility Requirem
entsC
hapter 5 Alternatives Analysis
Chapter 6
Phased Developm
ent and C
ost Estimates
Chapter 7
Airport Layout Plan and D
rawings
CHAPTER 2 - EXISTING CONDITIONS
2.0 INTRODUCTION
This chapter intends to provide background information and an inventory of the Airport and its environs. Quality, relevant baseline information in this regard is necessary for plan integrity. Data herein is obtained from investigation and interviews, consulting firm experience with the Airport and its projects along with Port of Benton staff guidance, FAA input, WSDOT consultation, along with various other governmental agencies and websites.Prosser Airport is owned, operated, and sponsored by the Port of Benton and managed and guided by the Port’s Commissioners through John Haakenson, Director of Airports and Operations.
2.1 BRIEF AREA HISTORY
Prosser is located near the eastern end of the Yakima Valley and the Yakima River runs through the City. The Prosser area was home to Native Americas who lived along and fished the Yakima river as a food source prior to the area being settled in 1882 by Colonel William Farrand Prosser. Soon after homesteading began, the Northern Pacific Railroad made a connection to Prosser, making it a part of a transcontinental railroad network. A town plat was filed by Colonel Prosser in 1885 and the City of Prosser was officially incorporated in 1899 with a population of 229 people. In 1905, Benton County was established through taking portions of Yakima and Klickitat counties. The City of Prosser was established as the county seat. The greater Prosser area is now at the heart of Washington’s Wine County with nearly 40 wineries in the area.
2.2 BRIEF AIRPORT HISTORY
Prosser Airport was first established in 1935 with development of a turf airstrip. It was originally owned by the City of Prosser. In 1961 it was transferred to the Port of Benton. Since its inception, Prosser Airport has served the regional aviation community as a general aviation airport. The Port provides for multi-modal transportation including two airports (Prosser and Richland), short line rail, barge, and trucking amenities. The Prosser Airport is located in Benton County one mile northwest of the Prosser central business district. It occupies 120 acres of land of which approximately 100 acres are used for aeronautical uses. Table 2-1 provides a brief overview of project history.
2.3 AIRPORT ROLE
This planning effort is intended to instruct and supplement state and federal airport planning efforts. This Plan is a more detailed look at the Prosser Airport, while national and state planning step back somewhat and generally consider the role the Prosser Airport plays in the overall system of federal and state airports.As part of Washington State’s Aviation System, Prosser Airport is one of 134 public-use airports statewide and is an important resource to the state’s overall transportation network. It also functions as part of the National Airspace System that links regional and local airports to the larger integrated transportation system. Figure 2-1 shows the South Central Region of Washington State Public Use Airports.
AIRPORT MASTER PLAN UPDATE 2-2
PROSSER AIRPORT - S40C
hapter 1 Introduction
Chapter 2
Existing Conditions
Chapter 3
Aviation Activity Forecasts
Chapter 4
Facility Requirem
entsC
hapter 5 Alternatives Analysis
Chapter 6
Phased Developm
ent and C
ost Estimates
Chapter 7
Airport Layout Plan and D
rawings
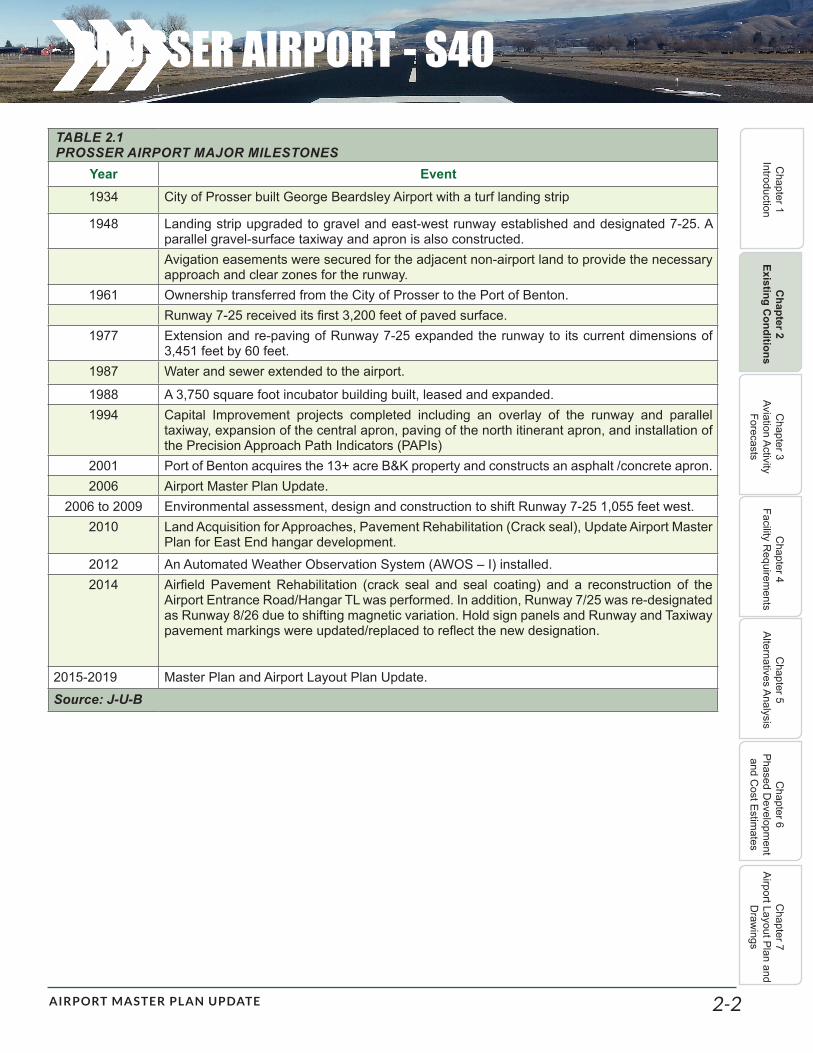
TABLE 2.1 PROSSER AIRPORT MAJOR MILESTONES
Year Event1934 City of Prosser built George Beardsley Airport with a turf landing strip
1948 Landing strip upgraded to gravel and east-west runway established and designated 7-25. A parallel gravel-surface taxiway and apron is also constructed.Avigation easements were secured for the adjacent non-airport land to provide the necessary approach and clear zones for the runway.
1961 Ownership transferred from the City of Prosser to the Port of Benton.Runway 7-25 received its first 3,200 feet of paved surface.
1977 Extension and re-paving of Runway 7-25 expanded the runway to its current dimensions of 3,451 feet by 60 feet.
1987 Water and sewer extended to the airport.
1988 A 3,750 square foot incubator building built, leased and expanded.1994 Capital Improvement projects completed including an overlay of the runway and parallel
taxiway, expansion of the central apron, paving of the north itinerant apron, and installation of the Precision Approach Path Indicators (PAPIs)
2001 Port of Benton acquires the 13+ acre B&K property and constructs an asphalt /concrete apron.2006 Airport Master Plan Update.
2006 to 2009 Environmental assessment, design and construction to shift Runway 7-25 1,055 feet west.2010 Land Acquisition for Approaches, Pavement Rehabilitation (Crack seal), Update Airport Master
Plan for East End hangar development.2012 An Automated Weather Observation System (AWOS – I) installed.2014 Airfield Pavement Rehabilitation (crack seal and seal coating) and a reconstruction of the
Airport Entrance Road/Hangar TL was performed. In addition, Runway 7/25 was re-designated as Runway 8/26 due to shifting magnetic variation. Hold sign panels and Runway and Taxiway pavement markings were updated/replaced to reflect the new designation.
2015-2019 Master Plan and Airport Layout Plan Update.Source: J-U-B

AIRPORT MASTER PLAN UPDATE 2-3
PROSSER AIRPORT - S40C
hapter 1 Introduction
Chapter 2
Existing Conditions
Chapter 3
Aviation Activity Forecasts
Chapter 4
Facility Requirem
entsC
hapter 5 Alternatives Analysis
Chapter 6
Phased Developm
ent and C
ost Estimates
Chapter 7
Airport Layout Plan and D
rawings
2.3.1 FEDERAL PLANNING Prosser Airport is part of the US National Transportation System and the Federal Aviation Administration’s (FAA) National Plan of Integrated Airport Systems (NPIAS). Of the nation’s nearly 5,200 public-use airports, the NPIAS comprises 3,331 airports which are considered, by FAA, significant to the capacity and integrity of the national airspace system. Because of NPIAS participation, the Port of Benton, as sponsor is eligible, and has received federal funding for airport improvements under the Airport Improvement Program (AIP). Funds to pay for NPIAS improvements originate with the AIP program. AIP is a user-fee based program, funded through the Airport and Airways Trust Fund as originated through the Airport and Airway Improvement Act of 1982, as amended. This grant-in-aid program provides the funding to execute most federal, state and local airport planning. This planning effort, along with planning done by WSDOT may be used to consider the quality and quantity of Prosser Airport’s participation in the NPIAS. The current NPIAS identifies the Airport as a public use,
local (as opposed to basic service, regional service or an airport of national importance) general aviation airport, with 51 based aircraft and $2,722,200 of anticipated development needs for eligible improvements. FAA has also fielded two system planning documents for general aviation airports:
• ASSET 1: General Aviation Airports: A National Asset (May 2012)
• ASSET 2: In-Depth Review of the 497 Unclassified Airports (March 2014)
These efforts serve to segregate general aviation airports into service levels based upon type (propeller/jet) of based aircraft and aircraft operations.
2.3.2 STATE PLANNING Prosser Airport is eligible to receive funding through WSDOT and other state agencies. State law directs WSDOT to perform periodic system plan updates in response to changes in the aviation industry, community, and system. WSDOT has received funds from FAA to update the Washington Aviation System Plan (WASP)
FIGURE 2-1 WASHINGTON STATE PUBLIC USE AIRPORTS
Source: WSDOT

AIRPORT MASTER PLAN UPDATE 2-4
PROSSER AIRPORT - S40C
hapter 1 Introduction
Chapter 2
Existing Conditions
Chapter 3
Aviation Activity Forecasts
Chapter 4
Facility Requirem
entsC
hapter 5 Alternatives Analysis
Chapter 6
Phased Developm
ent and C
ost Estimates
Chapter 7
Airport Layout Plan and D
rawings
and is being overseen by the Washington State Aviation System Plan Advisory Committee. The primary purpose of the WASP update is to study the performance and interaction of Washington’s entire aviation system; and, to understand the contributions of individual airports to the system as a whole. Additionally, the study involves examining aviation user requirements, current airport usage levels and based aircraft and capacity to meet current and future demand. At the time of this Master Plan the most recent WASP was completed in 2009, while the 2015 update is currently underway, but not complete. The timeline on the WASP study is to have the plan finalized by January 2017. The 2009 WASP identifies the Prosser Airport as one of 23 Community Service Airports. The Distribution of Airport is defined as follows:
• Commercial Service - Accommodates at least 2,500 scheduled passenger boardings per year for at least three years.
• Regional Service - Serves large or multiple communities; all NPIAS relievers; 40 based aircraft and 4,000-foot long runway, with exceptions.
• Community Service - Serves a community; fewer than 20 based aircraft; paved runway.
• Local Service - Serves a community; fewer then 230 based aircraft; paved runway.
• Rural Essential - Other land-based airports, including residential airports.
The Washington State legislature (ESSB 5121) designated four geographic regions in the state for special attention in the Long-Term Air Transportation Study (LATS) (2009). These four regions, known as Special Emphasis Regions (SER) in the study, concentrated key centers of population, employment, and economic activity in Washington. The Washington State Legislature deemed it essential to ensure that airport facilities within these regions support current conditions and future needs. One of the four designated Special Emphasis Regions is the Tri-Cities consisting of Benton and Franklin Counties. The LATS performance objectives for Community Service Airports such as Prosser are focused on providing airports with the capability to accommodate medevac and air taxi operations, including potential operations in very light jets (VLJ). The WSDOT 2012 Airport Economic Profile estimates regional impacts from visitor spending account for $94,000 of wages and $287,000 of total economic activity were related to the Prosser Airport in 2010. The Airport Economic Profile notes that 46 aircraft based at Prosser in 2012 along with 6,000 general aviation operations that same year consisting of general itinerant
and local operations. WSDOT occasionally performs inventories of airfield pavement conditions at various airports, including Prosser using the pavement condition index (PCI) procedure set forth by the FAA and is the standard used by the aviation industry to visual assess pavement conditions. The results of the PCI evaluation provide an indicator of the structural integrity and functional capability of the pavement. WSDOT’s 2012 Pavement Management Program Update identifies the following numerical reference index ranges:
• PCI Score of 0-10: Reconstruction• PCI Score of 11-25: Reconstruction• PCI Score of 26-40: Reconstruction• PCI Score of 41-55: Major Rehabilitation• PCI Score of 56-70: Preventative Maintenance/
Major Rehabilitation• PCI Score of 71-85: Preventative Maintenance• PCI Score of 86-100: Preventative Maintenance
Table 2.2 and Figure 2-2 depict the 2012 Pavement Conditions Indices at the Prosser Airport.
TABLE 2.2 PAVEMENT CONDITION INDEX INVENTORYSECTION PCI
Runway 8/26East end 82West end 100
ApronsNorth Apron - West Portion 68North Apron - East Portion 82FBO Apron East 77FBO Apron West 76Fueling apron/PCC 79East hangar TL area 86East hangar TL area 100East hangar TL area 96East hangar TL area 91Main apron 79West Holding bay apron 100
Taxiways Taxiway A3 80Taxiway A 89Taxiway A West 100Portion of Taxiway A4 78Taxiway A4 100Source: WSDOT
AIRPORT MASTER PLAN UPDATE 2-5
PROSSER AIRPORT - S40C
hapter 1 Introduction
Chapter 2
Existing Conditions
Chapter 3
Aviation Activity Forecasts
Chapter 4
Facility Requirem
entsC
hapter 5 Alternatives Analysis
Chapter 6
Phased Developm
ent and C
ost Estimates
Chapter 7
Airport Layout Plan and D
rawings
WSDOT occasionally performs an analysis to estimate the economic impacts of Washington airports. The Washington State Department of Transportation 2012 Airport Economic Impact Study provided an economic profile for the Prosser Airport expressed in 2010 dollars. The estimated regional impact to Benton and Yakima counties from airport business was $332,000. Estimated statewide impacts from visitor spending was $287,000, and the estimated taxes paid were estimated at $23,110. The analysis of economic activity was based upon the Prosser Airport. The Port of Benton has over $53 million in assets; 10 sites over 2,103 acres and manages a $9.8 million budget with operations covered by lease income and taxes dedicated to capital projects.
2.3.3 PREVIOUS AIRPORT PLANNINGThe most recent airport planning document on file is an Airport Master Plan update dated July 2006. That narrative and its Airport Layout Plan (ALP) drawings provided the matter-of-course planning analyses including identifying a number of non-standards conditions and obstructions to navigable airspace, development alternatives and a recommended course of action per a series of phased improvements. Table 2.3 identifies historical FAA and WSDOT grant funding.

PROSSER AIRPORT - S40
AIRPORT MASTER PLAN UPDATE 2-6
Chapter 1
IntroductionC
hapter 2 Existing C
onditionsC
hapter 3 Aviation Activity
Forecasts
Chapter 4
Facility Requirem
entsC
hapter 5 Alternatives Analysis
Chapter 6
Phased Developm
ent and C
ost Estimates
Chapter 7
Airport Layout Plan and D
rawings
Prosser
PCI Legend: 0-10 11-25 26-40 41-55 56-70 71-85 86-100
R07PR-01 (82)
A04PR-01 (79)
T03PR-01 (78)
T02PR-01 (89)
A03PR-03 (96)
A02PR-03 (79)
A02PR-01 (77)
A02PR-02 (76)
A01PR-02 (82)
A01PR-01 (68)
T02PR-02 (100)
R07PR-02 (100)
A05PR-01 (100)
A03PR-04 (91)
T04PR-01 (100)
T01PR-01 (80)
A03PR-01 (86)
A03PR-02 (100)
Prosser http://www.appliedpavement.com/hosting/washington/#path=2/60
1 of 1 8/23/2016 10:12 AM
Source: Washington Aviation System Plan
FIGURE 2-2 2012 PAVEMENT CONDITIONS INDICES AT THE PROSSER AIRPORT

PROSSER AIRPORT - S40
AIRPORT MASTER PLAN UPDATE 2-7
Chapter 1
IntroductionC
hapter 2 Existing C
onditionsC
hapter 3 Aviation Activity
Forecasts
Chapter 4
Facility Requirem
entsC
hapter 5 Alternatives Analysis
Chapter 6
Phased Developm
ent and C
ost Estimates
Chapter 7
Airport Layout Plan and D
rawings
TABLE 2.3 HISTORICAL FAA AND WSDOT GRANT FUNDING
Work site: Prosser Airport, Prosser, Washington Locid: The Prosser Airport FAA Funding5% State
MatchPort of Benton Project Total WSDOT
Grant No.Grant Number FY Description Non-Primary
EntitlementState
Apportionment FAA Total
9-45-022-701 1948 Land acquisition; Clearing; Grading & drainage of landing area (300’x3873’), taxiways & building area; Construct runway (100’x3673’), Taxiways, apron, access road & automobile parking area;
$13,756 $- $13,756 $724 $14,480
9-45-022-002 1950 Install airport lighting system include Medium Intensity Runway Lighting; Install segmented circle
$6,317 $- $6,317 $332 $6,649
PGP A-53-0050-01 1975 Preparation of an Airport Master Plan for George O. Beardsley Field $7,667 $- $7,667 $404 $8,070 5-53-0050-01 1977 Acquire land (Areas B1, B2, & C4); Install lighted wind cone, segmented
circle, & rotating beacon; obstruction removal; Reconstruct & mark Runway 7/25 including turnarounds(3,480’x60’); Construct access road (290’x30’); construct & mark stub Taxiway Continued
$150,000 $100,000 $250,000 $13,158 $263,158
(275’x30’); Construct aircraft parking & service apron (4,900 sy); Rehabilitate Medium Intensity Runway Lighting
$- $- $- $-
5-53-0050-02 1981 Construct & mark parallel taxiway $94,705 $- $94,705 $4,984 $99,690 3-53-0050-01 1989 Master plan update; $40,500 $- $40,500 $2,132 $42,632 3-53-0050-02 1991 Acquire land, Parcels C-1A & C-1B, include relocation $130,681 $- $130,681 $6,878 $137,559 3-53-0050-03 1995 Overlay Runway 7/25; Overlay parallel & connector Taxiways; Overlay
& expand General Aviation apron; Install perimeter fencing (2,244 l.f.); Install Precision Approach Path Indicator, Runway 7/25; Revise Airport Layout Plan
$150,000 $271,365 $421,365 $22,177 $443,542
3-53-0050-04 1999 Acquire land for development (Tracts 7&9); Update Exhibit A $108,507 $- $108,507 $5,711 $114,218 3-53-0050-05 2000 Install/reconstruct Runway 7/25 medium intensity runway lightings
(MIRL); Construct general aviation aprons, including connecting taxiways; Construct t-hangar taxiways; Construct access road; Install signs;
$150,000 $690,785 $840,785 $44,252 $885,037
3-53-0050-006 2002 Update airport master plan study $85,303 $- $85,303 $4,490 $89,793 3-53-0050-007 2003 Install perimeter fencing (approx. 7,700 l.f. include gates) $99,703 $- $99,703 $5,248 $104,951 3-53-0050-008 2004 Rehabilitate Runway 7/25 and taxiways (slurry seal); Install pilot radio
controls on Runway 7/25 lighting; Install Runway End Identification Lights (REILs) Runway 7/25; Replace beacon including tower
$150,000 $14,744 $164,744 $8,671 $173,415
3-53-0050-009 2006 Relocate/shift Runway 7/25, including environmental (Phase 1); Conduct ALP update
$150,000 $1,789 $151,789 $7,989 $159,778
3-53-0050-010 2008 Relocate/shift Runway 7, including land , Parcel 13 (Smith) and Parcel 15 (DeLeon) acquisition (Phase 2)
$88,104 $- $88,104 $4,637 $92,741
3-53-0050-011 2009 Relocate/shift Runway 7, including land , Parcel 20 (Sybouts), Parcel 21 (Killian) and parcel 22 (McGrew) acquisition and construction (Phase 3)
$150,000 $2,201,572 $2,351,572 $72,750 $51,017 $2,475,339 PRO-01-09
3-53-0050-012 2009 Extend/shift Runway 7 (Phase 4), including shifting the parallel taxiway $150,000 $408,402 $558,402 $29,390 $587,792 3-53-0050-013 2010 Acquire approach land Parcel 14 (Whited), Parcel 15 (DeLeon), Parcel
16 (Martin): Rehabilitate Runway 7/25, taxiways and aprons (crack seal); Update Airport Layout Plan;
$150,000 $496,208 $646,208 $34,011 $680,219

PROSSER AIRPORT - S40
AIRPORT MASTER PLAN UPDATE 2-8
Chapter 1
IntroductionC
hapter 2 Existing C
onditionsC
hapter 3 Aviation Activity
Forecasts
Chapter 4
Facility Requirem
entsC
hapter 5 Alternatives Analysis
Chapter 6
Phased Developm
ent and C
ost Estimates
Chapter 7
Airport Layout Plan and D
rawings
TABLE 2.3 HISTORICAL FAA AND WSDOT GRANT FUNDING
Work site: Prosser Airport, Prosser, Washington Locid: The Prosser Airport FAA Funding5% State
MatchPort of Benton Project Total WSDOT
Grant No.Grant Number FY Description Non-Primary
EntitlementState
Apportionment FAA Total
3-53-0050-014 2012 Install Weather Reporting Equipment $150,000 $14,966 $164,966 $- $18,330 $183,296 3-53-0050-015 2014 Rehabilitate Apron, Rehabilitate Runway - 07/25, Magnetic Variation
Update Rwy to 8/26 $150,000 $323,538 $473,538 $- $52,615 $526,153
3-53-0050-016 2015 Update Airport Master Plan Study $150,000 $116,537 $266,537 $- $29,615 $296,152
Source: FAA

AIRPORT MASTER PLAN UPDATE 2-9
PROSSER AIRPORT - S40C
hapter 1 Introduction
Chapter 2
Existing Conditions
Chapter 3
Aviation Activity Forecasts
Chapter 4
Facility Requirem
entsC
hapter 5 Alternatives Analysis
Chapter 6
Phased Developm
ent and C
ost Estimates
Chapter 7
Airport Layout Plan and D
rawings
2.4 AIRPORT INVENTORY
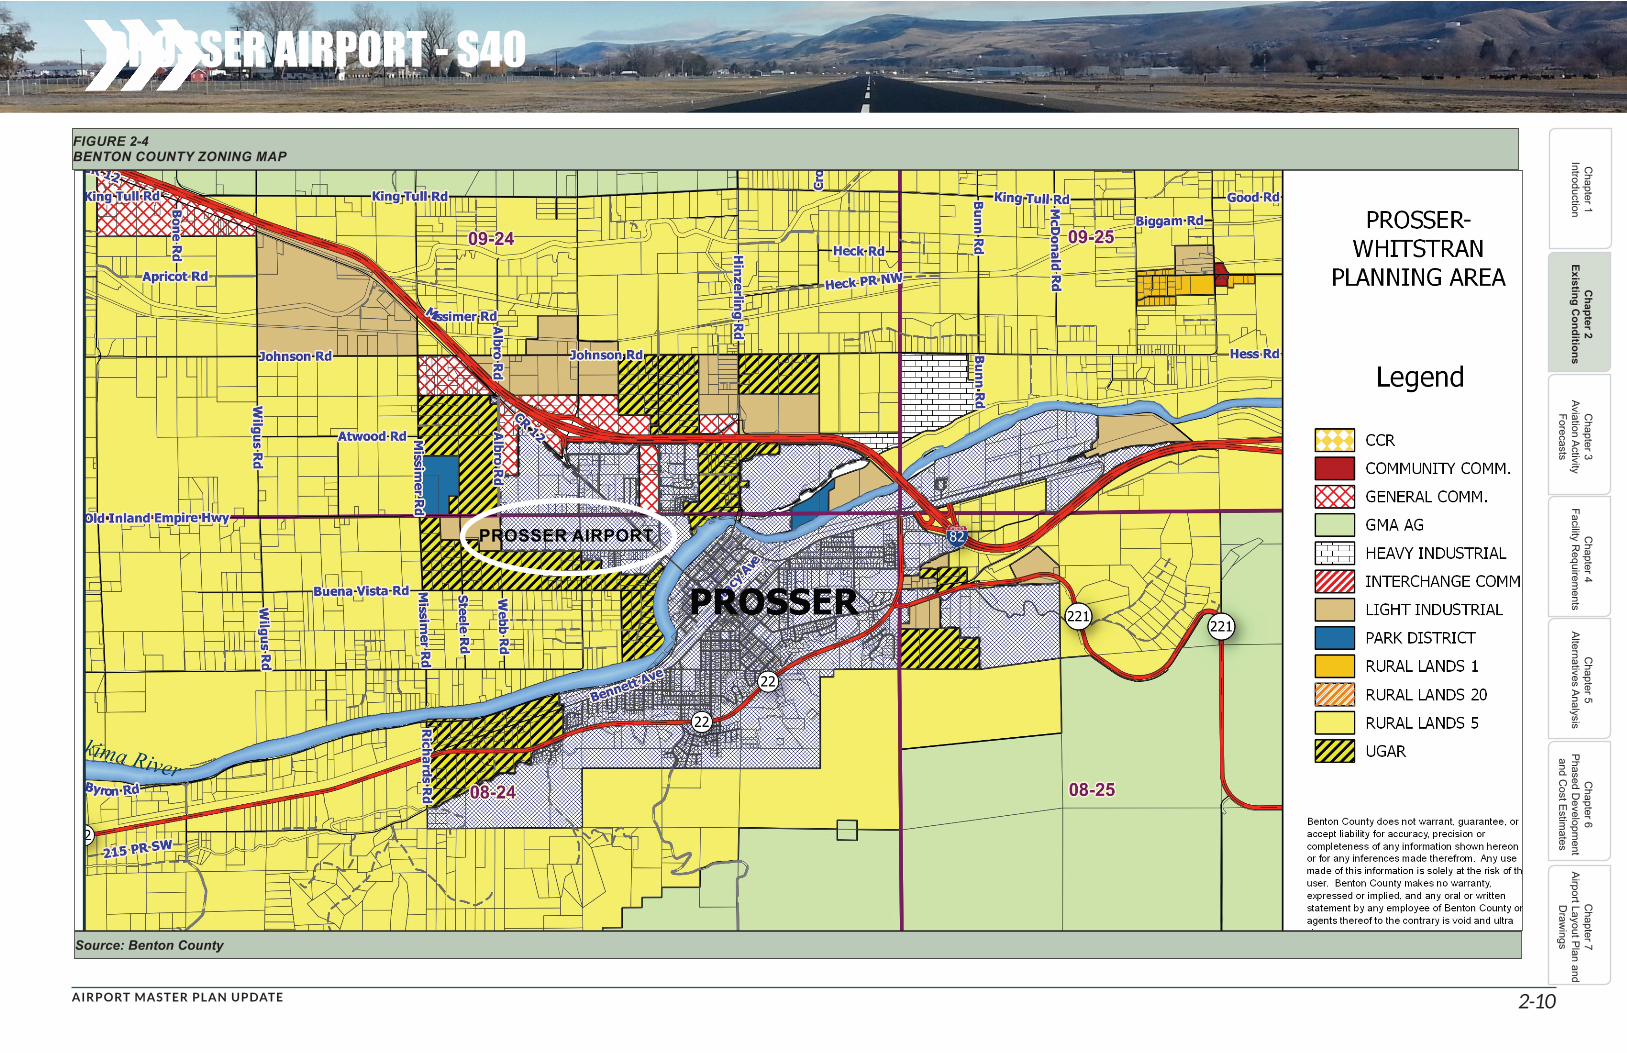
Prosser Airport is located within the limits of both the City of Prosser and Benton County and is in the Benton-Franklin-Walla Walla Regional Transportation Planning Organization (RTPO). The closest interstate to the Prosser Airport is I-82, (approximately 1.3 miles to the north) and the closest Federal highway is US 12 (also approximately 1.3 miles to the north). The closest state highway is the Old Inland Empire Highway which runs adjacent to the Prosser Airport along its northern boundary. The Yakima River lies to the south of the airport. The Prosser Airport is bordered on all four sides by public roads. Primary vehicle access to the airport is on the south side via Nunn Road. Figure 2-3 shows the Prosser Airport in relation to Benton County and the City of Prosser while Figures 2-4 and 2-5 show the zoning for each jurisdiction, respectively. Prosser Airport is located near North 46o 12’ 48.1372” and West 119o 47’ 44.0264” and at 705 foot elevation. Prosser Airport properties currently approximate 120 total acres with an estimated 100 acres for aeronautical uses. The Prosser Airport is equipped with a rotating beacon. The rotating beacon alternates green and white,
indicating nighttime availability of a public-use, civilian airport. The airport also equipped with an Automated Weather Observing System (AWOS), located on the south side of the runway and west of the west apron. The AWOS provides real-time local weather information for the flying public and can be reached at 121.125 MHz or by dialing 509-786-8889. A Segmented Circle is located on the north side of the runway. The Segmented Circle indicates traffic pattern, and found within the circle is a lighted primary Wind Cone displaying wind vector information. A supplemental Wind Cone is found near the end Runway 8 end on the north side and is not lighted.
2.4.1 RUNWAY 8-26Runway 8-26 is 3,451 feet long and is 60 feet wide. It is constructed of asphalt with a 16,000 single-wheel gear (SWG) pavement strength and is in good condition. The wheel (single, double, dual-double) nomenclature refers to a pavement design methodology which produces a pavement strength referenced to the number of wheels on a given aircraft strut. Design inputs in this regard include soil type and other soil characteristics, sub grade/base soil improvements, loading, frequency and mix of aircraft which are expected to use the pavement,
FIGURE 2-3 PROSSER AIRPORT VICINITY MAP
Source: J-U-B
Prosser Airport
PROSSER AIRPORT - S40
AIRPORT MASTER PLAN UPDATE 2-10
Chapter 1
IntroductionC
hapter 2 Existing C
onditionsC
hapter 3 Aviation Activity
Forecasts
Chapter 4
Facility Requirem
entsC
hapter 5 Alternatives Analysis
Chapter 6
Phased Developm
ent and C
ost Estimates
Chapter 7
Airport Layout Plan and D
rawings
FIGURE 2-4 BENTON COUNTY ZONING MAP
Source: Benton County
PROSSER AIRPORT

PROSSER AIRPORT - S40
AIRPORT MASTER PLAN UPDATE 2-11
Chapter 1
IntroductionC
hapter 2 Existing C
onditionsC
hapter 3 Aviation Activity
Forecasts
Chapter 4
Facility Requirem
entsC
hapter 5 Alternatives Analysis
Chapter 6
Phased Developm
ent and C
ost Estimates
Chapter 7
Airport Layout Plan and D
rawings
City of Prosser Zoning Classification
PF (Public Facility)
IL (Industrial Light)
AG (Agri-Business)
CT (Commercial Thoroughfare)
CP (Commercial Professional)
CN (Commercial Neighborhood)
CG (Commercial General)
CD (Commercial Downtown)
AT (Agri-Tourism)
Zoning
RH (Residential High Density)
RM (Residential Medium Density)
RL (Residential Low Density)
RMHP (Residential Manufactured Home Park)
RMS (Residential Manfuctured Home Subdivision)
SSR (Steep Slope Residential)
UR (Urban Residential)
Map Date: 2/6/14
FIGURE 2-5 CITY OF PROSSER ZONING MAP
Source: City of Prosser
PROSSER AIRPORT

AIRPORT MASTER PLAN UPDATE 2-12
PROSSER AIRPORT - S40C
hapter 1 Introduction
Chapter 2
Existing Conditions
Chapter 3
Aviation Activity Forecasts
Chapter 4
Facility Requirem
entsC
hapter 5 Alternatives Analysis
Chapter 6
Phased Developm
ent and C
ost Estimates
Chapter 7
Airport Layout Plan and D
rawings
pavement type and composition, planned pavement life, and other design criteria. In short, pavements are designed to accommodate a designated number of aircraft operations, over time without substantial surface rehabilitation. It is worth noting that the design allows for a limited number of aircraft operations with weights greater than 16,000 pounds. Runway longitudinal line of sight is met. The effective runway longitudinal gradient is 0.5%. FAA design standards require that the effective and the maximum runway longitudinal gradients not exceed certain limits to ensure a runway is not too steep overall or within a shorter distance. Line of sight provides that any two points five feet above the runway centerline shall be mutually visible along any one-half of runway length. Right traffic is established for Runway 26 operations and left traffic to Runway 8. Aircraft generally use all or portions of a rectangular flight pattern, of which the runway constitutes a portion of one side. The traffic pattern at Prosser is designated to keep aircraft north of the airport, and away from the more populated area of the City of Prosser.Medium Intensity Runway Lighting (MIRL) are frangible-mounted (breakable) at the base to avoid substantial damage to the aircraft in the event of an aircraft deviation from the runway. Runway threshold lights are part of the MIRL system and are directionally-lighted to indicate the runway end limits. Runway 8 end threshold lights are frangible-mounted. Runway 26 lights threshold lights are in-pavement.Precision Approach Path Indicator (PAPI) systems are located near each end of the runway, on the south side. The PAPI system is a type of Visual Glideslope Indicator (VGSI) used to provide lighted, visual information to the pilot as descent toward a runway end is made. The PAPI indicates a red and a white light when the pilot is on the correct glideslope to either runway end, two red lights when below the glideslope and two white lights when above. Both runway ends are equipped with Runway End Identifier Lighting Systems (REILs). REILs are frangible-mounted flashing lights situated near each runway end. This lighting system facilitates day or night runway end identification, in clear or semi-obscured weather conditions. Both runway ends are marked with elements appropriate for visual aircraft operation with no aiming points. Runway marking elements at the Prosser Airport include designation (the numbers) and centerline. Runway markings are white. An Instrument Approach Procedure (IAP) is not available for pilots operating at Prosser Airport. An IAP is an FAA-designed and prescribed three-dimensional path in the sky for safe aircraft landing. These paths necessarily
avoid terrain, tall towers and other obstructions to allow safe aircraft operation during periods of inclement weather.
2.4.2 TAXIWAYS AND APRONSParallel Taxiway A is Runway 8-26’s primary taxiway. It is constructed of asphalt at 16,000 SWG. It is 25 feet wide at the west end for the first 1,000 feet east of the Runway 8 end and then 30 feet for the remainder of the taxiway to the end of Runway 26. The taxiway extends the entire length of the runway on the south side providing access to hangars and tie-down facilities. There are two different dimensions for the runway to taxiway centerline separation. On the west end, the separation between Runway 8 and Taxiway A is 235 feet and transitions to a 150-foot separation 1,000 feet east of the Runway 8 end. Connecting Taxiways are constructed of asphalt at 16,000 SWG and vary in width from approximately 85 feet to 25 feet wide at the narrowest width. They are marked with holdlines and equipped with signage 125 feet from Runway 8-26 centerline. There is a 50-foot by 75-foot holding bay apron located at the west end of the Taxiway A. Taxiway markings are yellow and retro-reflective markers are installed for night operations. On the north side of the runway there is a taxiway leading to the North Apron parking area and one hangar. As shown in Table 2.4 below, there are three (3) asphalt apron areas consisting of 39,340 square yards with 71 tie-downs that are rated for 16,000 SWG.
TABLE 2.4 APRON AREAS AND TIE-DOWN INVENTORY
Location Area (sy) No. of Tie-Downs
Main Apron 26,600 46FBO Apron 9,580 16North Apron 3,160 9Total 39,340 71Source: J-U-B
2.4.3 AIRPORT SERVICES AND ACCESSThe Prosser Airport has one FBO, Fair Weather Flyers, who is an authorized aircraft Spruce Dealer, and provides light sport aircraft flight training, full maintenance services, part sales, installations, full restoration services and supplies/gifts as well as performs annual and 100 hour inspections. Bill Musselman is the FBO contact who is also an aviation mechanic along with Jerry Williams. The FBO provides a Pilot’s Lounge with Wi-Fi, a courtesy car to reach local destinations, concierge service for hotel/bed and breakfast stays, and provides catering service

AIRPORT MASTER PLAN UPDATE 2-13
PROSSER AIRPORT - S40C
hapter 1 Introduction
Chapter 2
Existing Conditions
Chapter 3
Aviation Activity Forecasts
Chapter 4
Facility Requirem
entsC
hapter 5 Alternatives Analysis
Chapter 6
Phased Developm
ent and C
ost Estimates
Chapter 7
Airport Layout Plan and D
rawings
for events and gatherings. Fair Weather Flyers’ website is www.fairweatherflyersprosser.com.AVGAS 100 Low Lead (LL) fuel is available 24 hours a day through the use of a credit card machine. The above ground fueling facility holds 2,000 gallons and is located western portion of the FBO Apron, near the rest room. Prosser Airport is accessible from the regional transportation network using Wine Country Road which can be accessed from I-82. The Prosser Airport can be accessed from four (4) improved and unimproved entrances on Nunn Road. A chain link style fence urrounds the airport perimeter and provides two accesses points to Old Inland Empire Highway from the north side of the airport: a pedestrian gate and a vehicle access gate. There is an informal/formal circulation system for automobiles at the Prosser Airport that uses a combination of improved (asphalt) and unimproved (gravel) surfaces. Automobile parking available at various locations provides access to hangars and airport based businesses. There is no marked and signed designated automobile parking at the Airport. The local transit agency, Ben-Franklin Transit, does not provide public transportation services to or from the Prosser Airport. The closest transit center is Stacy Street in the City of Prosser approximately one (1) mile away. The FBO provides a courtesy car that is available for local travel use to reach accommodations or destinations. A private company, Tri-Cities Limo, serves the City of Prosser providing transportation to and from the airport. There are also taxi services based in the Tri-Cities which serve Pasco, Kennewick, Richland, and surrounding areas. The Prosser Airport hosts the Prosser Fly-In each year which is typically sponsored by the Prosser Wing-Nuts, the local chapter of the Experimental Aircraft Association (EAA), and Port of Benton. This often includes a variety of activities including local winery tours that are at the heart of the Washington Wine Country. Additionally, the Greater Prosser Balloon Rally is held annually which includes a weekend full of activities including hot air balloon launches, night glow, harvest festival, farmers market, and the Caren Mercer-Andreason Street Painting Festival.Current companies located at Prosser Airport include Carole’s Flying Machine, Chukar Cherry Company, Connell Oil, Experimental Aircraft Association (EAA) local chapter and Milne Fruit in addition to the aforementioned FBO, Fair Weather Flyers.
2.5 ENVIRONMENTAL
2.5.1 AIRPORT AREA ZONING AND LAND USEThe Prosser Airport is located on land owned by the Port of Benton, located within the jurisdictional limits of both the Benton County and the City of Prosser. Figures 2-4 and 2-5 (located in section 2.4) depict the land use for both jurisdictions. The City and County worked to avoid incompatible land uses surrounding the Prosser Airport. One goal identified in the City of Prosser Comprehensive Plan (Comp Plan) is to provide Prosser Airport with reasonable protection from airspace obstructions, incompatible land uses, and nuisance complaints that could restrict operations. According to the WSDOT Airports and Compatible Land Use Guidebook (January 2011), land uses or activities under the Runway Protection Zone (RPZ) may be compatible with airport uses depending upon location, size, height, density and intensity of use. The associated Comp Plan policy provides direction to:
“keep residential land underlying the air approach to low density and intensity. Residential densities directly east and west of the airport runways will range from one to five dwelling units per acre as appropriate. Intensive commercial uses, that attract significant number of people, should be discouraged.”
Benton County Ordinance Chapter 11.36 provides for the protection of land zoned at Landing Field (L-F) which addresses the property adjacent to the airport. Section 11.36.010 describes the landing field district as the area surrounding existing landing and taxi pavements and precludes any obstructions. Property owners are precluded from erecting any buildings or structures without first applying for re-zoning so that the Planning Commission can determine if any proposed improvements may constitute incompatibility with airport operations.The Washington State Legislature also provides guidance on the siting of incompatible uses around a general aviation airport that is operated for the benefit of the general public such as the Prosser Airport. The WSDOT has established an Airport Land Use Compatibility Planning Program (Program) based upon 36.70.547 Revised Code of Washington (RCW). The Program focuses on providing assistance to stakeholders needing to work to develop land use policies which prevent incompatible land uses adjacent to the airports. In order to comply with the Washington State Legislature’s intent, the Port of Benton has worked to mitigate the risk of any incompatible land uses in the RPZ by purchasing property and working closely with

AIRPORT MASTER PLAN UPDATE 2-14
PROSSER AIRPORT - S40C
hapter 1 Introduction
Chapter 2
Existing Conditions
Chapter 3
Aviation Activity Forecasts
Chapter 4
Facility Requirem
entsC
hapter 5 Alternatives Analysis
Chapter 6
Phased Developm
ent and C
ost Estimates
Chapter 7
Airport Layout Plan and D
rawings
the City of Prosser and Benton County on approval of land uses. Overall, the land use surrounding the Prosser Airport is low in density and intensity. If there are new or modified land uses within the RPZ, then consultation with the FAA is necessary to work towards avoiding the land use issue within the RPZ all together or work to minimize the impact of the proposed land use. Another option is to mitigate the risk of the land use in the RPZ by placing the proposed new or modified land use in a Compatibility Zone with reduced risk. The ideal approach is to remove all incompatible land uses from the RPZ at an airport, but some land uses may be permitted because it is low in density and intensity. The land use to the north of Prosser Airport is classified as residential medium density (RM) and commercial according to the city of Prosser Zoning Map. The Prosser Airport itself is zoned light industrial (IL). The Land Use Map, shown on the next page in Figure 2-6, in the 2014 City of Prosser Comp Plan shows commercial (C) and low medium residential (LMR) land uses surrounding the Airport in the future. The land west of the Runway 8 end, starting at Albro Road and extending west beyond Steele Road and part of the Benton County jurisdiction and is zoned Rural Lands.The FAA has published interim guidance on acceptable land uses in RPZs, intended to enhance safety for individuals and property on the ground. The WSDOT Airport and Compatible Land Use Plan Guidebook (Guidebook) identifies six safety zones to reflect varying degrees of aircraft accident concentrations and also take into account the manner in which aircraft fly as they land and takeoff. The Prosser School District owns two parcels of property on the northeast corner of Old Inland Empire Highway and Missimer Road that is within BentonCounty boundaries and both parcels (8 acres and 22 acres respectively) are zoned as “Park District.” When the property was originally purchased by the Prosser School District, it was intended that a future K-12 school would be constructed to serve the educational demand from the local communities. A portion of these parcels are within safety zones 2, 3 and 6 as identified in Figure 2-7 (WSDOT Airport and Compatible Land Use Safety Zones) and might be considered an incompatible land use creating a conflict to be resolved.A K-12 school should not be permitted within Zones 2 and 3 according to the Guidebook. If a K-12 school is built, it is recommended the buildings be located in Zone 6, as far away from Zones 2 and 3 as permissible, to allow for increased safety. Additionally, the Prosser School District may consider selling the parcels or conducting a land swap with the Port of Benton for land that is not in close proximity to an airport.
2.5.2 CLIMATE Table 2.5 summarizes temperature and precipitation data from the National Oceanic and Atmospheric Administration (NOAA) station located in Prosser (Station Identification: USC00456768). The Western Regional Climate Center (WRCC) characterizes weather in Eastern Washington as:
• Warmer summers and colder winters with less precipitation than in western Washington.
• Annual precipitation ranges from 7-9 inches.• Prevailing westerly winds influence the majority of
air mass and weather system movement.• Frost depth typically reaches 10 to 20 inches in
depth.
2.5.3 WINDA wind analysis was completed using the FAA Standard Wind Analysis tool that performs the wind analysis specified in AC 150/5300-13, Airport Design. Wind data was collected from the nearest station located at the Tri-Cities Airport Station (PSC) as shown on Table 2.6. Wind Roses can be found in Chapter 7. Wind Roses visualize direction and speed combined with the runway alignment to produce a basis for standards conformance. Results indicate that Runway 8-26 does not meet FAA’s recommended 95 percent coverage of wind in all-weather and VFR at 10.5 knots, but does meet the requirements for IFR. FAA details the objectives of wind analysis noting that the desirable wind coverage is 95 percent. That is; a runway, or runways, at a given alignment should have a crosswind component less than a given threshold 95 percent of the time. These thresholds are: 10.5 knots for small aircraft, 13 knots for larger general aviation aircraft, 16 knots for larger turbo-prop and some jet aircraft, and 20 knots for the largest turbine commercial and general aviation turbine aircraft. The underlying notion is that larger aircraft are better able to accommodate crosswind, without regard to pilot skill, but simply because of size.
2.5.4 NEPAFAA Order 1050.1F- Environmental Impacts: Policies and Procedures establishes guidelines for compliance with the 1969 National Environmental Policy Act (NEPA) and the Council on Environmental Quality’s (CEQ) NEPA implementing regulations. NEPA and the CEQ regulations require an environmental review of all federal actions, including projects that utilize federal funds, take place on federally controlled land or necessitate a federal permit. As an Airport under federal jurisdiction, all activities at the Prosser Airport require NEPA compliance.

PROSSER AIRPORT - S40
AIRPORT MASTER PLAN UPDATE 2-15
Chapter 1
IntroductionC
hapter 2 Existing C
onditionsC
hapter 3 Aviation Activity
Forecasts
Chapter 4
Facility Requirem
entsC
hapter 5 Alternatives Analysis
Chapter 6
Phased Developm
ent and C
ost Estimates
Chapter 7
Airport Layout Plan and D
rawings
Classifications
I- Industrial
HDR- High Density Residential
C- Commercial
AT- Agri-Tourism
AB- Agri-Business
LMR- Low Medium Residential
PL- Public Land
SSR- Steep Slope Residential
URB- Urban Residential
City of Prosser Comprehensive PlanLand Use Map
05/16/14
FIGURE 2-6 CITY OF PROSSER COMPREHENSIVE PLAN LAND USE MAP
Source:
PROSSER AIRPORT

AIRPORT MASTER PLAN UPDATE 2-16
PROSSER AIRPORT - S40C
hapter 1 Introduction
Chapter 2
Existing Conditions
Chapter 3
Aviation Activity Forecasts
Chapter 4
Facility Requirem
entsC
hapter 5 Alternatives Analysis
Chapter 6
Phased Developm
ent and C
ost Estimates
Chapter 7
Airport Layout Plan and D
rawings
TABLE 2.5 PROSSER CLIMATE DATA
Month Mean Daily Maximum
Temperature (°F)
Mean Daily Minimum
Temperature (°F)
Precipitation (inches)
Snowfall (inches)
January 41.5 28.2 1.13 0.01February 47.7 30.5 0.83 0.01March 57.9 36.5 0.78 0April 65.9 41.0 0.7 0May 74.4 47.9 0.7 0June 81.6 54.0 0.73 0July 90.1 58.4 0.2 0August 89.2 57.3 0.27 0September 80.0 49.6 0.47 0October 65.9 40.9 0.75 0November 65.9 33.1 1.02 0.03December 50.3 26.7 1.36 0.25Average/Total 67.5 42.0 8.94 0.30
Source: WRCC
TABLE 2.6 WIND INFORMATION
RunwayCrosswind Components
No. of Observations10.5
Knots13
Knots16
Knots20
KnotsALL WEATHER
8/26 92.89% 96.45% 98.96% 99.81% 91,833IFR
8/26 98.02% 98.88% 99.50% 99.81% 84,391VFR
8/26 92.44% 96.24% 98.91% 99.81% 7,556PERIOD: 2005-2015Source: FAA

PROSSER AIRPORT - S40
AIRPORT MASTER PLAN UPDATE 2-17
Chapter 1
IntroductionC
hapter 2 Existing C
onditionsC
hapter 3 Aviation Activity
Forecasts
Chapter 4
Facility Requirem
entsC
hapter 5 Alternatives Analysis
Chapter 6
Phased Developm
ent and C
ost Estimates
Chapter 7
Airport Layout Plan and D
rawings
N
5000 1,000
SCALE IN FEET
AIRPORT SAFETY COMPATIBILITY ZONESFUTURE 1850 FEET EXTENSION
ZONE COLOR ZONE # ZONE DEFINITION
LEGEND
J-U-B ENGINEERS, INC.
FIGURE 2-7 SAFETY ZONE EXHIBIT
Source: J-U-B/WSDOT

AIRPORT MASTER PLAN UPDATE 2-18
PROSSER AIRPORT - S40C
hapter 1 Introduction
Chapter 2
Existing Conditions
Chapter 3
Aviation Activity Forecasts
Chapter 4
Facility Requirem
entsC
hapter 5 Alternatives Analysis
Chapter 6
Phased Developm
ent and C
ost Estimates
Chapter 7
Airport Layout Plan and D
rawings
This section provides an overview of the environmental conditions at the Airport including an identification of critical resources. Baseline environmental conditions were determined by reviewing existing data from literature searches and databases, interpretation of aerial photography and maps, agency coordination and information obtained during preliminary field surveys. The following subsections present social, environmental and economic considerations at the Airport and provide an overview for subsequent NEPA analysis which may be required prior to Airport development projects. This environmental overview is not intended to satisfy the environmental clearance requirements outlined in FAA Order 1050.1F nor is it intended to fulfill the requirements of the NEPA.
1. Air Quality The Environmental Protection Agency (EPA) has established National Ambient Air Quality Standards (NAAQS) for the following criteria pollutants: carbon monoxide (CO), nitrogen dioxide (NO2), ozone (O3), sulfur dioxide (SO2), particulate matter (PM) and lead (Pb). The Clean Air Act (CAA) requires that air quality conditions within all areas of a state be designated as “attainment”, “nonattainment” or “unclassifiable” with respect to the NAAQS. The EPA and the State of Washington Department of Ecology’s (WDOE’s) Washington Air Quality Advisory regulate air quality in Benton County. Benton County is currently in attainment for all criteria pollutants under the NAAQS. According to FAA Order 1050.1F, proposed improvements at an airport having less than 180,000 annual general aviation aircraft operations and less than 1.3 million annual passenger enplanements do not require an air quality analysis. GA operations at the Airport are forecasted to remain under than operations threshold for air quality analysis through the year 2035. Therefore, no air quality analysis would be required for the proposed improvements at the Airport. However, fugitive dust from construction activities may have temporary short-term impacts on the air quality in the project area. Best management practices (BMPs), such as watering and other means to control dust should be implemented to mitigate for construction related, short-term air quality impacts.
2. Biological ResourcesFederal agencies are required to evaluate impacts on fish, wildlife, plants and critical habitats. Information obtained from the U.S. Fish and Wildlife Service’s (USFWS) Information,
Planning and Conservation System (IPaC) indicates that at the time this Master Plan Update was prepared, there were three species on the Endangered Species Act (ESA) list which have the potential to occur in the general vicinity of the Prosser Airport. These species include the endangered gray wolf (Canis lupus), and two threatened species, the yellow-billed cuckoo (Coccyzus americanus) and the bull trout (Salvelinus confluentus). The Washington Department of Fish and Wildlife Priority Habitats and Species (PHS) database identified the Townsend’s ground squirrel (Urocitellus townsendii) as a Washington State Priority Species that may occur in the general vicinity of the Prosser Airport. Prior to implementation of Airport improvement projects, a biological assessment would need to be developed to address ESA listed species, Washington State priority species, and critical wildlife habitat that may be impacted.
3. ClimateThe Airport is located at 705 feet above sea level and experiences a typical four-season climate. Data collected from the Western Regional Climate Center indicates that the area has an average low temperature 41.2o F, with an average high of 65.8o F. The area receives approximately 9 inches of precipitation annually, with the highest amounts typically occurring November through January. The area receives an average of 3 inches of snowfall. As outlined in FAA Order 1050.1F, the CEQ has indicated that climate and Green House Gas (GHG) emissions, should be considered in NEPA analyses. However there are currently no federal standards or significance thresholds for aviation related GHG emissions. GHGs result primarily from the combustion of fuels. Factors that could potentially increase the combustion of fuel and subsequent GHG emissions should be evaluated prior to project implementation. Such activities include an increase in airport capacity, an increase in the number of operations and alterations of operational characteristics that increase aircraft fuel burn.
4. Coastal ResourcesThere are no coastal resources on or near the Prosser Airport.
5. Department of Transportation Act, Section 4(f)Section 4(f) of the Department of Transportation Act, which was recodified and renumbered as Section 303(c) of 49 U.S.C., provides that the

AIRPORT MASTER PLAN UPDATE 2-19
PROSSER AIRPORT - S40C
hapter 1 Introduction
Chapter 2
Existing Conditions
Chapter 3
Aviation Activity Forecasts
Chapter 4
Facility Requirem
entsC
hapter 5 Alternatives Analysis
Chapter 6
Phased Developm
ent and C
ost Estimates
Chapter 7
Airport Layout Plan and D
rawings
Secretary of Transportation will not approve any program or project that requires use of any publicly owned land from a public park, recreation area or wildlife and waterfowl refuge of national, state or local significance or land from a historic site of national, state or local significance unless there is no feasible and prudent alternative to the use of such land and such program, and the project includes all possible planning to minimize harm resulting from the use. Significance is determined by the officials with jurisdiction. There are no public owned parks, recreation areas or wildlife and waterfowl refuges on the Airport property. In 2006, Reiss-Landreau Research conducted a cultural resource survey for the Runway 7 Realignment Project. The survey indicated that there are no known Section 4(f) resources on the Airport property in the Area of Potential Effect (APE) associated with the Runway 7 Realignment Project. Airport actions which take place outside of the previously surveyed APE would likely require a cultural resource survey to determine if the project would impact Section 4(f) resources.
6. FarmlandsThe Farmland Protection Policy Act (FPPA) was enacted to minimize the extent to which federal actions and programs contribute to the conversion of farmland to nonagricultural uses. The FPPA classifies farmland as prime farmland, unique farmland or farmland that is of statewide or local importance. A federal action which may result in the conversion of farmland to nonagricultural uses requires coordination with the Natural Resources Conservation Service (NRCS). A review of the NRCS’s Web Soil Survey indicates that approximately 66% of the soils located on Airport property are considered “prime farmland if irrigated.” However, none of the property on the Airport is currently used for agricultural activities and most of the area is developed and contains Airport infrastructure. Therefore, projects on existing Airport property would not affect farmland resources. Potential farmland impacts should be considered for all actions which take place outside of the existing Airport property, specifically those that would require property acquisition.
7. Hazardous Materials, Solid Waste, and Pollution Prevention
Hazardous materials present at the Airport include the following: aviation fuels, motor fuels, pesticides, substances used to operate or
maintain aircraft, ground vehicles, equipment, and buildings, and various hazardous materials transported to and from the Airport via ground vehicles and aircraft. The Airport also maintains and operates one above-ground AVGAS 100LL gas storage tank, which feeds a single gas pump available self-serve to pilots 24 hours-a-day. The storage, use, and transport of hazardous materials at the Airport are controlled by a framework of federal, state, and local regulations. The WDOE’s Hazardous Waste and Toxics Reduction Program (HWTR) maintains environmental databases on sites with known contamination and sites that are regulated according to the requirements of state or federal laws. A review of the HWTR’s database in February 2016 indicates that there are no known underground storage tanks (USTs) that are still in place at the Airport. The Port of Benton is working with the Voluntary Cleanup Program operated by the Washington State Department of Ecology to monitor a groundwater plume and soil contamination at the Marvin Bonny Hangar at the Prosser Airport (Cleanup Site ID 2188). Existing and future activities at the Prosser Airport are not anticipated to generate a quantity of hazardous waste materials which would reach impact category thresholds. However, construction activities have the potential to generate hazardous materials. Hazardous materials used and/or generated during construction would be disposed of at the Franklin County Moderate Risk Waste Facility and solid waste would be processed by the City of Richland Landfill. Transfer stations in the area include the BDI Transfer Station and Kennewick Waste Management and drop box facilities are available in Benton City and at the Basin Disposal in Prosser.
8. Historical, Architectural, Archeological, and Cultural Resources
The FAA requires that historical, architectural, archaeological and cultural resource impacts be evaluated prior to the implementation of improvements at airports. Cultural resource evaluations are governed by the National Historic Preservation Act (NHPA) and the Archaeological and Historic Preservation Act (AHPA). The NHPA recommends measures to coordinate federal historic preservation activities on federal actions affecting historic properties included in or eligible for inclusion in the National Register of Historic Places (NRHP).
AIRPORT MASTER PLAN UPDATE 2-20
PROSSER AIRPORT - S40C
hapter 1 Introduction
Chapter 2
Existing Conditions
Chapter 3
Aviation Activity Forecasts
Chapter 4
Facility Requirem
entsC
hapter 5 Alternatives Analysis
Chapter 6
Phased Developm
ent and C
ost Estimates
Chapter 7
Airport Layout Plan and D
rawings
A cultural resource survey was conducted by Reiss-Landreau Research in 2006 on a portion of the Airport property. The survey determined that there were no cultural resources in the surveyed APE. A search of the National Register of Historic Places (NHRP) database in 2016 indicates that there are no listed historical sites on the Airport property. However, future development that takes place at the Airport outside of the area that was surveyed in 2006 would require a cultural resource survey to determine if the proposed action would result in impacts to cultural or historic resources.
9. Land UseLand use planning allows the Airport to achieve compatibility with surrounding communities while maintaining safety for existing users and accommodating operations to meet aviation demand. Land use is discussed in detail in Section 2.5.1 of this Master Plan Update.
10. Natural Resources and Energy SupplyThis section examines potential changes in demand for energy and natural resources that would have a measurable effect on local supplies due to the implementation of proposed projects. Energy requirements associated with an airport fall into two general categories: demands for stationary facilities and demands for the movement of air and ground vehicles. E.O. 13123 encourages Federal agencies to expand the use of renewable energy and requires each agency to reduce petroleum use, total energy use, associated air emissions and water consumption in its facilities. It is the policy of the FAA, consistent with NEPA and WDOE regulations, to encourage the development of facilities that exemplify the highest standards of design including principles of sustainability related to the use of natural resources.Existing Airport operations do not place an undue burden on the local energy and natural resources supply. Future development at the Airport would need to be evaluated to determine if the proposed improvements would represent a significant impact.
11. Noise and Noise-Compatible Land Use
The FAA has determined that for an aviation noise analysis the cumulative noise energy exposure of individuals to noise resulting from aviation activities must be established in terms of yearly day/night average sound levels (DNL)
as FAA’s primary metric. If significant noise impacts are expected, the FAA official must prepare a detailed noise analysis as part of the environmental document. Projects which may have a significant impact on noise include citing a new airport, runway relocation, runway strengthening, or a major runway expansion require a noise analysis including noise contour maps. FAA Order 1050.1F indicates that any action that would increase noise by DNL 1.5dB or more for a noise sensitive area that is exposed to noise at or above the DL 65 dB noise exposure level or that will be exposed at or above the DNL 65 dB level due to a DNL 1.5 dB or greater increase is considered to be significant. Future development at the Airport is unlikely to present a significant noise impact to surrounding land use based on the current 65 DNL noise contour, providing that compatible land use in the future is maintained by Benton County and the City of Prosser.
12. Socioeconomics, Environmental Justice, and Children’s Environmental Health and Safety Risks
Airport development can cause induced impacts on surrounding communities. Induced impacts may affect population movement and growth, public service demands, and changes in economic activity. Environmental Justice is defined as the right to a safe, healthy, productive, and sustainable environment for all, and in this context, “environment” is considered to include the ecological, physical, social, political, aesthetic, and economic environments. To evaluate an environmental constraint or potential impact, a specific improvement would have to be known to determine the significance of the impact. A cursory evaluation would not determine the severity of the impact to environmental justice populations, relocations or children’s environmental health and safety risk. Impacts to socioeconomic resources, environmental justice populations and children’s health and safety would have to be evaluated before the implementation of Airport improvements.
13.VisualEffectsVisual impacts from airport activities are typically related to lighting and visual aesthetics. FAA has not established significance thresholds for impacts from light emissions or to visual resources impacts. However, FAA is required to consider the extent to which any lighting or visual

AIRPORT MASTER PLAN UPDATE 2-21
PROSSER AIRPORT - S40C
hapter 1 Introduction
Chapter 2
Existing Conditions
Chapter 3
Aviation Activity Forecasts
Chapter 4
Facility Requirem
entsC
hapter 5 Alternatives Analysis
Chapter 6
Phased Developm
ent and C
ost Estimates
Chapter 7
Airport Layout Plan and D
rawings
resource impacts associated with an action at an airport will create an annoyance, interfere with normal activities within the vicinity of the airport or disrupt the visual character of the area. Lighting for aviation security, obstruction identification and navigational aids produce light emissions. Changes to existing structures, the construction of new structures or the removal of existing resources such as waterways and vegetation may impact the visual character of an area. Visual resource impacts would need to be evaluated prior to implementation of Airport projects.
14. Water ResourcesThe Airport is located on relatively flat terrain. There are no natural drainage features or wetlands on the Airport. The nearest waterway is the Yakima River, which is situated approximately 0.22 miles southeast of the Prosser Airport. A review of the NPS Wild and Scenic River Inventory indicates that there are no Wild and Scenic Rivers nor are there any Study Rivers within the general vicinity of the Airport. A review of the National Wetland Inventory (NWI) database indicated that there are no wetlands on or near Airport property. The nearest known wetland is a small freshwater emergent wetland located approximately 0.35 miles east of the Airport, situated along the northern bank of the Yakima River. Current storm drainage at the Airport is retained on site. Surface drainage from future improvements at the Airport would likely be collected in a designated drainage system and conveyed to detention basins where it would evaporate or percolate in the subsurface. Future Airport improvement projects are not anticipated to create discharges into natural waterways.
According to the Federal Emergency Management Agency (FEMA) Flood Insurance Rate Map (FIRM) (Community Panel No. 5302370485B) the Airport is located in a Flood Zone C: outside of the 500-year floodplain. Therefore, future improvements at the Airport would likely have no impact on floodplains, flood zones, or floodways.
Environmental Overview Summary
A review of the existing conditions at the Prosser Airport indicates that specific environmental issues which should be considered during the development of Airport improvement projects include, but are not limited to, impacts on ESA listed and State Priority Species, noise impacts, visual impacts (including light emissions),
property acquisition, and changes to existing land use. Improvements at the Airport will require environmental documentation including consultation and coordination with regulating agencies prior to implementation of proposed improvements.
2.5.5 SUSTAINABILITY Although the topic of sustainability, as it applies to general aviation airports like Prosser, does not necessarily fall under the banner of environmental per this chapter’s subsection, the historical consequence of sustainability practices is environmentally-related, and it is for this reason the following discussion is found at this location in this narrative. FAA’s website under Airport Sustainability finds the following: “Sustainable actions reduce environmental impacts help maintain high, stable levels of economic growth, and help achieve “social progress”, a broad set of actions that ensures organizational goals are achieved in a way that is consistent with the needs and values of the local community.” Potential sustainability topics for planning consideration include, but are not limited to:
• LEED certification for future buildings,• Voluntary-based noise mitigation measures/
policies, with pilot/resident outreach program,• Establishment of/adherence to best management
practices for water retention and irrigation,• Establishment of airport-wide waste reduction/
recycling goals,• Guidance of occasional public outreach to
articulate sustainability goals and progress,• Working with area utilities to consider a solar site,
or other renewable arrangement, on/near Prosser Airport. (Note: siting of a solar facility will require close coordination with FAA),
• Limiting the use of diesel engines, and• LED fixtures installation as appropriate.
The Sustainable Aviation Guidance Alliance (SAGA) was formed in 2008 by professional aviation industry groups to assist an airport and their sponsor in creating sustainability predispositions and programs. The SAGA database contains more than 1,000 general practices. This comprehensive database may be used as baseline for sponsor and tenants in the creation of a sustainability plan and execution of its policies and intent.On a related note, a limited number of airport sustainability master plans have been created in recent years at airports of all sizes and can be used as a reference document going forward with sustainability efforts.

AIRPORT MASTER PLAN UPDATE 2-22
PROSSER AIRPORT - S40C
hapter 1 Introduction
Chapter 2
Existing Conditions
Chapter 3
Aviation Activity Forecasts
Chapter 4
Facility Requirem
entsC
hapter 5 Alternatives Analysis
Chapter 6
Phased Developm
ent and C
ost Estimates
Chapter 7
Airport Layout Plan and D
rawings
2.6 AREA AIRSPACE, AIRPORTS, AND NAVIGATIONAL AIDS
The operating airspace environment surrounding The Prosser Airport is important given that it is part of the state and national transportation system. A description of the local airspace surrounding the Prosser Airport along with nearby public-use airports and navigational aids follows.
2.6.1 AIRSPACEThe FAA is charged with oversight of the nation’s civil navigable airspace and has established various regulatory and non-regulatory airspace classes and areas, endeavoring to create a safe operating environment for all types of aviation users. US airspace classifications are conceptualized on Figure 2-8. Regional airspace surrounding The Prosser Airport within the Seattle Sectional Chart is shown on Figure 2-9. The Prosser Airport and most other rural general aviation Washington airports underlay Class E airspace. Class E airspace exists from 1,200 feet up to 17,999 above ground level (AGL). Pilots operating within Class E airspace must be certificated or in training.
2.6.2 AREA AIRPORTS AND NAVIGATIONAL AIDSProsser is near several general aviation and commercial service airports with enroute and local navigational facilities. Tri-Cities Regional Airport (PSC) is operated by the Port of Pasco and is the largest airport in Southeastern Washington and Northeastern Oregon and is the fourth largest air carrier airport in the State of Washington with connections to eight major hubs. In June of 2016, there were 34,981 enplanements which was up by 10% from June of 2015. PSC is base to over 120 jet, twin-engine business aircraft, helicopter, single-engine and experimental aircraft. PSC is included in the NPIAS. Richland Airport (RLD) is also part of the Port of Benton operations and has 165 based aircraft on approximately 650 acres along with light and medium industrial uses including Airport Mini-Storage, Civil Air Patrol, Hi-Line Engineering, Keck Services, and Connell Oil. RLD is located two (2) miles northwest of Richland and approximately eight (8) nautical miles from the Tri-Cities Regional Airport. RLD has Instrument Approach Procedures (IAP) and is included in the NPIAS.Perhaps the most important feature of Prosser’s area airspace is the Military Operations Area (MOAs) and Restricted Airspace. An MOA is a volume of special use airspace established by FAA to separate nonhazardous military activity from Instrument Flight Rules (IFR) activity
FIGURE 2-8 US AIRSPACE CLASSIFICATIONS
Source: J-U-B
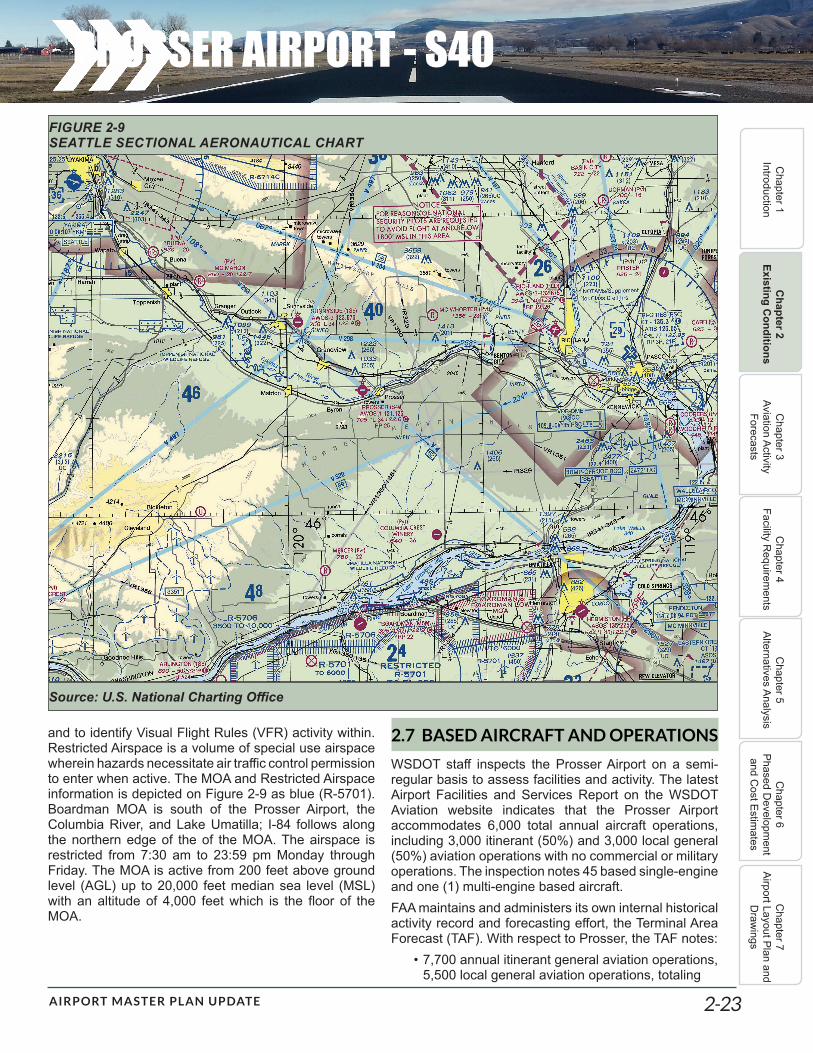
AIRPORT MASTER PLAN UPDATE 2-23
PROSSER AIRPORT - S40C
hapter 1 Introduction
Chapter 2
Existing Conditions
Chapter 3
Aviation Activity Forecasts
Chapter 4
Facility Requirem
entsC
hapter 5 Alternatives Analysis
Chapter 6
Phased Developm
ent and C
ost Estimates
Chapter 7
Airport Layout Plan and D
rawings
FIGURE 2-9 SEATTLE SECTIONAL AERONAUTICAL CHART
Source: U.S. National Charting Office
and to identify Visual Flight Rules (VFR) activity within. Restricted Airspace is a volume of special use airspace wherein hazards necessitate air traffic control permission to enter when active. The MOA and Restricted Airspace information is depicted on Figure 2-9 as blue (R-5701).Boardman MOA is south of the Prosser Airport, the Columbia River, and Lake Umatilla; I-84 follows along the northern edge of the of the MOA. The airspace is restricted from 7:30 am to 23:59 pm Monday through Friday. The MOA is active from 200 feet above ground level (AGL) up to 20,000 feet median sea level (MSL) with an altitude of 4,000 feet which is the floor of the MOA.
2.7 BASED AIRCRAFT AND OPERATIONS
WSDOT staff inspects the Prosser Airport on a semi-regular basis to assess facilities and activity. The latest Airport Facilities and Services Report on the WSDOT Aviation website indicates that the Prosser Airport accommodates 6,000 total annual aircraft operations, including 3,000 itinerant (50%) and 3,000 local general (50%) aviation operations with no commercial or military operations. The inspection notes 45 based single-engine and one (1) multi-engine based aircraft. FAA maintains and administers its own internal historical activity record and forecasting effort, the Terminal Area Forecast (TAF). With respect to Prosser, the TAF notes:
• 7,700 annual itinerant general aviation operations, 5,500 local general aviation operations, totaling

AIRPORT MASTER PLAN UPDATE 2-24
PROSSER AIRPORT - S40C
hapter 1 Introduction
Chapter 2
Existing Conditions
Chapter 3
Aviation Activity Forecasts
Chapter 4
Facility Requirem
entsC
hapter 5 Alternatives Analysis
Chapter 6
Phased Developm
ent and C
ost Estimates
Chapter 7
Airport Layout Plan and D
rawings
13,200 annual operations from 2007 to current, and the same to the TAF’s final 2040 forecast year. This is the current, official FAA record for purposes of this planning.
And: • 45 based aircraft from 1999 through 2006 • 51 based aircraft in 2007• 53 based aircraft from 2008 through 2011• 51 based aircraft from 2012 through 2014• 71 based aircraft in 2015• 74 based aircraft in the TAF’s final 2040 forecast
year.FAA also maintains a database of based aircraft for official record keeping purposes. The database currently indicates 71 based, validated aircraft at Prosser. However, only 51 of those aircraft have been confirmed at the Prosser Airport, according to the FAA based aircraft database.A general rule-of-thumb for estimating aircraft operations at uncontrolled airports like the Prosser Airport is contained in FAA guidance, recommending: 250 operations per based aircraft for rural general aviation airports, 350 for more urban, busier general aviation
airports and 450 for reliever airports in metropolitan areas.
2.8 AIRFIELD DESIGN STANDARDS
FAA specifies a coding scheme for airport design that relates airfield design criteria to the operational and physical characteristics of aircraft using an airport in a meaningful quantity, along with Instrument Approach Procedure (IAP) visibility. This scheme, and standards compliance thereto, relates to individual runways and runway ends at certificated and/or obligated airports. Prosser is an obligated airport, because the Port of Benton has accepted federal grant-in-aid funds from FAA.
2.8.1 DESIGN STANDARDS CRITERION The first portion of the overall scheme relates to a given runway, and runway end, and has three criteria. Table 2.7 shows the criterion collectively, the Runway Design Code (RDC). The first, represented by a letter, is the Aircraft Approach Category (AAC). It relates to aircraft approach speed, an aircraft operational characteristic (1.3 x Vso/Vref {the speed of an aircraft in the landing configuration}). The second designator, Airplane
TABLE 2.7 DESIGN STANDARDS CRITERIA
Aircraft Approach Category (AAC) Aircraft Approach Speed (Knots)A Less than 91B 91 or greater, but less than 121C 121 or greater, but less than 141D 141 or greater, but less than 166E 166 or greater
Airplane Design Group (ADG) Aircraft Wingspan (Feet) Tail Height (Feet)I <49 <20II 49-<79 20-<30III 79-<118 30-<45IV 118-<171 45-<60V 171-<214 60-<66VI 214-<262 66-<80
IAP Capability in Terms of Visibility (Statute Mile)RVR 5000 Not lower than 1 mileRVR 4000 Lower than 1 mile but not lower than ¾ mileRVR 2400 Lower than ¾ mile but not lower than ½ mileRVR 1600 Lower than ½ mile but not lower than ¼ mileRVR 1200 Lower than ¼ mileSource: FAA Advisory Circular 150/5300-13A
AIRPORT MASTER PLAN UPDATE 2-25
PROSSER AIRPORT - S40C
hapter 1 Introduction
Chapter 2
Existing Conditions
Chapter 3
Aviation Activity Forecasts
Chapter 4
Facility Requirem
entsC
hapter 5 Alternatives Analysis
Chapter 6
Phased Developm
ent and C
ost Estimates
Chapter 7
Airport Layout Plan and D
rawings
Design Group (ADG), is represented by a roman numeral. It relates to aircraft wingspan and aircraft tail height physical characteristics. Figure 2-10 shows representative aircraft grouped only by Airplane Design Group (ADG), for reference. A given runway end may accommodate an IAP with various FAA-approved visibilities. These visibilities are segregated and expressed in terms of Runway Visual Range (RVR). RVR is a real-time meteorological measurement noted feet and related to ¼ mile visibility increments. RVR measurements are made at the runway end.These criterion, the AAC speed, ADG wingspan and tail height, along with IAP capability, combine to identify each runway’s RDC and classify design standards, primarily related to runway and runway protection. A nRDC is associated with a particular runway end. A field with multiple runways may have multiple RDC’s. Beyond RDC, Taxiway Design Group (TDG) is an additional criterion; it is based upon the dimensions of aircraft undercarriage, specifically the distance between the outer edge of the main gear, termed the Main Gear Width (MGW) with the distance between the Cockpit to Main Gear (CMG). Note that if the nose wheel fronts the cockpit, the CMG distance increases. Various MGW and CMG ranges combine to make TDG’s 1 through 7, with 7 accommodating the largest ranges, and aircraft. The visualization, as Figure 2-11, shows the physical aircraft characteristics associated with ADG and TDG. In many instances ADG and TDG for individual airplanes will be within the same grouping; for example, ADG-I with TDG-1, ADG-II with TDG-2, and AGD-III with TDG-3. Notable exceptions generally include aircraft with a relatively long fuselage. Finally, aircraft weight is an additional criterion to be able to determine suitable application of all airport planning and design at The Prosser Airport. Aircraft which weigh less than 12,500 pounds (maximum certificated gross), regardless of wheel configuration, are termed utility or small aircraft. Those which weigh more are termed non-utility or large aircraft. Note that the runway, taxiway and the main apron pavement strengths are currently 16,000 pounds SWG.The most demanding aircraft or group of aircraft with alike physical and operational characteristics that use the Prosser Airport regularly; generally conducting at least 500 annual takeoffs or landings, is termed the design aircraft. Thus, the current criterion for Runway 8-26 are:
A&B-I; TDG-1a, Small Aircraft And, the current criterion for Taxiway A, its connectors and aprons is TDG-1a, Small Aircraft. The current design
aircraft is the Cessna 414, a B-I, TDG-1a, Small Aircraft.
2.8.2 DESIGN STANDARDS Design standards encompass various areas, zones, surface gradients and separations standards; select standards are described and tabulated within Table 2.8, based upon and the current design aircraft:
1. A Runway Protection Zone (RPZ) is a trapezoidal area off each runway end, established to enhance protection of people and property by clearing incompatible land uses. Prosser’s RPZ’s are wholly owned in fee.
2. The Runway Safety Area (RSA) and Taxiway Safety Area (TSA) are established to ensure that the ground surface adjacent to runways and taxiways is suitably prepared to reduce the risk of damage in the event of an aircraft deviation from paved surfaces. Safety area specifications are dimensional, grade-specific and material-specific.
3. The Runway Object Free Area (ROFA) and Taxiway Object Free Area (TOFA) are established to ensure the safety of aircraft operations by having an area free of objects, except those frangible-mounted objects, necessary for air navigation or ground maneuvering purposes.
4. The Obstacle Free Zone (OFZ) is a volume of airspace up to 150 feet above airport elevation, centered on runway centerline, primarily established to preclude taxiing and parked aircraft. The runway hold line is sometimes located to coincide with limits of the OFZ.
5. The purpose of the Approach (also termed the Threshold Siting Surface [TSS]) and Departure Surfaces is to provide obstacle clearance for visual approaches and instrument approach procedures. These surfaces are generally three-dimensional trapezoids with 20:1 or 34:1 surfaces extending upward and outward away from each end of a runway.
Note that the specification and minimum exceeding the specifications, for an individual project is generally acceptable, but may not be eligible for federal or state funds.
2.8.3 FAR PART 77Title 14 of the Code of Federal Regulations, Part 77, Safe, Efficient Use, and Preservation of the Navigable Airspace specifies various imaginary surfaces considered to protect the airspace around the Prosser Airport from objects of natural growth or man-made features, termed obstructions. These surfaces are the

AIRPORT MASTER PLAN UPDATE 2-26
PROSSER AIRPORT - S40C
hapter 1 Introduction
Chapter 2
Existing Conditions
Chapter 3
Aviation Activity Forecasts
Chapter 4
Facility Requirem
entsC
hapter 5 Alternatives Analysis
Chapter 6
Phased Developm
ent and C
ost Estimates
Chapter 7
Airport Layout Plan and D
rawings
FIGURE 2-10 REPRESENTATIVE AIRCRAFT BY WINGSPAN
Source: J-U-B

AIRPORT MASTER PLAN UPDATE 2-27
PROSSER AIRPORT - S40C
hapter 1 Introduction
Chapter 2
Existing Conditions
Chapter 3
Aviation Activity Forecasts
Chapter 4
Facility Requirem
entsC
hapter 5 Alternatives Analysis
Chapter 6
Phased Developm
ent and C
ost Estimates
Chapter 7
Airport Layout Plan and D
rawings
FIGURE 2-11 SELECT AIRPORT DESIGN CRITERION
Source: J-U-B
primary, approach, transitional, horizontal and conical as described in Section 77.25 and as follows:
1. The primary surface is longitudinally centered on the runway. The elevation of any point on the primary surface is the same as the elevation of the nearest point on centerline. The width of the primary surface is based on the type of approach available or planned for each runway.
2. The approach surface is a surface longitudinally centered on the extended runway centerline and extending outward and upward from each end of the primary surface. An approach surface is applied to each end of each runway based on the type of approach available or planned for that runway end.
3. The transitional surfaces extend outward and upward at right angles to the runway centerline and runway centerline extended at a slope of 7:1 (±8.13 degrees) from the sides of the primary surface and from the sides of the approach surfaces.
4. The horizontal surface is a level horizontal plane 150 feet above the established airport elevation, the perimeter of which is constructed by swinging arcs of either 5,000 or 10,000 feet from the center of each end of the primary surface of each runway and connecting the adjacent arcs with lines of tangency.
5. The conical surface extends outward and upward from the periphery of the horizontal surface at a slope of 20:1 (±2.86 degrees) for a horizontal distance of 4,000 feet.
In addition to these surfaces, Section 77.23 provides for additional obstruction identification guidance; A determination in this regard is made by FAA via proponent filing of FAA Form 7460 Notice of Proposed Construction or Alteration.
2.9 FINANCIAL/ECONOMIC DEVELOPMENT
In calendar year 2014, service-providing industries are a major share of Benton County’s economy at 82.1% which represents industries such as the health care

AIRPORT MASTER PLAN UPDATE 2-28
PROSSER AIRPORT - S40C
hapter 1 Introduction
Chapter 2
Existing Conditions
Chapter 3
Aviation Activity Forecasts
Chapter 4
Facility Requirem
entsC
hapter 5 Alternatives Analysis
Chapter 6
Phased Developm
ent and C
ost Estimates
Chapter 7
Airport Layout Plan and D
rawings
and social assistance; finance, insurance and real estate; wholesale/retail trade; administrative and waste management/remediation; wholesale/retail trade there are 616 employers representing an average number of employees at 10,197 and in health care and social assistance there are 1,780 employers representing an average of 10,232 employees. The professional, scientific, and technical support industry is the largest private industry in Benton County representing 11.7% share of total employment with 459 employers with an average number of 9,391 employees. Agriculture represents 7.3 % of the total employment and is mainly focused on crop production of apples, grapes and other produce. Employment in agriculture is highly seasonal and volatile. Benton County employment is improving after the layoffs in 2011 from the Hanford Nuclear Reservation.Economic Development Participants
Prosser’s Economic Development Association is a non-profit organization that works to recruit new business, retain existing businesses and promote the economic welfare and quality of living in the greater Prosser area. Major public funding partners are the City of Prosser, the Port of Benton, and Benton County. The Economic Development Association’s mission statement is:
“Prosser is a center of excellence for agriculture and agri-tourism industries, providing a wealth of educational and experiential opportunities as well as a solid foundation for industry research, development, and production. These factors synergistically work together to create supportive environments for public endeavors and private business, which carry the success of the Prosser Brand through generations.”
Other program partners include the Historic Downtown Prosser Association and the Prosser Chamber of
TABLE 2.8 SELECT PROSSER AIRPORT DESIGN STANDARDS
Standard/Specification Standard (B-I Small) Existing (B-I Small)
Runway Width 60 Feet 60 FeetRunway Shoulder Width 10 Feet 10 FeetEffective Runway Longitudinal Grades Within ±2% Maximum Within ±2% MaximumRunway Pavement Strength Recommended 12,500
SWG16,000 SWG
Runway Protection Zones (RPZ) 250 feet x 450 feet x 1,000 feet
250 feet x 450 feet x 1,000 feet
Runway Safety Area (RSA) Width/Beyond End 120 feet x 240 feet 120 feet x 240 feetRunway Object Free Area (ROFA) Width/Beyond End
250 feet x 240 feet 250 feet x 240 feet
Taxiway Width 25 feet 25 / 35 feetTaxiway Shoulder Width 10 feet 10 feetTaxiway Safety Area (TSA) 49 feet 49 feetTaxiway/Taxilane Object Free Area (TOFA) 89 feet / 79 feet 89 feet / 79 feet
Runway Centerline to Parallel Taxiway A Centerline 150 feet 150/235 feetRunway to Holding Position 125 feet 125 feetRunway to Aircraft Parking Area 125 feet 125 feetTaxiway Centerline to Fixed/Movable Object 44.5 feet 44.5 feetRunway Obstacle Free Zone Width/Beyond End 250 feet/ 200 feet 250 feet / 200 feetApproach Surface (20:1) 250 feet x 700 feet x 5,000
feet250 feet x 700 feet x 5,000
feet
Part 77 Primary Surface Width/Beyond End 250 feet x 200 feet 250 feet x 200 feetPart 77 Approach Surfaces Dimension/Slope 250 feet x 1,250 feet x
5,000 feet; 20:1250 feet x 1,250 feet x
5,000 feet; 20:1Source: FAA/J-U-B

AIRPORT MASTER PLAN UPDATE 2-29
PROSSER AIRPORT - S40C
hapter 1 Introduction
Chapter 2
Existing Conditions
Chapter 3
Aviation Activity Forecasts
Chapter 4
Facility Requirem
entsC
hapter 5 Alternatives Analysis
Chapter 6
Phased Developm
ent and C
ost Estimates
Chapter 7
Airport Layout Plan and D
rawings
Commerce. The Historic Downtown Prosser Association is a non-profit organization that follows the National Main Street Program structure towards Economic Development through Historic Preservation. The Prosser Chamber of Commerce is a non-profit membership organization created to promote and assist local business and organize community events. Airport Economic Impact Study In 2012, WSDOT, with the support of the FAA, released an Economic Impact Study (Study) that studied the role aviation plays in Washington’s economy. The Aviation Economic Impact Study looked at all 135 public use airports’ contribution to the economy statewide and the community level by:
• Measuring the economic and fiscal impacts of each public-use airport in Washington
• Exploring how the aviation system supports economic development and competitiveness at the local and statewide levels
• Building understanding of how the state’s aviation system creates economic value for people and communities across the state.
The approach to the study looked at three different perspectives to create a more comprehensive picture of aviation’s economic value and impact in the state of Washington: Airport-level economic impacts, industry-level economic impacts, and user-level economic value. The study found that there are direct economic and fiscal benefits created by the aviation system in the state and that the system is a core element of the state’s transportation infrastructure. From the Prosser Airport perspective, the study estimates the total impact that can be attributed to airport-related activity at the 135 public use airports in Washington State: 248,500 jobs, $15.3 billion in wages and, $50.9 billion in total economic activity. The Executive Summary goes on to state that from a fiscal perspective, more than $791 million in tax revenue is generated from aviation activities. Over $548 million goes towards supporting the State of Washington general fund, while cities, special purpose districts, and counties collect approximately $243 million in tax revenue. The Industry Perspective portion of the study explores the relationship between aviation and specific industries and highlights the ways in which economic activity and aviation are intertwined. According to the WSDOT Economic Study Executive Summary, over 97% of State Gross Business Income (GBI) is generated by businesses within ten (10) miles of an airport and 70% of GBI is generated within five miles of an airport. Overall, airports support industry in a variety of ways and connect communities to commerce and economic opportunities that flow through the larger aviation system.
The User Perspective portion of the study looks at the value derived by individual users of the state’s airports and aviation services. Especially for communities with smaller airports, the value goes above and beyond the number of jobs and gross business income. Overall, the Study provides the state with the ability to look at economic implications for expanding capacity and maximizing the current inventory of aviation facilities. A significant share of aviation system economic contributions are from mobility and connectivity for both people and freight. General Aviation Appreciation MonthWashington State’s Governor Jay Inslee named June as General Aviation Appreciation Month for the fourth year in a row, recognizing the vital contribution all of general aviation, including business aviation, provides to the statewide economy. The proclamation noted that aviation plays a crucial role in the lives of Washingtonians, as well as the operation of businesses, industry, ranches, and farms – and its vital to the state’s economy, and transportation system. Additionally, the proclamation highlights how general aviation, aerospace, aircraft manufacturing and other aviation activities contribute to Washington’s economic health and vitality.
2.10 CONSTRAINTS TO AND OPPORTUNITIES FOR AVIATION GROWTH
A review and description of some of the existing physical site constraints and known, potential opportunities for growth follows. This is important during this early period of plan development in order to obtain an overall inventory. Note that items listed below are not meant to be a comprehensive list of all opportunities and constraints. Constraints:
• Runway Length. Current users have expressed interest in increasing the total runway length to 4,000 or 4,200 feet.
• Monitoring Land Use Compatibility. Prosser Airport is surrounded by residential uses, vacant school property to the northwest, and retail uses that are generally considered incompatible with the local airport uses. Aircraft noise, safety and other impacts need to be considered as the Prosser Airport expands. An Airport Overlay Zone is recommended to provide solid protection of incompatible land uses surrounding The Prosser Airport.
• Hangars on Both Sides of Runway. Currently, there are aircraft hangars on the north and south side of the runway. The hangar on the north side

AIRPORT MASTER PLAN UPDATE 2-30
PROSSER AIRPORT - S40C
hapter 1 Introduction
Chapter 2
Existing Conditions
Chapter 3
Aviation Activity Forecasts
Chapter 4
Facility Requirem
entsC
hapter 5 Alternatives Analysis
Chapter 6
Phased Developm
ent and C
ost Estimates
Chapter 7
Airport Layout Plan and D
rawings
of the runway accessed by a taxiway is slated for demolition in the near future. It should be noted that having hangars on both sides of a runway can lead to runway incursions such as a pilot crossing a runway or a pilot entering any portion of the airport movement areas (runways/taxiways) without clearance.
• Lack of Helicopter Landing Area. There is currently no landing area for helicopters.
• Hold Bays. A Hold Bay, also known as a Run-Up Apron area is desired by users at the runway ends. This would allow pilots to complete engine and other checks of their aircraft prior to takeoff. This area is necessary because the air blast from the aircraft checks may interfere with other aircraft in the immediate vicinity or the aircraft may obstruct ground traffic.
• Buildings in the RPZ. There are at least four buildings at the west end of the Prosser Airport remaining that have been purchased using FAA funds that may need to be addressed.
• Instrument Approach Capability. The Prosser Airport is Visual Approach only. A Non-Precision Instrument Approach plan could be developed for the flying public.
Opportunities: • Facilitate Wine Industry Tourism• Develop Prosser Airport to be a hub for the lower
Yakima Valley• Grow the flight school / training center • Offer multi-modal resources such as a rental car
facility• Increase the usage of Prosser Airport for
agricultural uses• Expand fueling options for aircraft (offer Jet A
Fuel) and high octane (91) automobile fuel • Assess and potentially improve Wi-Fi • Promote, relocate, and add lighting to tent
camping facility• Add safe crossing of Old Inland Empire Highway
to access The Barn Restaurant on Wine County Road
• Provide better access to retail shopping on Wine Country Road east of Prosser Airport
• Improving aviation fueling abilities such as providing fire support at the fuel pit

AIRPORT MASTER PLAN UPDATE 3-1
PROSSER AIRPORT - S40C
hapter 1 Introduction
Chapter 2
Existing Conditions
Chapter 3
Aviation Activity
Forecasts
Chapter 4
Facility Requirem
entsC
hapter 5 Alternatives Analysis
Chapter 6
Phased Developm
ent and C
ost Estimates
Chapter 7
Airport Layout Plan and D
rawings
CHAPTER 3 - AVIATION ACTIVITY FORECASTS
TERMINOLOGYAircraft Operation: A count of a takeoff, landing, or touch-and-go. Each time an aircraft touches the runway to takeoff or land, it counts as an operation.Airport Reference Code: Used to determine facility size and setback requirements. The Airport reference code is a composite of the approach category and design group of the critical aircraft. Approach Category: Classification of an aircraft by approach speed, with “A” being the slowest and “E” being the fastest. Based Aircraft: Aircraft that are stored at The Prosser Airport. These aircraft may be stored full-time, or seasonally.Critical Aircraft: The most demanding aircraft (in terms of size and/or speed) to use an airport over 500 times a year, or have scheduled operations at an airport. Design Group: Classification of an aircraft by its size (wingspan and tail height) with “I” being the smallest and “VI” being the largest. Enplanement: The act of a passenger boarding a scheduled or charter aircraft with more than nine seats, operating under FAR Part 121 or Part 135 regulations.General Aviation (GA): Aviation activities conducted by recreational, business, and charter users not operating as airlines under FAR Part 121, Part 135, or military regulations.Itinerant Operation: An operation that originates and terminates at different airports. An example is an aircraft flying from the Prosser Airport to the Tri-Cities.Local Operation: An operation that originates and terminates at the same airport. An example is an aircraft taking off from the Prosser Airport, remaining near the Airport to practice flight maneuvers, and then landing at the Prosser Airport. Touch-and-Go: A maneuver where an aircraft lands and takes off without leaving the runway. A touch-and-go counts as two aircraft operations.
3.1 CHAPTER SUMMARY
This chapter presents aviation activity forecasts for the Prosser Airport (S40 or “the Airport”). The purpose of preparing aviation activity forecasts is to use existing and projected aircraft activity to plan for future improvement projects. Forecasts are intended to provide justification for future decisions, including analysis of alternatives to meet the long-term needs at the Airport while accomplishing other social, environmental, and economic goals. A summary of the main points of the chapter is included below.
• Single-engine aircraft are projected to grow at 1.1 percent annually. The composition of these aircraft is expected to change with light sport and experimental aircraft becoming more common as older piston aircraft are retired. New piston aircraft deliveries are expected to be less than the rate of retirement at S40 and across the County.
• Although none exist today, this forecast recommends planning for one turbo-prop and two helicopters in addition to the single-engine aircraft as these user classes are expected to show high growth over the next 20 years and are capable of operating at S40.
• Aircraft operations are expected to grow at 0.8% per year, in line with how they have grown over the past 20 years. Local operations are expected to grow slightly faster than itinerant operations; however, itinerant operations will continue to make up 60 percent of aircraft operations.
• The existing and future airport reference code, determined by number of operations from FAA Traffic Flow Management System Counts Data, is approach category B, design group I (B-I).
• The critical aircraft is the Cessna 414.• Based aircraft and aircraft operations forecasts fall
within the FAA tolerances for deviation from the TAF, but grow faster than the TAF for the five- and ten-year reporting periods.
3.2 INTRODUCTION
The aviation activity forecast evaluates the future demand at S40. This chapter forecasts the following activities: based aircraft and aircraft operations (local and itinerant). The forecasts have a base year of 2015, and use the FAA fiscal year (October to September). The forecast period is 20 years, with five-year reporting intervals. Several forecasting methodologies are applied to each activity, and are compared with the Federal Aviation Administration (FAA) Terminal Area Forecast (TAF). Forecasts are not developed for scheduled commercial passenger and cargo operations, as these are

AIRPORT MASTER PLAN UPDATE 3-2
PROSSER AIRPORT - S40C
hapter 1 Introduction
Chapter 2
Existing Conditions
Chapter 3
Aviation Activity
Forecasts
Chapter 4
Facility Requirem
entsC
hapter 5 Alternatives Analysis
Chapter 6
Phased Developm
ent and C
ost Estimates
Chapter 7
Airport Layout Plan and D
rawings
not significant current or future markets expected to be served by the Prosser Airport.Aviation activity forecasts are used to determine facility requirements, an assessment of what facilities the airport has compared to what facilities the airport needs in the future. These forecasts are reviewed and formally approved by the FAA Seattle Airports District Office with respect to their reasonableness and concurrence with FAA forecasting.The chapter is organized in the following sections:
• Background describes how the Airport is used, how the community around it is changing, and any trends observed in available data.
• Methodology describes how the forecasts were prepared.
• Based Aircraft Forecasts describe the users that hangar and store aircraft at Prosser Airport.
• Aircraft Operations Forecasts describe the number of local and itinerant aircraft movements at S40.
• Critical Aircraft describes the most demanding aircraft to use S40 on a regular basis, on which future design considerations are based.
• Chapter Summary provides an overview of the forecasts for based aircraft and aircraft operations, and compares the Master Plan forecasts to the TAF.
Data sources used in this chapter are described in Table 3.1.
TABLE 3.1 DESCRIPTION OF DATA SOURCES
SOURCE DESCRIPTIONFixed Base Operator The fixed base operator (FBO) sells fuel and provides aircraft and pilot services.
FBO staff monitor the radio and are present at the airport throughout their work hours. The FBO manager was interviewed by the project team and shared counts of monthly itinerant operations, which totaled 6,937 for fiscal year 2015. The FBO manager does not count local operations. This data is expected to represent a good sample of aviation activity, but is subject to personal bias and limited to FBO hours of operation (Monday – Friday, 8am-5pm).
Runway End Game Cameras
S40 has game (wildlife) cameras installed at both runway ends which capture aircraft N-numbers on arrival. These numbers can be used to determine aircraft type. Other data include date and time of operation. Game cameras are automated, and may miss aircraft that land far down the runway or approach at a steep angle. Game camera records include a period from the beginning of June to the end of September 2016, outside of which the cameras do not have data. There were 327 arrivals captured during this period. The game cameras are used to supplement the Airport IQ 5010 data and provide additional insight on aircraft types operating at S40.
FAA Terminal Area Forecast (TAF)
The FAA TAF, published in January 2016, provides forecasts for operations and based aircraft at S40. These forecasts serve as a comparison for forecasts prepared as part of this planning effort, and provide historical information on aircraft activity. Due to the absence of a control tower at S40, the TAF does not provide much historical context.
FAA Aerospace Forecast The Aerospace Forecast is a national-level forecast of aviation activity. The Aerospace Forecast helps guide local forecasts by serving as a point of comparison between local trends and national trends.
FAA Traffic Flow Management System Counts Data (TFMSC)
The TFMSC includes data collected from flight plans. TFMSC data from 2010-2015 includes average of 250 operations per year.These operations are categorized by aircraft type, and used to identify trends in the S40 fleet mix. The advantage of the TFMSC data is that it is detailed, and provides insight into the users of S40. The disadvantage is that it only includes itinerant operations, and represents a relatively small sample size (less than two percent of the total).

AIRPORT MASTER PLAN UPDATE 3-3
PROSSER AIRPORT - S40C
hapter 1 Introduction
Chapter 2
Existing Conditions
Chapter 3
Aviation Activity
Forecasts
Chapter 4
Facility Requirem
entsC
hapter 5 Alternatives Analysis
Chapter 6
Phased Developm
ent and C
ost Estimates
Chapter 7
Airport Layout Plan and D
rawings
TABLE 3.1: DESCRIPTION OF DATA SOURCES
SOURCE DESCRIPTIONFixed Base Operator The fixed base operator (FBO) sells fuel and provides aircraft and pilot
services. FBO staff monitor the radio and are present at the airport throughout their work hours. The FBO manager was interviewed by the project team and shared counts of monthly itinerant operations, which totaled 6,937 for fiscal year 2015. The FBO manager does not count local operations. This data is expected to represent a good sample of aviation activity, but is subject to personal bias and limited to FBO hours of operation (Monday – Friday, 8am-5pm).
Runway End Game Cameras
S40 has game (wildlife) cameras installed at both runway ends which capture aircraft N-numbers on arrival. These numbers can be used to determine aircraft type. Other data include date and time of operation. Game cameras are automated, and may miss aircraft that land far down the runway or approach at a steep angle. Game camera records include a period from the beginning of June to the end of September 2016, outside of which the cameras do not have data. There were 327 arrivals captured during this period. The game cameras are used to supplement the Airport IQ 5010 data and provide additional insight on aircraft types operating at S40.
FAA Terminal Area Forecast (TAF)
The FAA TAF, published in January 2016, provides forecasts for operations and based aircraft at S40. These forecasts serve as a comparison for forecasts prepared as part of this planning effort, and provide historical information on aircraft activity. Due to the absence of a control tower at S40, the TAF does not provide much historical context.
3.3 BACKGROUND
Background information is organized into three components:
• CommunityProfiledescribes the makeup of the businesses and residents in Benton County.
• AviationProfiledescribes the users of the Airport, and summarizes previously completed studies of aviation activity.
• Catchment Area describes the geographic boundaries that the Airport draws its users from.
These sections tell the story behind the data, and help frame the discussion for the aviation forecasts included later in the chapter.
3.3.1 COMMUNITY PROFILES40 is located in Benton County, Washington, in the City of Prosser. Prosser is on the western side of Benton County, along the border with Yakima County to the west.As shown in Figure 3-1, the economy of Prosser is largely built on agriculture, manufacturing, and educational and health services – owing to the rural character of the City. The U.S. Census Bureau estimates that Prosser
has 5,714 residents in 2015. The Washington Office of Financal Management (OFM) reports that Benton County had a population of 185,000 in 2015. The U.S. Census Bureau indicates that approximately 150,000 Benton County residents live in the communities on the eastern edge of the County border.The OFM indicates that between 2006 and 2016 Benton County was the second fastest growing county in the State in terms of population, with 18.62 percent growth, an annual average rate of 1.7 percent. Population projections for Benton County come from the OFM. The most recent series of OFM projections were prepared in 2012. OFM prepares Low, Medium, and High growth projections to account for future uncertainty. Since the projections were released, Benton County has tracked in line with the Medium projectons. OFM provides a breakdown by age group, which is used to estimate the working-age population. This includes teenagers with part-time jobs, and stops at the age where full social security benefits are available. OFM population projections for Benton County are shown in Table 3.2.OFM projections show that Benton County population is expected to grow faster than the State average of percent. Like the rest of the Country, Benton County will see a large jump in population over the age of 65 between 2015 and 2025 associated with the Baby

AIRPORT MASTER PLAN UPDATE 3-4
PROSSER AIRPORT - S40C
hapter 1 Introduction
Chapter 2
Existing Conditions
Chapter 3
Aviation Activity
Forecasts
Chapter 4
Facility Requirem
entsC
hapter 5 Alternatives Analysis
Chapter 6
Phased Developm
ent and C
ost Estimates
Chapter 7
Airport Layout Plan and D
rawings
FIGURE 3-1 CITY OF PROSSER AND BENTON COUNTY ECONOMY
Source: City of Prosser Consolidated Comprehensive Plan, 2011
TABLE 3.2 WASHINGTON OFFICE OF FINANCIAL MANAGEMENT 2012 POPULATION PROJECTIONS
YEAR POPULATION TOTAL
POPULATION UNDER 15
POPULATION 15-65 (WORKFORCE)
POPULATION OVER 65
2015 184,882 40,275 119,810 24,797
2025 210,803 44,385 130,024 36,394
2035 236,007 49,162 142,995 43,850
CAGR 1.2% 1.0% 0.9% 2.9%
CAGR: Compound Average Growth Rate Source: Washington State Office of Financial Management

AIRPORT MASTER PLAN UPDATE 3-5
PROSSER AIRPORT - S40C
hapter 1 Introduction
Chapter 2
Existing Conditions
Chapter 3
Aviation Activity
Forecasts
Chapter 4
Facility Requirem
entsC
hapter 5 Alternatives Analysis
Chapter 6
Phased Developm
ent and C
ost Estimates
Chapter 7
Airport Layout Plan and D
rawings
Boomers. The working-age population is the largest population segment. Despite the lower average growth rate, it will remain the largest segment through 2035 with over 60 percent of total population. The growing working age population will need jobs, and a core assumption of the OFM projections is that the economy of Benton County will develop to support these new residents.The Benton-Franklin Council of Governments (BFCOG) is in the process of updating their long-range transportation plan, called Transition 2040. While Transition 2040 will not be complete until 2017; two draft chapters are available. Transition 2040 shows that growth is expected to be strongest in the population centers on the eastern side of the County. Prosser is characterized as a Small Urban Area by Tranisiton 2040, which is defined as:
“[…] areas with populations over 5,000 that are outside the Metropolitan Planning Area. While surrounded by rural, unincorporated, and natural resource lands, they serve as small hubs for housing, jobs, and health services.”
Transition 2040 estimates show the population of Prosser growing to 8,718 by the year 2040, which is an average annual growth of 1.6 percent. Transition 2040 desribes the physical characteristics of S40, such as its runway length, but does not provide in-depth analysis. Interstate 82, which runs through Prosser to Interstate 90 and Seattle, is identified as a strategic freight corridor by Transition 2040. There are two ramps for Interstate 82 in town. Location along the strategic freight corridor will support economic development in the community as this location makes the community eligilbe to compete for certain economic development grants from WSDOT, as outlined in the Washington State Freight Mobility Plan (WSFMP). Transition 2040 states that WSFMP “aims to support rural economies’ farm-to-market, manufacturing, and resource industry sectors.”The BFCOG 2015 Comprehensive Economic Development Strategy Update (2015 CEDS) highlight several recent developments in Prosser. These include the Washington State University Agricultural Experiment Station, which provides scientific research that supports the wine industry. The Port of Benton constructed the 32-acre Vintner’s Village as an incubator for new vineyards, and recently received a $1.5 million dollar loan to expand the facility as it had become full. The 2015 CEDS states that one of BFCOG’s goal is to continue to “liaise with the cities of Prosser [and other rural communities in the BFCOG jurisdiction] to promote economic development within their communities.”While Prosser will remain small compared to the communities in the eastern side of the County, overall population growth through 2040 is projected to be strong, and the community’s location on Interstate 82 may help it
attract new businesses. BFCOG economic development efforts around the wine industry have met with success as shown by the second phase of development for Vintner’s Village. Section 3.3 investigates how local economic growth may influence aviation activity.
3.3.2 AVIATION PROFILE - USERSThe Airport accommodates local and itinerant general aviation on its one 3,451 foot long by 60 foot wide runway. Users include agricultural spray operations, business travelers, student pilots, and hobbyists flying for recreational purposes. The Airport offers self-serve 100LL fuel used by piston powered aircraft which is available 24 hours per day. S40 has a fixed base operator (FBO) that provides flight instruction in standard and light sport aircraft, and aircraft maintenance services. There is no control tower at S40, and the Airport is not staffed 24 hours a day. The FBO staff are on site from 8am to 5pm, Monday through Friday. There are 56 aircraft based at S40, and all are single-engine piston. Of the 56 aircraft based at S40, 43 are standard single engine piston, and 13 are experiment / kit planes. There are 55 aircraft with an ARC of A-I and one with an ARC of B-I.The size of facilities and availability of services determines which types of aircraft can use S40 on a regular basis. The 60 foot runway width meets FAA standards for approach category B, Design Group I aircraft that are categorized as small because the maximum takeoff weight is 12,500 pounds or less. Although existing facilities were built for the most common users at the time of their design, S40 is capable of handling larger and heavier aircraft. Pavement strength is rated at 16,000 pounds for single wheel configuration. The Airport does not offer jet fuel, and the runway length and width may deter larger jets. FAA flight plan records show that small jets and turbo props, such as the Cessna Citation II and the Beech King Air 300, use S40.A survey on airport facilities was conducted from May to July 2016 (2016 User Survey). The survey collected 64 online responses; however, respondents were allowed to skip questions. Respondents that used the Airport were asked why they chose to do so, and were allowed to pick more than one reason. Of the 38 respondents that answered, 89 percent flew for recreation, 13 percent for business, and 32 percent for flight training.
3.3.3 AVIATION PROFILE – TERMINAL AREA FORECASTThe FAA TAF provides a record of aviation activity at S40 from 1990 to 2014, and forecasts from 2015 to 2040. Due to the absence of an airport traffic control tower, records are considered estimates. The TAF and airport management records show that the only based aircraft

FIGURE 3-2 FAA TAF FOR S40 - FORECAST ISSUED JANUARY 2016
Source: FAA Terminal Area Forecast
AIRPORT MASTER PLAN UPDATE 3-6
PROSSER AIRPORT - S40C
hapter 1 Introduction
Chapter 2
Existing Conditions
Chapter 3
Aviation Activity
Forecasts
Chapter 4
Facility Requirem
entsC
hapter 5 Alternatives Analysis
Chapter 6
Phased Developm
ent and C
ost Estimates
Chapter 7
Airport Layout Plan and D
rawings
TABLE 3.3 FAA TAF FOR S40 – FORECAST ISSUED JANUARY 2016
TYPE FISCAL YEAR
ITINERANT OPERATIONS
LOCAL OPERATIONS
TOTAL OPERATIONS
BASED SINGLE ENGINE1
Rec
ord
1990 7,202 2,500 9,702 381995 7,200 5,000 12,200 482000 7,200 5,000 12,200 452005 7,200 5,000 12,200 452010 7,700 5,500 13,200 53
Fore
cast
2015 7,700 5,500 13,200 512
2020 7,700 5,500 13,200 512025 7,700 5,500 13,200 512030 7,700 5,500 13,200 512035 7,700 5,500 13,200 512040 7,700 5,500 13,200 51
Source: FAA Terminal Area Forecast1 Management records show that all based aircraft are single engine. Mix is shown in footnote #2.2 Airport Management counts show 56 based aircraft in 2015. Of these, 43 are standard, and 13 are experimental/kit planes.

AIRPORT MASTER PLAN UPDATE 3-7
PROSSER AIRPORT - S40C
hapter 1 Introduction
Chapter 2
Existing Conditions
Chapter 3
Aviation Activity
Forecasts
Chapter 4
Facility Requirem
entsC
hapter 5 Alternatives Analysis
Chapter 6
Phased Developm
ent and C
ost Estimates
Chapter 7
Airport Layout Plan and D
rawings
are single engine piston. No other types are included in TAF records or forecasts. A summary of the FAA TAF issued on January 2016 is included in Table 3.3 and Figure 3-2.The TAF shows no variance from 2015 onwards, and records offer few clues into historical aircraft operations. Based aircraft totals were updated more frequently. As discussed in the next section, the TAF shows variation around the time the 2006 Master Plan was completed, and has not exhibited much change since then. This is not uncommon for TAFs at non-towered airports in rural areas; however, it does present a challenge when using the TAF to forecast change.Given the absence of variance in the TAF data, the Master Plan uses additional data sources in an attempt to add detail to the TAF numbers. Aircraft management counts show 56 based single engine piston aircraft instead of 51 in 2015. FBO staff provided itinerant operations counts for fiscal year 2015, shown in Table 3.4.The FBO does not keep count of local touch-and-go operations, and does not have counts for night operations and weekend operations as the office is closed. In light of the periods where no counts were collected, FBO records account for 90 percent of total itinerant operations as reported by the TAF. Given that the TAF has shown no variability in operations counts since 2007, the proximity of the 2015 counts and the TAF estimate could be a coincidence. Regardless of whether it is or not it is a coincidence, the proximity of the two figures lends support to using the 2015 TAF counts as a baseline for itinerant operations. This does not address the lack of annual operations variation in years past.
The lack of variance in aircraft operations and based aircraft in future TAF years presents a challenge in forecasting demand for two reasons. First – flat historical activity levels make it difficult to use linear regression analysis to project future activity. A work-around is discussed in Section 3.3. The second challenge is that FAA guidelines suggest forecasts should be within ten percent of the TAF over a five year period, and within 15 percent of the TAF over a ten year period, or else additional justification may be needed. Preferred forecasts are compared to the TAF in Section 3.6.Effort has been made to consider other sources of data for S40, including previously completed planning studies and other FAA databases.
3.3.4 AVIATION PROFILE – OTHER PLANNING STUDIESOther planning studies for S40 include a 2006 Airport Master Plan, and the 2009 Washington Aviation System Plan (WASP), which was done as part of the Washington State Long Term Air Transportation Study. The 2006 Master Plan forecasts did not deviate much from the TAF, but may explain the jump from 12,200 annual operations to 13,200, and the change from 45 based aircraft to 51 between 2006 and 2007. Since the 2006 Master Plan, the TAF has regressed to flat operations. Based aircraft totals appear to have been updated every five years.Chapter 7 of the 2009 WASP did not forecast activity for individual general aviation airports. General aviation airports were grouped at the Regional Transportation Planning Organization (RTPO) level, and given a single growth rate. S40 was part of the BFCOG RTPO, which also included the Walla Walla sub-RTPO.
The CAGR for based aircraft at general aviation airports in BFCOG RTPO was 1.7 percent from 2005 to 2015, and the CAGR for aircraft operations was 1.6 percent. The 2009 WASP is being updated as of 2015; however, demand forecasts have not been published. A comparison between historical growth rates and the growth rates in the 2009 WASP is presented in Table 3.5. Based aircraft grew more quickly, and aircraft operations grew more slowly than the 2009 WASP.
TABLE 3.4 2015 ITINERANT OPERATIONS COUNTS
MONTH OPERATIONSOctober 604
November 322December 246January 166February 453
March 607April 750May 960June 731July 793
August 422September 883
Total 6,937Source: S40 FBO Staff

AIRPORT MASTER PLAN UPDATE 3-8
PROSSER AIRPORT - S40C
hapter 1 Introduction
Chapter 2
Existing Conditions
Chapter 3
Aviation Activity
Forecasts
Chapter 4
Facility Requirem
entsC
hapter 5 Alternatives Analysis
Chapter 6
Phased Developm
ent and C
ost Estimates
Chapter 7
Airport Layout Plan and D
rawings
TABLE 3.5 GROWTH RATE COMPARISON 2005-2015
CATEGORY TAF1 2009 WASPBased Aircraft 2.2% 1.7%
Aircraft Operations 0.8% 1.6%
1 Based aircraft includes 2015 airport management counts. SOURCES: FAA TAF, Airport Mgmt, WSDOT
3.3.5 AVIATION PROFILE – TRAFFIC FLOW MANAGEMENT SYSTEM COUNTSAnother source of data is the FAA Traffic Flow Management System Counts (TFMSC), which are records of flight plans filed and completed. The TFMSC for S40 includes 3,378 operations for a period including fiscal years 2005 to 2015. The TFMSC data includes counts of operations by aircraft type, making it possible to lookup the aircraft reference code. The aircraft reference code is vital to facility planning because it guides size and setbacks for improvement projects.The limitations of TFMSC data is that it does not include local operations, and does not include itinerant operations that did not file a flight plan. Traffic flying under visual flight rules are not required to file flight plans; therefore, some pilots chose not to do so. This can skew TFMSC records by showing a higher percentage of larger aircraft (e.g. business jets and turbo props that typically file flight
plans) than smaller aircraft (e.g. single engine piston aircraft). TFMSC data for S40 varies between larger and smaller design groups, and does not show evidence of being skewed towards larger aircraft. TFMSC data by aircraft reference code is shown in Table 3.6 and Figure 3-3.Aircraft classified as “unknown” are operations recorded in TFMSC without data to identify the attribute type. Aircraft classified as “other” include rare one-off operations by military transport aircraft, and military and civilian helicopters. There were 28 operations over the ten year period by “other” aircraft – 20 of which were helicopters and the other eight were military aircraft. It is expected that most “unknown” aircraft fall into one of the more common aircraft reference codes. The logic behind this is supported by physical constraints of the airfield, such as runway length, width, and pavement strength, making the airfield undesirable or unaccommodating to larger aircraft on a regular basis, and TFMSC operations data showing the majority of operations are performed by Approach Category A/B and Design Group I/II aircraft.The most common operation type in the TFMSC records switches from A-I to B-II starting in 2011 (outside of a swing back to A-I in 2014). This timing corresponds with the end of the global financial crisis. Although the underlying cause of this switch cannot be identified with complete accuracy, national trends reported by the FAA Aerospace Forecast show the GA market moving away from recreational flying as personal finance became strained by the economy. Business GA picked up in response to the reduction of service by passenger
TABLE 3.6 FAA TFMSC RECORDS – OPERATIONS BY AIRCRAFT REFERENCE CODE
FISCAL YEAR A-I A-II B-I B-II UNKNOWN OTHER TOTAL
OPS1TAF ITN.
OPS2
2005 112 26 24 38 0 0 200 7,2002006 158 4 18 40 12 2 236 7,7002007 76 8 28 42 10 0 164 7,7002008 266 20 86 54 52 8 494 7,7002009 374 12 54 120 80 10 660 7,7002010 362 26 34 116 50 6 600 7,7002011 50 12 36 164 10 0 272 7,7002012 40 20 36 198 2 0 296 7,7002013 58 16 42 80 6 0 202 7,7002014 50 28 24 26 10 2 142 7,7002015 28 20 24 38 2 0 112 7,700
SOURCES: FAA TFMSC, FAA TAF 1 Operations captured in TFMSC data 2. Total annual operations reported by FAA TAF

AIRPORT MASTER PLAN UPDATE 3-9
PROSSER AIRPORT - S40C
hapter 1 Introduction
Chapter 2
Existing Conditions
Chapter 3
Aviation Activity
Forecasts
Chapter 4
Facility Requirem
entsC
hapter 5 Alternatives Analysis
Chapter 6
Phased Developm
ent and C
ost Estimates
Chapter 7
Airport Layout Plan and D
rawings
airlines in the wake of the global financial crisis. TFMSC records have declined across the board since 2009.Extrapolation of the TFMSC records across the TAF requires application of the statistical tests of significance to determine what degree of confidence can be obtained for each ARC estimate based on the sample size. Results are shown in Table 3.7 and explained below.Mean is the average of the sample.Standard error describes how the individual observations are dispersed around the sample mean. The coefficient of variation explains how the individual observations are dispersed around the sample mean. A larger percentage equals greater dispersion.Kurtosis helps identify outliers in the dispersion. A positive kurtosis indicates that there are more observations in the tail ends of the distribution than would be expected under normal distribution, and a negative kurtosis indicates that there are fewer. The closer to 0 the kurtosis is, the closer to a textbook “normal” distribution the sample is.Skewness indicates what side of the mean the majority of observations fall. Positive skewness means that there are more observations above the mean, and a negative
skewness is the opposite.Count is the number of observations included in each sample.The key statistic of interest is the confidence interval. The way to read this statistic is that there is 95 percent confidence that the confidence level contains the population mean. For ARC A-I aircraft, this means that there is 95 percent confidence that the interval between 55 and 231 contains the population mean. This information can be used to extrapolate the TFMSC data and provide a range of total itinerant operations by ARC for the forecast years.The advantage of the descriptive statistics analysis is that it is independent of the population, which is the total number of itinerant operations. The statistics hold true regardless of whether or not the TAF total operations counts are accurate. A disadvantage is that it the statistics do not take into account any external forces that would increase or reduce flying by a certain ARC in a particular year.The other item that statistics does not shed light on is the likelihood of a particular ARC to file a flight plan. Given that S40 is in uncontrolled airspace, and given that the Airport does not have instrument procedures, it is
SOURCE:
FIGURE 3-3 FAA TFMSC RECORDS - OPERATIONS BY AIRCRAFT REFERENCE COCE

AIRPORT MASTER PLAN UPDATE 3-10
PROSSER AIRPORT - S40C
hapter 1 Introduction
Chapter 2
Existing Conditions
Chapter 3
Aviation Activity
Forecasts
Chapter 4
Facility Requirem
entsC
hapter 5 Alternatives Analysis
Chapter 6
Phased Developm
ent and C
ost Estimates
Chapter 7
Airport Layout Plan and D
rawings
expected that recreational pilots and students are much less likely to file than experience flight crews in larger aircraft. For this reason, more weight is put on the A-II and B-II TFMSC records being near actual operations, and the A-I and B-I operations being samples. Operations by ARC are discussed in Section 3.6.
3.3.6 CATCHMENT AREAThe catchment area for S40, which defines where its users comer from, is driven by the presence of other Airports and the facilities and services that they offer. The 2012 WSDOT Airport Economic Profile indicates that the catchment area for S40 includes Yakima and Benton counties. Nearby airports include Sunnyside Airport (1S5) in Yakima County, which is located 14 miles to the northwest of S40, and Richland Airport (RLD) in Benton County, which is located 31 miles to the east. 1S5 is a rural airport, similar to S40, and RLD is located in Benton County’s primary population centers of Richland and Kennewick. A comparison of nearby airports is presented in Table 3.8.1. RLD does not have a control tower, but is located
within controlled airspace associated with the Tri-Cities Airport(PSC).
2. 1S5 has 13 single engine, and 1 multi-engine aircraft.
3. RLD has 140 single engine, 3 jet, 9 multi-engine, 6 helicopter, and 20 other aircraft.
The presence of 1S5 and RLD, and the comparable facilities offered at each, limits the extent of the S40 catchment area; however, the Airport captures users from around the area. The 2016 user survey asked respondents where they lived. Of the 42 responses to
that question, 31 percent lived in Prosser, 43 percent lived in the Tri-Cities area (Richland, Kennewick, and Pasco), five percent lived in Yakima County, and 21 percent were from areas outside of Yakima and Benton counties and the Tri-Cities.The 2012 WSDOT Airport Economic Profile lists the catchment area for 1S5 as Yakima County only, whereas the catchment area for S40 includes both Benton and Yakima counties. S40 offers more aircraft services to pilots, such as flight training and maintenance than 1S5. Runway weight bearing capacity is higher, which means that S40 can accommodate heavier aircraft on a more regular basis.RLD offers the same types of pilot services as S40, but is located near larger population and employment center, features Jet A fuel for turbine aircraft, and has instrument approaches for all-weather reliability.MethodologyThe forecasts use linear regression models for based aircraft and operations forecasts. The market share methodology is used for based aircraft forecasts because there is some variation in historical data. Market share is not used for aircraft operations because there is little variation in the historical data. Other forecast methods, such as Monte Carlo simulation would be ineffective without more detailed historical data. The linear regression method begins with a correlation analysis, which investigates how aviation activities at S40 have performed when compared to select aviation and non-aviation activity indicators. Future activities are projected based on growth of highly correlated variables using an algebraic regression equation. The market share methodology looks at how based aircraft at S40 have changed in relation to a larger market, and projects
TABLE 3.7 TFMSC DESCRIPTIVE STATISTICS
ATTRIBUTE A-I A-II B-I B-IIMean 143 17 37 83Standard Error 39 2 6 18Standard Deviation 131 8 19 58Coefficient of Variation (%) 91 45 52 70Kurtosis (0.46) (0.92) 4.13 (0.26)Skewness 1.07 (0.29) 1.90 0.97Count 11 11 11 11Confidence Level (95.0%) 88 5 13 39Lower Bound (95.0%) 55 12 24 44Upper Bound (95.0%) 231 23 50 122
Source: TFMSC Records from 2005-2015

AIRPORT MASTER PLAN UPDATE 3-11
PROSSER AIRPORT - S40C
hapter 1 Introduction
Chapter 2
Existing Conditions
Chapter 3
Aviation Activity
Forecasts
Chapter 4
Facility Requirem
entsC
hapter 5 Alternatives Analysis
Chapter 6
Phased Developm
ent and C
ost Estimates
Chapter 7
Airport Layout Plan and D
rawings
future growth based on maintaining a share of the larger market.The correlation analysis, which is part of the linear regression model, compares based aircraft, local operations, and itinerant operations to external activity indicators. These activity indicators are selected because they represent national levels of similar activity to what occurs at S40, and because they are indices of socioeconomic activity in Benton County. Correlation analysis ignores units and orders of magnitude, and instead measure how closely the variables change in proportion to one another using percentages. Correlation can be negative, indicating that as one index grows, the other declines. Correlation is measured by the correlation coefficient, which ranges from -1 to +1. A score close to +/-1 suggest stronger positive/negative correlation, and a score closer to zero suggests that the two variables are not correlated.Correlation shows potential interrelatedness between two variables; however, it cannot be the sole factor to determine that growth of one variable is caused by the other. Often times there are unrelated factors and additional variables that impact the growth in both variables. An example is a ten percent growth in the sale of luxury goods correlating to the ten percent growth in travel by private aircraft in a community. Purchasing luxury goods does not directly cause people to fly by private aircraft, nor vice versa – but the strong correlation suggests that a third factor may be causing both variables to grow (such as local growth in an industry with high paying jobs). Correlation is augmented by professional judgement which helps explain the correlation. Factors evaluated in the correlation analysis and analysis results
are shown in Table 3.9 and Table 3.10.Correlation analysis does not fully explain why variables behave the way they do, but does help suggest a connection, or lack thereof, between variables. The correlation analysis shows that total employment has the strongest correlation with the three measures of aviation activity at S40, followed by GRP and Total Earnings. The variables are positively correlated with the aviation activity measures, meaning that when once increases, the other does the same. Observing the trends of the variables, it is evident that aviation activity measures show strongest correlation with variables that are growing, and those that do not show much volatility. For example, the S&P 500 average close has experienced periods of growth and contraction in the ten years considered. When compared to the relatively stable activity indicators at S40, the S&P 500 is highly volatile and weakly correlated.Weak correlation and negative with national variables is cause for further discussion. As stated in Section 3.1, the TAF operations data lacks historical variation, therefore it remains constant while national GA operations fluctuate. However, S40 based aircraft, which exhibit more historical variation than S40 operations, also exhibit a negative correlation with the national single engine piston fleet. This suggests that while the single engine piston fleet has been shrinking nationwide, growth at S40 is going counter to national trends.Correlation analysis does not “prove” that a particular variable is better than another to use for regression forecasts; however, it does demonstrate that the variables have historically changed proportionally and may be
TABLE 3.8 NEARBY AIRPORTS
ATTRIBUTE PROSSER (S40) SUNNYSIDE (1S5) RICHLAND (RLD)
Runway(s) 3,451’ x 60’ 3,423’ x 60’ (1/19) 4,009’ x 75’(8/26) 4,001’ x 100’
Distance from S40 (Driving) 0 Miles 14 Miles Northwest 30 Miles EastRunway Weight Capacity 16,000 lbs. (Single) 12,500 lbs. (Single) 30,000 lbs. (Single)100LL Fuel Yes Yes YesJet A Fuel No No YesFlight Training Yes No YesAircraft Maintenance Yes No YesInstrument Approach No No YesControl Tower No No No
1
Based Aircraft (2015) 56 142
1783
Sources: Aircraft Owners and Pilots Association (AOPA) Airport Guide, FAA Terminal Area Forecast (Jan 2016)

AIRPORT MASTER PLAN UPDATE 3-12
PROSSER AIRPORT - S40C
hapter 1 Introduction
Chapter 2
Existing Conditions
Chapter 3
Aviation Activity
Forecasts
Chapter 4
Facility Requirem
entsC
hapter 5 Alternatives Analysis
Chapter 6
Phased Developm
ent and C
ost Estimates
Chapter 7
Airport Layout Plan and D
rawings
subject to the same market forces, such as the number of jobs in a community. For this reason, variables that have exhibited a high level of correlation are carried forward into regression analysis. The results of these analyses will be checked against the TAF and national forecasts to assess whether or not the forecasts they produce are reasonable.
3.4 BASED AIRCRAFT FORECASTS
The FAA TAF has five classifications for based aircraft: single- and multi-engine piston, jet (turbine), helicopter, and other. Airport and FAA TAF records from 2005 to 2015 show that only single-engine piston aircraft are based at S40. The breakdown amongst the single engine aircraft is 43 standard, and 13 kit/experimental aircraft. 2015 counts come directly from the airport manager. The Airport is used by other aircraft classifications, as discussed in Section 3.4; however, these aircraft are based elsewhere. Based aircraft forecasts are used to plan for aircraft parking and storage, and help identify the critical design aircraft for facility planning. Historical based aircraft totals are presented in Table 3.11.Based aircraft counts show a net gain of 11 aircraft between 2005 and 2015; however, there have been periods of growth, stability, and decline throughout. The FAA sees single-engine piston aircraft as a declining market due to the age of the fleet, and the growing costs of maintaining airworthiness. As shown in Table 3.9, the national single engine GA fleet has been reduced from
148,101 aircraft in 2005 to 122,435 in 2015 due to these pressures.Despite the overall reduction of the GA fleet, there are some segments of the GA market that are experiencing growth. While traditional single-engine piston aircraft are retiring, a new subset of this market is expanding: light sport and experimental aircraft. There are 13 experimental aircraft based at S40. Although there are no light sport aircraft based at the Airport, the FBO is certified to provide flight instruction to owners of these aircraft. These aircraft are smaller and more maneuverable than older single-engine piston aircraft, cheaper to own and operate, and can be piloted with a light sport license, which has fewer training and medical requirements than a private pilot’s license, and the FBO at S40 offers light sport flight instruction. Light sport aircraft are popular among recreational pilots (those who fly for fun and personal travel); however their size and speed make them less popular for business GA. The FAA Aerospace Forecast indicates that experimental aircraft registrations have grown by two percent between 2014 and 2015, and the FAA expects a sustained annual average growth of 1.4 percent through 2035 for this category. It is expected that as some of the older single-engine piston aircraft retire, they may be replaced by experimental and light sport aircraft if the owner does not wish to purchase a heavier single-engine piston aircraft.Based aircraft forecasts are performed for single-engine piston aircraft only due to the absence of data on other aircraft types. For the purposes of contingency planning,
TABLE 3.9 CORRELATION ANALYSIS VARIABLES AND SOURCES
FACTOR TYPE (SCALE) SOURCEBased Aircraft
Aviation (Local)Airport Management / TAF
Itinerant GA Operations FBO/TAF/TFMSCLocal GA Operations TAFItinerant GA Operations
Aviation (National) FAA Aerospace ForecastLocal GA OperationsSingle-Engine FleetPopulation
Socioeconomic (Benton County)
U.S. Census Bureau Washington OFMBFCOGWoods & Poole, Inc.
Labor ForceEmploymentTotal EarningsGross Regional Product (GRP)S&P 500 Average Close
Socioeconomic (National)Yahoo Finance
Cushing, OK Spot Price (Oil) U.S. Department of EnergyU.S. Gross Domestic Product World Bank, OCEDSource:

PROSSER AIRPORT - S40
AIRPORT MASTER PLAN UPDATE 3-13
Chapter 1
IntroductionC
hapter 2 Existing C
onditionsC
hapter 3 Aviation A
ctivity Forecasts
Chapter 4
Facility Requirem
entsC
hapter 5 Alternatives Analysis
Chapter 6
Phased Developm
ent and C
ost Estimates
Chapter 7
Airport Layout Plan and D
rawings
TABLE 3.10 NATIONAL BASED AIRCRAFT DATA
Year Based Itinerant Local Itinerant GA1 Local GA1 Single Engine1 Population Workforce Employment Earnings2 GRP² Retail Sales² GDP3,5 S&P 5004,5 Oil4,5
Units Aircraft Operations Operations Thousands of Ops.
Thousands of Ops. Aircraft Thousands Thousands Thousands Millions
of DollarsMillions
of DollarsMillions
of DollarsBillions
of DollarsAverage
CloseDollars
per barrel2005 45 7,200 5,000 19,303 14,844 148,101 157.726 98.196 86.537 4,509.545 7,083.925 2,323.95 13.10 1,207.77 56.492006 45 7,200 5,000 18,707 14,365 145,036 159.564 98.725 86.144 4,412.965 6,865.070 2,373.16 13.90 1,318.31 66.022007 51 7,700 5,500 18,575 14,557 147,569 161.669 99.118 90.741 4,677.887 7,422.776 2,391.05 14.50 1,478.10 72.322008 53 7,700 5,500 17,493 14,081 145,497 166.573 101.433 92.731 4,807.627 7,583.665 2,346.46 14.70 1,215.22 99.572009 53 7,700 5,500 15,571 12,448 140,649 171.122 103.394 94.921 5,163.441 8,293.603 2,214.46 14.40 946.27 61.652010 53 7,700 5,500 14,864 11,716 139,519 176.472 106.217 98.626 5,489.495 8,893.862 2,350.41 15.00 1,130.68 79.402011 53 7,700 5,500 14,528 11,437 136,895 180.678 108.542 100.174 5,601.096 9,004.691 2,506.35 15.50 1,280.76 94.872012 53 7,700 5,500 14,522 11,608 128,847 184.008 109.494 102.154 5,760.176 9,271.277 2,576.24 16.20 1,386.51 94.112013 51 7,700 5,500 14,177 11,748 124,398 187.408 110.593 104.169 5,936.291 9,545.743 2,647.92 16.80 1,652.29 97.912014 51 7,700 5,500 13,978 11,674 123,440 190.874 111.593 106.212 6,117.229 9,828.319 2,721.46 17.40 1,944.41 93.262015 56 7,700 5,500 13,932 11,807 122,435 194.387 112.571 108.289 6,303.086 10,119.245 2,796.87 - - -
Growth Rate:Five Year 1.1% 0.0% 0.0% -1.3% 0.2% -2.6% 2.0% 1.2% 1.9% 2.8% 2.6% 3.5% 3.8% 14.5% 4.1%Ten Year 2.2% 0.7% 1.0% -3.2% -2.3% -1.9% 2.1% 1.4% 2.3% 3.4% 3.6% 1.9% 3.2% 5.4% 5.7%
Correlation: Based Aircraft 1.00 0.91 0.91 (0.73) (0.67) (0.51) 0.67 0.66 0.73 0.69 0.70 0.37 0.52 (0.06) 0.61Itinerant Ops. 0.91 1.00 1.00 (0.71) (0.66) (0.49) 0.64 0.63 0.71 0.65 0.67 0.34 0.65 0.17 0.65Local Ops. 0.91 1.00 1.00 (0.71) (0.66) (0.49) 0.64 0.63 0.71 0.65 0.67 0.34 0.65 0.17 0.65Notes: 1: National Total per FAA.2: Dollar values in 2009 dollars (multiply by 1.11 to convert to 2015 dollars). 3: Dollar values in 2015 dollars.4: Dollar values current for year they are reported in.5: 2015 data not yet available for GDP, S&P 500 Average Close, and Oil.
Correlation Strength Rank Based Aircraft Itinerant Operations Local Operations
1 Employment2 Gross Regional Product (GRP)3 Earnings Tie: Earnings / Gross Domestic Product (GDP) / Oil

AIRPORT MASTER PLAN UPDATE 3-14
PROSSER AIRPORT - S40C
hapter 1 Introduction
Chapter 2
Existing Conditions
Chapter 3
Aviation Activity
Forecasts
Chapter 4
Facility Requirem
entsC
hapter 5 Alternatives Analysis
Chapter 6
Phased Developm
ent and C
ost Estimates
Chapter 7
Airport Layout Plan and D
rawings
TABLE 3.12 NATIONAL GENERAL AVIATION AND AIR TAXI FLEET 2015-2035
AIRCRAFT TYPE CLASSIFICATION % OF FLEET (2015, 2035)
GROWTH RATE (2015-2035)
Single-Engine Piston 62% 51% -0.6%Multi-Engine Piston 7% 6% -0.4%Turbo-Prop 5% 6% 1.5%Jet 6% 10% 2.8%Rotorcraft (Helicopters) 5% 8% 2.5%Experimental 13% 15% 1.4%Light Sport 1% 3% 4.3%Other 2% 2% -0.2%National Fleet 197,780 214,260 0.4%Source: FAA Aerospace Forecast 2015-2035 Numbers may not add to 100% due to rounding
TABLE 3.11 HISTORICAL BASED AIRCRAFT COUNTS
YEAR BASED AIRCRAFT (SINGLE-ENGINE)
PERCENT CHANGE (YEAR TO YEAR)
2005 452006 45 0.0%2007 51 13.3%2008 53 3.9%2009 53 0.0%2010 53 0.0%2011 53 0.0%2012 53 0.0%2013 51 -3.8%2014 51 0.0%2015 56 9.8%
Growth Rate (2005-2015) 2.2%Growth Rate (2010-2015) 1.1%Sources: (2015) Airport Records, (2005-2014) FAA Terminal Area Forecast

AIRPORT MASTER PLAN UPDATE 3-15
PROSSER AIRPORT - S40C
hapter 1 Introduction
Chapter 2
Existing Conditions
Chapter 3
Aviation Activity
Forecasts
Chapter 4
Facility Requirem
entsC
hapter 5 Alternatives Analysis
Chapter 6
Phased Developm
ent and C
ost Estimates
Chapter 7
Airport Layout Plan and D
rawings
a summary of market trends for other aircraft types is included in Table 3.12.Aircraft types showing high growth potential include turbo-prop, jet, rotorcraft, experimental aircraft, and light sport aircraft. Experimental and light-sport aircraft growth are included in the single engine forecasts. There were 13 experimental aircraft at S40 in 2015 and although there were no light sport aircraft, the FBO offers light sport flight instruction. Turbo-prop, and rotorcraft forecasts are presented as contingency in case these high-growth markets appear at S40. While small jets can and do operate at S40, they are unlikely to base at the Airport due to the runway length restricting payload and range.TFMSC data shows that turbo-prop, rotorcraft, and small jets use S40 on an itinerant basis, indicating that the airfield is capable of supporting these users. The lack of Jet A fuel may be a deterred to jet and turbo prop aircraft at this time. The TAF indicates that jet/turbo prop aircraft are already in the area, with three based at RLD. There are six helicopters at RLD. The intent of contingency planning is not to promote a “built it and they will come” approach, but instead to carry consideration for how the Airport could accommodate different aircraft types in the future as improvement alternatives are developed. This includes planning for the possibility of larger hangars, and investigating the feasibility and market potential for providing Jet A fuel.Based aircraft forecasts are prepared using historical growth rates, growth rates from the FAA Aerospace Forecast, and socioeconomic factors that showed high correlation to historical based aircraft levels (Employment, Earnings, and GRP). Forecasts are compared to the FAA TAF and variations are explained in the following sections. Based aircraft forecasts are presented in Figure 3-4.
3.4.1 BASED AIRCRAFT FORECAST METHODOLOGIESThe following section describe the methodologies used to prepare the based aircraft forecasts.Growth Rate ForecastsGrowth rate forecasts use historical growth rates over the past five and ten year periods to project future growth. This methodology works only when there is variation in the historical dataset. Based aircraft at S40 grew by an annual average of 2.2 percent from 2005 to 2015 (45 to 56), and by an annual average of 1.1 percent from 2010 to 2015 (53 to 56). These growth rates are used to project future based aircraft totals, resulting in 70 based aircraft using the five year growth rate and 87 based aircraft using the ten-year growth rate.
FAA Aerospace ForecastDue to the FAA outlook on the single engine piston market, the FAA Aerospace forecast shows a decline in based aircraft by an annual average of 0.6 percent per year. In this forecast, based aircraft decline from 56 to 50, meaning that the arrival of new single-engine piston aircraft occurs at a slower rate than retirements and relocation of aircraft to other airports. Nationally, these trends are similar to what has occurred to the single-engine fleet over the past 10 years; however, the correlation analysis in Table 3.5 shows that based aircraft totals at S40 have a negative correlation to the national single-engine piston fleet, meaning that as the national fleet becomes smaller, based aircraft at S40 have been growing. Much of this is likely due to the influx of experimental and light sport aircraft at S40, which have offset retirements and relocations.Socioeconomic ForecastsSocioeconomic indicators that have shown strong correlation to based aircraft totals at S40 include total employment, total earnings, and gross regional product. These indicators measure at the County level. All three indicators can be thought of as different measures for the economic health of the region. Forecasts for these indicators come from U.S. Census gap-year data provider Woods & Poole, which provides un-incentivized projections of local socioeconomic indicators. Earnings and GRP forecasts have the same 2.9 percent annual growth rate, and project based aircraft growth from 56 to 100 by 2035. The employment forecast has a 1.9 percent annual growth rate and projects based aircraft growth from 56 to 81 by 2035.Forecasts presented provide a range of alternatives for evaluation. High growth rates shown in the socioeconomic indicators reflect growth Benton County has seen over the past decade. These growth rates are projected to continue into the future; however, growth in earnings and GRP have historically occurred at a faster rate than growth in based aircraft at S40 (3.4 percent for earnings and 3.6 percent for GRP compared to 2.2 percent for based aircraft). Due to the mismatch between historical growth rates, it is not recommended that earnings and GRP are used as the basis for based aircraft forecasts.The market share methodology is a low/no growth forecast, and compares based aircraft at S40 with the national single-engine piston fleet. This methodology forecasts a decline to 41 total based aircraft in 2035 due to the expected retirement of single engine aircraft in the future. Given that this methodology is counter to historical trends of based aircraft growth at S40, it is not recommended that the market share methodology be used as the preferred forecast.The methodologies that fall in the mid-growth category

AIRPORT MASTER PLAN UPDATE 3-16
PROSSER AIRPORT - S40C
hapter 1 Introduction
Chapter 2
Existing Conditions
Chapter 3
Aviation Activity
Forecasts
Chapter 4
Facility Requirem
entsC
hapter 5 Alternatives Analysis
Chapter 6
Phased Developm
ent and C
ost Estimates
Chapter 7
Airport Layout Plan and D
rawings
Forecast 2005 2010 2015 2020 2025 2030 2035 2015-2035Historical 45 53 56 Growth RateMarket Share 44 44 42 41 -1.6%
FAA TAF 56 56 56 56 0.0%
GR (5Y) 59 63 66 70 1.1%
Employment 62 68 74 81 1.9%
GR (10Y) 62 70 78 87 2.2%
Earnings 65 75 87 100 2.9%
GRP 65 75 87 100 2.9%
Source:
FIGURE 3-4: PROSSER AIRPORT BASED AIRCRAFT OPERATIONS FORECASTS

AIRPORT MASTER PLAN UPDATE 3-17
PROSSER AIRPORT - S40C
hapter 1 Introduction
Chapter 2
Existing Conditions
Chapter 3
Aviation Activity
Forecasts
Chapter 4
Facility Requirem
entsC
hapter 5 Alternatives Analysis
Chapter 6
Phased Developm
ent and C
ost Estimates
Chapter 7
Airport Layout Plan and D
rawings
include the five-year growth rate, the employment- based forecast, and the ten-year growth rate. These forecasts project based aircraft growth between 1.1 percent and 2.2 percent through the forecast period. The five- and ten-year growth rate forecasts assume that based aircraft will continue to grow at S40 in line with how they have grown over the past ten years. Factors that support choosing the five-year growth rate over the ten-year growth rate include the emergence of light sport aircraft, and that the last five years of growth include the recession in 2008. Light sport pilot license has lower flight training costs, and allow older pilots to keep flying with less stringent medical requirements than a private pilot license. The five years of socioeconomic data reflect how the general aviation market (particularly the business and recreational segments) have responded since the recession.Conversely, the ten-year forecast provides a longer data window, and has a bigger growth rate that falls more closely in-line with the socioeconomic growth experienced by the County over the past ten years. The core question of the ten-year forecast growth rate revolves around the sustainability of this rate into the future. Given that the single-engine piston market is in decline, and economic realities associated with retirees (aging pilots) taking losses on their retirement assets during the recession, it is not recommended that the ten-year forecast be used as the basis for the based aircraft forecasts.The employment-based forecast falls between the two growth rate forecasts and projects 81 based aircraft in the 20-year forecast window at a growth rate of 1.9 percent. This forecast and associated growth rate is more in line with the Ten Year Forecast than the Five Year Forecast, and similar concerns about long-term sustainability of the growth rate exists. Employment growth is an indicator of economic development which supports based aircraft growth; however, past growth trends and the expected decline in single engine piston aircraft (except for light sport and experimental) support choosing a forecast with a smaller growth rate.Given the options evaluated, it is recommended that thefive-yeargrowth ratemethodologybeused asthe preferred based aircraft forecast. This forecast
is supported by historic growth, is seen as reasonable based on realities of the GA market such as the changing composition of the single-engine category to include more experimental and light sport aircraft.Consideration is given to the fast growing market segments that are not currently based at S40, but may do so in the future. Growth by these user classes is supported by newer industries in the area related to wine production. As shown in Table 3.11 previously, turbo-prop and helicopter aircraft are growing in the national fleet, and S40 has facilities in place to accommodate these users should they wish to locate at the Airport. Linear regression forecasting does not work with start values of zero. The model needs a non-zero number to show growth over time. To compensate for this, forecasting assumes that there is one user of each class at the Airport in 2015 and then forecasts growth using the FAA Aerospace Forecast growth rates. The result is one turbo-prop and two helicopters over the 20-year forecast window.
3.5 AIRCRAFT OPERATIONS FORECASTS
The FAA TAF has two classifications for aircraft operations: local and itinerant. Operations records from 2005 to 2015 show little variation outside of a 500 operation jump per category from 2006 to 2007. Aircraft operations totals and ten-year growth rates are shown in Table 3.13. Because the dataset does not change from 2007 to 2015, the five-year growth rate is zero. The TAF carries this zero percent growth rate forward and TAF operations totals in 2035 are the same as in 2015. The FAA Aerospace Forecast and the Terminal Area Forecast for the U.S. show that aviation is a dynamic industry and has been subject to strong growth and decline over the past 20 years on a national level. It is unlikely that operations at S40 remained stagnant during these years. FAA forecasters likely defaulted to the last set of known values due to the remoteness of S40 and the absence of an ATCT with which better data could have been acquired.This type of data consistency and absence of variation is not uncommon at airports like S40, which have no control tower to count operations and instead rely on estimates
TABLE 3.13 HISTORICAL AIRCRAFT OPERATIONS COUNTS
YEAR OPERATIONS (ITINERANT)
OPERATIONS (LOCAL)
OPERATIONS (TOTAL)
2005-2006 (per year) 7,200 5,000 12,200
2007-2015 (per year) 7,700 5,500 13,200Growth Rate 0.7% 1.0% 0.8%Source: FAA Terminal Area Forecast

AIRPORT MASTER PLAN UPDATE 3-18
PROSSER AIRPORT - S40C
hapter 1 Introduction
Chapter 2
Existing Conditions
Chapter 3
Aviation Activity
Forecasts
Chapter 4
Facility Requirem
entsC
hapter 5 Alternatives Analysis
Chapter 6
Phased Developm
ent and C
ost Estimates
Chapter 7
Airport Layout Plan and D
rawings
from tenants and management. Lack of variation within the dataset presents challenges to forecasting using regression and correlation analyses because external datasets have new values yearly while the operations counts at S40 do not. Therefore, the formulas are limited. With this in mind, forecasting for aircraft operations uses historical data as a starting point, and then looks to external forecasts to provide growth rates.According to the FAA Aerospace Forecast, GA operations made up 52 percent of all aircraft operations in the U.S. in 2015; however due to faster growth in the scheduled air carrier market, GA operations are expected to make up 47 percent of all aircraft operations in 2035. Further segmentation suggests that the business GA market is the primary driver of growth while the recreational GA market and flight training markets are in decline. As explored in Section 3.3, the growing light sport class has slowed the decline of the recreational GA market; however it is expected that this market will produce a net decline until it stabilizes in the next five to ten years.GA is not subject to the same reporting standards as commercial flight, therefore it is more difficult to tell whether a GA operation was performed for the purposes of business, flight training, or recreation. The 2016 User Survey found that 89 percent of S40 users flew for recreation, 32 percent flew for flight training, and 13 percent flew for business. The survey also showed that pilots often tended to fly for multiple purposes – and
some indicated that their reason for flying depended on the day and what they needed to do.Flight instruction at S40 is offered by FBO, but it is not an institutional flight school. Local operations are expected to consist of a mix of students, pilots maintaining proficiency, and recreational users.Another factor that is expected to influence GA operations in the future is the number of active pilots. As stated in Section 3.3, the light sport market is growing; however, it makes up a relatively small percentage of GA pilots (one percent in 2015 and three percent in 2020). The most common GA pilot license held is the private license; however, this license is closely aligned with recreational GA and is expected to decline from 40 percent of GA pilots in 2015 to 36 percent in 2035. The commercial licensed pilot population is expected to grow at 0.4 percent annually, from 24 percent of the pilot population in 2015 to 25 percent in 2035. Another area of growth is pilots licensed on rotorcraft only, which is expected to grow at 2.2 percent annually. Licenses held by type are shown in Table 3.14.Aircraft operations forecasts blend regression analysis and application of external growth rates. Similar to based aircraft forecasts, operations forecasts look to external sources including the FAA Aerospace Forecast and socioeconomic factors that, despite the lack of data variation, showed high correlation to historical operations levels. Forecasts are compared to the FAA TAF and
TABLE 3.14 NATIONAL GA OPERATIONS AND PILOTS BY TYPE 2015-2035
OPERATIONS CLASSIFICATION
% OF OPS. (2015, 2035)
GROWTH RATE (2015-2035)
Itinerant 28% 25% 0.4%Local 24% 21% 0.5%National GA Operations 52% 47% 0.4%National Total Operations (Millions) 49.8 59.9 0.9%
LICENSE TYPE % OF LICENSES (2015, 2035)
GROWTH RATE (2015-2035)
Student 27% 25% -0.3%Sport Pilot 1% 3% 5.2%Private 40% 36% -0.3%Commercial 24% 25% 0.4%Rotorcraft Only 3% 5% 2.2%Total Pilots (Except ATP) 438,690 448,400 0.1%Source: FAA Aerospace Forecast 2015-2035 Air Transport Pilots (ATP) excluded because S40 does not have commercial service Numbers will not add to 100% due to omitted categories

AIRPORT MASTER PLAN UPDATE 3-19
PROSSER AIRPORT - S40C
hapter 1 Introduction
Chapter 2
Existing Conditions
Chapter 3
Aviation Activity
Forecasts
Chapter 4
Facility Requirem
entsC
hapter 5 Alternatives Analysis
Chapter 6
Phased Developm
ent and C
ost Estimates
Chapter 7
Airport Layout Plan and D
rawings
variations are explained in the following sections. Based aircraft forecasts are presented in Figure 3-4.Operations Forecast MethodologiesThe following sections describe the forecast methodologies used to prepare the operations forecasts.Growth Rate ForecastA growth rate forecast projects historical trends continuing into the future. For this methodology to work, there must be an observable rate of change or the forecast will remain flat. Aircraft operations records provide sufficient rate of change for a ten-year growth rate forecast, but the five-year growth rate is zero. The five-year growth rate methodology is not carried forward because it does not forecast any change and the ten-year growth rate forecast is used to develop the growth rate operations forecast. The ten-year growth rate projects 0.8 percent annual average growth over the ten year period, which is equal to the weighted average of the historical ten-year growth rates of itinerant operations (0.7 percent growth and 58 percent of operations) and local operations (1.0 percent growth and 42 percent of operations).FAA Aerospace ForecastThe FAA Aerospace Forecast uses a 0.5 percent growth rate for local operations and a 0.4 percent growth rate for itinerant operations over the next 20 years. The weighted average of the two is 0.4 percent. Although GA traffic shows modest growth in the FAA Aerospace Forecast, it is expected that the composition of hours flown by GA aircraft will change. As shown in Table 3.15, GA operations and aircraft utilization are expected to grow fastest in the light sport, jet, and rotorcraft categories. Piston powered aircraft, the most common aircraft type by number of aircraft and hours flown are projected to decline over time. As with based aircraft, it is expected that growth in operations by itinerant jet aircraft, and local and itinerant light sport and experimental aircraft
will offset the decline in piston aircraft operations. Socioeconomic ForecastsLocal socioeconomic indicators that show strong correlation to aircraft operations at S40 include employment, GRP, and earnings. Local operations are typically most sensitive to local conditions and itinerant operations are more responsive to the greater regional and national economy. Forecasts are prepared using the remaining indicators: employment, GRP, earnings, and GDP. Of these, employment (1.9 percent), earnings (2.9 percent) and GRP (three percent) use the same growth rates as used in the based aircraft forecasts (+/- 0.1% due to rounding). The U.S. GDP forecast comes from the Organization for Economic Cooperation and Development (OECD), and projects an average annual growth rate of 1.9% for the U.S. GDP.Preferred Operations ForecastMuch like the based aircraft forecasts, aircraft operations forecasts provide a range of high- mid-, and low/no-growth alternatives for evaluation. High growth rates shown in the socioeconomic indicators reflect growth Benton County has seen over the past decade. These growth rates are projected to continue into the future; however, growth in earnings and GRP have historically occurred at a faster rate than growth in based aircraft at S40 (3.4 percent for earnings and 3.6 percent for GRP compared to 0.8 percent for aircraft operations). Although both are trending towards growth (hence the correlation), the earnings and GRP growth rates are much higher than the operations growth rate. Due to the mismatch between historical growth rates, it is not recommended that earnings and GRP are used as the basis for aircraft operations forecasts. Operations at S40 will grow, but it is not expected that they will do so at the same rate as Benton County earnings and GRP.
TABLE 3.15 NATIONAL GA HOURS FLOWN BY CLASS 2015-2035
OPERATIONS CLASS % OF HOURS FLOWN (2015, 2035)
GROWTH RATE (2015-2035)
Single Engine Piston 46% 31% -0.5%Multi-Engine Piston 7% 5% -0.2%Turbo-Prop 11% 12% 1.7%Jet 16% 25% 3.6%Rotorcraft (Helicopters) 14% 19% 3.0%Experimental 5% 6% 2.4%Light Sport 1% 2% 5.1%Other 1% 0% -0.1%Total GA Hours Flown 23,566 30,626 1.4%Source: FAA Aerospace Forecast 2015-2035

AIRPORT MASTER PLAN UPDATE 3-20
PROSSER AIRPORT - S40C
hapter 1 Introduction
Chapter 2
Existing Conditions
Chapter 3
Aviation Activity
Forecasts
Chapter 4
Facility Requirem
entsC
hapter 5 Alternatives Analysis
Chapter 6
Phased Developm
ent and C
ost Estimates
Chapter 7
Airport Layout Plan and D
rawings
The mid-growth forecasts include the employment and GDP-based methodologies. Similar to the high- growth forecasts, the mid-growth forecast project operations growth far in excess of what has occurred historically. This is likely due to inaccuracies in historical data; however, information collected from Airport tenants supports the accuracy of 2015 operations totals. In the absence of more reliable historical data, it is not recommended that employment and GDP are used as the basis for aircraft operations. It is not expected that operations will grow as quickly as the local and national economies overall.The low/no-growth forecasts include the Ten-year Growth Rate, the FAA Aerospace Forecast, and the TAF. The TAF projects no growth which is counter to historical trends and evidence of economic development in Benton County. The FAA Aerospace Forecast and the Ten- year Growth Rate both show modest growth at less than one percent annually. Given the growth patterns of the County economy, it is recommended that the higher of the two, the Ten-year Growth Rate Forecast, be used as the preferred aircraft operations forecast. This forecast is supported by growth in the County and national economies, and by growth in operations by
aircraft classes (light sport, experimental, and jet) that are already based and itinerant users of the Airport. The preferred operations forecast is shown in Table 3.16.FAA Standard Operating Procedure 2.0 requires operations forecasts to distinguish between operations performed under instrument flight rules (IFR) and visual flight rules (VFR). TFMSC data reports aircraft that filed flight plans, but does not distinguish whether these were IFR or VFR flight plans. Given than S40 has no instrument approach or departure procedures, it is assumed that 100 percent of operations are performed under VFR. If S40 gets an instrument procedure, then the mix of IFR and VFR will need to be revisited.
TABLE 3.16 PREFERRED AIRCRAFT OPERATIONS FORECAST
YEAR OPERATIONS (ITINERANT)
OPERATIONS (LOCAL)
OPERATIONS (TOTAL)
2015 7,700 5,500 13,2002020 8,000 5,800 13,8002025 8,200 6,100 14,3002030 8,500 6,300 14,8002035 8,800 6,700 15,500
Growth Rate 0.7% 1.0% 0.8%

AIRPORT MASTER PLAN UPDATE 3-21
PROSSER AIRPORT - S40C
hapter 1 Introduction
Chapter 2
Existing Conditions
Chapter 3
Aviation Activity
Forecasts
Chapter 4
Facility Requirem
entsC
hapter 5 Alternatives Analysis
Chapter 6
Phased Developm
ent and C
ost Estimates
Chapter 7
Airport Layout Plan and D
rawings
FIGURE 3-5 S40 AIRCRAFT OPERATIONS FORECASTS
Forecast 2010 2015 2020 2025 2030 2035 2015-2035
Historical 13,200 13,200 Growth Rate
GR - 5 13,200 13,200 13,200 13,200 0.0%
FAA TAF 13,200 13,200 13,200 13,200 0.0%
FAA Aero 13,400 13,800 14,100 14,400 0.4%
GR - 10 13,800 14,300 14,800 15,500 0.8%
Employment 14,600 15,900 17,500 19,100 1.9%
GDP 15,000 16,700 18,500 19,800 2.0%
Earnings 15,300 17,700 20,400 23,500 2.9%
GRP 15,300 17,700 20,400 23,700 3.0%
Source:

AIRPORT MASTER PLAN UPDATE 3-22
PROSSER AIRPORT - S40C
hapter 1 Introduction
Chapter 2
Existing Conditions
Chapter 3
Aviation Activity
Forecasts
Chapter 4
Facility Requirem
entsC
hapter 5 Alternatives Analysis
Chapter 6
Phased Developm
ent and C
ost Estimates
Chapter 7
Airport Layout Plan and D
rawings
3.6 CRITICAL AIRCRAFT
The critical aircraft defines the design standards of the airport, and is based on the most demanding aircraft to exceed the FAA “substantial use threshold” of over 500 operations per year. Data comes from TAF operations totals adjusted using TFMSC records. As stated in Section 3.1, TFMSC records are likely to be counts for A-II and B-II aircraft, and samples for A-I and B-I aircraft. Operations counts are extrapolated using the following methodology, and based on the total annual count of 7,700, which is backed up by FBO counts described in Table 3.4. Design group II is presented first because it is expected that these larger aircraft are more likely to file a flight plan than the smaller design group I aircraft.
3.6.1 DESIGN GROUP II
• A-II: The mean number of annual A-II aircraft in the same was 17 a year, and the standard error was 2. Conventional statistics suggests that 99 percent of samples are found within three standard errors of the mean, which suggests indicates 26 annual B-II operations. TFMSC records show a high of 28 A-II operations, which means that the projection of 136 is reasonable.
• B-II: The mean number of annual B-II aircraft was 83 per year, and the standard error was 18. Conventional statistics suggests that 99 percent of samples are found within three standard errors of the mean, which suggests indicates 136 annual B-II operations. TFMSC records show a high of 198 B-II operations in 2012, which means that the projection of 26 operations is reasonable.
• Design Group I: The remaining operations are split between A-I and B-I aircraft, based on the upper bounds of the 95 percent confidence interval. The ratio between the two shows 4.64 operations by A-I aircraft for each operation of a B-I aircraft. This ratio is used to calculate the itinerant operations for each type.
• A-I: The ratio analysis shows 6,200 itinerant operations by A-I aircraft. Statistical analysis of the upper bound at the 95 percent confidence level, when extrapolated to match itinerant operations totals, shows the upper bound of 6,331 operations. This suggests that 6,200 is reasonable.
• B-I: The ratio analysis shows 1,338 itinerant operations by B-I aircraft. Statistical analysis of the upper bound at the 95 percent confidence level, when extrapolated to match itinerant operations totals, shows the upper bound of 1,366 operations. This suggests that 1,338 is reasonable.
Operations data by aircraft reference code are presented in Table 3.17.TFMSC data is captures itinerant traffic - aircraft that file flight plans – and not local traffic. Local traffic is primarily GA operators performing touch as goes for flight training and recreational purposes. It is not cost effective to fly touch and goes in a business jet because of crew cost, fuel cost, and wear and tear on the airframe. Flight crews of larger aircraft typically use simulators to practice. Interviews with airport management and tenants further suggest that local operations at S40 are primarily performed by smaller aircraft in Design Group I, and occasionally by aircraft in Design Group II. As stated in Section 3.1, 55 of the based aircraft have an ARC of A-I, and one has an ARC of B-I.A breakout of local operations by aircraft reference code is included in Table 3.18.2015 operations estimates in Table 3.17 and Table 3.18 show that the existing airport reference code is B-I with an estimated 1,750 annual operations. Example B-I aircraft that have used S40 during the past ten years include the Cessna 414, Cessna 210, and Cessna 206. Using 2035 operations forecasts and the same percentages, the future critical aircraft remains B-I throughout the forecast period. Forecast operations estimates by aircraft reference code are presented in Table 3.19.
TABLE 3.17 2015 ITINERANT OPERATIONS BY AIRCRAFT REFERENCE CODE
DESIGN GROUP
APPROACH CATEGORYTOTAL
A BI 6,200 81% 1,338 17% 7,538 98%II 26 0% 136 2% 162 2%
TOTAL (%) 6,226 81% 1,474 19% 7,700 100%Design Group and Approach Category defined on Page 3-1Counts exclude 378 operations recorded in TFMSC data for aircraft classified as “unknown” or “other.” Total operations count based on FAA TAF.

AIRPORT MASTER PLAN UPDATE 3-23
PROSSER AIRPORT - S40C
hapter 1 Introduction
Chapter 2
Existing Conditions
Chapter 3
Aviation Activity
Forecasts
Chapter 4
Facility Requirem
entsC
hapter 5 Alternatives Analysis
Chapter 6
Phased Developm
ent and C
ost Estimates
Chapter 7
Airport Layout Plan and D
rawings
TABLE 3.18 2015 LOCAL OPERATIONS BY AIRCRAFT REFERENCE CODE
DESIGN
GROUP
APPROACH CATEGORY TOTALA B
I 4,950 90% 412 7% 5,362 97%II 28 1% 110 2% 138 3%TOTAL (%) 4,978 91% 522 9% 5,500 100%Source: Consultant Team Design Group and Approach Category defined on Page 3.1 Total operations count based on FAA TAF.
TABLE 3.19 2035 OPERATIONS COUNTS BY AIRCRAFT REFERENCE CODE
DESIGN GROUP
APPROACH CATEGORY TOTAL
A BI 13,100 2,002 15,102II 64 334 398
TOTAL 13,164 2,336 15,500Source: Consultant Team Design Group and Approach Category defined on Page 3.1
3.7 CHAPTER SUMMARY
The ability to forecast for future activity at S40 is somewhat limited by the availability of historical data. What is known is that the economy of Benton County is growing and new industries ( f o r example, vineyards and wine production) are adding diversity to the area surrounding the Airport. As shown in Table 3.5, the local GRP has been growing at a similar rate to the national economy over the past ten years and it is expected that continued growth will support growth in aviation activity. A summary of the forecasts is presented below in Table 3.20.
The current and future design/critical aircraft is typified by the Cessna 206 Skywagon, 414 Chancellor and 210 Centurion, all Group I aircraft with activity counts identified in Tables 3.9.The based aircraft forecast is within five percent of the TAF in 2020 and 13 percent of the TAF in 2030. The operations forecast is within five percent of the TAF in 2020 and eight percent of the TAF in 2025. TAF comparison worksheets are shown in Figure 3-6 and Figure 3-7.
TABLE 3.20 AVIATION ACTIVITY FORECAST SUMMARY
YearBased Aircraft Operations
Single Engine
Turbo Prop Helicopter Total Itinerant Local Total
2015 56 0 0 56 7,700 5,500 13,2002020 59 1 2 62 8,000 5,800 13,8002025 63 1 2 66 8,200 6,100 14,3002030 66 1 2 69 8,500 6,300 14,8002035 70 1 2 73 8,800 6,700 15,500Growth Rate 1.1% N/A N/A 1.3% 0.7% 1.0% 0.8%

AIRPORT MASTER PLAN UPDATE 3-24
PROSSER AIRPORT - S40C
hapter 1 Introduction
Chapter 2
Existing Conditions
Chapter 3
Aviation Activity
Forecasts
Chapter 4
Facility Requirem
entsC
hapter 5 Alternatives Analysis
Chapter 6
Phased Developm
ent and C
ost Estimates
Chapter 7
Airport Layout Plan and D
rawings
FIGURE 3-6 COMPARISON OF AIRPORT PLANNING AND TAF FORECASTS
YEARAIRPORT
FORECAST FAFAF/TAF
(% DIFFERENCE)
Passenger Enplanements
Base Year 2015 0 0 N/A
Base Year +5 yrs 2020 0 0 N/A
Base Year + 10 yrs 2025 0 0 N/A
Base Year + 15 yrs 2030 0 0 N/A
Commercial Operations
Base Year 2015 0 0 N/A
Base Year +5 yrs 2020 0 0 N/A
Base Year + 10 yrs 2025 0 0 N/A
Base Year + 15 yrs 2030 0 0 N/A
Total Operations
Base Year 2015 13,200 13,200 0.0%
Base Year +5 yrs 2020 13,800 13,200 4.5%
Base Year + 10 yrs 2025 14,300 13,200 8.3%
Base Year + 15 yrs 2030 14,800 13,200 12.1%
NOTES: TAF data is on a U.S. Government fiscal year basis (October through September). AF/TAF (% difference ) column has embedded formulas.
Source:

PROSSER AIRPORT - S40
AIRPORT MASTER PLAN UPDATE 3-25
Chapter 1
IntroductionC
hapter 2 Existing C
onditionsC
hapter 3 Aviation A
ctivity Forecasts
Chapter 4
Facility Requirem
entsC
hapter 5 Alternatives Analysis
Chapter 6
Phased Developm
ent and C
ost Estimates
Chapter 7
Airport Layout Plan and D
rawings
FIGURE 3-7 COMPARISON OF AIRPORT PLANNING AND TAF FORECASTS
Source:

AIRPORT MASTER PLAN UPDATE 4-1
PROSSER AIRPORT - S40C
hapter 1 Introduction
Chapter 2
Existing Conditions
Chapter 3
Aviation Activity Forecasts
Chapter 4
Facility Requirem
entsC
hapter 5 Alternatives Analysis
Chapter 6
Phased Developm
ent and C
ost Estimates
Chapter 7
Airport Layout Plan and D
rawings
4.0 INTRODUCTION
Given that future aviation activity levels are determined, the ability of existing facilities to satisfy this demand is evaluated herein. Deficiencies determine airport needs throughout the 20-year planning period. This chapter examines impacts to the airport due to the forecasts of aviation demand, focusing on four distinct elements:
• Airport Role and Service Level• Airside Requirements • Landside Requirements
Any inadequacies in the ability to serve existing and future demand are highlighted, and recommendations are made regarding physical improvements or administrative modifications that might need to be corrected.
4.1 AIRPORT ROLE AND SERVICE LEVEL
The Prosser Airport is currently classified in the FAA’s National Plan of Integrated Airport Systems (NPIAS) and functions as a general aviation facility within the nation’s system of airports. The Prosser Airport is currently classified in the State of Washington’s State Long-Term Air Transportation Study (LATS) as a community service airport within the state system of airports. No change in role over the 20-year planning period is expected or planned by either.For purposes of this narrative, a community service general aviation airport accommodates mostly small and large aircraft with approach speeds limited to 121 knots or A and B category speeds. As described in the previous chapter, the Prosser Airport is not currently accommodating, nor is expected to accommodate the threshold number of aircraft operations (500) which exceed these speed thresholds.
4.1.1 DESIGN STANDARDS FAA guidance notes that the most demanding aircraft or group of aircraft with similar characteristics that use the airport on a regular basis, conducting at least 500 annual takeoffs and landings, is termed the critical/design aircraft. This aircraft/group determines design standards such as runway width, pavement strength and runway to taxiway separation criteria. Previous chapters of this narrative established that the airport should be designed to comply with B-I (Small) standards at minimum.The critical/design aircraft within the short (0-5 years hence), intermediate (5-10 years hence), and long-term (10-20 years hence) development periods are characterized by the various aircraft which have:
• Approach speeds not exceeding 121 knots, or up to Category B aircraft;
• Wingspans not exceeding 49 feet, or up to Group I;
• Maximum certificated weights not exceeding 16,000 pounds (large aircraft); and,
• Undercarriage design within TDG-1a limits.The types of aircraft in this classification, and those that visit the Prosser Airport include single-engine personal, business, and recreational aircraft such as Beechcraft, Cessna, and Cirrus Models, along with most helicopters and ultralight and light-sport aircraft. Note that not all parts of the field require design based upon this aircraft grouping. For example, T-hangar design and construction for smaller general aviation aircraft could be made for smaller (or larger) aircraft wingspans, given that many T-hangar doors are narrower (or wider) than 49 feet.In summary, the following design standards are anticipated for these portions of the field within the 20-years planning horizon:
• Runway 8-26: B-I, Up to 16,000 pounds pavement strength;
• Taxiway A/Connectors: B-I, TDG-1a, Up to 16,000 pounds pavement strength;
• Portions of Main Apron: B-I, TDG-2, Up to 16,000 pounds pavement strength; and
• Other Portions of Apron, Taxiways, and Taxilanes: maintain B-II separation where pavement is already constructed at this separation, TDG-2, Up to 30,000-pound pavement strength.
4.1.2 ULTIMATE DESIGN STANDARDS The previous chapter makes clear the current and forecast fleet mix support B-I (small) airport design standards as opposed to the more demanding B-II design standards.
• Nevertheless, some long term reasons exist to protect the field for some B-II standards in
• Approach speeds not exceeding 121 knots, or up to Category B aircraft;
• Wingspans not exceeding 79 feet, or up to Group II;
• Maximum certificated weights not exceeding 16,000 pounds (large aircraft); and,
• Undercarriage design within TDG2 limits.The types of aircraft in this classification include twin
CHAPTER 4 - FACILITY REQUIREMENTS

AIRPORT MASTER PLAN UPDATE 4-2
PROSSER AIRPORT - S40C
hapter 1 Introduction
Chapter 2
Existing Conditions
Chapter 3
Aviation Activity Forecasts
Chapter 4
Facility Requirem
entsC
hapter 5 Alternatives Analysis
Chapter 6
Phased Developm
ent and C
ost Estimates
Chapter 7
Airport Layout Plan and D
rawings
and single-engine personal, business, and recreational aircraft such as Beechcraft and Cessna models turbo-prop and jet types. Upcoming portions of this chapter and tabulations within B-II standards are Ultimate. It must be clear that airfield improvements for these more demanding standards are not justified by the current fleet mix identified in the Forecast of Aviation Demand and are not strictly eligible for federal grant-in-aid, with the possible exception of the runway-to-taxiway centerline separation standard. This subject will be explored in more detail in the next chapter.
4.2 AIRSIDE RECOMMENDATIONS
A review of the airfield requirements generated from the previous chapter here includes an analysis of wind data, instrument approach capability, navigable airspace, runway, taxiway and apron dimensions, pavement strengths and airfield design standards. Landing and navigational aids are also discussed. Further analysis of alternatives to address these airfield requirements will be addressed in the next chapter in the context of alternatives.
4.2.1 WIND ANALYSISFAA details the objectives of a wind analysis noting that the desirable wind coverage is 95 percent. That is, a runway, or runways, at a given alignment(s) should have a crosswind component less than a given threshold 95 percent of the time to meet FAA standards.The inventory portion of this narrative has a wind record created from the closest location with a 10-year wind record (Tri-Cities Airport). Three wind roses were created as applicable to the runway at the Prosser Airport:
• All-Weather (all cloud ceiling heights and all visibilities),
• VFR (occurrence of cloud ceiling heights greater than 1,000 feet above ground level and visibilities greater than three statute miles visibility), and
• IFR (occurrence of cloud ceiling heights less than 1,000 feet but greater than 200 feet above ground level and visibilities less than three statute miles but greater than one-half mile).
As previously noted, it is suspected that the current wind data is incomplete and more information is needed to evaluate the current runway alignment. Ten years of wind data pulled from the Tri-Cities Airport (PSC) yields:
• All-Weather: 10.5 knots (92.89 percent)Using wind data from Tri-Cities Airport is not sufficient
for determining wind coverage at Prosser due to the huge ridgelines separating the two airports. Although 10 years’ worth of wind record was not available on-field, a 36-month inventory was analyzed from the Prosser non-FAA funded AWOS with analysis to determine any inadequate crosswind component for the three sky conditions. The below wind condition is noted:
• All-Weather: 10.5 knots (94.05 percent)Without more data, it is recommended to continue to gather more wind data (minimum 10 years) using the AWOS on site and undertake a wind study in the future.
4.2.2 INSTRUMENT APPROACH CAPABILITYInstrument approach capability is defined based upon the ability of the airport’s navigational equipment and/or GPS technology to safely accommodate aircraft operations during periods of inclement weather. FAA categorizes three types of instrument approach capability: precision, non-precision and visual. A runway end with precision instrument approach capability is equipped with either ground-based navigational equipment or satellite-based technology that provides vertical and horizontal guidance to a runway end. A runway end with non-precision instrument approach capability is equipped with either ground-based navigational equipment or satellite-based technology that provides only horizontal guidance to a runway end. Horizontal guidance allows the aircraft to be piloted in poorer weather conditions, and horizontal and vertical guidance allows the aircraft to be piloted in poorer conditions still. A runway end with visual instrument approach capability is equipped with no navigation technology and requires relatively clear weather for aircraft operation. The Prosser Airport currently has no instrument approach capability.
ILS-Based NavigationThe traditional equipment that provides precision instrument approach capability is an Instrument Landing System (ILS). This system generally consists of a glideslope, a localizer, along with an approach lighting system. The glideslope emits a radio signal which allows an aircraft to follow a pre-specified vertical path to a runway end, and a localizer emits a radio signal that allows an aircraft to follow a specific horizontal path to a runway end, as visualized in Figure 4-1. An approach lighting system allows close-in visual guidance for day and night. An ILS can provide the precision instrument approach capability necessary for safe aircraft operation during periods of inclement weather. Weather, in this regard, comes in two measures, (1) local visibility in statute miles and (2) substantial height
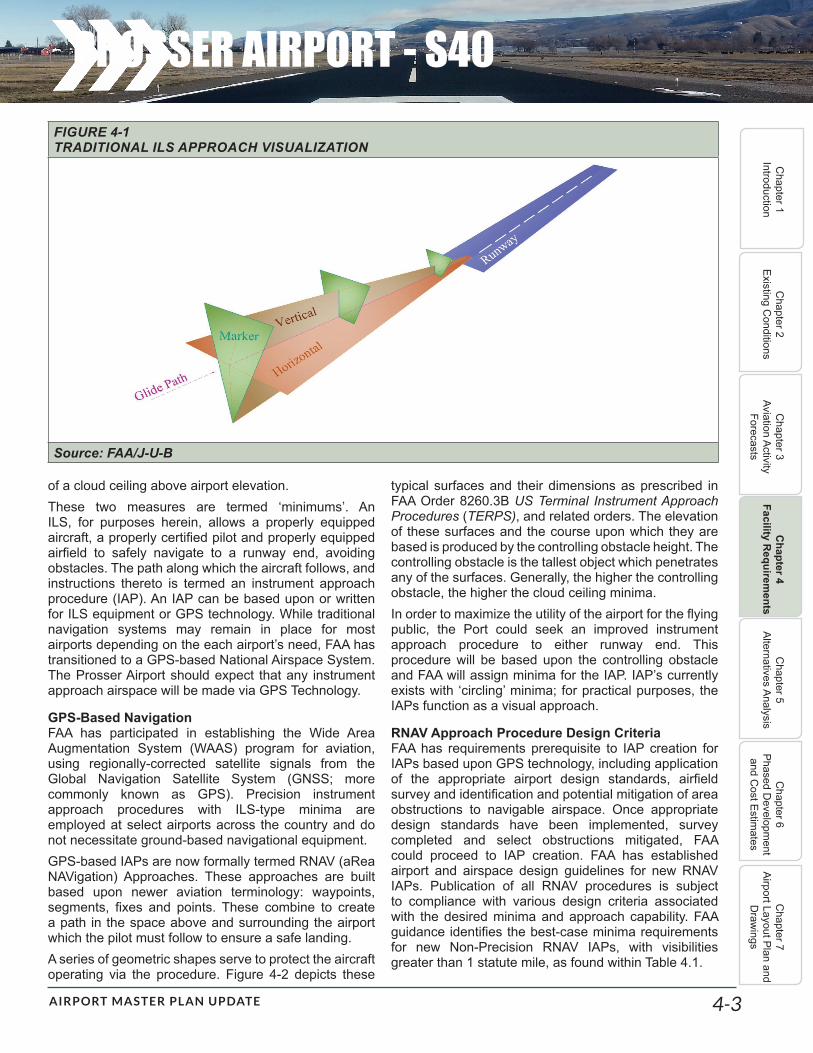
AIRPORT MASTER PLAN UPDATE 4-3
PROSSER AIRPORT - S40C
hapter 1 Introduction
Chapter 2
Existing Conditions
Chapter 3
Aviation Activity Forecasts
Chapter 4
Facility Requirem
entsC
hapter 5 Alternatives Analysis
Chapter 6
Phased Developm
ent and C
ost Estimates
Chapter 7
Airport Layout Plan and D
rawings
of a cloud ceiling above airport elevation. These two measures are termed ‘minimums’. An ILS, for purposes herein, allows a properly equipped aircraft, a properly certified pilot and properly equipped airfield to safely navigate to a runway end, avoiding obstacles. The path along which the aircraft follows, and instructions thereto is termed an instrument approach procedure (IAP). An IAP can be based upon or written for ILS equipment or GPS technology. While traditional navigation systems may remain in place for most airports depending on the each airport’s need, FAA has transitioned to a GPS-based National Airspace System. The Prosser Airport should expect that any instrument approach airspace will be made via GPS Technology.
GPS-Based NavigationFAA has participated in establishing the Wide Area Augmentation System (WAAS) program for aviation, using regionally-corrected satellite signals from the Global Navigation Satellite System (GNSS; more commonly known as GPS). Precision instrument approach procedures with ILS-type minima are employed at select airports across the country and do not necessitate ground-based navigational equipment. GPS-based IAPs are now formally termed RNAV (aRea NAVigation) Approaches. These approaches are built based upon newer aviation terminology: waypoints, segments, fixes and points. These combine to create a path in the space above and surrounding the airport which the pilot must follow to ensure a safe landing. A series of geometric shapes serve to protect the aircraft operating via the procedure. Figure 4-2 depicts these
typical surfaces and their dimensions as prescribed in FAA Order 8260.3B US Terminal Instrument Approach Procedures (TERPS), and related orders. The elevation of these surfaces and the course upon which they are based is produced by the controlling obstacle height. The controlling obstacle is the tallest object which penetrates any of the surfaces. Generally, the higher the controlling obstacle, the higher the cloud ceiling minima. In order to maximize the utility of the airport for the flying public, the Port could seek an improved instrument approach procedure to either runway end. This procedure will be based upon the controlling obstacle and FAA will assign minima for the IAP. IAP’s currently exists with ‘circling’ minima; for practical purposes, the IAPs function as a visual approach.
RNAV Approach Procedure Design CriteriaFAA has requirements prerequisite to IAP creation for IAPs based upon GPS technology, including application of the appropriate airport design standards, airfield survey and identification and potential mitigation of area obstructions to navigable airspace. Once appropriate design standards have been implemented, survey completed and select obstructions mitigated, FAA could proceed to IAP creation. FAA has established airport and airspace design guidelines for new RNAV IAPs. Publication of all RNAV procedures is subject to compliance with various design criteria associated with the desired minima and approach capability. FAA guidance identifies the best-case minima requirements for new Non-Precision RNAV IAPs, with visibilities greater than 1 statute mile, as found within Table 4.1.
FIGURE 4-1 TRADITIONAL ILS APPROACH VISUALIZATION
Source: FAA/J-U-B

AIRPORT MASTER PLAN UPDATE 4-4
PROSSER AIRPORT - S40C
hapter 1 Introduction
Chapter 2
Existing Conditions
Chapter 3
Aviation Activity Forecasts
Chapter 4
Facility Requirem
entsC
hapter 5 Alternatives Analysis
Chapter 6
Phased Developm
ent and C
ost Estimates
Chapter 7
Airport Layout Plan and D
rawings
TABLE 4.1 RNAV INSTRUMENT APPROACH PROCEDURE FOR ≥1 STATUTE MILE NON-PRECISION, STRAIGHT-IN
Standard/Specification Current RequirementsHeight Above Touchdown (HAT) ≥250 Feet ≥250 FeetTERPS GQS/Visual Surfaces Clear/Night Lighted Clear/Night LightedAirport Layout PlanIn-Process ApprovedMinimum Runway Length 3,451 Feet 3,200 FeetRunway Markings Visual Non-Precision
Holdlines/Signage from Runway Centerline 150’ 200’Runway Edge Lighting Medium Intensity Medium IntensityParallel Taxiway Full-Parallel RecommendedApproach Lighting None RecommendedAirfield Design Standards ≥3/4 Mile ≥3/4 MileThreshold Siting Criteria (Table 3-2 in Airport Design AC 150/5300)
20:1 Clear, Row 1-2 20:1 Clear, Rows 1-4
Approach Survey In-Process CompletedSource: FAA/J-U-B
FIGURE 4-2 GPS APPROACH VISUALIZATION
Source: FAA/J-U-B
AIRPORT MASTER PLAN UPDATE 4-5
PROSSER AIRPORT - S40C
hapter 1 Introduction
Chapter 2
Existing Conditions
Chapter 3
Aviation Activity Forecasts
Chapter 4
Facility Requirem
entsC
hapter 5 Alternatives Analysis
Chapter 6
Phased Developm
ent and C
ost Estimates
Chapter 7
Airport Layout Plan and D
rawings
Description of each of the items found in the table follows:
• Height Above Touchdown (HAT) is a calculation that is generally made to consider the desired cloud ceiling minima. HAT is the height of the Minimum Descent Altitude (MDA) above the highest elevation within the runway end environment. Minimum Descent Altitude is an altitude prescribed by an approach procedure below which a pilot should not descend unless able to visualize the airfield environment during inclement weather on a given glide path. Generally, a glide path angle greater than three percent will increase the HAT and the cloud ceiling minimum established for a given approach.
• Although a complete analysis of TERPS surfaces for future or ultimate airfield configurations is beyond the scope of this planning, FAA has identified specific guidance for inclusion into FAA AC 150/5300-13A, Airport Design. Guidance therein relates to glideslope and visual 20:1 surfaces. These surfaces emanate from the end of each runway and protect its final approach.
• The Airport Layout Plan should show design standards compliance for the desired instrument approach procedures and be approved.
• Runways ends should be marked non-precision with aiming points. Non-precision runway pavement markings include the runway designation, centerline, threshold marking and aiming point.
• Connector taxiways should have holdlines and airfield signage located a minimum of 200 feet from runway centerline. Medium-intensity runway lighting is recommended to accompany the runway, along with a full-parallel taxiway.
• Compliance with ≥¾-mile design standards should be maintained (select standards are identified in the upcoming Table 4.2).
• FAA guidance prescribes vertical and/or non-vertical survey instructions for airfield and obstacle location based upon TERPS airspace surfaces and potential obstructions for a proposed approach procedure.
An IAP with improved minima is desirable and will be explored in a larger alternatives context in the upcoming chapter. An improved IAP to either or both runway ends more clearly indicates to aviation businesses and the flying public that the Prosser Airport is ready to accommodate business and the aviation user in a more all-weather environment, thereby making the Prosser Airport more reliable and open for business during
periods of inclement weather.
4.2.3 RUNWAY LENGTHRunway length requirements can be determined based on guidance in FAA Advisory Circular 150/5325-4B; and, for projects receiving federal funding, use of the advisory circular is mandatory. Per the advisory circular, the recommended runway length is a function of airport elevation (noted in feet above mean sea level), mean maximum temperature of the hottest month, (degrees Fahrenheit), aircraft weight (in pounds, maximum certificated takeoff weight), number of passenger seats, aircraft engine performance, wet/dry condition of the runway and the maximum difference in runway elevation on centerline. The required runway length for Runway 8-26, calculated using FAA’s guidance was determined through the steps identified below. The existing and future critical aircraft, typified by the Cessna 206 and Cessna 414 were approved by the FAA in the Forecasts of Aviation Demand. Following Advisory Circular 150/5325-4B, the recommended runway length using the critical design airplane/airplane family is as follows: Step #1: Records of instrument aircraft operations by type from September 2014 to September 2015 reveal several types that frequent the airport:
• Beechcraft KingAir 90A/200• Cessna Citation Encore• Pilatus PC-12• Cessna 414, 340• Cessna 206, 201• Cirrus SR-20
Note these aircraft are all small (less than or equal to 12,500 maximum gross certificated weight). Step #2: Of those above, the aircraft that requires the longest take-off run is the Beechcraft King Air 90A with a maximum gross certificated take-off weight of 10,100 pounds with less than 10 passenger seats. Step #3: Based upon this information, FAA guidance specifies use of the performance chart found as Figure 2-1 within Advisory Circular 150-5324-4B for Small Aircraft with Fewer than 10 Passenger Seats, recreated as Figure 4-3 below.Step #4: The final step to determine the required runway length is to follow the green line to arrive at a runway length as identified on the right hand side of Figure 4-3. The mean maximum temperature of the hottest month in Prosser, WA, as reported by the Western Regional Climate Center (WRCC), is 88.5° Fahrenheit. This is the beginning point on the bottom of the chart within

AIRPORT MASTER PLAN UPDATE 4-6
PROSSER AIRPORT - S40C
hapter 1 Introduction
Chapter 2
Existing Conditions
Chapter 3
Aviation Activity Forecasts
Chapter 4
Facility Requirem
entsC
hapter 5 Alternatives Analysis
Chapter 6
Phased Developm
ent and C
ost Estimates
Chapter 7
Airport Layout Plan and D
rawings
Figure 4-3 on the left side. From there the line rises to meet the airport elevation (705 feet) curve, then to the right to arrive at the runway length. The green line is the visualization. The recommended runway length based on the existing and future critical aircraft at the Prosser Airport is approximately 3,250 feet at the 95 percent of the small fleet value. The Airport’s current runway length is 3,451 feet. Ideally, sponsors would be able to accommodate all of the recommended runway length for the design airplane that meets the regular use definition. Yet, runway length also is dependent on the availability of land, funds and environmental concerns which will be looked at in the alternatives chapter. Anecdotally, a 4,000-foot runway length may be a minimum threshold for some business aircraft operators due to insurance requirements. While this requirement has not been verified, the Prosser Airport Management has received inquiries and operations have been turned away as a consequence of inadequate runway length for that specific aircraft. It is up to the pilot’s discretion whether he/she chooses to land on a runway.
4.2.4 RUNWAY DESIGN STANDARDSSelect airfield design standards (Not lower than 1 mile for the Airport) are noted in Table 4.2. The Forecasts of Aviation Demand indicate solid B-I (small) aircraft operational activity at the Prosser Airport now and throughout the forecasted planning periods (since B-I activity exceeds FAA guidelines of 500 annual itinerant and local operations). The “Existing” column describes the conditions that exist at the airport today. It is worth noting that these standards are generally intended as minimum; that is, it is permissible to exceed a given standard width or dimension; however, not all may be eligible for grant-in-aid funding. The pavements aligned with the eastern runway end, currently marked as blast pad may remain, but should be marked in current compliance and are ineligible for grant-in-aid funding. These former runway pavements were abandoned as usable landing area in 2010 when the Runway 26 RPZ was brought within the airport property envelope for standards and obstruction disposition purposes. In order to aid day and night visual and potential non-precision operation a Visual Glideslope Indicating System (VGSI), two-light Precision Approach Path Indicator (PAPIs) should be maintained for the future. A 2-unit PAPI is installed to guide pilots on an westerly
FIGURE 4-3 REQUIRED RUNWAY 8-26 LENGTH (CHART VISUALIZATION)
Source: FAA/J-U-B
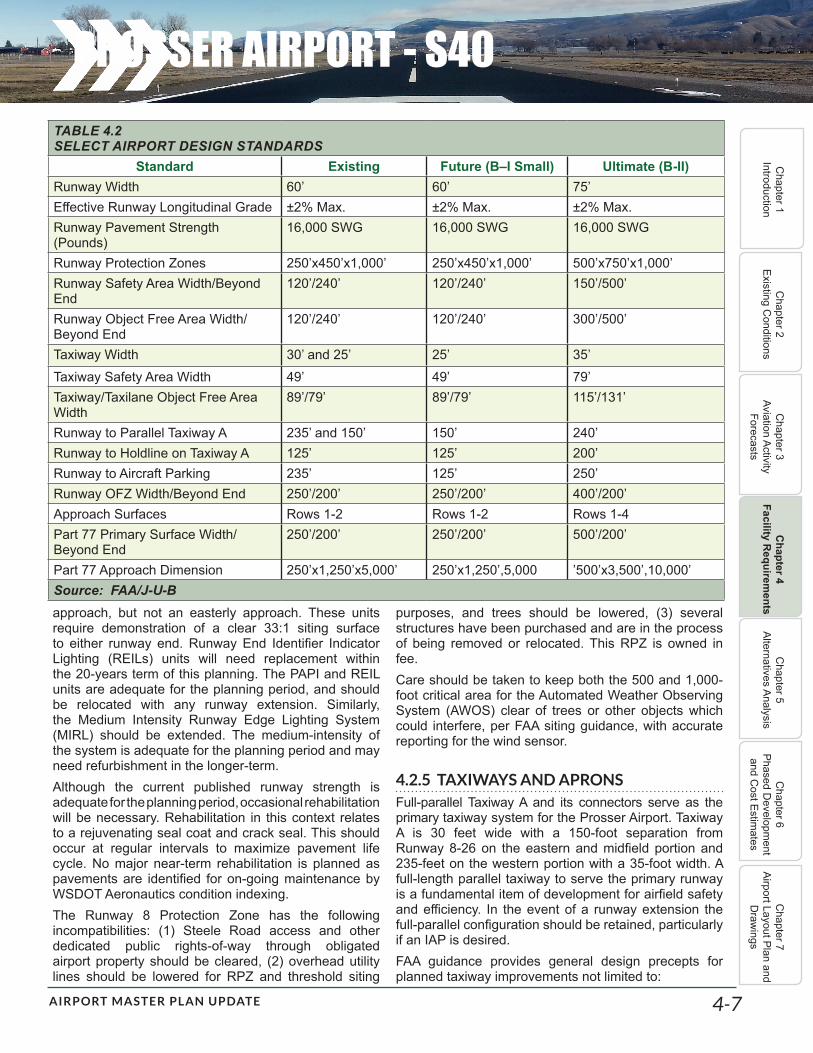
AIRPORT MASTER PLAN UPDATE 4-7
PROSSER AIRPORT - S40C
hapter 1 Introduction
Chapter 2
Existing Conditions
Chapter 3
Aviation Activity Forecasts
Chapter 4
Facility Requirem
entsC
hapter 5 Alternatives Analysis
Chapter 6
Phased Developm
ent and C
ost Estimates
Chapter 7
Airport Layout Plan and D
rawings
approach, but not an easterly approach. These units require demonstration of a clear 33:1 siting surface to either runway end. Runway End Identifier Indicator Lighting (REILs) units will need replacement within the 20-years term of this planning. The PAPI and REIL units are adequate for the planning period, and should be relocated with any runway extension. Similarly, the Medium Intensity Runway Edge Lighting System (MIRL) should be extended. The medium-intensity of the system is adequate for the planning period and may need refurbishment in the longer-term. Although the current published runway strength is adequate for the planning period, occasional rehabilitation will be necessary. Rehabilitation in this context relates to a rejuvenating seal coat and crack seal. This should occur at regular intervals to maximize pavement life cycle. No major near-term rehabilitation is planned as pavements are identified for on-going maintenance by WSDOT Aeronautics condition indexing.The Runway 8 Protection Zone has the following incompatibilities: (1) Steele Road access and other dedicated public rights-of-way through obligated airport property should be cleared, (2) overhead utility lines should be lowered for RPZ and threshold siting
purposes, and trees should be lowered, (3) several structures have been purchased and are in the process of being removed or relocated. This RPZ is owned in fee.Care should be taken to keep both the 500 and 1,000-foot critical area for the Automated Weather Observing System (AWOS) clear of trees or other objects which could interfere, per FAA siting guidance, with accurate reporting for the wind sensor.
4.2.5 TAXIWAYS AND APRONSFull-parallel Taxiway A and its connectors serve as the primary taxiway system for the Prosser Airport. Taxiway A is 30 feet wide with a 150-foot separation from Runway 8-26 on the eastern and midfield portion and 235-feet on the western portion with a 35-foot width. A full-length parallel taxiway to serve the primary runway is a fundamental item of development for airfield safety and efficiency. In the event of a runway extension the full-parallel configuration should be retained, particularly if an IAP is desired. FAA guidance provides general design precepts for planned taxiway improvements not limited to:
TABLE 4.2 SELECT AIRPORT DESIGN STANDARDS
Standard Existing Future (B–I Small) Ultimate (B-II) Runway Width 60’ 60’ 75’Effective Runway Longitudinal Grade ±2% Max. ±2% Max. ±2% Max.Runway Pavement Strength (Pounds)
16,000 SWG 16,000 SWG 16,000 SWG
Runway Protection Zones 250’x450’x1,000’ 250’x450’x1,000’ 500’x750’x1,000’Runway Safety Area Width/Beyond End
120’/240’ 120’/240’ 150’/500’
Runway Object Free Area Width/Beyond End
120’/240’ 120’/240’ 300’/500’
Taxiway Width 30’ and 25’ 25’ 35’Taxiway Safety Area Width 49’ 49’ 79’Taxiway/Taxilane Object Free Area Width
89’/79’ 89’/79’ 115’/131’
Runway to Parallel Taxiway A 235’ and 150’ 150’ 240’Runway to Holdline on Taxiway A 125’ 125’ 200’Runway to Aircraft Parking 235’ 125’ 250’Runway OFZ Width/Beyond End 250’/200’ 250’/200’ 400’/200’Approach Surfaces Rows 1-2 Rows 1-2 Rows 1-4Part 77 Primary Surface Width/Beyond End
250’/200’ 250’/200’ 500’/200’
Part 77 Approach Dimension 250’x1,250’x5,000’ 250’x1,250’,5,000 ’500’x3,500’,10,000’Source: FAA/J-U-B
AIRPORT MASTER PLAN UPDATE 4-8
PROSSER AIRPORT - S40C
hapter 1 Introduction
Chapter 2
Existing Conditions
Chapter 3
Aviation Activity Forecasts
Chapter 4
Facility Requirem
entsC
hapter 5 Alternatives Analysis
Chapter 6
Phased Developm
ent and C
ost Estimates
Chapter 7
Airport Layout Plan and D
rawings
• Taxiways should be designed for cockpit-over-centerline taxiing, as opposed to the previously permitted judgemental oversteer.
• Taxiway intersection design should be made so that no steering angle exceeds 50 degrees.
• Taxiway intersection design should be such that no more than three turn options exist.
• Taxiway intersection angles should be at regular intervals.
• Taxiway design should be made to discourage runway incursions, increase pilot situational awareness, remove hot spots, limit runway crossings, increase pilot visibility and permit indirect access only to an apron or runway.
B-I airfield design standards compliance indicates that any future parallel or connecting taxiways should be 25 feet wide, with a minimum 16,000 pound single-wheel gear pavement strength. Any parallel taxiway centerline should be sited with a minimum separation from runway centerline of 150 feet in order to protect for future B-I (small) runway centerline to parallel taxiway centerline separation. Holdlines and signage now 125 feet or less perpendicular from runway centerline should remain. Table 4.2 notes the ultimate runway to parallel taxiway separation as 240 feet. Consideration will be given to this standard in the context of the upcoming alternatives analysis. All taxiways should be equipped with either edge reflectors or medium-intensity taxiway lighting.Taxiway A strength is adequate for the planning period, Periodic rehabilitation of the taxiway should be planned. Rehabilitation in this context relates to a rejuvenating seal coat and crack seal. This should occur at regular intervals to maximize pavement life cycle. No major near-term rehabilitation is planned as pavements are identified for on-going maintenance by WSDOT Aeronautics. Should Taxiway A require reconstruction in the future, but prior to justification for B-II operations, it is recommended that Taxiway A be relocated to B-II separation standards if practical. FAA-established thresholds of operational demand with respect to holding bays (30 operations per hour) are, per the Forecasts of Aviation Demand, not reached in the long-term of this planning. Hold bays are situated near the end of runways.Others taxiways are important to the current airfield configuration. FAA specifies that the taxiway to taxiway centerline distance should be no less than 70 feet. A reconfiguration of the midfield apron permits the opportunity to evaluate larger aircraft (and helicopter) parking area. The next chapter will consider this design in an alternatives context. The northside access taxiway will require a rejuvenating
seal coat and crack seal. This should occur at regular intervals to maximize pavement life cycle.
4.2.6 NAVIGABLE AIRSPACENavigable airspace for purposes herein relates to 14 CFR Part 77 surfaces. Select surfaces are described in the Inventory and within Table 4.2. While FAA does not have the statutory authority to regulate local landuse, airport sponsors like the Port must adhere to grant assurances, which include #20 Hazard Removal and Mitigation and #21 Compatible Land Use. Airport sponsors that have accepted Federal funds are obligated under Federal grant assurances to take appropriate action, to the extent reasonable, including the adoption of zoning laws, to restrict the use of land adjacent to or in the immediate vicinity of the airport to activities and purposes compatible with normal airport operations. WSDOT has promulgated advisory guidance to effect grant assurance compliance in this regard and Port, City and County code and comprehensive planning should continue to include language to that end. An obstruction to navigable airspace is any object which penetrates a surface meaningful to aircraft operations. Not all obstructions are consequential to maintenance of compatible land use. For example, an obstruction that is properly lit and marked in compliance with FAA guidance is not necessarily considered incompatible.A controlling obstacle and other obstructions to navigable airspace with proposed dispositions and other objects in the vicinity of the airport, for both the existing and future airfield are identified on the various drawings in upcoming chapters and appendices. Given that the community has grown, and will likely continue to grow around the Airport, compatible land use is, and will always be a concern. The Port currently specifies that permitting is required for development proponents on or near the airport. Future applications for changes in land use or other sensitive development activities around the airport should continue to be received by the Port, potential incompatibilities should be sited/moved to avoid airspace conflicts, and multi-jurisdictional coordination should occur per the WSDOT guidance. Washington State Code (RCW) specifies that a sponsor’s effort to protect compatible land use is appropriate, and should be considered within an overall comprehensive plan with assistance from WSDOT Aeronautics in the form of technical and general assistance and best practices handbook. WSDOT Aeronautics guidance focuses on height restriction, safety and noise mitigation to establish and maintain compatible land use in the airport vicinity.

AIRPORT MASTER PLAN UPDATE 4-9
PROSSER AIRPORT - S40C
hapter 1 Introduction
Chapter 2
Existing Conditions
Chapter 3
Aviation Activity Forecasts
Chapter 4
Facility Requirem
entsC
hapter 5 Alternatives Analysis
Chapter 6
Phased Developm
ent and C
ost Estimates
Chapter 7
Airport Layout Plan and D
rawings
4.2.7 AIRSPACE CAPACITYAirspace capacity for purposes herein relates to the ability of the airfield to accommodate the existing and forecast number of aviation operations. FAA guidance specifies three measures in this regard, Annual Service Volume (ASV), hourly Visual Flight Rule (VFR) and Instrument Flight Rule (IFR) capacities. The first, ASV, is the overall ability of the Airport to accommodate a modeled number of aviation operations. This value is 230,000 for the Prosser Airport in its current configuration. The VFR and IFR modeled values are 98 and 59 hourly aviation operations, respectively. FAA guidance as it applies to forecast the Prosser Airport operational activity suggests no improvements as a consequence of these capacity guidelines. Given the local role the Prosser Airport currently plays in the Washington and regional Tri-Cities system of airports, an air traffic control tower is not an improvement that FAA would likely recommend based upon its requisite cost-benefit analysis. Demonstration of a benefit as it relates to cost is a prerequisite for siting of a tower at the Prosser Airport. Thus, the Prosser Airport will remain an uncontrolled field. As a consequence, the current airspace classification, per previous chapters, is unlikely to change.
4.3 LANDSIDE RECOMMENDATIONS
Landside area requirements are generated based upon the Forecasts of Aviation Demand. These relate to apron/ramp aircraft parking and circulation area, terminal/FBO building and aircraft hangar area, aircraft fueling and fueling area, automobile access and parking area. Landside facilities are those portions of the airfield which are not directly related to the landing and take-off of aircraft, but support it.
4.3.1 BASED AIRCRAFT APRON AREABased aircraft apron area is and will continue to be beneficial. Based aircraft parking area is foremost for aircraft rental, transient aircraft and charter activity. Also, a given aircraft owner may likely choose to hangar their aircraft due to personal choice and weather. The Prosser Airport’s apron and aircraft parking area (including but not limited to based aircraft parking) approximates 34,155 square yards. This area currently accommodates 64 single-engine aircraft tie-downs. No multi-engine aircraft tie-downs are marked. No based jet or helicopter aircraft are to be accommodated given that they will likely be hangared, except one spot in reserve for the duration of the planning period. Table 4.3 shows recommendations for based aircraft
apron using an FAA guideline of 960 square yards per each single-engine, and 1,385 for each multi-engine aircraft. Additional based aircraft apron area is not required for the 20-year term of the planning.
4.3.2 ITINERANT AIRCRAFT APRON AREAArea recommendations for itinerant aircraft activity are estimated differently, as described below and as shown in Table 4.4. Predicated upon the long-term Forecasts of Aviation Demand, approximately 28 percent of aircraft are expected to be in larger aircraft category, corresponding to the 1,385 area standard, while 72 percent of aircraft are expected to be in small aircraft category, corresponding to the 960 square yard area standard. Note that the larger aircraft category includes multi-engine, jet and helicopter aircraft.A basis for itinerant apron area required can then be calculated: 72 percent (for smaller aircraft) times 960 square yards per smaller aircraft plus the quantity of 28 percent (for larger aircraft) times 1,385 square yards per larger aircraft is equal to 1,079 square yards per aircraft {(960 x 72%)+(1,385 x 28%)=1,079}. FAA guidance for estimating peaking activity originates via Airport Design. Peak day is defined as the average number of operations per day during the most active month. At the Prosser Airport, the most active month normally accounts for approximately 10 percent of total annual operations. The following is assumed for the calculations in Table 4.4 per FAA estimating guidelines: (1) Peak day itinerant activity constitutes 43 per cent of peak day operations, (2) half of these aircraft will require apron parking at some point during the peak day, and (3) approximately 75 percent of peak day transient aircraft are to be simultaneously accommodated. For example, the year 2015 calculation is as follows: 44 peak day operations times 43 percent (peak day itinerant operations) equals 19, divided by 2 (for those that require parking area) is equal to 9. The product of 9 and 75 percent (aircraft that are expected to be simultaneously accommodated) is equal to 7, and 7 times 1,079 square yards per aircraft is equal to 7,656 square yards. Note that only the final number in this calculation sequence is not rounded. Note that this calculated value does not include taxiway/taxilane clearance areas. The main apron approximates 23,000 square yards. Itinerant helicopter parking area is considered. The Forecasts of Aviation Demand identify a couple of based helicopters in the future and anticipate continuing itinerant operations. Helicopter or other rotorcraft are currently parked on small tideown multiple spaces.

AIRPORT MASTER PLAN UPDATE 4-10
PROSSER AIRPORT - S40C
hapter 1 Introduction
Chapter 2
Existing Conditions
Chapter 3
Aviation Activity Forecasts
Chapter 4
Facility Requirem
entsC
hapter 5 Alternatives Analysis
Chapter 6
Phased Developm
ent and C
ost Estimates
Chapter 7
Airport Layout Plan and D
rawings
TABLE 4.3 BASED AIRCRAFT APRON RECOMMENDATIONS
2015 2020 2025 2035 Current
Forecast Single-Engine Based Aircraft 56 59 63 70
Single-Engine Based Aircraft not Hangared 3 3 3 3Based Aircraft Apron (Single-Engine) (Sq. Yards)
2,688 2,832 3,024 3,360
Forecast Multi-Engine and Helicopter Aircraft 0 3 3 3Multi-Engine Based Aircraft and Helicopter not Hangared
0 1 1 1
Based Aircraft Apron (Multi-Engine/Helo) (Sq. Yards)
0 1,385 1,385 1,385
Total Based Aircraft Apron recommendations (Sq. Yards)
2,688 4,217 4,409 4,745 ±5,000
Source: FAA/J-U-B
TABLE 4.4 ITINERATE AIRCRAFT PARKING AREA RECOMMENDATIONS
2015 2020 2025 2035 CurrentPeak Day Operations 44 46 48 50
Peak Day Itinerant Operations 19 20 20 22
Itinerant Aircraft Positions Required 9 10 10 11
Simultaneous Itinerant Aircraft Positions Required 7 7 7 8Total Itinerant Parking Area Required (Square Yards)
7,656 8,003 8,239 8,699 ±16,500
Source: FAA/J-U-B
4.3.3 TERMINAL/FBO BUILDING AREAA basic general aviation terminal/FBO building should ideally provide office space, a waiting room for pilots and passengers, an area for food and beverage vending, a public telephone and restrooms. Building area recommendations are shown in Table 4.5. FAA does not have current advisory guidance for general aviation area recommendations by use or in total, yet generalized recommendations remains valuable if considered in the context of FBO perspective and overall airport lease area needs. Terminal/FBO area recommendations are a function of the anticipated number of peak hour operations and airport users. Peak hour operations are estimated at 15 percent of peak day operations from Table 4.4. Peak hour users are computed as 1.5 passengers per each local aircraft arrival and 2.5 passengers per itinerant arrival. The previous chapter identified a 42/58 percent mix of local/itinerant activity. Typical floor space requirements,
expressed in square feet per user are as follows for general aviation terminal facilities: Waiting Lounge; 15, Office Space; 3, Public Conveniences; 1.5, Concession/Vending; 5, Storage, Circulation, HVAC; 24.5. The Prosser Airport does have a formal, dedicated terminal building and space in this regard is collocated with FBO leased area. FAA very rarely provides funding for terminal-related improvements at local general aviation airports like Prosser. While the Prosser Airport’s 3,850 square foot FBO/terminal area may be adequate for purposes herein, refurbishment could be considered in the intermediate-term as the current facility is at or very near the end of its useful life. Complicating this matter is the fact that the current terminal building faces an apron, which because of standards is now only usable for taxi. More specifically, aircraft tail height clearance of the 7:1 transitional surface requires closure of the entire apron for aircraft parking purposes. A closer look at this circumstance follows in the next chapter.

AIRPORT MASTER PLAN UPDATE 4-11
PROSSER AIRPORT - S40C
hapter 1 Introduction
Chapter 2
Existing Conditions
Chapter 3
Aviation Activity Forecasts
Chapter 4
Facility Requirem
entsC
hapter 5 Alternatives Analysis
Chapter 6
Phased Developm
ent and C
ost Estimates
Chapter 7
Airport Layout Plan and D
rawings
4.3.4 AIRCRAFT HANGAR AREAThe Prosser Airport currently accommodates 6 leased and 9 privately-owned hangars, totaling approximately 50,000 square feet. It is presumed that 95 percent of future based aircraft desire hangar space given current owner preferences. Hangar area recommendations found within Table 4.6 are based upon: 1,200 square feet for single-engine piston aircraft, 2,200 square feet for multi-engine piston and twin-turbo prop aircraft, 4,000 square feet for smaller jet aircraft, 12,000 square feet for larger jet aircraft, and 1,500 square feet for helicopters. The small/large jet aircraft category is created by estimating 80/20 segregation from the Forecasts of Aviation Demand for the Jet category. Aircraft accounted for within Table 4.3 are not included for analysis within Table 4.6.
Note that aircraft may be located in T-hangar units, in more conventional small box hangars, or collocated with other aircraft in a larger hangar. A single aircraft, perhaps only requiring 1,200 square feet, may be located in a 6,400 square foot hangar. Summarily, it is not meaningful to infer from the table that a given quantity of future hangars units is recommended, only a minimum hangar area. Additional hangar area will be required, for each of the 5- year period over the 20-year term, per the Forecasts of Aviation Demand and as demand materializes.
4.3.5 AIRCRAFT FUELINGThe current tank capacity of 10,000 gallons of piston (100LL) fuel with no turbine fuels capacity roughly equates to a deliver every couple of months. Future
TABLE 4.5 TERMINAL/FBO BUILDING RECOMMENDATIONS
2015 2020 2025 2035 CurrentPeak Hour Operations 7 7 7 8Peak Hour Users 26 28 29 30Waiting Lounge 396 414 432 450Office Space 79 83 86 90
Public Conveniences 40 4 43 45Vending/Concession 132 138 144 150Storage, Circulation, HVAC 647 676 706 735Total Terminal Building Area (Square Feet) 1,294 1,352 1,411 1,470 ±3,850Source: FAA/J-U-B
TABLE 4.6 HANGAR AREA RECOMMENDATIONS
2015 2020 2025 2035 CurrentSingle-Engine Based Aircraft (Not On Ramp) 53 56 60 67 -Single-Engine Hangar Area 63,300 67,200 72,000 80,400Multi-Engine/Twin Based Aircraft (Not On Ramp) 0 1 1 1 -Multi-Engine/Twin-Turbo Prop Hangar Area 0 2,200 2,200 2,200Jet (Small) Based Aircraft 0 0 0 0 -Jet (Small) Hangar Area 0 0 0 0Jet (Large) Based Aircraft 0 0 0 0
-Jet (Large) Hangar Area 0 0 0 0Helicopter/Other Based Aircraft 0 2 2 2 -Helicopter/Other Hangar Area 0 3,000 3,000 3,000Total Hangar Area Recommended (Square Feet) 63,300 72,400 77,200 85,600 ±50,000
Source: FAA/J-U-B
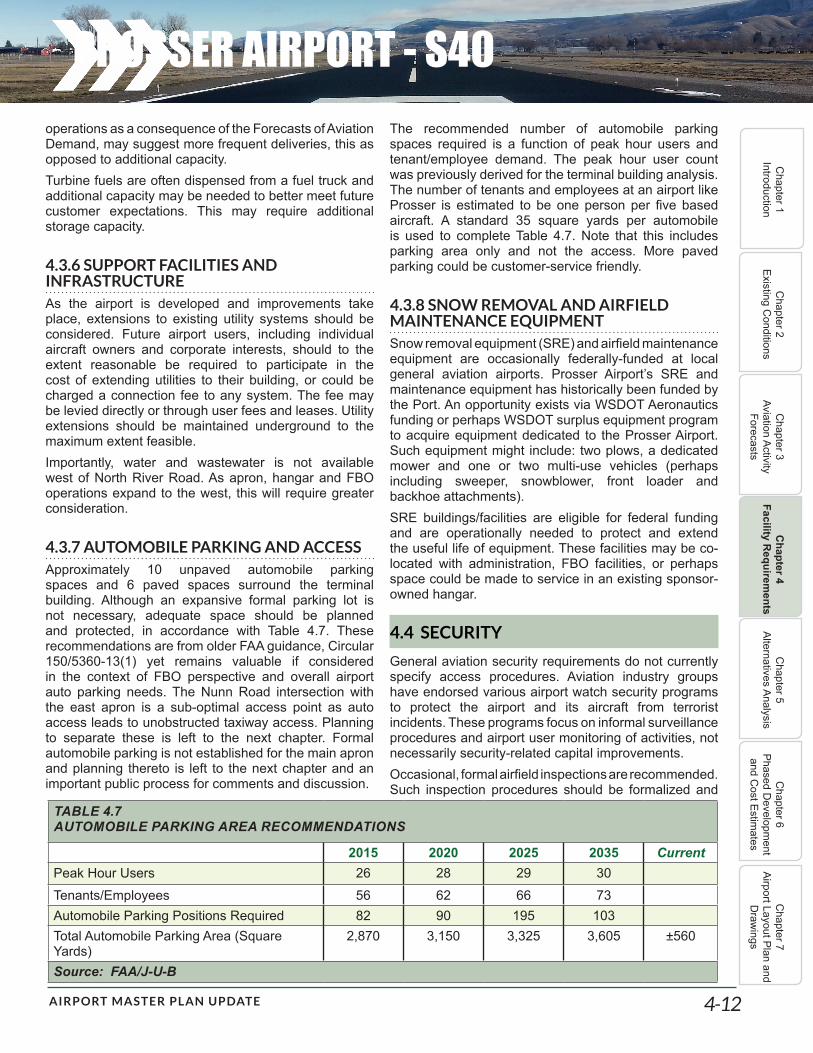
AIRPORT MASTER PLAN UPDATE 4-12
PROSSER AIRPORT - S40C
hapter 1 Introduction
Chapter 2
Existing Conditions
Chapter 3
Aviation Activity Forecasts
Chapter 4
Facility Requirem
entsC
hapter 5 Alternatives Analysis
Chapter 6
Phased Developm
ent and C
ost Estimates
Chapter 7
Airport Layout Plan and D
rawings
operations as a consequence of the Forecasts of Aviation Demand, may suggest more frequent deliveries, this as opposed to additional capacity.Turbine fuels are often dispensed from a fuel truck and additional capacity may be needed to better meet future customer expectations. This may require additional storage capacity.
4.3.6 SUPPORT FACILITIES AND INFRASTRUCTUREAs the airport is developed and improvements take place, extensions to existing utility systems should be considered. Future airport users, including individual aircraft owners and corporate interests, should to the extent reasonable be required to participate in the cost of extending utilities to their building, or could be charged a connection fee to any system. The fee may be levied directly or through user fees and leases. Utility extensions should be maintained underground to the maximum extent feasible. Importantly, water and wastewater is not available west of North River Road. As apron, hangar and FBO operations expand to the west, this will require greater consideration.
4.3.7 AUTOMOBILE PARKING AND ACCESSApproximately 10 unpaved automobile parking spaces and 6 paved spaces surround the terminal building. Although an expansive formal parking lot is not necessary, adequate space should be planned and protected, in accordance with Table 4.7. These recommendations are from older FAA guidance, Circular 150/5360-13(1) yet remains valuable if considered in the context of FBO perspective and overall airport auto parking needs. The Nunn Road intersection with the east apron is a sub-optimal access point as auto access leads to unobstructed taxiway access. Planning to separate these is left to the next chapter. Formal automobile parking is not established for the main apron and planning thereto is left to the next chapter and an important public process for comments and discussion.
The recommended number of automobile parking spaces required is a function of peak hour users and tenant/employee demand. The peak hour user count was previously derived for the terminal building analysis. The number of tenants and employees at an airport like Prosser is estimated to be one person per five based aircraft. A standard 35 square yards per automobile is used to complete Table 4.7. Note that this includes parking area only and not the access. More paved parking could be customer-service friendly.
4.3.8 SNOW REMOVAL AND AIRFIELD MAINTENANCE EQUIPMENTSnow removal equipment (SRE) and airfield maintenance equipment are occasionally federally-funded at local general aviation airports. Prosser Airport’s SRE and maintenance equipment has historically been funded by the Port. An opportunity exists via WSDOT Aeronautics funding or perhaps WSDOT surplus equipment program to acquire equipment dedicated to the Prosser Airport. Such equipment might include: two plows, a dedicated mower and one or two multi-use vehicles (perhaps including sweeper, snowblower, front loader and backhoe attachments).SRE buildings/facilities are eligible for federal funding and are operationally needed to protect and extend the useful life of equipment. These facilities may be co-located with administration, FBO facilities, or perhaps space could be made to service in an existing sponsor-owned hangar.
4.4 SECURITY
General aviation security requirements do not currently specify access procedures. Aviation industry groups have endorsed various airport watch security programs to protect the airport and its aircraft from terrorist incidents. These programs focus on informal surveillance procedures and airport user monitoring of activities, not necessarily security-related capital improvements. Occasional, formal airfield inspections are recommended. Such inspection procedures should be formalized and
TABLE 4.7 AUTOMOBILE PARKING AREA RECOMMENDATIONS
2015 2020 2025 2035 CurrentPeak Hour Users 26 28 29 30Tenants/Employees 56 62 66 73Automobile Parking Positions Required 82 90 195 103Total Automobile Parking Area (Square Yards)
2,870 3,150 3,325 3,605 ±560
Source: FAA/J-U-B
AIRPORT MASTER PLAN UPDATE 4-13
PROSSER AIRPORT - S40C
hapter 1 Introduction
Chapter 2
Existing Conditions
Chapter 3
Aviation Activity Forecasts
Chapter 4
Facility Requirem
entsC
hapter 5 Alternatives Analysis
Chapter 6
Phased Developm
ent and C
ost Estimates
Chapter 7
Airport Layout Plan and D
rawings
airport emergency and security plans should be drafted as necessary.The Transportation Security Administration (TSA) is charged with security at commercial service and general aviation airports. TSA has no requirements of the Port, but has created recommendations based upon threat and the local and regional aviation environment. Per TSA’s 2004 Security Guidelines for General Aviation Airports, WSDOT recommends a medium security level and that the following actions be considered:
• Install strategically located security-related signage
• Formalize and document security procedures; • Provide for positive passenger baggage and
cargo identification• Established procedures to ensure all aircraft are
secured• Formalize community watch program• Create security-related contact list• Formalize law enforcement support• Formalize a security committee• Formalize transient pilot sign-in/out procedures• Install access control infrastructure and formalize
procedures• Install lighting system, perhaps building interior
and exterior and apron floodlighting• Formalize personnel identification system• Establish vehicle identification protocol for airfield
access• Establish and reinforce challenge procedures
Many of these steps have already been taken, some remain to be considered, while others are in process. TSA and WSDOT stop short of recommending security-related fencing. TSA has worked extensively to ensure that a meaningful security apparatus is provided for the general aviation community while being responsive to its constituents. It would be appropriate to occasionally, perhaps every year, coordinate with TSA representatives. In the event of a threat or perhaps resulting from a commercial or general aviation incident, TSA may elect to regulate rather than recommend various security infrastructure or procedures. Fencing along Nunn Road should be 6-foot chain-link. A security plan addressing these and other issues is recommended.
4.5 SUMMARY
A summary of recommended improvements and actions are located in Table 4.8 on the next page. Through the course of master planning consultations and public involvement, the Port of Benton has received feedback from users that the airport should be planned to maximize community economic development opportunities and be a safe and inviting facility. Both Port staff and users agree that this airport planning should protect for those larger, faster and more expensive aircraft that sometimes use the airport, even if the critical mass of 500 annual aircraft operations may not be reached for eligibility purposes. Previous planning and the prevailing view in this regard has aimed to somewhat protect for B-II with a non-precision, straight-in instrument approach procedure to both runway ends. The larger, faster and more expensive aircraft often fit more nicely in the B-II grouping, as opposed to the B-I grouping and the lack of instrument approach to either runway end may be artificially restricting access to the Prosser Airport. The type of aircraft activity, current and future, found in the Forecasts of Demand does not make B-II design standards eligible for grant-in-aid funding from FAA. Regardless, Port of Benton staff wish an effort within this planning to estimate the need. Description, visuals, and cost estimates to meet B-II with a non-precision, straight-in instrument approach procedure to both runway ends is left to the next chapter where it can be considered in the larger alternatives context, as an ‘ultimate’ plan.

AIRPORT MASTER PLAN UPDATE 4-14
PROSSER AIRPORT - S40C
hapter 1 Introduction
Chapter 2
Existing Conditions
Chapter 3
Aviation Activity Forecasts
Chapter 4
Facility Requirem
entsC
hapter 5 Alternatives Analysis
Chapter 6
Phased Developm
ent and C
ost Estimates
Chapter 7
Airport Layout Plan and D
rawings
TABLE 4.8 SUMMARY OF RECOMMENDATIONS
Airport Role Existing Future UltimateDesign Standards B-I/TDG1a,
Small, ≥3/4 MileB-I/TDG1a, Small, ≥3/4 Mile
B-II/TDG2, Large, ≥3/4 Mile
Airside Existing Future UltimateInstrument Approach Capability (Perhaps GPS Instrument Approach Procedure{s}) See Next ChapterRunway Length 3,451’ 3,250’ See Next ChapterRunway Width 60’ 60’ 75’Taxiway Width 25/30’ 25’ 35’Runway Protection Zones 250’x450’x1,000’ 250’x450’x1,000’ 500’x700’x1,000’Runway Safety Area 120’ wide/240’ ends 120’ wide/240’ ends 150’ wide/300’ endsRunway Object Free Area 250’ wide/240’ ends 250’ wide/240’ ends 500’ wide/300’ endsRunway Obstacle Free Zone 200’ wide/240’ ends 200’ wide/240’ ends 400’ wide/240’ endsTaxiway Safety Area Width 49’ 49’ 79’Taxiway/Taxilane OFA Width 79’/89’ 79’/89’ 115’/131’Runway to Taxiway A 235’&150’ 150’ 240’Runway to Holdline 125’ 125’ 200’Runway Aircraft Parking 235’ 125’ 250’Runway and Taxiway Pavements Occasional Rehabilitation
Runway Lighting (MIRL, New PAPI-Runway 26, REIL) PAPIs, Occasional RehabilitationNavigable Airspace Clear/Mitigate Obstructions
Landside Existing 2015 2020 2025 2035Based Aircraft Apron Area (SY) ±5,000 2,688 4,217 4,409 4,745 Recommended Additional Area (SY) 0 0 0 0Itinerant Aircraft Apron Area (SY) 1±16,500 7,656 8,003 8,239 8,609 Recommended Additional Area (SY) 0 0 0 0Terminal Building Area (SF) ±3,850 1,294 1,352 1,411 1,470 Recommended Additional Area (SF) 0 0 0 0On-Airport Hangar Area (SF) ±50,000 63,300 72,400 77,200 85,600 Recommended Additional Area (SF) 13,300 12,400 17,200 35,600Automobile Parking Area (SY) ±560 2,870 3,150 3,325 3,605 Recommended Additional Paved Area (SY) 2,310 2,590 2,765 3,045Automobile Access See Next ChapterHelicopter/Rotocraft Parking See Next ChapterAirfield Snow Removal and Maintenance Equipment
Occasional Purchase
Fencing Nunn Road, Perimeter

AIRPORT MASTER PLAN UPDATE 4-15
PROSSER AIRPORT - S40C
hapter 1 Introduction
Chapter 2
Existing Conditions
Chapter 3
Aviation Activity Forecasts
Chapter 4
Facility Requirem
entsC
hapter 5 Alternatives Analysis
Chapter 6
Phased Developm
ent and C
ost Estimates
Chapter 7
Airport Layout Plan and D
rawings
TABLE 4.8 SUMMARY OF RECOMMENDATIONSSecurity, Compliance and SustainabilitySecurity MonitorCompliance; Through-the-Fence None, Monitor Compliance; Update Overlay District Zoning/Comprehensive Plan Coordinate with OthersCompliance; Airport Rules and Regulations Recently UpdatedCompliance; Minimum Standards Recently UpdatedCompliance; Development Standards Recently Updated
TABLE SUMMARY: ITEMS/STANDARD BELOW NEED TO MET 1. Runway to Taxiway Separation Should be 150’ Minimum
2. Additional Based Aircraft Apron, Hangar Area and Automobile Parking
3. Regular Pavements Maintenance, Equipment and Lighting Rehabilitation4. Clear and Ensure Future Clear Airspace5. Consider Runway Length, Instrument Approach CapabilitySource: FAA/J-U-B

AIRPORT MASTER PLAN UPDATE 5-1
PROSSER AIRPORT - S40C
hapter 1 Introduction
Chapter 2
Existing Conditions
Chapter 3
Aviation Activity Forecasts
Chapter 4
Facility Requirem
entsC
hapter 5 A
lternatives Analysis
Chapter 6
Phased Developm
ent and C
ost Estimates
Chapter 7
Airport Layout Plan and D
rawings
CHAPTER 5 - ALTERNATIVES ANALYSIS
5.0 INTRODUCTION
This chapter describes development alternatives and configurations that could be considered to meet the facility requirements and accommodate demand in the short and long-term. Several issues are at hand and are carried forward from Table 4-9.
1. Accommodate FAA Design Standards and Clear/Mitigate Obstructions
2. Perhaps Improve GPS Approach Capability3. Consider Additional Runway Length4. Locate Hangars, Apron and Taxiways and
Consider Other Miscellaneous FacilitiesThese roughly correspond to the issues to be addressed as described in the Introduction to this planning. Although apparently separate and distinct, the above are related and one impacts another in obvious and in more subtle ways.
5.1 ALTERNATIVES INTRODUCTION
It is important for grant assurance compliance that this overall planning effort pursues FAA design standards. There is an ever-increasing distance between aviation infrastructure needs and federal and state funding at a local, regional and national level, particularly for general aviation airports. A result of this, at least for the Prosser Airport, is that an improvement or series of improvements necessary for FAA design standards compliance may not be funded in the short-term or perhaps even in the longer-term if the improvements are substantial. In short, improvements for this alternative are likely to occur over a 20-year period. A series of alternatives follows providing meaning to a relatively complex situation. Alternative No. 1A: Existing and Future Design Standards Compliance. This alternative specifies no future improvements other than accommodation of select FAA design standards and clearance or mitigation of obstructions. This alternative is described within Section 5.2.Alternative No. 1B: Existing and Future Design Standards Compliance with GPS Approaches to Both Runway Ends. This alternative specifies accommodation of select FAA design standards and clearance or mitigation of obstructions along with an improved ability to accommodate all weather operations. This alternative anticipates a 1-mile visibility GPS approach procedures using GPS technology. This alternative is described within Section 5.3.
Alternative No. 1C: Existing and Future Design Standards Compliance with GPS Approaches to Both Runway Ends and a Westerly Runway Extension for 4,000 Feet. This alternative specifies accommodation of select FAA design standards and clearance or mitigation of obstructions, an improved ability to accommodate all weather operations, along with a 549-foot westerly runway extension. This alternative anticipates a 1-mile visibility GPS approach procedures using GPS technology. This alternative is described within Section 5.4.The next series of alternatives describes a similar series of potential improvements as potential enhancements. This set of alternatives considers compliance for the more demanding (B-II) design standards. It is important to note, up front, that FAA grant-in-aid is not eligible for these more robust standards and their associated improvements. These alternatives are made primarily to envision and describe that which is to perhaps be protected, as opposed to funded and built within the 20-year period of this planning.Alternative No. 2A: Ultimate (B-II) Design Standards Compliance. This alternative specifies no future improvements other than accommodation of select ultimate FAA design standards and clearance or mitigation of obstructions. This alternative is described within Section 5.5.Alternative No. 2B: Ultimate (B-II) Design Standards Compliance with GPS Approaches to Both Runway Ends. This alternative specifies accommodation of select ultimate FAA design standards and clearance or mitigation of obstructions, along with an improved ability to accommodate all weather operations. This alternative anticipates a 1-mile visibility GPS approach procedures using GPS technology. This alternative is described within Section 5.6.Alternative No. 2C: Ultimate (B-II) Design Standards Compliance with GPS Approaches to Both Runway Ends and a Westerly Runway Extension for 4,000 Feet. This alternative specifies accommodation of select ultimate FAA design standards and clearance or mitigation of obstructions, an improved ability to accommodate all weather operations, along with a 549-foot westerly runway extension. This alternative anticipates a 1-mile visibility GPS approach procedures using GPS technology. This alternative is described within Section 5.7.Finally, four landside development configurations consider potential apron, hangars, taxiways, and aviation business locations and uses. The previous chapter demonstrates the need for additional landside aviation facilities and the following configurations show

AIRPORT MASTER PLAN UPDATE 5-2
PROSSER AIRPORT - S40C
hapter 1 Introduction
Chapter 2
Existing Conditions
Chapter 3
Aviation Activity Forecasts
Chapter 4
Facility Requirem
entsC
hapter 5 A
lternatives Analysis
Chapter 6
Phased Developm
ent and C
ost Estimates
Chapter 7
Airport Layout Plan and D
rawings
demand accommodation. All configurations show non-aviation industrial.LandsideConfigurationNo.1A:SetbackforVisualOperations. This configuration primarily shows fill-in box hangars via ground-leasing. This alternative is described within Section 5.8.1. Landside Configuration No. 1B: Setback for GPSOperations. This configuration primarily shows fill-in box hangars via ground- leasing, and clearance area for GPS operations. This alternative is described within Section 5.8.2. LandsideConfigurationNo.2A:SetbackforVisualOperations. This configuration shows fill-in box hangars via ground-leasing near the eastern apron, with T-hangar development around the main apron. This alternative is described within Section 5.8.3.Landside Configuration No. 2B: Setback for GPSOperations. This configuration shows fill-in box hangars via ground-leasing near the eastern apron, with T-hangar development around the main apron. Additional clearance area for GPS operations is planned. This alternative is described within Section 5.8.4.
5.2 ALTERNATIVE NO. 1A: EXISTING AND FUTURE FAA DESIGN STANDARDS
This alternative shows improvements for design standards compliance.
1. South Steele Road crosses the Runway 8 RPZ. Of the three actions which could be taken to mitigate this non-standard condition per the below, closure of the access of planned because it is not yet known if FAA will allow approve access:a. Receive administrative clearance from FAA,
via an approval of an ‘RPZ Memo’ to keep the access open to the general public,
b. Close the access, orc. Relocate the Runway 8 End.
2. The distance required between the Runway 8-26 centerline to the parallel Taxiway A centerline is 150 feet. FAA is permitting analysis at the next level of design standards (B-II) for this runway-to-taxiway centerline standard only. This entails moving the entirety of the parallel taxiway from 150 feet to 240 feet.
3. This relocation of Parallel Taxiway A impacts both aprons. The main apron would lose its first row of tiedowns. The east apron would need to
accommodate the new taxiway at its northwest corner with a redesign.
4. Several obstructions to navigable airspace are found west beyond airport property along extended Runway 8 centerline. These will need to be lowered or otherwise cleared.
5.3 ALTERNATIVE NO. 1B: EXISTING AND FUTURE FAA DESIGN STANDARDS WITH GPS APPROACHES TO BOTH RUNWAY ENDS
Alternative No. 1B includes those items found on the previous alternative, plus improvements associated with a GPS Approach Procedure to either runway end. A GPS approach procedure is a three-dimensional, FAA-created and approved path in the sky for aircraft operation, allowing the Prosser Airport to function as a more all-weather capable airport. A more capable all-weather airport informs the flying public and aviation businesses that the field is open for business in a meaningful way as it relates to operations in inclement weather. The primary consequence of this alternative and the main difference between the previous alternative is wider airspace surfaces, including the primary and approach surfaces.
1. South Steele Road crosses the Runway 8 Runway Protection Zone. Of the three actions which could be taken to mitigate this non-standard condition per the below, closure of the access of planned because it is not yet known if FAA will allow approve access:a. Receive administrative clearance from FAA,
via an approval of an ‘RPZ Memo’ to keep the access open to the general public,
b. Close the access, orc. Relocate the Runway 8 End.
2. The distance required between the runway centerline to the parallel Taxiway A centerline is 150 feet. FAA is permitting analysis at the next level of design standards (B-II) for this runway-to-taxiway centerline standard only. This entails moving the remainder of the parallel taxiway from 150 feet to 240 feet.
3. This relocation of Parallel Taxiway A impacts both aprons. The main apron would lose its first row of tiedowns. The east apron would need to accommodate the new taxiway at its northwest corner with a redesign.

AIRPORT MASTER PLAN UPDATE 5-3
PROSSER AIRPORT - S40C
hapter 1 Introduction
Chapter 2
Existing Conditions
Chapter 3
Aviation Activity Forecasts
Chapter 4
Facility Requirem
entsC
hapter 5 A
lternatives Analysis
Chapter 6
Phased Developm
ent and C
ost Estimates
Chapter 7
Airport Layout Plan and D
rawings
4. Several obstructions to navigable airspace are found within and west beyond airport property along extended Runway 8 centerline. These will need to be lowered or otherwise cleared. In addition, the wider and more demanding surfaces create obstructions along Old Inland Empire Highway and along South Steele Road and necessitate the closure of a large portion of the east apron.
5.4 ALTERNATIVE NO. 1C: EXISTING AND FUTURE FAA DESIGN STANDARDS WITH GPS APPROACHES TO BOTH RUNWAY ENDS AND A WESTERLY RUNWAY EXTENSION TO 4,000 FEET
Alternative No. 1C includes those items found on the previous two alternatives, plus a 549-foot westerly extension of the runway and taxiway. The previous chapter notes that an application of FAA runway length standards, as they apply to the Prosser Airport, suggests that a runway extension to 4,000 feet: (1) should be considered in this context, (2) airspace should be protected if additional length is desired, and (3) is not currently eligible for federal grant-in-aid. A few items are of note for this alternative:
1. WSDOT Aeronautics, via its state system planning recommends no additional runway length.
2. Any meaningful length; that is, beyond a hundred feet or so, will require land acquisition for approach protection and RPZ design standards compliance.
3. A 4,000-foot runway is the most economically responsive length from an aviation demand-accommodation perspective. Airport users and the flying public see 4,000 feet as a good length for the future of the Prosser Airport.
4. Regional FAA guidance suggests participation with federal funding for any extension requires documentation of penalized operations to make funds eligible. A penalized operation is one in which the pilot is not able to operate as desired at a given runway length. Hot weather or payloads that are more robust serve to restrict, or penalize, some aircraft operations.
The primary consequence of this alternative and the main difference between the previous alternatives is the actual extension, along with land acquisition and obstruction removal for the extension to allow a clear path for aircraft operation.
1. South Steele Road crosses the Runway 8 RPZ. Of the three actions which could be taken to mitigate this non-standard condition per the below, closure of the access of planned because it is not yet known if FAA will allow approve access:a. Receive administrative clearance from FAA,
via an approval of an ‘RPZ Memo’ to keep the access open to the general public,
b. Close the access, orc. Relocate the Runway 8 End.
2. The distance required between the runway centerline to the parallel Taxiway A centerline is 150 feet. FAA is permitting analysis at the next level of design standards (B-II) for this runway-to-taxiway centerline standard only. This entails moving the remainder of the parallel taxiway from 150 feet to 240 feet.
3. This relocation of Parallel Taxiway A impacts both aprons. The main apron would lose its first row of tiedowns. The east apron would need to accommodate the new taxiway at its northwest corner with a redesign.
4. Several obstructions to navigable airspace are found within and west beyond airport property along extended Runway 8 centerline. These will need to be lowered or otherwise cleared. In addition, the wider and more demanding surfaces create obstructions along Old Inland Empire Highway and along South Steele Road and necessitate the closure of a large portion of the east apron.
5. Partial land acquisitions, either fee or to-the-ground easements are recommended to protect the RPZ and approach surfaces. The area proposed appears to be mostly clear of above ground improvements which would necessitate relocation activities.

PROSSER AIRPORT - S40
AIRPORT MASTER PLAN UPDATE 5-4
Chapter 1
IntroductionC
hapter 2 Existing C
onditionsC
hapter 3 Aviation Activity
Forecasts
Chapter 4
Facility Requirem
entsC
hapter 5 A
lternatives Analysis
Chapter 6
Phased Developm
ent and C
ost Estimates
Chapter 7
Airport Layout Plan and D
rawings
FIGURE 5.1 ALTERNATIVE NO. 1A
Runway 8-26 3,451' x 60'
1
2 23
Old Inland Empire Highway
Nunn Road
Wine Country Road
South Steele Road
South Missim
er Road
4
4
4
Pavement to be Removed (Ultimate)
AB
D
C
EF
3000 600
SCALE IN FEET
N
TRUE
NOR
TH
LEGEND
RUNWAY PROTECTION ZONERUNWAY SAFETY AREA
Alternative 1A Costs
# Improvement AIP WSDOT Port Unfunded Total
1 Close S. Steele Rd. Access \ RPZMemo $1,350 $0 $150 $0 $1,500
2Relocate Portion of Taxiway A to 240Feet (25 Feet Wide, TDG1A) $1,072,550 $28,225 $28,225 $0 $1,129,000
3 Remark Aprons, Tiedowns Removed $64,800 $0 $7,200 $0 $72,000
4 Lower \ Mitigate Obstructions $1,195,100 $31,450 $31,450 $0 $1,258,000
Total: $2,333,800 $59,675 $67,025 $0 $2,460,500
Alternative No. 1ARUNWAY OBJECT FREE AREA
PROPERTY LINE
Existing and Future Design Standards Compliance
DESIGN AIRCRAFT
7:1 Transitional Surface7:1 Transitional Surface
End
of R
wy
80 Foot Tree Clear at 1,800' Feet From Runway End(with no ground elevation change)
1,800 Feet
200' Feet BeyondRunway End
(Primary Surface)
685 Feet
80' Tree Clear at 685 feet From Runway ℄(with no ground elevation change)
250' Primary Surface
80 F
oot
Tree
Example Cross Section View: Primary and Transitional Surface Clearance
Example Profile View: Approach Surface Clearance
℄
20:1 Approach Surface
20:1 Approach Surface
B-I
80 F
oot
Tree
RUNWAY APPROACH SURFACE
STRUCTURES TO BE REMOVED
# DESCRIPTION
A STRUCTURE TO BE REMOVED
B HOUSE UNOCCUPIED - TO BE REMOVED
C HOUSE UNOCCUPIED - TO BE REMOVED
D STRUCTURE TO BE REMOVED
E HOUSE HAS BEEN REMOVED
F STRUCTURE TO BE REMOVED
Source: J-U-B
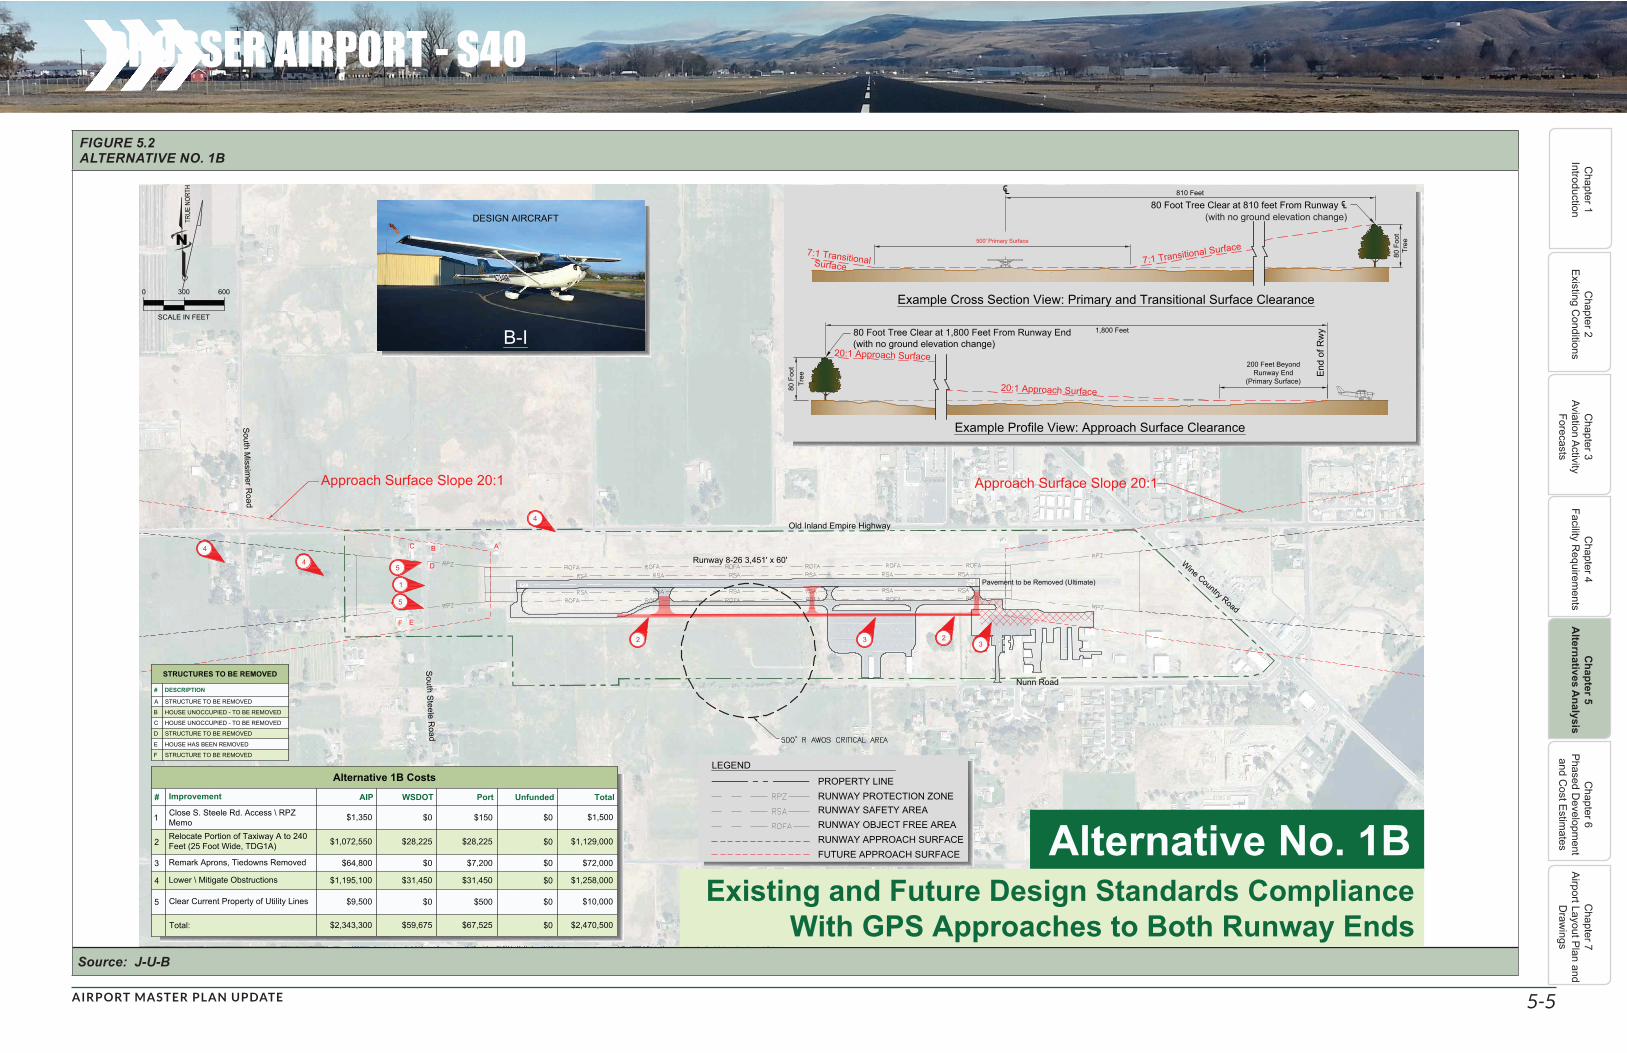
PROSSER AIRPORT - S40
AIRPORT MASTER PLAN UPDATE 5-5
Chapter 1
IntroductionC
hapter 2 Existing C
onditionsC
hapter 3 Aviation Activity
Forecasts
Chapter 4
Facility Requirem
entsC
hapter 5 A
lternatives Analysis
Chapter 6
Phased Developm
ent and C
ost Estimates
Chapter 7
Airport Layout Plan and D
rawings
FIGURE 5.2 ALTERNATIVE NO. 1B
Runway 8-26 3,451' x 60'
Approach Surface Slope 20:1 Approach Surface Slope 20:1
2 23
Old Inland Empire Highway
Nunn Road
Wine Country Road
South Steele Road
4
4
South Missim
er Road
4
3
1
5
5
Pavement to be Removed (Ultimate)
AB
D
C
EF
3000 600
SCALE IN FEET
N
TRUE
NOR
TH
Alternative No. 1BExisting and Future Design Standards Compliance
With GPS Approaches to Both Runway Ends
LEGEND
RUNWAY PROTECTION ZONERUNWAY SAFETY AREARUNWAY OBJECT FREE AREA
PROPERTY LINE
FUTURE APPROACH SURFACE
Alternative 1B Costs
# Improvement AIP WSDOT Port Unfunded Total
1 Close S. Steele Rd. Access \ RPZMemo $1,350 $0 $150 $0 $1,500
2Relocate Portion of Taxiway A to 240Feet (25 Foot Wide, TDG1A) $1,072,550 $28,225 $28,225 $0 $1,129,000
3 Remark Aprons, Tiedowns Removed $64,800 $0 $7,200 $0 $72,000
4 Lower \ Mitigate Obstructions $1,195,100 $31,450 $31,450 $0 $1,258,000
5 Clear Current Property of Utility Lines $9,500 $0 $500 $0 $10,000
Total: $2,343,300 $59,675 $67,525 $0 $2,470,500
DESIGN AIRCRAFT
7:1 Transitional Surface7:1 Transitional
End
of R
wy80 Foot Tree Clear at 1,800 Feet From Runway End
(with no ground elevation change)1,800 Feet
200 Feet BeyondRunway End
(Primary Surface)
810 Feet
80 Foot Tree Clear at 810 feet From Runway ℄(with no ground elevation change)
500' Primary Surface
80 F
oot
Tree
Example Cross Section View: Primary and Transitional Surface Clearance
Example Profile View: Approach Surface Clearance
℄
Surface
20:1 Approach Surface
20:1 Approach Surface
B-I
80 F
oot
Tree
RUNWAY APPROACH SURFACE
STRUCTURES TO BE REMOVED
# DESCRIPTION
A STRUCTURE TO BE REMOVED
B HOUSE UNOCCUPIED - TO BE REMOVED
C HOUSE UNOCCUPIED - TO BE REMOVED
D STRUCTURE TO BE REMOVED
E HOUSE HAS BEEN REMOVED
F STRUCTURE TO BE REMOVED
Source: J-U-B
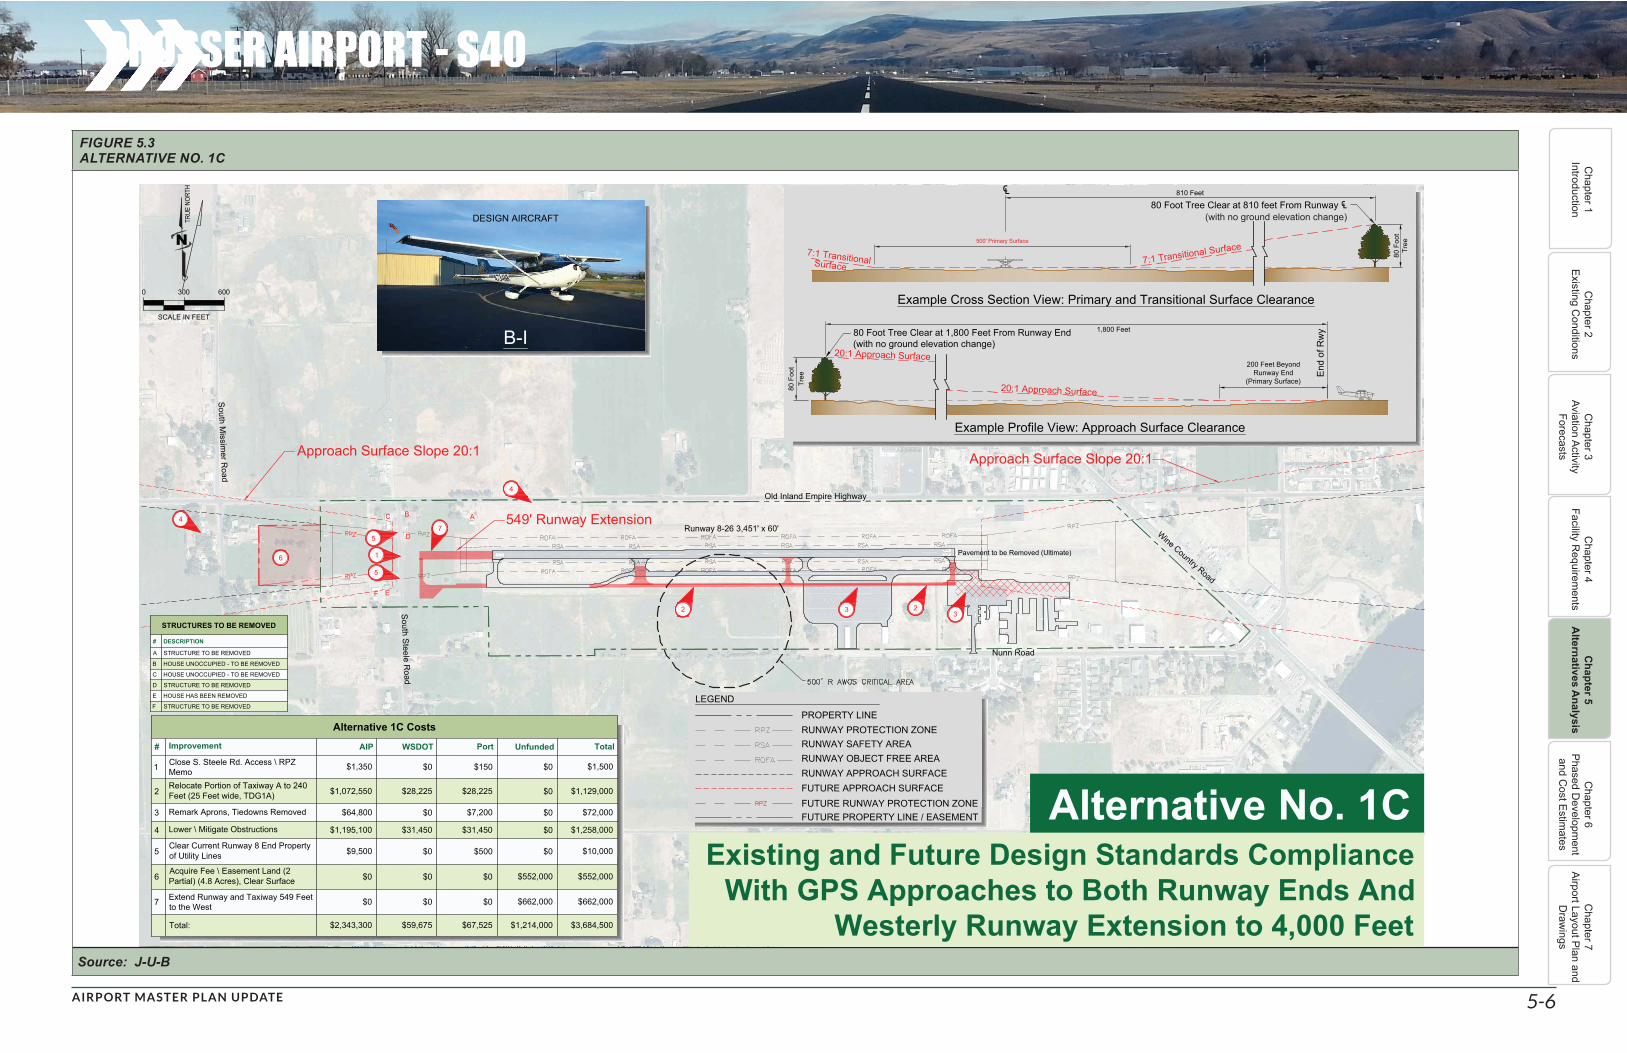
PROSSER AIRPORT - S40
AIRPORT MASTER PLAN UPDATE 5-6
Chapter 1
IntroductionC
hapter 2 Existing C
onditionsC
hapter 3 Aviation Activity
Forecasts
Chapter 4
Facility Requirem
entsC
hapter 5 A
lternatives Analysis
Chapter 6
Phased Developm
ent and C
ost Estimates
Chapter 7
Airport Layout Plan and D
rawings
FIGURE 5.3 ALTERNATIVE NO. 1C
Runway 8-26 3,451' x 60'
Approach Surface Slope 20:1 Approach Surface Slope 20:1
549' Runway Extension
2
7
3 2
Old Inland Empire Highway
Nunn Road
Wine Country Road
South Steele Road
4
South Missim
er Road
4
3
6 1
5
5
Pavement to be Removed (Ultimate)
AB
D
C
EF
3000 600
SCALE IN FEET
N
TRUE
NOR
TH
Alternative No. 1CExisting and Future Design Standards Compliance
With GPS Approaches to Both Runway Ends AndWesterly Runway Extension to 4,000 Feet
LEGEND
RUNWAY PROTECTION ZONERUNWAY SAFETY AREARUNWAY OBJECT FREE AREA
PROPERTY LINE
FUTURE APPROACH SURFACEFUTURE RUNWAY PROTECTION ZONE
Alternative 1C Costs
# Improvement AIP WSDOT Port Unfunded Total
1 Close S. Steele Rd. Access \ RPZMemo $1,350 $0 $150 $0 $1,500
2Relocate Portion of Taxiway A to 240Feet (25 Feet wide, TDG1A) $1,072,550 $28,225 $28,225 $0 $1,129,000
3 Remark Aprons, Tiedowns Removed $64,800 $0 $7,200 $0 $72,000
4 Lower \ Mitigate Obstructions $1,195,100 $31,450 $31,450 $0 $1,258,000
5Clear Current Runway 8 End Propertyof Utility Lines $9,500 $0 $500 $0 $10,000
6Acquire Fee \ Easement Land (2Partial) (4.8 Acres), Clear Surface $0 $0 $0 $552,000 $552,000
7 Extend Runway and Taxiway 549 Feetto the West $0 $0 $0 $662,000 $662,000
Total: $2,343,300 $59,675 $67,525 $1,214,000 $3,684,500
DESIGN AIRCRAFT
7:1 Transitional Surface7:1 Transitional
End
of R
wy80 Foot Tree Clear at 1,800 Feet From Runway End
(with no ground elevation change)1,800 Feet
200 Feet BeyondRunway End
(Primary Surface)
810 Feet
80 Foot Tree Clear at 810 feet From Runway ℄(with no ground elevation change)
500' Primary Surface
80 F
oot
Tree
Example Cross Section View: Primary and Transitional Surface Clearance
Example Profile View: Approach Surface Clearance
℄
Surface
20:1 Approach Surface
20:1 Approach Surface B-I
80 F
oot
Tree
RUNWAY APPROACH SURFACE
FUTURE PROPERTY LINE / EASEMENT
STRUCTURES TO BE REMOVED
# DESCRIPTION
A STRUCTURE TO BE REMOVED
B HOUSE UNOCCUPIED - TO BE REMOVED
C HOUSE UNOCCUPIED - TO BE REMOVED
D STRUCTURE TO BE REMOVED
E HOUSE HAS BEEN REMOVED
F STRUCTURE TO BE REMOVED
Source: J-U-B

AIRPORT MASTER PLAN UPDATE 5-7
PROSSER AIRPORT - S40C
hapter 1 Introduction
Chapter 2
Existing Conditions
Chapter 3
Aviation Activity Forecasts
Chapter 4
Facility Requirem
entsC
hapter 5 A
lternatives Analysis
Chapter 6
Phased Developm
ent and C
ost Estimates
Chapter 7
Airport Layout Plan and D
rawings
5.5 ALTERNATIVE NO. 2A: ULTIMATE FAA DESIGN STANDARDS
This alternatives analysis now transitions from existing and future design standards to ultimate design standards. While Alternatives 1A, 1B and 1C might be funded, Alternatives 2A, 2B and 2C might be protected, as ultimate have a greatly reduced chance for grant-in–aid funding.. For example, the expanded Runway and Taxiway Safety Areas, runway widening to 75 feet, and taxiway widening to 35 feet are relatively large dollar improvements. This alternative shows improvements for ultimate design standards compliance.
1. South Steele Road crosses the Runway 8 Runway Protection Zone. Of the three actions which could be taken to mitigate this non-standard condition per the below, closure of the access of planned because it is not yet known if FAA will allow approve access:a. Receive administrative clearance from FAA,
via an approval of an ‘RPZ Memo’ to keep the access open to the general public,
b. Close the access, orc. Relocate the Runway 8 End.
2. The distance required between the Runway 8-26 centerline to parallel Taxiway A centerline is 240 feet. This entails moving the entirety of the parallel taxiway from 150 feet to 240 feet.
3. This relocation of Parallel Taxiway A, additional taxiway width and associated taxiway design standards, impacts both aprons. The main apron would lose its first row of tiedowns. The east apron would need to accommodate the new taxiway at its northwest corner with a redesign.
4. Several obstructions to navigable airspace are found west beyond airport property along extended Runway 8 centerline. These will need to be lowered or otherwise cleared. In addition, the wider and more shallow, demanding surfaces create obstructions along Old Inland Empire Highway and along South Steele Road and necessitate the closure of a large portion of the east apron.
5. Both the Runway and Taxiway Safety Areas widen and shallow to allow for the larger, B-II ultimate aircraft design standard.
6. Runway 8-26 is widened from 60 feet to 75 feet. This widening also requires a proportional relocation of the Medium Intensity Runway-edge Lighting (MIRL) system.
5.6 ALTERNATIVE NO. 2B: ULTIMATE FAA DESIGN STANDARDS WITH GPS APPROACHES TO BOTH RUNWAY ENDS
Alternative No. 2B includes those items found on the Alternative 2A, plus improvements associated with a GPS Approach Procedure (IAP) to either runway end. The primary consequence of this alternative and the main difference between the previous alternative is wider airspace surfaces, including the primary and approach surfaces.
1. South Steele Road crosses the Runway 8 Runway Protection Zone. Of the three actions which could be taken to mitigate this non-standard condition per the below, closure of the access of planned because it is not yet known if FAA will allow approve access:a. Receive administrative clearance from FAA,
via an approval of an ‘RPZ Memo’ to keep the access open to the general public,
b. Close the access, orc. Relocate the Runway 8 End.
2. The distance required between the Runway 8-26 centerline to parallel Taxiway A centerline is 240 feet. This entails moving the entirety of the parallel taxiway from 150 feet to 240 feet.
3. This relocation of Parallel Taxiway A impacts both aprons. The main apron would lose its first row of tiedowns. The east apron would need to accommodate the new taxiway at its northwest corner with a redesign.
4. Several obstructions to navigable airspace are found west beyond airport property along extended Runway 8 centerline. These will need to be lowered or otherwise cleared. In addition, the wider and more shallow, demanding surfaces create obstructions along Old Inland Empire Highway and along South Steele Road and necessitate the closure of a large portion of the east apron.
5. Runway 8-26 is widened from 60 feet to 75 feet. This widening also requires a proportional relocation of the Medium Intensity Runway-edge Lighting (MIRL) system.
6. Both the Runway and Taxiway Safety Areas widen and shallow to allow for the larger, ultimate B-II aircraft design standard.
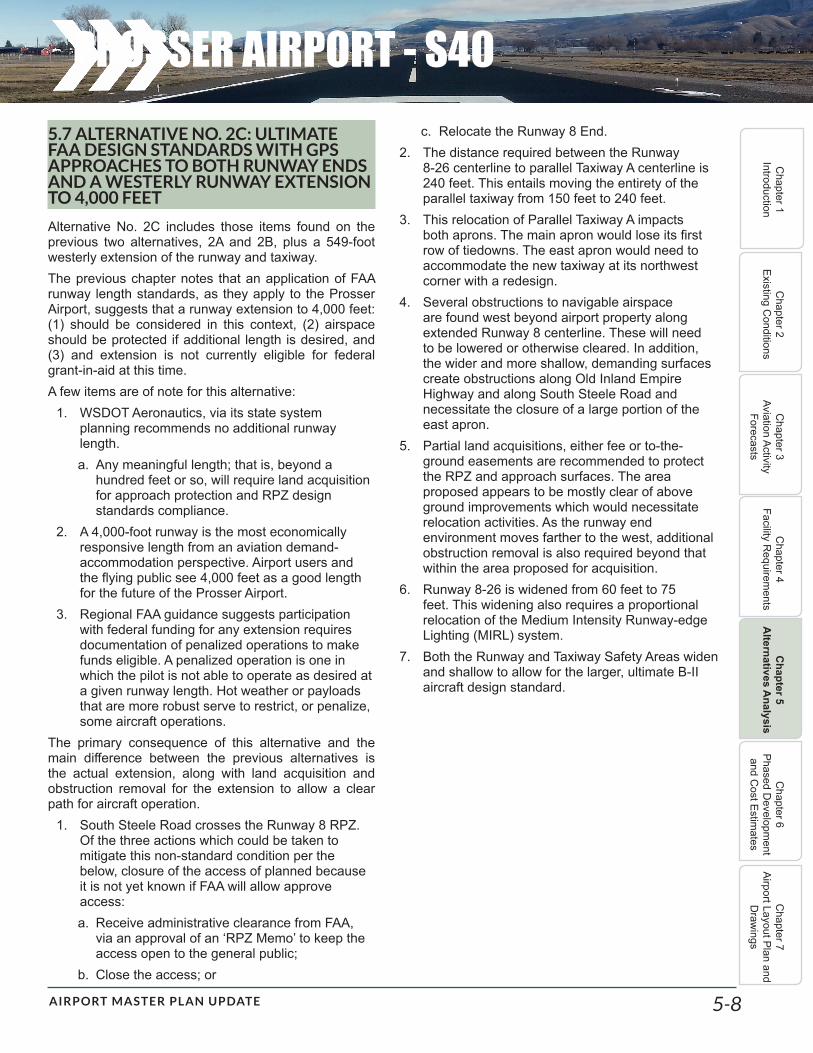
AIRPORT MASTER PLAN UPDATE 5-8
PROSSER AIRPORT - S40C
hapter 1 Introduction
Chapter 2
Existing Conditions
Chapter 3
Aviation Activity Forecasts
Chapter 4
Facility Requirem
entsC
hapter 5 A
lternatives Analysis
Chapter 6
Phased Developm
ent and C
ost Estimates
Chapter 7
Airport Layout Plan and D
rawings
5.7 ALTERNATIVE NO. 2C: ULTIMATE FAA DESIGN STANDARDS WITH GPS APPROACHES TO BOTH RUNWAY ENDS AND A WESTERLY RUNWAY EXTENSION TO 4,000 FEET
Alternative No. 2C includes those items found on the previous two alternatives, 2A and 2B, plus a 549-foot westerly extension of the runway and taxiway. The previous chapter notes that an application of FAA runway length standards, as they apply to the Prosser Airport, suggests that a runway extension to 4,000 feet: (1) should be considered in this context, (2) airspace should be protected if additional length is desired, and (3) and extension is not currently eligible for federal grant-in-aid at this time.A few items are of note for this alternative:
1. WSDOT Aeronautics, via its state system planning recommends no additional runway length.a. Any meaningful length; that is, beyond a
hundred feet or so, will require land acquisition for approach protection and RPZ design standards compliance.
2. A 4,000-foot runway is the most economically responsive length from an aviation demand-accommodation perspective. Airport users and the flying public see 4,000 feet as a good length for the future of the Prosser Airport.
3. Regional FAA guidance suggests participation with federal funding for any extension requires documentation of penalized operations to make funds eligible. A penalized operation is one in which the pilot is not able to operate as desired at a given runway length. Hot weather or payloads that are more robust serve to restrict, or penalize, some aircraft operations.
The primary consequence of this alternative and the main difference between the previous alternatives is the actual extension, along with land acquisition and obstruction removal for the extension to allow a clear path for aircraft operation.
1. South Steele Road crosses the Runway 8 RPZ. Of the three actions which could be taken to mitigate this non-standard condition per the below, closure of the access of planned because it is not yet known if FAA will allow approve access:a. Receive administrative clearance from FAA,
via an approval of an ‘RPZ Memo’ to keep the access open to the general public;
b. Close the access; or
c. Relocate the Runway 8 End.2. The distance required between the Runway
8-26 centerline to parallel Taxiway A centerline is 240 feet. This entails moving the entirety of the parallel taxiway from 150 feet to 240 feet.
3. This relocation of Parallel Taxiway A impacts both aprons. The main apron would lose its first row of tiedowns. The east apron would need to accommodate the new taxiway at its northwest corner with a redesign.
4. Several obstructions to navigable airspace are found west beyond airport property along extended Runway 8 centerline. These will need to be lowered or otherwise cleared. In addition, the wider and more shallow, demanding surfaces create obstructions along Old Inland Empire Highway and along South Steele Road and necessitate the closure of a large portion of the east apron.
5. Partial land acquisitions, either fee or to-the-ground easements are recommended to protect the RPZ and approach surfaces. The area proposed appears to be mostly clear of above ground improvements which would necessitate relocation activities. As the runway end environment moves farther to the west, additional obstruction removal is also required beyond that within the area proposed for acquisition.
6. Runway 8-26 is widened from 60 feet to 75 feet. This widening also requires a proportional relocation of the Medium Intensity Runway-edge Lighting (MIRL) system.
7. Both the Runway and Taxiway Safety Areas widen and shallow to allow for the larger, ultimate B-II aircraft design standard.
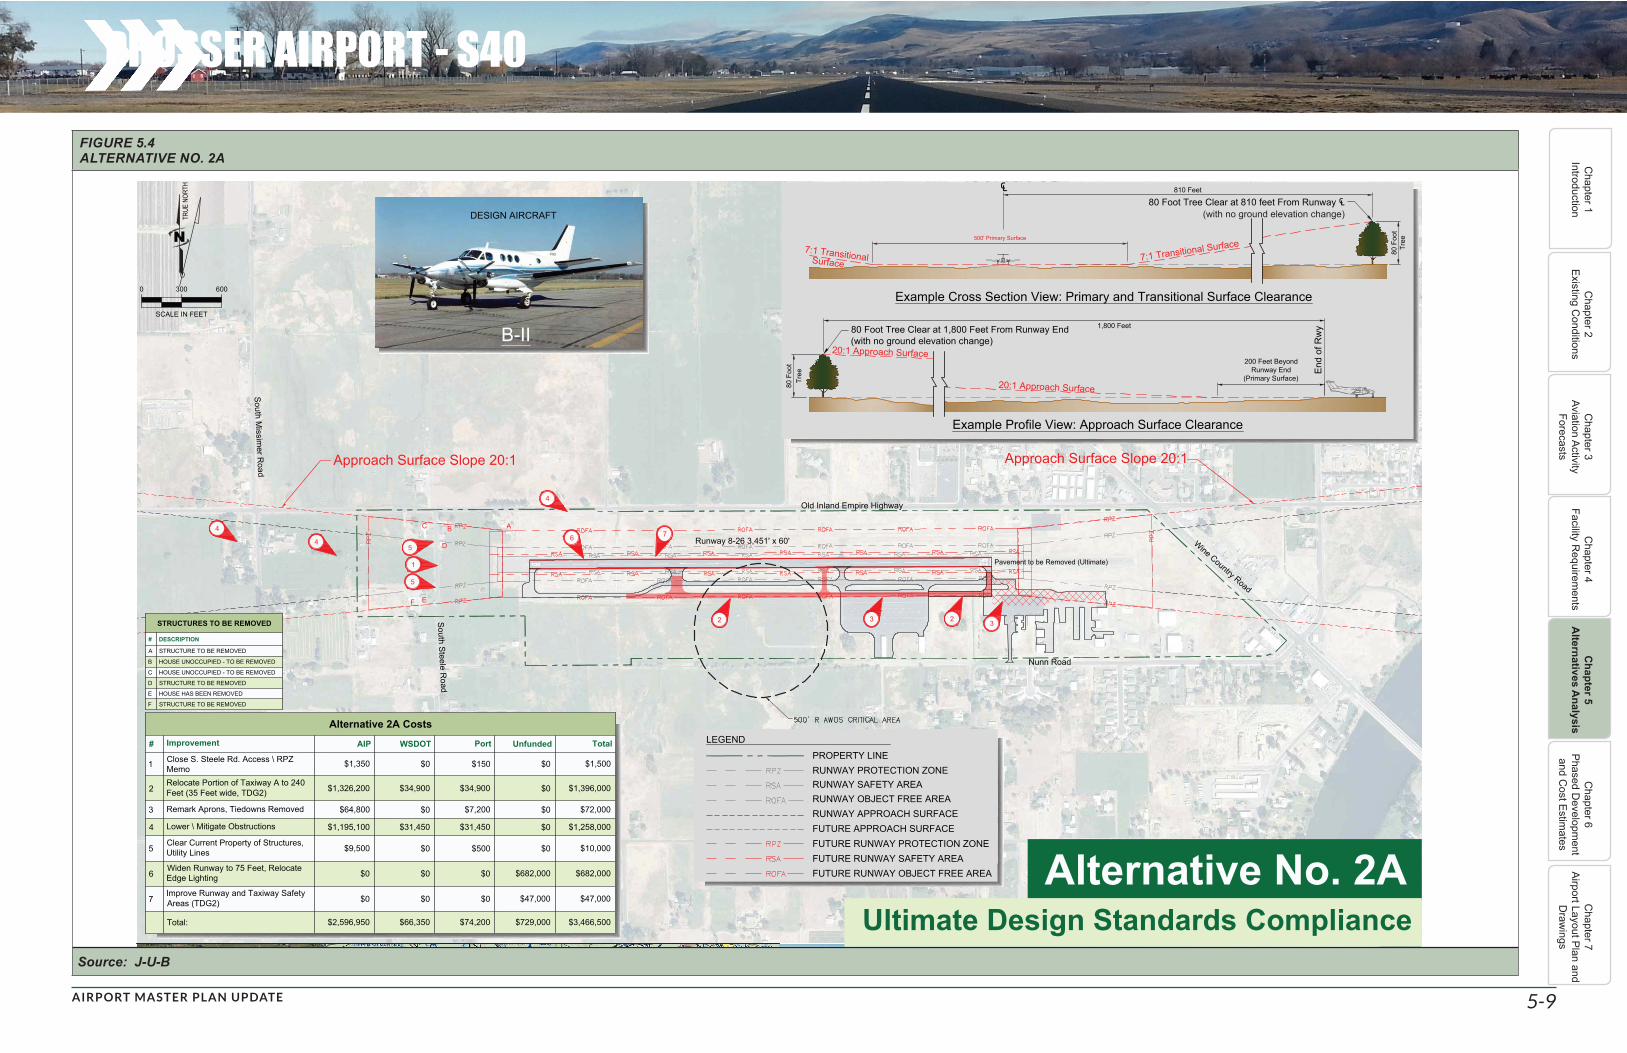
PROSSER AIRPORT - S40
AIRPORT MASTER PLAN UPDATE 5-9
Chapter 1
IntroductionC
hapter 2 Existing C
onditionsC
hapter 3 Aviation Activity
Forecasts
Chapter 4
Facility Requirem
entsC
hapter 5 A
lternatives Analysis
Chapter 6
Phased Developm
ent and C
ost Estimates
Chapter 7
Airport Layout Plan and D
rawings
FIGURE 5.4 ALTERNATIVE NO. 2A
Runway 8-26 3,451' x 60'
Approach Surface Slope 20:1 Approach Surface Slope 20:1
2 3 2
Old Inland Empire Highway
Nunn Road
Wine Country Road
South Steele Road
South Missim
er Road
4
476
4
3
1
5
5
Pavement to be Removed (Ultimate)
AB
D
C
EF
3000 600
SCALE IN FEET
N
TRUE
NOR
TH
Alternative No. 2AUltimate Design Standards Compliance
LEGEND
RUNWAY PROTECTION ZONERUNWAY SAFETY AREARUNWAY OBJECT FREE AREA
PROPERTY LINE
FUTURE APPROACH SURFACE
Alternative 2A Costs
# Improvement AIP WSDOT Port Unfunded Total
1 Close S. Steele Rd. Access \ RPZMemo $1,350 $0 $150 $0 $1,500
2Relocate Portion of Taxiway A to 240Feet (35 Feet wide, TDG2) $1,326,200 $34,900 $34,900 $0 $1,396,000
3 Remark Aprons, Tiedowns Removed $64,800 $0 $7,200 $0 $72,000
4 Lower \ Mitigate Obstructions $1,195,100 $31,450 $31,450 $0 $1,258,000
5Clear Current Property of Structures,Utility Lines $9,500 $0 $500 $0 $10,000
6Widen Runway to 75 Feet, RelocateEdge Lighting $0 $0 $0 $682,000 $682,000
7Improve Runway and Taxiway SafetyAreas (TDG2) $0 $0 $0 $47,000 $47,000
Total: $2,596,950 $66,350 $74,200 $729,000 $3,466,500
FUTURE RUNWAY PROTECTION ZONEFUTURE RUNWAY SAFETY AREAFUTURE RUNWAY OBJECT FREE AREA
DESIGN AIRCRAFT
7:1 Transitional Surface7:1 Transitional
End
of R
wy80 Foot Tree Clear at 1,800 Feet From Runway End
(with no ground elevation change)1,800 Feet
200 Feet BeyondRunway End
(Primary Surface)
810 Feet
80 Foot Tree Clear at 810 feet From Runway ℄(with no ground elevation change)
500' Primary Surface
80 F
oot
Tree
Example Cross Section View: Primary and Transitional Surface Clearance
Example Profile View: Approach Surface Clearance
℄
Surface
20:1 Approach Surface
20:1 Approach Surface B-II
80 F
oot
Tree
RUNWAY APPROACH SURFACE
STRUCTURES TO BE REMOVED
# DESCRIPTION
A STRUCTURE TO BE REMOVED
B HOUSE UNOCCUPIED - TO BE REMOVED
C HOUSE UNOCCUPIED - TO BE REMOVED
D STRUCTURE TO BE REMOVED
E HOUSE HAS BEEN REMOVED
F STRUCTURE TO BE REMOVED
Source: J-U-B

PROSSER AIRPORT - S40
AIRPORT MASTER PLAN UPDATE 5-10
Chapter 1
IntroductionC
hapter 2 Existing C
onditionsC
hapter 3 Aviation Activity
Forecasts
Chapter 4
Facility Requirem
entsC
hapter 5 A
lternatives Analysis
Chapter 6
Phased Developm
ent and C
ost Estimates
Chapter 7
Airport Layout Plan and D
rawings
FIGURE 5.5 ALTERNATIVE NO. 2B
Runway 8-26 3,451' x 60'
Approach Surface Slope 34:1 Approach Surface Slope 34:1
2 3 2
Old Inland Empire Highway
Nunn Road
Wine Country Road
South Steele Road
South Missim
er Road
4
476
4
3
1
5
5
Pavement to be Removed (Ultimate)
AB
D
C
EF
3000 600
SCALE IN FEET
N
TRUE
NOR
TH
Alternative No. 2BUltimate Design Standards Compliance With
GPS Approaches to Both Runway Ends
LEGEND
RUNWAY PROTECTION ZONERUNWAY SAFETY AREARUNWAY OBJECT FREE AREA
PROPERTY LINE
FUTURE APPROACH SURFACE
Alternative 2B Costs
# Improvement AIP WSDOT Port Unfunded Total
1 Close S. Steele Rd. Access \ RPZMemo $1,350 $0 $150 $0 $1,500
2Relocate Portion of Taxiway A to 240Feet (35 Feet wide, TDG2) $1,326,200 $34,900 $34,900 $0 $1,396,000
3 Remark Aprons, Tiedowns Removed $64,800 $0 $7,200 $0 $72,000
4 Lower \ Mitigate Obstructions $1,195,100 $31,450 $31,450 $0 $1,258,000
5Clear Current Property of Structures,Utility Lines $9,500 $0 $500 $0 $10,000
6Widen Runway to 75 Feet RelocateEdge Lighting $0 $0 $0 $682,000 $682,000
7Improve Runway and Taxiway SafetyAreas (TDG2) $0 $0 $0 $47,000 $47,000
Total: $2,596,950 $66,350 $74,200 $729,000 $3,466,500
FUTURE RUNWAY PROTECTION ZONEFUTURE RUNWAY SAFETY AREAFUTURE RUNWAY OBJECT FREE AREA
DESIGN AIRCRAFT
7:1 Transitional Surface7:1 Transitional
End
of R
wy80 Foot Tree Clear at 1,800 Feet From Runway End
(with no ground elevation change)2,920 Feet
200 Feet BeyondRunway End
(Primary Surface)
810 Feet
80 Foot Tree Clear at 810 feet From Runway ℄(with no ground elevation change)
500' Primary Surface
80 F
oot
Tree
Example Cross Section View: Primary and Transitional Surface Clearance
Example Profile View: Approach Surface Clearance
℄
Surface
34:1 Approach Surface
34:1 Approach Surface
B-II
80 F
oot
Tree
RUNWAY APPROACH SURFACE
STRUCTURES TO BE REMOVED
# DESCRIPTION
A STRUCTURE TO BE REMOVED
B HOUSE UNOCCUPIED - TO BE REMOVED
C HOUSE UNOCCUPIED - TO BE REMOVED
D STRUCTURE TO BE REMOVED
E HOUSE HAS BEEN REMOVED
F STRUCTURE TO BE REMOVED
Source: J-U-B

PROSSER AIRPORT - S40
AIRPORT MASTER PLAN UPDATE 5-11
Chapter 1
IntroductionC
hapter 2 Existing C
onditionsC
hapter 3 Aviation Activity
Forecasts
Chapter 4
Facility Requirem
entsC
hapter 5 A
lternatives Analysis
Chapter 6
Phased Developm
ent and C
ost Estimates
Chapter 7
Airport Layout Plan and D
rawings
FIGURE 5.6 ALTERNATIVE NO. 2C
Runway 8-26 3,451' x 60'
Approach Surface Slope 34:1Approach Surface Slope 34:1Widen to 75' Runway Width
2 3
1
2
549' Runway ExtensionOld Inland Empire Highway
Nunn Road
Wine Country RoadSouth Steele Road
South Missim
er Road
4769
4
3
5
5
8Pavement to be Removed (Ultimate)
AB
D
C
EF
3000 600
SCALE IN FEET
N
TRUE
NOR
TH
Alternative No. 2CUltimate Design Standards Compliance WithGPS Approaches to Both Runway Ends And
Westerly Runway Extension to 4,000 Feet
LEGEND
RUNWAY PROTECTION ZONERUNWAY SAFETY AREARUNWAY OBJECT FREE AREA
PROPERTY LINE
FUTURE APPROACH SURFACE
Alternative 2C Costs
# Improvement AIP WSDOT Port Unfunded Total
1 Close S. Steele Rd. Access \ RPZMemo $1,350 $0 $150 $0 $1,500
2Relocate Portion of Taxiway A to 240Feet (35 Feet wide, TDG2) $1,326,200 $34,900 $34,900 $0 $1,396,000
3 Remark Aprons, Tiedowns Removed $64,800 $0 $7,200 $0 $72,000
4 Lower \ Mitigate Obstructions $1,195,100 $31,450 $31,450 $0 $1,258,000
5Clear Current Property of Structures,Utility Lines $9,500 $0 $500 $0 $10,000
6Widen Runway to 75 Feet, RelocateEdge Lighting $0 $0 $0 $682,000 $682,000
7Improve Runway and Taxiway SafetyAreas (TDG2) $0 $0 $0 $47,000 $47,000
8Acquire Fee \ Easement Land(2 Partial) (8.4 Acres), Clear Surface $0 $0 $0 $966,000 $966,000
9Extend Runway (75 Feet Wide) AndTaxiway (35 Feet Wide) 549' to theWest
$750,500 $19,750 $19,750 $0 $790,000
Total: $3,347,450 $86,100 $93,950 $1,695,000 $5,222,500
FUTURE RUNWAY PROTECTION ZONEFUTURE RUNWAY SAFETY AREAFUTURE RUNWAY OBJECT FREE AREA
DESIGN AIRCRAFT
7:1 Transitional Surface7:1 Transitional
End
of R
wy80 Foot Tree Clear at 1,800 Feet From Runway End
(with no ground elevation change)2,920 Feet
200 Feet BeyondRunway End
(Primary Surface)
810 Feet
80 Foot Tree Clear at 810 feet From Runway ℄(with no ground elevation change)
500' Primary Surface
80 F
oot
Tree
Example Cross Section View: Primary and Transitional Surface Clearance
Example Profile View: Approach Surface Clearance
℄
Surface
34:1 Approach Surface
34:1 Approach Surface
B-II
80 F
oot
Tree
RUNWAY APPROACH SURFACE
FUTURE PROPERTY LINE
STRUCTURES TO BE REMOVED
# DESCRIPTION
A STRUCTURE TO BE REMOVED
B HOUSE UNOCCUPIED - TO BE REMOVED
C HOUSE UNOCCUPIED - TO BE REMOVED
D STRUCTURE TO BE REMOVED
E HOUSE HAS BEEN REMOVED
F STRUCTURE TO BE REMOVED
Source: J-U-B
AIRPORT MASTER PLAN UPDATE 5-12
PROSSER AIRPORT - S40C
hapter 1 Introduction
Chapter 2
Existing Conditions
Chapter 3
Aviation Activity Forecasts
Chapter 4
Facility Requirem
entsC
hapter 5 A
lternatives Analysis
Chapter 6
Phased Developm
ent and C
ost Estimates
Chapter 7
Airport Layout Plan and D
rawings
5.8 ALTERNATIVE NO. 5 SERIES: LANDSIDE DEVELOPMENT
The alternatives analysis now shifts to accommodation of future hangars, apron, aviation businesses while also considering auto access and generalized landside configurations. Development areas for aviation and non-aviation purposes are planned for each alternative.Examples of compatible on–airport and off-airport aviation-related land uses include:
1. General Aviation Terminal/Ramp2. Corporate Aviation Terminal/Ramp3. Air Cargo4. Aircraft Maintenance and Support5. Aircraft Rescue and Structural Firefighting6. On-Field Agricultural/Agricultural Lease7. Aviation-Related Light Industrial
a. Parts Manufacturing and Assembly b. Flight Simulatorc. Defense Contractord. Aerial Photography/Photogrammetrye. Aerial Spray
8. Fixed Base Operation (FBO)a. Aircraft Charter, Storage, Salesb. Aircraft Repair and Washc. Pilot Suppliesd. Pilot Lounge, Flight Planninge. Flight Trainingf. Food Services/Cateringg. Office/Overnight Accommodationsh. Restrooms
9. Aircraft Storagea. T-hangarb. Executive Hangarc. Mixed-Use Hangard. T-Shade
10. US Government a. Militaryb. Air Traffic Controlc. Navigational Aids
d. Homeland Securitye. Public Safety and Emergency Facilitiesf. Weather Collection and Disseminationg. Satellite Communications
Examples of non-aviation related land uses which are generally compatible off-airport, and at a distance from the airport vicinity include:1. Postal Annex2. Telecommunications Facilities3. Greenhouses4. Auto Mall/Large-Scale Retail5. Rental Car Ready Return/Storage6. Auto/Boat Storage and Mini-Storage7. Light and Heavy Manufacturing8. Warehousing/Storage9. Data Storage10. Recreational; Fields and Golf Course11. Hotel/Motel12. Support/Regional Businesses including Bank,
Convenience, Restaurant, Coffee/SnackTwo development areas are considered. These are around the main apron and around the east apron. Planned development around the east apron has been considered in the past and is, for the most part, set with an in-fill of hangars to maximize the area of development. Although the 20-year period of this planning is the primary focus with respect limits of time for planned development, FAA permits project documents and generalized planning and discussion to cover up to 50 year’s worth development. In short, landside facilities to accommodate more demand than anticipated in the forecasting portion of this planning will be shown. Specific aims for landside configuration planning include:
1. Plan land uses and propose facilities which will meet anticipated demand, and which will also allow for continued demand accommodation in case regional economic activity is more robust than anticipated.
2. Plan land uses and propose facility locations which will allow the Airport to continue its financial self-sufficiency.
There are two configurations. With respect to the main apron are, the first configuration is geared towards more ground-leased box hangars and the second is more towards ground-leased T-hangars. Two refinements of these configurations, the ‘B’ depictions show airspace

AIRPORT MASTER PLAN UPDATE 5-13
PROSSER AIRPORT - S40C
hapter 1 Introduction
Chapter 2
Existing Conditions
Chapter 3
Aviation Activity Forecasts
Chapter 4
Facility Requirem
entsC
hapter 5 A
lternatives Analysis
Chapter 6
Phased Developm
ent and C
ost Estimates
Chapter 7
Airport Layout Plan and D
rawings
clearance and setback for GPS approach procedures. This setback is here considered to visualize the on-the-ground impacts from protecting for the ultimate design standards with the GPS instrument approach as shown in Alternatives 2B and 2C. The Runway 26 RPZ and FAR Part 77 Approach Surfaces are shown. The ‘A’ Configuration shown standards and setback for continued visual operation while the ‘B’ Configurations show standard and setback for the ultimate design standards with the GPS instrument approach. The Automated Weather Observing System (AWOS) wind sensor is should remain clear of building or other objects which could interfere with weather recording. A curved 500-foot line demarks east of the main apron shows an approximation of a no build zone. Moving this unit is not currently FAA-eligible and would be at a 100 percent cost to the Port.The Non-Aviation Industrial Area to the east of the development areas is Port of Benton property not associated with the Prosser Airport.The numerals “1” and “2” are found on various taxilanes, these indicate the design group for which the taxiway is able to accommodate, given building proxmities. Brief descriptions of the each of the configuration and refinements follows.
5.8.1 LANDSIDE CONFIGURATION NO. 1A: SETBACK FOR VISUAL OPERATIONSLandside Configuration No. 1A shows the first landside configuration with the following in the Terminal Area:
1. In-fill box hangar development area around the east apron development area
2. Two larger hangar for business operations, potentially an FBO or two
3. Helicopter operations and parking areas adjacent to the main apron
4. Access to the planned box hangar development area adjacent to the Non-Aviation Industrial Area is limited
5. New access roads from Nunn Road for T-hangar development
5.8.2 LANDSIDE CONFIGURATION NO. 1B: SETBACK FOR GPS APPROACHLandside Configuration No. 1B shows the second landside configuration and includes the following development within the Terminal Area:
1. In-fill box hangar development area around the
east apron development area. Hangar access for those adjacent to the Non-Aviation Industrial Area must be not be north to connect to apron. Aircraft must access the airfield between the two existing hangars with a Group I separation. This is because of the GPS Approach surface and RPZ proximity which is enlarged from the visual setback. As a consequence, hangar development should be planned with hangar doors less than 49 feet wide.
2. Similarly, the east apron must either be closed, or marked as non-movement area due to the proximity of the setback.
3. Chapter 3 of this document, the forecasting efforts anticipates more based helicopter and helicopter operations. The southern-most main apron is tie-down becomes helicopter parking.
4. New access roads from Nunn Road for hangar development near the Non-Aviation Industrial area and the Main Apron.
5. This configuration, like the prior does not show T-hangars for aircraft storage facilities. Box hangars are a good choice if space is not constrained and user preference is for larger, individual storage spaces. Box hangars are a less efficient use of ground, as compared to T-hangars, and return less money in the long-term.
5.8.3 LANDSIDE CONFIGURATION NO. 2A: SETBACK FOR VISUAL OPERATIONSLandside Configuration No. 2A shows the third landside configuration with the following in the Terminal Area:
1. In-fill box hangar development area around the east apron development area
2. Large-scale T-hangar development south and adjacent to the main apron
3. Helicopter operations and parking areas adjacent to the main apron
4. Access to the planned box hangar development area adjacent to the Non-Aviation Industrial Area is limited
5. New access roads from Nunn Road for T-hangar development
6. It is important to note that development for the last all alternatives could perhaps occur in phased manner over a 20-year period

AIRPORT MASTER PLAN UPDATE 5-14
PROSSER AIRPORT - S40C
hapter 1 Introduction
Chapter 2
Existing Conditions
Chapter 3
Aviation Activity Forecasts
Chapter 4
Facility Requirem
entsC
hapter 5 A
lternatives Analysis
Chapter 6
Phased Developm
ent and C
ost Estimates
Chapter 7
Airport Layout Plan and D
rawings
5.8.4 LANDSIDE CONFIGURATION NO. 2B: SETBACK FOR GPS APPROACHLandside Configuration No. 2B shows the final landside configuration and includes the following development within the Terminal Area:
1. In-fill box hangar development area around the east apron development area. Hangar access for those adjacent to the Non-Aviation Industrial Area must be not be north to connect to apron. Aircraft must access the airfield between the two existing hangars with a Group I separation. This is because of the GPS Approach setback. As a consequence, hangar development should be planned with hangar doors less than 49 feet wide.
2. Similarly, the east apron must either be closed, or marked as non-movement area due to the proximity of the setback.
3. The southern-most main apron is tie-down becomes helicopter parking.
4. New access roads from Nunn Road for T-hangar development.
5. This configuration, like the prior shows T-hangars and the primary aircraft storage facilities on the main apron. T-hangars are a good choice if space is constrained and user preference is for smaller, individual storage spaces, as opposed to multiple aircraft in the same space. T-hangar are a more efficient use of ground, are generally more expensive to build with larger upfront costs and generally return more revenue to owner in the longer-term.

PROSSER AIRPORT - S40
AIRPORT MASTER PLAN UPDATE 5-15
Chapter 1
IntroductionC
hapter 2 Existing C
onditionsC
hapter 3 Aviation Activity
Forecasts
Chapter 4
Facility Requirem
entsC
hapter 5 A
lternatives Analysis
Chapter 6
Phased Developm
ent and C
ost Estimates
Chapter 7
Airport Layout Plan and D
rawings
FIGURE 5.7 ALTERNATIVE NO. 3A
Nunn Road
Main ApronApron
Taxiway A
Non-AviationIndustrial
Area
Relocated Taxiway A
FBOFBO?
AWO
SC
ritic
al A
rea
WineCountry RoadApproach Surface 20:1
Fuel
Fuel
Nunn Road
Main ApronApron
Taxiway A
Non-AviationIndustrial
Area
Relocated Taxiway A
FBOFBO?
AWO
SC
ritic
al A
rea
WineCountry Road
Approach SurfaceSlope 34:1
Fuel
Fuel
1000 200
SCALE IN FEET
N
TRUE
NOR
TH
Setback for Visual OperationsLandside Configuration No. 1A
Setback for GPS ApproachesLandside Configuration No. 1B
1000 200
SCALE IN FEET
N
TRUE
NOR
TH
LEGENDFUTURE BUILDING/HANGAR
FUTURE PAVEMENTFUTURE ACCESS ROAD / PARKING
LEGEND
FUTURE BUILDING/HANGAR
FUTURE PAVEMENTFUTURE ACCESS ROAD / PARKING
I
HELOS
HEL
OS
Non-Movement Area
DESIGN GROUP
I II DESIGN GROUP
I
II I
I I
II
I II
II
II I
I I
Source: J-U-B

PROSSER AIRPORT - S40
AIRPORT MASTER PLAN UPDATE 5-16
Chapter 1
IntroductionC
hapter 2 Existing C
onditionsC
hapter 3 Aviation Activity
Forecasts
Chapter 4
Facility Requirem
entsC
hapter 5 A
lternatives Analysis
Chapter 6
Phased Developm
ent and C
ost Estimates
Chapter 7
Airport Layout Plan and D
rawings
FIGURE 5.8 ALTERNATIVE NO. 4A
Nunn Road
Main ApronApron
Taxiway A
Non-AviationIndustrial
Area
Relocated Taxiway A
WineCountry RoadApproach Surface 20:1
AWO
SC
ritic
al A
rea
FBO
Nunn Road
Main ApronApron
Taxiway A
Non-AviationIndustrial
Area
Relocated Taxiway A
WineCountry Road
Approach SurfaceSlope 34:1AW
OS
Crit
ical
Are
a
FBO
1000 200
SCALE IN FEET
N
TRUE
NOR
TH
Setback for Visual OperationsLandside Configuration No. 2A
Setback for GPS ApproachesLandside Configuration No. 2B
1000 200
SCALE IN FEET
N
TRUE
NOR
TH
LEGENDFUTURE BUILDING/HANGAR
FUTURE PAVEMENTFUTURE ACCESS ROAD / PARKING
LEGEND
FUTURE BUILDING/HANGAR
FUTURE PAVEMENTFUTURE ACCESS ROAD / PARKING
HELOS
HEL
OS
Non-Movement Area
DESIGN GROUP
DESIGN GROUP
I
I II
I
II I
I I
II
I II
II
II I
I I
Source: J-U-B

AIRPORT MASTER PLAN UPDATE 5-17
PROSSER AIRPORT - S40C
hapter 1 Introduction
Chapter 2
Existing Conditions
Chapter 3
Aviation Activity Forecasts
Chapter 4
Facility Requirem
entsC
hapter 5 A
lternatives Analysis
Chapter 6
Phased Developm
ent and C
ost Estimates
Chapter 7
Airport Layout Plan and D
rawings
5.9 SUMMARY
Overall, a selected course of action for the future represents the formulation of a development policy as much as the process of concept selection. Pursuant to the objectives identified in the introductory portion of this planning, scenarios will be evaluated based upon the following criteria:
1. Safety2. ‘Upfront’ Costs3. Ongoing Costs4. Airspace Design5. Off-Site Impacts6. Environmental7. Flexibility and Expandability 8. Revenue Generation9. Opportunities for Private Investment
10. Industrial/Business Park DevelopmentPort selection of an alternative, a configuration, or a combination thereof could be the basis for an updated Airport Layout Plan within the overall master planning context. Important to note at this point is that selection of an alternative or configuration does not necessarily mean it will happen just as envisioned. The intent is to visualize and create a 20-year ‘road’ map. The map then becomes a plan, and plans may change. The functional result of this type of airport planning, in many instances, is an expectation of change. Or more to the point, a plan which has remained unchanged over a given 10-year period has perhaps not been responsive to 10 years’ worth of community or economic growth. Also important to note is that the Port may update the Airport Layout Plan at any time, but FAA currently funds a more comprehensive Airport Master Plan Update every 10 years or so.Federal and state funding decisions for improvement for the Prosser Airport are not made exclusively based upon analyses herein or a Port decision as part of this planning. Funding decisions are made during the annual Capital Improvement Plan (CIP) process, with WSDOT Aeronautics with FAA as a close, active participant. Generally, for federal-funding participation, a given improvement or series of, must (this list is not exhaustive):
1. Be found on the approved Airport Layout Plan; that is, officially identified by the Port,
2. Be eligible, justified, reasonable and a priority
for federal funds, per FAA advisory circular or supplemental guidance,
3. Have an environmental determination pursuant to NEPA, and
4. Be funded, in an increasingly competitive general aviation funding environment.
More about these prerequisites is covered in the next chapter. Prior to evaluation a bit of clarification for, and description of each evaluation criteria, is perhaps helpful.
1. Safety in this context refers to design standards compliance and the ability to effectively provide obstruction disposition.
2. ‘Upfront’ Cost is referencing estimated costs to construct. These are found on each alternative.
3. On-going Costs are those recurring costs, such as preventive pavements maintenance designed to lengthen lifespan.
4. Airspace design relates to the ability of the Prosser Airport to operate without limitation and constraint from an airspace perspective.
5. Off-Site Impacts estimates the impacts of land acquisitions, overflights of adjacent or nearby areas and obstruction lowering.
6. Environmental estimates to the extent of the Prosser Airport’s impact of the local environment with respect to NEPA impact categories.
7. Flexibility and expandability relates to the ability of an alternative or configuration to accommodate various types of aviation activity seamlessly as the 20-year planning period progresses. Also, the ability of the Prosser Airport to operate without limitation and constraint is considered.
8. Revenue generation is the ability of the Prosser Airport to maximize its value for the Port and be financially self-sufficient.
9. Opportunities for private investment is the extent to which users or aviation businesses find opportunities to conduct business via ground leasing or via on-airport accommodations.
10. Industrial/Business Park Development refers to the ability of an alternative or configuration to accommodate existing and planned on-airport and off-airport aviation and non-aviation development.
Importantly, as can perhaps be seen this evaluation is (1) subjective and (2) not weighted. Port staff and leadership prerogative along with TAC perspectives and desires will ultimately instruct future development.

AIRPORT MASTER PLAN UPDATE 5-18
PROSSER AIRPORT - S40C
hapter 1 Introduction
Chapter 2
Existing Conditions
Chapter 3
Aviation Activity Forecasts
Chapter 4
Facility Requirem
entsC
hapter 5 A
lternatives Analysis
Chapter 6
Phased Developm
ent and C
ost Estimates
Chapter 7
Airport Layout Plan and D
rawings
The next few subsections discuss each evaluation criteria for the alternatives/configurations.SafetyEach alternative is crafted to be design standards compliant with relative ease of obstruction disposition. All alternatives and configurations are weighted equally as a consequence. This is the most important criteria for evaluation. ‘Upfront’ CostsAlternatives are considered more responsive with lower costs. Upfront planning-level cost estimates are shown on each alternative’s exhibit. As can be seen, the 1B and 1C, and the 2B and 2C alternatives are more costly than the 1A and 2A Alternatives. Thus, they are less responsive for this criterion. On-Going CostsAlternatives are considered more responsive with lower longer-term costs. The results here are similar to the ‘upfront’ costs criterion because future costs will be relatively larger as future facilities are constructed. In short, more pavements equals more pavements maintenance. Airspace Design and ConsiderationsEach alternative is crafted to be airspace standards-compliant with planned obstruction disposition. It is important to note that obstructions exist now, and will be created with all of the runway extension-related alternatives. Obstructions will be disposed of via lowering or lighting per FAA guidance. All alternatives are considered equal as a consequence, except the alternatives with GPS Approaches. These alternatives more meaningfully allow aircraft operation during periods of inclement weather and as a result make the airport more available to the flying public, especially to the business and charter flyer. Off-SiteImpactsThe alternatives which specify land acquisition associated with a runway extension and GPS instrument approaches are considered less responsive as they impact off-site. Environmental Upon Port staff review of Working Paper No. 2, environmental coordination will be completed. Coordination involves sending this chapter to select jurisdictional governmental agencies which may wish comment, not limited to state and federal agencies and Benton County. Known issues for consideration include proximity of homes and business near the runway ends and known environmental issues on aviation-related property planned for hangar development near the east apron. This area, known at the ‘Bonney Building’, or the ‘Milne Fruit Products Hagarty’ formally, is an older building on obligated airport property which is begin monitored.
This building formerly housed an aerial applicator aviation business. Wells were sunk to monitor pollutant levels, and monitoring continues in pursuit of FAA grant assurance compliance and hazardous waste and water quality impact categories. This facility is reporting every two years to the Environmental Protection Agency (EPA), via the Biennial Reporting (BR), used to inform the Resource Conservation and Recovery Act (RCRA) Hazardous Waste Report.Flexibility and ExpandabilityThis section and the next are somewhat related. Development depicted for configurations can, and is planned to be phased over time. Configurations are considered equal except the ‘B’ configurations, which show a constrained landside environment due to the necessary GPS Approach airspace clearances necessary for design standards compliance. Regardless, all configurations are made to accommodate forecast demand and to be as flexible as the airspace constraint will allow. Configurations 2A and 2B show T-hangar development which is a more efficient use of space with more aircraft storage in a given area. These configurations are more responsive if the desire is to accommodate a larger number of based or itinerant aircraft than forecast/ anticipated.Revenue GenerationFinancial self-sufficiency is a matter for grant assurance compliance and is foundational to this planning effort. It is for this reason that demand accommodation is considered in various forms for the short and long-term. Hangar ground lease revenue is sometimes a large component of revenue for a given general aviation airport. Future hangar construction can either be funded by the Port or by ground leasing. Configurations 2A and 2B shows T-hangar development potentially funded by the Port, and other configurations show ground-leased box hangar development by others. Upfront costs for ground leasing are relatively small while the long-term return is less, while the reverse is generally true for Box or T-hangars build by the Port. With respect to airside improvements, revenue will increase with a larger, more business aircraft capable airfield as envisioned with Alternative No. 2A, 2B and 2C. Opportunities for Private InvestmentOn-Airport ground leasing is a common practice at the Prosser Airport and may be an important part of its future. Additional land acquisition for hangar development is not necessary as the current land envelope is sufficient to accommodate forecast demand. The primary difference between the alternatives is a more constrained landside for GPS Approach clearances or a the ability

AIRPORT MASTER PLAN UPDATE 5-19
PROSSER AIRPORT - S40C
hapter 1 Introduction
Chapter 2
Existing Conditions
Chapter 3
Aviation Activity Forecasts
Chapter 4
Facility Requirem
entsC
hapter 5 A
lternatives Analysis
Chapter 6
Phased Developm
ent and C
ost Estimates
Chapter 7
Airport Layout Plan and D
rawings
to accommodate more based aircraft with T-hangar construction.Industrial/Business Park DevelopmentThe current Non-Aviation Industrial Area is maintained for all configurations. Configurations are deemed equally responsive in this regard.Beyond this, no aviation or non-aviation industrial park is planned. The development envelope, found between the AWOS critical area and the Non-Aviation Industrial Area is entirely visualized on exhibits for each configuration. Aviation-related development, specifically, hangars, aprons, and taxilanes fill the envelope.
5.10 TAC AND PORT PREROGATIVE
Information in this chapter will be coordinated with the TAC and open house will be held for user consideration. Following these consultations, a second meeting with the Port was held to solicit direction and selection for the future of the airport. This meeting will include constituent feedback from the open house and staff recommendation.Discussion thus far in the planning process has focused on selecting Alternative No. 1A, and perhaps 1C after an exploration of the impacts. Discussion has also focused on protecting for Alternatives No. 2C as perhaps an ultimate development, recognizing that federal grant-in-aid funding is not currently available for most of the items in this alternative. This financial constraint is defining given the amount of development dollars. Protecting the airfield for ultimate development as visualized for Alternatives 2A, 2B and 2C clearly have direct impacts to properties near runway ends and the landside. The trade-off between protecting for the larger, faster and heavier business aircraft and their potential economic impact for the community and the on-the-ground consequences of that protection will be discussed in the sponsor consultations, Port staff briefings and before the Port Commission.
AIRPORT MASTER PLAN UPDATE 6-1
PROSSER AIRPORT - S40C
hapter 1 Introduction
Chapter 2
Existing Conditions
Chapter 3
Aviation Activity Forecasts
Chapter 4
Facility Requirem
entsC
hapter 5 Alternatives Analysis
Chapter 6
Phased Developm
ent and C
ost Estimates
Chapter 7
Airport Layout Plan and D
rawings
6.0 INTRODUCTION
Capital improvements and preventive maintenance at the Prosser Airport are scheduled for three successive time periods: Phase I: 2019–2023; Phase II: 2024–2028; and Phase III: 2029–2038. The following sections describe and depict the various improvements, by phase, along with an estimated cost for each item. Development items are shown on three exhibits within the text. The recommended phasing is not set in stone and changes in aviation demand, the Port’s perspective, grant funding or area economics may alter proposed improvement timing or composition. Estimates were developed using historical year (2017) costs. Each figure represents an estimate of total project cost. Estimates include construction, engineering, administration, testing, surveying, and legal expenses. It should be noted that these estimates are order of magnitude accurate for planning purposes, based upon area bid tabulations. A 25% contingency amount is added to anticipate unforeseen circumstances. This approach reduces the chance of budget surprises when a more detailed investigation and design is initiated. Cost estimates should be reviewed and updated as necessary to account for technological improvements, changes in the economy, future construction innovations, and/or changes in local conditions. These costs constitute an unconstrained, yet reasonable, estimate of future airport needs. The exhibit tables identify FAA, State, Port and other funding participation. The Airport Improvement Program, Non-Primary Entitlement (AIP NPE) columns approximate the current FAA entitlement funding for the Prosser Airport of up to $150,000 annually. The Port of Benton, as sponsor of the Prosser Airport is assigned this entitlement funding given the activity levels at the Airport and its participation in FAA’s National Plan of Integrated Airport Systems (NPIAS). These dollars are 90% grant funding. The FAA Unfunded columns on the Intermediate and Long-Term Exhibits shows the desired level of capital improvement and necessary funding for the unconstrained demand identified by the planning process thus far. The planning process has revealed the sponsor’s desire for capital improvements beyond that which can be accommodated by current FAA entitlement funding for the Prosser Airport. The purpose of this column is to identify unconstrained capital improvements and funding while highlighting that these improvements exceed the permitted $150,000 annual entitlement. Other FAA grant funds are available, primarily from two sources within AIP funding formulae: FAA State
Apportionment (SA) and FAA Discretionary. FAA SA grant funds are those funds assigned to the state for general aviation airports according to a priority ranking. The National Priority Ranking (NPR) methodology assigns value to airports based upon activity and type of capital improvement. Projects are assigned to this column if they exceed the $150,000 annual entitlement, and/or they are not (perhaps yet) eligible for FAA funds based upon FAA guidance activity threshold guidance (as an example). The Washington State Department of Transportation (WSDOT), offers a partial grant program, often used to supplement and match FAA funding, generally 2.5 to 5 percent. WSDOT grant funding has a similar priority ranking mechanism for project evaluation. WSDOT requires the airport sponsor to match the remaining 5 percent for a total project funding; thus, FAA may provide 90 percent, WSDOT provides 5 percent and the final 5 percent of typical capital improvement project funding comes from Port of Benton funds. The Port participation column may be revenues that originate from the operation of the Airport or from general funds. This column identifies the above 5 percent matching funds or public funds for larger, generally revenue producing capital improvements that do not meaningfully compete for FAA or WSDOT grant dollars. Finally, the Other column identifies capital improvement projects, generally aircraft storage facilities, that are constructed with private funds and are often for a private or business use. This includes general aviation or corporate hangar development, along with aviation business, aviation companies or individuals that wish to make an investment in the airport. These types of developments are generally not eligible for FAA or WSDOT funding.
6.1 SHORT-TERM IMPROVEMENTS
During this phase, several minor development and improvement items are planned to provide for safe and efficient airport operations and to allow for planned development. The Short-Term Improvements will be roughly in line with the current Airport Capital Improvement Plan (ACIP). The following descriptions accompany the exhibit on upcoming pages.
1. 2019; East End Hangar Taxilane (Design/Bidding)Up front facilities for demand accommodation is the first project envisioned for the master plan. Immediate tenancy and ground leasing is expected for four (4) new hangars along the east end taxiway. Two (2) of these hangar need to
CHAPTER 6 - PHASED DEVELOPMENT

AIRPORT MASTER PLAN UPDATE 6-2
PROSSER AIRPORT - S40C
hapter 1 Introduction
Chapter 2
Existing Conditions
Chapter 3
Aviation Activity Forecasts
Chapter 4
Facility Requirem
entsC
hapter 5 Alternatives Analysis
Chapter 6
Phased Developm
ent and C
ost Estimates
Chapter 7
Airport Layout Plan and D
rawings
access the airfield with TDG1a standards with hangar door width not greater than 49’.
2. 2020 NPE Funds Carry3. 2020; Remove Lower Trees Underlying 20:1
Runway8Approach;Off-AirportPort staff has been working with adjacent property owners for several years to bring this portion of land adjacent to the airport into design standards compliance. This tree lowering activity is a continuation of that work.
4. 2020; Lower Powerlines Along Old Inland Empire Highway Overhead utility lines are found adjacent to obligated airport property on the north side of the field, within the Old Inland Empire (OIE) Highway Right-of-Way. These poles represent a minimal penetration of the FAR Part 77 Transition Surface. Lowering in place is preferable, but at a minimum installation of red solar-lit obstruction lighting for each pole as the planned obstruction disposition. The Port of Benton has been working with the City of Prosser for future lowering of these power lines. The City of Prosser recently requested a utility easement as a first step. The Port will continue to work with the City.
5. 2020; Improve Pilot Lounge in Existing FBO Hangar on East ApronThe current pilot lounge has aged past its useful life and facilities are not adequate for the level of customer service required by the Port. This project considers expanding the existing pilot lounge reception area for the traveling public while the terminal relocation for the primary facility is being planned.
6. 2021; East End Hangar Taxilane (Construction Only)Up front facilities for demand accommodation is the first project envisioned for the master plan and the sixth for actual construction.
7. 2022; Lower/Replace Trees Between ApronsTrees along the flight line between the aprons have become an obstruction to FAR Part 77 7:1 airspace for both the current visual operating environment and the proposed helipads. These trees should be lowered or removed and replacement trees should be planted farther away from the runway. Tree species should be selected that have limited overall growth heights, so as to not become an obstruction in the future. This would also prepare the area for the next planned capital improvement project.
8. 2022; Construct Helipads (2), Access Road andAirfieldPavementRehab,CrackSeal/FogSeal (Design Only) Desire has been expressed by planning project stakeholders to make a formal area for helicopter operations. The forecasting conducted for this planning anticipates more robust helicopter activity, for both permanently based and itinerant helicopters. Collocation of fixed-wing and rotary aircraft has proven problematic at other airports and these types of craft are best segregated. Given the relatively large costs to relocate the terminal function and the uncertainty of the actual timing of the move, helipads are planned for the area between the two aprons. This permits ease of access regardless of terminal function location. Gated pedestrian and auto access to the helipads is adjacent to but does not interfere with fixed-wing activity on the main apron. Auto/user access to this area from Nunn Road outside any apron Object Free Areas to Nunn Road is planned. A recent review of the airport’s existing pavement conditions reveals the slurry seal and seal coating work performed in 2015 is holding up well. Based on a typical lifespan of 7-10 years for a slurry seal, the field is due for pavement maintenance at this time. This project will involve crack sealing all pavements, with a slurry seal of Runway 8/26, seal coating of all taxiways, taxilanes, and aprons, and new pavement markings.
9. 2023; Construct Helipads (2), Access Road andAirfieldPavementRehab,CrackSeal/FogSeal (Bidding and Construction) The previous year’s project goes from design to bidding and construction in this year.
10. 2023; Airport Business Plan WSDOT recently (2017) promulgated its updated Airport System Plan Update. One of the new requirements is for creation of a formal airport business plan.
11. 2018-2023; Ground Lease: (5) Executive Hangars Desire has also been expressed by planning project stakeholders to make areas available for executive (box) hangar ground leasing. A few different sites around the east apron hangar area are available and identified for leasing should demand materialize. It is unknown when a specific lessor will materialize, so the 5-year

AIRPORT MASTER PLAN UPDATE 6-3
PROSSER AIRPORT - S40C
hapter 1 Introduction
Chapter 2
Existing Conditions
Chapter 3
Aviation Activity Forecasts
Chapter 4
Facility Requirem
entsC
hapter 5 Alternatives Analysis
Chapter 6
Phased Developm
ent and C
ost Estimates
Chapter 7
Airport Layout Plan and D
rawings
range is specified, with the ability to accommodate during any given year. Note that the eastern-most location is outside the Bonnie Hangar area of environmental concern.Figure 6-1; Short-Term Improvements (2019-2023) depicts items numerically tabulated and referenced in plan view, totaling:
FAA NPE: $750,000 FAA Unfunded: $420,800 WSDOT: $57,222 Port: $287,778 Totals $1,515,000

PROSSER AIRPORT - S40
AIRPORT MASTER PLAN UPDATE 6-4
Chapter 1
IntroductionC
hapter 2 Existing C
onditionsC
hapter 3 Aviation Activity
Forecasts
Chapter 4
Facility Requirem
entsC
hapter 5 Alternatives Analysis
Chapter 6
Phased Developm
ent and C
ost Estimates
Chapter 7
Airport Layout Plan and D
rawings
FIGURE 6-1 SHORT-TERM IMPROVEMENTS
Runway 8-26 3,451' x 60'
Old Inland Empire Highway
Nunn Road
Wine Country Road
Sout
h St
eele
Roa
d
Sout
h M
issi
mer
Roa
d
8 9
8
9
1
6
4
3
3
3 5
7
11
118 9
Short-Term ImprovementsProsser Airport (S40) Years 2019-2023
3000 600
SCALE IN FEET
N
TRUE
NOR
TH
LEGENDPROPERTY LINESHORT-TERM IMPROVEMENTS
Figure 6-1
Source: J-U-B

AIRPORT MASTER PLAN UPDATE 6-5
PROSSER AIRPORT - S40C
hapter 1 Introduction
Chapter 2
Existing Conditions
Chapter 3
Aviation Activity Forecasts
Chapter 4
Facility Requirem
entsC
hapter 5 Alternatives Analysis
Chapter 6
Phased Developm
ent and C
ost Estimates
Chapter 7
Airport Layout Plan and D
rawings
6.2 INTERMEDIATE-TERM IMPROVEMENTS
During this intermediate, phase the focus shifts to more substantial capital improvements for airfield improvements to accommodate FAA standards for a planned instrument approach procedure, including with apron/hangar changes and possible terminal relocation. The following descriptions accompany the tables and the exhibits on upcoming pages.
1. 2024-2028; Ground Lease: Lots for Executive Hangars Desire has been expressed by planning project stakeholders to make an area available for executive (box) hangar ground leasing. A few different sites around the east apron hangar area are available, and identified for leasing should demand materialize. It is unknown when a specific lessor will materialize, so the 5-year range of years is specified, with the ability to accommodate during any given year. A final fourth ground lease spot for a much larger (up to 120 feet by 150 feet) would also available on the main apron. Environmental concerns associated with this project are likely to be minimal as the proposed actions would take place in areas on the Airport property that are adjacent to existing Airport development. Some of this work will need to be done in conjunction with Project #12.
2. 2024; Environmental Assessment of Intermediate Projects for Instrument ApproachEach capital improvement on the airfield, regardless of FAA/WSDOT financial participation, requires an environmental evaluation and clearance. This project considers clearance for all the projects necessary for design standards compliance for a straight-in instrument approach to any runway end. Given that the majority of the project improvements that will be evaluated in this EA would occur on Airport property in previously developed or disturbed areas, potential environmental impacts are likely to be minimal. Resources of concern that will be evaluated during the environmental assessment include hazardous materials, noise, sensitive species and visual impacts, among others. The environmental documentation process will be coordinated with and overseen by FAA to meet the requirements of the FAA AIP eligibility and grant funding.
3. 2024; T- Hangar (6-Units) East Side and Adjacent Pavements (Design/Construction)Desire has been expressed by planning project stakeholders to make an area available for
T-Hangar ground leasing. This is one of two sites for T- Hangar development. Some of this work will need to be done in conjunction with Project #12.
4. 2025; Borrow Ahead From EA in 20245. 2024; Improve Nunn Road, Curb/Gutter
Beyond Main Apron, Extend Utilities to GA Terminal AreaThis landside project is a next step in a sequence of projects to ready the airport for the IAP and the relocated terminal area. This portion of Nunn Road has steep sides down to the ditches, is narrower than the remainder of road, and is a different service level. Given that utilities would then be in place, improved auto access to the main apron follows, then building an access construction. While the planned IAP will permit the Prosser Airport to more meaningfully participate in the national and regional airspace and airport systems, and will allow the flying public access to the Airport during some periods of inclement weather, there are some notable on the ground consequences of this action. With the IAP, the FAR Part 77 Primary Surface would widen from 250 feet to 500 feet in total width. The FAR Part 77 7:1 Transitional Surface would emanate from the widened edges of the Primary Surface. On the ground design to clear obstructions (including parked aircraft) for this new IAP airspace should be completed. In order to clear parked aircraft tail heights on the eastern apron with the planned IAP airspace, the entirety of the eastern apron would become unusable to parked aircraft. Thus, (1) design and planning must accommodate parked aircraft on the main apron and (2) consequently, the terminal function should be relocated to the main apron given the lack of future activity. The first step to relocation is readying the new terminal apron location. Two sites naturally accommodate a future terminal area and front the main apron. However, neither site currently has access to utilities. Extension of sub-surface utilities is the first of a few actions required to move the terminal function to a more operationally-effective location.
6. 2024; Construct GA Terminal Access/Parking/ Fencing, Apron ExpansionThe planning process reveals that the business community continues to see an influx of visitors related to the ever-increasing wine and fruit market. Tasting rooms and well-appointed facilities await these consumers throughout the immediate Prosser area. Feedback from the

AIRPORT MASTER PLAN UPDATE 6-6
PROSSER AIRPORT - S40C
hapter 1 Introduction
Chapter 2
Existing Conditions
Chapter 3
Aviation Activity Forecasts
Chapter 4
Facility Requirem
entsC
hapter 5 Alternatives Analysis
Chapter 6
Phased Developm
ent and C
ost Estimates
Chapter 7
Airport Layout Plan and D
rawings
planning project stakeholders has revealed that the airport could fill an important role, given that it is the front door to the area for the flying public. Current reception facilities for the airport visitors were deemed inadequate for this purpose. This capital improvement will build the access road and auto parking, finish perimeter/security fencing to improve the GA terminal facility. Environmental resource concerns for this project are likely to be minimal given the existing built environment of the project area and the adjacent Airport development.
7. 2024; Construct GA/FBO Terminal on Main Apron, Relocate FuelPlanned terminal facilities include well-appointed, non-wildlife attractant landscaping (per FAA guidance), with meeting rooms, pilot facilities and lease area within. It is possible that these can coexist with a traditional 80 foot by 100 foot hangar as is depicted on the exhibit. But, this is not prerequisite. This decision, which will be made at the time, is primarily centered around the fact that a well-heeled visitor will likely wish to park her multi-million dollar aircraft in a close-by hangar. Future airspace constraints required a redesign of aircraft parking. In order to maintain the appropriate number of parking spots the Apron needs to be expanded toward the West. Relocated self-fueling facilities, dispensing both piston and turbine fuels are planned near the terminal area with a fueling island on the apron. The relocation of the fueling system will require an environmental evaluation of hazardous materials concerns including potential soil contamination and cleanup associated with the existing system and containment/spill prevention requirements associated with the relocated system.
8. 2024; Install New Beacon, Vault/Regulator/ GeneratorMany airfield electronic components have a useful service life of approximately 20 years. The current electrical vault is near the east apron and will be relocated with the terminal facilities. At this time, this equipment will have aged long past its useful service life and replacement should be considered, regardless. The airport currently does not have an emergency backup generator, and one should be acquired. Environmental considerations for this project will include an evaluation of the consumption of natural resources and new energy requirements associated with the proposed project.
9. 2024;ModificationtoFormerGATerminalFacilities/ Hangar Leases in Place.Given that the east apron will become unusable when the IAP and terminal facilities are relocated, there is little reason to keep the current terminal facilities, and this spot could be used for ground leasing. Executive (box) hangars could be sited in this area to generate both lease and fuel revenues. These facilities could front the apron, but might be better site in alignment with the other two planned hangars along the adjacent taxilane. Optionally the buildings could be reconfigured to access from the South and East side. A terminal or FBO could then operate out of this area. Noting that it would be with limited apron space.
10. 2025; Relocate Taxiway A for 240-Feet with MITL, New A4 Connector, Hold Bay, Mark East ApronThe westerly portion of the airfield features a runway-to-taxiway separation of 240 feet. This separation is in compliance with a B-II Non-Precision design standard. Forecasting for this planning revealed that this more demanding design standard is not currently FAA AIP eligible, but is desired by the airport sponsor. This capital improvement project, currently AIP unfunded, aims to continue the phased relocation to 240 feet. This first phase relocates Taxiway A from a 150-foot separation to a 240-foot separation from the western edge of the main apron to the 240-foot offset pavements. The current aligned connector taxiway access from the main apron across Taxiway A to the runway is disposed of with a new taxiway connector location. These relocated pavements are planned to be equipped with blue Medium Intensity Taxiway Lighting (MITL). The second and final phase relocates Taxiway A from a 150-foot separation to a 240-foot separation from the western edge of the main apron to the 240-foot offset pavements. The current beyond end connector taxiway access from the main apron across Taxiway A to the runway is disposed of with a new taxiway connector location at the runway end. These relocated taxiway pavements are planned to be equipped with blue Medium Intensity Taxiway Lighting (MITL). Improved surface grades are steep from the runway down to the apron and the current terminal building, and engineering design for this improvement may modify that shown in this planning. It is important to keep taxiway access

AIRPORT MASTER PLAN UPDATE 6-7
PROSSER AIRPORT - S40C
hapter 1 Introduction
Chapter 2
Existing Conditions
Chapter 3
Aviation Activity Forecasts
Chapter 4
Facility Requirem
entsC
hapter 5 Alternatives Analysis
Chapter 6
Phased Developm
ent and C
ost Estimates
Chapter 7
Airport Layout Plan and D
rawings
from the east apron hangars to the Runway 26 end no more than 2 percent. Finally, the main apron tie-down row nearest to the runway will be lost due to airspace proximity. The need to accommodate aircraft larger than Group I (up to 49-foot wingspans) suggests that a wholesale apron redesign for marking should be made. Environmental considerations associated with the relocation of Taxiway A would include an evaluation of visual impacts, ground disturbance impacts and associated construction impacts. There are currently no known sensitive resources in the area.
11. 2025; Publish Straight-In RNAV GPS Approach Procedures to Runway 8 and 26 endsA large amount of prerequisite capital improvements have been completed at this time in the planning to allow the appropriate on-the-ground design standards compliance and close-in obstruction disposition. The IAP then permits a more flexible and responsive operating environment for the flying public, while maintaining the prerequisite safe environment for aircraft operating in some inclement weather.
12. 2026; Construct Taxilane for East Side T-Hangar/Hangar AreaFAA makes AIP funding available for common-use taxilanes. In order to access additional lease area in the long-term, a 25-wide taxilane for Group I aircraft access is planned. Construction of the taxilane is likely to result in minimal environmental impacts as there are no known sensitive resources in the general project area.
13. 2027; Relocate North-Side Hangar to East Apron AreaTo minimize runway crossing in an uncontrolled (air traffic control tower) FAA discourages design which provides access from both sides of a runway for many general aviation airports. The current north side of the airport is minimally used, and is planned for closure. One hangar remains on this side of the field and should be relocated to main hangar area. This would happen at lease renewal or when instructed by FAA. Environmental considerations for this project are anticipated to be minimal given that there are no known sensitive resources in or adjacent to the area and the project is consistent with the adjacent built environment.
14. 2028; Pavement Maintenance: Main Apron/Taxilane on East Apron, Runway, Parallel/ConnectorsThis project is a recurring pavement preventive maintenance item needed to extend the useful airfield pavement life. Airfield pavements are the most expensive to fix given their size. Crack sealing will help prevent subsurface water infiltration and surface sealing will help offset life-shortening oxidation of the surface. Environmental impacts are typically minimal for maintenance projects.
Figure 6-2; Intermediate-Term Improvements (2024-2028) depicts these items numerically-tabulated and referenced in plan view, totaling:
FAA NPE: $1,050,000 FAA Unfunded: $4,101,900 WSDOT: $276,217 Port: $1,843,217
Totals $7,271,334

PROSSER AIRPORT - S40
AIRPORT MASTER PLAN UPDATE 6-8
Chapter 1
IntroductionC
hapter 2 Existing C
onditionsC
hapter 3 Aviation Activity
Forecasts
Chapter 4
Facility Requirem
entsC
hapter 5 Alternatives Analysis
Chapter 6
Phased Developm
ent and C
ost Estimates
Chapter 7
Airport Layout Plan and D
rawings
FIGURE 6-2 INTERMEDIATE-TERM IMPROVEMENTS
Runway 8-26 3,451' x 60'
Old Inland Empire Highway
Nunn Road
Wine Country RoadSo
uth
Stee
le R
oad
Sout
h M
issi
mer
Roa
d
6
7
146
1
10
1111
12
8
914
1
14
7
1
7
5
10
3
0
SCALE IN FEET
250 500
N
TRUE
NOR
TH
Intermediate-TermImprovements
LEGENDPROPERTY LINE
PAVEMENT TO BE REMOVED/CLOSED
SHORT-TERM IMPROVEMENTS
INTERMEDIATE-TERM IMPROVEMENTS
Prosser Airport (S40) Years 2024-2028
Figure 6-2
Source: J-U-B

AIRPORT MASTER PLAN UPDATE 6-9
PROSSER AIRPORT - S40C
hapter 1 Introduction
Chapter 2
Existing Conditions
Chapter 3
Aviation Activity Forecasts
Chapter 4
Facility Requirem
entsC
hapter 5 Alternatives Analysis
Chapter 6
Phased Developm
ent and C
ost Estimates
Chapter 7
Airport Layout Plan and D
rawings
6.3 LONG-TERM IMPROVEMENTS
During this long-term phase the focus is initially on a B-II standards compliance along with a westerly runway extension provided B-II is justified. Preventive maintenance is also woven through the final 10 years of the plan.The following descriptions accompany the tables and the exhibits on upcoming pages.
1. 2029-2038; Ground Lease: Lots for Executive Hangars Desire has also been expressed by planning project stakeholders to make an area available for executive (box) hangar ground leasing. A few final spots around the east apron hangar area are available, and identified for leasing should demand materialize in this final term. All lots are on property currently occupied by the Bonnie building. Since the proposed project is consistent with adjacent development and the project area has been previously disturbed there would likely be minimal environmental impacts.
2. 2029; Update Airport Master PlanThis master plan should be updated every so often. FAA makes AIP funds available every 10 years or so to update.
3. 2030; Environmental Assessment; RDC B-II/TDG 1B with Westerly Runway ExtensionAn Environmental Assessment would be completed to address a runway extension and upgrade of the existing facility to Runway Design Code (RDC) B-II. The Master Plan Update would demonstrate the need through existing and forecasted operations for the change in RDC. While the forecasting for this planning did not demonstrate that a threshold number (500 annual) of demanding aircraft operations are occurring to warrant FAA AIP eligibility for Runway Design Code (RDC) B-II Non-Precision standards, the airport sponsor has made it clear that planning to that end should be done regardless. Port staff has been instructed to document aircraft operators in upcoming years to evaluate if they arrive at the 500 mark, as activity is expected to increase. There are several steps and a series of capital improvement necessary for airport-wide design standards compliance and for a westerly runway extension. The Environmental Assessment would address resource impacts from the complete series of improvements that would be associated with the change to RDC B-II.
4. 2031; RDC B-II/TDG 1B with Westerly Runway Extension; Phase I; Design, Land, Fence, Obstructions
This first phase of the overall project is in some ways the preparatory work, prior to the runway and taxiway construction that will define the extension and design standards upgrade.
4a) Overall design should be done for all related improvements to consider upfront impacts. 4b) Fee land (or a to-the-ground easement, at a minimum) for Future Runway 8 Protection Zone (RPZ) properties should be acquired via the Uniform Act. This area approximates 8.4 acres and includes the entire future RPZ. 4c) New perimeter fence should surround the acquired properties and the remainder of properties not an already equipped with an 8’ tall chainlike fence. 4d) Lower trees in runway ends area for the close-in FAR Part 77 34:1 Instrument Approach Surface. This surface is shallower and wider than the existing surface.
Environmental concerns associated with this project will be addressed in the 2030 EA.
5. 2032; RDC B-II/TDG 1B with Westerly Runway Extension; Phase II; Paving, Marking, Lights, Landing Aids This second and final phase of the overall project is where the final plan takes shape with paving and finishing touches.
5a) Runway 8-26 pavements may have reached the end of their useful life and reconstruction may be necessary. It would be valuable to address this pavement’s condition at this point, within this overall project to minimize the number of closures and for best bid dollars. Similarly, the Runway’s Medium Intensity Runway Lighting (MIRL) System will be reaching is useful life end. This project could be completed concurrently with the next project. 5b) A 549-foot runway and parallel taxiway extension is planned to accommodate some aircraft during periods of hot weather and high density altitude, and/or with larger aircraft and robust payloads. Non-Eligibility (FAA AIP $) for the runway extension is much like that of that of the B-II design standards. Neither is currently eligible, but the Port will be monitoring and documenting activity as the time moves and demand grows. 5c) With the new runway and taxiway configurations, some airfield wide changes will be necessary. The Runway 8 end PAPI

AIRPORT MASTER PLAN UPDATE 6-10
PROSSER AIRPORT - S40C
hapter 1 Introduction
Chapter 2
Existing Conditions
Chapter 3
Aviation Activity Forecasts
Chapter 4
Facility Requirem
entsC
hapter 5 Alternatives Analysis
Chapter 6
Phased Developm
ent and C
ost Estimates
Chapter 7
Airport Layout Plan and D
rawings
and REIL systems will require relocation/replacement, hold line signage panel replacement will be necessary, and a supplemental Runway 8 wind cone should be provided. 5d) The IAP will need to be updated, landing aids flight checked, and Airport Geographic Information System (AGIS) survey completed to update FAA‘s databases.
Environmental concerns associated with this project will be addressed in the 2030 EA.
6. 2034; Reconstruct Portion of Main Apron for Strength, Rehabilitate RemainderA sufficient number of peak period aircraft operation cycles on the apron pavements is anticipated in the long-term to bring a premature end to the pavement life. A portion of this apron should be reconstructed with hardstands to minimize damage and the remainder of the apron should have a crack seal and seal coat with a re-marking. This rehabilitation project is likely to have minimal impacts to the environmental resources.
7. 2035; Preventive Maintenance; Main Apron, East Apron Taxiway, Runway and Parallel ConnectorsThis project is a recurring pavement preventive maintenance item needed to extend the useful airfield pavement life. Airfield pavements are the most expensive to fix given their size. Crack sealing with help prevent subsurface water infiltration and surface sealing with help life-shortening oxidation of the surface. Maintenance projects such as this one typically have limited environmental concerns.
8. 2036; Construct Helipads (4) and Access RoadThe forecasting done for this planning anticipates more robust helicopter activity, for both permanently based, and for helicopters that come and go. Four additional helipads are planned for the area between the two aprons. This permits ease of access regardless of terminal function location. The environmental evaluation for this project will include an assessment of noise impacts. Environmental concerns are likely to be limited given the location of the proposed project.
9. 2038; Construct T-Hangar (6-Unit) East Side and Adjacent Pavements Desire has been expressed by planning project stakeholders to make an area available for T-Hangar ground leasing. With the Bonney Building environmental mitigation complete, this second and final spot for a T-Hangar area is available to Group I (Up to 49-foot wingspans only) access.
Environmental concerns in this area should be limited due to the environmental mitigation that is currently required for the area.
Figure 6-3; Long-Term Improvements (2029-2038) depicts these items numerically-tabulated and referenced in plan view, totaling:
FAA NPE: $1,500,000 FAA Unfunded: $6,090,783 WSDOT: $196,025 Port: $221,025 Others: $350,000
Totals $8,507,833

PROSSER AIRPORT - S40
AIRPORT MASTER PLAN UPDATE 6-11
Chapter 1
IntroductionC
hapter 2 Existing C
onditionsC
hapter 3 Aviation Activity
Forecasts
Chapter 4
Facility Requirem
entsC
hapter 5 Alternatives Analysis
Chapter 6
Phased Developm
ent and C
ost Estimates
Chapter 7
Airport Layout Plan and D
rawings
FIGURE 6-3 LONG-TERM IMPROVEMENTS
Runway 8-26 3,451' x 60'
Old Inland Empire Highway
Nunn Road
Wine Country Road
Sout
h St
eele
Roa
d
Sout
h M
issi
mer
Roa
d 4c
4d
4d
5a5c
5d5d
7 7
74d
84b
4d
7
5b
1
6
9
0
SCALE IN FEET
250 500
N
TRUE
NOR
TH
Long-Term Improvements
LEGENDPROPERTY LINE
PAVEMENT TO BE REMOVED/CLOSED
SHORT-TERM IMPROVEMENTS
INTERMEDIATE-TERM IMPROVEMENTS
LONG-TERM IMPROVEMENTS
Prosser Airport (S40) Years 2029-2038
Figure 6-3
Source: J-U-B

AIRPORT MASTER PLAN UPDATE 6-12
PROSSER AIRPORT - S40C
hapter 1 Introduction
Chapter 2
Existing Conditions
Chapter 3
Aviation Activity Forecasts
Chapter 4
Facility Requirem
entsC
hapter 5 Alternatives Analysis
Chapter 6
Phased Developm
ent and C
ost Estimates
Chapter 7
Airport Layout Plan and D
rawings
6.4 ENVIRONMENTAL SUMMARY
The proposed project improvements at the Airport are described in detail in Sections 6.1 (Short Term), 6.2 (Intermediate Term), and 6.3 (Long Term) Projects and constitute the work anticipated as a result of the master planning and public involvement process. The short term improvements primarily include preventive maintenance projects while intermediate and long term improvements are geared more toward standards compliance and satisfying future demand. Short Term Improvements - The short term projects, also referred to as the Preferred Alternative, are anticipated to occur from 2019 to 2025 and include:
• Extend the East End Hangar Taxilane – This project would consist of an approximately 350-foot taxilane extension for future hangars. Two locations are identified on the ALP for the possible taxilane extension. These locations include the far east end adjacent to the Bonney Building which is a Voluntary Cleanup Site for soil contamination and east end area adjacent to the entrance to the Airport behind the existing FBO buildings. Both of these areas are within the airfield area and have been previously disturbed by prior construction and ongoing Airport activities. The preference is to start with the area adjacent to the airport entrance, to allow time for the Bonney Building cleanup to be resolved.
• Construct Two Helipads and a Helipad Access Road – This project would consist of the installation of two paved and concreted helipads for helicopter activity away from the other aircraft and buildings. The proposed location for the helipads is presently undeveloped and adjacent to the larger west apron area. A new access road would be constructed from Nunn Road to the helipads. The new access road would be approximately 350 – feet long. Several trees will be relocated and replanted.
• AirfieldPavementRehabilitation- A recent review of the Airport’s existing pavement conditions reveal the slurry seal and seal coating work performed in 2015 is holding up well. Based on a typical lifespan of 7-10 years for a slurry seal, the Airport is due for pavement maintenance in 2023. This project would likely involve crack sealing all pavements, with a slurry seal of Runway 8/26, seal coating of all taxiways, taxilanes, and aprons, and new pavement markings.
• Ground Lease Hangar Development – As depicted on the ALP, several hangars would be developed in the near term as demand requires. The proposed hangar locations would be within the airfield and within previously disturbed areas.
Based on the scope, breadth and location of the proposed project improvements, the following environmental resource studies are anticipated to be required prior to the implementation of the Preferred Alternative:
• Biological Evaluation - A preliminary biological evaluation and site visit indicates that there is no habitat on the Airport for ESA-listed species. The Washington Department of Fish and Wildlife’s PHS database identified the Townsend ground squirrel as potentially occurring in the general vicinity. A biological evaluation is recommended prior to the implementation to verify that there is no habitat for sensitive species at the Airport and that there are no changes to ESA species list.
• Cultural resource survey – A cultural resource survey for the Runway 7 Realignment Project was conducted in 2006. Since the project areas for the Preferred Alternative extend beyond the area evaluated in the 2006 survey, a cultural resource survey is recommended for the remainder of the Airport property.
• Hazardous Materials – There are no known hazardous materials in the proposed project area adjacent to the airport entrance. A review of the Washington State Department of Ecology Facility Site Atlas should be conducted prior to proceeding. In the case of the Bonney Building, the site has been cleaned and monitoring wells established. Once the Department of Ecology clears the site, development can occur.
• Land Acquisition – All of the property proposed for development is within the Airport property boundary. There is no additional land acquisition required
• Visual Resources – The Preferred Alternative includes the extension of an existing taxilane, and the construction of helipad and access road. The new development, associated lighting and signage should be evaluated for visual resource impacts.
• Water Resource Assessment – Although there are no natural waterways, wetlands or other water features on the Airport property, a water resource assessment is recommended to evaluate impacts to the existing stormwater facilities and surface drainage from the Preferred Alternative.

AIRPORT MASTER PLAN UPDATE 6-13
PROSSER AIRPORT - S40C
hapter 1 Introduction
Chapter 2
Existing Conditions
Chapter 3
Aviation Activity Forecasts
Chapter 4
Facility Requirem
entsC
hapter 5 Alternatives Analysis
Chapter 6
Phased Developm
ent and C
ost Estimates
Chapter 7
Airport Layout Plan and D
rawings
• Construction impact analysis – Construction activities have the potential to result in temporary impacts to air, noise and water quality. Therefore, construction impacts and mitigation measures, such as Best Management Practices, should be considered prior to the implementation of the Preferred Alternative.
The following resource surveys are not anticipated to be required for the completion of the NEPA requirements associated with the Preferred Alternative:
• Air Quality Analysis – Benton County is currently in attainment for all criteria pollutants and GA operations at the Airport are forecasted to remain under the operation threshold for air quality analysis through the year 2035. The proposed improvements are not anticipated to have a long-term impact to air quality. An air quality analysis may be required, however, if Benton County’s air quality designation changes.
• Farmland Analysis – There are no agricultural activities on the Airport property and the Preferred Alternative would not convert any agricultural land to non-agricultural activities.
• Land Use Analysis – A land use analysis for the preferred alternative is accounted for in an upcoming chapter of this Master Plan Update.
• Environmental Justice Analysis – Since the Preferred Alternative would take place on existing Airport property, property acquisitions or relocations are within, and are not anticipated to impact health and safety conditions off the Airport an environmental justice analysis would likely not be required.
• Wetland Delineation – There are no wetlands or jurisdictional waterways on the Airport.
• Floodplain Analysis – The Airport is located outside of the 500-year floodplain and no impacts to floodplain outside of the Airport property is anticipated.
• Noise Analysis – The proposed improvements under the Preferred Alternative are not likely to present an impact to surrounding land uses based on the current 65 DNL contour, and therefore a noise analysis would likely not be required.
A preliminary evaluation of the Preferred Alternative for the Short Term improvements indicates that the NEPA requirements for the proposed project actions could likely be addressed under a documented categorical exclusion. However, the required environmental document would be determined by the FAA.
Intermediate Term Improvements: The Intermediate Projects, those improvements that are planned to occur from 2024 to 2028, would not be pursued until completion of the appropriate environmental analysis as dictated by the FAA. In general, the Intermediate Term Projects are associated with the Airport’s goal to provide a straight-in instrument GPS approach procedure. In order to accomplish the instrument approach, the Runway Safety Areas would need to be widened to 500 feet. This action would render some of the existing apron paving and facilities unusable in their current location. Given the scope of work and potential resource impacts associated with the intermediate term improvements an Environmental Assessment would likely be necessary prior to the implementation of the Intermediate Term improvements. Long Term Improvements: The Long Term Improvements, those scheduled to occur in 2029 and beyond, would include the extension of Runway 8-26. The runway extension would likely require the completion of an Environmental Assessment. NEPA requirements for the Long Term Projects would be assessed at a later date
6.5 FINANCIAL
Upon completion of the historical analysis of the Prosser Airport, a financial forecast is prepared. This forecast is developed on a yearly basis for 2019 through 2023. Financial forecasting is the estimation of future revenue and expenses. While historical data and development plans are the best indicators of what these monies might be, future financial performance is affected by many events and outside influences. Some of these include the effects of inflation and major impacts on the region’s economy such as changes in the fruit industry or changes in agricultural water rights. As the forecasting horizon moves further out, these outside influences and events compound and often have a more profound effect on the entity’s financial performance. Because of these outside influences, forecasts beyond a five-year horizon should be viewed more as an indication than as an estimate.In preparing the financial forecast for Prosser Airport, potential revenue and expense items were examined for reasonableness. Given the near-term outlook for continued low inflation, projected revenues and expenses were escalated at a modest 2.0% rate. A select financial history for the Port of Benton as it relates to the Prosser Airport is found within Table 6.1 and the 2019-2023 financial forecasts for Prosser Airport are presented in Table 6.2. It assumes that no new key sources of operating revenues will be implemented during this five-year forecast. This is admittedly conservative. Possible

AIRPORT MASTER PLAN UPDATE 6-14
PROSSER AIRPORT - S40C
hapter 1 Introduction
Chapter 2
Existing Conditions
Chapter 3
Aviation Activity Forecasts
Chapter 4
Facility Requirem
entsC
hapter 5 Alternatives Analysis
Chapter 6
Phased Developm
ent and C
ost Estimates
Chapter 7
Airport Layout Plan and D
rawings
sources of additional or new revenues could come from landing fees, revisions to the fuel flowage fees, an increase in fuel sales, or the addition of a new business or hangars. However, the Airport must judge the potential profitability of such changes, given corresponding costs for collection and administration. It is projected that the actual revenue from aviation activities for Prosser Airport will increase and average $6,000 per year over the next 5 years in terms of actual cash flow for projects. The airport by itself, operates in the black without the transfer of funds from a Port General Fund. This revenue stream does not account for the typical 5% match needed for the annual non-primary entitlement funding of $150,000 from the FAA. Each year, depending upon the funding streams obtained for projects, additional funds are may be needed for projects, typically coming from the transfer from the Port’s General Fund.
These itemized projects may be funded, in part, through
grants with 90% participation by FAA. Grant funds depend upon authorization of the FAA’s AIP program by Congress each year and the funding is not 100% guaranteed. This financial forecast shows that Prosser Airport will continue to operate in the black over the next five years without outside funding support from the Port’s general fund for grant matches and other operating expenses. Re-evaluation and increase of rates to fair market value when leases come due for renewal could help offset the Airport’s reliance on the Port’s general fund. Finally, any forecast has unforeseen elements; unexpected expenditures may arise. The uncertainty associated with a new AIP program should also be expected. Should federal grant monies diminish, certain capital improvements may have to be funded from other sources.
TABLE 6.1 HISTORICAL FINANCIAL DATA; SELECT
Revenues
2013 ($) 2014 ($) 2015 ($) 2016 ($) 2017 ($)Fuel Flowage Fees $404 $1,462 $720 $623 $667Port-Owned Hangar Leases $3,324 $3,324 $3,324 $6,358 $6,358Ground Leases for private hangars $9,623 $9,623 $13,016 $18,616 $18,638Non-Aviation Leases $170,605 $184,377 $184,377 $193,341 $256,757Total Revenues $183,956 $198,786 $201,437 $218,938 $282,420
ExpensesFBO $27,500 $30,000 $30,000 $26,700 $30,580Utilities $26,761 $29,537 $25,053 $25,242 $34,669NAVAID inspection/maintenance (AWOS) $8,885 $4,800 $10,870 $4,344 $6,516Outside Services (Consulting and Engineering) $66,131 $47,074 $63,452 $104,957 $65,360Property Tax $57 $57 $57 $57 $59In House Expenses (Salary and Taxes) $27,317 $28,637 $28,756 $29,750 $30,843Total Expenses $156,651 $140,105 $158,188 $191,050 $168,027Note: Excluding Grants and Projects funded through grants. Source: Port of Benton
TABLE 6.2 FORECAST FINANCIAL DATA; SELECT
Revenues 2019 ($) 2020 ($) 2021 ($) 2022 ($) 2023 ($)
Revenues net Expenses (with 2% Growth) $116,681 $119,014 $121,395 $123,823 $126,299

AIRPORT MASTER PLAN UPDATE 6-15
PROSSER AIRPORT - S40C
hapter 1 Introduction
Chapter 2
Existing Conditions
Chapter 3
Aviation Activity Forecasts
Chapter 4
Facility Requirem
entsC
hapter 5 Alternatives Analysis
Chapter 6
Phased Developm
ent and C
ost Estimates
Chapter 7
Airport Layout Plan and D
rawings
6.6 SUMMARY
Project Costs planned for the 20-year term total: $19,201,945 as shown in the tables below.A good portion of funds for improvements are currently identified as Unfunded. The reason for this identification is that financial plans must, per FAA, remain financially constrained until such time as funding is programmed via the annual ACIP process.
SHORT TERM 2019-2023 FAA NPE: $750,000 FAA Unfunded: $420,800 WSDOT: $57,222 Port: $287,778 Totals $1,515,000
INTERMEDIATE 2024-2028 FAA NPE: $1,050,000 FAA Unfunded: $4,101,900 WSDOT: $276,217 Port: $1,843,217 Totals $7,271,334
LONG TERM 2029-2038 FAA NPE: $1,500,000 FAA Unfunded: $6,090,783 WSDOT: $196,025 Port: $221,025 Others: $350,000 Totals $8,507,833
FUNDING SOURCE TOTALS FAA NPE: $3,300,000 FAA SA: $420,900 FAA UNFUNDED: $10,192,683 WSDOT: $2,352,020 Port: $2,586,342 Others: $350,000 Totals $19,201,945

AIRPORT MASTER PLAN UPDATE 7-1
PROSSER AIRPORT - S40C
hapter 1 Introduction
Chapter 2
Existing Conditions
Chapter 3
Aviation Activity Forecasts
Chapter 4
Facility Requirem
entsC
hapter 5 Alternatives Analysis
Chapter 6
Phased Developm
ent and C
ost Estimates
Chapter 7
Airport Layout Plan
and Draw
ings
CHAPTER 7 - AIRPORT MASTER PLAN DRAWINGS
7.0 INTRODUCTION
This chapter describes and depicts the necessary improvements and Port prerogatives derived from previous chapters. This includes but is not limited to the following features: existing airfield and landside configurations, future developments, airport airspace, land uses and property ownership. While the single-sheet Airport Layout Plan (ALP) drawing shows most of the airport-related features, other depictions, such as airspace limits and close-in land uses are shown on separate drawings. These drawings constitute the ALP drawing set:
AF-1 Cover and Index AF-2 Airport Data SheetAF-3 Airport Layout PlanAF-4 Airport Airspace PlanAF-5 Runway 8 Inner ApproachAF-5A Runway 8 Inner Approach TablesAF-6 Runway 26 Inner ApproachAF-6A Runway 26 Inner Approach TablesAF-7 Runway Centerline Plan and ProfileAF-8 Land Use PlanAF-9 Runway Centerline Plan and ProfileAF-10 Airport Property Inventory Map
The ALP is a legal document that represents an agreement between the Port of Benton and the Federal Aviation Administration.The agreement relates to design standards compliance, future development locations and obstruction disposition. On-airport development must be depicted on the ALP and it should be kept reasonably current. A reduced-size ALP along with and other drawings are found at the end of this chapter.
7.1 COVER
The Cover Sheet provides information regarding responsible parties along with project location, vicinity maps and content information.
7.2 AIRPORT LAYOUT PLAN AND DATA SHEET
The ALP is a scaled graphic representation of existing and proposed airport development including pertinent clearance and dimensional information required to show
conformance with design standards. The ALP depicts the recommended location of facilities proposed to accommodate the 20-year demand (and beyond in some cases) as discussed in the facility requirements chapter and refined through the alternatives and financial process. Short-term improvements primarily include preventive maintenance projects while intermediate and longer-term improvements are geared more toward standards compliance and satisfying future demand. Other notable improvements shown on the ALP include a short runway extension, parallel taxiway relocation, expanded apron, hangars, and pavement maintenance projects. A defining series of projectS relates to the relocation of the airport’s center of business to the main apron. When the straight-in instrument approach procedures are approved to the runway ends, the entirety of the East Apron becomes unusable for aircraft parking. A series of improvements, starting in the short-term and finishing up in the middle of the 20-year planning period provides new and reconfigured facilities for design standards compliance and effective demand accommodation. The Airport Data Table provides basic information concerning airport elevation, airport reference point location, design aircraft and airport reference code, etc. The Runway Data tables provide information such as runway design and reference code, approach surface information and runway end coordinates/elevations. A scale, legend, and north arrow orient the reader on the ALP and a wind rose is included on the Airport Data heat.
7.3 AIRPORT AIRSPACE PLAN (PART 77)
FAR Part 77 specifies various imaginary surfaces designed to protect the airspace around the Prosser Airport from objects of natural growth or man-made features called obstructions. These surfaces are the primary, approach, transitional, horizontal and conical as shown on the Airport Airspace Plan in their ultimate configuration.The primary surface is longitudinally centered on the runways. The elevation of any point on the primary surface is the same as the elevation of the nearest point on the runway centerline. The width of the primary surface is based on the type of approach available or planned for each runway. The planned primary surface is 500 feet wide and extends 200 feet beyond each runway end.The approach surface is a surface longitudinally centered on the extended runway centerline and extending
AIRPORT MASTER PLAN UPDATE 7-2
PROSSER AIRPORT - S40C
hapter 1 Introduction
Chapter 2
Existing Conditions
Chapter 3
Aviation Activity Forecasts
Chapter 4
Facility Requirem
entsC
hapter 5 Alternatives Analysis
Chapter 6
Phased Developm
ent and C
ost Estimates
Chapter 7
Airport Layout Plan
and Draw
ings
outward and upward from each end of the primary surface. An approach surface is applied to each end of each runway based on the type of approach available or planned for that runway end. The transitional surfaces extend outward and upward at right angles to the runway centerline and runway centerline extended at a slope of 7:1 (±8.13 degrees) from the sides of the primary surface and from the sides of the approach surfaces.The horizontal surface is a level horizontal plane 150 feet above the established airport elevation, the perimeter of which is constructed by swinging arcs of 5,000 feet from the center of each end of the primary surface of each runway and connecting the adjacent arcs with lines of tangency.The conical surface extends outward and upward from the periphery of the horizontal surface at a slope of 20:1 (±2.86 degrees) for a horizontal distance of 4,000 feet. Parts of Section 77.23 specify additional surfaces. A surface at a height of 500 feet exists along with another surface a 200-foot height above the ground surface within 3 nautical miles of the airport. These surfaces are not shown.
7.4 RUNWAY PLAN AND PROFILES
The Approach Surface, Inner-Approach Surface Plan and Profile drawings show the existing, future and ultimate approach surface configurations and their interaction with the airport and off-airport environs. The extended runway centerline ground profile and the critical point profiles are shown for terrain clearance purposes. Notable objects in this regard are shown in each plan and profile and tabulated with heights and disposition, as appropriate. These drawings are supplemental to the Airport Airspace Plan. Obstruction of concerns are mostly trees and are planned for lowering over the 20-year term of this planning.The Runway Centerline Profile drawing depicts surface longitudinal grades on centerline, edge of runway pavement, and edge of Runway Safety Area. The Line of Sight standard is also depicted.
7.5 TERMINAL AREA PLAN
A number of changes are depicted on the Terminal Area Plan for the Prosser Airport. This drawing represents a closer-in view of the proposed landside improvements shown on the ALP. Potential private hangar developments are planned for the short, intermediate and long-term as both executive and T-hangars. Hangars and apron design for larger, more corporate-
type aircraft are found on the main apron. More robust helicopter use is expected at the Prosser Airport as time goes by and several parking positions are planned. As noted earlier, the Airport’s center of business is planned to be relocated to the main apron. This includes a full-service FBO, fueling, and other larger aircraft services. Phased facility construction, utility extension, landscaping, auto access and auto parking area are planned. These improvements should be constructed as funding and demand allows and are planned to accommodate the expected activity. The proposed size and location in this regard are for planning purposes only and specific plans should be evaluated on a case-by-case basis for general conformance to the ALP.
7.6 LAND USE PLAN
The Land Use Plan identifies areas within and adjacent to airport property by zone and/or land use from City and County resources. Review for any residential development near the Airport should consider the Airport’s proximity and noise sensitivity. The WSDOT Land Use compatibility zones as they apply to the Prosser Airport are depicted for inclusion into area comprehensive planning. Land uses within these zones should to be protected by Port, County and City ordinance or code to ensure compatible land use. Areas off each of the ends of the runway are generally the most noise sensitive
7.7 AIRPORT PROPERTY INVENTORY MAP
The Airport Property Map shows the locations of existing airport sponsor ownership and areas proposed for ownership or release. The map also shows known easements, buildings, apron, fences, roads and other relevant features. Tracts are shown for depiction purposes only and this map is not to be used for survey or land acquisition. Property information includes ownership, location, purpose, book and page/reception and Federal involvement.

PROSSER AIRPORT - S40
AIRPORT MASTER PLAN UPDATE 7-3
Chapter 1
IntroductionC
hapter 2 Existing C
onditionsC
hapter 3 Aviation Activity
Forecasts
Chapter 4
Facility Requirem
entsC
hapter 5 Alternatives Analysis
Chapter 6
Phased Developm
ent and C
ost Estimates
Chapter 7
Airport Layout Plan
and Draw
ings
AIP NO. 3-53-0050-13
PROJECTLOCATION
PASCOPROSSER
OWNERPORT OF BENTON
AREA MAP
SEATTLE SPOKANEWASHINGTON
N
VICINITY MAP
PROSSERAIRPORT
OTHER J-U-B COMPANIES
Kennewick, WA 99336
2810 W. Clearwater Ave.
Phone: 509.783.2144
Suite 201
www.jub.com
SHEET NUMBER:
LAST UPDATED: July 9, 2019
APR.DESCRIPTION FAA UPDATE
REVISION
DATE
REUSE OF DRAWINGSTHIS DOCUMENT, AND THE IDEAS AND DESIGNS INCORPORATED HEREIN, AS AN INSTRUMENT OFPROFESSIONAL SERVICE, IS THE PROPERTY OF J-U-B ENGINEERS, Inc. AND IS NOT TO BE USED, IN WHOLE ORPART, FOR ANY OTHER PROJECT WITHOUT THE EXPRESS WRITTEN AUTHORIZATION OF J-U-B ENGINEERS, Inc.
AF-1
2019
AIRPORT LAYOUT PLAN
PROSSER, WASHINGTON
PORT OF BENTONPROSSER AIRPORT
INDEX OF SHEETSSHEET NUMBER SHEET TITLE REVISION
DATE
AF-1 TITLE SHEETAF-2 AIRPORT DATA SHEETAF-3 AIRPORT LAYOUT PLANAF-4 AIPORT AIRSPACE PLANAF-4A OBSTRUCTION TABLEAF-5 RUNWAY 8 INNER APPROACH SURFACEAF-5A RUNWAY 8 INNER APPROACH SURFACE OBSTRUCTION TABLESAF-6 RUNWAY 26 INNER APPORACH SURFACEAF-6A RUNWAY 26 INNER APPROACH SURFACE OBSTRUCTION TABLESAF-7 RUNWAY CENTERLINE PLAN AND PROFILEAF-8 TERMINAL AREA PLANAF-9 LAND USEAF-10 AIRPORT PROPERTY INVENTORY - EXHIBIT A
NO.
PORT OF BENTON DATE
SPONSOR APPROVAL
FEDERAL AVIATION ADMINISTRATIONNORTHWEST MOUNTAIN REGIONSEATTLE AIRPORTS DISTRICT OFFICE
DATE
FAA APPROVAL
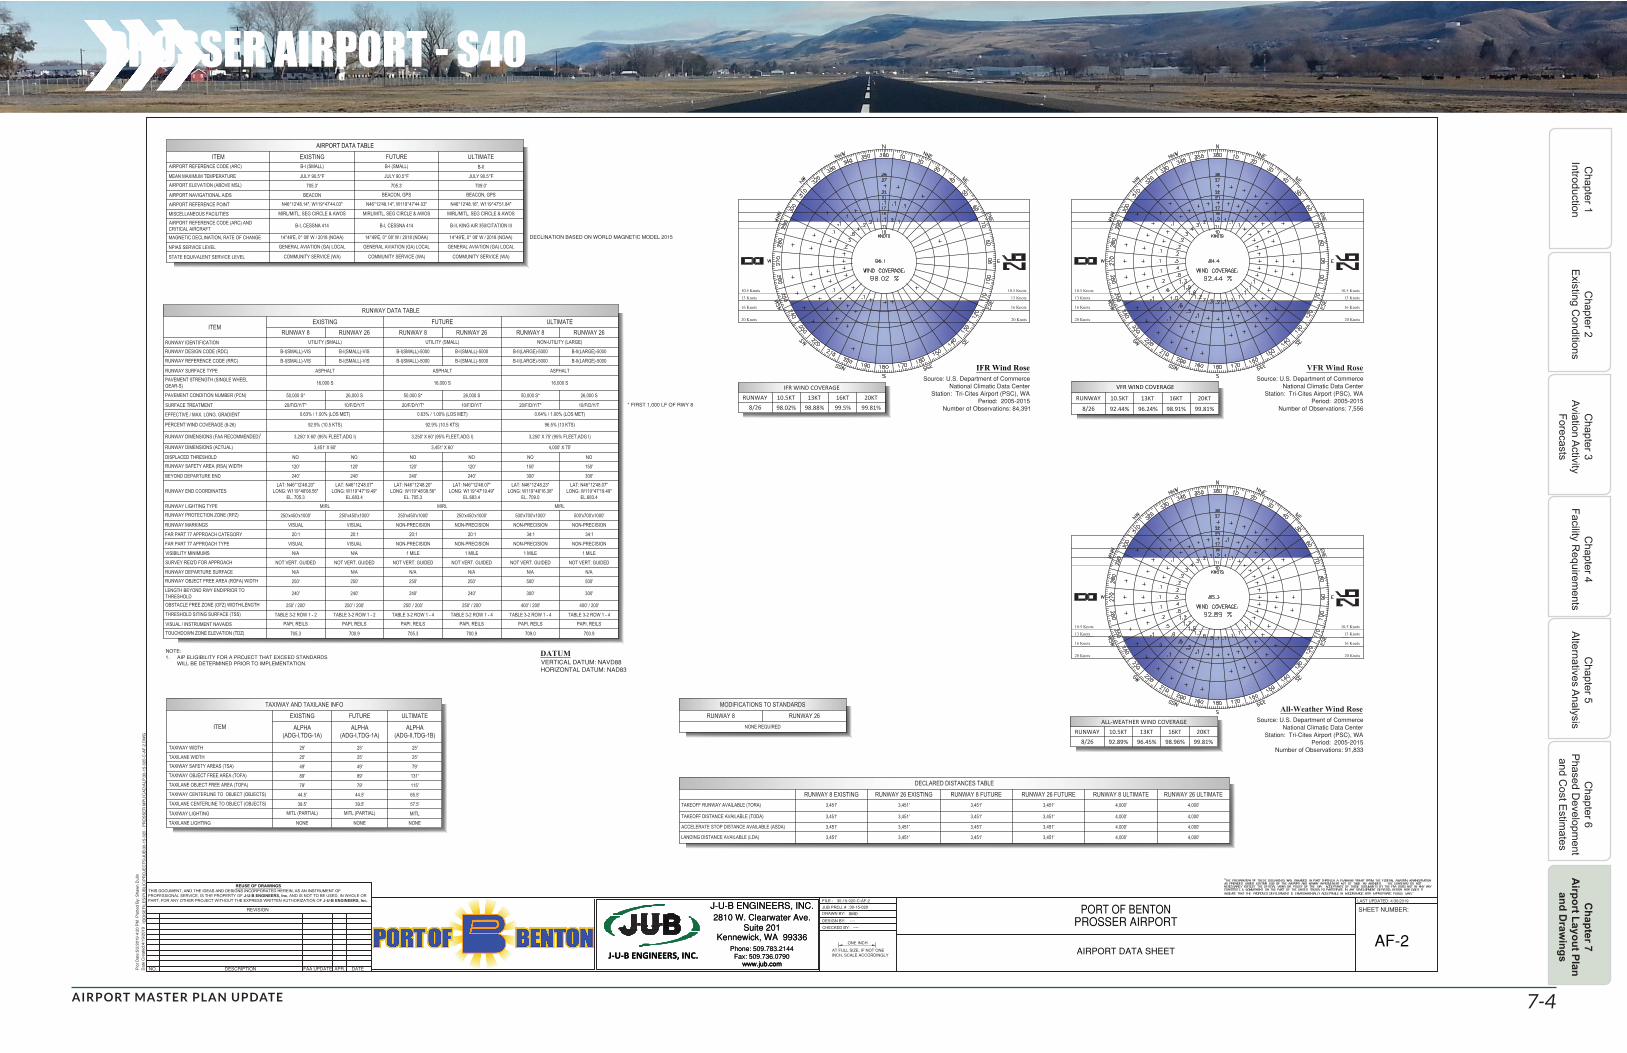
PROSSER AIRPORT - S40
AIRPORT MASTER PLAN UPDATE 7-4
Chapter 1
IntroductionC
hapter 2 Existing C
onditionsC
hapter 3 Aviation Activity
Forecasts
Chapter 4
Facility Requirem
entsC
hapter 5 Alternatives Analysis
Chapter 6
Phased Developm
ent and C
ost Estimates
Chapter 7
Airport Layout Plan
and Draw
ings
REUSE OF DRAWINGSTHIS DOCUMENT, AND THE IDEAS AND DESIGNS INCORPORATED HEREIN, AS AN INSTRUMENT OFPROFESSIONAL SERVICE, IS THE PROPERTY OF J-U-B ENGINEERS, Inc. AND IS NOT TO BE USED, IN WHOLE ORPART, FOR ANY OTHER PROJECT WITHOUT THE EXPRESS WRITTEN AUTHORIZATION OF J-U-B ENGINEERS, Inc.
APR.DESCRIPTIONNO.
REVISION
DATE
LAST UPDATED: 4/30/2019
DESIGN BY:
DRAWN BY:
CHECKED BY:
SHEET NUMBER:JUB PROJ. # :
30-15-020-C-AF-2
INCH, SCALE ACCORDINGLYAT FULL SIZE, IF NOT ONE
ONE INCH
FILE :
\\BO
ISE
FIL
ES
\PU
BLI
C\P
RO
JEC
TS
\JU
B\3
0-15
-020
- P
RO
SS
ER
MP
U\C
AD
\ALP
\30-
15-0
20-C
-AF
-2.D
WG
Plo
t Dat
e:5/
2/20
19 4
:20
PM
Plo
tted
By:
Sha
wn
Dul
inD
ate
Cre
ated
:4/1
9/20
19
J-U-B ENGINEERS, INC.
Kennewick, WA 99336Suite 201
J-U-B ENGINEERS, INC.2810 W. Clearwater Ave.
www.jub.comFax: 509.736.0790
Phone: 509.783.2144
FAA UPDATE
J-U-B ENGINEERS, INC.
Kennewick, WA 99336Suite 201
J-U-B ENGINEERS, INC.2810 W. Clearwater Ave.
www.jub.comFax: 509.736.0790
Phone: 509.783.2144
www.jub.com
30-15-020
AIRPORT DATA SHEETAF-2
SMD
----
----
10.5 Knots
13 Knots
16 Knots
20 Knots
10.5 Knots
13 Knots
16 Knots
20 Knots
10.5 Knots
13 Knots
16 Knots
20 Knots
10.5 Knots
13 Knots
16 Knots
20 Knots
VFR WIND COVERAGE
RUNWAY 10.5KT 13KT 16KT 20KT
8/26 92.44% 96.24% 98.91% 99.81%
IFR WIND COVERAGERUNWAY 10.5KT 13KT 16KT 20KT
8/26 98.02% 98.88% 99.5% 99.81%
ALL-WEATHER WIND COVERAGERUNWAY 10.5KT 13KT 16KT 20KT
8/26 92.89% 96.45% 98.96% 99.81%
Source: U.S. Department of CommerceNational Climatic Data Center
Station: Tri-Cites Airport (PSC), WAPeriod: 2005-2015
Number of Observations: 84,391
IFR Wind Rose
Source: U.S. Department of CommerceNational Climatic Data Center
Station: Tri-Cites Airport (PSC), WAPeriod: 2005-2015
Number of Observations: 91,833
All-Weather Wind Rose
Source: U.S. Department of CommerceNational Climatic Data Center
Station: Tri-Cites Airport (PSC), WAPeriod: 2005-2015
Number of Observations: 7,556
VFR Wind Rose
10.5 Knots
13 Knots
16 Knots
20 Knots
10.5 Knots
13 Knots
16 Knots
20 Knots
AIRPORT DATA TABLEITEM EXISTING FUTURE ULTIMATE
AIRPORT REFERENCE CODE (ARC) B-I (SMALL) B-I (SMALL) B-II
MEAN MAXIMUM TEMPERATURE JULY 90.5°F JULY 90.5°F JULY 90.5°FAIRPORT ELEVATION (ABOVE MSL) 705.3' 705.3' 709.0'
AIRPORT NAVIGATIONAL AIDS BEACON BEACON, GPS BEACON, GPS
AIRPORT REFERENCE POINT N46°12'48.14", W119°47'44.03" N46°12'48.14", W119°47'44.03" N46°12'48.16", W119°47'51.84"
MISCELLANEOUS FACILITIES MIRL/MITL, SEG CIRCLE & AWOS MIRL/MITL, SEG CIRCLE & AWOS MIRL/MITL, SEG CIRCLE & AWOS
AIRPORT REFERENCE CODE (ARC) ANDCRITICAL AIRCRAFT B-I, CESSNA 414 B-I, CESSNA 414 B-II, KING AIR 350/CITATION III
MAGNETIC DECLINATION, RATE OF CHANGE 14°49'E, 0° 08' W / 2018 (NOAA) 14°49'E, 0° 08' W / 2018 (NOAA) 14°49'E, 0° 08' W / 2018 (NOAA)
NPIAS SERVICE LEVEL GENERAL AVIATION (GA) LOCAL GENERAL AVIATION (GA) LOCAL GENERAL AVIATION (GA) LOCAL
STATE EQUIVALENT SERVICE LEVEL COMMUNITY SERVICE (WA) COMMUNITY SERVICE (WA) COMMUNITY SERVICE (WA)
RUNWAY DATA TABLE
ITEMEXISTING FUTURE ULTIMATE
RUNWAY 8 RUNWAY 26 RUNWAY 8 RUNWAY 26 RUNWAY 8 RUNWAY 26RUNWAY IDENTIFICATION UTILITY (SMALL) UTILITY (SMALL) NON-UTILITY (LARGE)
RUNWAY DESIGN CODE (RDC) B-I(SMALL)-VIS B-I(SMALL)-VIS B-I(SMALL)-5000 B-I(SMALL)-5000 B-II(LARGE)-5000 B-II(LARGE)-5000
RUNWAY REFERENCE CODE (RRC) B-I(SMALL)-VIS B-I(SMALL)-VIS B-I(SMALL)-5000 B-I(SMALL)-5000 B-II(LARGE)-5000 B-II(LARGE)-5000
RUNWAY SURFACE TYPE ASPHALT ASPHALT ASPHALTPAVEMENT STRENGTH (SINGLE WHEELGEAR-S) 16,000 S 16,000 S 16,000 S
PAVEMENT CONDITION NUMBER (PCN) 50,000 S* 26,000 S 50,000 S* 26,000 S 50,000 S* 26,000 S
SURFACE TREATMENT 20/F/D/Y/T* 10/F/D/Y/T 20/F/D/Y/T* 10/F/D/Y/T 20/F/D/Y/T* 10/F/D/Y/T
EFFECTIVE / MAX. LONG. GRADIENT 0.63% / 1.00% (LOS MET) 0.63% / 1.00% (LOS MET) 0.64% / 1.00% (LOS MET)
PERCENT WIND COVERAGE (8-26) 92.9% (10.5 KTS) 92.9% (10.5 KTS) 96.5% (13 KTS)
RUNWAY DIMENSIONS (FAA RECOMMENDED)1 3,250' X 60' (95% FLEET,ADG I) 3,250' X 60' (95% FLEET,ADG I) 3,250' X 75' (95% FLEET,ADG I)
RUNWAY DIMENSIONS (ACTUAL) 3,451' X 60' 3,451' X 60' 4,000' X 75'
DISPLACED THRESHOLD NO NO NO NO NO NORUNWAY SAFETY AREA (RSA) WIDTH 120' 120' 120' 120' 150' 150'
BEYOND DEPARTURE END 240' 240' 240' 240' 300' 300'
RUNWAY END COORDINATESLAT: N46°12'48.20"
LONG: W119°48'08.56"EL. 705.3
LAT: N46°12'48.07"LONG: W119°47'19.49"
EL.683.4
LAT: N46°12'48.20"LONG: W119°48'08.56"
EL. 705.3
LAT: N46°12'48.07"LONG: W119°47'19.49"
EL.683.4
LAT: N46°12'48.23"LONG: W119°48'16.38"
EL. 709.0
LAT: N46°12'48.07"LONG: W119°47'19.49"
EL.683.4RUNWAY LIGHTING TYPE MIRL MIRL MIRLRUNWAY PROTECTION ZONE (RPZ) 250'x450'x1000' 250'x450'x1000' 250'x450'x1000' 250'x450'x1000' 500'x700'x1000' 500'x700'x1000'
RUNWAY MARKINGS VISUAL VISUAL NON-PRECISION NON-PRECISION NON-PRECISION NON-PRECISION
FAR PART 77 APPROACH CATEGORY 20:1 20:1 20:1 20:1 34:1 34:1
FAR PART 77 APPROACH TYPE VISUAL VISUAL NON-PRECISION NON-PRECISION NON-PRECISION NON-PRECISION
VISIBILITY MINIMUMS N/A N/A 1 MILE 1 MILE 1 MILE 1 MILE
SURVEY REQ'D FOR APPROACH NOT VERT. GUIDED NOT VERT. GUIDED NOT VERT. GUIDED NOT VERT. GUIDED NOT VERT. GUIDED NOT VERT. GUIDED
RUNWAY DEPARTURE SURFACE N/A N/A N/A N/A N/A N/ARUNWAY OBJECT FREE AREA (ROFA) WIDTH 250' 250' 250' 250' 500' 500'LENGTH BEYOND RWY END/PRIOR TOTHRESHOLD 240' 240' 240' 240' 300' 300'
OBSTACLE FREE ZONE (OFZ) WIDTH/LENGTH 250' / 200' 250' / 200' 250' / 200' 250' / 200' 400' / 200' 400' / 200'THRESHOLD SITING SURFACE (TSS) TABLE 3-2 ROW 1 - 2 TABLE 3-2 ROW 1 - 2 TABLE 3-2 ROW 1 - 4 TABLE 3-2 ROW 1 - 4 TABLE 3-2 ROW 1 - 4 TABLE 3-2 ROW 1 - 4
VISUAL / INSTRUMENT NAVAIDS PAPI, REILS PAPI, REILS PAPI, REILS PAPI, REILS PAPI, REILS PAPI, REILS
TOUCHDOWN ZONE ELEVATION (TDZ) 705.3 700.9 705.3 700.9 709.0 700.9
TAXIWAY AND TAXILANE INFO
ITEMEXISTING FUTURE ULTIMATE
ALPHA(ADG-I,TDG-1A)
ALPHA(ADG-I,TDG-1A)
ALPHA(ADG-II,TDG-1B)
TAXIWAY WIDTH 25' 25' 25'
TAXILANE WIDTH 25' 25' 25'TAXIWAY SAFETY AREAS (TSA) 49' 49' 79'TAXIWAY OBJECT FREE AREA (TOFA) 89' 89' 131'TAXILANE OBJECT FREE AREA (TOFA) 79' 79' 115'TAXIWAY CENTERLINE TO OBJECT (OBJECTS) 44.5' 44.5' 65.5'TAXILANE CENTERLINE TO OBJECT (OBJECTS) 39.5' 39.5' 57.5'
TAXIWAY LIGHTING MITL (PARTIAL) MITL (PARTIAL) MITL
TAXILANE LIGHTING NONE NONE NONE
MODIFICATIONS TO STANDARDSRUNWAY 8 RUNWAY 26
NONE REQUIRED
DECLARED DISTANCES TABLERUNWAY 8 EXISTING RUNWAY 26 EXISTING RUNWAY 8 FUTURE RUNWAY 26 FUTURE RUNWAY 8 ULTIMATE RUNWAY 26 ULTIMATE
TAKEOFF RUNWAY AVAILABLE (TORA) 3,451' 3,451' 3,451' 3,451' 4,000' 4,000'
TAKEOFF DISTANCE AVAILABLE (TODA) 3,451' 3,451' 3,451' 3,451' 4,000' 4,000'
ACCELERATE STOP DISTANCE AVAILABLE (ASDA) 3,451' 3,451' 3,451' 3,451' 4,000' 4,000'
LANDING DISTANCE AVAILABLE (LDA) 3,451' 3,451' 3,451' 3,451' 4,000' 4,000'
VERTICAL DATUM: NAVD88HORIZONTAL DATUM: NAD83
DATUM
DECLINATION BASED ON WORLD MAGNETIC MODEL 2015
* FIRST 1,000 LF OF RWY 8
NOTE:1. AIP ELIGIBILITY FOR A PROJECT THAT EXCEED STANDARDS
WILL BE DETERMINED PRIOR TO IMPLEMENTATION.

PROSSER AIRPORT - S40
AIRPORT MASTER PLAN UPDATE 7-5
Chapter 1
IntroductionC
hapter 2 Existing C
onditionsC
hapter 3 Aviation Activity
Forecasts
Chapter 4
Facility Requirem
entsC
hapter 5 Alternatives Analysis
Chapter 6
Phased Developm
ent and C
ost Estimates
Chapter 7
Airport Layout Plan
and Draw
ings
N3000 600
SCALE IN FEET
TRUE
NOR
TH
REUSE OF DRAWINGSTHIS DOCUMENT, AND THE IDEAS AND DESIGNS INCORPORATED HEREIN, AS AN INSTRUMENT OFPROFESSIONAL SERVICE, IS THE PROPERTY OF J-U-B ENGINEERS, Inc. AND IS NOT TO BE USED, IN WHOLE ORPART, FOR ANY OTHER PROJECT WITHOUT THE EXPRESS WRITTEN AUTHORIZATION OF J-U-B ENGINEERS, Inc.
APR.DESCRIPTIONNO.
REVISION
DATE
LAST UPDATED: 5/2/2019
DESIGN BY:
DRAWN BY:
CHECKED BY:
SHEET NUMBER:JUB PROJ. # :
30-15-020-C-AF-3
INCH, SCALE ACCORDINGLYAT FULL SIZE, IF NOT ONE
ONE INCH
FILE :
\\BO
ISE
FIL
ES
\PU
BLI
C\P
RO
JEC
TS
\JU
B\3
0-15
-020
- P
RO
SS
ER
MP
U\C
AD
\ALP
\30-
15-0
20-C
-AF
-3.D
WG
Plo
t Dat
e:5/
2/20
19 4
:18
PM
Plo
tted
By:
Sha
wn
Dul
inD
ate
Cre
ated
:4/1
9/20
19
J-U-B ENGINEERS, INC.
Kennewick, WA 99336Suite 201
J-U-B ENGINEERS, INC.2810 W. Clearwater Ave.
www.jub.comFax: 509.736.0790
Phone: 509.783.2144
FAA UPDATE
J-U-B ENGINEERS, INC.
Kennewick, WA 99336Suite 201
J-U-B ENGINEERS, INC.2810 W. Clearwater Ave.
www.jub.comFax: 509.736.0790
Phone: 509.783.2144
www.jub.com
30-15-020
AIRPORT LAYOUT PLANAF-3
SMD
----
----
MODEL: WMM2015MAGNETIC DECLINATION 14°49'EAPRIL 24, 2018RATE OF CHANGE0° 8' W PER YEAR
LEGENDEXISTING FUTURE ULTIMATE DESCRIPTION
BUILDING/STRUCTURE
AIRPORT PAVEMENT
ROADWAY
BUILDING ENVELOPE (LOT)
AIRPORT PROPERTY LINE
AIRPORT PROPERTY EASEMENTS
APPROACH SURFACE
PART 77 APPROACH SURFACE
BUILDING RESTRICTION LINERUNWAY OBJECT FREE AREA (ROFA)
RUNWAY PROTECTION ZONE
RUNWAY SAFETY AREA
RUNWAY OBJECT FREE ZONETAXIWAY OBJECT FREE AREA (TOFA)
NAVAID CRITICAL AREA
FENCE
FENCE TO BE RELOCATED
THRESHOLD LIGHTSLANDING AID (PAPI-2)
LANDING AID (REILS)
SUPPLEMENTAL WINDCONEAIRPORT REFERENCE POINT (ARP)
SURVEY MONUMENT
TREEGROUND CONTOURS (2' INTERVAL)
PAVEMENT TO BE REMOVED
NOTES:1. TRUE BEARINGS LISTED FOR RUNWAYS ARE GEODETIC VALUES. ELEVATIONS PUBLISHED ARE
BASED ON NAD88 VERTICAL DATUM. HORIZONTAL DATUM IS NAD83/2011.2. DATE OF OBSTRUCTION FLIGHT WAS 9/13/14.3. ALL EXISTING TAXIWAY WIDTHS ARE 25'.4. EXISTING AND FUTURE BUILDINGS ARE LABELED ON THE TERMINAL AREA PLAN.5. RUNWAY 8 PAPI-2 IS LOCATED AT STATION 205+17, 99.2 FT FROM RUNWAY CENTERLINE. RUNWAY 26
PAPI-2 IS LOCATED AT STATION 230+49, 91.4 FT FROM RUNWAY CENTERLINE.6. RUNWAY 8 REILS ARE LOCATED AT STATION 199+59, 105 FT FROM RUNWAY CENTERLINE. RUNWAY 26
REILS ARE LOCATED AT STATION 234+19, 105 FT FROM RUNWAY CENTERLINE.7. TAXIWAY A EDGE SAFETY MARGIN (TESM); TAXIWAY DESIGN GROUP (TDG) 1A (E,F): 5 FT, 1B (U): 5 FT8. TAXIWAY A SHOULDER WIDTH; TAXIWAY DESIGN GROUP (TDG) 1A (E,F): 10 FT, 1B (U): 10 FT9. RUNWAY SHOULDER WIDTH; B-I SMALL (E,F): 10 FT, B-II (U): 10 FT10. TAXIWAY A OBJECT FREE AREA (TOFA); AIRPLANE DESIGN GROUP (ADG) I: 89 FT11. TAXILANE OBJECT FREE AREA (TOFA); AIRPLANE DESIGN GROUP (ADG) I: 79 FT12. TAXIWAY/TAXILANE SAFETY AREA (TSA); AIRPLANE DESIGN GROUP (ADG) I: 49 FT13. APRON (E): 35,494 SQUARE YARDS, APRON (F)(U) 19,470 SQUARE YARDS14. ALL FENCES ARE 6 FEET IN HEIGHT UNLESS OTHERWISE NOTED.15. THE DEPICTED 35-FOOT BUILDING RESTRICTION LINE IS INTENDED AS A GUIDELINE ONLY. FUTURE
HANGARS MUST RECEIVE A NO-HAZARD DETERMINATION VIA FAA FROM 7460 FILING.
CLEARANCE TABLE WITHIN RUNWAY 26 PART 77 APPROACH SURFACES
LOCATION GROUNDELEVATION
TRAVERSEWAY
ADJUSMENT
EXISTINGAPPROACH
CLEARANCE
FUTUREAPPROACH
CLEARANCE
ULTIMATEAPPROACH
CLEARANCENORTH EDGE OF ULTIMATE APPROACH AT WINE COUNTRY ROAD 684.0 N/A N/A 14.5' 35.8'
NORTH EDGE OF FUTURE APPROACH AT WINE COUNTRY ROAD 683.2 N/A 39.0' 16.7' 38.9'
NORTH EDGE OF EXISTING APPROACH AT WINE COUNTRY ROAD 681.0 47.4' 47.4' 22.8' 47.1'
APPROACH CENTERLINE AT WINE COUNTRY ROAD 676.5 64.9' 64.9' 34.9' 64.4'
SOUTH EDGE OF EXISTING APPROACH AT WINE COUNTRY ROAD 672.3 76.6' 76.6' 85.4' 85.4'
SOUTH EDGE OF FUTURE APPROACH AT WINE COUNTRY ROAD 670.1 N/A 97.1' 57.3' 95.2'
SOUTH EDGE OF ULTIMATE APPROACH AT WINE COUNTRY ROAD 664.6 N/A N/A 64.5' 106.9'
NORTH EDGE OF ULTIMATE APPROACH AT SOUTH WAMBA ROAD 674.7 N/A N/A 58.7' 106.2'
NORTH EDGE OF FUTURE APPROACH AT SOUTH WAMBAROAD 672.8 N/A 107.9' 61.6' 108.1'
NORTH EDGE OF EXISTING APPROACH AT SOUTH WAMBA ROAD 671.7 108.9' 108.9' 62.6' 109.2'
APPROACH CENTERLINE AT SOUTH WAMBA ROAD 668.9 111.4' 111.4' 65.3' 112.2'
SOUTH EDGE OF EXISTING APPROACH AT SOUTH WAMBA ROAD 665.7 115.6' 115.5' 69.0' 115.6'
SOUTH EDGE OF FUTURE APPROACH AT SOUTH WAMBA ROAD 664.2 N/A 114.5' 68.9' 113.5'
SOUTH EDGE OF ULTIMATE APPROACH AT SOUTH WAMBA ROAD 664.2 N/A N/A 66.7' 110.5'
CLEARANCE TABLE WITHIN RUNWAY 8 PART 77 APPROACH SURFACES
LOCATION GROUNDELEVATION
TRAVERSEWAY
ADJUSMENT
EXISTINGAPPROACH
CLEARANCE
FUTUREAPPROACH
CLEARANCE
ULTIMATEAPPROACH
CLEARANCENORTH EDGE OF FUTURE APPROACH AT STEELE ROAD 716.3 +15' N/A -0.8' N/A
NORTH EDGE OF EXISTING APPROACH AT STEELE ROAD 713.9 +15' 1.2' 1.2' N/A
APPROACH CENTERLINE AT STEELE ROAD 709.4 +15' 5.5' 5.5' N/A
SOUTH EDGE OF EXISTING APPROACH AT STEELE ROAD 706.5 +15' 8.2' 8.2' N/A
SOUTH EDGE OF FUTURE APPROACH AT STEELE ROAD 704.8 +15' N/A 9.7' N/A
NORTH EDGE OF ULTIMATE APPROACH AT MISSIMER ROAD 725.6 +15' N/A N/A 6.4'
NORTH EDGE OF FUTURE APPROACH AT MISSIMER ROAD 725.6 +15' N/A 57.0' 6.4'
NORTH EDGE OF EXISTING APPROACH AT MISSIMER ROAD 724.4 +15' 57.1' 57.1' 7.0'
APPROACH CENTERLINE AT MISSIMER ROAD 722.7 +15' 59.0' 59.0' 8.9'
SOUTH EDGE OF EXISTING APPROACH AT MISSIMER ROAD 717.3 +15' 63.7' 63.7' 13.9'
SOUTH EDGE OF FUTURE APPROACH AT MISSIMER ROAD 714.4 +15' N/A 66.3' 16.5'
SOUTH EDGE OF ULTIMATE APPROACH AT MISSIMER ROAD 714.4 +15' N/A N/A 16.7'
NORTH EDGE OF ULTIMATE APPROACH AT OLD INLAND EMPIRE HIGHWAY 724.2 +15' N/A N/A 2.2'
NORTH EDGE OF FUTURE APPROACH AT OLD INLAND EMPIRE HIGHWAY 724.2 +15' N/A 48.6' 2.2'
NORTH EDGE OF EXISTING APPROACH AT OLD INLAND EMPIRE HIGHWAY 733.6 +15' 96.9' 96.9' 26.6'
PORT OF BENTON DATE
SPONSOR APPROVAL
FEDERAL AVIATION ADMINISTRATIONNORTHWEST MOUNTAIN REGIONSEATTLE AIRPORTS DISTRICT OFFICE
DATE
FAA APPROVAL
EXISTING BUILDING AND FACILITIES LIST
NO. DESCRIPTION CONDITIONAPPROXIMATESIZE (SQ. FT.) HEIGHT TOP ELEV.
ROTATING BEACON AND TOWER GOOD N/A 54 729
FBO / PILOT LOUNGE GOOD 3,800 21 698
RESTROOMS GOOD 800 12 687
EAA BUILDING GOOD 900 12 687
FUEL TANK GOOD N/A 11 691
T-HANGARS GOOD 5,670 17 695
HANGAR GOOD 4,800 17 693
T-HANGARS POOR 4,600 17 693
HANGAR GOOD 3,400 17 693
HANGAR GOOD 3,000 17 693
HANGAR GOOD 3,600 23 698
HANGAR GOOD 3,600 23 698
T-HANGARS FAIR 4,600 17 694
HANGAR NEW 5,800 23 697
T-HANGARS FAIR 8,600 17 694
HANGAR GOOD 3,750 23 697
HANGAR GOOD 3,000 23 695
HANGAR GOOD 3,600 20 693
MAINTENANCE HANGAR GOOD 4,000 18 690
INDUSTRIAL PARK BUILING GOOD 12,000 27 700
INDUSTRIAL PARK BUILDING GOOD 12,000 23 696
HANGAR (ABANDONED CONCRETE) N/A 925 0 675
T-HANGAR (TO BE REMOVED) POOR 925 17 704
LIGHTED WIND SOCK AND SEGMENTED CIRCLE GOOD N/A 23 709
CHUKAR CHERRIES (4 BLDGS) GOOD N/A 23 692
123456789
10111213141516171819202122232425
FUTURE BUILDING AND FACILITIES LIST
NO. DESCRIPTION DIMENSIONAPPROXIMATESIZE (SQ. FT.) HEIGHT TOP ELEV.
HANGAR 100X130 13,000 35 715
HANGAR 100X130 13,000 35 715
FUEL TANKS N/A 500 10 688
FUEL ISLAND 25X55 1,375 6 686
FUTURE GA FBO TERMINAL 100X130 13,000 35 712
HANGAR 75X75 5,625 35 709
HANGAR 75X75 5,625 35 709
HANGAR 65X70 4,550 35 709
HANGAR 75X75 5,625 35 708
HANGAR 50X50 2,500 35 708
HANGAR 50X50 2,500 35 708
HANGAR 50X50 2,500 35 708
HANGAR 50X50 2,500 35 708
T-HANGARS (QTY 5) 50X126 6,300 35 707
HANGAR 65X80 5,200 35 708
HANGAR 65X80 5,200 35 708
HANGAR 65X60 3,900 35 708
HANGAR 65X60 3,900 35 708
262728293031323334353637383940414243
ULTIMATE BUILDING AND FACILITIES LIST
NO. DESCRIPTION DIMENSIONAPPROXIMATESIZE (SQ. FT.) HEIGHT TOP ELEV.
HANGAR (QTY 2) 75X75 5,625 30 706
T-HANGARS (QTY 5) 50X126 6,300 35 707
FUEL TANKS N/A 500 10 688
444546
1
234
5
6 7
8 9 10
11
12
13
15
16
17
1819
20
2127 30 31 32 33
35
36
37 38
40 41 42 43
39
44
451426
22
2324
2846
29
25
34

PROSSER AIRPORT - S40
AIRPORT MASTER PLAN UPDATE 7-6
Chapter 1
IntroductionC
hapter 2 Existing C
onditionsC
hapter 3 Aviation Activity
Forecasts
Chapter 4
Facility Requirem
entsC
hapter 5 Alternatives Analysis
Chapter 6
Phased Developm
ent and C
ost Estimates
Chapter 7
Airport Layout Plan
and Draw
ings
N
TRUE
NOR
TH
7:1
7:1
20:1
34:1
TYPICAL ISOMETRIC VIEW OFFAR PART 77 SURFACES
RUNWAY CENTERLINES
CONICAL SURFACEHORIZONTAL SURFACE 150'ABOVE ESTABLISHEDAIRPORT ELEVATION
20:1
REUSE OF DRAWINGSTHIS DOCUMENT, AND THE IDEAS AND DESIGNS INCORPORATED HEREIN, AS AN INSTRUMENT OFPROFESSIONAL SERVICE, IS THE PROPERTY OF J-U-B ENGINEERS, Inc. AND IS NOT TO BE USED, IN WHOLE ORPART, FOR ANY OTHER PROJECT WITHOUT THE EXPRESS WRITTEN AUTHORIZATION OF J-U-B ENGINEERS, Inc.
APR.DESCRIPTIONNO.
REVISION
DATE
LAST UPDATED: 4/30/2019
DESIGN BY:
DRAWN BY:
CHECKED BY:
SHEET NUMBER:JUB PROJ. # :
30-15-020-C-AF-4
INCH, SCALE ACCORDINGLYAT FULL SIZE, IF NOT ONE
ONE INCH
FILE :
\\BO
ISE
FIL
ES
\PU
BLI
C\P
RO
JEC
TS
\JU
B\3
0-15
-020
- P
RO
SS
ER
MP
U\C
AD
\ALP
\30-
15-0
20-C
-AF
-4.D
WG
Plo
t Dat
e:5/
2/20
19 4
:23
PM
Plo
tted
By:
Sha
wn
Dul
inD
ate
Cre
ated
:4/1
9/20
19
J-U-B ENGINEERS, INC.
Kennewick, WA 99336Suite 201
J-U-B ENGINEERS, INC.2810 W. Clearwater Ave.
www.jub.comFax: 509.736.0790
Phone: 509.783.2144
FAA UPDATE
J-U-B ENGINEERS, INC.
Kennewick, WA 99336Suite 201
J-U-B ENGINEERS, INC.2810 W. Clearwater Ave.
www.jub.comFax: 509.736.0790
Phone: 509.783.2144
www.jub.com
30-15-020
AIRPORT AIRSPACE PLANAF-4
SMD
----
----
HORIZONTAL ACCURACY:AT A MAP SCALE OF 1"=50' NOT MORE THAN 10% OF ALL WELL-DEFINED PLANIMETRICFEATURES ARE IN ERROR BY MORE THAN 1.0'VERTICAL ACCURACY:CONTOUR INTERVAL 1.0 NOT MORE THAN 10% OF ALL VERTICAL POINTS ARE INERROR BY MORE THAN 1/2 THE ABOVE CONTOUR INTERVAL.
NOTES:1. TRUE BEARINGS LISTED FOR RUNWAYS ARE GEODETIC VALUES.
ELEVATIONS PUBLISHED ARE BASED ON NAD88 VERTICAL DATUM.HORIZONTAL DATUM IS NAD83/2011.
2. DATE OF OBSTRUCTION FLIGHT WAS 9/13/14.3. AGIS AND DOF OBSTRUCTS ACCOUNTED FOR.4. USGS MAP OBTAINED FROM:
HTTP://GOTO.ARCGISONLINE.COM/MAPS/USA_TOPO_MAPS,COPYRIGHT:© 2013 NATIONAL GEOGRAPHIC SOCIETY, I-CUBED
5. PLAN VIEW DEPICTS ULTIMATE AIRSPACE CONFIGURATION.
LEGENDLAND MASS OBSTRUCTION
OBSTRUCTION ITEM CALLOUT
MODEL: WMM2015MAGNETIC DECLINATION 14°49'EAPRIL 24, 2018RATE OF CHANGE0° 8' W PER YEAR
0
0SCALE IN FEET
VERT
HORZ 2000 4000
200 400

PROSSER AIRPORT - S40
AIRPORT MASTER PLAN UPDATE 7-7
Chapter 1
IntroductionC
hapter 2 Existing C
onditionsC
hapter 3 Aviation Activity
Forecasts
Chapter 4
Facility Requirem
entsC
hapter 5 Alternatives Analysis
Chapter 6
Phased Developm
ent and C
ost Estimates
Chapter 7
Airport Layout Plan
and Draw
ings
REUSE OF DRAWINGSTHIS DOCUMENT, AND THE IDEAS AND DESIGNS INCORPORATED HEREIN, AS AN INSTRUMENT OFPROFESSIONAL SERVICE, IS THE PROPERTY OF J-U-B ENGINEERS, Inc. AND IS NOT TO BE USED, IN WHOLE ORPART, FOR ANY OTHER PROJECT WITHOUT THE EXPRESS WRITTEN AUTHORIZATION OF J-U-B ENGINEERS, Inc.
APR.DESCRIPTIONNO.
REVISION
DATE
LAST UPDATED: 7/8/2019
DESIGN BY:
DRAWN BY:
CHECKED BY:
SHEET NUMBER:JUB PROJ. # :
30-15-020-C-AF-4
INCH, SCALE ACCORDINGLYAT FULL SIZE, IF NOT ONE
ONE INCH
FILE :
\\BO
ISE
FIL
ES
\PU
BLI
C\P
RO
JEC
TS
\JU
B\3
0-15
-020
- P
RO
SS
ER
MP
U\C
AD
\ALP
\30-
15-0
20-C
-AF
-4.D
WG
Plo
t Dat
e:7/
8/20
19 1
:53
PM
Plo
tted
By:
Sha
wn
Dul
inD
ate
Cre
ated
:4/1
9/20
19
J-U-B ENGINEERS, INC.
Kennewick, WA 99336Suite 201
J-U-B ENGINEERS, INC.2810 W. Clearwater Ave.
www.jub.comFax: 509.736.0790
Phone: 509.783.2144
FAA UPDATE
J-U-B ENGINEERS, INC.
Kennewick, WA 99336Suite 201
J-U-B ENGINEERS, INC.2810 W. Clearwater Ave.
www.jub.comFax: 509.736.0790
Phone: 509.783.2144
www.jub.com
30-15-020
OBSTRUCTION TABLEAF-4A
SMD
----
----
OBSTRUCTION TABLEOBSITEM DESCRIPTION DATE OF
SURVEYGROUNDELEV (FT)
OBJECTTOP ELEV
(FT)
PENETRATION(FT) SURFACE PENETRATED PROPOSED
ACTIONPROPOSED
ACTION DATE
1 BEACON (DOF OAS#53-021204) SEPT 2014 676 729 13 TRANSITIONAL RELOCATE 2024
2 ANTENNA (DOF OAS#53-000115) SEPT 2014 827 1046 187 INNER HORIZONTAL LIGHTED N/A
10 BUILDING SEPT 2014 687 703 10 TRANSITIONAL LIGHT 2024
20 CATENARY SEPT 2014 692 729 20 TRANSITIONAL LIGHT 2020
21 CATENARY SEPT 2014 689 727 22 TRANSITIONAL LIGHT 2020
22 CATENARY SEPT 2014 698 735 22 TRANSITIONAL LIGHT 2020
23 CATENARY SEPT 2014 703 739 20 TRANSITIONAL LIGHT 2020
24 CATENARY SEPT 2014 719 750 16 TRANSITIONAL LIGHT 2020
35 NATURAL HIGH POINT SEPT 2014 706 706 1 TRANSITIONAL NONE NONE
36 POLE SEPT 2014 756 798 -108 INNER HORIZONTAL / ULTIMATE APPROACH N/A N/A
37 POLE SEPT 2014 743 784 -117 INNER HORIZONTAL / ULTIMATE APPROACH N/A N/A
38 POLE SEPT 2014 746 780 -121 INNER HORIZONTAL / ULTIMATE APPROACH N/A N/A
39 POLE SEPT 2014 769 801 -170 INNER HORIZONTAL / ULTIMATE APPROACH N/A N/A
40 POLE SEPT 2014 682 731 -235 INNER HORIZONTAL / ULTIMATE APPROACH N/A N/A
41 POLE SEPT 2014 725 775 -183 INNER HORIZONTAL / ULTIMATE APPROACH N/A N/A
42 POLE SEPT 2014 731 779 -106 CONICAL N/A N/A
43 POLE SEPT 2014 686 730 -136 CONICAL N/A N/A
44 POLE SEPT 2014 688 728 24 TRANSITIONAL LIGHT 2020
45 POLE SEPT 2014 699 739 25 TRANSITIONAL LIGHT 2020
46 POLE SEPT 2014 709 748 24 TRANSITIONAL LIGHT 2020
48 POLE SEPT 2014 854 884 3 CONICAL LIGHTED N/A
62 POLE SEPT 2014 703 729 4 TRANSITIONAL LIGHT 2020
63 POLE SEPT 2014 701 727 3 TRANSITIONAL LIGHT 2020
65 POLE SEPT 2014 696 722 4 TRANSITIONAL LIGHT 2020
66 POLE SEPT 2014 695 721 3 TRANSITIONAL LIGHT 2020
83 POLE SEPT 2014 687 716 2 TRANSITIONAL LIGHT 2020
85 POLE SEPT 2014 684 718 10 TRANSITIONAL LIGHT 2020
86 POLE SEPT 2014 685 715 9 TRANSITIONAL LIGHT 2020
87 POLE SEPT 2014 687 717 13 TRANSITIONAL LIGHT 2020
88 POLE SEPT 2014 688 719 16 TRANSITIONAL LIGHT 2020
89 POLE SEPT 2014 687 723 19 TRANSITIONAL LIGHT 2020
90 POLE SEPT 2014 686 724 20 TRANSITIONAL LIGHT 2020
91 POLE SEPT 2014 690 726 20 TRANSITIONAL LIGHT 2020
92 POLE SEPT 2014 691 731 23 TRANSITIONAL LIGHT 2020
93 POLE SEPT 2014 695 729 19 TRANSITIONAL LIGHT 2020
94 POLE SEPT 2014 696 735 23 TRANSITIONAL LIGHT 2020
95 POLE (D0F OAS#53-022431) SEPT 2014 701 740 24 TRANSITIONAL LIGHT 2020
96 POLE (DOF OAS#53-022430) SEPT 2014 701 742 24 TRANSITIONAL LIGHT 2020
97 POLE SEPT 2014 704 739 19 TRANSITIONAL LIGHT 2020
98 POLE SEPT 2014 706 742 20 TRANSITIONAL LIGHT 2020
99 POLE SEPT 2014 713 745 10 TRANSITIONAL LIGHT 2020
100 POLE SEPT 2014 720 744 8 TRANSITIONAL LIGHT 2020
101 POLE SEPT 2014 712 751 25 TRANSITIONAL LIGHT 2020
102 POLE SEPT 2014 720 742 4 TRANSITIONAL LIGHT 2020
103 POLE SEPT 2014 714 754 28 TRANSITIONAL LIGHT 2020
104 POLE SEPT 2014 715 755 27 TRANSITIONAL LIGHT 2020
105 POLE SEPT 2014 719 758 29 TRANSITIONAL LIGHT 2020
109 SIGN SEPT 2014 704 707 1 PRIMARY N/A N/A
110 TANK SEPT 2014 766 895 36 INNER HORIZONTAL LIGHTED N/A
111 TREE SEPT 2014 689 756 42 TRANSITIONAL LOWER 2020
112 TREE SEPT 2014 715 772 38 TRANSITIONAL LOWER 2020
113 TREE SEPT 2014 745 834 -76 INNER HORIZONTAL / ULTIMATE APPROACH N/A N/A
114 TREE SEPT 2014 742 840 21 TRANSITIONAL LOWER 2020
115 TREE SEPT 2014 753 826 -146 INNER HORIZONTAL / ULTIMATE APPROACH N/A N/A
116 TREE SEPT 2014 653 731 -92 ULTIMATE APPROACH N/A N/A
119 TREE SEPT 2014 732 804 -61 CONICAL N/A N/A
120 TREE SEPT 2014 688 730 16 TRANSITIONAL LOWER 2020
122 TREE SEPT 2014 718 769 33 TRANSITIONAL LOWER 2020
123 TREE SEPT 2014 677 738 21 TRANSITIONAL LOWER 2020
124 TREE SEPT 2014 691 764 48 TRANSITIONAL LOWER 2020
125 TREE SEPT 2014 707 765 35 TRANSITIONAL LOWER 2020
126 TREE SEPT 2014 701 788 61 TRANSITIONAL LOWER 2020
127 TREE SEPT 2014 828 925 66 INNER HORIZONTAL LOWER 2020
128 TREE SEPT 2014 853 879 5 CONICAL LOWER 2020
130 TREE SEPT 2014 845 905 41 CONICAL LOWER 2020
131 TREE SEPT 2014 821 920 61 INNER HORIZONTAL LOWER 2020
132 TREE SEPT 2014 734 822 10 TRANSITIONAL LOWER 2020
133 TREE SEPT 2014 704 803 47 TRANSITIONAL LOWER 2020
139 TREE SEPT 2014 690 746 15 TRANSITIONAL LOWER 2020
141 TREE SEPT 2014 702 752 1 TRANSITIONAL LOWER 2031
143 TREE SEPT 2014 715 767 9 TRANSITIONAL LOWER 2020
145 TREE SEPT 2014 697 798 25 TRANSITIONAL LOWER 2031
155 TREE SEPT 2014 679 740 4 TRANSITIONAL LOWER 2020
157 TREE SEPT 2014 678 738 25 TRANSITIONAL LOWER 2020
173 TREE SEPT 2014 702 786 52 TRANSITIONAL LOWER 2020
177 TREE SEPT 2014 691 761 44 TRANSITIONAL LOWER 2020
180 TREE SEPT 2014 691 742 24 TRANSITIONAL LOWER 2020
182 TREE SEPT 2014 689 762 47 TRANSITIONAL LOWER 2020
188 TREE SEPT 2014 704 794 55 TRANSITIONAL LOWER 2020
190 VERTICAL STRUCTURE SEPT 2014 706 713 7 PRIMARY REMOVE 2032
191 TREE SEPT 2014 714 771 51 TRANSITIONAL LOWER 2020
192 TREE SEPT 2014 715 776 54 TRANSITIONAL LOWER 2020
OBSTRUCTION TABLEOBSITEM DESCRIPTION DATE OF
SURVEYGROUNDELEV (FT)
OBJECTTOP ELEV
(FT)
PENETRATION(FT) SURFACE PENETRATED PROPOSED
ACTIONPROPOSED
ACTION DATE
196 VERTICAL STRUCTURE SEPT 2014 708 715 7 PRIMARY REMOVE 2032
5000 TOWER (DOF OAS#53-020221) OCT 2008 1875 1979 964 CONICAL N/A N/A
5001 TOWER (DOF OAS#53-022435) AUG 2013 1869 2022 1011 CONICAL N/A N/A
5002 POLE (DOF OAS#53-020851) AUG 2010 1868 1909 904 CONICAL N/A N/A
5003 TOWER (DOF OAS#53-066325) JAN 2018 663 825 -34 INNER HORIZONTAL N/A N/A
5004 TOWER (DOF OAS#53-021204) MAY 2011 1000 1191 OUTSIDE AIRSPACE N/A N/A
5006 SIGN (DOF OAS#53-066644) JAN 2018 696 755 -144 CONICAL N/A N/A
5010 SOLAR PANELS (DOF OAS#53-066359) JAN 2018 693.65 700.00 -50.94 TRANSITIONAL N/A N/A
5011 BUILDING (DOF OAS#53-081641) JAN 2018 713 769 -90 INNER HORIZONTAL N/A N/A
5012 SIGN (DOF OAS#53-066280) JAN 2018 733 827 -32 INNER HORIZONTAL N/A N/A
NOTES:1. DATE OF OBSTRUCTION FLIGHT WAS 9/13/14.
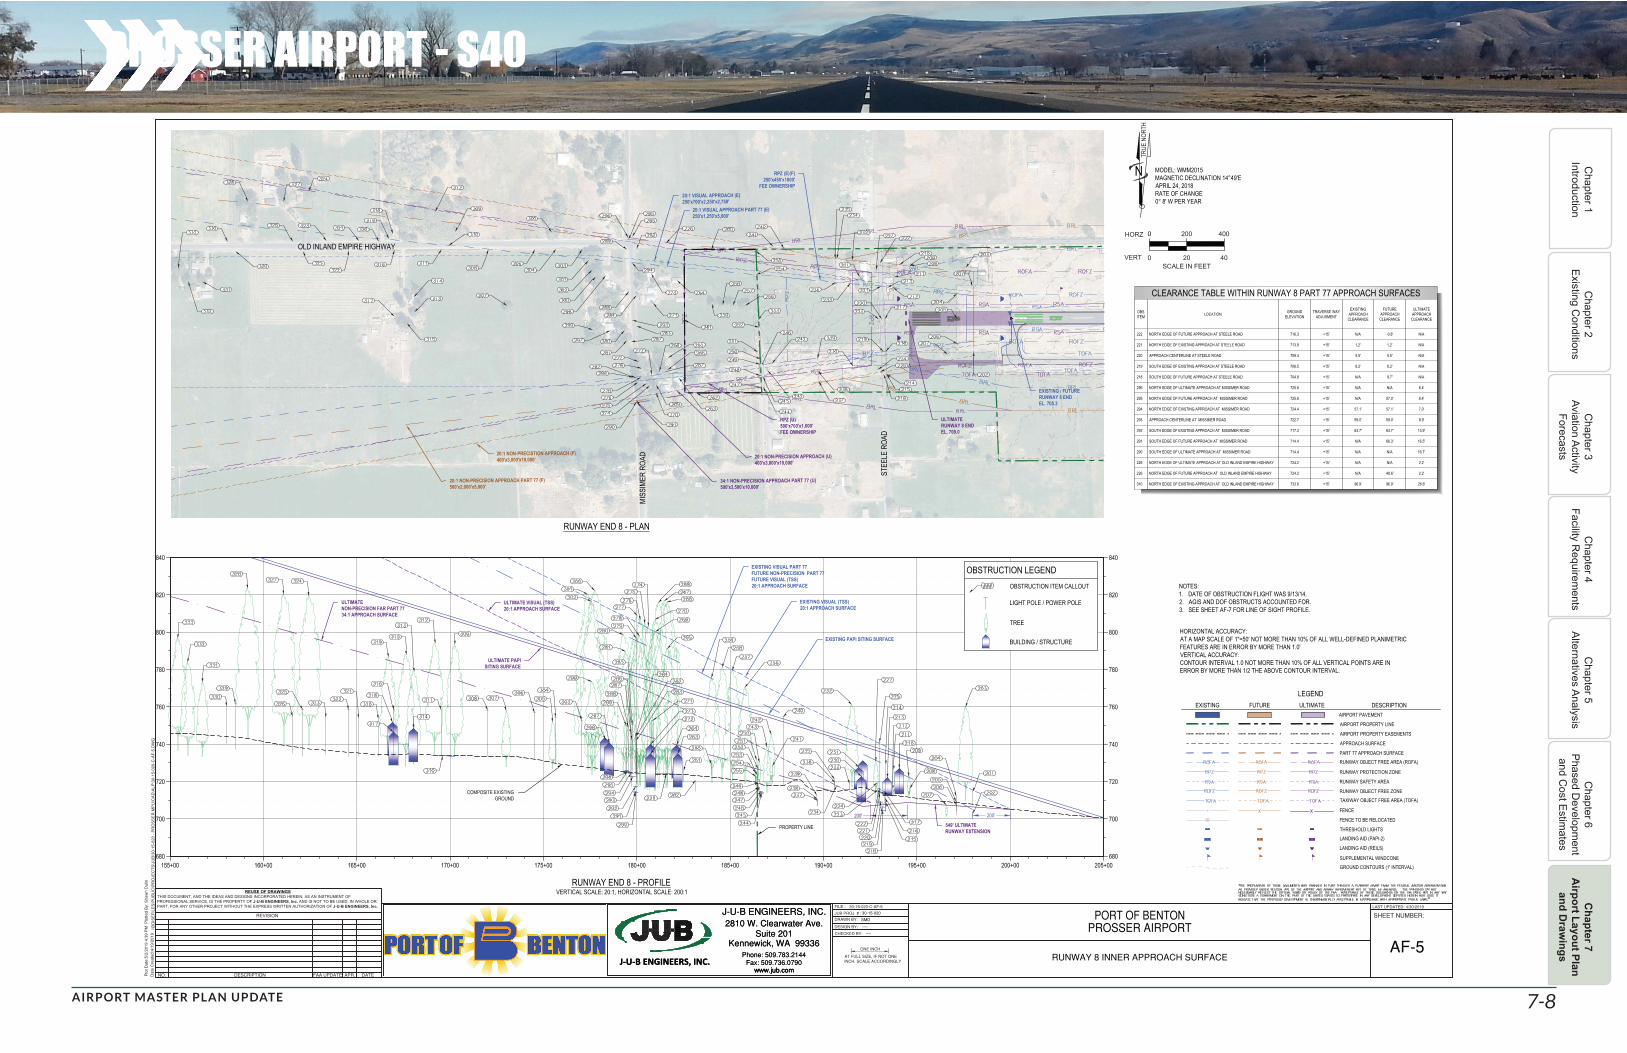
PROSSER AIRPORT - S40
AIRPORT MASTER PLAN UPDATE 7-8
Chapter 1
IntroductionC
hapter 2 Existing C
onditionsC
hapter 3 Aviation Activity
Forecasts
Chapter 4
Facility Requirem
entsC
hapter 5 Alternatives Analysis
Chapter 6
Phased Developm
ent and C
ost Estimates
Chapter 7
Airport Layout Plan
and Draw
ings
N
0
0SCALE IN FEET
VERT
HORZ 200 400
20 40
TRUE
NOR
TH
REUSE OF DRAWINGSTHIS DOCUMENT, AND THE IDEAS AND DESIGNS INCORPORATED HEREIN, AS AN INSTRUMENT OFPROFESSIONAL SERVICE, IS THE PROPERTY OF J-U-B ENGINEERS, Inc. AND IS NOT TO BE USED, IN WHOLE ORPART, FOR ANY OTHER PROJECT WITHOUT THE EXPRESS WRITTEN AUTHORIZATION OF J-U-B ENGINEERS, Inc.
APR.DESCRIPTIONNO.
REVISION
DATE
LAST UPDATED: 4/30/2019
DESIGN BY:
DRAWN BY:
CHECKED BY:
SHEET NUMBER:JUB PROJ. # :
30-15-020-C-AF-5
INCH, SCALE ACCORDINGLYAT FULL SIZE, IF NOT ONE
ONE INCH
FILE :
\\BO
ISE
FIL
ES
\PU
BLI
C\P
RO
JEC
TS
\JU
B\3
0-15
-020
- P
RO
SS
ER
MP
U\C
AD
\ALP
\30-
15-0
20-C
-AF
-5.D
WG
Plo
t Dat
e:5/
2/20
19 4
:39
PM
Plo
tted
By:
Sha
wn
Dul
inD
ate
Cre
ated
:4/1
9/20
19
J-U-B ENGINEERS, INC.
Kennewick, WA 99336Suite 201
J-U-B ENGINEERS, INC.2810 W. Clearwater Ave.
www.jub.comFax: 509.736.0790
Phone: 509.783.2144
FAA UPDATE
J-U-B ENGINEERS, INC.
Kennewick, WA 99336Suite 201
J-U-B ENGINEERS, INC.2810 W. Clearwater Ave.
www.jub.comFax: 509.736.0790
Phone: 509.783.2144
www.jub.com
30-15-020
RUNWAY 8 INNER APPROACH SURFACEAF-5
SMD
----
----
RUNWAY END 8 - PLAN
RUNWAY END 8 - PROFILE
LEGENDEXISTING FUTURE ULTIMATE DESCRIPTION
AIRPORT PAVEMENT
AIRPORT PROPERTY LINE
AIRPORT PROPERTY EASEMENTS
APPROACH SURFACE
PART 77 APPROACH SURFACERUNWAY OBJECT FREE AREA (ROFA)
RUNWAY PROTECTION ZONE
RUNWAY SAFETY AREA
RUNWAY OBJECT FREE ZONETAXIWAY OBJECT FREE AREA (TOFA)
FENCE
FENCE TO BE RELOCATED
THRESHOLD LIGHTSLANDING AID (PAPI-2)
LANDING AID (REILS)
SUPPLEMENTAL WINDCONEGROUND CONTOURS (1' INTERVAL)
VERTICAL SCALE: 20:1, HORIZONTAL SCALE: 200:1
HORIZONTAL ACCURACY:AT A MAP SCALE OF 1"=50' NOT MORE THAN 10% OF ALL WELL-DEFINED PLANIMETRICFEATURES ARE IN ERROR BY MORE THAN 1.0'VERTICAL ACCURACY:CONTOUR INTERVAL 1.0 NOT MORE THAN 10% OF ALL VERTICAL POINTS ARE INERROR BY MORE THAN 1/2 THE ABOVE CONTOUR INTERVAL.
NOTES:1. DATE OF OBSTRUCTION FLIGHT WAS 9/13/14.2. AGIS AND DOF OBSTRUCTS ACCOUNTED FOR.3. SEE SHEET AF-7 FOR LINE OF SIGHT PROFILE.
MODEL: WMM2015MAGNETIC DECLINATION 14°49'EAPRIL 24, 2018RATE OF CHANGE0° 8' W PER YEAR
OBSTRUCTION LEGENDOBSTRUCTION ITEM CALLOUT
LIGHT POLE / POWER POLE
TREE
BUILDING / STRUCTURE
CLEARANCE TABLE WITHIN RUNWAY 8 PART 77 APPROACH SURFACES
OBSITEM LOCATION GROUND
ELEVATIONTRAVERSE WAY
ADJUSMENT
EXISTINGAPPROACH
CLEARANCE
FUTUREAPPROACH
CLEARANCE
ULTIMATEAPPROACH
CLEARANCE
222 NORTH EDGE OF FUTURE APPROACH AT STEELE ROAD 716.3 +15' N/A -0.8' N/A
221 NORTH EDGE OF EXISTING APPROACH AT STEELE ROAD 713.9 +15' 1.2' 1.2' N/A
220 APPROACH CENTERLINE AT STEELE ROAD 709.4 +15' 5.5' 5.5' N/A
219 SOUTH EDGE OF EXISTING APPROACH AT STEELE ROAD 706.5 +15' 8.2' 8.2' N/A
218 SOUTH EDGE OF FUTURE APPROACH AT STEELE ROAD 704.8 +15' N/A 9.7' N/A
296 NORTH EDGE OF ULTIMATE APPROACH AT MISSIMER ROAD 725.6 +15' N/A N/A 6.4'
295 NORTH EDGE OF FUTURE APPROACH AT MISSIMER ROAD 725.6 +15' N/A 57.0' 6.4'
294 NORTH EDGE OF EXISTING APPROACH AT MISSIMER ROAD 724.4 +15' 57.1' 57.1' 7.0'
293 APPROACH CENTERLINE AT MISSIMER ROAD 722.7 +15' 59.0' 59.0' 8.9'
292 SOUTH EDGE OF EXISTING APPROACH AT MISSIMER ROAD 717.3 +15' 63.7' 63.7' 13.9'
291 SOUTH EDGE OF FUTURE APPROACH AT MISSIMER ROAD 714.4 +15' N/A 66.3' 16.5'
290 SOUTH EDGE OF ULTIMATE APPROACH AT MISSIMER ROAD 714.4 +15' N/A N/A 16.7'
226 NORTH EDGE OF ULTIMATE APPROACH AT OLD INLAND EMPIRE HIGHWAY 724.2 +15' N/A N/A 2.2'
226 NORTH EDGE OF FUTURE APPROACH AT OLD INLAND EMPIRE HIGHWAY 724.2 +15' N/A 48.6' 2.2'
310 NORTH EDGE OF EXISTING APPROACH AT OLD INLAND EMPIRE HIGHWAY 733.6 +15' 96.9' 96.9' 26.6'

PROSSER AIRPORT - S40
AIRPORT MASTER PLAN UPDATE 7-9
Chapter 1
IntroductionC
hapter 2 Existing C
onditionsC
hapter 3 Aviation Activity
Forecasts
Chapter 4
Facility Requirem
entsC
hapter 5 Alternatives Analysis
Chapter 6
Phased Developm
ent and C
ost Estimates
Chapter 7
Airport Layout Plan
and Draw
ings
REUSE OF DRAWINGSTHIS DOCUMENT, AND THE IDEAS AND DESIGNS INCORPORATED HEREIN, AS AN INSTRUMENT OFPROFESSIONAL SERVICE, IS THE PROPERTY OF J-U-B ENGINEERS, Inc. AND IS NOT TO BE USED, IN WHOLE ORPART, FOR ANY OTHER PROJECT WITHOUT THE EXPRESS WRITTEN AUTHORIZATION OF J-U-B ENGINEERS, Inc.
APR.DESCRIPTIONNO.
REVISION
DATE
LAST UPDATED: 4/30/2019
DESIGN BY:
DRAWN BY:
CHECKED BY:
SHEET NUMBER:JUB PROJ. # :
30-15-020-C-AF-5
INCH, SCALE ACCORDINGLYAT FULL SIZE, IF NOT ONE
ONE INCH
FILE :
\\BO
ISE
FIL
ES
\PU
BLI
C\P
RO
JEC
TS
\JU
B\3
0-15
-020
- P
RO
SS
ER
MP
U\C
AD
\ALP
\30-
15-0
20-C
-AF
-5.D
WG
Plo
t Dat
e:5/
2/20
19 4
:39
PM
Plo
tted
By:
Sha
wn
Dul
inD
ate
Cre
ated
:4/1
9/20
19
J-U-B ENGINEERS, INC.
Kennewick, WA 99336Suite 201
J-U-B ENGINEERS, INC.2810 W. Clearwater Ave.
www.jub.comFax: 509.736.0790
Phone: 509.783.2144
FAA UPDATE
J-U-B ENGINEERS, INC.
Kennewick, WA 99336Suite 201
J-U-B ENGINEERS, INC.2810 W. Clearwater Ave.
www.jub.comFax: 509.736.0790
Phone: 509.783.2144
www.jub.com
30-15-020
RUNWAY 8 INNER APPROACH SURFACE OBSTRUCTION TABLESAF-5A
SMD
----
----
OBSTRUCTIONS WITHIN RUNWAY 8OBSITEM DESCRIPTION
GNDELEV(FT)
OBJTOPELEV(FT)
EXISTINGSURFACEPENETRATION(FT)
EXISTINGSURFACEPENETRATED
FUTURESURFACEPENETRATION(FT)
FUTURESURFACEPENETRATED
ULTIMATESURFACEPENETRATION(FT)
ULTIMATESURFACEPENETRATED
PROPOSEDACTION
PROPOSEDACTION DATE
201 FENCE @ FUT 707 715 2 TRANSITIONAL 9 APPROACH 8 APPROACH LOWER 2025
202 FENCE @ FUT 701 707 -6 TRANSITIONAL 2 APPROACH 1 APPROACH LOWER 2025
203 TREE 710 760 32 TRANSITIONAL 50 TRANSITIONAL 50 TRANSITIONAL REMOVE 2025
204 FENCE @ ULT 707 712 2 APPROACH 2 APPROACH 5 APPROACH LOWER 2025
205 FENCE @ CL 704 709 0 APPROACH 0 APPROACH 2 APPROACH LOWER 2025
206 FENCE @ ULT 702 708 -2 APPROACH -2 APPROACH 1 APPROACH LOWER 2025
207 TREE 701 707 -13 TRANSITIONAL -5 APPROACH -1 APPROACH N/A N/A
208 FENCE @ FUT 712 716 -24 TRANSITIONAL -6 APPROACH 3 APPROACH REMOVE 2032
209 TREE 712 723 -17 TRANSITIONAL 1 APPROACH 9 APPROACH REMOVE 2032
210 BUILDING W ANTENAE 713 736 -7 TRANSITIONAL 11 APPROACH 21 APPROACH REMOVE 2032
211 TREE 713 726 -8 TRANSITIONAL 0 APPROACH 17 APPROACH REMOVE 2032
212 FENCE 712 716 -11 APPROACH -11 APPROACH 7 APPROACH REMOVE 2032
213 BUILDING 712 722 -6 APPROACH -6 APPROACH 13 APPROACH REMOVE 2032
214 TELEPHONE POLE 704 729 -17 TRANSITIONAL 1 APPROACH 14 APPROACH REMOVE 2032
215 FENCE @ FUT 704 709 -38 TRANSITIONAL -20 APPROACH -7 APPROACH N/A N/A
216 FENCE @ EXT 706 711 -18 APPROACH -18 APPROACH 2 APPROACH REMOVE 2032
217 FENCE @ CL 708 715 -14 APPROACH -14 APPROACH 6 APPROACH REMOVE 2032
218 STEELE ROAD @ FUT 705 720 -27 TRANSITIONAL -10 APPROACH 4 APPROACH REMOVE 2032
219 STEELE ROAD @ EXST 706 721 -8 APPROACH -8 APPROACH 12 APPROACH REMOVE 2032
220 STEELE ROAD @ CL 709 724 -5 APPROACH -5 APPROACH 15 APPROACH REMOVE 2032
221 STEELE ROAD @ EXST 714 729 -1 APPROACH -1 APPROACH 20 APPROACH REMOVE 2032
222 STEELE ROAD @ FUT 716 731 -17 TRANSITIONAL 1 APPROACH 15 APPROACH REMOVE 2032
223 FENCE @ CL 709 716 -15 APPROACH -15 APPROACH 7 APPROACH REMOVE 2032
224 TREE 707 719 -25 TRANSITIONAL -12 APPROACH 7 APPROACH REMOVE 2032
225 POWER POLE 704 741 -5 TRANSITIONAL 11 APPROACH 27 APPROACH REMOVE 2032
226 OLD INLAND EMPIRE HWY 724 739 -67 TRANSITIONAL -49 APPROACH -2 APPROACH N/A N/A
227 TREE 716 731 -13 TRANSITIONAL 0 APPROACH 20 APPROACH REMOVE 2032
230 BUILDING 706 720 -26 TRANSITIONAL -18 APPROACH 8 APPROACH REMOVE 2032
231 BUILDING 716 728 -14 APPROACH -8 APPROACH 17 APPROACH REMOVE 2032
232 TREE 718 761 5 TRANSITIONAL 23 APPROACH 42 APPROACH REMOVE 2032
233 FENCE @ EXST 716 719 -20 APPROACH -19 APPROACH 7 APPROACH REMOVE 2032
234 ACCESS ROAD 718 728 -32 TRANSITIONAL -14 APPROACH 7 APPROACH REMOVE 2032
235 FENCE @ FUT 717 721 -40 TRANSITIONAL -22 APPROACH -1 APPROACH N/A N/A
236 FENCE @ EXST 715 719 -23 APPROACH -23 APPROACH 5 APPROACH REMOVE 2032
237 FENCE @ FUT 706 710 -55 TRANSITIONAL -37 APPROACH -13 APPROACH N/A N/A
238 FENCE @ ULT 707 711 -46 TRANSITIONAL -36 APPROACH -7 APPROACH N/A N/A
239 FENCE @ EXST 709 713 -34 APPROACH -34 APPROACH -5 APPROACH N/A N/A
240 POWER POLE 719 755 -24 TRANSITIONAL -6 TRANSITIONAL 23 TRANSITIONAL LOWER 2032
241 ROAD SIGN INTX AHEAD 719 728 -53 TRANSITIONAL -36 TRANSITIONAL -5 TRANSITIONAL N/A N/A
242 TREE 718 745 -14 APPROACH -14 APPROACH 21 APPROACH REMOVE 2032
243 TREE 714 739 -27 TRANSITIONAL -22 APPROACH 13 APPROACH REMOVE 2032
244 ACCESS ROAD @ FUT 714 724 -56 TRANSITIONAL -38 APPROACH -6 APPROACH N/A N/A
245 ACCESS ROAD @ ULT 714 724 -48 TRANSITIONAL -38 APPROACH -2 APPROACH N/A N/A
246 ACCESS ROAD @ EXIST 715 725 -37 APPROACH -37 APPROACH -1 APPROACH N/A N/A
247 FENCE @ FUT 712 717 -63 TRANSITIONAL -45 APPROACH -13 APPROACH N/A N/A
248 FENCE @ ULT 715 717 -54 TRANSITIONAL -45 APPROACH -9 APPROACH N/A N/A
249 FENCE @ EXIST 717 719 -43 APPROACH -43 APPROACH -7 APPROACH N/A N/A
250 TREE 719 730 -32 APPROACH -32 APPROACH 4 APPROACH REMOVE 2032
251 TREE 720 732 -32 APPROACH -32 APPROACH 5 APPROACH REMOVE 2032
252 TREE 720 727 -36 APPROACH -36 APPROACH 1 APPROACH REMOVE 2032
253 FENCE @ CL 719 723 -40 APPROACH -40 APPROACH -3 APPROACH N/A N/A
254 FENCE @ EXIST 718 725 -39 APPROACH -39 APPROACH -2 APPROACH N/A N/A
255 FENCE @ FUT 719 723 -58 TRANSITIONAL -41 APPROACH -8 APPROACH N/A N/A
256 TREE 719 770 4 APPROACH 4 APPROACH 42 APPROACH REMOVE 2019
257 TREE 719 780 10 APPROACH 10 APPROACH 49 APPROACH REMOVE 2019
258 TREE 720 781 9 APPROACH 9 APPROACH 49 APPROACH REMOVE 2019
259 TREE 720 776 0 APPROACH 0 APPROACH 42 APPROACH REMOVE 2019
260 ULT FENCE 723 729 -62 TRANSITIONAL -46 APPROACH -5 APPROACH N/A N/A
261 ULT FENCE @ CL 720 726 -57 APPROACH -57 APPROACH -13 APPROACH N/A N/A
262 ULT FENCE 715 721 -76 TRANSITIONAL -59 APPROACH -16 APPROACH N/A N/A
263 BUILDING 717 735 -53 TRANSITIONAL -49 APPROACH -4 APPROACH N/A N/A
264 BUILDING 722 740 -45 APPROACH -45 APPROACH 1 APPROACH LOWER 2019
265 TREE 718 791 4 APPROACH 4 APPROACH 50 APPROACH REMOVE 2019
266 TREE 717 816 29 APPROACH 29 APPROACH 75 APPROACH REMOVE 2019
267 TREE 717 817 29 APPROACH 29 APPROACH 75 APPROACH REMOVE 2019
268 TREE 717 816 26 APPROACH 26 APPROACH 73 APPROACH REMOVE 2019
269 TREE 716 800 2 TRANSITIONAL 10 APPROACH 57 APPROACH REMOVE 2019
270 TREE 715 807 3 TRANSITIONAL 17 APPROACH 64 APPROACH REMOVE 2019
271 SILO 723 753 -38 APPROACH -38 APPROACH 9 APPROACH LOWER 2019
272 BUILDING 717 735 -57 APPROACH -57 APPROACH -9 APPROACH N/A N/A
273 BUILDING 723 741 -51 APPROACH -51 APPROACH -3 APPROACH N/A N/A
274 TREE 716 803 3 TRANSITIONAL 11 APPROACH 59 APPROACH REMOVE 2019
275 TREE 716 805 6 TRANSITIONAL 12 APPROACH 60 APPROACH REMOVE 2019
276 TREE 718 807 12 APPROACH 12 APPROACH 61 APPROACH REMOVE 2019
277 TREE 719 809 14 APPROACH 14 APPROACH 63 APPROACH REMOVE 2019
278 TREE 717 798 3 APPROACH 3 APPROACH 53 APPROACH REMOVE 2019
279 TREE 717 797 -3 TRANSITIONAL 1 APPROACH 51 APPROACH REMOVE 2019
280 TREE 722 799 0 APPROACH 0 APPROACH 51 APPROACH REMOVE 2019
281 TREE 721 790 -9 APPROACH -9 APPROACH 42 APPROACH REMOVE 2019
282 TELEPHONE POLE 724 744 -62 TRANSITIONAL -51 APPROACH -1 APPROACH N/A N/A
283 TELEPHONE POLE 722 742 -53 APPROACH -53 APPROACH -4 APPROACH N/A N/A
OBSTRUCTIONS WITHIN RUNWAY 8OBSITEM DESCRIPTION
GNDELEV(FT)
OBJTOPELEV(FT)
EXISTINGSURFACEPENETRATION(FT)
EXISTINGSURFACEPENETRATED
FUTURESURFACEPENETRATION(FT)
FUTURESURFACEPENETRATED
ULTIMATESURFACEPENETRATION(FT)
ULTIMATESURFACEPENETRATED
PROPOSEDACTION
PROPOSEDACTION DATE
284 TELEPHONE POLE 724 744 -52 APPROACH -52 APPROACH -2 APPROACH N/A N/A
285 POWER POLE 726 751 -66 TRANSITIONAL -48 TRANSITIONAL 3 TRANSITIONAL LOWER 2032
286 POWER POLE 717 743 -54 APPROACH -54 APPROACH -4 APPROACH N/A N/A
287 POWER POLE 721 746 -51 APPROACH -51 APPROACH -1 APPROACH N/A N/A
288 POWER POLE 724 749 -48 APPROACH -48 APPROACH 2 APPROACH LOWER 2032
289 POWER POLE 725 750 -58 TRANSITIONAL -48 APPROACH 3 APPROACH LOWER 2032
290 MISSIMER ROAD @ ULT 714 729 -85 TRANSITIONAL -68 TRANSITIONAL -17 TRANSITIONAL N/A N/A
291 MISSIMER ROAD @ FUT 715 730 -84 TRANSITIONAL -66 APPROACH -17 APPROACH N/A N/A
292 MISSIMER ROAD @ EXIST 717 732 -64 APPROACH -64 APPROACH -14 APPROACH N/A N/A
293 MISSIMER ROAD @ CL 723 738 -59 APPROACH -59 APPROACH -9 APPROACH N/A N/A
294 MISSIMER ROAD @ EXIT 725 740 -57 APPROACH -57 APPROACH -7 APPROACH N/A N/A
295 MISSIMER ROAD @ FUT 726 741 -75 TRANSITIONAL -57 APPROACH -6 APPROACH N/A N/A
296 MISSIMER ROAD @ ULT 726 741 -76 TRANSITIONAL -58 TRANSITIONAL -6 TRANSITIONAL N/A N/A
297 BUILDING 723 741 -62 APPROACH -62 APPROACH -9 APPROACH N/A N/A
298 BUILDING 726 744 -60 APPROACH -60 APPROACH -7 APPROACH N/A N/A
299 TREE 724 774 -34 APPROACH -34 APPROACH 21 APPROACH REMOVE 2032
300 TREE 726 822 16 APPROACH 16 APPROACH 70 APPROACH REMOVE 2019
301 TREE 727 820 12 APPROACH 12 APPROACH 67 APPROACH REMOVE 2019
302 TREE 726 817 9 APPROACH 9 APPROACH 64 APPROACH REMOVE 2019
303 POWER POLE 728 753 -64 TRANSITIONAL -57 APPROACH -2 APPROACH N/A N/A
304 POWER POLE 730 755 -67 TRANSITIONAL -63 APPROACH -4 APPROACH N/A N/A
305 TREE 727 752 -84 TRANSITIONAL -66 APPROACH -7 APPROACH N/A N/A
306 POWER POLE 732 757 -69 TRANSITIONAL -66 APPROACH -5 APPROACH N/A N/A
307 TREE 728 758 -72 APPROACH -72 APPROACH -8 APPROACH N/A N/A
308 POWER POLE 733 758 -77 APPROACH -77 APPROACH -11 APPROACH N/A N/A
309 TREE 733 793 -62 TRANSITIONAL -51 APPROACH 19 APPROACH REMOVE 2032
310 OLD INLAND EMPIRE HWY 734 749 -97 APPROACH -97 APPROACH -27 APPROACH N/A N/A
311 POWER POLE 734 759 -89 APPROACH -89 APPROACH -18 APPROACH N/A N/A
312 TREE 734 794 -61 HORIZONTAL -61 HORIZONTAL 16 HORIZONTAL REMOVE 2032
313 TREE 729 779 -76 APPROACH -76 APPROACH -2 APPROACH N/A N/A
314 BUILDING 730 749 -107 APPROACH -107 APPROACH -32 APPROACH N/A N/A
315 TREE 728 788 -69 APPROACH -69 APPROACH 6 APPROACH REMOVE 2032
316 POWER POLE 734 759 -102 APPROACH -102 APPROACH -26 APPROACH N/A N/A
317 BUILDING 729 747 -114 APPROACH -114 APPROACH -38 APPROACH N/A N/A
318 BUILDING 734 752 -104 APPROACH -109 APPROACH -33 APPROACH N/A N/A
319 TREE 734 787 -69 APPROACH -75 APPROACH 2 APPROACH REMOVE 2032
320 TELEPHONE POLE 734 754 -111 APPROACH -111 APPROACH -33 APPROACH N/A N/A
321 TELEPHONE POLE 734 754 -116 APPROACH -116 APPROACH -36 APPROACH N/A N/A
322 POWER POLE 734 759 -114 APPROACH -114 APPROACH -33 APPROACH N/A N/A
323 TELEPHONE POLE 734 754 -124 APPROACH -124 APPROACH -40 APPROACH N/A N/A
324 TREE 739 819 -36 HORIZONTAL -36 HORIZONTAL 22 HORIZONTAL REMOVE 2032
325 POWER POLE 734 759 -126 APPROACH -126 APPROACH -40 APPROACH N/A N/A
326 TELEPHONE POLE 735 755 -133 APPROACH -133 APPROACH -45 APPROACH N/A N/A
327 TREE 740 820 -35 HORIZONTAL -35 HORIZONTAL 19 HORIZONTAL REMOVE 2032
328 TREE 743 823 -32 HORIZONTAL -32 HORIZONTAL 16 HORIZONTAL REMOVE 2032
329 POWER POLE 737 762 -141 APPROACH -141 APPROACH -47 APPROACH N/A N/A
330 TELEPHONE POLE 740 760 -145 APPROACH -145 APPROACH -50 APPROACH N/A N/A
331 TREE 733 773 -138 APPROACH -138 APPROACH -41 APPROACH N/A N/A
332 TREE 734 784 -132 APPROACH -132 APPROACH -33 APPROACH N/A N/A
333 TREE 737 797 -121 APPROACH -121 APPROACH -21 APPROACH N/A N/A
NOTES:1. DATE OF OBSTRUCTION FLIGHT WAS 9/13/14.2. NO KNOWN PENETRATIONS TO THE OFZ.

PROSSER AIRPORT - S40
AIRPORT MASTER PLAN UPDATE 7-10
Chapter 1
IntroductionC
hapter 2 Existing C
onditionsC
hapter 3 Aviation Activity
Forecasts
Chapter 4
Facility Requirem
entsC
hapter 5 Alternatives Analysis
Chapter 6
Phased Developm
ent and C
ost Estimates
Chapter 7
Airport Layout Plan
and Draw
ings
N
0
0SCALE IN FEET
VERT
HORZ 200 400
20 40
TRUE
NOR
TH
REUSE OF DRAWINGSTHIS DOCUMENT, AND THE IDEAS AND DESIGNS INCORPORATED HEREIN, AS AN INSTRUMENT OFPROFESSIONAL SERVICE, IS THE PROPERTY OF J-U-B ENGINEERS, Inc. AND IS NOT TO BE USED, IN WHOLE ORPART, FOR ANY OTHER PROJECT WITHOUT THE EXPRESS WRITTEN AUTHORIZATION OF J-U-B ENGINEERS, Inc.
APR.DESCRIPTIONNO.
REVISION
DATE
LAST UPDATED: 7/9/2019
DESIGN BY:
DRAWN BY:
CHECKED BY:
SHEET NUMBER:JUB PROJ. # :
30-15-020-C-AF-5
INCH, SCALE ACCORDINGLYAT FULL SIZE, IF NOT ONE
ONE INCH
FILE :
\\BO
ISE
FIL
ES
\PU
BLI
C\P
RO
JEC
TS
\JU
B\3
0-15
-020
- P
RO
SS
ER
MP
U\C
AD
\ALP
\30-
15-0
20-C
-AF
-5.D
WG
Plo
t Dat
e:7/
9/20
19 8
:56
AM
Plo
tted
By:
Sha
wn
Dul
inD
ate
Cre
ated
:5/2
/201
9
J-U-B ENGINEERS, INC.
Kennewick, WA 99336Suite 201
J-U-B ENGINEERS, INC.2810 W. Clearwater Ave.
www.jub.comFax: 509.736.0790
Phone: 509.783.2144
FAA UPDATE
J-U-B ENGINEERS, INC.
Kennewick, WA 99336Suite 201
J-U-B ENGINEERS, INC.2810 W. Clearwater Ave.
www.jub.comFax: 509.736.0790
Phone: 509.783.2144
www.jub.com
30-15-020
RUNWAY 26 INNER APPROACH SURFACEAF-6
SMD
----
----
RUNWAY END 26 - PLAN
RUNWAY END 26 - PROFILEVERTICAL SCALE: 20:1, HORIZONTAL SCALE: 200:1
HORIZONTAL ACCURACY:AT A MAP SCALE OF 1"=50' NOT MORE THAN 10% OF ALL WELL-DEFINED PLANIMETRICFEATURES ARE IN ERROR BY MORE THAN 1.0'VERTICAL ACCURACY:CONTOUR INTERVAL 1.0 NOT MORE THAN 10% OF ALL VERTICAL POINTS ARE INERROR BY MORE THAN 1/2 THE ABOVE CONTOUR INTERVAL.
NOTES:1. DATE OF OBSTRUCTION FLIGHT WAS 9/13/14.2. AGIS AND DOF OBSTRUCTS ACCOUNTED FOR.3. SEE SHEET AF-7 FOR LINE OF SIGHT PROFILE.
MODEL: WMM2015MAGNETIC DECLINATION 14°49'EAPRIL 24, 2018RATE OF CHANGE0° 8' W PER YEAR
CLEARANCE TABLE WITHIN RUNWAY 26 PART 77 APPROACH SURFACES
OBSITEM LOCATION GROUND
ELEVATIONTRAVERSE WAY
ADJUSMENT
EXISTINGAPPROACH
CLEARANCE
FUTUREAPPROACH
CLEARANCE
ULTIMATEAPPROACH
CLEARANCE
410 NORTH EDGE OF ULTIMATE APPROACH AT WINE COUNTRY ROAD 684.0 +15' N/A N/A 14.5'
416 NORTH EDGE OF FUTURE APPROACH AT WINE COUNTRY ROAD 683.2 +15' N/A 39.0' 16.7'
420 NORTH EDGE OF EXISTING APPROACH AT WINE COUNTRY ROAD 681.0 +15' 47.4' 47.4' 22.8'
432 APPROACH CENTERLINE AT WINE COUNTRY ROAD 676.5 +15' 64.9' 64.9' 34.9'
446 SOUTH EDGE OF EXISTING APPROACH AT WINE COUNTRY ROAD 672.3 +15' 76.6' 76.6' 85.4'
453 SOUTH EDGE OF FUTURE APPROACH AT WINE COUNTRY ROAD 670.1 +15' N/A 97.1' 57.3'
459 SOUTH EDGE OF ULTIMATE APPROACH AT WINE COUNTRY ROAD 664.6 +15' N/A N/A 64.5'
471 NORTH EDGE OF ULTIMATE APPROACH AT SOUTH WAMBA ROAD 674.7 +15' N/A N/A 58.7'
470 NORTH EDGE OF FUTURE APPROACH AT SOUTH WAMBAROAD 672.8 +15' N/A 107.9' 61.6'
469 NORTH EDGE OF EXISTING APPROACH AT SOUTH WAMBA ROAD 671.7 +15' 108.9' 108.9' 62.6'
468 APPROACH CENTERLINE AT SOUTH WAMBA ROAD 668.9 +15' 111.4' 111.4' 65.3'
467 SOUTH EDGE OF EXISTING APPROACH AT SOUTH WAMBA ROAD 665.7 +15' 115.6' 115.5' 69.0'
466 SOUTH EDGE OF FUTURE APPROACH AT SOUTH WAMBA ROAD 664.2 +15' N/A 114.5' 68.9'
500 SOUTH EDGE OF ULTIMATE APPROACH AT SOUTH WAMBA ROAD 664.2 +15' N/A N/A 66.7'
OBSTRUCTION LEGENDOBSTRUCTION ITEM CALLOUT
LIGHT POLE / POWER POLE
TREE
BUILDING / STRUCTURE
LEGENDEXISTING FUTURE ULTIMATE DESCRIPTION
AIRPORT PAVEMENT
AIRPORT PROPERTY LINE
AIRPORT PROPERTY EASEMENTS
APPROACH SURFACE
PART 77 APPROACH SURFACERUNWAY OBJECT FREE AREA (ROFA)
RUNWAY PROTECTION ZONE
RUNWAY SAFETY AREA
RUNWAY OBJECT FREE ZONETAXIWAY OBJECT FREE AREA (TOFA)
FENCE
FENCE TO BE RELOCATED
THRESHOLD LIGHTSLANDING AID (PAPI-2)
LANDING AID (REILS)
SUPPLEMENTAL WINDCONEGROUND CONTOURS (1' INTERVAL)

PROSSER AIRPORT - S40
AIRPORT MASTER PLAN UPDATE 7-11
Chapter 1
IntroductionC
hapter 2 Existing C
onditionsC
hapter 3 Aviation Activity
Forecasts
Chapter 4
Facility Requirem
entsC
hapter 5 Alternatives Analysis
Chapter 6
Phased Developm
ent and C
ost Estimates
Chapter 7
Airport Layout Plan
and Draw
ings
REUSE OF DRAWINGSTHIS DOCUMENT, AND THE IDEAS AND DESIGNS INCORPORATED HEREIN, AS AN INSTRUMENT OFPROFESSIONAL SERVICE, IS THE PROPERTY OF J-U-B ENGINEERS, Inc. AND IS NOT TO BE USED, IN WHOLE ORPART, FOR ANY OTHER PROJECT WITHOUT THE EXPRESS WRITTEN AUTHORIZATION OF J-U-B ENGINEERS, Inc.
APR.DESCRIPTIONNO.
REVISION
DATE
LAST UPDATED: 4/30/2019
DESIGN BY:
DRAWN BY:
CHECKED BY:
SHEET NUMBER:JUB PROJ. # :
30-15-020-C-AF-5
INCH, SCALE ACCORDINGLYAT FULL SIZE, IF NOT ONE
ONE INCH
FILE :
\\BO
ISE
FIL
ES
\PU
BLI
C\P
RO
JEC
TS
\JU
B\3
0-15
-020
- P
RO
SS
ER
MP
U\C
AD
\ALP
\30-
15-0
20-C
-AF
-5.D
WG
Plo
t Dat
e:5/
2/20
19 4
:37
PM
Plo
tted
By:
Sha
wn
Dul
inD
ate
Cre
ated
:4/1
9/20
19
J-U-B ENGINEERS, INC.
Kennewick, WA 99336Suite 201
J-U-B ENGINEERS, INC.2810 W. Clearwater Ave.
www.jub.comFax: 509.736.0790
Phone: 509.783.2144
FAA UPDATE
J-U-B ENGINEERS, INC.
Kennewick, WA 99336Suite 201
J-U-B ENGINEERS, INC.2810 W. Clearwater Ave.
www.jub.comFax: 509.736.0790
Phone: 509.783.2144
www.jub.com
30-15-020
RUNWAY 26 INNER APPROACH SURFACE OBSTRUCTION TABLESAF-6A
SMD
----
----
OBSTRUCTIONS WITHIN RUNWAY 26
OBSITEM DESCRIPTION
GNDELEV(FT)
OBJTOP
ELEV(FT)
EXISTINGSURFACE
PENETRATION(FT)
EXISTINGSURFACE
PENETRATED
FUTURESURFACE
PENETRATION(FT)
FUTURESURFACE
PENETRATED
ULTIMATESURFACE
PENETRATION(FT)
ULTIMATESURFACE
PENETRATED
PROPOSEDACTION
PROPOSEDACTION DATE
401 TAXILANE 685 705 4 TRANSITIONAL 22 TRANSITIONAL 22 APPROACH CLOSE 2027
402 APRON 685 705 -7 TRANSITIONAL 11 TRANSITIONAL 15 APPROACH CLOSE 2027
403 APRON 678 698 -3 TRANSITIONAL 14 APPROACH 14 APPROACH CLOSE 2027
404 HANGAR 675 694 -44 TRANSITIONAL -26 TRANSITIONAL -8 APPROACH N/A N/A
405 APRON 676 696 -49 TRANSITIONAL -31 TRANSITIONAL -10 APPROACH N/A N/A
406 WIND SOCK 677 688 -46 TRANSITIONAL -39 APPROACH -21 APPROACH N/A N/A
407 6 FT FENCE 684 690 -61 TRANSITIONAL -43 TRANSITIONAL -61 APPROACH N/A N/A
408 POWER POLE 684 720 -33 TRANSITIONAL -15 TRANSITIONAL -33 APPROACH N/A N/A
409 STREET LIGHT 684 701 -54 TRANSITIONAL -37 TRANSITIONAL -13 APPROACH N/A N/A
410 WINE COUNTRY ROAD @ ULT 684 699 -61 TRANSITIONAL -43 TRANSITIONAL -14 APPROACH N/A N/A
411 COVERED CITY MAP 682 696 -46 TRANSITIONAL -39 APPROACH -18 APPROACH N/A N/A
412 MAINTENACE HANGAR 674 700 -62 TRANSITIONAL -44 TRANSITIONAL -15 APPROACH N/A N/A
413 INFORMATION SIGN 682 693 -48 TRANSITIONAL -44 APPROACH -22 APPROACH N/A N/A
414 6 FT FENCE 682 688 -50 APPROACH -50 APPROACH -28 APPROACH N/A N/A
415 PATHWAY SIGN 682 692 -53 TRANSITIONAL -46 APPROACH -24 APPROACH N/A N/A
416 WINE COUNTRY ROAD @ FUT 684 699 -57 TRANSITIONAL -39 APPROACH -17 APPROACH N/A N/A
417 STREET LIGHT 683 717 -35 TRANSITIONAL -23 APPROACH 0 APPROACH NONE N/A
418 SPEED LIMIT SIGN 682 715 -28 TRANSITIONAL -26 APPROACH -2 APPROACH N/A N/A
419 POWER POLE (DOF OAS#53-022424) 683 720 -43 TRANSITIONAL -25 TRANSITIONAL 3 APPROACH NONE --
420 WINE COUNTRY ROAD @ EXIST 681 696 -47 APPROACH -47 APPROACH -23 APPROACH N/A N/A
421 STREET LIGHT 680 715 -32 APPROACH -32 APPROACH -6 APPROACH N/A N/A
422 BUILDING 682 700 -60 TRANSITIONAL -47 APPROACH -21 APPROACH N/A N/A
423 POWER POLE 682 718 -50 TRANSITIONAL -33 APPROACH -5 APPROACH N/A N/A
424 ROAD @ ULT 683 698 -80 TRANSITIONAL -62 TRANSITIONAL -25 APPROACH N/A N/A
425 6 FT FENCE @ CL 677 683 -69 APPROACH -69 APPROACH -41 APPROACH N/A N/A
426 TREE 680 720 -32 APPROACH -32 APPROACH -4 APPROACH N/A N/A
427 BUILDING 680 695 -58 APPROACH -58 APPROACH -29 APPROACH N/A N/A
428 TREE 682 722 -59 TRANSITIONAL -41 TRANSITIONAL -2 APPROACH N/A N/A
429 STREET LIGHT 677 699 -54 APPROACH -54 APPROACH -25 APPROACH N/A N/A
430 TREE 679 719 -37 APPROACH -37 APPROACH -7 APPROACH N/A N/A
431 STREET LIGHT 676 698 -58 APPROACH -58 APPROACH -28 APPROACH N/A N/A
432 WINE COUNTRY ROAD @ CL 676 691 -65 APPROACH -65 APPROACH -35 APPROACH N/A N/A
433 TREE 679 719 -38 TRANSITIONAL -38 APPROACH -7 APPROACH N/A N/A
434 STREET LIGHT 675 697 -63 APPROACH -63 APPROACH -31 APPROACH N/A N/A
435 BUILDING 676 691 -70 APPROACH -70 APPROACH -38 APPROACH N/A N/A
436 STREET LIGHT 674 695 -67 APPROACH -67 APPROACH -35 APPROACH N/A N/A
437 STREET LIGHT 674 691 -73 APPROACH -73 APPROACH -40 APPROACH N/A N/A
438 TREE 680 740 -52 TRANSITIONAL -34 TRANSITIONAL 9 APPROACH REMOVE 2025
439 POWER POLE 679 715 -66 TRANSITIONAL -50 APPROACH -17 APPROACH N/A N/A
440 OLD INLAND EMPIRE HWY @ FUT 679 694 -90 TRANSITIONAL -73 APPROACH -38 APPROACH N/A N/A
441 STREET LIGHT 674 709 -58 APPROACH -58 APPROACH -24 APPROACH N/A N/A
442 6 FT FENCE @ EXIST 673 679 -89 APPROACH -89 APPROACH -54 APPROACH N/A N/A
443 STREET LIGHT 673 690 -79 APPROACH -79 APPROACH -44 APPROACH N/A N/A
444 BUILDING 673 691 -78 APPROACH -78 APPROACH -43 APPROACH N/A N/A
445 6 FT FENCE @ FUT 670 676 -114 TRANSITIONAL -96 TRANSITIONAL -60 APPROACH N/A N/A
446 WINE COUNTRY ROAD @ EXST 681 696 -77 APPROACH -77 APPROACH -40 APPROACH N/A N/A
447 STREET LIGHT 672 707 -67 APPROACH -67 APPROACH -30 APPROACH N/A N/A
448 STREET LIGHT 670 688 -97 TRANSITIONAL -87 APPROACH -49 APPROACH N/A N/A
449 BUILDING 667 692 -114 TRANSITIONAL -96 TRANSITIONAL -46 APPROACH N/A N/A
450 4.5 FT FENCE @ FUT 669 673 -120 TRANSITIONAL -102 APPROACH -64 APPROACH N/A N/A
451 STREET LIGHT 667 681 -121 TRANSITIONAL -103 TRANSITIONAL -59 APPROACH N/A N/A
452 POWER POLE 676 712 -78 TRANSITIONAL -68 APPROACH -28 APPROACH N/A N/A
453 WINE COUNTRY ROAD @ FUT 668 683 -115 TRANSITIONAL -97 APPROACH -57 APPROACH N/A N/A
454 STREET LIGHT 667 686 -118 TRANSITIONAL -100 TRANSITIONAL -54 APPROACH N/A N/A
455 STREET LIGHT 668 705 -88 TRANSITIONAL -75 APPROACH -35 APPROACH N/A N/A
456 BUILDING 667 685 -98 APPROACH -98 APPROACH -57 APPROACH N/A N/A
457 STREET LIGHT 664 684 -138 TRANSITIONAL -120 TRANSITIONAL -138 APPROACH N/A N/A
458 STREET LIGHT 665 703 -113 TRANSITIONAL -95 TRANSITIONAL -41 APPROACH N/A N/A
459 WINE COUNTRY ROAD @ ULT 665 680 -140 TRANSITIONAL -122 TRANSITIONAL -64 APPROACH N/A N/A
460 BUILDING 667 684 -105 APPROACH -105 APPROACH -61 APPROACH N/A N/A
461 TREE 673 733 -56 APPROACH -56 APPROACH -12 APPROACH N/A N/A
462 BUILDING 673 688 -104 APPROACH -104 APPROACH -59 APPROACH N/A N/A
463 POWER POLE 673 709 -90 TRANSITIONAL -83 APPROACH -39 APPROACH N/A N/A
464 BUILDING 671 689 -103 APPROACH -103 APPROACH -58 APPROACH N/A N/A
465 BUILDING 663 678 -150 TRANSITIONAL -132 TRANSITIONAL -71 APPROACH N/A N/A
466 N. WAMBA RD 664 679 -132 TRANSITIONAL -115 APPROACH -69 APPROACH N/A N/A
467 N. WAMBA RD 666 681 -116 APPROACH -116 APPROACH -69 APPROACH N/A N/A
468 N. WAMBA RD 669 684 -111 APPROACH -111 APPROACH -65 APPROACH N/A N/A
469 N. WAMBA RD 672 687 -109 APPROACH -109 APPROACH -63 APPROACH N/A N/A
470 N. WAMBA RD 673 688 -126 TRANSITIONAL -108 APPROACH -62 APPROACH N/A N/A
471 N. WAMBA RD 676 691 -139 TRANSITIONAL -121 TRANSITIONAL -59 APPROACH N/A N/A
472 POWER POLE 672 708 -95 TRANSITIONAL -90 APPROACH -43 APPROACH N/A N/A
473 BUILDING 675 690 -144 TRANSITIONAL -126 TRANSITIONAL -62 APPROACH N/A N/A
474 BUILDING 672 688 -133 TRANSITIONAL -115 APPROACH -66 APPROACH N/A N/A
475 POWER POLE 671 707 -107 APPROACH -106 APPROACH -53 APPROACH N/A N/A
476 TREE 674 734 -117 TRANSITIONAL -99 TRANSITIONAL -26 APPROACH N/A N/A
477 NEW GATE DRIVE @ FUT 672 687 -152 TRANSITIONAL -135 APPROACH -78 APPROACH N/A N/A
478 NEW GATE DRIVE @ ULT 674 689 -166 HORIZONTAL -153 TRANSITIONAL -75 APPROACH N/A N/A
OBSTRUCTIONS WITHIN RUNWAY 26
OBSITEM DESCRIPTION
GNDELEV(FT)
OBJTOP
ELEV(FT)
EXISTINGSURFACE
PENETRATION(FT)
EXISTINGSURFACE
PENETRATED
FUTURESURFACE
PENETRATION(FT)
FUTURESURFACE
PENETRATED
ULTIMATESURFACE
PENETRATION(FT)
ULTIMATESURFACE
PENETRATED
PROPOSEDACTION
PROPOSEDACTION DATE
479 POWER POLE 669 705 -121 APPROACH -121 APPROACH -62 APPROACH N/A N/A
480 OLD INLAND EMPIRE HWY @ EXST 668 683 -146 APPROACH -146 APPROACH -86 APPROACH N/A N/A
481 COLUMBIA ROAD @ ULT 674 689 -166 HORIZONTAL -163 TRANSITIONAL -81 APPROACH N/A N/A
482 BUILDING 650 668 -164 TRANSITIONAL -163 APPROACH -102 APPROACH N/A N/A
483 TREE 643 683 -159 TRANSITIONAL -150 APPROACH -88 APPROACH N/A N/A
484 POWER POLE 666 702 -133 APPROACH -133 APPROACH -70 APPROACH N/A N/A
485 TREE 670 750 -103 TRANSITIONAL -85 APPROACH -23 APPROACH N/A N/A
486 TREE 673 723 -133 HORIZONTAL -133 HORIZONTAL -51 TRANSITIONAL N/A N/A
487 POWER POLE 662 698 -146 APPROACH -146 APPROACH -80 APPROACH N/A N/A
488 TREE 666 706 -150 HORIZONTAL -139 APPROACH -73 APPROACH N/A N/A
489 TREE 657 697 -150 APPROACH -150 APPROACH -82 APPROACH N/A N/A
490 TREE 653 693 -158 APPROACH -158 APPROACH -89 APPROACH N/A N/A
491 POWER POLE 659 695 -158 APPROACH -158 APPROACH -88 APPROACH N/A N/A
492 TREE 658 718 -137 APPROACH -137 APPROACH -66 APPROACH N/A N/A
493 ACCESS ROAD 647 657 -200 APPROACH -200 APPROACH -128 APPROACH N/A N/A
494 TREE 645 685 -173 APPROACH -173 APPROACH -101 APPROACH N/A N/A
495 POWER POLE 659 695 -160 HORIZONTAL -167 APPROACH -93 APPROACH N/A N/A
496 POWER POLE 666 702 -153 HORIZONTAL -153 HORIZONATAL -90 TRANSITIONAL N/A N/A
497 POWER POLE 656 692 -175 APPROACH -175 APPROACH -100 APPROACH N/A N/A
498 TREE 641 701 -154 HORIZONTAL -154 HORIZONTAL -91 APPROACH N/A N/A
499 TREE 626 666 -202 APPROACH -202 APPROACH -126 APPROACH N/A N/A
500 N. WAMBA RD 664 679 -144 TRANSITIONAL -126 TRANSITIONAL -67 APPROACH N/A N/A
NOTES:1. DATE OF OBSTRUCTION FLIGHT WAS 9/13/14.2. NO KNOWN PENETRATIONS TO THE OFZ.

PROSSER AIRPORT - S40
AIRPORT MASTER PLAN UPDATE 7-12
Chapter 1
IntroductionC
hapter 2 Existing C
onditionsC
hapter 3 Aviation Activity
Forecasts
Chapter 4
Facility Requirem
entsC
hapter 5 Alternatives Analysis
Chapter 6
Phased Developm
ent and C
ost Estimates
Chapter 7
Airport Layout Plan
and Draw
ings
N
2000 400
SCALE IN FEET
TRUE
NOR
TH
REUSE OF DRAWINGSTHIS DOCUMENT, AND THE IDEAS AND DESIGNS INCORPORATED HEREIN, AS AN INSTRUMENT OFPROFESSIONAL SERVICE, IS THE PROPERTY OF J-U-B ENGINEERS, Inc. AND IS NOT TO BE USED, IN WHOLE ORPART, FOR ANY OTHER PROJECT WITHOUT THE EXPRESS WRITTEN AUTHORIZATION OF J-U-B ENGINEERS, Inc.
APR.DESCRIPTIONNO.
REVISION
DATE
LAST UPDATED: 5/2/2019
DESIGN BY:
DRAWN BY:
CHECKED BY:
SHEET NUMBER:JUB PROJ. # :
30-15-020-C-AF-7
INCH, SCALE ACCORDINGLYAT FULL SIZE, IF NOT ONE
ONE INCH
FILE :
\\BO
ISE
FIL
ES
\PU
BLI
C\P
RO
JEC
TS
\JU
B\3
0-15
-020
- P
RO
SS
ER
MP
U\C
AD
\ALP
\30-
15-0
20-C
-AF
-7.D
WG
Plo
t Dat
e:5/
3/20
19 6
:54
AM
Plo
tted
By:
Sha
wn
Dul
inD
ate
Cre
ated
:5/2
/201
9
J-U-B ENGINEERS, INC.
Kennewick, WA 99336Suite 201
J-U-B ENGINEERS, INC.2810 W. Clearwater Ave.
www.jub.comFax: 509.736.0790
Phone: 509.783.2144
FAA UPDATE
J-U-B ENGINEERS, INC.
Kennewick, WA 99336Suite 201
J-U-B ENGINEERS, INC.2810 W. Clearwater Ave.
www.jub.comFax: 509.736.0790
Phone: 509.783.2144
www.jub.com
30-15-020
RUNWAY CENTERLINE PLAN AND PROFILEAF-7
SMD
----
----
RUNWAY 8-26 PLAN
RUNWAY END 8 - PROFILEVERTICAL SCALE: 10:1, HORIZONTAL SCALE: 200:1LEGEND
EXISTING FUTURE ULTIMATE DESCRIPTIONAIRPORT PAVEMENT
AIRPORT PROPERTY LINERUNWAY OBJECT FREE AREA (ROFA)
RUNWAY SAFETY AREA
RUNWAY OBJECT FREE ZONETAXIWAY OBJECT FREE AREA (TOFA)
FENCE
THRESHOLD LIGHTSLANDING AID (PAPI-2)
LANDING AID (REILS)
SUPPLEMENTAL WINDCONEAIRPORT REFERENCE POINT (ARP)
GROUND CONTOURS (2' INTERVAL)
MODEL: WMM2015MAGNETIC DECLINATION 14°49'EAPRIL 24, 2018RATE OF CHANGE0° 8' W PER YEAR

PROSSER AIRPORT - S40
AIRPORT MASTER PLAN UPDATE 7-13
Chapter 1
IntroductionC
hapter 2 Existing C
onditionsC
hapter 3 Aviation Activity
Forecasts
Chapter 4
Facility Requirem
entsC
hapter 5 Alternatives Analysis
Chapter 6
Phased Developm
ent and C
ost Estimates
Chapter 7
Airport Layout Plan
and Draw
ings
REUSE OF DRAWINGSTHIS DOCUMENT, AND THE IDEAS AND DESIGNS INCORPORATED HEREIN, AS AN INSTRUMENT OFPROFESSIONAL SERVICE, IS THE PROPERTY OF J-U-B ENGINEERS, Inc. AND IS NOT TO BE USED, IN WHOLE ORPART, FOR ANY OTHER PROJECT WITHOUT THE EXPRESS WRITTEN AUTHORIZATION OF J-U-B ENGINEERS, Inc.
APR.DESCRIPTIONNO.
REVISION
DATE
LAST UPDATED: 5/2/2019
DESIGN BY:
DRAWN BY:
CHECKED BY:
SHEET NUMBER:JUB PROJ. # :
30-15-020-C-AF-8
INCH, SCALE ACCORDINGLYAT FULL SIZE, IF NOT ONE
ONE INCH
FILE :
\\BO
ISE
FIL
ES
\PU
BLI
C\P
RO
JEC
TS
\JU
B\3
0-15
-020
- P
RO
SS
ER
MP
U\C
AD
\ALP
\30-
15-0
20-C
-AF
-8.D
WG
Plo
t Dat
e:5/
2/20
19 4
:19
PM
Plo
tted
By:
Sha
wn
Dul
inD
ate
Cre
ated
:4/3
0/20
19
J-U-B ENGINEERS, INC.
Kennewick, WA 99336Suite 201
J-U-B ENGINEERS, INC.2810 W. Clearwater Ave.
www.jub.comFax: 509.736.0790
Phone: 509.783.2144
FAA UPDATE
J-U-B ENGINEERS, INC.
Kennewick, WA 99336Suite 201
J-U-B ENGINEERS, INC.2810 W. Clearwater Ave.
www.jub.comFax: 509.736.0790
Phone: 509.783.2144
www.jub.com
30-15-020
TERMINAL AREA PLANAF-8
SMD
----
----
FUTURE BUILDING AND FACILITIES LIST
NO. DESCRIPTION DIMENSIONAPPROXIMATESIZE (SQ. FT.) HEIGHT TOP ELEV.
HANGAR 100X130 13,000 35 715
HANGAR 100X130 13,000 35 715
FUEL TANKS N/A 500 10 688
FUEL ISLAND 25X55 1,375 6 686
FUTURE GA FBO TERMINAL 100X130 13,000 35 712
HANGAR 75X75 5,625 35 709
HANGAR 75X75 5,625 35 709
HANGAR 65X70 4,550 35 709
HANGAR 75X75 5,625 35 708
HANGAR 50X50 2,500 35 708
HANGAR 50X50 2,500 35 708
HANGAR 50X50 2,500 35 708
HANGAR 50X50 2,500 35 708
T-HANGARS (QTY 5) 50X126 6,300 35 707
HANGAR 65X80 5,200 35 708
HANGAR 65X80 5,200 35 708
HANGAR 65X60 3,900 35 708
HANGAR 65X60 3,900 35 708
262728293031323334353637383940414243
N
1000 200
SCALE IN FEET
TRUE
NOR
TH
EXISTING BUILDING AND FACILITIES LIST
NO. DESCRIPTION CONDITIONAPPROXIMATESIZE (SQ. FT.) HEIGHT TOP ELEV.
ROTATING BEACON AND TOWER GOOD N/A 54 729
FBO / PILOT LOUNGE GOOD 3,800 21 698
RESTROOMS GOOD 800 12 687
EAA BUILDING GOOD 900 12 687
FUEL TANK GOOD N/A 11 691
T-HANGARS GOOD 5,670 17 695
HANGAR GOOD 4,800 17 693
T-HANGARS POOR 4,600 17 693
HANGAR GOOD 3,400 17 693
HANGAR GOOD 3,000 17 693
HANGAR GOOD 3,600 23 698
HANGAR GOOD 3,600 23 698
T-HANGARS FAIR 4,600 17 694
HANGAR NEW 5,800 23 697
T-HANGARS FAIR 8,600 17 694
HANGAR GOOD 3,750 23 697
HANGAR GOOD 3,000 23 695
HANGAR GOOD 3,600 20 693
MAINTENANCE HANGAR GOOD 4,000 18 690
INDUSTRIAL PARK BUILING GOOD 12,000 27 700
INDUSTRIAL PARK BUILDING GOOD 12,000 23 696
HANGAR (ABANDONED CONCRETE) N/A 925 0 675
T-HANGAR (TO BE REMOVED) POOR 925 17 704
LIGHTED WIND SOCK AND SEGMENTED CIRCLE GOOD N/A 23 709
CHUKAR CHERRIES (4 BLDGS) GOOD N/A 23 692
123456789
10111213141516171819202122232425
ULTIMATE BUILDING AND FACILITIES LIST
NO. DESCRIPTION DIMENSIONAPPROXIMATESIZE (SQ. FT.) HEIGHT TOP ELEV.
HANGAR (QTY 2) 75X75 5,625 30 706
T-HANGARS (QTY 5) 50X126 6,300 35 707
FUEL TANKS N/A 500 10 688
444546
LEGENDEXISTING FUTURE ULTIMATE DESCRIPTION
BUILDING/STRUCTURE
AIRPORT PAVEMENT
ROADWAY
BUILDING ENVELOPE (LOT)
AIRPORT PROPERTY LINE
APPROACH SURFACE
PART 77 APPROACH SURFACE
BUILDING RESTRICTION LINERUNWAY OBJECT FREE AREA (ROFA)
RUNWAY PROTECTION ZONE
RUNWAY SAFETY AREA
RUNWAY OBJECT FREE ZONETAXIWAY OBJECT FREE AREA (TOFA)
NAVAID CRITICAL AREA
FENCE
THRESHOLD LIGHTSLANDING AID (PAPI-2)
LANDING AID (REILS)
SUPPLEMENTAL WINDCONEAIRPORT REFERENCE POINT (ARP)PAVEMENT TO BECLOSED/REMOVED/ABANDONED
1
2
34
5
67
89 10
11
12
13
15
16
17
18
19
20
2127 30
31 32 33
35
36
3738
40 41 42 43
39
44
451426
22
2324
28
46
29
MODEL: WMM2015MAGNETIC DECLINATION 14°49'EAPRIL 24, 2018RATE OF CHANGE0° 8' W PER YEAR
NOTES:1. TRUE BEARINGS LISTED FOR RUNWAYS ARE GEODETIC VALUES. ELEVATIONS PUBLISHED ARE
BASED ON NAD88 VERTICAL DATUM. HORIZONTAL DATUM IS NAD83/2011.2. DATE OF OBSTRUCTION FLIGHT WAS 9/13/14.3. ALL EXISTING TAXIWAY WIDTHS ARE 25'.4. EXISTING AND FUTURE BUILDINGS ARE LABELED ON THE TERMINAL AREA PLAN.5. RUNWAY 8 PAPI-2 IS LOCATED AT STATION 205+17, 99.2 FT FROM RUNWAY CENTERLINE. RUNWAY 26
PAPI-2 IS LOCATED AT STATION 230+49, 91.4 FT FROM RUNWAY CENTERLINE.6. RUNWAY 8 REILS ARE LOCATED AT STATION 199+59, 105 FT FROM RUNWAY CENTERLINE. RUNWAY 26
REILS ARE LOCATED AT STATION 234+19, 105 FT FROM RUNWAY CENTERLINE.7. TAXIWAY A EDGE SAFETY MARGIN (TESM); TAXIWAY DESIGN GROUP (TDG) 1A (E,F): 5 FT, 1B (U): 5 FT8. TAXIWAY A SHOULDER WIDTH; TAXIWAY DESIGN GROUP (TDG) 1A (E,F): 10 FT, 1B (U): 10 FT9. RUNWAY SHOULDER WIDTH; B-I SMALL (E,F): 10 FT, B-II (U): 10 FT10. TAXIWAY A OBJECT FREE AREA (TOFA); AIRPLANE DESIGN GROUP (ADG) I: 89 FT11. TAXILANE OBJECT FREE AREA (TOFA); AIRPLANE DESIGN GROUP (ADG) I: 79 FT12. TAXIWAY/TAXILANE SAFETY AREA (TSA); AIRPLANE DESIGN GROUP (ADG) I: 49 FT13. APRON (E): 35,494 SQUARE YARDS, APRON (F)(U) 19,470 SQUARE YARDS14. ALL FENCES ARE 6 FEET IN HEIGHT UNLESS OTHERWISE NOTED.15. THE DEPICTED 35-FOOT BUILDING RESTRICTION LINE IS INTENDED AS A GUIDELINE ONLY. FUTURE
HANGARS MUST RECEIVE A NO-HAZARD DETERMINATION VIA FAA FROM 7460 FILING.
25
34

PROSSER AIRPORT - S40
AIRPORT MASTER PLAN UPDATE 7-14
Chapter 1
IntroductionC
hapter 2 Existing C
onditionsC
hapter 3 Aviation Activity
Forecasts
Chapter 4
Facility Requirem
entsC
hapter 5 Alternatives Analysis
Chapter 6
Phased Developm
ent and C
ost Estimates
Chapter 7
Airport Layout Plan
and Draw
ings
N
4000 800
SCALE IN FEET
TRUE
NOR
TH
REUSE OF DRAWINGSTHIS DOCUMENT, AND THE IDEAS AND DESIGNS INCORPORATED HEREIN, AS AN INSTRUMENT OFPROFESSIONAL SERVICE, IS THE PROPERTY OF J-U-B ENGINEERS, Inc. AND IS NOT TO BE USED, IN WHOLE ORPART, FOR ANY OTHER PROJECT WITHOUT THE EXPRESS WRITTEN AUTHORIZATION OF J-U-B ENGINEERS, Inc.
APR.DESCRIPTIONNO.
REVISION
DATE
LAST UPDATED: 4/30/2019
DESIGN BY:
DRAWN BY:
CHECKED BY:
SHEET NUMBER:JUB PROJ. # :
30-15-020-C-AF-9
INCH, SCALE ACCORDINGLYAT FULL SIZE, IF NOT ONE
ONE INCH
FILE :
\\BO
ISE
FIL
ES
\PU
BLI
C\P
RO
JEC
TS
\JU
B\3
0-15
-020
- P
RO
SS
ER
MP
U\C
AD
\ALP
\30-
15-0
20-C
-AF
-9.D
WG
Plo
t Dat
e:5/
2/20
19 4
:36
PM
Plo
tted
By:
Sha
wn
Dul
inD
ate
Cre
ated
:4/3
0/20
19
J-U-B ENGINEERS, INC.
Kennewick, WA 99336Suite 201
J-U-B ENGINEERS, INC.2810 W. Clearwater Ave.
www.jub.comFax: 509.736.0790
Phone: 509.783.2144
FAA UPDATE
J-U-B ENGINEERS, INC.
Kennewick, WA 99336Suite 201
J-U-B ENGINEERS, INC.2810 W. Clearwater Ave.
www.jub.comFax: 509.736.0790
Phone: 509.783.2144
www.jub.com
30-15-020
LAND USEAF-9
SMD
----
----
LEGENDEXISTING FUTURE ULTIMATE DESCRIPTION
BUILDING/STRUCTURE
AIRPORT PAVEMENT
ROADWAY
AIRPORT PROPERTY LINE
PARCEL LINES
PROSSER CITY LIMITS
BUILDING RESTRICTION LINE
RUNWAY SAFETY AREA
NAVAID CRITICAL AREA
FENCE
CITY OF PROSSER LAND USEAT - AGRICULTURAL - TOURISM
CT - COMMERCIAL THOROUGHFARE
CN - COMMERCIAL NEIGHBORHOOD
CG - COMMERCIAL GENERAL
CD - COMMERCIAL DOWNTOWN
RH- RESIDENTIAL HIGH DENSITY
RM - RESIDENTIAL MEDIUM DENSITY
RMHP - RESIDENTIAL MANUFACTURED HOME PARK
RMS - RESIDENTIAL MANUFACTURED HOME SUBDIVISION
PF - PUBLIC FACILITY
IL - INDUSTRIAL LIGHT
BENTON COUNTY LAND USEGC - GENERAL COMMERCIAL
IL - LIGHT INDUSTRIAL
UGAR
RL-1
RL-5
PD - PARK DISTRICT
AIRPORT SAFETY COMPATIBILITY ZONES
ZONE 1 - RUNWAY PROTECTION ZONE
ZONE 2 - RUNWAY APPROACH ZONE
ZONE 3 - TURNING ZONE
ZONE 4 - EXTENDED RUNWAY ZONE
ZONE 5 - RUNWAY SAFETY AREA
ZONE 6 - TRAFFIC PATTERN ZONE
AIRPORT LAND USEAVIATION
AVIATION RESERVE
TERMINAL AREA
NON-AVIATION INDUSTRIAL
NOTES:
GOAL LU-9: PROVIDE THE PROSSER AIRPORT WITH REASONABLE PROTECTION FROM AIRSPACEOBSTRUCTIONS, INCOMPATIBLE LAND USES, AND NUISANCE COMPLAINTS THAT COULD RESTRICT OPERATIONS.
POLICY LU-9.1: KEEP RESIDENTIAL LAND UNDERLYING THE AIR APPROACH EAST AND WEST OF THERUNWAY TO A LOW DENSITY AND INTENSITY. COMMERCIAL USES, THAT ATTRACTSIGNIFICANT NUMBERS OF PEOPLE, SHOULD BE DISCOURAGED.
POLICY LU-9.2: PLAN LAND USE AROUND THE AIRPORT WITH POTENTIAL NOISE PROBLEMS IN MIND.OPEN SPACE USES ARE MOST DESIRABLE, SUCH AS, PARKS, CEMETERIES, GOLFCOURSES, ETC. COMMERCIAL USES CONSISTENT WITH THE LAND USE MAP ARE APPROPRIATE PROVIDED APPROPRIATE NOISE INSTALLATION MEASURES ARE INCORPORATED INTO THE CONSTRUCTION OF NEW BUILDINGS. INDUSTRIAL USES AREAPPROPRIATE IF LOCATED IN A PLANNED PARK. LOW-DENSITY RESIDENTIAL USE WITHSOUND-REDUCTION WOULD BE APPROPRIATE.
POLICY LU-9.3: PLAN INDUSTRIAL SITE DEVELOPMENT IN THE AIRPORT AREA KEEPING IN MIND THENEEDS AND OPERATIONS OF THE AIRPORT.
COMPATABILITY ZONE LAND USE GUIDELINES:
ZONE 1: AVOID LAND USES WHICH CONCENTRATE PEOPLE INDOORS OR OUTDOORS.PROHIBIT ALL RESIDENTIAL LAND USES. ALL NON-RESIDENTIAL LAND USES PERMITTED OUTRIGHT SUBJECT TO THEPOPULATION DENSITY AND SPECIAL FUNCTION LAND USE GUIDELINES.PROHIBIT ALL SPECIAL FUNCTION LAND USES.
ZONE 2: AVOID LAND USES WHICH CONCENTRATE PEOPLE INDOORS OR OUTDOORS.PROHIBIT ALL RESIDENTIAL LAND USES. ALL NON-RESIDENTIAL LAND USES PERMITTED OUTRIGHT SUBJECT TO THEPOPULATION DENSITY AND SPECIAL FUNCTION LAND USE GUIDELINES.PROHIBIT ALL SPECIAL FUNCTION LAND USES.
ZONE 3: AVOID LAND USES WHICH CONCENTRATE PEOPLE INDOORS OR OUTDOORS.RUNWAY <4,000 FEET - PROHIBIT ALL RESIDENTIAL LAND USES.ALL NON-RESIDENTIAL LAND USES PERMITTED OUTRIGHT SUBJECT TO THE SPECIAL FUNCTION LAND USE GUIDELINES.PROHIBIT ALL SPECIAL FUNCTION LAND USES.
ZONE 4: LIMIT POPULATION CONCENTRATIONS.RUNWAY <4,000 FEET - PROHIBIT ALL RESIDENTIAL LAND USES.ALL NON-RESIDENTIAL LAND USES PERMITTED OUTRIGHT SUBJECT TO THE SPECIAL FUNCTION LAND USE GUIDELINES.PROHIBIT ALL SPECIAL FUNCTION LAND USES
ZONE 5: AVOID LAND USES WHICH CONCENTRATE PEOPLE INDOORS OR OUTDOORS.PROHIBIT ALL RESIDENTIAL LAND USES. ALL NON-RESIDENTIAL LAND USES PERMITTED OUTRIGHT SUBJECT TO THEPOPULATION DENSITY AND SPECIAL FUNCTION LAND USE GUIDELINES.PROHIBIT ALL SPECIAL FUNCTION LAND USES.
ZONE 6: LIMIT LARGE CONCENTRATIONS OF PEOPLE.RUNWAY <4,000 FEET - MAXIMUM 1DU/5 ACRE IN RURAL AREAS OR 1 DU/5 ACRE IN URBAN AREAALL NON-RESIDENTIAL LAND USES PERMITTED OUTRIGHT SUBJECT TO THE SPECIAL FUNCTION LAND USE GUIDELINES.PROHIBIT ALL SPECIAL FUNCTION LAND USES
MODEL: WMM2015MAGNETIC DECLINATION 14°49'EAPRIL 24, 2018RATE OF CHANGE0° 8' W PER YEAR

PROSSER AIRPORT - S40
AIRPORT MASTER PLAN UPDATE 7-15
Chapter 1
IntroductionC
hapter 2 Existing C
onditionsC
hapter 3 Aviation Activity
Forecasts
Chapter 4
Facility Requirem
entsC
hapter 5 Alternatives Analysis
Chapter 6
Phased Developm
ent and C
ost Estimates
Chapter 7
Airport Layout Plan
and Draw
ings
N
3000 600
SCALE IN FEET
TRUE
NOR
TH
REUSE OF DRAWINGSTHIS DOCUMENT, AND THE IDEAS AND DESIGNS INCORPORATED HEREIN, AS AN INSTRUMENT OFPROFESSIONAL SERVICE, IS THE PROPERTY OF J-U-B ENGINEERS, Inc. AND IS NOT TO BE USED, IN WHOLE ORPART, FOR ANY OTHER PROJECT WITHOUT THE EXPRESS WRITTEN AUTHORIZATION OF J-U-B ENGINEERS, Inc.
APR.DESCRIPTIONNO.
REVISION
DATE
LAST UPDATED: 4/30/2019
DESIGN BY:
DRAWN BY:
CHECKED BY:
SHEET NUMBER:JUB PROJ. # :
30-15-020-C-AF-10
INCH, SCALE ACCORDINGLYAT FULL SIZE, IF NOT ONE
ONE INCH
FILE :
\\BO
ISE
FIL
ES
\PU
BLI
C\P
RO
JEC
TS
\JU
B\3
0-15
-020
- P
RO
SS
ER
MP
U\C
AD
\ALP
\30-
15-0
20-C
-AF
-10.
DW
G
Plo
t Dat
e:5/
2/20
19 4
:33
PM
Plo
tted
By:
Sha
wn
Dul
inD
ate
Cre
ated
:4/3
0/20
19
J-U-B ENGINEERS, INC.
Kennewick, WA 99336Suite 201
J-U-B ENGINEERS, INC.2810 W. Clearwater Ave.
www.jub.comFax: 509.736.0790
Phone: 509.783.2144
FAA UPDATE
J-U-B ENGINEERS, INC.
Kennewick, WA 99336Suite 201
J-U-B ENGINEERS, INC.2810 W. Clearwater Ave.
www.jub.comFax: 509.736.0790
Phone: 509.783.2144
www.jub.com
30-15-020
AIRPORT PROPERTY INVENTORY - EXHIBIT AAF-10
SMD
----
----
FUTURE PROPERTY ACQUISITION INFORMATION
PARCEL OWNER TYPE OFINTEREST
ACREAGE(APPROX)
DATE OFACQUISITON REMARKS
LOT 23 SHANAFELT, MATTHEW
LOT 24 GAGNER, JAMES & JOAN
LEGENDEXISTING FUTURE ULTIMATE DESCRIPTION
BUILDING/STRUCTURE
AIRPORT PAVEMENT
ROADWAY
BUILDING ENVELOPE (LOT)
AIRPORT PROPERTY LINE
AIRPORT PROPERTY EASEMENTS
APPROACH SURFACE
PART 77 APPROACH SURFACE
BUILDING RESTRICTION LINERUNWAY OBJECT FREE AREA (ROFA)
RUNWAY PROTECTION ZONE
RUNWAY SAFETY AREA
RUNWAY OBJECT FREE ZONETAXIWAY OBJECT FREE AREA (TOFA)
NAVAID CRITICAL AREA
FENCE
FENCE TO BE RELOCATED
AIRPORT PROPERTY PARCEL INFORMATION
PARCEL GRANTOR TYPE OFINTEREST
ACREAGE(APPROX.) INSTRUMENT AUDITORS FILE
NUMBERBOOK AND
PAGEDATE OF
ACQUISITIONFAA
GRANT/YEARACQUISITION
PURPOSEKNOWN
EMCUMBRANCES EASEMENTS & REMARKSLOT 1 PROPST FEE 16.06 WARRANTY DEED 1996-8130 7/5/1995 AIRPORTLOT 2 PROPST & STONE FEE 3.15 WARRANTY DEED 1989-17800 11/9/1989 3-53-0050-02/1991 AIRPORTLOT 3 CITY OF PROSSER FEE 50.92 QUIT CLAIM DEED 1946-3943 6/19/1961 AIRPORTLOT 13 SMITH FEE 8.02 WARRANTY DEED 2007-033272 10/5/2007 3-53-0050-10/2008 AIRPORT NONE
LOT 14 WHITED FEE 1.18 WARRANTY DEED 2009-003302 1/15/2010 3-53-0050-11/2009 AIRPORT1) WA. IRR. CO. ROW FOR MAINT. 2) ROW BENTON PUD POWER EASEMENT W10-FT OF E 25-FT OF PROPERTY. 3) ROW BENTON PUD POWER EASEMENT S10-FT OF N 277 FT OF E 425 FT OIE HWY AND STEELE RD
LOT 15 DELEON FEE 1.57 WARRANTY DEED 2009-008364 2/13/2009 3-53-0050-11/2009 AIRPORT
Sunnyside IrrigationDist. 93-20056, Road &Irrigation Maint.Agreements btw Smithand Robledo 93-24982
1) WA. IRR. CO. ROW FOR MAINT. 2) SUNNYSIDE VALLEY IRR PROJECT & ROWFOR WATER IN FAVOR OF KATHLEEN WILKINSON-SMITH. 3) BENTON PUDIRRIGATION 10-FT ALONG SOUTH AND WEST SIDES. 4) ROW EASEMENT BENTONPUD 93-25410
LOT 16 MARTIN FEE 1.72 WARRANTY DEED 2009-03044 7/13/2009 3-53-0050-11/2009 AIRPORT 1) SUNNYSIDE VALLEY IRR PROJECT. 2) WA. IRR. CO. ROW FOR MAINT. 3) ROWEASEMENT BENTON PUD ELECTRIC POWER LINE & ROAD
LOT 20 SYBOUTS FEE 4 WARRANTY DEED 2009-00330 1/8/2009 3-53-0050-13/2010 AIRPORT 1) WA. IRR. CO. ROW FOR MAINT. 2) SUNNYSIDE VALLEY IRR PROJECT. 3) CITYOF PROSSER ROW FOR OIE HWY
LOT 21 KILLIAN FEE 4 WARRANTY DEED 2009-003296 12/23/2008 3-53-0050-13/2010 AIRPORT1) WA. IRR. CO. ROW FOR MAINT. 2) SUNNYSIDE VALLEY IRR PROJECT. 3) CITYOF PROSSER ROW FOR OIE HWY, 4) Avigation Easement 5/6/1948, Vol 96/Pg367 covers Killian, McGrew and Sybouts Properties
LOT 22 MCGREW FEE 2.92 WARRANTY DEED 2010-002165 2/26/2009 3-53-0050-13/2010 AIRPORT 1) WA. IRR. CO. ROW FOR MAINT. 2) SUNNYSIDE VALLEY IRR PROJECT. 3) CITYOF PROSSER
TRACT 1 CITY OF PROSSER FEE 7.27 QUIT CLAIM DEED 1945-7938 VOL. 2, PG. 37 6/19/1961 AIRPORT ALLGAIER'S HOME TRACT 1TRACT 2 CITY OF PROSSER FEE 7.52 QUIT CLAIM DEED 1945-7938 VOL. 2, PG. 37 6/19/1961 AIRPORT ALLGAIER'S HOME TRACT 2TRACT 3 CITY OF PROSSER FEE 9.49 QUIT CLAIM DEED 1945-7938 VOL. 2, PG. 37 6/19/1961 AIRPORT ALLGAIER'S HOME TRACT 3TRACT 4 CITY OF PROSSER FEE 9.49 QUIT CLAIM DEED 1945-7938 VOL. 2, PG. 37 6/19/1961 AIRPORT ALLGAIER'S HOME TRACT 4TRACT 5 PROPST FEE 9.66 WARRANTY DEED 1996-8130 VOL. 2, PG. 37 7/5/1995 AIRPORT ALLGAIER'S HOME TRACT 5TRACT 6 PROPST FEE 9.66 WARRANTY DEED 1996-8130 VOL. 2, PG. 37 7/5/1995 AIRPORT ALLGAIER'S HOME TRACT 6TRACT 7 B&K, INC. FEE 6.61 HISTORICAL DEED 1998-01538 VOL. 2, PG. 37 4/8/1998 3-53-00050-04/1999 AIRPORT ALLGAIER'S HOME TRACT 7 (PORTION)TRACT 7A B&K, INC. FEE 1 WARRANTY DEED 1980-5429 10/18/1979 5-53-0050-01/1977 AIRPORT ALLGAIER'S HOME TRACT 7 (PORTION)TRACT 8 B&K, INC. FEE 6.38 HISTORICAL DEED 1998-01538 VOL. 2, PG. 37 4/8/1998 3-53-00050-04/1999 AIRPORT ALLGAIER'S HOME TRACT 8 (PORTION)TRACT 8A B&K, INC. FEE 0.97 WARRANTY DEED 1980-5429 10/18/1979 5-53-0050-01/1977 AIRPORT ALLGAIER'S HOME TRACT 8 (PORTION)*This information should be used for planning purposes only. An official land survey should be completed to attained accurate information. No Surplus Property Transfer, Government Land Transfer or statutory federal agreements or conditions were part of the listed properties. No known properties were released from federal obligations or property disposal.
MODEL: WMM2015MAGNETIC DECLINATION 14°49'EAPRIL 24, 2018RATE OF CHANGE0° 8' W PER YEAR
PROPERTY ENCUMBRANCES
# GRANTOR TYPE OFINTEREST
ACREAGE(APPROX.)OR WIDTH
INSTRUMENT AUDITOR'S FILENUMBER DATE GRANT/YEAR DESCRIPTION
A (OLD) JEFFERY AND LORRAINE GOOLDY AVIG. EASEMENT 0.64 1/11/1978 5-53-0050-01/1977
B (OLD) JEFFERY AND LORRAINE GOOLDY AVIG. EASEMENT 0.92 12/12/1977 5-53-0050-01/1977
C (OLD) LAWRENCE AND CLAUDIA BRUNELLE AVIG. EASEMENT 0.92 10/11/1977 5-53-0050-01/1977
D (OLD) MANUEL AND ELIBERTA SANTOY AVIG. EASEMENT 3.39 10/7/1977 5-53-0050-01/1977
E (OLD) THE WOODSHOP INC. AVIG. EASEMENT 3.25 12/12/1977 5-53-0050-01/1977
F (OLD) KANG YOUNG SON AVIG. EASEMENT 0.92 11/7/1977 5-53-0050-01/1977
G (OLD) MAXINE MARIE BROWN AVIG. EASEMENT 1.38 10/11/1977 5-53-0050-01/1977
H PORT OF BENTON EASEMENT 30' 2009-028526 SVID IRRIGATION EASEMENT
I PORT OF BENTON EASEMENT 1' BPUD EASEMENT
J PORT OF BENTON EASEMENT 15' 87-17158 SANITARY SEWER EASEMENT
K PORT OF BENTON EASEMENT 10' 88-4169 PUD EASEMENT
L PORT OF BENTON EASEMENT 10' 2010-018499 PUD EASEMENT
M PORT OF BENTON EASEMENT 30' 2009-028526 SVID IRRIGATION EASEMENT
N PORT OF BENTON EASEMENT 10' 88-4169 PUD EASEMENT
O PORT OF BENTON EASEMENT 10' PUD EASEMENT
P PORT OF BENTON RW 40' ROAD RIGHT OF WAY (40' EXISTING)
Q PORT OF BENTON RW 40' ROAD RIGHT OF WAY (40' EXISTING, 60' FUTURE)
PORT OF BENTON DATE
SPONSOR APPROVAL
AIRPORT MASTER PLAN UPDATE A-1
PROSSER AIRPORT - S40APPEN
DIX 1
FACILITY DESCRIPTION AND BACKGROUND
Prosser Airport (S40) is currently a general aviation airport owned and operated by the Port of Benton (Port) under the jurisdiction of the Washington State Department of Transportation (WSDOT), South Central Region which includes Kittitas, Yakima, Benton, Walla Walla, Columbia, Garfield, and Asotin counties. It is also under the jurisdiction of the Federal Aviation Administration’s (FAA) Northwest Mountain Airport Region Seattle Airports District Office. S40 is managed by the Port of Benton’s Director of Airports and Operations in conjunction with the Port of Benton Commissioners. The Commission is comprised of a three-member board and each member is elected to a six-year term. While the Director of Airports and Operations is the point of contact for airport matters, the Director must receive approval from the Commissioners to execute contracts or agreements. Each commissioner represents a separate district within the Port boundaries. The commissioners are:
• Roy D. Keck - President• Jane F. Hagarty - Vice President• Robert Larson - Secretary
The Port provides for multi-modal transportation including two airports (Prosser and Richland), short line rail, barge, and trucking amenities. S40 is located in Benton County one mile northwest of the Prosser central business district. It occupies 120 acres of land of which approximately 100 acres are used for aeronautical uses. WSDOT staff inspects Prosser Airport on a semi-regular basis to assess facilities and activity. The latest Airport Facilities and Services Report on the WSDOT Aviation website indicates that S40 accommodates 6,000 total annual aircraft operations, including 3,000 itinerant (50%) and 3,000 local general (50%) aviation operations with no commercial or military operations. The inspection notes 45 based single-engine and one (1) multi-engine based aircraft. FAA maintains and administers its own internal historical activity record and forecasting effort, the Terminal Area Forecast (TAF). With respect to Prosser, the TAF notes:
• 7,700 annual itinerant general aviation operations and 5,500 annual local general aviation operations, totaling 13,200 annual operations during the 2007 through 2016.
• 7,700 annual itinerant general aviation operations, 5,500 local general aviation operations, totaling 13,200 annual operations from 2007 to current, and the same to the TAF’s final 2040 forecast year. This is the current, official FAA record for purposes
of this planning.• And:
• 45 based aircraft from 1999 through 2006 • 51 based aircraft in 2007• 53 based aircraft from 2008 through 2011• 51 based aircraft from 2012 through the TAF’s
final 2040 forecast year.FAA also maintains a database of based aircraft for official record keeping purposes. The database currently indicates 71 based, validated aircraft at Prosser. However, only 54 of those aircraft have been confirmed at S40, according to the FAA based aircraft database.A general rule-of-thumb for estimating aircraft operations at uncontrolled airports like S40 is contained in FAA guidance, recommending: 250 operations per based aircraft for rural general aviation airports, 350 for more urban, busier general aviation airports and 450 for reliever airports in metropolitan areas. Applying this rule-of-thumb to S40, a rural general aviation airport, the operation per based aircraft estimate results in 13,500 local operations at S40. Cargo or passenger service is not available at Prosser.
SCOPE OF EXISTING RECYCLING PROGRAM
a. Facilities over which the Airport has direct control of waste management – Currently, there are no recycling facilities at the Prosser Airport. Materials for recycling can be delivered to a Basin Disposal Recycling Drop Box facilities located throughout Benton County. In Prosser City, a facility is located at the Transfer Station at Sherman and Wine County Road that can recycle newspaper, aluminum and steel, mixed paper, and cardboard.
b. Areas over which the Airport has no direct control, but may have influence – The Port of Benton encourages hangar occupants, Airport users, and the FBO at Prosser Airport and those individuals wishing to dispose of deplaned waste to recycle as much as possible at the Basin Disposal Recycling Drop Boxes in Prosser.
c. Areas over which the airport has not direct control or influence – The Port of Benton encourages individuals with material for recycling to deliver it to Basin Disposal Recycling Drop Box facilities which offers complete recycling services.
APPENDIX 1 - AIRPORT RECYCLING PLAN

AIRPORT MASTER PLAN UPDATE A-2
PROSSER AIRPORT - S40APPEN
DIX 1
PROSSER AIRPORT’S CURRENT WASTE MANAGEMENT PROGRAM
Prosser Airport’s municipal solid waste (MSW) is removed weekly by Basin Disposal, Inc. which provides two 96 gallon containers. The solid waste is then transported to the BDI transfer facility where it is consolidated and ultimately disposed at the Finley Buttes Landfill located approximately 12 miles south of Boardman, Oregon at exit 168 on I-84. Finely Buttes Landfill is a municipal solid waste disposal facility permitted by the Oregon Department of Environmental Quality and is in full compliance with all rules and regulations. Most of the solid waste at Prosser Airport is generated by airport users such as the members of Chapter 1466 of the Prosser Wing-Nuts Experimental Aircraft Association who meet monthly at a facility located on Prosser Airport property, pilots who generate deplaned waste, and individuals/organizations who lease hangars or the airport grounds for activities.
REVIEW OF RECYCLING FEASIBILITY
Prosser Airport users generate minimal amounts of recyclable material which may be a barrier to a recycling program on the Airport property. Currently, any recyclable material can be delivered to any of the Basin Disposal Recycling Drop Box facilities located throughout Benton County. In the City of Prosser, a facility is located at the Transfer Station at Sherman and Wine County. Material that can be recycled includes newspaper, aluminum and steel, mixed paper, and cardboard.Prosser Airport works to maintain compliance with applicable federal, state, and local waste regulations. However, the most important policy that impacts recycling at the Prosser Airport is the FAA Modernization and Reform Act of 2012 (FMRA), which amended Title 49, United States Code (U.S.C.), included a number of changes to the Airport Improvement Program. Once those changes contained in Section 132 (b) of the FMRA expanded the definition of airport planning to include “developing a plan for recycling and minimizing the generation of airport solid waste, consistent with applicable State and local recycling laws, including the cost of a waste audit” then, recycling and reduction of waste became a consideration for the current Airport Master Plan update for Prosser Airport. Additionally, since Section 133 of the FMRA added a provision requiring airports that have or plan to prepare a master plan, and that receive AIP funding for an eligible project, by including this section in the Master Plan Update, it will ensure that the Airport will address issues relating to solid waste recycling.Incentives for implementing a recycling, reuse, and waste reduction program at Prosser Airport may include:
• The Port of Benton implementing policies and guidelines that would encourage Airport users and tenants to take their recyclables to the local Basin Disposal Recycling Drop Box facilities to minimize contributions to the landfill.
• Encourage Airport users and tenants to reduce solid waste generation and reuse materials whenever possible.
• Designate a place for the collection of materials for recycling and make arrangements for pick up by Port of Benton staff who would then transport recyclables to the local Basin Disposal Recycling Drop Box facility.
Logistical constraints to a Prosser Airport recycling program may include the minimal volume of material that is generated that is appropriate for recycling. The lack of properly marked containers discourages Airport users and tenants to easily use recycling facilities. Additionally, there is no regularly scheduled pick up of recyclable materials at the Airport.
OPERATION AND MAINTENANCE REQUIREMENTS
The Port of Benton receives solid waste collection services from Basin Disposal, Inc. which provides two 96 gallon containers for disposal of all waste at the Airport. Solid waste is then transported to the BDI transfer facility where it is processed and ultimately disposed of at a permanent disposal site, the Finley Buttes Landfill in Boardman, Oregon. Solid waste and recyclable material are mixed together in the containers. The Port of Benton is the responsible party for designing and implementing any recycling program at the Prosser Airport. Currently, there are no identifiable Operation and Maintenance costs or requirements associated with the Airport’s recycling efforts since there are no recycling efforts in place. Other than an occasional trip to the Basin Disposal Recycling Drop Box facilities by Airport users and tenants when recyclables are present in sufficient volumes to warrant such an effort, there are currently no other resources dedicated to recycling for recyclables, organic materials, and/or C&D debris. The existing services provided by Basin Disposal, Inc. may impede the purchase/use of environmental-preferred products since they only pick up the solid waste disposed of in the container, recyclable or not. No effort is made to separate solid waste from recyclables when it is loaded into containers at the BDI transfer facility before being disposed of at the Finley Buttes Landfill. Basin Disposal, Inc. does not possess any recycling containers that could be used at Prosser Airport to collect recyclable material.

AIRPORT MASTER PLAN UPDATE A-3
PROSSER AIRPORT - S40APPEN
DIX 1
REVIEW OF WASTE MANAGEMENT CONTRACTS
Currently Prosser Airport receives weekly solid waste collection service from Basin Disposal, Inc. by the City of Prosser. The service provides for two 96 gallon containers for disposal of all solid waste at the Airport. Basin Disposal, Inc. does not provide recycling containers or services at the current time. Currently, solid waste collection services are paid for from the general revenue account of Prosser Airport. Recycling is not offered so there is no expense or revenue budget line item associated. The existing disposal services does not encourage reuse or recycling efforts. Without containers that provide for the collection and sorting of recycling material, the existing service provided by Basin Disposal, Inc. impedes the purchase/use of environmentally-preferred produces. The nature of the service provided by Basin Disposal, Inc. is for the removal of mixed solid waste from the Airport and the transfer to Finley Buttes Landfill for permanent disposal only. No recycle services are available.
POTENTIAL FOR COST SAVINGS OR REVENUE GENERATION
It is likely that no real cost savings or potential for revenue generation exists with the current volumes and types of solid waste and potential recyclables that exist today at the Prosser Airport. However, a recycling program could be put into place for the following considerations:
• While recyclable volumes are currently very small, they will likely grow as the Airport and its tenant base grows in future years.
• Community recycling is a responsible approach to the waste management process and any and all contributions lessen the landfill burden.
• Participating in recycling and responsible waste management programs is an appropriate role for a major community facility like the Airport, and shows dedication toward being good stewards of the land.
Even though such recycling and waste management programs may not be especially financially viable today, being involved in these processes now will better prepare the Airport for the future.
PLAN TO MINIMIZE SOLID WASTE GENERATION
Because recycling containers and services are not available for a fee on the Prosser Airport property, the Port of Benton does not recycle paper (newspaper and
magazines), plastic bottles and aluminum cans, and plastic cups. Prosser Airport’s comprehensive approach to reduce the amount of waste being disposed of in landfills includes the following opportunities:
Objective TargetPurchase and locate a suitable sized container(s) for the collection and sorting of recyclable materials in the proximate area of the existing solid waste containers. On a regular basis, Port of Benton maintenance staff will transport the recyclables to the local Columbia Basin Recycling Drop Box facilities.
April 2020
Implement policies and educational programs that encourage Airport users and tenants to minimize the amount of waste that is being disposed of in the landfill and reuse materials whenever possible by participating in a reuse and recycling effort. For example, purchase items made from recycled products.
Review Port of Benton policies on reuse, recycling, and waste reduction and update as necessary.
Review and update arrangements/contracts/leases between the Airport users and tenants to encourage purchasing policies/requirements that focus on purchasing products made from post-consumer recycled materials
Review agreements by April 2021 and incorporate necessary changes.
Review and revise current boiler plate construction contracts and agreements to reflect the Airport’s recycling goals for Construction and Demolition (C&D) Debris
Review agreements by April 2021 and incorporate necessary changes.
Review and revise procurement and contract documents to provide for recycling or reuse of materials in new development projects
Review agreements by April 2021 and incorporate necessary changes.

AIRPORT MASTER PLAN UPDATE A-4
PROSSER AIRPORT - S40APPEN
DIX 1
AIRPORT MASTER PLAN UPDATE A-4
PROSSER AIRPORT - S40APPEN
DIX 1
After implementation of the measures shown above, the Airport may track the performance of these efforts. Contractors should provide the Airport with an accounting of material volumes and types of materials submitted for recycling on each project. The Airport could also give consideration to the level of recycling that is intended as part of the contractor selection process. The Airport may also consider providing information about Benton County’s recycling programs by advertising their support and encouraging participation in the County’s recycling efforts.