2015 Annual Airport Traffic Report - Port Authority of New York ...
82
-
Upload
khangminh22 -
Category
Documents
-
view
5 -
download
0
Transcript of 2015 Annual Airport Traffic Report - Port Authority of New York ...

- - COVER
i
Table of Contents
lEttER fROm aViatiOn dEpaRtmEnt
faCt ShEEtS John F. Kennedy International Airport Newark Liberty International Airport LaGuardia Airport Stewart International Airport Atlantic City International Airport Teterboro Airport
aiRCRaft mOVEmEntS
Commercial and non-Commercial aircraft movements1.1.1 Annual Total 2002-2015, by Airport and Region 1.1.2 Monthly Totals 2015, by Airport and Region
aircraft movements By market1.2.1 Annual Totals 2002-2015, by Airport and Region
paSSEngER tRaffiC
top 50 airport Comparisons2.1.1 Number of Passengers, Domestic 2015 2.1.2 Number of Passengers, Worldwide 2015
Commercial passenger traffic2.2.1 Annual Totals 2002-2015, by Airport and Region 2.2.2 Monthly Totals 2015, by Airport and Region
passenger traffic By market2.3.1 Annual Totals 2002-2015, by Airport and Region
passenger traffic By airline2.4.1 Top 20 Carriers, 2015 Passengers, by Airport and Region
passenger traffic By terminal2.5.1 2015 Passengers, Domestic and International by Airport
passenger demographics2.6.1 Profile of Departing Passengers, by Airport and Region
CaRgO tRanSpORt
top 50 airport Comparisons3.1.1 Revenue Cargo in Short Tons, Top 50 Domestic (ACI) – 2015 3.1.2 Revenue Cargo in Short Tons, Top 50 Worldwide (ACI) – 2015
Revenue freight in Short tons3.2.1 Annual Totals 2002-2015, by Airport and Region 3.2.2 Monthly Totals 2015, by Airport and Region
Regional freight in Short tons3.3.1 By International Market, Annual Totals 2006 -2015, for Region (US Customs) 3.3.2 U.S. Trading Districts by Air, 2015 (US Customs) 3.3.3 Air Trade Commodities in the NY/NJ Region, 2015 (US Customs)
Revenue freight by airlines3.4.1 Top Carriers 2015, by Airport and Region
Revenue mail in Short tons3.5.1 Annual Totals 2002-2015, by Airport and Region 3.5.2 Monthly Totals 2015, by Airport and Region
- - taBlE Of COntEntS
1
3579
1113
1522
29
3132
3339
45
47
50
51
5758
5960
616263
64
6667

ii
gROund tRanSpORtatiOn & aiRpORt ECOnOmiC impaCt
passengers accessing airports by Bus & Rail4.1.1 Annual Totals 2002-2015, by Airport and Region
paid parked cars4.2.1 Annual Totals 2002-2015, by Airport and Region
taxi dispatch passengers4.3.1 Annual Totals 2002-2015, by Airport and Region
ground transportation Center Bookings4.4.1 Annual Totals 2002-2015, by Airport and Region
airport Employment 4.5.1 Annual Totals 2002-2015, by Airport and Region
the Economic impact of the aviation industry 4.6.1 2015 Totals for the New York/New Jersey Region
CREditS
69
70
71
72
73
74
75
1
April 1, 2016
I am happy to share the Port Authority Aviation Department’s 2015 Annual Traffic Report, which provides important statistics on air traffic at our regional aviation facilities, including comparative data on airports worldwide and the multitude of destinations our airports offer our customers.
2015 in PersPective By any measure, 2015 was a spectacular year for the Port Authority’s airport system. Our airports handled an all-time record high 124.2 million passengers, growing 5.9 percent over 2014. This represents the biggest annual increase since we gained 6.2 percent in 2005, and we easily outperformed the national 4.8 percent growth rate as well. To put the 124.2 million total passenger mark in perspective, imagine it as if it represented the population of a country. If that were the case, it would rank 11th in the world, just behind Japan’s 127 million citizens and more than Mexico, Philippines, Vietnam, Egypt, and every country in Europe.
This marks our third consecutive record year, and it’s the first time we’ve broken nine different passenger records. The region as a whole and all three major Port Authority airports set these individual records:
• Most total passengers, system-wide, 124.2 million
• Most international passengers, system-wide, 43.6 million
• Most total passengers, JFK, 56.8 million
• Most international passengers, JFK, 30 million
• Most domestic passengers, JFK, 26.8 million
• Most total passengers, LaGuardia, 28.4 million
• Most domestic passengers, LaGuardia, 26.7 million
• Most total passengers, Newark, 37.5 million
• Most domestic passengers, Newark, 25.7 million
All three major airports enjoyed growth in 2015. JFK was up 6.8 percent, EWR up 5.3 percent, and LGA up 5.4 percent. ACY traffic fell 0.9 percent in large part due to local economic conditions, and SWF was down 9 percent as airlines reduced capacity due to a number of factors, including an industry-wide shortage of pilots brought on partly by regulatory changes.
The consistency of our passenger records is a testament to the resiliency of our airport system and the region we serve. Our rate of growth exceeded that of four of the top five U.S. airports – ATL, ORD, DEN and DAL – and as economic engines, the Port Authority’s airport system has few rivals. Today, our airports support more 588,800 jobs paying $30.6 billion in annual wages and generating $84.7 billion in annual sales.
Cargo deserves a special mention. While it significantly weakened in the second half of the year, it nevertheless had a positive year, growing 1.2 percent. The growth is significant because it represents the first time since 2004 that we have had consecutive years of cargo growth.
2016 OUtLOOKSimilar to last year, air travel in 2016 has started on rocky footing as a January blizzard created delays and cancellations. However, the outlook for the full year remains optimistic. We anticipate 2016 passenger traffic to grow 2.5-3 percent, which would establish another all-time record.
Letter from the Aviation Department
The consistency of our passenger records
is a testament to the resiliency of our airport system and
the region we serve.
- - lEttER fROm thE aViatiOn dEpaRtmEnt

2
The same cannot be said of cargo, which weakened significantly in the second half of 2015, even as the economy was growing and jet fuel prices were falling. Clearly, demand for air freight has weakened or shifted to other modes. The weakness has spilled over to 2016, and as a result, we are anticipating a flat to negative performance from cargo in 2016.
The attached statistics are a continuing reflection of the Aviation Department’s desire to keep our stakeholders informed, and reaffirms our commitment to achieving regional prosperity through a unified system of airport facilities that offer safe and secure environments, an excellent customer experience, and environmentally sustainable and friendly services delivered by a first-rate staff.
Ralph Tragale Assistant Director Aviation Customer, Industry and External Affairs
2015 was a spectacular year for the Port Authority’s
airport system.

3
John F. Kennedy International Airport
- - faCt ShEEtS
John f. Kennedy international airport fact Sheet
HistOrY• Construction for a new international airport began in 1942 under a New York City contract on the site of the Idlewild Golf Course in Queens, New York City.
• The Port Authority of New York and New Jersey began operating the soon-to-open airport on June 1, 1947, under a lease with the City of New York.
• On July 9, 1948, commercial flights began flying into and out of the newly opened New York International Airport.
• The airport was rededicated John F. Kennedy International Airport on December 24, 1963, in memory of the nation’s 35th president.
• On February 7, 1964, the Beatles arrived for the first time in the United States and entertained reporters and the public at a press conference in the former International Arrivals Building. Over the decades, the airport has been a gateway for numerous presidents and dignitaries, including thousands who have arrived throughout the years for the annual United Nations General Assembly.
• In 2000, JFK welcomed its one-billionth passenger.
• In 2004, the Port Authority and the City of New York concluded an agreement that ensures the agency’s continued operation of JFK through 2050.
• JFK made airport history on March 19, 2007, when the A380, the world’s largest passenger aircraft, touched down on U.S. soil for the first time in a route-proving test, and again on August 1, 2008, when an Emirates Airline A380 landed at JFK—the first regularly scheduled arrival of the A380 in the United States.
• In 2013, JFK surpassed 50 million annual passengers for the first time in its history.
siZe AnD LOcAtiOnJFK covers 4,930 acres, including 880 acres in the Central Terminal Area. The airport has more than 30 miles of roadway. It is located on Jamaica Bay in the southeastern section of Queens County, New York City, 15 miles by highway from midtown Manhattan.
AviAtiOn rOLeJFK has been recognized for decades as the premier U.S. gateway for passengers and cargo. JFK is the busiest airport in the New York City metropolitan area, and among the busiest in North America and the world. In 2015, the airport handled
a record 56.8 million passengers, and more than 1.3 million tons of cargo. The airport handled about 30 million international passengers in 2015, also an all-time record. About 85 airlines operate out of the airport, serving about 165 nonstop destinations.
eMPLOYMent AnD ecOnOMic iMPActAbout 37,000 people are employed at the airport. The airport contributes about $42 billion in economic activity to the New York-New Jersey metropolitan region, generating about 284,500 total jobs and $15.1 billion in annual wages.
investMentThe City of New York invested about $150 million in the original construction of the airport. Since then, the Port Authority has invested more than $7.5 billion in JFK.
reDeveLOPMentMajor JFK redevelopment work includes several projects undertaken by the Port Authority and its airline and airport partners, including JetBlue’s Terminal 5 and T5i, and American Airlines’ Terminal 8, along with parking garages for both terminals. Delta Air Lines partnered with the Port Authority and Terminal 4 to construct a new state-of-the-art terminal space at Terminal 4, replacing the antiquated space it occupied in Terminal 3. The $1.2 billion expansion, which enhanced capacity by nine passenger gates and added space for more aircraft parking, opened in May 2013.
A $457 million rehabilitation of Runway 4L-22R was completed in 2015, and includes new runway safety areas, navigational aids, and operational enhancements to increase safety, efficiency and reduce delays. The Port Authority also invested nearly $350 million to completely reconstruct JFK’s Bay Runway, the airport’s main runway and one of the longest commercial runways in the country. Both projects added new high-speed exits for landing aircraft. The new taxiways will enable swifter departures and easier access from taxiways to terminal gates, saving time on the ground for all passengers at JFK. On the books in the near future are two runway and several taxiway rehabilitation projects that will continue JFK’s efforts to maintain our pavements in the best condition and enhance the operational efficiencies of the airport.
centrAL terMinAL AreA (ctA)JFK has six airline terminals surrounded by a dual ring of peripheral taxiways. The original CTA was enlarged from
655 to 880 acres by relocating taxiways to provide needed space for expanding the passenger terminals. There are more than 125 aircraft gates serving the six terminals. The CTA also includes a cogeneration plant that produces the power supply for JFK, and the heating and air conditioning for the entire CTA.
terMinALs• The Terminal One Group, a consortium of airlines – Air France, Japan Airlines, Korean Air, and Lufthansa – built the 11-gate international Terminal 1 on the site of the old Eastern Airlines Terminal. It opened in 1998.
• Delta Air Lines operates Terminal 2 and completed the expansion of Terminal 4 during 2013. Delta vacated Terminal 3 when the newly expanded Terminal 4 opened in May 2013. After 50 years of service to JFK, Terminal 3 was demolished.
• The 1.5-million-square-foot, common-use Terminal 4 opened in May 2001. Terminal 4 includes separate levels for departures and arrivals, consolidated ticketing and baggage operations, improved customer facilities, duty-free retail shops, and a wide variety of eateries. A Welcome Center opened in 2009. Delta Air Lines redeveloped a portion of the terminal by adding nine new gates, and other enhancements and amenities, which opened in 2013.
• JetBlue’s Terminal 5 opened in 2008. The Port Authority provided nearly $800 million toward the jointly financed, 26-gate, 635,000-square-foot terminal, which is designed to handle up to 20 million passengers per year. In 2012, JetBlue broke ground on T5i, a 145,000-square-foot expansion to accommodate JetBlue international arrivals. The project was completed in 2015.
• A $251 million redevelopment project was completed at British Airways’ Terminal 7. The project expanded and reconfigured the terminal for greater efficiency. Improvements included new ticketing and check-in areas, new retail outlets, and a new departure and arrival roadway system.
• American Airlines’ $1.2 billion transformation of Terminal 8 opened in 2007 and serves domestic and international passengers on three concourses. Terminal 8 includes expanded check-in areas, top name-brand shops and eateries, and numerous services.
• The Port Authority completed $20 million in restoration and preservation

4
John F. Kennedy International Airport
measures for JFK’s historic TWA Flight Center in advance of an adaptive re-use redevelopment program, which will create hotel space and related services in the Central Terminal Area.
rOADWAY Access AnD GrOUnD trAnsPOrtAtiOnA roadway configuration in the Central Terminal Area divides the roadway network into five terminal areas so motorists can make direct connections between terminals, parking lots, and airport expressways. In addition to AirTrain JFK, the airport also is served by taxis, airport coaches, and several car rental agencies.
AirtrAin JFKOpened in 2003, the light-rail system connects JFK with the Long Island Rail Road and New York City subway and bus lines. More than 7.1 million paid passengers used the system in 2015, and millions more rode the free portion of the system to connect between terminals, and to parking lots and rental car areas. Recent improvements include digital signage, expanded closed-circuit television and audio recording systems for monitoring critical communications.
PArKinGJFK offers more than 15,000 public parking spaces and includes five garages. E-ZPass Plus, which allows customers to use their E-ZPass to pay for parking, is available in all parking lots and garages, except for the overflow lot. A reservation system was introduced in 2011.
cArGOJFK is one of the world’s leading international air cargo centers. The airport offers nearly 4 million square feet of modern, state-of-the-art cargo warehouse and office space. The entire air cargo area is designated as a Foreign-Trade Zone. JFK serves the world’s key air cargo markets through a strong mix of long-haul, direct and nonstop all-cargo aircraft and wide-body passenger aircraft flights.
rUnWAYs/tAXiWAYs• JFK’s runway system consists of two pairs of parallel runways (4L-22R, 4R-22L and 13L-31R, 13R-31L) aligned at right angles. Total runway length is nine miles.
• The Bay Runway reconstruction project widened 13R-31L from 150 to 200 feet wide in 2011. Runway 4R-22L was widened from 150 to 200 feet in 2002.
• All runways have high-intensity runway edge lighting, centerline and taxiway exit lighting, and are grooved to improve skid resistance and minimize hydroplaning.
• Taxiways total approximately 45 miles in length with widths of 75 feet or 82 feet. There are shoulders and erosion control pavements on each side of the taxiways. Other features include the taxiway centerline light system and a sign system, illuminated at night to provide directional information for taxiing aircraft.
• The Port Authority invested $200 million for taxiway and airside rehabilitation to prepare for the A380 aircraft, and more than $150 million was dedicated to fund technical and customer service initiatives to combat airport delays.
Air trAFFic cOntrOL tOWerThe 321-foot air traffic control tower opened in 1994 and includes communications, radar, and wind shear alert systems.

5
Newark Liberty International Airport
newark liberty international airport fact Sheet
HistOrY• The metropolitan area’s first major airport, Newark Airport was built by the City of Newark on 68 acres of marshland. After the airport’s opening on October 1, 1928, it quickly became the world’s busiest commercial airport.
• During World War II, the airport was operated by the Army Air Corps.
• After the Port Authority assumed responsibility for Newark Airport’s operations on March 22, 1948, the agency added an instrument runway, a passenger terminal, a control tower, and an air cargo center.
• The Central Terminal Area was constructed and opened in 1973. Other construction during the early 1970s included the Port Authority Administration Building, the Central Heating and Refrigeration Plant, and taxiways and roadways.
• In 1989, a two-building maintenance complex opened.
• In 1996, the International Arrivals Facility opened in Terminal B, and the automated monorail began operating between terminals and parking lots.
• Terminal C opened in 1988 as the hub of Continental Airlines, and later underwent numerous upgrades.
• In 2001, the monorail was extended to the Northeast Corridor and renamed AirTrain Newark.
• In 2002, the airport was renamed Newark Liberty International Airport to memorialize all those who lost their lives on September 11, 2001. Also in 2002, the Port Authority and the City of Newark agreed to extend the lease through 2065.
siZe AnD LOcAtiOnThe airport covers 2,027 acres, including a 425-acre Central Terminal Area. The airport is bordered by the New Jersey Turnpike, Interstate 78 and U.S. Routes 1-9 in the cities of Newark and Elizabeth, N.J.
AviAtiOn rOLeNewark Liberty International Airport is among the busiest North American and international airports. In 2015, about 37.5 million passengers used the airport, an all-time record. About 30 airlines operate out of the airport, serving more than 150 nonstop destinations.
eMPLOYMent AnD ecOnOMic iMPAct About 21,000 people are employed at Newark Airport. The airport contributes about $25.3 billion in economic activity to the New York-New Jersey
metropolitan region, generating about 176,900 total jobs and $9.2 billion in annual wages.
investMentThe City of Newark spent more than $8.2 million on the construction and development of Newark Airport. The U.S. government spent more than $15.1 million prior to 1948. Since assuming the airport’s lease in 1948, the Port Authority has invested more than $5.2 billion at the airport.
reDeveLOPMentA major capital program combined about $3.8 billion in Port Authority, federal, and private funds and delivered numerous improvements, including AirTrain Newark, new ticket counters, parking garages, terminal upgrades, and runway and taxiway improvements. A $347 million modernization of Terminal B was recently completed. Future projects include the redevelopment of Terminal A and a replacement of AirTrain Newark.
centrAL terMinAL AreA (ctA) The 425-acre oval Central Terminal Area was built as part of a large-scale airport redevelopment program in the 1960s and early 1970s. The CTA consists of three passenger terminals: A, B, and C, and a first-class, ten-story, 585-room hotel with meeting rooms, a pool and fitness center, two restaurants and a bar.
PAssenGer terMinALs• Construction of Terminal A began in October 1967, and the facility opened in August 1973. With 28 gates, the terminal branches out into three circular satellite buildings. The satellites contain flight departure lounges, and airline and passenger service facilities. The main terminal building measures approximately 800 by 165 feet, and includes a Welcome Center. Planning for the redevelopment of Terminal A is well under way.
• Terminal B’s modernization expanded the two-level facility into three levels. Highlights include inline baggage screening systems and passenger screening systems, a baggage claim hall, departure areas, ticket counters, additional passenger lounges and concessions, and a Welcome Center. Terminal B has 15 international arrivals gates.
• Terminal C opened in 1988. Continental Airlines’ Global Gateway project in 2001 added 600,000 square feet of space and turned the facility into a three-level terminal with two levels for departures. The C-3 concourse added 19 gates – bringing the terminal’s total
to 57 – a huge retail and concessions space, and U.S. Customs facilities. The state-of-the-art International Arrivals Facility, also completed by Continental, added another 1,500-passengers-per-hour arrival capacity to Newark Liberty. A Welcome Center also was added. In 2010, Continental merged with United Airlines.
• As part of the 2014 remodeling of the Terminal B food court, now named Liberty Terrace, Westfield Concessions invested approximately $65,000 to add a custom wall shop unit in the corridor adjacent the food court with a variety of tenants hailing from the state of New Jersey. Travelex America was opened in a converted space on the International Arrivals level on the U.S. Customs exit ramp. In the B2 satellite, EJE Duty Free moved from their original location in the rotunda to become a dramatic walk-through duty free visited by all outgoing B2 passengers. The walk-through spans the entire length of the satellite concourse with an impressive modern design. Garden State Diner, an icon at EWR since the early 1990s, opened in a new location in August 2015.
• OTG is making a $120 million investment to upgrade and expand Terminal C’s dining and shopping options, with completion scheduled for 2016.
rOADWAYsTo reduce congestion and improve airport access, roadways were widened and reconfigured in the passenger terminal area and airport entrances, giving vehicles the option to bypass terminals and proceed directly to parking areas.
AirtrAin neWArKAirTrain Newark, the airport’s automated monorail, opened for service on-airport between terminals and parking lots in 1996. The system was extended to a new station on the Northeast Corridor Rail Line in 2001, providing passengers with connections to NJ Transit and Amtrak trains for links between the airport and New York City, Philadelphia, points across New Jersey, and beyond. More than 2.5 million paid riders used the system in 2015 to connect to the airport at the Northeast Corridor Rail Link station, along with millions of others who used the system free of charge to travel between passenger terminals, and to connect to parking lots and rental car areas.

6
PArKinGThe airport offers more than 18,400 parking spaces. The airport features two parking garages: a six-level facility at AirTrain Station P4 that offers optional valet service, as well as five charging stations for electric vehicles, and another facility across from Terminal C. E-ZPass Plus, which allows customers to use their E-ZPass to pay for parking, is accepted at all parking lots. A reservation system was introduced in 2011.
cArGOThe airport is the overnight express package center for the NY/NJ region, offering a full range of short-, medium-, and long-haul services to domestic and international destinations. In 2010, FedEx agreed to continue hub operations at Newark Liberty and committed to a 20-year lease extension. FedEx installed a rooftop solar electric system to provide more than 15 percent of the hub’s energy needs. Newark Liberty handled more than 700,000 tons of cargo in 2015.
rUnWAYs AnD tAXiWAYsThe airport has two parallel runways (4R-22L and 4L-22R) and a third runway (11-29) that is primarily used for commuter aircraft traffic. Runway 4R-22L is 10,000 feet long by 150 feet wide, and Runway 4L-22R is 11,000 feet long by 150 feet wide. Both runways have displaced thresholds to reduce community noise impacts. Visual aids include high-intensity edge lights, LED centerline and touchdown zone lighting, and high-speed exit taxiway centerline lighting. More than 12 miles of 75-foot-wide taxiways link the three runways with the central terminal and cargo areas. A $42 million rehabilitation of Runway 4R-22L was completed in 2012, and a $97 million rehabilitation of Runway 4L-22R, including the construction of multi-entrance and cross taxiways was completed in 2014. Runway 4R-22L changed its approach lighting system to an ALSF-2, and additional high-speeds P2 and P3 were completed in 2013. Runway 22L also was upgraded to a Cat III approach system allowing for landings in poor weather conditions.
POrt AUtHOritY ADMinistrAtiOn BUiLDinGIn 2002, reconstruction of the landmark Newark Liberty International Airport Administration Building (Building One) was completed. The 100,000-square-foot building incorporates a new emergency response facility within the airport’s original 1935 central terminal building, which is a National Historic Landmark. The facility houses most of the Port Authority’s airport staff.
Air trAFFic cOntrOL tOWerA 325-foot air traffic control tower was commissioned in 2003, the fourth in the airport’s history. The rooftop of the Port Authority Administration Building features what is believed to be the first air traffic control tower ever built. The first air route traffic control center was also established on the airport in 1935.
Newark International Airport

7
LaGuardia Airport
laguardia airport fact Sheet
HistOrY• At the turn of the century, the airport site, then commonly known as North Beach, was occupied by the Gala Amusement Park.
• In 1929, the 105-acre site was purchased by the Curtiss-Wright Co. and developed into a private flying field. Originally called the Glenn H. Curtiss Airport, it later became known as Curtiss-Wright Field.
• The City of New York purchased Curtiss-Wright Field in 1935 and renamed it North Beach Airport. On September 9, 1937, ground was broken for a new airport, which, on October 15, 1939, was dedicated as New York City Municipal Airport.
• Eighteen days later, on November 2, 1939, the airport was renamed New York Municipal Airport-LaGuardia Field to honor New York City’s Mayor, Fiorello LaGuardia.
• On December 2, 1939, the airport opened to commercial traffic. It soon became known simply as LaGuardia Airport.
• The Port Authority of New York and New Jersey began operating LaGuardia Airport in 1947.
siZe AnD LOcAtiOnLaGuardia Airport covers 680 acres. It borders Flushing and Bowery bays in the northwestern section of Queens County, New York City, about eight miles by highway from midtown Manhattan.
AviAtiOn rOLeLaGuardia Airport is one of the nation’s leading domestic gateways for business travel, and is the primary business/short-haul airport for New York City. LaGuardia Airport set a new all-time record in 2015 with more than 28.4 million passengers. Eleven airlines serve 75 nonstop destinations at LaGuardia Airport, which relative to its size, holds the distinction of being the most efficient airport in the world, handling more passengers per acre per year than any other airport.
eMPLOYMent AnD ecOnOMic iMPActLaGuardia Airport employs about 12,000 people. The airport contributes about $17.7 billion in economic activity to the New York-New Jersey metropolitan region, generating about 129,100 total jobs and $6.4 billion in annual wages.
investMentOriginal construction by the City of New York cost $40 million. The Port Authority’s total capital investment in the airport to date is about $2.6 billion.
reDeveLOPMentPlanning is well under way for the multi-billion dollar redevelopment of Terminal B, including related airport infrastructure. A new $86 million electrical substation provides a more reliable and robust source of power for the airport. Hangars 2 and 4 located just east of Terminal B were demolished in anticipation of redevelopment construction. In 2010, the Port Authority completed the airport’s Police Crisis Command Center and Aircraft Rescue and Firefighting (ARFF) Facility and the Federal Aviation Administration (FAA) began operating from a new tower.
PAssenGer terMinALs• Originally known as the Overseas Terminal, then the Marine Air Terminal (MAT), Terminal A is the original airport terminal building. It served international flights on flying boats through the 1940s. On September 1, 1991, Delta Air Lines began shuttle operations to Boston and Washington, D.C. at Terminal A, which accommodates six gates. In 2011, Delta added daily shuttle service to Chicago. General aviation also operates from the terminal through a fixed-base operator (FBO). In 1995, the MAT was designated an historic landmark. A $7 million restoration of the terminal was completed in 2004.
• Dedicated on April 17, 1964, Terminal B (also known as the Central Terminal Building) serves most of the airport’s scheduled domestic airlines. It is 1,300 feet long and 180 feet wide, with approximately 750,000 square feet of floor space. Originally constructed at a cost of $36 million and then expanded and modernized for $340 million in the 1990s, the terminal consists of a four-story central section, two three-story wings, and four concourses that accommodate 35 aircraft contact gates. The terminal offers two food courts, Welcome Centers in the east and west wings, and MetroCard dispensing machines for those who wish to use New York City public transportation.
• Opened in September 1992 and costing $200 million, Terminal C comprises approximately 300,000 square feet of space with 21 aircraft contact gates. Operated by Delta Air Lines and hosting some American Airlines flights, the terminal features
an innovative mix of food, retail, and concessions integrated into the gate holdroom areas and a Welcome Center on the arrivals level.
• Terminal D, which consists of 10 gates, opened at the east end of the airport in June 1983. It is operated by Delta Air Lines and hosts Canadian carrier WestJet. In 2010, Delta enhanced and expanded the terminal’s food, retail, and concessions options, and the Port Authority opened a Welcome Center on the arrivals level. Delta expanded its operations into Terminal C following its takeover of the US Airways lease of Terminal C in 2011, and invested nearly $100 million in its terminal complex to improve customer access, speed baggage handling, and improve the concessions and customer service experience. In 2012, Delta opened a 600-foot-long enclosed walkway connecting Terminals C and D.
PArKinGLaGuardia Airport offers more than 5,600 public parking spaces, including a 2,650-space, five-level parking garage; E-Z Pass Plus in all parking lots; Express Pay machines in Lots 2, 4, and 5; and a 55-space metered lot. In 2011, the airport introduced a Premium Reservations program that enables customers the ability to reserved parking spaces. In 2013, the Port Authority’s Board of Commissioners authorized a new $82.9 million East Parking Garage, a critical early step toward the airport’s redevelopment that will culminate with the replacement of Terminal B. The new 1,100-space garage opened in the summer of 2015. During the summer of 2016, construction will begin on a new 3,000-space West Parking Garage, and the airport’s current parking garage (P2) and long-term parking lot (P3) will close.
rUnWAYsThere are two main runways, 4-22 and 13-31. Each is 7,000 feet long by 150 feet wide. In a $40 million project completed in 1967 by the Port Authority, both runways were extended over the bays around the airport to their present lengths. The runway extensions are supported upon a 50-acre, L-shaped, pile-supported concrete deck structure. All runways have high-intensity runway edge lighting, centerline, and taxiway exit lighting and are grooved for added traction during wet weather. Touchdown zone lighting was added on Runway 13 in 2005 and on Runways 4 and 22 in 2009 as part of the runway rehabilitation programs.

8
LaGuardia Airport
As part of an FAA Runway Safety Area project, two new Engineered Materials Arresting Systems (EMAS) beds were installed on Runways 4 and 31 in 2015.
Air trAFFic cOntrOL tOWerThe Federal Aviation Administration commissioned a new 233-foot-tall, state-of-the-art air traffic control tower in October 2010. The new tower features the latest aviation technology, including a system that tracks the surface movement of aircraft and vehicles, enhancing safety and efficiency. The $100 million tower replaced an iconic hourglass-shaped tower that had served the airport since 1964.
9
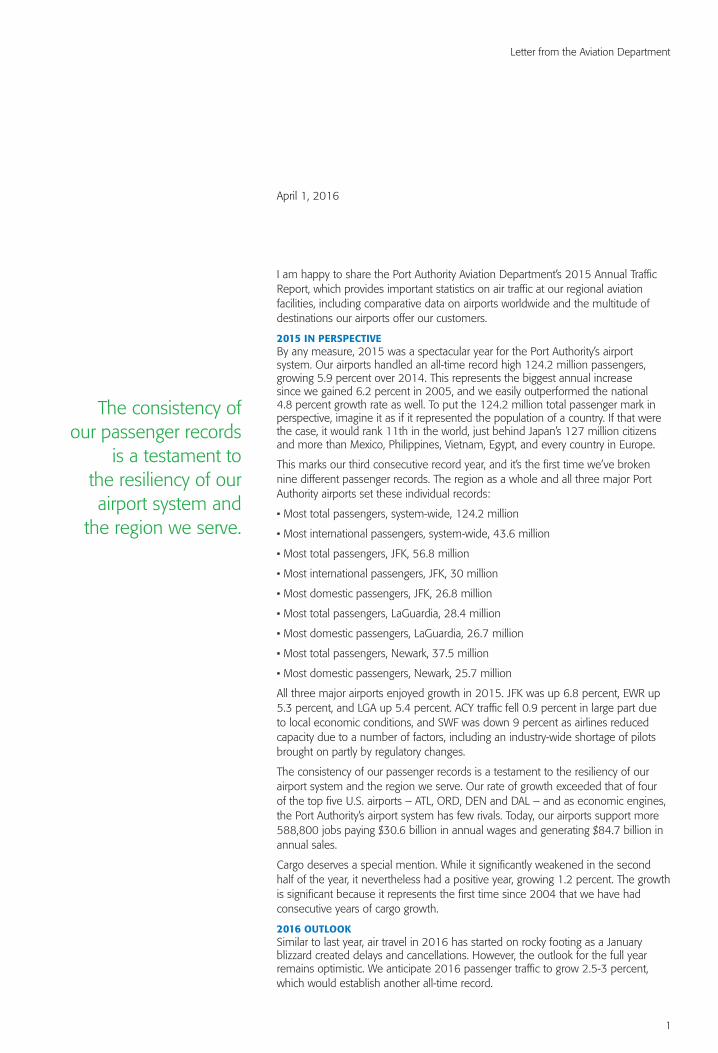
HistOrY• In 1930, Archie Stewart, an aviation buff and descendant of prominent local dairy farmer Lachlan Stewart, along with his uncle, Samuel Lachlan Stewart, donated 220 acres of land to the City of Newburgh to be used as an airport.
• In 1934, Douglas MacArthur proposed flight training for cadets, and the City of Newburgh transferred the land to the U.S. government for $1. Construction begins and a small dirt airstrip was cleared and graded.
• In 1939, the U.S. Military Academy at West Point built the first airfield at Stewart for cadet aviation training. The north entrance to the USMA was named after the old Stewart farm, “Stoney Lonesome.”
• In 1948, the airfield became Stewart Air Force Base.
• In 1970, Stewart Airport was acquired by the State of New York. Operating responsibility was later transferred to the New York State Department of Transportation (DOT).
• In the 1980s, several business enterprises began operations at Stewart after the DOT and Urban Development Corporation began planning for the development of the airport.
• In 1980, Runway 9-27 is expanded to nearly 12,000 feet in length, allowing it to accommodate any large aircraft in the world.
• In 1981, U.S. hostages held in Iran returned to the United States via Stewart Airport.
• In 1990, scheduled air carrier service began as American Airlines offered the first commercial flights.
• On March 31, 2000, Stewart Airport became the nation’s first privatized commercial airport under a 99-year lease agreement with National Express.
• On November 1, 2007, the Port Authority purchased the remaining 93 years of the operating lease for $78.5 million.
siZe AnD LOcAtiOnStewart Airport covers 2,400 acres. It is located at the Intersection of the New York State Thruway (Interstate 87) and Interstate 84, in Newburgh/New Windsor in Orange County, New York, less than 60 miles north of Manhattan.
AviAtiOn rOLeStewart Airport is an economical, convenient alternative to the New York/New Jersey metropolitan region’s airports. Several commercial and charter
airlines operate at the airport, offering direct access to a number of major U.S. hubs with connections to virtually anywhere in the world. Stewart handled about 282,000 passengers and more than 15,100 tons of cargo in 2015.
eMPLOYMent AnD ecOnOMic iMPActThe airport contributes about $347 million in annual economic activity to its region, generating about 2,400 total jobs and more than $123 million in annual wages. More than half the capital projects initiated by the Port Authority have been awarded to local firms and contractors.
investMentA $100 million project that rehabilitated and modernized both runways was completed in mid-2015, representing the largest investment ever made in a single project in Stewart’s history. Since the Port Authority took over Stewart Airport in November 2007, it has invested more than $173 million to make improvements. Planned investments include continued improvements to infrastructure, safety and security projects, parking, roadways, terminal upgrades, customer service, and amenities.
reDeveLOPMentIn 1991, Stewart International became the first facility to receive $5 million in funding under the Federal Aviation Administration’s (FAA) Military Airport Program for capital improvements to airports that were formerly military facilities or military/civil aircraft-use facilities. That same year, the FAA awarded Stewart a $900,000 grant to fund a master plan update, conduct an environmental review, and prepare a noise study. The airport also received $13 million in federal funding for infrastructure rehabilitation. In 1992, the FAA awarded another $3 million for terminal expansion and redesign. A 50,000-square-foot air cargo building opened in 1990. In 2007, the Port Authority initiated its redevelopment program, whose upgrades include the complete repaving of both of the airport’s runways as part of a $100 million project — the largest in the airport’s history — and a new Federal Inspection Services facility to accommodate international flights. In December 2011, the Port Authority Board of Commissioners approved a $20 million expansion of the airport’s passenger terminal. Design work is under way for the expansion. Construction is expected to begin in 2016, and the project will be complete
in 2019. The Port Authority built a new $10 million regional crime lab for the New York State Police as part of an agreement that ensures the police force continues to guard and protect the airport. The lab opened in 2015.
PAssenGer terMinALStewart Airport’s terminal features an expansive lobby with 37 check-in stations, several check-in kiosks, shared-use terminal equipment, a checkpoint lane with the latest generation AIT full-body scanner, two Explosive Detection System baggage screening systems, and a new Federal Inspection Service facility to efficiently process international arrivals. The terminal also includes seven passenger gates and jet-boarding bridges, ticket counters, an electronic flight information display system, a spacious baggage claim area, and car rental agency counters. The concourse features top-notch concessions, an ATM, and wi-fi service.
rOADWAY Access AnD GrOUnD trAnsPOrtAtiOnThe MetroNorth-Port Jervis rail line offers a direct link to Secaucus, N.J., from the Salisbury Mills station. The Hudson Line provides a direct link to Grand Central Terminal from the Beacon station. Amtrak service is provided from Poughkeepsie and Croton-Harmon. Some area hotels offer free shuttle service. Black car service is provided by Visconti Ground Transportation. Car rental agencies are located in the passenger terminal. Shortline/Coach USA offers daily round-trip bus service from Stewart Airport to the Port Authority Bus Terminal. The Newburgh-Beacon Shuttle offers weekday service from Stewart Airport to the Metro-North Hudson Line at the Beacon train station.
PArKinGThe airport offers approximately 2,000 parking spaces in short- and long-term lots within walking distance of the terminal.
cArGOStewart International maintains 536,800 square feet of air cargo facilities. The airport handles a variety of cargo, including oversized freight, express packages and livestock. The airport is home to the New York Animal Import Center. Fed Ex and UPS operate regularly scheduled flights at the airport. A USDA inspection facility is located on the airport.
Stewart International Airport
Stewart international airport fact Sheet

10
rUnWAYsStewart Airport has two runways: Runway 9-27 is 11,817 feet long and Runway 16-34 is 6,004 feet long. Both runways are 150 feet wide, and were completely repaved in 2014.
Air trAFFic cOntrOL tOWerA state-of-the-art control tower was commissioned by the FAA in 2006 and is open 24 hours a day.
Stewart International Airport
11
Atlantic City International Airport
atlantic City international airport fact Sheet
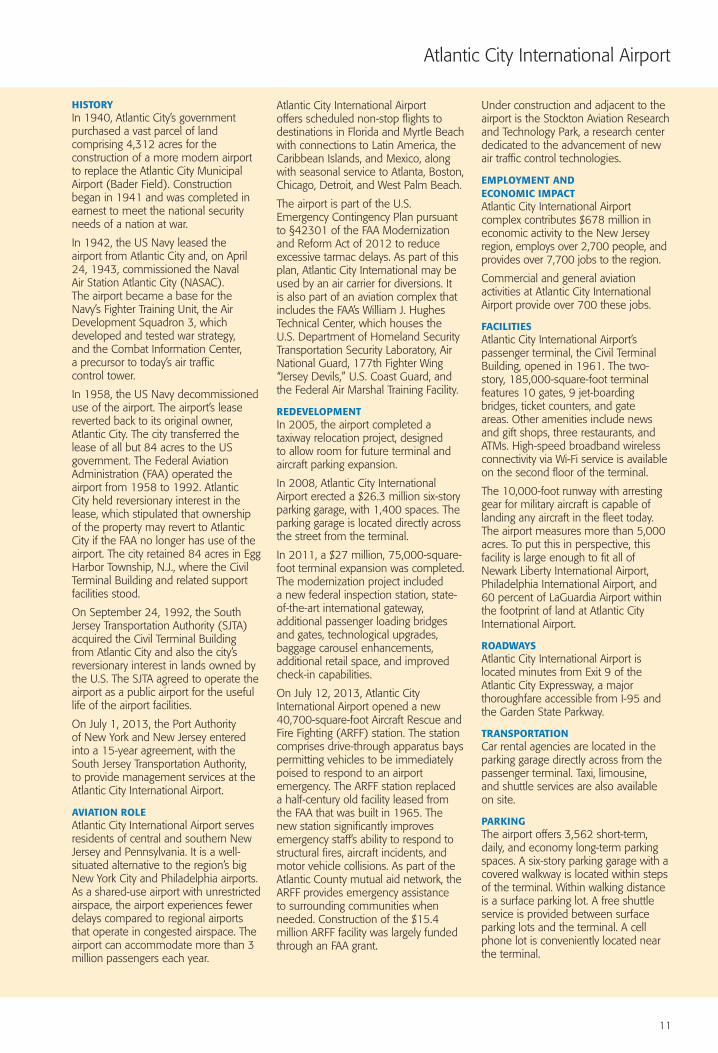
HistOrYIn 1940, Atlantic City’s government purchased a vast parcel of land comprising 4,312 acres for the construction of a more modern airport to replace the Atlantic City Municipal Airport (Bader Field). Construction began in 1941 and was completed in earnest to meet the national security needs of a nation at war.
In 1942, the US Navy leased the airport from Atlantic City and, on April 24, 1943, commissioned the Naval Air Station Atlantic City (NASAC). The airport became a base for the Navy’s Fighter Training Unit, the Air Development Squadron 3, which developed and tested war strategy, and the Combat Information Center, a precursor to today’s air traffic control tower.
In 1958, the US Navy decommissioned use of the airport. The airport’s lease reverted back to its original owner, Atlantic City. The city transferred the lease of all but 84 acres to the US government. The Federal Aviation Administration (FAA) operated the airport from 1958 to 1992. Atlantic City held reversionary interest in the lease, which stipulated that ownership of the property may revert to Atlantic City if the FAA no longer has use of the airport. The city retained 84 acres in Egg Harbor Township, N.J., where the Civil Terminal Building and related support facilities stood.
On September 24, 1992, the South Jersey Transportation Authority (SJTA) acquired the Civil Terminal Building from Atlantic City and also the city’s reversionary interest in lands owned by the U.S. The SJTA agreed to operate the airport as a public airport for the useful life of the airport facilities.
On July 1, 2013, the Port Authority of New York and New Jersey entered into a 15-year agreement, with the South Jersey Transportation Authority, to provide management services at the Atlantic City International Airport.
AviAtiOn rOLeAtlantic City International Airport serves residents of central and southern New Jersey and Pennsylvania. It is a well-situated alternative to the region’s big New York City and Philadelphia airports. As a shared-use airport with unrestricted airspace, the airport experiences fewer delays compared to regional airports that operate in congested airspace. The airport can accommodate more than 3 million passengers each year.
Atlantic City International Airport offers scheduled non-stop flights to destinations in Florida and Myrtle Beach with connections to Latin America, the Caribbean Islands, and Mexico, along with seasonal service to Atlanta, Boston, Chicago, Detroit, and West Palm Beach.
The airport is part of the U.S. Emergency Contingency Plan pursuant to §42301 of the FAA Modernization and Reform Act of 2012 to reduce excessive tarmac delays. As part of this plan, Atlantic City International may be used by an air carrier for diversions. It is also part of an aviation complex that includes the FAA’s William J. Hughes Technical Center, which houses the U.S. Department of Homeland Security Transportation Security Laboratory, Air National Guard, 177th Fighter Wing “Jersey Devils,” U.S. Coast Guard, and the Federal Air Marshal Training Facility.
reDeveLOPMentIn 2005, the airport completed a taxiway relocation project, designed to allow room for future terminal and aircraft parking expansion.
In 2008, Atlantic City International Airport erected a $26.3 million six-story parking garage, with 1,400 spaces. The parking garage is located directly across the street from the terminal.
In 2011, a $27 million, 75,000-square-foot terminal expansion was completed. The modernization project included a new federal inspection station, state- of-the-art international gateway, additional passenger loading bridges and gates, technological upgrades, baggage carousel enhancements, additional retail space, and improved check-in capabilities.
On July 12, 2013, Atlantic City International Airport opened a new 40,700-square-foot Aircraft Rescue and Fire Fighting (ARFF) station. The station comprises drive-through apparatus bays permitting vehicles to be immediately poised to respond to an airport emergency. The ARFF station replaced a half-century old facility leased from the FAA that was built in 1965. The new station significantly improves emergency staff’s ability to respond to structural fires, aircraft incidents, and motor vehicle collisions. As part of the Atlantic County mutual aid network, the ARFF provides emergency assistance to surrounding communities when needed. Construction of the $15.4 million ARFF facility was largely funded through an FAA grant.
Under construction and adjacent to the airport is the Stockton Aviation Research and Technology Park, a research center dedicated to the advancement of new air traffic control technologies.
eMPLOYMent AnD ecOnOMic iMPActAtlantic City International Airport complex contributes $678 million in economic activity to the New Jersey region, employs over 2,700 people, and provides over 7,700 jobs to the region.
Commercial and general aviation activities at Atlantic City International Airport provide over 700 these jobs.
FAciLities Atlantic City International Airport’s passenger terminal, the Civil Terminal Building, opened in 1961. The two-story, 185,000-square-foot terminal features 10 gates, 9 jet-boarding bridges, ticket counters, and gate areas. Other amenities include news and gift shops, three restaurants, and ATMs. High-speed broadband wireless connectivity via Wi-Fi service is available on the second floor of the terminal.
The 10,000-foot runway with arresting gear for military aircraft is capable of landing any aircraft in the fleet today. The airport measures more than 5,000 acres. To put this in perspective, this facility is large enough to fit all of Newark Liberty International Airport, Philadelphia International Airport, and 60 percent of LaGuardia Airport within the footprint of land at Atlantic City International Airport.
rOADWAYs Atlantic City International Airport is located minutes from Exit 9 of the Atlantic City Expressway, a major thoroughfare accessible from I-95 and the Garden State Parkway.
trAnsPOrtAtiOnCar rental agencies are located in the parking garage directly across from the passenger terminal. Taxi, limousine, and shuttle services are also available on site.
PArKinG The airport offers 3,562 short-term, daily, and economy long-term parking spaces. A six-story parking garage with a covered walkway is located within steps of the terminal. Within walking distance is a surface parking lot. A free shuttle service is provided between surface parking lots and the terminal. A cell phone lot is conveniently located near the terminal.

12
Atlantic City International Airport
rUnWAYs Atlantic City International Airport has two runways: 4/22 is 6,144 by 150 feet (1,873 x 46 m) asphalt/concrete; 13/31 is 10,000 by 150 feet (3,048 x 46 m) asphalt.
Air trAFFic cOntrOL tOWer A state-of-the-art control tower was commissioned by the FAA in 1987. Open 24 hours per day, the tower is staffed by FAA-certified air-traffic controllers.
secUritY AnD sAFetY Atlantic City International Airport is a designated test site for emerging security technologies through a Cooperative Research and Development Agreement with the U.S. Department of Homeland Security’s Transportation Security Laboratory.

13
Teterboro Airport
teterboro airport fact Sheet
HistOrY• Teterboro Airport is the oldest operating airport in the New York City metropolitan region.
• Walter C. Teter acquired the property in 1917, and the first flight took place in 1919.
• During World War I, North American Aviation operated a manufacturing plant on the site. After the war, the airport served as a base of operation for Anthony Fokker, the Dutch aircraft designer.
• During World War II, the U.S. Army and U.S. Air Force operated the airport.
• The Port Authority purchased the airport on April 1, 1949, from Fred L. Wehran, a private owner.
• The airport was leased to Pan Am World Airways by the Port Authority in 1970. The airport then passed to its successor organization, Johnson Controls, until December 1, 2000, when the Port Authority re-assumed full responsibility for the operation of the airport.
siZe AnD LOcAtiOnTeterboro Airport covers 827 acres. It borders the municipalities of Teterboro, Hasbrouck Heights, Little Ferry, Moonachie, and Wood-Ridge in Bergen County, N.J., with its northern border on U.S. Highway 46 and its southern border on Moonachie Avenue.
AviAtiOn rOLeTeterboro Airport, designated as a reliever airport for general aviation in the New York-New Jersey region, is a 24-hour public-use facility that offers visual non-precision and all-weather precision landing capabilities. The airport does not permit scheduled commercial operations, and prohibits aircraft with operating weights in excess of 100,000 pounds.
eMPLOYMent AnD ecOnOMic iMPActTeterboro Airport supports more than 14,900 jobs paying $868 million in annual wages, and generates nearly $2.3 billion in annual sales activity.
investMentThe Port Authority has invested more than $380 million to upgrade the airport’s facilities and open new areas of service to the aviation community.
reDeveLOPMentPlans are under way to develop 15 acres of unimproved land at Teterboro that will deliver more efficient operations by better meeting the needs of newer, more efficient aircraft through
improvements to aeronautical areas. Primary improvements throughout the airport include two new 40,000-square-foot hangars, a 30,000-square-foot hangar, a modernized terminal building, and paved parking for aircraft.
BUsiness services• Fixed-Based Operations – Teterboro Airport is served by four fixed-based operators that provide a range of services for private, general aviation aircraft.
• Charter/Aircraft Leasing – Companies can charter an aircraft either to supplement their own aircraft or to travel if they do not own an airplane.
• Cargo – Couriers and small package cargo shippers operate at Teterboro Airport.
• Public Service – Teterboro Airport serves as the primary receiving point for hearts and other human organs used for life-saving transplant operations performed at medical centers throughout the region.
• International Travel – Customs clearance services are available at the airport.
FAciLitiesTwenty-three hangars at the airport have a total area of approximately 572,000 square feet. One large office building with an area of approximately 134,400 square feet includes the airport management office. Additional office and shop space at fixed-base operator and tenant locations totals about 252,000 square feet. Aircraft rescue and fire fighting and maintenance facilities are located at the airport.
rUnWAYs AnD tAXiWAYsRunway 6-24 (NE/SW) is 6,013 feet long and 150 feet wide, and is equipped with High Intensity Runway Edge Lights (HIRL). Runway 6 approach has an Instrument Landing System (ILS) and a Medium Intensity Approach Lighting System-R (MALS-R). Runway 24 approach is equipped with a Precision Approach Path Indicator (PAPI) and Runway End Identifier Lights (REILS). Runway 6-24 underwent a complete rehabilitation in 2010, during which centerline lights were added to the runway and Touchdown Zone (TDZ) lights were added to Runway 6. Both Runway 6 and Runway 24 have an EMAS installed at each departure end.
Runway 1-19 (North/South) is 7,000 feet long and 150 feet wide, and is equipped with HIRL and REILS. Runway 19 approach is equipped with a PAPI and Runway 1 approach is equipped
with a Visual Approach Slope Indicator (VASI). Runway 19 approach has an ILS. Runway 1-19 was overlaid and grooved in the summer of 2000, which included the installation of centerline lights and TDZ lights for Runway 19. Runway 1 is the preferred runway for noise abatement procedures. Runway 1-19 was rehabilitated in 2011, and included work to relocate nearby Redneck Avenue to create a Runway Safety Area and the installation of an EMAS.
The airport features approximately 4.2 miles of taxiways. Most are 60 feet wide and all are equipped with centerline lights and edge lighting systems.
certiFicAtiOn stAtUsIn 1973, Teterboro Airport voluntarily applied for and received certification for safety under Part 139 of the Federal Aviation Administration (FAA) Regulations. It was the first general aviation airport in the nation to have this certification. The certification requires that the airport operator meet prescribed operating and safety standards, terms, and conditions as required by the FAA. Teterboro Airport became the first civilian airport to receive International Organization for Standardization (ISO) certification for its Quality Management System (QMS). The QMS is currently registered as conforming to the requirements of ISO 9001:2008. The ISO establishes standards for ideal business practices and is recognized worldwide. Certification requires reviews of airport management’s procedures and responsibilities, corrective and preventative actions, and internal quality control measures.
AircrAFt MOveMents2015 – 167,236 2010 – 149,5302000 – 181,9031990 – 160,307 1980 – 231,017
Air trAFFic cOntrOL tOWerThe control tower, which is open 24 hours a day, was constructed on the east side of the airport by the FAA and went into operation on October 29, 1975. Plans to construct a new tower are progressing.

14
Page is intentionally blank.

- - aiRCRaft mOVEmEntS SECtiOn
AircrAFt MOveMents
Commercial and Non-CommercialAircraft Movements
Aircraft Movements by Market

15
1.1.1 JFK COmmERCial and nOn-COmmERCial aiRCRaft mOVEmEntS Annual Totals 2002 to 2015
domestic SChEdulEd ChaRtER nOn-YEaR paSSEngER paSSEngER CaRgO COmmutER REVEnuE OthER * tOtal
2002 113,473 83 9,899 45,395 1,542 10,364 180,7562003 120,002 221 8,850 34,213 2,580 8,290 174,1562004 141,019 197 8,933 44,025 1,706 8,734 204,6142005 150,258 204 8,193 59,973 1,728 9,886 230,2422006 166,970 217 7,419 64,971 1,180 9,656 250,4132007 192,606 215 7,586 91,600 1,297 9,654 302,9582008 187,501 50 6,820 83,428 1,605 8,621 288,0252009 177,208 30 5,723 81,302 1,398 7,143 272,8042010 168,811 39 5,942 68,726 1,184 7,743 252,4452011 171,153 25 5,588 73,405 1,234 8,098 259,5032012 175,552 22 5,363 58,939 755 9,724 250,3552013 175,688 18 5,397 57,105 461 9,662 248,3312014 179,490 673 5,701 58,334 356 10,346 254,9002015 193,729 21 5,850 53,509 394 11,513 265,016
international SChEdulEd ChaRtER nOn-YEaR paSSEngER paSSEngER CaRgO COmmutER REVEnuE OthER * tOtal
2002 87,366 1,909 13,999 2,863 754 – 106,8912003 85,402 1,961 15,163 2,701 935 – 106,1622004 94,219 1,378 15,027 3,726 1,110 – 115,4602005 97,527 1,266 14,380 5,209 1,324 – 119,7062006 106,491 1,023 13,417 5,814 1,269 – 128,0142007 118,233 1,823 13,311 6,231 1,198 – 140,7962008 125,785 488 10,926 11,964 1,203 – 150,3662009 123,444 171 7,839 10,503 525 – 142,4822010 124,710 188 9,387 9,714 526 – 144,5252011 127,323 182 9,668 11,742 320 – 149,2352012 130,864 691 8,539 11,127 152 – 151,3732013 138,645 133 8,016 10,866 136 – 157,7962014 150,658 191 6,973 10,518 114 – 168,4542015 156,909 118 6,948 9,751 155 – 173,881
domestic andinternational
SChEdulEd ChaRtER nOn-YEaR paSSEngER paSSEngER CaRgO COmmutER REVEnuE OthER * tOtal
2002 200,839 1,992 23,898 48,258 2,296 10,364 287,6472003 205,404 2,182 24,013 36,914 3,515 8,290 280,3182004 235,238 1,575 23,960 47,751 2,816 8,734 320,0742005 247,785 1,470 22,573 65,182 3,052 9,886 349,9482006 273,461 1,240 20,836 70,785 2,449 9,656 378,4272007 310,839 2,038 20,897 97,831 2,495 9,654 443,7542008 313,286 538 17,746 95,392 2,808 8,621 438,3912009 300,652 201 13,562 91,805 1,923 7,143 415,2862010 293,521 227 15,329 78,440 1,710 7,743 396,9702011 298,476 207 15,256 85,147 1,554 8,098 408,7382012 306,416 713 13,902 70,066 907 9,724 401,7282013 314,333 151 13,413 67,971 597 9,662 406,1272014 330,148 864 12,674 68,852 470 10,346 423,3542015 350,638 139 12,798 63,260 549 11,513 438,897
* Includes Air Taxi, Business & Private, Government flights. Helicopters are excluded.
1.1.1 Commercial and non-Commercial aircraft movements, annual total 2002-2015, by airport and Region

16
1.1.1 eWr COmmERCial and nOn-COmmERCial aiRCRaft mOVEmEntS Annual Totals 2002 to 2015
domestic SChEdulEd ChaRtER nOn-YEaR paSSEngER paSSEngER CaRgO COmmutER REVEnuE OthER * tOtal
2002 204,996 727 24,057 96,852 957 15,260 342,8492003 189,214 1,252 24,469 110,726 651 14,064 340,3762004 188,233 512 25,058 135,428 423 15,095 364,7492005 180,606 322 24,719 138,989 352 14,992 359,9802006 185,996 217 25,337 136,363 356 14,376 362,6452007 181,414 384 23,902 126,785 202 14,786 347,4732008 164,519 219 21,799 141,655 137 12,736 341,0652009 144,577 418 18,475 144,648 128 11,443 319,6892010 131,384 339 19,008 150,934 111 11,599 313,3752011 138,804 506 18,736 142,243 306 11,420 312,0152012 142,829 375 17,690 145,482 1,011 11,009 318,3962013 144,757 373 16,895 146,170 1,440 11,341 320,9762014 143,052 453 17,684 131,808 1,443 11,010 305,4502015 149,604 391 20,291 138,485 1,882 12,954 323,607
international SChEdulEd ChaRtER nOn-YEaR paSSEngER paSSEngER CaRgO COmmutER REVEnuE OthER * tOtal
2002 51,299 1,077 2,133 7,988 467 – 62,9642003 51,704 1,232 2,255 10,771 525 – 66,4872004 57,192 663 2,069 11,991 773 – 72,6882005 60,348 182 2,119 13,284 328 – 76,2612006 62,082 131 2,900 17,292 206 – 82,6112007 66,806 33 3,305 18,274 39 – 88,4572008 71,356 85 3,363 18,141 40 – 92,9852009 67,466 103 3,122 21,415 26 – 92,1322010 72,439 171 3,134 20,121 80 – 95,9452011 75,232 105 3,142 19,465 65 – 98,0092012 72,690 76 2,406 20,503 56 – 95,7312013 69,822 62 1,643 21,163 76 – 92,7662014 71,548 106 1,347 18,756 154 – 91,9112015 71676 195 1,306 16,643 94 – 89,914
domestic andinternational
SChEdulEd ChaRtER nOn-YEaR paSSEngER paSSEngER CaRgO COmmutER REVEnuE OthER * tOtal
2002 256,295 1,804 26,190 104,840 1,424 15,260 405,8132003 240,918 2,484 26,724 121,497 1,176 14,064 406,8632004 245,425 1,175 27,127 147,419 1,196 15,095 437,4372005 240,954 504 26,838 152,273 680 14,992 436,2412006 248,078 348 28,237 153,655 562 14,376 445,2562007 248,220 417 27,207 145,059 241 14,786 435,9302008 235,875 304 25,162 159,796 177 12,736 434,0502009 212,043 521 21,597 166,063 154 11,443 411,8212010 203,823 510 22,142 171,055 191 11,599 409,3202011 214,036 611 21,878 161,708 371 11,420 410,0242012 215,519 451 20,096 165,985 1,067 11,009 414,1272013 214,579 435 18,538 167,333 1,516 11,341 413,7422014 214,600 559 19,031 150,564 1,597 11,010 397,3612015 221,280 586 21,597 155,128 1,976 12,954 413,521
* Includes Air Taxi, Business & Private, Government flights. Helicopters are excluded.

17
1.1.1 LGA COmmERCial and nOn-COmmERCial aiRCRaft mOVEmEntS Annual Totals 2002 to 2015
domestic SChEdulEd ChaRtER nOn-YEaR paSSEngER paSSEngER CaRgO COmmutER REVEnuE OthER * tOtal
2002 187,812 87 – 141,369 519 13,530 343,3172003 184,113 142 – 156,883 563 14,206 355,9072004 192,263 124 – 169,811 694 14,777 377,6692005 191,910 98 – 169,111 456 15,706 377,2812006 189,222 58 – 173,998 311 14,390 377,9792007 181,482 90 – 174,451 310 13,990 370,3232008 175,060 52 – 169,896 244 10,866 356,1182009 156,940 96 – 165,384 228 8,835 331,4832010 161,675 84 – 165,965 173 9,416 337,3132011 159,391 88 – 175,111 264 9,035 343,8892012 161,560 73 – 169,620 202 9,239 340,6942013 156,247 63 – 172,051 213 9,292 337,8662014 157,115 39 – 163,280 205 9,143 329,7822015 167,577 44 – 155,924 218 9,336 333,099
international SChEdulEd ChaRtER nOn-YEaR paSSEngER paSSEngER CaRgO COmmutER REVEnuE OthER * tOtal
2002 17,080 7 – 2,028 7 – 19,1222003 15,527 1 – 3,522 4 – 19,0542004 15,034 0 – 7,066 6 – 22,1062005 17,467 2 – 6,118 3 – 23,5902006 13,782 0 – 8,186 3 – 21,9712007 12,615 12 – 8,593 4 – 21,2242008 12,599 19 – 10,164 8 – 22,7902009 11,093 2 – 11,808 2 – 22,9052010 11,570 15 – 12,717 1 – 24,3032011 10,835 20 – 11,120 6 – 21,9812012 15,012 0 – 14,283 0 – 29,2952013 16,460 2 – 16,527 6 – 32,9952014 12,055 6 – 19,359 9 – 31,4292015 12,799 3 – 14,370 3 – 27,175
domestic andinternational
SChEdulEd ChaRtER nOn-YEaR paSSEngER paSSEngER CaRgO COmmutER REVEnuE OthER * tOtal
2002 204,892 94 – 143,397 526 13,530 362,4392003 199,640 143 – 160,405 567 14,206 374,9612004 207,297 124 – 176,877 700 14,777 399,7752005 209,377 100 – 175,229 459 15,706 400,8712006 203,004 58 – 182,184 314 14,390 399,9502007 194,097 102 – 183,044 314 13,990 391,5472008 187,659 71 – 180,060 252 10,866 378,9082009 168,033 98 – 177,192 230 8,835 354,3882010 173,245 99 – 178,682 174 9,416 361,6162011 170,226 108 – 186,231 270 9,035 365,8702012 176,572 73 – 183,903 202 9,239 369,9892013 172,707 65 – 188,578 219 9,292 370,8612014 169,170 45 – 182,639 214 9,143 361,2112015 180,376 47 – 170,294 221 9,336 360,274
* Includes Air Taxi, Business & Private, Government flights. Helicopters are excluded.

18
1.1.1 sWF COmmERCial and nOn-COmmERCial aiRCRaft mOVEmEntS Annual Totals 2002 to 2015
domestic SChEdulEd ChaRtER nOn-YEaR paSSEngER paSSEngER CaRgO COmmutER REVEnuE OthER * tOtal
2002 7,732 – – – – – 7,7322003 9,931 – – – – – 9,9312004 11,967 – – – – – 11,9672005 11,708 – – – – – 11,7082006 543 32 1,559 7,265 106 73,644 83,1492007 6,783 – 1,520 7,756 – 71,100 87,1592008 5,441 – 1,602 6,740 12 58,840 72,6352009 1,454 – 933 5,417 23 36,738 44,5652010 1,426 – 903 5,350 193 39,175 47,0472011 1,651 – 1,160 5,836 169 37,672 46,4882012 1,768 – 1,261 5,734 95 33,286 42,1442013 1,729 – 1,278 4,535 75 31,266 38,8832014 1,643 – 1,274 4,311 58 29,591 36,8772015 1,653 2 1,313 3,631 32 31,192 37,823
international SChEdulEd ChaRtER nOn-YEaR paSSEngER paSSEngER CaRgO COmmutER REVEnuE OthER * tOtal
2002 3 – – – – – 32003 9 – – – – – 92004 11 – – – – – 112005 28 – – – – – 282006 25 2 34 8 – – 692007 – – 20 – – – 202008 – – 8 – – – 82009 – – 3 – 3 – 62010 – – – – – – –2011 – 20 1 – 21 – 422012 – – 12 – 1 – 132013 – – 20 – 2 – 222014 – – 4 – – – 42015 – – 11 – – – 11
domestic andinternational
SChEdulEd ChaRtER nOn-YEaR paSSEngER paSSEngER CaRgO COmmutER REVEnuE OthER * tOtal
2002 7,735 – – – – – 7,7352003 9,940 – – – – – 9,9402004 11,978 – – – – – 11,9782005 11,736 – – – – – 11,7362006 568 34 1,593 7,273 106 73,644 83,2182007 6,783 – 1,540 7,756 – 71,100 87,1792008 5,441 – 1,610 6,740 12 58,840 72,6432009 1,454 – 936 5,417 26 36,738 44,5712010 1,426 – 903 5,350 193 39,175 47,0472011 1,651 20 1,161 5,836 190 37,672 46,5302012 1,768 – 1,273 5,734 96 33,286 42,1572013 1,729 – 1,298 4,535 77 31,266 38,9052014 1,643 – 1,278 4,311 58 29,591 36,8812015 1,653 2 1,324 3,631 32 31,192 37,834
* Includes Air Taxi, Business & Private, Government flights. Helicopters are excluded.
19
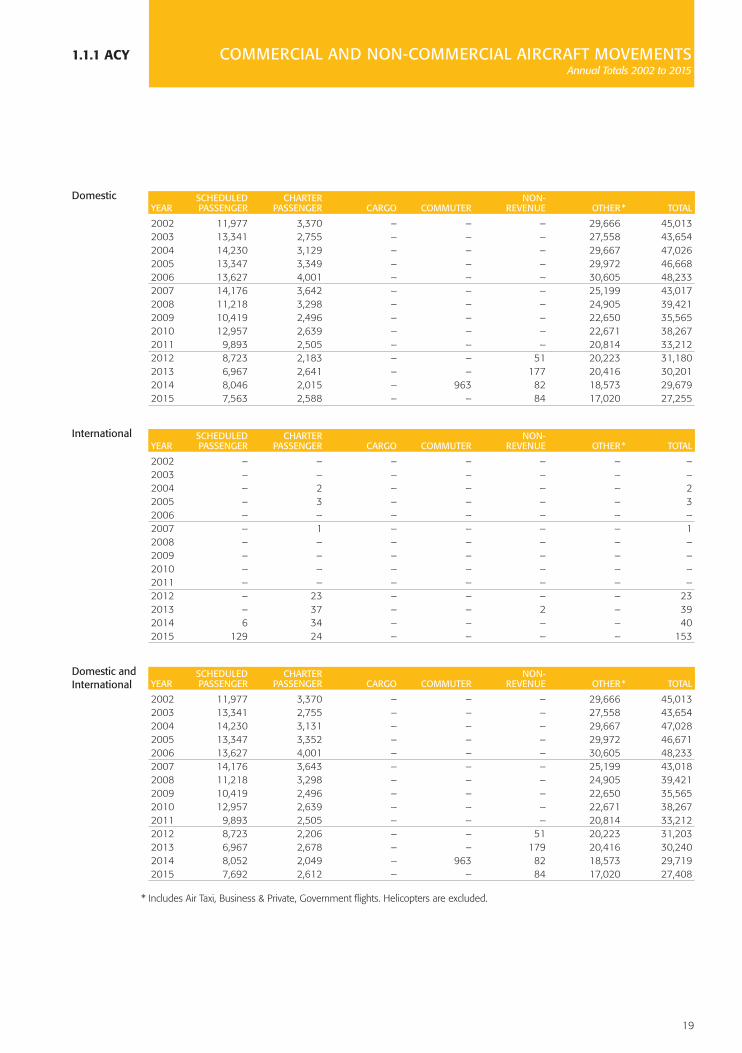
1.1.1 AcY COmmERCial and nOn-COmmERCial aiRCRaft mOVEmEntS Annual Totals 2002 to 2015
domestic SChEdulEd ChaRtER nOn-YEaR paSSEngER paSSEngER CaRgO COmmutER REVEnuE OthER * tOtal
2002 11,977 3,370 – – – 29,666 45,0132003 13,341 2,755 – – – 27,558 43,6542004 14,230 3,129 – – – 29,667 47,0262005 13,347 3,349 – – – 29,972 46,6682006 13,627 4,001 – – – 30,605 48,2332007 14,176 3,642 – – – 25,199 43,0172008 11,218 3,298 – – – 24,905 39,4212009 10,419 2,496 – – – 22,650 35,5652010 12,957 2,639 – – – 22,671 38,2672011 9,893 2,505 – – – 20,814 33,2122012 8,723 2,183 – – 51 20,223 31,1802013 6,967 2,641 – – 177 20,416 30,2012014 8,046 2,015 – 963 82 18,573 29,6792015 7,563 2,588 – – 84 17,020 27,255
international SChEdulEd ChaRtER nOn-YEaR paSSEngER paSSEngER CaRgO COmmutER REVEnuE OthER * tOtal
2002 – – – – – – –2003 – – – – – – –2004 – 2 – – – – 22005 – 3 – – – – 32006 – – – – – – –2007 – 1 – – – – 12008 – – – – – – –2009 – – – – – – –2010 – – – – – – –2011 – – – – – – –2012 – 23 – – – – 232013 – 37 – – 2 – 392014 6 34 – – – – 402015 129 24 – – – – 153
domestic andinternational
SChEdulEd ChaRtER nOn-YEaR paSSEngER paSSEngER CaRgO COmmutER REVEnuE OthER * tOtal
2002 11,977 3,370 – – – 29,666 45,0132003 13,341 2,755 – – – 27,558 43,6542004 14,230 3,131 – – – 29,667 47,0282005 13,347 3,352 – – – 29,972 46,6712006 13,627 4,001 – – – 30,605 48,2332007 14,176 3,643 – – – 25,199 43,0182008 11,218 3,298 – – – 24,905 39,4212009 10,419 2,496 – – – 22,650 35,5652010 12,957 2,639 – – – 22,671 38,2672011 9,893 2,505 – – – 20,814 33,2122012 8,723 2,206 – – 51 20,223 31,2032013 6,967 2,678 – – 179 20,416 30,2402014 8,052 2,049 – 963 82 18,573 29,7192015 7,692 2,612 – – 84 17,020 27,408
* Includes Air Taxi, Business & Private, Government flights. Helicopters are excluded.

20
1.1.1 teB COmmERCial and nOn-COmmERCial aiRCRaft mOVEmEntS Annual Totals 2002 to 2015
domestic SChEdulEd ChaRtER nOn-YEaR paSSEngER paSSEngER CaRgO COmmutER REVEnuE OthER * tOtal
2002 – – – – – 200,599 200,5992003 – – – – – 193,807 193,8072004 – – – – – 202,400 202,4002005 – – – – – 196,129 196,1292006 – – – – – 187,840 187,8402007 – – – – – 182,101 182,1012008 – – – – – 161,039 161,0392009 – – – – – 132,746 132,7462010 – – – – – 143,380 143,3802011 – – – – – 145,792 145,7922012 – – – – – 141,119 141,1192013 – – – – – 148,207 148,2072014 – – – – – 154,611 154,6112015 – – – – – 159,707 159,707
international SChEdulEd ChaRtER nOn-YEaR paSSEngER paSSEngER CaRgO COmmutER REVEnuE OthER * tOtal
2002 – – – – – – –0 2003 – – – – – – –0
2004 – – – – – – –0
2005 – – – – – – –0
2006 – – – – – – –0
2007 – – – – – – –0
2008 – – – – – 1,394 1,3942009 – – – – – 5,144 5,1442010 – – – – – 6,150 6,1502011 – – – – – 6,455 6,4552012 – – – – – 6,357 6,3572013 – – – – – 6,825 6,8252014 – – – – – 7,231 7,2312015 – – – – – 7,529 7,529
domestic andinternational
SChEdulEd ChaRtER nOn-YEaR paSSEngER paSSEngER CaRgO COmmutER REVEnuE OthER * tOtal
2002 – – – – – 200,599 200,5992003 – – – – – 193,807 193,8072004 – – – – – 202,400 202,4002005 – – – – – 196,129 196,1292006 – – – – – 187,840 187,8402007 – – – – – 182,101 182,1012008 – – – – – 162,433 162,4332009 – – – – – 137,890 137,8902010 – – – – – 149,530 149,5302011 – – – – – 152,247 152,2472012 – – – – – 147,476 147,4762013 – – – – – 155,032 155,0322014 – – – – – 161,842 161,8422015 – – – – – 167,236 167,236
* Includes Air Taxi, Business & Private, Government flights. Helicopters are excluded.

21
1.1.1 COmmERCial and nOn-COmmERCial aiRCRaft mOVEmEntSreGiOn Annual Totals 2002 to 2015
domestic SChEdulEd ChaRtER nOn-YEaR paSSEngER paSSEngER CaRgO COmmutER REVEnuE OthER * tOtal
2002 525,990 4,267 33,956 283,616 3,018 68,820 919,6672003 516,601 4,370 33,319 301,822 3,794 64,118 924,0242004 547,712 3,962 33,991 349,264 2,823 68,273 1,006,0252005 547,829 3,973 32,912 368,073 2,536 70,556 1,025,8792006 556,358 4,525 34,315 382,597 1,953 142,671 1,122,4192007 576,461 4,331 33,008 400,592 1,809 134,729 1,150,9302008 543,739 3,619 30,221 401,719 1,998 115,968 1,097,2642009 490,598 3,040 25,131 396,751 1,777 86,809 1,004,1062010 476,253 3,101 25,853 390,975 1,661 90,604 988,4472011 480,892 3,124 25,484 396,595 1,973 87,039 995,1072012 490,432 2,653 24,314 379,775 2,114 83,481 982,7692013 485,388 3,095 23,570 379,861 2,366 81,977 976,2572014 489,346 3,180 24,659 358,696 2,144 78,663 956,6882015 520,126 3,046 27,454 351,549 2,610 82,015 986,800
international SChEdulEd ChaRtER nOn-YEaR paSSEngER paSSEngER CaRgO COmmutER REVEnuE OthER * tOtal
2002 155,748 2,993 16,132 12,879 1,228 – 188,9802003 152,642 3,194 17,418 16,994 1,464 – 191,7122004 166,456 2,043 17,096 22,783 1,889 – 210,2672005 175,370 1,453 16,499 24,611 1,655 – 219,5882006 182,380 1,156 16,351 31,300 1,478 – 232,6652007 197,654 1,869 16,636 33,098 1,241 – 250,4982008 209,740 592 14,297 40,269 1,251 – 266,1492009 202,003 276 10,964 43,726 556 – 257,5252010 208,719 374 12,521 42,552 607 – 264,7732011 213,390 327 12,811 42,327 412 – 269,2672012 218,566 790 10,957 45,913 209 – 276,4352013 224,927 234 9,679 48,556 222 – 283,6182014 234,267 337 8,324 48,633 277 – 291,8382015 241,513 340 8,265 40,764 252 – 291,134
domestic andinternational
SChEdulEd ChaRtER nOn-YEaR paSSEngER paSSEngER CaRgO COmmutER REVEnuE OthER * tOtal
2002 681,738 7,260 50,088 296,495 4,246 68,820 1,108,6472003 669,243 7,564 50,737 318,816 5,258 64,118 1,115,7362004 714,168 6,005 51,087 372,047 4,712 68,273 1,216,2922005 723,199 5,426 49,411 392,684 4,191 70,556 1,245,4672006 738,738 5,681 50,666 413,897 3,431 142,671 1,355,0842007 774,115 6,200 49,644 433,690 3,050 134,729 1,401,4282008 753,479 4,211 44,518 441,988 3,249 115,968 1,363,4132009 692,601 3,316 36,095 440,477 2,333 86,809 1,261,6312010 684,972 3,475 38,374 433,527 2,268 90,604 1,253,2202011 694,282 3,451 38,295 438,922 2,385 87,039 1,264,3742012 708,998 3,443 35,271 425,688 2,323 83,481 1,259,2042013 710,315 3,329 33,249 428,417 2,588 81,977 1,259,8752014 723,613 3,517 32,983 407,329 2,421 78,663 1,248,5262015 761,639 3,386 35,719 392,313 2,862 82,015 1,277,934
* Includes Air Taxi, Business & Private, Government flights. Helicopters are excluded.

22
1.1.2 JFK COmmERCial and nOn-COmmERCial aiRCRaft mOVEmEntS Monthly Totals 2015
domestic SChEdulEd ChaRtER nOn- % ChangEmOnth paSSEngER paSSEngER CaRgO COmmutER REVEnuE OthER * tOtal 2014-15
Jan 14,608 – 454 3,715 19 601 19,397 8.9%Feb 13,777 2 432 3,318 29 686 18,244 8.0%Mar 15,982 4 448 3,766 17 724 20,941 1.4%Apr 16,338 – 489 4,233 28 752 21,840 5.0%May 17,005 2 480 4,532 28 1,034 23,081 2.4%Jun 17,018 3 493 4,427 33 1,026 23,000 -0.2%Jul 17,784 1 512 4,716 36 1,200 24,249 3.0%Aug 17,962 – 473 4,903 27 1,092 24,457 0.7%Sep 15,899 2 482 4,741 30 1,538 22,692 2.8%Oct 16,444 1 524 5,142 41 1,132 23,284 7.1%Nov 14,691 2 454 5,107 30 960 21,244 5.1%Dec 16,221 4 609 4,909 76 768 22,587 5.8%total 2015 193,729 21 5,850 53,509 394 11,513 265,016 3.9%% Change2014 to 2015 7.9% -96.9% 1.2% -8.3% 10.7% 11.3% 3.9%
international SChEdulEd ChaRtER nOn- % ChangEmOnth paSSEngER paSSEngER CaRgO COmmutER REVEnuE OthER * tOtal 2014-15
Jan 11,826 4 543 762 10 – 13,145 4.2%Feb 10,406 1 553 694 19 – 11,673 3.9%Mar 12,108 8 589 818 21 – 13,544 2.2%Apr 12,761 10 578 854 18 – 14,221 4.7%May 13,287 9 591 968 10 – 14,865 3.5%Jun 14,114 12 551 930 4 – 15,611 3.1%Jul 15,552 9 572 944 15 – 17,092 4.5%Aug 15,623 8 556 896 19 – 17,102 2.5%Sep 13,148 13 566 781 2 – 14,510 3.5%Oct 12,856 13 600 706 12 – 14,187 2.4%Nov 11,973 4 636 589 12 – 13,214 0.2%Dec 13,255 27 613 809 13 – 14,717 4.0%total 2015 156,909 118 6,948 9,751 155 – 173,881 3.2%% Change2014 to 2015 4.1% -38.2% -0.4% -7.3% 37.2% – 3.2%
domestic andinternational
SChEdulEd ChaRtER nOn- % ChangEmOnth paSSEngER paSSEngER CaRgO COmmutER REVEnuE OthER * tOtal 2014-15
Jan 26,434 4 997 4,477 29 601 32,542 7.0%Feb 24,183 3 985 4,012 48 686 29,917 6.3%Mar 28,090 12 1,037 4,584 38 724 34,485 1.7%Apr 29,099 10 1,067 5,087 46 752 36,061 4.9%May 30,292 11 1,071 5,500 38 1,034 37,946 2.8%Jun 31,132 15 1,044 5,357 37 1,026 38,611 1.1%Jul 33,336 10 1,084 5,660 51 1,200 41,341 3.6%Aug 33,585 8 1,029 5,799 46 1,092 41,559 1.4%Sep 29,047 15 1,048 5,522 32 1,538 37,202 3.1%Oct 29,300 14 1,124 5,848 53 1,132 37,471 5.2%Nov 26,664 6 1,090 5,696 42 960 34,458 3.1%Dec 29,476 31 1,222 5,718 89 768 37,304 5.1%total 2015 350,638 139 12,798 63,260 549 11,513 438,897 3.7%% Change2014 to 2015 6.2% -83.9% 0.4% -8.1% 17.1% 11.3% 3.7%
* Includes Air Taxi, Business & Private, Government and Helicopters.
1.1.2 Commercial and non-Commercial aircraft movements, monthly totals 2015, by airport and Region
23
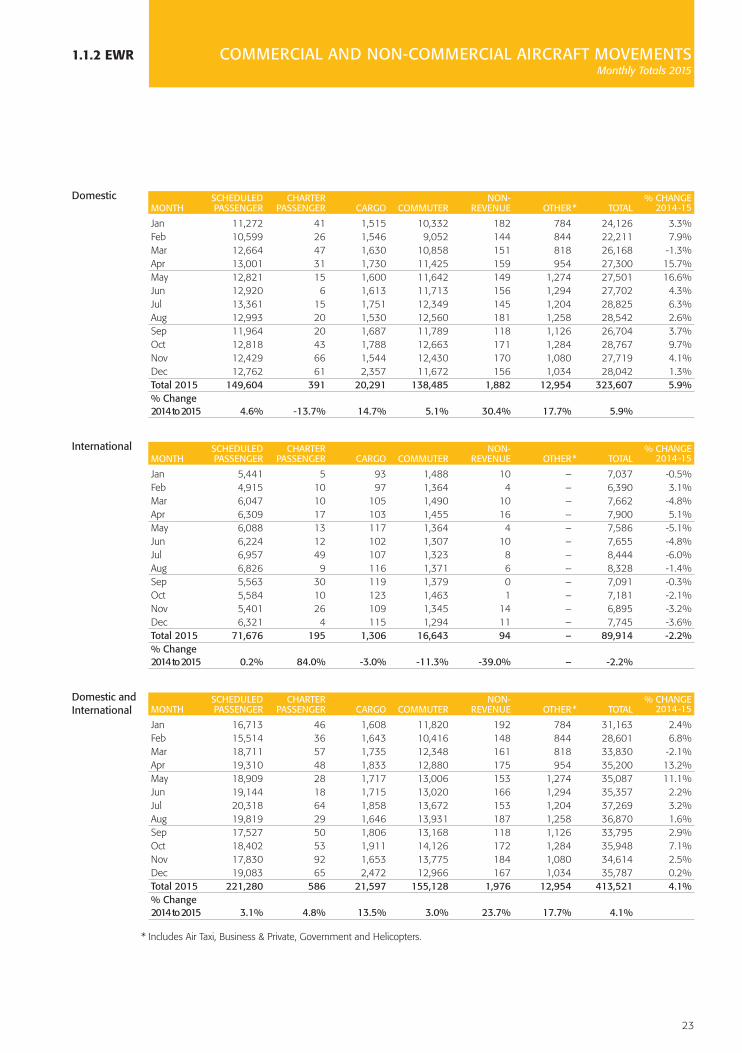
1.1.2 eWr COmmERCial and nOn-COmmERCial aiRCRaft mOVEmEntS Monthly Totals 2015
domestic SChEdulEd ChaRtER nOn- % ChangEmOnth paSSEngER paSSEngER CaRgO COmmutER REVEnuE OthER * tOtal 2014-15
Jan 11,272 41 1,515 10,332 182 784 24,126 3.3%Feb 10,599 26 1,546 9,052 144 844 22,211 7.9%Mar 12,664 47 1,630 10,858 151 818 26,168 -1.3%Apr 13,001 31 1,730 11,425 159 954 27,300 15.7%May 12,821 15 1,600 11,642 149 1,274 27,501 16.6%Jun 12,920 6 1,613 11,713 156 1,294 27,702 4.3%Jul 13,361 15 1,751 12,349 145 1,204 28,825 6.3%Aug 12,993 20 1,530 12,560 181 1,258 28,542 2.6%Sep 11,964 20 1,687 11,789 118 1,126 26,704 3.7%Oct 12,818 43 1,788 12,663 171 1,284 28,767 9.7%Nov 12,429 66 1,544 12,430 170 1,080 27,719 4.1%Dec 12,762 61 2,357 11,672 156 1,034 28,042 1.3%total 2015 149,604 391 20,291 138,485 1,882 12,954 323,607 5.9%% Change2014 to 2015 4.6% -13.7% 14.7% 5.1% 30.4% 17.7% 5.9%
international SChEdulEd ChaRtER nOn- % ChangEmOnth paSSEngER paSSEngER CaRgO COmmutER REVEnuE OthER * tOtal 2014-15
Jan 5,441 5 93 1,488 10 – 7,037 -0.5%Feb 4,915 10 97 1,364 4 – 6,390 3.1%Mar 6,047 10 105 1,490 10 – 7,662 -4.8%Apr 6,309 17 103 1,455 16 – 7,900 5.1%May 6,088 13 117 1,364 4 – 7,586 -5.1%Jun 6,224 12 102 1,307 10 – 7,655 -4.8%Jul 6,957 49 107 1,323 8 – 8,444 -6.0%Aug 6,826 9 116 1,371 6 – 8,328 -1.4%Sep 5,563 30 119 1,379 0 – 7,091 -0.3%Oct 5,584 10 123 1,463 1 – 7,181 -2.1%Nov 5,401 26 109 1,345 14 – 6,895 -3.2%Dec 6,321 4 115 1,294 11 – 7,745 -3.6%total 2015 71,676 195 1,306 16,643 94 – 89,914 -2.2%% Change2014 to 2015 0.2% 84.0% -3.0% -11.3% -39.0% – -2.2%
domestic andinternational
SChEdulEd ChaRtER nOn- % ChangEmOnth paSSEngER paSSEngER CaRgO COmmutER REVEnuE OthER * tOtal 2014-15
Jan 16,713 46 1,608 11,820 192 784 31,163 2.4%Feb 15,514 36 1,643 10,416 148 844 28,601 6.8%Mar 18,711 57 1,735 12,348 161 818 33,830 -2.1%Apr 19,310 48 1,833 12,880 175 954 35,200 13.2%May 18,909 28 1,717 13,006 153 1,274 35,087 11.1%Jun 19,144 18 1,715 13,020 166 1,294 35,357 2.2%Jul 20,318 64 1,858 13,672 153 1,204 37,269 3.2%Aug 19,819 29 1,646 13,931 187 1,258 36,870 1.6%Sep 17,527 50 1,806 13,168 118 1,126 33,795 2.9%Oct 18,402 53 1,911 14,126 172 1,284 35,948 7.1%Nov 17,830 92 1,653 13,775 184 1,080 34,614 2.5%Dec 19,083 65 2,472 12,966 167 1,034 35,787 0.2%total 2015 221,280 586 21,597 155,128 1,976 12,954 413,521 4.1%% Change2014 to 2015 3.1% 4.8% 13.5% 3.0% 23.7% 17.7% 4.1%
* Includes Air Taxi, Business & Private, Government and Helicopters.

24
1.1.2 LGA COmmERCial and nOn-COmmERCial aiRCRaft mOVEmEntS Monthly Totals 2015
domestic SChEdulEd ChaRtER nOn- % ChangEmOnth paSSEngER paSSEngER CaRgO COmmutER REVEnuE OthER * tOtal 2014-15
Jan 13,224 – – 12,017 11 722 25,974 5.8%Feb 12,244 – – 10,723 19 670 23,656 5.5%Mar 14,683 – – 12,323 20 764 27,790 -1.4%Apr 14,619 3 – 13,274 12 840 28,748 1.0%May 14,508 6 – 12,895 24 926 28,359 0.1%Jun 14,354 4 – 12,476 7 740 27,581 -2.4%Jul 14,403 7 – 14,338 17 716 29,481 4.3%Aug 14,387 11 – 14,659 31 742 29,830 2.0%Sep 13,679 4 – 13,580 28 836 28,127 1.5%Oct 14,241 5 – 14,122 21 806 29,195 -0.4%Nov 13,250 2 – 13,314 16 810 27,392 0.9%Dec 13,985 2 – 12,203 12 764 26,966 -3.2%total 2015 167,577 44 – 155,924 218 9,336 333,099 1.0%% Change2014 to 2015 6.7% 12.8% – -4.5% 6.3% 2.1% 1.0%
international SChEdulEd ChaRtER nOn- % ChangEmOnth paSSEngER paSSEngER CaRgO COmmutER REVEnuE OthER * tOtal 2014-15
Jan 820 2 – 1,358 – – 2,180 -11.5%Feb 809 – – 1,217 1 – 2,027 -9.8%Mar 953 – – 1,350 – – 2,303 -16.2%Apr 1,000 – – 1,457 – – 2,457 -9.5%May 1,156 – – 1,440 – – 2,596 -3.4%Jun 1,097 – – 1,438 – – 2,535 -5.2%Jul 1,147 – – 1,356 – – 2,503 -7.5%Aug 1,135 – – 1,293 1 – 2,429 -14.7%Sep 1,129 1 – 1,036 – – 2,166 -23.1%Oct 1,216 – – 968 1 – 2,185 -22.8%Nov 1,154 – – 778 – – 1,932 -16.7%Dec 1,183 – – 679 – – 1,862 -21.6%total 2015 12,799 3 – 14,370 3 – 27,175 -13.5%% Change2014 to 2015 6.2% -50.0% – -25.8% -66.7% – -13.5%
domestic andinternational
SChEdulEd ChaRtER nOn- % ChangEmOnth paSSEngER paSSEngER CaRgO COmmutER REVEnuE OthER * tOtal 2014-15
Jan 14,044 2 – 13,375 11 722 28,154 4.2%Feb 13,053 – – 11,940 20 670 25,683 4.1%Mar 15,636 – – 13,673 20 764 30,093 -2.7%Apr 15,619 3 – 14,731 12 840 31,205 0.1%May 15,664 6 – 14,335 24 926 30,955 -0.2%Jun 15,451 4 – 13,914 7 740 30,116 -2.7%Jul 15,550 7 – 15,694 17 716 31,984 3.3%Aug 15,522 11 – 15,952 32 742 32,259 0.6%Sep 14,808 5 – 14,616 28 836 30,293 -0.7%Oct 15,457 5 – 15,090 22 806 31,380 -2.4%Nov 14,404 2 – 14,092 16 810 29,324 -0.5%Dec 15,168 2 – 12,882 12 764 28,828 -4.7%total 2015 180,376 47 – 170,294 221 9,336 360,274 -0.3%% Change2014 to 2015 6.6% 4.4% – -6.8% 3.3% 2.1% -0.3%
* Includes Air Taxi, Business & Private, Government and Helicopters.

25
1.1.2 sWF COmmERCial and nOn-COmmERCial aiRCRaft mOVEmEntS Monthly Totals 2015
domestic SChEdulEd ChaRtER nOn- % ChangEmOnth paSSEngER paSSEngER CaRgO COmmutER REVEnuE OthER * tOtal 2014-15
Jan 132 – 97 256 13 1,816 2,314 -13.8%Feb 128 – 95 228 7 1,839 2,297 -6.9%Mar 138 – 110 251 – 2,119 2,618 -8.1%Apr 137 – 116 325 – 2,719 3,297 -0.4%May 144 – 108 366 – 2,980 3,598 4.1%Jun 135 – 110 352 – 2,593 3,190 -3.5%Jul 142 – 111 355 – 2,893 3,501 -3.0%Aug 141 – 98 354 – 3,351 3,944 16.5%Sep 136 – 114 317 – 3,136 3,703 10.0%Oct 140 – 110 269 8 2,971 3,498 9.0%Nov 138 2 96 265 4 2,731 3,236 17.9%Dec 142 – 148 293 – 2,044 2,627 5.5%total 2015 1,653 2 1,313 3,631 32 31,192 37,823 2.6%% Change2014 to 2015 0.6% – 3.1% -15.8% -44.8% 5.4% 2.6%
international SChEdulEd ChaRtER nOn- % ChangEmOnth paSSEngER paSSEngER CaRgO COmmutER REVEnuE OthER * tOtal 2014-15
Jan – – 1 – – – 1 100.0%Feb – – – – – – – –Mar – – 2 – – – 2 100.0%Apr – – – – – – – –May – – 4 – – – 4 100.0%Jun – – – – – – – –Jul – – 4 – – – 4 –Aug – – – – – – – –Sep – – – – – – – –Oct – – – – – – – –Nov – – – – – – – –Dec – – – – – – – –total 2015 – – 11 – – – 11 175.0%% Change2014 to 2015 – – – – – – 175.0%
domestic andinternational
SChEdulEd ChaRtER nOn- % ChangEmOnth paSSEngER paSSEngER CaRgO COmmutER REVEnuE OthER * tOtal 2014-15
Jan 132 – 98 256 13 1,816 2,315 -13.8%Feb 128 – 95 228 7 1,839 2,297 -6.9%Mar 138 – 112 251 – 2,119 2,620 -8.1%Apr 137 – 116 325 – 2,719 3,297 -0.4%May 144 – 112 366 – 2,980 3,602 4.3%Jun 135 – 110 352 – 2,593 3,190 -3.5%Jul 142 – 115 355 – 2,893 3,505 -3.0%Aug 141 – 98 354 – 3,351 3,944 16.5%Sep 136 – 114 317 – 3,136 3,703 10.0%Oct 140 – 110 269 8 2,971 3,498 9.0%Nov 138 2 96 265 4 2,731 3,236 17.9%Dec 142 – 148 293 – 2,044 2,627 5.5%total 2015 1,653 2 1,324 3,631 32 31,192 37,834 2.6%% Change2014 to 2015 0.6% 100.0% 3.6% -15.8% -44.8% 5.4% 2.6%
* Includes Air Taxi, Business & Private, Government and Helicopters.

26
* Includes Air Taxi, Business & Private, Government and Helicopters.
1.1.2 AcY COmmERCial and nOn-COmmERCial aiRCRaft mOVEmEntS Monthly Totals 2015
domestic SChEdulEd ChaRtER nOn- gEnERal % ChangEmOnth paSSEngER paSSEngER CaRgO COmmutER REVEnuE aViatiOn * tOtal 2014-15
Jan 667 164 – – 2 1,059 1,892 0.5%Feb 610 175 – – 10 964 1,759 -7.8%Mar 716 191 – – 4 1,310 2,221 6.0%Apr 719 182 – – 3 1,399 2,303 -9.3%May 682 282 – – 5 1,714 2,683 -10.9%Jun 640 287 – – 8 1,598 2,533 -12.4%Jul 679 313 – – 18 1,744 2,754 -9.2%Aug 674 248 – – 5 1,970 2,897 -11.2%Sep 534 191 – – 8 1,563 2,296 -10.8%Oct 494 200 – – 8 1,358 2,060 -13.4%Nov 553 191 – – 3 1,299 2,046 -9.9%Dec 595 164 – – 10 1,042 1,811 -1.4%total 2015 7,563 2,588 – – 84 17,020 27,255 -8.2%% Change2014 to 2015 -6.0% 28.4% – -100.0% 2.4% -8.4% -8.2%
international SChEdulEd ChaRtER nOn- gEnERal % ChangEmOnth paSSEngER paSSEngER CaRgO COmmutER REVEnuE aViatiOn * tOtal 2014-15
Jan – 1 – – – – 1 –Feb – 1 – – – – 1 -50.0%Mar – 3 – – – – 3 -25.0%Apr – 3 – – – – 3 -25.0%May 14 2 – – – – 16 700.0%Jun 35 1 – – – – 36 414.3%Jul 34 5 – – – – 39 875.0%Aug 38 3 – – – – 41 925.0%Sep 8 – – – – – 8 60.0%Oct – 4 – – – – 4 -42.9%Nov – – – – – – – –Dec – 1 – – – – 1 –total 2015 129 24 – – – – 153 282.5%% Change2014 to 2015 2050.0% -29.4% – – – – 282.5%
domestic andinternational
SChEdulEd ChaRtER nOn- gEnERal % ChangEmOnth paSSEngER paSSEngER CaRgO COmmutER REVEnuE aViatiOn * tOtal 2014-15
Jan 667 165 – – 2 1,059 1,893 0.5%Feb 610 176 – – 10 964 1,760 -7.8%Mar 716 194 – – 4 1,310 2,224 6.0%Apr 719 185 – – 3 1,399 2,306 -9.4%May 696 284 – – 5 1,714 2,699 -10.4%Jun 675 288 – – 8 1,598 2,569 -11.4%Jul 713 318 – – 18 1,744 2,793 -8.0%Aug 712 251 – – 5 1,970 2,938 -10.0%Sep 542 191 – – 8 1,563 2,304 -10.6%Oct 494 204 – – 8 1,358 2,064 -13.5%Nov 553 191 – – 3 1,299 2,046 -9.9%Dec 595 165 – – 10 1,042 1,812 -1.4%total 2015 7,692 2,612 – – 84 17,020 27,408 -7.8%% Change2014 to 2015 -4.5% 27.5% – -100.0% 2.4% -8.4% -7.8%

27
1.1.2 teB COmmERCial and nOn-COmmERCial aiRCRaft mOVEmEntS Monthly Totals 2015
domestic SChEdulEd ChaRtER nOn- % ChangEmOnth paSSEngER paSSEngER CaRgO COmmutER REVEnuE OthER * tOtal 2014-15
Jan – – – – – 10,404 10,404 -6.6%Feb – – – – – 11,297 11,297 6.0%Mar – – – – – 12,736 12,736 8.3%Apr – – – – – 13,435 13,435 6.9%May – – – – – 14,883 14,883 -0.7%Jun – – – – – 14,085 14,085 6.2%Jul – – – – – 12,942 12,942 9.3%Aug – – – – – 11,834 11,834 2.7%Sep – – – – – 14,868 14,868 0.5%Oct – – – – – 15,109 15,109 2.6%Nov – – – – – 14,296 14,296 6.9%Dec – – – – – 13,818 13,818 -1.2%total 2015 – – – – – 159,707 159,707 3.3%% Change2014 to 2015 – – – – – 3.3% 3.3%
international SChEdulEd ChaRtER nOn- % ChangEmOnth paSSEngER paSSEngER CaRgO COmmutER REVEnuE OthER * tOtal 2014-15
Jan – – – – – 630 630 -0.2%Feb – – – – – 526 526 10.5%Mar – – – – – 650 650 15.0%Apr – – – – – 633 633 6.2%May – – – – – 688 688 9.9%Jun – – – – – 664 664 8.0%Jul – – – – – 526 526 -8.5%Aug – – – – – 503 503 12.3%Sep – – – – – 707 707 -0.4%Oct – – – – – 661 661 2.0%Nov – – – – – 696 696 3.7%Dec – – – – – 645 645 -3.7%total 2015 – – – – – 7,529 7,529 4.1%% Change2014 to 2015 – – – – – 4.1% 4.1%
domestic andinternational
SChEdulEd ChaRtER nOn- % ChangEmOnth paSSEngER paSSEngER CaRgO COmmutER REVEnuE OthER * tOtal 2014-15
Jan – – – – – 11,034 11,034 -6.3%Feb – – – – – 11,823 11,823 6.2%Mar – – – – – 13,386 13,386 8.6%Apr – – – – – 14,068 14,068 6.9%May – – – – – 15,571 15,571 -0.2%Jun – – – – – 14,749 14,749 6.3%Jul – – – – – 13,468 13,468 8.4%Aug – – – – – 12,337 12,337 3.0%Sep – – – – – 15,575 15,575 0.5%Oct – – – – – 15,770 15,770 2.5%Nov – – – – – 14,992 14,992 6.8%Dec – – – – – 14,463 14,463 -1.3%total 2015 – – – – – 167,236 167,236 3.3%% Change2014 to 2015 – – – – – 3.3% 3.3%
* Includes Air Taxi, Business & Private, Government and Helicopters.

28
1.1.2 COmmERCial and nOn-COmmERCial aiRCRaft mOVEmEntSreGiOn Monthly Totals 2015
domestic SChEdulEd ChaRtER nOn- % ChangEmOnth paSSEngER paSSEngER CaRgO COmmutER REVEnuE OthER * tOtal 2014-15
Jan 39,903 205 2,066 26,320 227 4,982 73,703 4.9%Feb 37,358 203 2,073 23,321 209 5,003 68,167 6.0%Mar 44,183 242 2,188 27,198 192 5,735 79,738 -0.7%Apr 44,814 216 2,335 29,257 202 6,664 83,488 6.1%May 45,160 305 2,188 29,435 206 7,928 85,222 5.3%Jun 45,067 300 2,216 28,968 204 7,251 84,006 -0.1%Jul 46,369 336 2,374 31,758 216 7,757 88,810 3.8%Aug 46,157 279 2,101 32,476 244 8,413 89,670 1.9%Sep 42,212 217 2,283 30,427 184 8,199 83,522 2.5%Oct 44,137 249 2,422 32,196 249 7,551 86,804 4.7%Nov 41,061 263 2,094 31,116 223 6,880 81,637 3.3%Dec 43,705 231 3,114 29,077 254 5,652 82,033 1.0%total 2015 520,126 3,046 27,454 351,549 2,610 82,015 986,800 3.1%% Change2014 to 2015 6.3% -4.2% 11.0% -2.0% 21.7% 4.3% 3.1%
international SChEdulEd ChaRtER nOn- % ChangEmOnth paSSEngER paSSEngER CaRgO COmmutER REVEnuE OthER * tOtal 2014-15
Jan 18,087 12 637 3,608 20 – 22,364 1.0%Feb 16,130 12 650 3,275 24 – 20,091 2.1%Mar 19,108 21 696 3,658 31 – 23,514 -2.3%Apr 20,070 30 681 3,766 34 – 24,581 3.2%May 20,545 24 712 3,772 14 – 25,067 0.1%Jun 21,470 25 653 3,675 14 – 25,837 -0.1%Jul 23,690 63 683 3,623 23 – 28,082 0.1%Aug 23,622 20 672 3,560 26 – 27,900 -0.3%Sep 19,848 44 685 3,196 2 – 23,775 -0.8%Oct 19,656 27 723 3,137 14 – 23,557 -2.0%Nov 18,528 30 745 2,712 26 – 22,041 -2.6%Dec 20,759 32 728 2,782 24 – 24,325 -1.0%total 2015 241,513 340 8,265 40,764 252 – 291,134 -0.2%% Change2014 to 2015 3.1% 0.9% -0.7% -16.2% -8.7% – -0.2%
domestic andinternational
SChEdulEd ChaRtER nOn- % ChangEmOnth paSSEngER paSSEngER CaRgO COmmutER REVEnuE OthER * tOtal 2014-15
Jan 57,990 217 2,703 29,928 247 4,982 96,067 3.9%Feb 53,488 215 2,723 26,596 233 5,003 88,258 5.1%Mar 63,291 263 2,884 30,856 223 5,735 103,252 -1.0%Apr 64,884 246 3,016 33,023 236 6,664 108,069 5.4%May 65,705 329 2,900 33,207 220 7,928 110,289 4.1%Jun 66,537 325 2,869 32,643 218 7,251 109,843 -0.1%Jul 70,059 399 3,057 35,381 239 7,757 116,892 2.9%Aug 69,779 299 2,773 36,036 270 8,413 117,570 1.4%Sep 62,060 261 2,968 33,623 186 8,199 107,297 1.8%Oct 63,793 276 3,145 35,333 263 7,551 110,361 3.2%Nov 59,589 293 2,839 33,828 249 6,880 103,678 2.0%Dec 64,464 263 3,842 31,859 278 5,652 106,358 0.5%total 2015 761,639 3,386 35,719 392,313 2,862 82,015 1,277,934 2.3%% Change2014 to 2015 5.3% -3.7% 8.0% -3.7% 18.3% 4.3% 2.3%
* Includes Air Taxi, Business & Private, Government and Helicopters.

29
1.2.1 aiRCRaft mOVEmEntS BY maRKEt Annual Totals 2002 to 2015
puERtO BERmuda & latin tRanS tRanSYEaR dOmEStiC * RiCO Canada CaRiBBEan mEXiCO amERiCa † atlantiC ‡ paCifiC § tOtal
2002 173,984 6,772 3,663 19,698 3,725 9,184 56,195 14,426 287,6472003 166,198 7,958 4,425 19,817 3,896 8,425 54,247 15,352 280,3182004 194,935 9,679 5,178 21,663 3,954 9,679 58,312 16,674 320,0742005 219,672 10,570 6,604 20,814 4,142 10,093 60,385 17,668 349,9482006 239,670 10,743 8,052 20,813 5,115 11,146 65,960 16,928 378,4272007 293,130 9,828 8,285 23,424 7,558 12,092 72,271 17,166 443,7542008 278,965 9,060 13,850 25,577 8,243 11,806 74,939 15,951 438,3912009 263,832 8,972 11,289 29,220 7,228 11,854 68,822 14,069 415,2862010 242,987 9,458 10,221 31,713 6,625 12,763 67,762 15,441 396,9702011 249,977 9,526 11,871 31,942 5,441 13,207 70,700 16,074 408,7382012 239,333 11,022 11,139 33,281 6,915 15,349 68,763 15,926 401,7282013 236,981 11,350 11,065 35,880 8,902 15,409 70,167 16,373 406,1272014 243,287 11,613 11,264 40,931 8,709 17,101 74,113 16,335 423,3532015 254,000 11,008 10,931 41,203 10,211 16,608 77,745 17,191 438,897
puERtO BERmuda & latin tRanS tRanSYEaR dOmEStiC* RiCO Canada CaRiBBEan mEXiCO amERiCa † atlantiC ‡ paCifiC § tOtal
2002 343,317 – 17,377 1,745 – – – – 362,4392003 355,906 1 17,138 1,916 – – – – 374,9612004 377,669 – 19,908 2,198 – – – – 399,7752005 377,281 – 21,556 2,034 – – – – 400,8712006 377,979 – 20,831 1,140 – – – – 399,9502007 370,323 – 20,048 1,176 – – – – 391,5472008 356,118 – 22,076 714 – – – – 378,9082009 331,483 – 22,573 332 – – – – 354,3882010 337,313 – 23,957 346 – – – – 361,6162011 343,889 – 21,924 57 – – – – 365,8702012 340,694 – 28,652 643 – – – – 369,9892013 337,866 – 31,701 1,294 – – – – 370,8612014 329,782 – 30,881 548 – – – – 361,2112015 333,099 – 27,041 133 – – 1 – 360,274
puERtO BERmuda & latin tRanS tRanSYEaR dOmEStiC * RiCO Canada CaRiBBEan mEXiCO amERiCa † atlantiC ‡ paCifiC § tOtal
2002 337,473 5,376 17,533 7,694 3,941 3,995 27,903 1,898 405,8132003 335,185 5,191 20,031 8,354 3,690 3,932 28,758 1,722 406,8632004 358,830 5,919 21,358 9,656 3,918 4,354 31,365 2,037 437,4372005 354,556 5,424 21,084 8,909 4,075 4,474 34,716 3,003 436,2412006 356,033 6,612 22,304 8,225 3,719 5,125 39,869 3,369 445,2562007 342,280 5,193 22,536 8,849 3,908 4,688 45,259 3,217 435,9302008 337,154 3,911 25,538 8,713 4,068 4,480 46,992 3,194 434,0502009 316,516 3,173 30,200 8,534 3,699 4,649 41,476 3,574 411,8212010 310,754 2,621 32,137 8,926 3,918 4,669 42,332 3,963 409,3202011 310,180 1,835 32,486 8,703 3,529 4,770 44,682 3,839 410,0242012 316,447 1,949 34,040 8,846 3,483 5,635 40,189 3,538 414,1272013 319,009 1,967 33,346 8,181 3,634 5,631 38,586 3,388 413,7422014 301,830 2,644 29,319 10,315 3,845 5,764 39,089 3,579 396,3852015 320,481 3,126 27,881 10,572 4,228 5,560 38,159 3,514 413,521
* Domestic includes Air Taxi, Business & Private, and Government. Helicopters are excluded.† Latin America includes Central & South America less Mexico and the Caribbean and Bermuda markets.‡ Transatlantic covers Europe, the Middle East and Africa, including India and Pakistan.§ Transpacific includes Pacific Rim counties, including China, Japan, Australia, New Zealand, and adjacent areas.
eWr
JFK
LGA
1.2.1 aircraft movements By market, annual totals 2002-2015, by airport and Region

30
1.2.1 aiRCRaft mOVEmEntS BY maRKEt Annual Totals 2002 to 2015
puERtO BERmuda & latin tRanS tRanSYEaR dOmEStiC * RiCO Canada CaRiBBEan mEXiCO amERiCa † atlantiC ‡ paCifiC § tOtal
2002 7,732 – 2 – – – 1 – 7,7352003 9,931 – 2 3 – – 2 2 9,9402004 11,967 – 2 – 1 1 5 2 11,9782005 11,708 – 3 – 1 – 20 4 11,7362006 83,149 – 35 2 – 1 31 – 83,2182007 87,159 – – – – – 20 – 87,1792008 72,635 – – – – – 8 – 72,6432009 44,565 – – – – – 6 – 44,5712010 47,047 – – – – – – – 47,0472011 46,488 – – – 41 – 1 – 46,5302012 42,144 – – – – – 13 – 42,1572013 38,883 – – – – – 22 – 38,9052014 36,877 – – – – – 4 – 36,8812015 37,823 – – – – – 11 – 37,834
* Domestic includes Air Taxi, Business & Private, and Government. Helicopters are excluded.
note: Region total does not include Teterboro.
sWF
puERtO BERmuda & latin tRanS tRanSYEaR dOmEStiC* RiCO Canada CaRiBBEan mEXiCO amERiCa atlantiC paCifiC tOtal
2002 907,519 12,148 38,575 29,137 7,666 13,179 84,099 16,324 1,108,6472003 910,874 13,150 41,596 30,090 7,586 12,357 83,007 17,076 1,115,7362004 990,427 15,598 46,446 33,519 7,873 14,034 89,682 18,713 1,216,2922005 1,009,885 15,994 49,247 31,760 8,218 14,567 95,121 20,675 1,245,4672006 1,105,064 17,355 51,222 30,180 8,834 16,272 105,860 20,297 1,355,0842007 1,135,909 15,021 50,869 33,450 11,466 16,780 117,550 20,383 1,401,4282008 1,084,293 12,971 61,464 35,004 12,311 16,286 121,939 19,145 1,363,4132009 991,961 12,145 64,062 38,086 10,927 16,503 110,304 17,643 1,261,6312010 976,368 12,079 66,315 40,985 10,543 17,432 110,094 19,404 1,253,2202011 983,746 11,361 66,281 40,702 9,011 17,977 115,383 19,913 1,264,3742012 969,798 12,971 73,831 42,793 10,398 20,984 108,965 19,464 1,259,2042013 962,940 13,317 76,112 45,394 12,536 21,040 108,775 19,761 1,259,8752014 941,455 14,257 71,464 51,834 12,554 22,865 113,206 19,914 1,247,5492015 972,658 14,134 65,982 51,932 14,439 22,168 115,916 20,705 1,277,934
puERtO BERmuda & latin tRanS tRanSYEaR dOmEStiC * RiCO Canada CaRiBBEan mEXiCO amERiCa † atlantiC ‡ paCifiC § tOtal
2002 45,013 – – – – – – – 45,0132003 43,654 – – – – – – – 43,6542004 47,026 – – 2 – – – – 47,0282005 46,668 – – 3 – – – – 46,6712006 48,233 – – – – – – – 48,2332007 43,017 – – 1 – – – – 43,0182008 39,421 – – – – – – – 39,4212009 35,565 – – – – – – – 35,5652010 38,267 – – – – – – – 38,2672011 33,212 – – – – – – – 33,2122012 31,180 – – 23 – – – – 31,2032013 30,201 – – 39 – – – – 30,2402014 29,679 – – 40 – – – – 29,7192015 27,255 – 129 24 – – – – 27,408
AcY
reGiOn

PAssenGer trAFFic
Top 50 Airport Comparisons
Commercial Passenger Traffic
Passenger Traffic by Market
2015 Revenue Passenger Traffic by Airline
Passenger Traffic by Terminal
- - paSSEngER tRaffiC SECtiOn

31
Source: Airports Council International - Worldwide Airport Traffic Report - Calendar Year 2015.
2.1.1 tOp 50 dOmEStiC aiRpORt COmpaRiSOnS U.S. Passenger Traffic, Ranked by Passenger
2015RanK aiRpORt nO. Of paSSEngERS % ChangE 2014-15
1 Hartsfield-Jackson Atlanta International Airport 101,491,106 5.522 O'Hare International Airport 76,942,493 9.83 Los Angeles International Airport 74,937,004 6.054 Dallas/Ft Worth International Airport 64,072,468 0.875 John F. Kennedy International Airport 56,827,154 6.786 Denver International Airport 54,014,502 1.017 San Francisco International Airport 50,057,887 6.258 McCarran International Airport 45,356,580 5.89 Charlotte Douglas International Airport 44,876,627 1.2310 Miami International Airport 44,350,247 8.3211 Sky Harbor International Airport 44,003,840 4.5112 George Bush Intercontinental Airport 43,023,224 4.2913 Seattle-Tacoma International Airport 42,340,461 12.9214 Orlando International Airport 38,727,749 8.3815 Newark Liberty International Airport 37,494,704 5.2916 Minneapolis/St Paul International Airport 36,556,281 4.0617 Logan International Airport 33,515,905 5.8718 Detroit Metropolitan Wayne County Airport 33,440,112 2.8519 Philadelphia International Airport 31,444,403 3.9820 LaGuardia Airport 28,437,668 5.521 Ft Lauderdale-Hollywood International Airport 26,941,671 9.322 Baltimore/Washington International Thurgood Marshall Airport 23,823,532 6.7723 Ronald Reagan Washington National Airport 23,012,191 10.7224 Midway International Airport 22,221,499 4.9225 Salt Lake City International Airport 22,152,498 4.7826 Washington Dulles International Airport 21,498,902 0.3727 San Diego International Airport 20,081,258 7.0528 Tampa International Airport 18,815,425 7.1929 Portland International Airport 16,850,952 5.8730 Love Field 14,497,498 5431 Lambert-St Louis International Airport 12,720,878 2.7232 W. P. Hobby Airport 12,163,344 1.833 Austin-Bergstrom International Airport 11,897,959 1134 Nashville International Airport 11,673,633 5.7435 Oakland International Airport 11,205,063 8.436 Louis Armstrong New Orleans International Airport 10,868,827 9.3137 Kansas City International Airport 10,472,461 3.0138 John Wayne Airport 10,180,258 8.4639 Raleigh-Durham International Airport 9,943,331 4.1840 Norman Y. Mineta San Jose International Airport 9,799,427 4.4141 Sacramento International Airport 9,608,737 7.2142 San Antonio International Airport 8,507,459 1.6543 Southwest Florida International Airport 8,371,801 5.0344 Pittsburgh International Airport 8,128,187 1.6245 Cleveland Hopkins International Airport 8,117,899 6.6846 Indianapolis International Airport 7,922,218 7.647 Port Columbus International Airport 6,796,214 6.9348 General Mitchell International Airport 6,549,353 -0.0749 Cincinnati/Northern Kentucky International Airport 6,316,333 6.950 Palm Beach International Airport 6,265,530 6.44
2.1.1 top 50 airport Comparisons, number of passengers, domestic 2015

32
2.1.2 tOp 50 WORldWidE aiRpORt COmpaRiSOnS Worldwide Passenger Traffic, Ranked by Passenger
2015RanK aiRpORt nO. Of paSSEngERS % ChangE 2014-15
1 Hartsfield-Jackson Atlanta International Airport 101,491,106 5.522 Beijing Capital International Airport 89,938,628 4.423 Dubai International Airport 78,014,841 10.74 O'Hare International Airport 76,942,493 9.85 Tokyo International (Haneda) Airport 75,316,718 3.426 Heathrow Airport 74,989,795 2.157 Los Angeles International Airport 74,937,004 6.058 Hong Kong International Airport 68,283,407 8.189 Aéroport de Paris-Charles de Gaulle 65,766,986 3.0610 Dallas/Ft Worth International Airport 64,072,468 0.8711 Atatürk International Airport 61,836,781 9.1712 Flughafen Frankfurt/Main 61,032,022 2.4613 Pudong International Airport 60,053,387 16.2714 Amsterdam Airport 58,284,864 6.0115 John F. Kennedy International Airport 56,827,154 6.7816 Singapore Changi Airport 55,449,000 2.5117 Guangzhou Bai Yun International Airport 55,201,915 0.7718 Soekarno-Hatta International Airport 54,053,905 -5.5119 Denver International Airport 54,014,502 1.0120 Suvarnabhumi International Airport 52,808,013 13.7521 San Francisco International Airport 50,057,887 6.2522 Incheon International Airport 49,412,750 8.2123 Kuala Lumpur International Airport 48,938,424 0.0224 Aeropuerto de Barajas 46,779,554 11.9725 Indira Gandhi International Airport 45,981,773 15.6726 McCarran International Airport 45,356,580 5.827 Charlotte Douglas International Airport 44,876,627 1.2328 Miami International Airport 44,350,247 8.3229 Sky Harbor International Airport 44,003,840 4.5130 George Bush Intercontinental Airport 43,023,224 4.2931 Seattle-Tacoma International Airport 42,340,461 12.9232 Chengdu Shuangliu International Airport 42,244,842 12.0233 Toronto Pearson International Airport 41,036,847 6.3934 Munich Airport 40,981,522 3.2335 Chhatrapati Shivaji International Airport 40,637,377 16.1336 Aeroporto di Roma-Fiumicino 40,422,156 4.9737 Gatwick Airport 40,271,343 5.6638 Sydney International Airport 39,914,103 2.739 Shenzhen Baoan International Airport 39,721,619 9.5140 Aeropuerto de Barcelona 39,674,095 5.7441 Guarulhos International Airport 39,213,865 -1.3942 Hongqiao International Airport 39,090,699 2.9543 Orlando International Airport 38,727,749 8.3844 Taiwan Taoyuan International Airport 38,473,333 7.4545 Aeropuerto Internacional de la Ciudad de México "Lic Benito Juárez" 38,433,288 12.246 Kunming International Airport 37,523,345 15.9947 Newark Liberty International Airport 37,494,704 5.2948 Narita International Airport 37,268,307 4.8849 Ninoy Aquino International Airport 36,583,459 7.3150 Minneapolis/St Paul International Airport 36,556,281 4.06
Source: Airports Council International – Worldwide Airport Traffic Report – Calendar Year 2015.
2.1.2 top 50 airport Comparisons, number of passengers, Worldwide 2015

33
domesticYEaR SChEdulEd ChaRtER COmmutER tOtal
2002 13,527,370 12,727 1,061,757 14,601,8542003 15,521,729 25,848 889,281 16,436,8582004 18,715,056 26,342 1,346,335 20,087,7332005 20,191,175 32,628 1,867,751 22,091,5542006 20,852,450 14,754 2,136,295 23,003,4992007 23,003,389 4,893 3,165,409 26,173,6912008 21,942,288 3,423 3,258,357 25,204,0682009 20,796,078 2,023 3,223,132 24,021,2332010 20,566,499 3,189 2,834,589 23,404,2772011 20,692,623 1,953 3,063,937 23,758,5132012 21,714,371 2,282 2,500,430 24,217,0832013 21,464,606 1,065 2,443,504 23,909,1752014 22,256,473 86,587 2,678,372 25,021,4322015 24,173,647 1,216 2,631,990 26,806,853
internationalYEaR SChEdulEd ChaRtER COmmutER tOtal
2002 14,979,644 285,156 71,534 15,336,3342003 14,951,177 281,725 66,731 15,299,6332004 17,164,097 222,685 99,976 17,486,7582005 18,417,371 232,969 150,017 18,800,3572006 19,306,775 146,305 172,303 19,625,3832007 21,168,276 202,293 173,556 21,544,1252008 22,197,030 66,035 335,983 22,599,0482009 21,516,446 18,920 321,343 21,856,7092010 22,793,276 17,939 305,394 23,116,6092011 23,480,594 14,944 390,546 23,886,0842012 24,590,649 73,356 393,088 25,057,0932013 26,122,488 17,282 401,413 26,541,1832014 27,718,176 26,171 451,971 28,196,3182015 29,541,412 16,405 462,484 30,020,301
domestic andinternational
YEaR SChEdulEd ChaRtER COmmutER tOtal
2002 28,507,014 297,883 1,133,291 29,938,1882003 30,472,906 307,573 956,012 31,736,4912004 35,879,153 249,027 1,446,311 37,574,4912005 38,608,546 265,597 2,017,768 40,891,9112006 40,159,225 161,059 2,308,598 42,628,8822007 44,171,665 207,186 3,338,965 47,717,8162008 44,139,318 69,458 3,594,340 47,803,1162009 42,312,524 20,943 3,544,475 45,877,9422010 43,359,775 21,128 3,139,983 46,520,8862011 44,173,217 16,897 3,454,483 47,644,5972012 46,305,020 75,638 2,893,518 49,274,1762013 47,587,094 18,347 2,844,917 50,450,3582014 49,974,649 112,758 3,130,343 53,217,7502015 53,715,059 17,621 3,094,474 56,827,154
2.2.1 JFK COmmERCial paSSEngER tRaffiC Annual Totals 2002 to 2015
2.2.1 Commercial passenger traffic, annual totals 2002-2015, by airport and Region
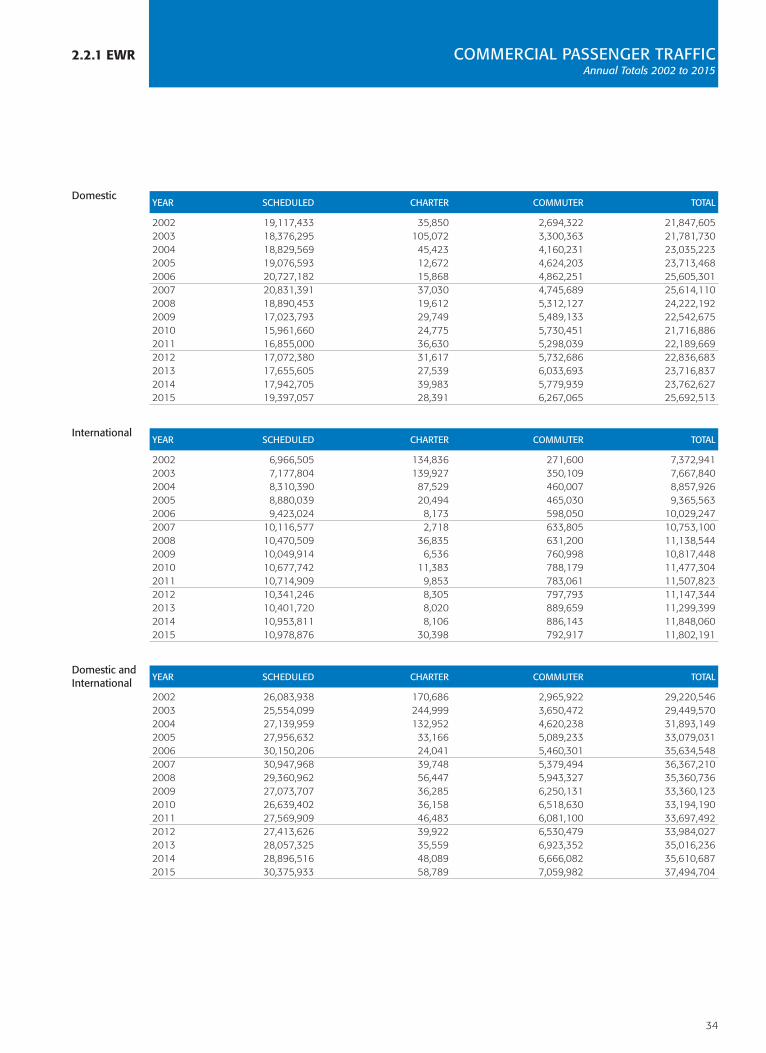
34
domesticYEaR SChEdulEd ChaRtER COmmutER tOtal
2002 19,117,433 35,850 2,694,322 21,847,6052003 18,376,295 105,072 3,300,363 21,781,7302004 18,829,569 45,423 4,160,231 23,035,2232005 19,076,593 12,672 4,624,203 23,713,4682006 20,727,182 15,868 4,862,251 25,605,3012007 20,831,391 37,030 4,745,689 25,614,1102008 18,890,453 19,612 5,312,127 24,222,1922009 17,023,793 29,749 5,489,133 22,542,6752010 15,961,660 24,775 5,730,451 21,716,8862011 16,855,000 36,630 5,298,039 22,189,6692012 17,072,380 31,617 5,732,686 22,836,6832013 17,655,605 27,539 6,033,693 23,716,8372014 17,942,705 39,983 5,779,939 23,762,6272015 19,397,057 28,391 6,267,065 25,692,513
internationalYEaR SChEdulEd ChaRtER COmmutER tOtal
2002 6,966,505 134,836 271,600 7,372,9412003 7,177,804 139,927 350,109 7,667,8402004 8,310,390 87,529 460,007 8,857,9262005 8,880,039 20,494 465,030 9,365,5632006 9,423,024 8,173 598,050 10,029,2472007 10,116,577 2,718 633,805 10,753,1002008 10,470,509 36,835 631,200 11,138,5442009 10,049,914 6,536 760,998 10,817,4482010 10,677,742 11,383 788,179 11,477,3042011 10,714,909 9,853 783,061 11,507,8232012 10,341,246 8,305 797,793 11,147,3442013 10,401,720 8,020 889,659 11,299,3992014 10,953,811 8,106 886,143 11,848,0602015 10,978,876 30,398 792,917 11,802,191
domestic andinternational
YEaR SChEdulEd ChaRtER COmmutER tOtal
2002 26,083,938 170,686 2,965,922 29,220,5462003 25,554,099 244,999 3,650,472 29,449,5702004 27,139,959 132,952 4,620,238 31,893,1492005 27,956,632 33,166 5,089,233 33,079,0312006 30,150,206 24,041 5,460,301 35,634,5482007 30,947,968 39,748 5,379,494 36,367,2102008 29,360,962 56,447 5,943,327 35,360,7362009 27,073,707 36,285 6,250,131 33,360,1232010 26,639,402 36,158 6,518,630 33,194,1902011 27,569,909 46,483 6,081,100 33,697,4922012 27,413,626 39,922 6,530,479 33,984,0272013 28,057,325 35,559 6,923,352 35,016,2362014 28,896,516 48,089 6,666,082 35,610,6872015 30,375,933 58,789 7,059,982 37,494,704
2.2.1 eWr COmmERCial paSSEngER tRaffiC Annual Totals 2002 to 2015

35
domesticYEaR SChEdulEd ChaRtER COmmutER tOtal
2002 17,801,507 5,054 3,063,014 20,869,5752003 17,987,478 9,314 3,438,454 21,435,2462004 19,231,252 6,274 3,954,084 23,191,6102005 19,977,024 4,935 4,436,272 24,418,2312006 19,777,748 3,281 4,715,953 24,496,9822007 18,853,913 5,354 4,940,098 23,799,3652008 17,244,972 2,884 4,693,536 21,941,3922009 16,102,463 6,120 5,034,430 21,143,0132010 17,420,964 5,920 5,523,231 22,950,1152011 17,175,291 5,252 5,906,213 23,086,7562012 17,785,343 7,607 6,481,079 24,274,0292013 17,895,141 5,263 7,053,168 24,953,5722014 18,064,300 2,905 7,089,997 25,157,2022015 19,757,324 2,422 6,925,177 26,684,923
internationalYEaR SChEdulEd ChaRtER COmmutER tOtal
2002 1,070,218 615 46,271 1,117,1042003 945,468 53 102,003 1,047,5242004 1,017,152 – 244,441 1,261,5932005 1,286,730 114 184,285 1,471,1292006 1,053,851 – 259,770 1,313,6212007 948,317 562 278,023 1,226,9022008 832,185 1,249 298,230 1,131,6642009 684,911 95 325,217 1,010,2232010 713,046 1,081 318,840 1,032,9672011 688,313 2,187 345,222 1,035,7222012 985,953 – 447,802 1,433,7552013 1,129,674 116 597,738 1,727,5282014 947,305 244 867,344 1,814,8932015 1,077,809 126 674,810 1,752,745
domestic andinternational
YEaR SChEdulEd ChaRtER COmmutER tOtal
2002 18,871,725 5,669 3,109,285 21,986,6792003 18,932,946 9,367 3,540,457 22,482,7702004 20,248,404 6,274 4,198,525 24,453,2032005 21,263,754 5,049 4,620,557 25,889,3602006 20,831,599 3,281 4,975,723 25,810,6032007 19,802,230 5,916 5,218,121 25,026,2672008 18,077,157 4,133 4,991,766 23,073,0562009 16,787,374 6,215 5,359,647 22,153,2362010 18,134,010 7,001 5,842,071 23,983,0822011 17,863,604 7,439 6,251,435 24,122,4782012 18,771,296 7,607 6,928,881 25,707,7842013 19,024,815 5,379 7,650,906 26,681,1002014 19,011,605 3,149 7,957,341 26,972,0952015 20,835,133 2,548 7,599,987 28,437,668
2.2.1 LGA COmmERCial paSSEngER tRaffiC Annual Totals 2002 to 2015

36
domesticYEaR SChEdulEd ChaRtER COmmutER tOtal
2002 227,834 – – 227,8342003 400,464 – – 400,4642004 510,563 – – 510,5632005 398,214 – – 398,2142006 66,261 2,055 241,461 309,7772007 646,058 – 267,869 913,9272008 536,627 – 252,680 789,3072009 180,154 – 209,911 390,0652010 185,531 – 209,371 394,9022011 187,653 – 224,400 412,0532012 157,588 – 207,260 364,8482013 157,526 – 163,156 320,6822014 157,681 – 151,676 309,3572015 155,621 203 125,930 281,754
internationalYEaR SChEdulEd ChaRtER COmmutER tOtal
2002 – – – –2003 375 – – 3752004 – – – –2005 6 – – 62006 – 125 19 1442007 – – – –2008 – – – –2009 – – – –2010 – – – –2011 – 1,601 – 1,6012012 – – – –2013 – – – –2014 – – – –2015 – – – –
domestic andinternational
YEaR SChEdulEd ChaRtER COmmutER tOtal
2002 227,834 – – 227,8342003 400,839 – – 400,8392004 510,563 – – 510,5632005 398,220 – – 398,2202006 66,261 2,180 241,480 309,9212007 646,058 – 267,869 913,9272008 536,627 – 252,680 789,3072009 180,154 – 209,911 390,0652010 185,531 – 209,371 394,9022011 187,653 1,601 224,400 413,6542012 157,588 – 207,260 364,8482013 157,526 – 163,156 320,6822014 157,681 – 151,676 309,3572015 155,621 203 125,930 281,754
2.2.1 sWF COmmERCial paSSEngER tRaffiC Annual Totals 2002 to 2015

37
domesticYEaR SChEdulEd ChaRtER COmmutER tOtal
2002 700,666 201,530 – 902,1962003 819,678 182,792 – 1,002,4702004 857,649 192,469 – 1,050,1182005 778,926 201,425 – 980,3512006 732,635 215,701 – 948,3362007 981,282 195,332 – 1,176,6142008 895,986 201,851 – 1,097,8372009 961,181 161,635 – 1,122,8162010 1,260,900 165,899 – 1,426,7992011 1,237,653 157,013 – 1,394,6662012 1,251,613 131,563 – 1,383,1762013 998,998 130,624 – 1,129,6222014 1,087,025 96,452 25,014 1,208,4912015 1,084,585 109,046 – 1,193,631
internationalYEaR SChEdulEd ChaRtER COmmutER tOtal
2002 – – – –2003 – – – –2004 – 54 – 542005 – 126 – 1262006 – – – –2007 – 17 – 172008 – – – –2009 – – – –2010 – – – –2011 – – – –2012 – 2,462 – 2,4622013 – 3,276 – 3,2762014 477 2,699 – 3,1762015 6,090 561 – 6,651
domestic andinternational
YEaR SChEdulEd ChaRtER COmmutER tOtal
2002 700,666 201,530 – 902,1962003 819,678 182,792 – 1,002,4702004 857,649 192,523 – 1,050,1722005 778,926 201,551 – 980,4772006 732,635 215,701 – 948,3362007 981,282 195,349 – 1,176,6312008 895,986 201,851 – 1,097,8372009 961,181 161,635 – 1,122,8162010 1,260,900 165,899 – 1,426,7992011 1,237,653 157,013 – 1,394,6662012 1,251,613 134,025 – 1,385,6382013 998,998 133,900 – 1,132,8982014 1,087,502 99,151 25,014 1,211,6672015 1,090,675 109,607 – 1,200,282
2.2.1 AcY COmmERCial paSSEngER tRaffiC Annual Totals 2002 to 2015

38
domesticYEaR SChEdulEd ChaRtER COmmutER tOtal
2002 51,374,810 255,161 6,819,093 58,449,0642003 53,105,644 323,026 7,628,098 61,056,7682004 58,144,089 270,508 9,460,650 67,875,2472005 60,421,932 251,660 10,928,226 71,601,8182006 62,156,276 251,659 11,955,960 74,363,8952007 64,316,033 242,609 13,119,065 77,677,7072008 59,510,326 227,770 13,516,700 73,254,7962009 55,063,669 199,527 13,956,606 69,219,8022010 55,395,554 199,783 14,297,642 69,892,9792011 56,148,220 200,848 14,492,589 70,841,6572012 57,981,295 173,069 14,921,455 73,075,8192013 58,171,876 164,491 15,693,521 74,029,8882014 59,508,184 225,927 15,724,998 75,459,1092015 64,568,234 141,278 15,950,162 80,659,674
internationalYEaR SChEdulEd ChaRtER COmmutER tOtal
2002 23,016,367 420,607 389,405 23,826,3792003 23,074,824 421,705 518,843 24,015,3722004 26,491,639 310,268 804,424 27,606,3312005 28,584,146 253,703 799,332 29,637,1812006 29,783,650 154,603 1,030,142 30,968,3952007 32,233,170 205,590 1,085,384 33,524,1442008 33,499,724 104,119 1,265,413 34,869,2562009 32,251,271 25,551 1,407,558 33,684,3802010 34,184,064 30,403 1,412,413 35,626,8802011 34,883,816 28,585 1,518,829 36,431,2302012 35,917,848 84,123 1,638,683 37,640,6542013 37,653,882 28,694 1,888,810 39,571,3862014 39,619,769 37,220 2,205,458 41,862,4472015 41,604,187 47,490 1,930,211 43,581,888
domestic andinternational
YEaR SChEdulEd ChaRtER COmmutER tOtal
2002 74,391,177 675,768 7,208,498 82,275,4432003 76,180,468 744,731 8,146,941 85,072,1402004 84,635,728 580,776 10,265,074 95,481,5782005 89,006,078 505,363 11,727,558 101,238,9992006 91,939,926 406,262 12,986,102 105,332,2902007 96,549,203 448,199 14,204,449 111,201,8512008 93,010,050 331,889 14,782,113 108,124,0522009 87,314,940 225,078 15,364,164 102,904,1822010 89,579,618 230,186 15,710,055 105,519,8592011 91,032,036 229,433 16,011,418 107,272,8872012 93,899,143 257,192 16,560,138 110,716,4732013 95,825,758 193,185 17,582,331 113,601,2742014 99,127,953 263,147 17,930,456 117,321,5562015 106,172,421 188,768 17,880,373 124,241,562
2.2.1 COmmERCial paSSEngER tRaffiCreGiOn Annual Totals 2002 to 2015

39
2.2.2 JFK COmmERCial paSSEngER tRaffiC Monthly Totals 2015
domestic tOtal REVEnuE % ChangE nOn-REVEnuEmOnth SChEdulEd ChaRtER COmmutER paSSEngERS 2014 tO 2015 paSSEngERS
Jan 1,740,420 – 150,736 1,891,156 9.1% 78,280Feb 1,666,597 255 139,582 1,806,434 12.9% 58,058Mar 2,025,219 239 183,597 2,209,055 7.7% 69,510Apr 2,046,587 – 206,044 2,252,631 7.6% 79,006May 2,122,602 – 237,271 2,359,873 7.5% 82,461Jun 2,150,681 248 229,770 2,380,699 7.7% 85,796Jul 2,287,825 40 242,286 2,530,151 7.9% 91,646Aug 2,290,840 – 245,131 2,535,971 5.2% 84,430Sep 1,904,616 263 229,589 2,134,468 1.9% 74,843Oct 2,057,289 – 271,009 2,328,298 7.6% 75,082Nov 1,883,777 108 253,491 2,137,376 8.6% 71,522Dec 1,997,194 63 243,484 2,240,741 3.9% 72,564total 2015 24,173,647 1,216 2,631,990 26,806,853 7.1% 923,198% Change2014 to 2015 8.6% -98.6% -1.7% 7.1% -5.3%
international tOtal REVEnuE % ChangE nOn-REVEnuEmOnth SChEdulEd ChaRtER COmmutER paSSEngERS 2014 tO 2015 paSSEngERS
Jan 2,031,241 – 29,726 2,060,967 3.1% 37,601Feb 1,688,794 749 29,031 1,718,574 4.8% 37,010Mar 2,172,327 603 35,101 2,208,031 6.0% 45,598Apr 2,344,857 1,219 35,425 2,381,501 2.8% 50,660May 2,562,110 – 43,701 2,605,811 4.5% 53,780Jun 2,727,326 1,104 44,691 2,773,121 5.5% 55,263Jul 3,068,387 900 48,425 3,117,712 7.9% 60,021Aug 3,224,098 891 48,764 3,273,753 6.8% 60,101Sep 2,604,225 2,958 40,446 2,647,629 8.2% 51,940Oct 2,529,647 3,038 39,083 2,571,768 9.5% 53,088Nov 2,173,406 1,006 30,270 2,204,682 10.7% 49,017Dec 2,414,994 3,937 37,821 2,456,752 7.2% 50,576total 2015 29,541,412 16,405 462,484 30,020,301 6.5% 604,655% Change2014 to 2015 6.6% -37.3% 2.3% 6.5% 4.0%
domestic andinternational
tOtal REVEnuE % ChangE nOn-REVEnuEmOnth SChEdulEd ChaRtER COmmutER paSSEngERS 2014 tO 2015 paSSEngERS
Jan 3,771,661 – 180,462 3,952,123 5.9% 115,881Feb 3,355,391 1,004 168,613 3,525,008 8.8% 95,068Mar 4,197,546 842 218,698 4,417,086 6.8% 115,108Apr 4,391,444 1,219 241,469 4,634,132 5.1% 129,666May 4,684,712 – 280,972 4,965,684 5.9% 136,241Jun 4,878,007 1,352 274,461 5,153,820 6.5% 141,059Jul 5,356,212 940 290,711 5,647,863 7.9% 151,667Aug 5,514,938 891 293,895 5,809,724 6.1% 144,531Sep 4,508,841 3,221 270,035 4,782,097 5.3% 126,783Oct 4,586,936 3,038 310,092 4,900,066 8.6% 128,170Nov 4,057,183 1,114 283,761 4,342,058 9.6% 120,539Dec 4,412,188 4,000 281,305 4,697,493 5.6% 123,140total 2015 53,715,059 17,621 3,094,474 56,827,154 6.8% 1,527,853% Change2014 to 2015 7.5% -84.4% -1.1% 6.8% -1.8%
2.2.2 Commercial passenger traffic, monthly totals 2015, by airport and Region

40
2.2.2 eWr COmmERCial paSSEngER tRaffiC Monthly Totals 2015
domestic tOtal REVEnuE % ChangE nOn-REVEnuEmOnth SChEdulEd ChaRtER COmmutER paSSEngERS 2014 tO 2015 paSSEngERS
Jan 1,337,782 1,487 413,654 1,752,923 2.9% 64,820Feb 1,292,919 1,260 378,106 1,672,285 10.3% 56,507Mar 1,615,475 1,893 483,569 2,100,937 0.8% 72,501Apr 1,667,710 1,950 515,614 2,185,274 13.2% 73,619May 1,669,681 901 535,833 2,206,415 11.7% 72,099Jun 1,682,256 415 539,141 2,221,812 4.4% 83,917Jul 1,789,126 808 575,928 2,365,862 7.6% 86,495Aug 1,752,555 2,573 582,160 2,337,288 4.3% 81,235Sep 1,538,784 2,501 537,008 2,078,293 9.3% 75,393Oct 1,699,745 4,356 590,396 2,294,497 14.8% 78,898Nov 1,652,292 5,655 572,049 2,229,996 13.0% 72,619Dec 1,698,732 4,592 543,607 2,246,931 6.4% 69,203total 2015 19,397,057 28,391 6,267,065 25,692,513 8.1% 887,306% Change2014 to 2015 8.1% -29.0% 8.4% 8.1% -3.8%
international tOtal REVEnuE % ChangE nOn-REVEnuEmOnth SChEdulEd ChaRtER COmmutER paSSEngERS 2014 tO 2015 paSSEngERS
Jan 792,868 222 66,301 859,391 2.0% 20,227Feb 693,224 310 63,391 756,925 7.3% 16,992Mar 894,912 795 70,854 966,561 -0.6% 20,630Apr 928,353 2,880 67,225 998,458 -0.6% 23,315May 946,545 1,530 68,904 1,016,979 -0.5% 21,538Jun 992,077 1,103 65,085 1,058,265 -2.6% 22,274Jul 1,134,127 6,924 65,856 1,206,907 -4.1% 27,343Aug 1,120,758 6,437 66,262 1,193,457 2.0% 26,166Sep 887,818 3,950 66,877 958,645 1.3% 22,293Oct 862,040 1,479 70,596 934,115 -1.5% 20,684Nov 800,398 4,616 61,986 867,000 0.3% 20,613Dec 925,756 152 59,580 985,488 -3.9% 28,103total 2015 10,978,876 30,398 792,917 11,802,191 -0.4% 270,178% Change2014 to 2015 0.2% 275.0% -10.5% -0.4% -16.7%
domestic andinternational
tOtal REVEnuE % ChangE nOn-REVEnuEmOnth SChEdulEd ChaRtER COmmutER paSSEngERS 2014 tO 2015 paSSEngERS
Jan 2,130,650 1,709 479,955 2,612,314 2.6% 85,047Feb 1,986,143 1,570 441,497 2,429,210 9.3% 73,499Mar 2,510,387 2,688 554,423 3,067,498 0.4% 93,131Apr 2,596,063 4,830 582,839 3,183,732 8.5% 96,934May 2,616,226 2,431 604,737 3,223,394 7.5% 93,637Jun 2,674,333 1,518 604,226 3,280,077 2.1% 106,191Jul 2,923,253 7,732 641,784 3,572,769 3.3% 113,838Aug 2,873,313 9,010 648,422 3,530,745 3.5% 107,401Sep 2,426,602 6,451 603,885 3,036,938 6.6% 97,686Oct 2,561,785 5,835 660,992 3,228,612 9.6% 99,582Nov 2,452,690 10,271 634,035 3,096,996 9.1% 93,232Dec 2,624,488 4,744 603,187 3,232,419 3.0% 97,306total 2015 30,375,933 58,789 7,059,982 37,494,704 5.3% 1,157,484% Change2014 to 2015 5.1% 22.3% 5.9% 5.3% -7.2%

41
2.2.2 LGA COmmERCial paSSEngER tRaffiC Monthly Totals 2015
domestic tOtal REVEnuE % ChangE nOn-REVEnuEmOnth SChEdulEd ChaRtER COmmutER paSSEngERS 2014 tO 2015 paSSEngERS
Jan 1,318,466 – 403,235 1,721,701 -1.1% 71,903Feb 1,304,376 – 415,266 1,719,642 9.2% 61,390Mar 1,677,245 – 518,751 2,195,996 3.5% 76,847Apr 1,707,225 168 576,560 2,283,953 4.0% 79,200May 1,754,736 374 600,328 2,355,438 3.0% 68,902Jun 1,752,981 235 604,835 2,358,051 5.4% 143,106Jul 1,823,844 355 670,782 2,494,981 9.6% 90,439Aug 1,822,529 719 670,019 2,493,267 7.0% 80,827Sep 1,595,365 266 597,024 2,192,655 10.6% 74,335Oct 1,711,178 170 670,881 2,382,229 8.9% 70,691Nov 1,597,315 38 613,519 2,210,872 9.4% 65,788Dec 1,692,064 97 583,977 2,276,138 3.3% 63,861total 2015 19,757,324 2,422 6,925,177 26,684,923 6.1% 947,289% Change2014 to 2015 9.4% -16.6% -2.3% 6.1% 0.7%
international tOtal REVEnuE % ChangE nOn-REVEnuEmOnth SChEdulEd ChaRtER COmmutER paSSEngERS 2014 tO 2015 paSSEngERS
Jan 57,167 – 52,934 110,101 -8.4% 1,565Feb 59,886 – 52,082 111,968 1.1% 1,398Mar 74,543 – 60,077 134,620 -6.5% 1,627Apr 81,603 55 67,668 149,326 -1.0% 1,929May 100,730 – 67,187 167,917 3.5% 2,132Jun 104,571 – 71,635 176,206 6.1% 2,089Jul 109,019 – 69,089 178,108 7.9% 2,357Aug 112,288 – 69,753 182,041 -5.0% 2,301Sep 95,199 71 52,505 147,775 -9.6% 1,571Oct 97,822 – 49,833 147,655 -11.9% 1,701Nov 91,021 – 31,662 122,683 -6.9% 1,620Dec 93,960 – 30,385 124,345 -12.0% 1,674total 2015 1,077,809 126 674,810 1,752,745 -3.4% 21,964% Change2014 to 2015 13.8% -48.4% -22.2% -3.4% -18.6%
domestic andinternational
tOtal REVEnuE % ChangE nOn-REVEnuEmOnth SChEdulEd ChaRtER COmmutER paSSEngERS 2014 tO 2015 paSSEngERS
Jan 1,375,633 – 456,169 1,831,802 -1.6% 73,468Feb 1,364,262 – 467,348 1,831,610 8.7% 62,788Mar 1,751,788 – 578,828 2,330,616 2.8% 78,474Apr 1,788,828 223 644,228 2,433,279 3.7% 81,129May 1,855,466 374 667,515 2,523,355 3.1% 71,034Jun 1,857,552 235 676,470 2,534,257 5.5% 145,195Jul 1,932,863 355 739,871 2,673,089 9.5% 92,796Aug 1,934,817 719 739,772 2,675,308 6.1% 83,128Sep 1,690,564 337 649,529 2,340,430 9.1% 75,906Oct 1,809,000 170 720,714 2,529,884 7.4% 72,392Nov 1,688,336 38 645,181 2,333,555 8.4% 67,408Dec 1,786,024 97 614,362 2,400,483 2.4% 65,535total 2015 20,835,133 2,548 7,599,987 28,437,668 5.4% 969,253% Change2014 to 2015 9.6% -19.1% -4.5% 5.4% 0.2%

42
2.2.2 sWF COmmERCial paSSEngER tRaffiC Monthly Totals 2015
domestic tOtal REVEnuE % ChangE nOn-REVEnuEmOnth SChEdulEd ChaRtER COmmutER paSSEngERS 2014 tO 2015 paSSEngERS
Jan 12,850 – 8,102 20,952 -15.1% 175Feb 12,272 – 7,544 19,816 -7.3% 202Mar 14,016 – 8,278 22,294 -14.0% 181Apr 13,068 – 10,916 23,984 -9.9% 260May 13,685 – 12,292 25,977 -10.1% 249Jun 12,097 – 12,070 24,167 -7.7% 814Jul 13,765 – 13,163 26,928 -4.4% 338Aug 13,682 – 13,359 27,041 -4.2% 304Sep 12,087 – 11,691 23,778 -5.8% 209Oct 12,821 – 9,649 22,470 -15.9% 219Nov 12,515 203 9,375 22,093 -5.5% 247Dec 12,763 – 9,491 22,254 -7.3% 238total 2015 155,621 203 125,930 281,754 -8.9% 3,436% Change2014 to 2015 -1.3% -17.0% -8.9% 5.1%
international tOtal REVEnuE % ChangE nOn-REVEnuEmOnth SChEdulEd ChaRtER COmmutER paSSEngERS 2014 tO 2015 paSSEngERS
Jan – – – – – – Feb – – – – – – Mar – – – – – – Apr – – – – – – May – – – – – – Jun – – – – – – Jul – – – – – – Aug – – – – – – Sep – – – – – – Oct – – – – – – Nov – – – – – – Dec – – – – – – total 2015 – – – – – – % Change2014 to 2015 – – – – – –
domestic andinternational
tOtal REVEnuE % ChangE nOn-REVEnuEmOnth SChEdulEd ChaRtER COmmutER paSSEngERS 2014 tO 2015 paSSEngERS
Jan 12,850 – 8,102 20,952 -15.1% 175Feb 12,272 – 7,544 19,816 -7.3% 202Mar 14,016 – 8,278 22,294 -14.0% 181Apr 13,068 – 10,916 23,984 -9.9% 260May 13,685 – 12,292 25,977 -10.1% 249Jun 12,097 – 12,070 24,167 -7.7% 814Jul 13,765 – 13,163 26,928 -4.4% 338Aug 13,682 – 13,359 27,041 -4.2% 304Sep 12,087 – 11,691 23,778 -5.8% 209Oct 12,821 – 9,649 22,470 -15.9% 219Nov 12,515 203 9,375 22,093 -5.5% 247Dec 12,763 – 9,491 22,254 -7.3% 238total 2015 155,621 203 125,930 281,754 -8.9% 3,436% Change2014 to 2015 -1.3% -17.0% -8.9% 5.1%

43
2.2.2 AcY COmmERCial paSSEngER tRaffiC Monthly Totals 2015
domestic tOtal REVEnuE % ChangE nOn-REVEnuEmOnth SChEdulEd ChaRtER COmmutER paSSEngERS 2014 tO 2015 paSSEngERS
Jan 92,266 5,911 – 98,177 6.2% 196Feb 90,236 6,195 – 96,431 6.8% 1,077Mar 108,401 8,092 – 116,493 6.2% 0Apr 97,310 8,229 – 105,539 0.9% 458May 92,245 11,423 – 103,668 -5.8% 852Jun 84,380 11,879 – 96,259 -8.9% 622Jul 96,917 12,320 – 109,237 -6.9% 660Aug 96,739 11,961 – 108,700 -9.5% 814Sep 72,781 9,487 – 82,268 -0.6% 587Oct 71,297 9,604 – 80,901 -4.4% 451Nov 84,785 9,573 – 94,358 -1.9% 148Dec 97,228 4,372 – 101,600 7.2% 424total 2015 1,084,585 109,046 – 1,193,631 -1.2% 6,289% Change2014 to 2015 -0.2% 13.1% – -1.2% 2.8%
international tOtal REVEnuE % ChangE nOn-REVEnuEmOnth SChEdulEd ChaRtER COmmutER paSSEngERS 2014 tO 2015 paSSEngERS
Jan – 90 – 90 – – Feb 65 – – 65 -56.1% – Mar 197 – – 197 -39.9% – Apr 161 – – 161 -49.8% – May 425 – – 425 132.2% – Jun 1,101 – – 1,101 85.4% – Jul 1,894 – – 1,894 449.0% – Aug 1,932 – – 1,932 394.1% – Sep 315 – – 315 -19.2% – Oct – 443 – 443 13.9% – Nov – – – – – – Dec – 28 – 28 -67.8% – total 2015 6,090 561 – 6,651 109.4% – % Change2014 to 2015 1176.7% -79.2% – 109.4% –
domestic andinternational
tOtal REVEnuE % ChangE nOn–REVEnuEmOnth SChEdulEd ChaRtER COmmutER paSSEngERS 2014 tO 2015 paSSEngERS
Jan 92,266 6,001 – 98,267 6.3% 196Feb 90,301 6,195 – 96,496 6.7% 1,077Mar 108,598 8,092 – 116,690 6.1% –Apr 97,471 8,229 – 105,700 0.7% 458May 92,670 11,423 – 104,093 -5.6% 852Jun 85,481 11,879 – 97,360 -8.4% 622Jul 98,811 12,320 – 111,131 -5.6% 660Aug 98,671 11,961 – 110,632 -8.2% 814Sep 73,096 9,487 – 82,583 -0.7% 587Oct 71,297 10,047 – 81,344 -4.3% 451Nov 84,785 9,573 – 94,358 -1.9% 148Dec 97,228 4,400 – 101,628 7.1% 424total 2015 1,090,675 109,607 – 1,200,282 -0.9% 6,289% Change2014 to 2015 0.3% 10.5% – -0.9% -100.0% 2.8%

44
2.2.2 COmmERCial paSSEngER tRaffiCreGiOn Monthly Totals 2015
domestic tOtal REVEnuE % ChangE nOn-REVEnuEmOnth SChEdulEd ChaRtER COmmutER paSSEngERS 2014 tO 2015 paSSEngERS
Jan 4,501,784 7,398 975,727 5,484,909 2.0% 215,374Feb 4,366,400 7,710 940,498 5,314,608 32.0% 177,234Mar 5,440,356 10,224 1,194,195 6,644,775 4.3% 219,039Apr 5,531,900 10,347 1,309,134 6,851,381 15.8% 232,543May 5,652,949 12,698 1,385,724 7,051,371 6.3% 224,563Jun 5,682,395 12,777 1,385,816 7,080,988 1.0% 314,255Jul 6,011,477 13,523 1,502,159 7,527,159 13.8% 269,578Aug 5,976,345 15,253 1,510,669 7,502,267 2.8% 247,610Sep 5,123,633 12,517 1,375,312 6,511,462 15.5% 225,367Oct 5,552,330 14,130 1,541,935 7,108,395 11.1% 225,341Nov 5,230,684 15,577 1,448,434 6,694,695 23.6% 210,324Dec 5,497,981 9,124 1,380,559 6,887,664 13.5% 206,290total 2015 64,568,234 141,278 15,950,162 80,659,674 6.9% 2,767,518% Change2014 to 2015 8.5% -37.5% 1.4% 6.9% -2.8%
international tOtal REVEnuE % ChangE nOn-REVEnuEmOnth SChEdulEd ChaRtER COmmutER paSSEngERS 2014 tO 2015 paSSEngERS
Jan 2,881,276 312 148,961 3,030,549 -3.3% 59,393Feb 2,441,969 1,059 144,504 2,587,532 -42.9% 55,400Mar 3,141,979 1,398 166,032 3,309,409 -41.0% 67,855Apr 3,354,974 4,154 170,318 3,529,446 -48.7% 75,904May 3,609,810 1,530 179,792 3,791,132 139.8% 77,450Jun 3,825,075 2,207 181,411 4,008,693 94.4% 79,626Jul 4,313,427 7,824 183,370 4,504,621 460.6% 89,721Aug 4,459,076 7,328 184,779 4,651,183 397.9% 88,568Sep 3,587,557 6,979 159,828 3,754,364 -19.4% 75,804Oct 3,489,509 4,960 159,512 3,653,981 9.9% 75,473Nov 3,064,825 5,622 123,918 3,194,365 4.0% 71,250Dec 3,434,710 4,117 127,786 3,566,613 -76.5% 80,353total 2015 41,604,187 47,490 1,930,211 43,581,888 4.1% 896,797% Change2014 to 2015 5.0% 27.6% -12.5% 4.1% -3.9%
domestic andinternational
tOtal REVEnuE % ChangE nOn-REVEnuEmOnth SChEdulEd ChaRtER COmmutER paSSEngERS 2014 tO 2015 paSSEngERS
Jan 7,383,060 7,710 1,124,688 8,515,458 3.1% 274,767Feb 6,808,369 8,769 1,085,002 7,902,140 8.9% 232,634Mar 8,582,335 11,622 1,360,227 9,954,184 3.8% 286,894Apr 8,886,874 14,501 1,479,452 10,380,827 5.7% 308,447May 9,262,759 14,228 1,565,516 10,842,503 5.5% 302,013Jun 9,507,470 14,984 1,567,227 11,089,681 4.7% 393,881Jul 10,324,904 21,347 1,685,529 12,031,780 6.7% 359,299Aug 10,435,421 22,581 1,695,448 12,153,450 5.1% 336,178Sep 8,711,190 19,496 1,535,140 10,265,826 6.5% 301,171Oct 9,041,839 19,090 1,701,447 10,762,376 8.4% 300,814Nov 8,295,509 21,199 1,572,352 9,889,060 9.0% 281,574Dec 8,932,691 13,241 1,508,345 10,454,277 4.0% 286,643total 2015 106,172,421 188,768 17,880,373 124,241,562 5.9% 3,664,315% Change2014 to 2015 7.1% -28.3% -0.3% 5.9% -3.1%
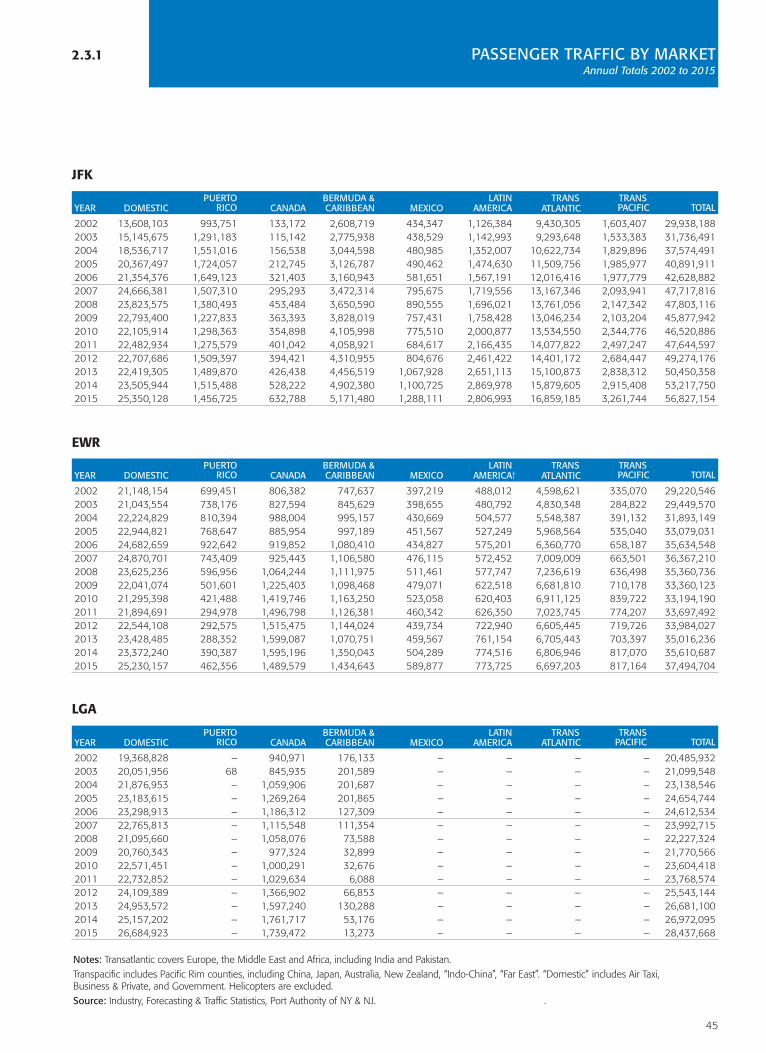
45
2.3.1 paSSEngER tRaffiC BY maRKEt Annual Totals 2002 to 2015
puERtO BERmuda & latin tRanS tRanSYEaR dOmEStiC RiCO Canada CaRiBBEan mEXiCO amERiCa atlantiC paCifiC tOtal
2002 13,608,103 993,751 133,172 2,608,719 434,347 1,126,384 9,430,305 1,603,407 29,938,1882003 15,145,675 1,291,183 115,142 2,775,938 438,529 1,142,993 9,293,648 1,533,383 31,736,4912004 18,536,717 1,551,016 156,538 3,044,598 480,985 1,352,007 10,622,734 1,829,896 37,574,4912005 20,367,497 1,724,057 212,745 3,126,787 490,462 1,474,630 11,509,756 1,985,977 40,891,9112006 21,354,376 1,649,123 321,403 3,160,943 581,651 1,567,191 12,016,416 1,977,779 42,628,8822007 24,666,381 1,507,310 295,293 3,472,314 795,675 1,719,556 13,167,346 2,093,941 47,717,8162008 23,823,575 1,380,493 453,484 3,650,590 890,555 1,696,021 13,761,056 2,147,342 47,803,1162009 22,793,400 1,227,833 363,393 3,828,019 757,431 1,758,428 13,046,234 2,103,204 45,877,9422010 22,105,914 1,298,363 354,898 4,105,998 775,510 2,000,877 13,534,550 2,344,776 46,520,8862011 22,482,934 1,275,579 401,042 4,058,921 684,617 2,166,435 14,077,822 2,497,247 47,644,5972012 22,707,686 1,509,397 394,421 4,310,955 804,676 2,461,422 14,401,172 2,684,447 49,274,1762013 22,419,305 1,489,870 426,438 4,456,519 1,067,928 2,651,113 15,100,873 2,838,312 50,450,3582014 23,505,944 1,515,488 528,222 4,902,380 1,100,725 2,869,978 15,879,605 2,915,408 53,217,7502015 25,350,128 1,456,725 632,788 5,171,480 1,288,111 2,806,993 16,859,185 3,261,744 56,827,154
puERtO BERmuda & latin tRanS tRanSYEaR dOmEStiC RiCO Canada CaRiBBEan mEXiCO amERiCa† atlantiC paCifiC tOtal
2002 21,148,154 699,451 806,382 747,637 397,219 488,012 4,598,621 335,070 29,220,5462003 21,043,554 738,176 827,594 845,629 398,655 480,792 4,830,348 284,822 29,449,5702004 22,224,829 810,394 988,004 995,157 430,669 504,577 5,548,387 391,132 31,893,1492005 22,944,821 768,647 885,954 997,189 451,567 527,249 5,968,564 535,040 33,079,0312006 24,682,659 922,642 919,852 1,080,410 434,827 575,201 6,360,770 658,187 35,634,5482007 24,870,701 743,409 925,443 1,106,580 476,115 572,452 7,009,009 663,501 36,367,2102008 23,625,236 596,956 1,064,244 1,111,975 511,461 577,747 7,236,619 636,498 35,360,7362009 22,041,074 501,601 1,225,403 1,098,468 479,071 622,518 6,681,810 710,178 33,360,1232010 21,295,398 421,488 1,419,746 1,163,250 523,058 620,403 6,911,125 839,722 33,194,1902011 21,894,691 294,978 1,496,798 1,126,381 460,342 626,350 7,023,745 774,207 33,697,4922012 22,544,108 292,575 1,515,475 1,144,024 439,734 722,940 6,605,445 719,726 33,984,0272013 23,428,485 288,352 1,599,087 1,070,751 459,567 761,154 6,705,443 703,397 35,016,2362014 23,372,240 390,387 1,595,196 1,350,043 504,289 774,516 6,806,946 817,070 35,610,6872015 25,230,157 462,356 1,489,579 1,434,643 589,877 773,725 6,697,203 817,164 37,494,704
eWr
JFK
puERtO BERmuda & latin tRanS tRanSYEaR dOmEStiC RiCO Canada CaRiBBEan mEXiCO amERiCa atlantiC paCifiC tOtal
2002 19,368,828 – 940,971 176,133 – – – – 20,485,9322003 20,051,956 68 845,935 201,589 – – – – 21,099,5482004 21,876,953 – 1,059,906 201,687 – – – – 23,138,5462005 23,183,615 – 1,269,264 201,865 – – – – 24,654,7442006 23,298,913 – 1,186,312 127,309 – – – – 24,612,5342007 22,765,813 – 1,115,548 111,354 – – – – 23,992,7152008 21,095,660 – 1,058,076 73,588 – – – – 22,227,3242009 20,760,343 – 977,324 32,899 – – – – 21,770,5662010 22,571,451 – 1,000,291 32,676 – – – – 23,604,4182011 22,732,852 – 1,029,634 6,088 – – – – 23,768,5742012 24,109,389 – 1,366,902 66,853 – – – – 25,543,1442013 24,953,572 – 1,597,240 130,288 – – – – 26,681,1002014 25,157,202 – 1,761,717 53,176 – – – – 26,972,0952015 26,684,923 – 1,739,472 13,273 – – – – 28,437,668
LGA
notes: Transatlantic covers Europe, the Middle East and Africa, including India and Pakistan. Transpacific includes Pacific Rim counties, including China, Japan, Australia, New Zealand, “Indo-China”, “Far East”. “Domestic” includes Air Taxi,
Business & Private, and Government. Helicopters are excluded. Source: Industry, Forecasting & Traffic Statistics, Port Authority of NY & NJ. .
2.3.1 passenger traffic By market, annual totals 2002-2015, by airport and Region

46
2.3.1 paSSEngER tRaffiC BY maRKEtcontinued Annual Totals 2002 to 2015
puERtO BERmuda & latin tRanS tRanSYEaR dOmEStiC RiCO Canada CaRiBBEan mEXiCO amERiCa atlantiC paCifiC tOtal
2002 227,834 – – – – – – – 227,8342003 400,464 – 50 325 – – – – 400,8392004 510,563 – – – – – – – 510,5632005 398,214 – 6 – – – – – 398,2202006 309,777 – 19 – – – 125 – 309,9212007 913,927 – – – – – – – 913,9272008 789,307 – – – – – – – 789,3072009 390,065 – – – – – – – 390,0652010 394,902 – – – – – – – 394,9022011 412,053 – – – 1,601 – – – 413,6542012 364,848 – – – – – – – 364,8482013 320,682 – – – – – – – 320,6822014 309,357 – – – – – – – 309,3572015 281,754 – – – – – – – 281,754
puERtO BERmuda & latin tRanS tRanSYEaR dOmEStiC RiCO Canada CaRiBBEan mEXiCO amERiCa atlantiC paCifiC tOtal
2002 902,196 – – – – – – – 2,706,5882003 1,002,470 – – – – – – – 3,007,4102004 1,050,118 – – 54 – – – – 3,150,4082005 980,351 – – 126 – – – – 2,941,1792006 948,336 – – 0 – – – – 948,3362007 1,176,614 – – 17 – – – – 1,176,6312008 1,097,837 – – – – – – – 1,097,8372009 1,122,816 – – – – – – – 1,122,8162010 1,426,799 – – – – – – – 1,426,7992011 1,394,666 – – – – – – – 1,394,6662012 1,383,176 – – 2,462 – – – – 1,385,6382013 1,129,622 – – 3,276 – – – – 1,132,8982014 1,208,491 – – 3,176 – – – – 1,211,6672015 1,193,631 – 4,692 1,959 – – – – 1,200,282
puERtO BERmuda & latin tRanS tRanSYEaR dOmEStiC RiCO Canada CaRiBBEan mEXiCO amERiCa atlantiC paCifiC tOtal
2002 55,255,115 2,595,398 2,782,721 3,532,489 831,566 1,614,396 14,028,926 1,938,477 82,579,0882003 57,644,119 3,031,897 2,791,191 3,823,481 837,184 1,623,785 14,123,996 1,818,205 85,693,8582004 64,199,180 3,411,528 3,254,566 4,241,496 911,654 1,856,584 16,171,121 2,221,028 96,267,1572005 67,874,498 3,473,055 3,348,320 4,325,967 942,029 2,001,879 17,478,320 2,521,017 101,965,0852006 70,594,061 2,571,765 2,427,586 4,368,662 1,016,478 2,142,392 18,377,311 2,635,966 104,134,2212007 74,393,436 2,250,719 2,336,284 4,690,265 1,271,790 2,292,008 20,176,355 2,757,442 110,168,2992008 70,431,615 1,977,449 2,575,804 4,836,153 1,402,016 2,273,768 20,997,675 2,783,840 107,278,3202009 67,107,698 1,729,434 2,566,120 4,959,386 1,236,502 2,380,946 19,728,044 2,813,382 102,521,5122010 67,794,464 1,719,851 2,774,935 5,301,924 1,298,568 2,621,280 20,445,675 3,184,498 105,141,1952011 68,917,196 1,570,557 2,927,474 5,191,390 1,146,560 2,792,785 21,101,567 3,271,454 106,918,9832012 71,109,207 1,801,972 3,276,798 5,524,294 1,244,410 3,184,362 21,006,617 3,404,173 110,551,8332013 72,251,666 1,778,222 3,622,765 5,660,834 1,527,495 3,412,267 21,806,316 3,541,709 113,601,2742014 73,553,234 1,905,875 3,885,135 6,308,775 1,605,014 3,644,494 22,686,551 3,732,478 117,321,5562015 78,740,593 1,919,081 3,866,531 6,621,355 1,877,988 3,580,718 23,556,388 4,078,908 124,241,562
reGiOn
sWF
AcY
Source: Industry, Forecasting & Traffic Statistics, Port Authority of NY & NJ. .

47
2.4.1 2015 REVEnuE paSSEngER tRaffiC BY aiRlinE Top 20 Carriers
dOmEStiC intERnatiOnal tOtalRanK aiRlinE paSSEngERS paSSEngERS paSSEngERS CumulatiVE %
1 Delta 9,695,685 4,913,008 14,608,693 25.7%2 JetBlue Airways 9,798,664 3,275,838 13,074,502 48.7%3 American 4,134,932 2,541,221 6,676,153 60.5%4 British Airways – 1,397,960 1,397,960 62.9%5 Emirates Airlines – 1,034,533 1,034,533 64.7%6 Virgin America 1,011,996 – 1,011,996 66.5%7 Air France – 962,929 962,929 68.2%8 United 928,358 – 928,358 69.9%9 US Airways 851,106 – 851,106 71.4%
10 Virgin Atlantic – 793,690 793,690 72.7%11 Cathay Pacific – 662,221 662,221 73.9%12 Caribbean Air – 600,861 600,861 75.0%13 Alitalia – 572,748 572,748 76.0%14 Lufthansa – 560,625 560,625 77.0%15 Aeromexico – 534,586 534,586 77.9%16 Turkish Air – 511,562 511,562 78.8%17 TAM Brazilian Airlines – 498,645 498,645 79.7%18 Norwegian Air – 480,815 480,815 80.5%19 Aer Lingus – 476,663 476,663 81.4%20 Korean – 458,384 458,384 82.2%
Others 386,112 9,744,012 10,130,124 100.0%total airports 26,806,853 30,020,301 56,827,154
dOmEStiC intERnatiOnal tOtalRanK aiRlinE paSSEngERS paSSEngERS paSSEngERS CumulatiVE %
1 United 17,926,404 7,725,844 25,652,248 68.4%2 Delta 1,568,519 261,273 1,829,792 73.3%3 JetBlue Airways 1,489,326 92,186 1,581,512 77.5%4 US Airways 1,362,743 1,362,743 1,362,743 81.1%5 Southwest Airlines 1,325,859 1,325,859 1,325,859 84.7%6 American 1,291,967 1,291,967 1,291,967 88.1%7 Lufthansa 7 524,507 524,507 89.5%8 SAS 8 499,677 499,677 90.9%9 Virgin America 488,235 488,235 488,235 92.2%
10 Porter Airlines 10 388,203 388,203 93.2%11 British Airways 11 268,864 268,864 93.9%12 Alaska Airlines 234,299 234,299 234,299 94.5%13 Air Canada 13 219,280 219,280 95.1%14 Air India 14 198,695 198,695 95.7%15 Air Portugal (TAP) 15 188,492 188,492 96.2%16 Cathay Pacific 16 185,820 185,820 96.7%17 Virgin Atlantic 17 175,843 175,843 97.1%18 Jet Airways 18 170,230 170,230 97.6%19 AC Express: Sky Regional 19 151,203 151,203 98.0%20 El Al 20 150,740 150,740 98.4%
Others 5,161 601,334 606,495 100.0%total airports 25,692,513 11,802,191 37,494,704
eWr
JFK
Source: Industry, Forecasting & Traffic Statistics, Port Authority of NY & NJ. .
2.4.1 passenger traffic By airline, top 20 Carriers, 2015 passengers, by airport and Region

48
2.4.1 2015 REVEnuE paSSEngER tRaffiC BY aiRlinEcontinued Top Carriers
dOmEStiC intERnatiOnal tOtalRanK aiRlinE paSSEngERS paSSEngERS paSSEngERS CumulatiVE %
1 Delta 10,757,782 168,428 10,926,210 38.4%2 American 4,729,206 173,431 4,902,637 55.7%3 US Airways 2,780,551 – 2,780,551 65.4%4 Southwest Airlines 2,655,464 – 2,655,464 74.8%5 United 2,394,169 – 2,394,169 83.2%6 JetBlue Airways 1,595,352 – 1,595,352 88.8%7 Spirit Airlines 1,244,766 – 1,244,766 93.2%8 Air Canada – 1,021,648 1,021,648 96.8%9 WestJet – 389,075 389,075 98.1%
10 Frontier Airlines 267,869 – 267,869 99.1%11 Virgin America 259,079 – 259,079 100.0%12 Miami Air Intern'l 685 163 848 100.0%
total airports 26,684,923 1,752,745 28,437,668
dOmEStiC intERnatiOnal tOtalRanK aiRlinE paSSEngERS paSSEngERS paSSEngERS CumulatiVE %
1 JetBlue Airways 125,209 – 125,209 44.4%2 Delta 68,485 – 68,485 68.7%3 US Airways 57,445 – 57,445 89.1%4 Allegiant Air 30,615 – 30,615 100.0%
total airports 281,754 – 281,754
dOmEStiC intERnatiOnal tOtalRanK aiRlinE paSSEngERS paSSEngERS paSSEngERS CumulatiVE %
1 Spirit Airlines 1,084,585 – 1,084,585 90.4%2 Charter Service 109,046 – 109,046 99.4%3 Air Canada – 4,692 4,692 99.8%4 Charter Service – 1,959 1,959 100.0%
total airports 1,193,631 6,651 1,200,282
LGA
sWF
AcY

49
2.4.1 2015 REVEnuE paSSEngER tRaffiC BY aiRlinEcontinued Top 20 Carriers
dOmEStiC intERnatiOnal tOtalRanK aiRlinE paSSEngERS paSSEngERS paSSEngERS CumulatiVE %
1 United 21,249,299 7,725,844 28,975,143 23.3%2 Delta 22,090,471 5,342,709 27,433,180 45.4%3 JetBlue Airways 13,008,551 3,368,024 16,376,575 58.6%4 American 10,156,105 2,714,652 12,870,757 68.9%5 US Airways 5,051,845 – 5,051,845 73.0%6 Southwest Airlines 3,981,323 – 3,981,323 76.2%7 Spirit Airlines 2,329,351 – 2,329,351 78.1%8 Virgin America 1,759,310 – 1,759,310 79.5%9 British Airways – 1,666,824 1,666,824 80.8%
10 Air Canada – 1,579,860 1,579,860 82.1%11 Lufthansa – 1,085,132 1,085,132 83.0%12 Emirates Airlines – 1,034,533 1,034,533 83.8%13 Virgin Atlantic – 969,533 969,533 84.6%14 Air France – 962,929 962,929 85.4%15 Cathay Pacific – 848,041 848,041 86.1%16 Caribbean Air – 600,861 600,861 86.5%17 El Al – 589,410 589,410 87.0%18 Alitalia – 572,748 572,748 87.5%19 Aeromexico – 534,586 534,586 87.9%20 Turkish Air – 511,562 511,562 88.3%
Others 1,033,419 13,474,640 14,508,059 100.0%total airport 80,659,674 43,581,888 124,241,562
reGiOn
Source: Industry, Forecasting & Traffic Statistics, Port Authority of NY & NJ.

50
2.5.1 paSSEngER tRaffiC BY tERminal Annual Totals 2015
dOmEStiC intERnatiOnaltERminal Building inBOund OutBOund inBOund OutBOund tOtal
Terminal 1 – – 3,355,103 3,354,059 6,709,508Terminal 2 1,388,643 1,112,616 52,795 60,529 2,614,583Terminal 4 4,006,213 4,392,270 6,226,479 5,749,158 20,374,120Terminal 5 4,992,232 4,968,207 1,552,999 1,866,732 13,380,170Terminal 7 465,161 463,197 1,721,616 1,674,837 4,324,811Terminal 8 2,532,003 2,486,206 2,219,521 2,186,016 9,423,746Terminal Location Varies 57 48 284 173 562total 13,384,482 13,422,717 15,128,797 14,891,504 56,827,154
dOmEStiC intERnatiOnaltERminal Building inBOund OutBOund inBOund OutBOund tOtal
Terminal A 4,674,805 4,663,822 456,216 492,863 10,287,706Terminal B 791,676 782,498 3,023,549 1,746,748 6,344,471Terminal C 7,363,927 7,415,785 2,394,858 3,687,957 20,862,527total 12,830,408 12,862,105 5,874,623 5,927,568 37,494,704
dOmEStiC intERnatiOnaltERminal Building inBOund OutBOund inBOund OutBOund tOtal
Central Terminal (B) 6,582,407 6,564,183 594,295 600,947 14,341,832Delta Terminal (D) 2,089,253 2,102,538 15,645 15,339 4,222,775Marine Terminal (A) 320,083 321,707 1,214 1,145 644,149US Airways Terminal (C) 4,341,020 4,363,732 255,967 268,193 9,228,912total 13,332,763 13,352,160 867,121 885,624 28,437,668
dOmEStiC intERnatiOnaltERminal Building inBOund OutBOund inBOund OutBOund tOtal
Airline Terminal 597,980 595,651 3,417 3,234 1,200,282total 597,980 595,651 3,417 3,234 1,200,282
dOmEStiC intERnatiOnaltERminal Building inBOund OutBOund inBOund OutBOund tOtal
Airline Terminal 141,098 140,656 – – 281,754total 141,098 140,656 – – 281,754
eWr
JFK*
LGA†
AcY
sWF
note: It is difficult to accurately reflect traffic at passenger terminals with airline tenants whose service to a market group is split between two terminals. This applies primarily to JFK’s Delta Terminals 2 & 3 and Terminal 4.
* JFK: Terminal 3 closed May 2013.† LGA: Delta operates in Terminals A & D and primary in Terminal C. Source: Forecasting, & Traffic Statistics, Port Authority of NY & NJ.
2.5.1 passenger traffic By terminal, 2015 passengers, domestic and international by airport

51
2.6.1 paSSEngER dEmOgRaphiCS Profile of Departing Passengers
nYC YEaR JfK lga EWR SWf REgiOn aiRpORtS
unweighted Base Size 3,214 1,543 1,493 – 6,250 4,757
passenger typeDeparting 67.3% 86.8% 60.0% – 69.6% 73.7%Connecting 32.7% 13.2% 40.0% – 30.4% 26.3% Connecting From Domestic Flight 15.3% 6.2% 17.5% – 13.9% 12.3% Connecting From International Flight 17.4% 7.0% 22.5% – 16.5% 14.0%
type of flightDomestic 47.1% 91.6% 66.2% – 63.1% 61.8%International 52.9% 8.4% 33.8% – 36.9% 38.2%
first trip through this terminal 54.7% 49.0% 46.7% – 51.0% 52.8%first trip through this airport 29.8% 33.3% 29.6% – 30.6% 31.0%
trip Origin – O&d passengersHome 35.3% 25.8% 37.7% – 33.2% 31.6%Hotel 31.5% 44.3% 24.8% – 33.5% 36.5%Staying with Friends/Relatives 22.8% 19.7% 20.7% – 21.3% 21.6%Work 4.3% 7.3% 12.3% – 7.2% 5.4%School 1.9% 0.6% 0.9% – 1.3% 1.4%Another Airport 2.7% 1.7% 1.3% – 2.0% 2.3%Cruise Ship 0.5% 0.2% 0.7% – 0.5% 0.4%Other 1.0% 0.4% 1.5% – 0.9% 0.7%
trip Origin location – O&d passengersnew York 83.7% 92.4% 36.9% – 74.5% 87.1%nYC 72.4% 84.1% 31.1% – 65.5% 77.0%manhattan 43.9% 59.6% 22.8% – 43.2% 50.1%Manhattan - below 14th St. 6.4% 7.5% 3.8% – 6.1% 6.9%Manhattan - 14th - 96th St. 31.9% 45.9% 17.1% – 32.3% 37.4%Manhattan - above 96th St. 5.5% 6.2% 1.9% – 4.8% 5.8%Manhattan (Unspecified) 0.1% – – – – –Bronx 4.8% 4.4% 0.9% – 3.7% 4.6%Brooklyn 10.4% 7.8% 4.1% – 8.1% 9.4%Queens 11.9% 12.2% 1.9% – 9.5% 12.0%Staten Island 1.4% 0.2% 1.3% – 1.0% 0.9%Westchester 2.1% 2.4% 1.1% – 2.0% 2.2%Nassau 2.8% 1.7% – – 1.8% 2.3%Suffolk 2.6% 1.8% 0.4% – 1.8% 2.3%Rockland 0.3% 0.5% 0.8% – 0.5% 0.4%Albany 0.5% 0.1% 0.8% – 0.5% 0.4%Orange 0.4% – 0.9% – 0.4% 0.3%Dutchess 0.3% 0.5% 0.1% – 0.3% 0.4%Tompkins 0.3% – 0.3% – 0.2% 0.2%Ulster 0.1% 0.2% 0.3% – 0.2% 0.2%Broome 0.2% 0.2% 0.2% – 0.2% 0.2%Saratoga 0.2% 0.1% – – 0.1% 0.1%Onondaga 0.1% 0.1% – – 0.1% 0.1%Chemung – 0.1% – – 0.1% 0.1%Columbia – – 0.2% – 0.1% –Oneida 0.1% – – – 0.1% 0.1%Sullivan – – 0.2% – – –Montgomery 0.1% – – – – –Cattaraugus – 0.2% – – – 0.1%Allegany 0.1% – – – – 0.1%Wyoming 0.1% – – – – 0.1%Other Upstate NY 1.0% 0.4% 0.4% – 0.7% 0.8% Source: PANYNJ Spring 2015 Terminal By Terminal Customer Satisfaction Study.SWF data not available.
2.6.1 passenger demographics, profile of departing passengers, by airport and Region

52
nYC YEaR JfK lga EWR SWf REgiOn aiRpORtS
trip Origin location – O&d passengersnew Jersey 6.4% 3.2% 54.0% – 17.4% 5.2%Middlesex 0.7% 0.2% 8.5% – 2.5% 0.5%Bergen 1.5% 0.7% 8.5% – 3.0% 1.2%Essex 0.5% 0.5% 8.0% – 2.4% 0.5%Morris 0.3% 0.2% 5.0% – 1.4% 0.2%Hudson 1.1% 1.0% 4.5% – 1.9% 1.0%Monmouth 0.3% – 3.3% – 1.0% 0.2%Mercer 0.2% – 2.9% – 0.8% 0.1%Passaic 0.2% – 2.7% – 0.7% 0.1%Somerset 0.2% 0.1% 2.6% – 0.8% 0.1%Union 0.1% 0.1% 2.3% – 0.7% 0.1%Ocean 0.1% – 1.5% – 0.4% –Hunterdon – – 0.8% – 0.2% –Sussex 0.1% 0.1% 0.8% – 0.3% 0.1%Burlington 0.3% 0.3% 0.7% – 0.4% 0.3%Warren 0.2% – 0.6% – 0.2% 0.1%Gloucester 0.1% – 0.3% – 0.1% –Camden – 0.1% 0.3% – 0.1% –Salem 0.1% – 0.3% – 0.1% –Other NJ 0.6% – 0.2% – 0.3% 0.4%pennsylvania 3.0% 0.2% 5.8% – 2.9% 1.9%Union 0.4% – 1.2% – 0.5% 0.2%Bucks – – 1.0% – 0.3% –Philadelphia 1.1% 0.1% 0.9% – 0.7% 0.7%Northampton – – 0.5% – 0.1% –Berks 0.1% – 0.3% – 0.1% 0.1%Monroe 0.1% – 0.3% – 0.1% 0.1%Schuylkill – – 0.2% – 0.1% –Armstrong 0.1% – 0.2% – 0.1% 0.1%Juniata – – 0.2% – 0.1% –Luzerne 0.1% – 0.2% – 0.1% 0.1%Lancaster 0.1% – 0.1% – 0.1% –Lackawanna 0.1% – 0.1% – 0.1% –Lehigh 0.1% – 0.1% – 0.1% 0.1%Montgomery 0.1% – 0.1% – 0.1% 0.1%Beaver – – 0.1% – – –Other PA 0.7% 0.1% 0.3% – 0.4% 0.5%Connecticut 5.1% 3.5% 1.2% – 3.6% 4.5%Fairfield 2.7% 2.4% 0.8% – 2.1% 2.6%New Haven 1.5% 0.8% 0.1% – 0.9% 1.2%Hartford 0.7% – 0.1% – 0.3% 0.4%Litchfield – 0.2% 0.1% – 0.1% 0.1%Middlesex 0.1% 0.1% 0.1% – 0.1% 0.1%Other CT 0.1% – 0.1% – 0.1% 0.1%Other U.S. 1.7% 0.7% 2.2% – 1.5% 1.3%
Source: PANYNJ Spring 2015 Terminal By Terminal Customer Satisfaction Study.SWF data not available.
2.6.1 paSSEngER dEmOgRaphiCS continued Profile of Departing Passengers

53
2.6.1 paSSEngER dEmOgRaphiCS continued Profile of Departing Passengers
nYC YEaR JfK lga EWR SWf REgiOn aiRpORtS
trip purpose - all passengersLeisure/Vacation/Visiting 72.5% 68.0% 60.6% – 68.0% 71.0%Business 11.9% 20.5% 23.8% – 17.4% 14.7%Both Business/Non-Business 5.6% 5.1% 5.7% – 5.5% 5.4%School-related 5.0% 2.4% 3.6% – 4.0% 4.1%Illness/Bereavement 1.1% 1.4% 1.4% – 1.2% 1.2%Moving/Relocation 2.3% 1.3% 3.0% – 2.2% 1.9%Other 1.7% 1.3% 1.9% – 1.7% 1.6%leisure/personal Only (net) 82.5% 74.4% 70.5% – 77.1% 79.8%any Business (net) 17.5% 25.6% 29.5% – 22.9% 20.2%
avg. number of nights Stayed locally – Visitors 8.7 5.1 8.1 – 7.4 7.2avg. number of nights away – O&d Residents 19.6 6.6 13.8 – 14.9 15.4
Check-in location - O&d passengersMain check-in counter 48.0% 18.0% 29.7% – 34.7% 36.4%Self check-in kiosk 19.1% 27.2% 38.3% – 26.3% 22.2%Printed boarding pass before coming to airport 14.9% 11.3% 12.2% – 13.1% 13.5%Downloaded boarding pass on web-enabled cell phone 11.7% 33.2% 15.8% – 19.0% 20.0%Curbside 6.4% 10.3% 4.1% – 6.9% 7.9%
avg. dwell time: local O&d (in mins.) 120 101 121 – 115 112avg. post Security dwell time O&d (in mins.) 87 81 92 – 87 85avg. layover for Connectors (in mins.) 195 122 187 – 185 183
food-Beverage purchaseBought food/Beverage 61.4% 61.1% 64.6% – 62.3% 61.3%Pre-security 7.0% 7.9% 9.3% – 7.9% 7.3%Post security 56.3% 54.3% 57.6% – 56.2% 55.6%
Retail purchase SpendAvg. $ Spent $63.07 $20.49 $57.88 – $55.14 $54.01Unweighted Base Size 510 117 201 – 828 627
avg. number of Bags Checked 2.5 2.0 2.1 – 2.3 2.4avg. travel party Size 3.1 2.7 2.3 – 2.8 2.9Kids under 18 in party 14.1% 11.9% 9.7% – 12.3% 13.4%accompanied By Wellwisher 11.5% 3.2% 7.8% – 8.5% 8.8%
had Smartphone in terminal 87.4% 94.4% 89.1% – 89.5% 89.8%used Social media in terminal 42.8% 38.7% 29.5% – 37.9% 41.5%used mobile app in terminal 13.0% 16.5% 17.2% – 15.1% 14.2%
Visited Restroom 68.5% 65.1% 69.8% – 68.1% 67.4%
Requested Special assistance 5.4% 3.2% 5.9% – 5.0% 4.6%Wheelchair 3.8% 1.9% 3.6% – 3.3% 3.1%Motorized Golf Cart 1.0% 0.4% 1.4% – 1.0% 0.8%
avg. number past 12 mos. Round trips through lga 0.5 2.5 0.5 – 1.0 1.2avg. number past 12 mos. Round trips through JfK 1.9 0.8 0.4 – 1.2 1.6avg. number past 12 mos. Round trips through EWR 0.2 0.3 2.4 – 0.9 0.2avg. number past 12 mos. Round trips through SWf – – – – – – Source: PANYNJ Spring 2015 Terminal By Terminal Customer Satisfaction Study.SWF data not available.

54
2.6.1 paSSEngER dEmOgRaphiCS continued Profile of Departing Passengers
nYC YEaR JfK lga EWR SWf REgiOn aiRpORtS
primary Residence united States 63.2% 89.8% 73.7% – 72.5% 72.0%
new York 19.3% 22.9% 8.5% – 17.0% 20.5%nYC 13.1% 16.8% 4.7% – 11.5% 14.3%manhattan 4.9% 6.2% 2.1% – 4.4% 5.4%Manhattan – below 14th St. 0.8% 0.8% 0.4% – 0.7% 0.8%Manhattan – 14th - 96th St. 2.6% 3.6% 1.4% – 2.5% 2.9%Manhattan – above 96th St. 1.5% 1.8% 0.3% – 1.2% 1.6%Bronx 1.9% 2.5% 0.4% – 1.6% 2.1%Brooklyn 3.2% 3.7% 1.2% – 2.7% 3.3%Queens 3.0% 4.2% 0.5% – 2.5% 3.4%Staten Island 0.2% 0.1% 0.6% – 0.3% 0.1%Suffolk 1.4% 1.3% 0.1% – 1.0% 1.4%Westchester 1.0% 1.3% 0.3% – 0.9% 1.1%Nassau 1.2% 0.8% – – 0.7% 1.0%Erie 0.4% 0.8% 0.1% – 0.4% 0.5%Rockland 0.3% 0.3% 0.3% – 0.3% 0.3%Broome 0.1% 0.1% 0.6% – 0.3% 0.1%Monroe 0.3% 0.3% – – 0.2% 0.3%Albany 0.2% – 0.4% – 0.2% 0.2%Tompkins – 0.1% 0.7% – 0.2% –Orange 0.2% 0.1% 0.3% – 0.2% 0.2%Onondaga 0.1% 0.2% 0.1% – 0.1% 0.2%Ulster 0.1% 0.1% 0.2% – 0.1% 0.1%Dutchess 0.1% 0.1% 0.1% – 0.1% 0.1%Saratoga – 0.2% – – 0.1% 0.1%Allegany 0.1% 0.1% – – 0.1% 0.1%Schenectady – – 0.1% – 0.1% –Genesee – 0.2% – – 0.1% 0.1%Jefferson – – 0.1% – – –Other NY 0.4% 0.3% 0.5% – 0.4% 0.4% Source: PANYNJ Spring 2015 Terminal By Terminal Customer Satisfaction Study.SWF data not available.

55
2.6.1 paSSEngER dEmOgRaphiCS continued Profile of Departing Passengers
nYC YEaR JfK lga EWR SWf REgiOn aiRpORtS
primary Residencenew Jersey 2.3% 1.1% 16.7% – 6.3% 1.9%Middlesex 0.2% – 2.8% – 0.9% 0.1%Bergen 0.6% 0.2% 2.8% – 1.2% 0.5%Essex 0.2% – 1.7% – 0.6% 0.1%Hudson 0.4% 0.5% 1.6% – 0.8% 0.4%Morris 0.1% – 1.4% – 0.5% 0.1%Passaic 0.1% – 1.1% – 0.4% –Monmouth 0.2% – 1.0% – 0.4% 0.1%Union 0.1% – 0.9% – 0.3% 0.1%Somerset 0.1% – 0.9% – 0.3% 0.1%Mercer – – 0.6% – 0.2% –Ocean – – 0.6% – 0.2% –Hunterdon – – 0.5% – 0.2% –Sussex – 0.1% 0.3% – 0.1% –Burlington 0.1% 0.1% 0.3% – 0.2% 0.1%Gloucester – – 0.2% – 0.1% –Warren – – 0.1% – – –Atlantic – – – – – –Camden – – – – – –Other NJ – – – – – –
Connecticut 3.4% 2.7% 0.7% – 2.5% 3.1%Fairfield 1.3% 1.4% 0.3% – 1.0% 1.4%New Haven 0.5% 0.5% – – 0.4% 0.5%Hartford 0.3% 0.3% – – 0.2% 0.3%Other CT 0.2% 0.3% 0.3% – 0.3% 0.2%
pennsylvania 2.2% 1.7% 2.1% – 2.0% 2.0%Philadelphia 0.4% 0.1% 0.6% – 0.4% 0.3%Bucks – – 0.3% – 0.1% –Northampton – – 0.2% – 0.1% –Monroe 0.1% – 0.2% – 0.1% –Chester 0.1% – 0.1% – 0.1% 0.1%Lancaster 0.1% – 0.1% – 0.1% –Montgomery 0.1% – 0.1% – 0.1% –Other PA 1.5% 1.6% 0.5% – 1.2% 1.5%Other US 36.9% 61.6% 45.8% – 45.3% 45.2%Outside U.S. 36.8% 10.2% 26.3% – 27.5% 28.0%
primary Residence Outside uSOther North America 2.0% 4.6% 3.8% – 3.1% 2.9%Caribbean 3.5% – 0.2% – 1.7% 2.3%Central America 0.9% 0.3% 0.6% – 0.7% 0.7%South America 3.6% 1.4% 1.3% – 2.4% 2.9%Europe 16.4% 1.6% 14.8% – 12.5% 11.5%Middle East 1.1% – 0.5% – 0.7% 0.8%Africa 0.6% – 0.2% – 0.3% 0.4%Asia 6.3% 1.4% 3.7% – 4.4% 4.7%Oceania 1.8% 0.2% 0.9% – 1.2% 1.3% Source: PANYNJ Spring 2015 Terminal By Terminal Customer Satisfaction Study.SWF data not available.
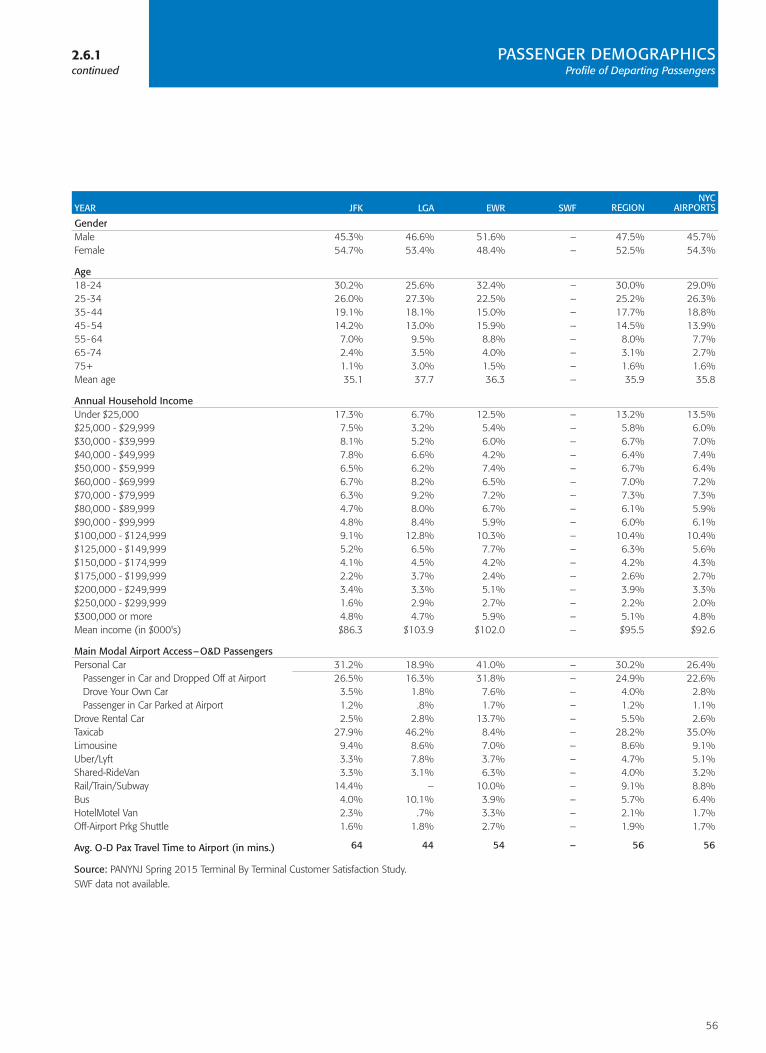
56
nYC YEaR JfK lga EWR SWf REgiOn aiRpORtS
genderMale 45.3% 46.6% 51.6% – 47.5% 45.7%Female 54.7% 53.4% 48.4% – 52.5% 54.3%
age18-24 30.2% 25.6% 32.4% – 30.0% 29.0%25-34 26.0% 27.3% 22.5% – 25.2% 26.3%35-44 19.1% 18.1% 15.0% – 17.7% 18.8%45-54 14.2% 13.0% 15.9% – 14.5% 13.9%55-64 7.0% 9.5% 8.8% – 8.0% 7.7%65-74 2.4% 3.5% 4.0% – 3.1% 2.7%75+ 1.1% 3.0% 1.5% – 1.6% 1.6%Mean age 35.1 37.7 36.3 – 35.9 35.8
annual household incomeUnder $25,000 17.3% 6.7% 12.5% – 13.2% 13.5%$25,000 - $29,999 7.5% 3.2% 5.4% – 5.8% 6.0%$30,000 - $39,999 8.1% 5.2% 6.0% – 6.7% 7.0%$40,000 - $49,999 7.8% 6.6% 4.2% – 6.4% 7.4%$50,000 - $59,999 6.5% 6.2% 7.4% – 6.7% 6.4%$60,000 - $69,999 6.7% 8.2% 6.5% – 7.0% 7.2%$70,000 - $79,999 6.3% 9.2% 7.2% – 7.3% 7.3%$80,000 - $89,999 4.7% 8.0% 6.7% – 6.1% 5.9%$90,000 - $99,999 4.8% 8.4% 5.9% – 6.0% 6.1%$100,000 - $124,999 9.1% 12.8% 10.3% – 10.4% 10.4%$125,000 - $149,999 5.2% 6.5% 7.7% – 6.3% 5.6%$150,000 - $174,999 4.1% 4.5% 4.2% – 4.2% 4.3%$175,000 - $199,999 2.2% 3.7% 2.4% – 2.6% 2.7%$200,000 - $249,999 3.4% 3.3% 5.1% – 3.9% 3.3%$250,000 - $299,999 1.6% 2.9% 2.7% – 2.2% 2.0%$300,000 or more 4.8% 4.7% 5.9% – 5.1% 4.8%Mean income (in $000's) $86.3 $103.9 $102.0 – $95.5 $92.6
main modal airport access–O&d passengersPersonal Car 31.2% 18.9% 41.0% – 30.2% 26.4% Passenger in Car and Dropped Off at Airport 26.5% 16.3% 31.8% – 24.9% 22.6% Drove Your Own Car 3.5% 1.8% 7.6% – 4.0% 2.8% Passenger in Car Parked at Airport 1.2% .8% 1.7% – 1.2% 1.1%Drove Rental Car 2.5% 2.8% 13.7% – 5.5% 2.6%Taxicab 27.9% 46.2% 8.4% – 28.2% 35.0%Limousine 9.4% 8.6% 7.0% – 8.6% 9.1%Uber/Lyft 3.3% 7.8% 3.7% – 4.7% 5.1%Shared-RideVan 3.3% 3.1% 6.3% – 4.0% 3.2%Rail/Train/Subway 14.4% – 10.0% – 9.1% 8.8%Bus 4.0% 10.1% 3.9% – 5.7% 6.4%HotelMotel Van 2.3% .7% 3.3% – 2.1% 1.7%Off-Airport Prkg Shuttle 1.6% 1.8% 2.7% – 1.9% 1.7%
avg. O-d pax travel time to airport (in mins.) 64 44 54 – 56 56
2.6.1 paSSEngER dEmOgRaphiCS continued Profile of Departing Passengers
Source: PANYNJ Spring 2015 Terminal By Terminal Customer Satisfaction Study. SWF data not available.

cArGO trAnsPOrt
Top 50 Domestic Airport Comparisons
Top 50 Worldwide Airport Comparisons
Revenue Freight in Short Tons
Revenue Freight by Airline
Revenue Mail in Short Tons
- - CaRgO tRanSpORt SECtiOn

57
3.1.1 tOp 50 dOmEStiC aiRpORt COmpaRiSOnS Revenue Freight plus Mail (in Short Tons), Ranked by Freight
2015RanK aiRpORt CaRgO (ShORt tOnS) % ChangE 2014-15
1 Memphis International Airport 4,290,638 0.752 Ted Stevens Anchorage International Airport 2,624,312 5.283 Louisville International Airport 2,350,656 2.54 Miami International Airport 2,005,175 0.325 Los Angeles International Airport 1,938,624 6.476 O'Hare International Airport 1,844,336 10.397 John F. Kennedy International Airport 1,286,484 -0.858 Indianapolis International Airport 992,321 -0.689 Cincinnati/Northern Kentucky International Airport 729,309 11.4710 Newark Liberty International Airport 683,760 7.1811 Dallas/Ft Worth International Airport 669,232 5.5212 Hartsfield-Jackson Atlanta International Airport 626,202 4.1513 Oakland International Airport 536,765 0.2614 LA/Ontario International Airport 463,463 7.4415 San Francisco International Airport 459,467 14.6916 George Bush Intercontinental Airport 429,785 -6.9417 Philadelphia International Airport 427,645 -1.1818 Seattle-Tacoma International Airport 334,241 3.7319 Sky Harbor International Airport 283,465 -0.120 Logan International Airport 274,983 -0.221 Washington Dulles International Airport 262,158 -2.4422 Denver International Airport 247,522 5.0723 Portland International Airport 216,187 4.0424 Minneapolis/St Paul International Airport 199,340 0.5425 Detroit Metropolitan Wayne County Airport 193,451 -4.2526 Orlando International Airport 188,013 8.7527 Salt Lake City International Airport 170,684 5.4728 San Diego International Airport 162,281 3.9329 Charlotte Douglas International Airport 134,024 2.0930 Fort Worth Alliance Airport 118,761 7.6531 Chicago Rockford International Airport 118,158 3.1632 Baltimore/Washington International Thurgood Marshall Airport 116,662 10.9533 Bradley International Airport 107,248 1.8134 San Antonio International Airport 105,546 -0.2835 McCarran International Airport 99,077 0.4236 Kansas City International Airport 95,197 1.3837 Tampa International Airport 92,184 8.4838 Rickenbacker International Airport 90,066 25.6239 El Paso International Airport 82,351 5.4840 Huntsville International Airport 81,713 -5.7941 Pittsburgh International Airport 77,500 2.4442 Raleigh-Durham International Airport 76,094 -0.1443 Ft Lauderdale-Hollywood International Airport 74,912 -3.9244 Cleveland Hopkins International Airport 72,486 1.0945 Austin-Bergstrom International Airport 71,421 1.3246 Piedmont Triad International Airport 68,977 -7.1447 General Mitchell International Airport 68,227 2.0948 Jacksonville International Airport 65,809 1.7549 Des Moines International Airport 64,242 2.0350 Sacramento International Airport 64,064 0.52
Source: Airports Council International - Worldwide Airport Traffic Report - Calendar Year 2015.
3.1.1 top 50 airport Comparisons
Revenue Cargo in Short tons, top 50 domestic (aCi) – 2015

58
3.1.2 tOp 50 WORldWidE aiRpORt COmpaRiSOnS Revenue Freight plus Mail (in Short Tons), Ranked by Freight
2015RanK aiRpORt CaRgO (ShORt tOnS) % ChangE 2014-15
1 Hong Kong International Airport 4,460,065 0.382 Memphis International Airport 4,290,638 0.753 Pudong International Airport 3,273,732 2.94 Ted Stevens Anchorage International Airport 2,624,312 5.285 Incheon International Airport 2,595,678 1.496 Dubai International Airport 2,506,092 3.47 Louisville International Airport 2,350,656 2.58 Narita International Airport 2,122,314 -0.599 Aéroport de Paris-Charles de Gaulle 2,090,795 0.2110 Flughafen Frankfurt/Main 2,076,734 -2.611 Taiwan Taoyuan International Airport 2,021,865 -3.212 Miami International Airport 2,005,175 0.3213 Los Angeles International Airport 1,938,624 6.4714 Beijing Capital International Airport 1,889,829 2.2515 Singapore Changi Airport 1,887,000 0.3716 O'Hare International Airport 1,844,336 10.3917 Amsterdam Airport 1,655,354 -0.9218 Heathrow Airport 1,591,637 0.1919 Guangzhou Bai Yun International Airport 1,537,759 5.7620 Doha International Airport 1,454,952 4621 John F. Kennedy International Airport 1,286,484 -0.8522 Suvarnabhumi International Airport 1,230,563 -0.0723 Tokyo International (Haneda) Airport 1,173,961 6.924 Shenzhen Baoan International Airport 1,013,691 5.1725 Indianapolis International Airport 992,321 -0.6826 Flughafen Leipzig/Halle 984,389 8.5927 Dubai World Central Al Maktoum International Airport 890,912 828 Abu Dhabi International Airport 837,551 3.9129 Indira Gandhi International Airport 772,362 11.5430 Atatürk International Airport 771,240 2.4831 Kuala Lumpur International Airport 761,498 -3.3432 Kansai International Airport 745,606 -0.0433 Köln-Bonn Airport 742,625 0.4334 Luxembourg-Findel International Airport 736,996 4.1835 Cincinnati/Northern Kentucky International Airport 729,309 11.4736 Chhatrapati Shivaji International Airport 712,379 1.5637 Newark Liberty International Airport 683,760 7.1838 Dallas/Ft Worth International Airport 669,232 5.5239 Aeropuerto Internacional El Dorado 667,543 4.9740 Liège Airport 651,001 10.1241 Hartsfield-Jackson Atlanta International Airport 626,202 4.1542 Ninoy Aquino International Airport 575,967 11.5343 Soekarno-Hatta International Airport 557,188 -9.2244 Chengdu Shuangliu International Airport 556,666 1.6345 Oakland International Airport 536,765 0.2646 Guarulhos International Airport 526,012 -5.1747 Milano Malpensa 511,190 8.8448 Brussels National Airport 475,680 8.2249 LA/Ontario International Airport 463,463 7.4450 San Francisco International Airport 459,467 14.69
Source: Airports Council International - Worldwide Airport Traffic Report - Calendar Year 2015.
3.1.2 top 50 airport Comparisons, Revenue Cargo in Short tons, top 50 Worldwide (aCi) – 2015

59
3.2.1 REVEnuE fREight in ShORt tOnS Annual Totals 2002 to 2015
domesticYEaR EWR JfK lga SWf REgiOn
2002 728,039 426,711 11,321 20,974 1,187,0452003 738,065 460,798 11,989 14,606 1,225,4582004 739,005 446,339 13,817 23,091 1,222,2522005 718,495 402,286 15,689 26,131 1,162,6012006 717,003 360,713 13,752 17,404 1,108,8722007 698,768 356,116 9,375 18,125 1,082,3842008 625,848 311,921 8,717 17,617 964,1032009 542,058 240,487 6,497 10,703 799,7452010 569,702 253,935 7,332 12,934 843,9032011 536,172 251,606 7,254 16,345 811,3772012 494,900 254,228 6,819 18,895 774,8422013 418,796 258,062 6,592 16,943 700,3932014 413,711 242,833 7,084 15,489 679,1172015 449,435 235,007 7,672 15,016 707,130
internationalYEaR EWR JfK lga SWf REgiOn
2002 181,733 1,260,135 388 – 1,442,2562003 237,530 1,279,245 344 – 1,517,1192004 256,251 1,347,109 279 – 1,603,6392005 239,108 1,318,641 317 – 1,558,0662006 251,525 1,345,674 246 578 1,598,0232007 254,788 1,301,242 220 308 1,556,5582008 243,601 1,162,899 177 104 1,406,7812009 219,862 921,428 215 52 1,141,5572010 291,268 1,139,861 184 – 1,431,3132011 276,169 1,131,343 136 13 1,407,6612012 247,998 1,064,998 190 203 1,313,3892013 244,359 1,062,973 128 547 1,308,0072014 253,130 1,100,222 56 24 1,353,4322015 255,252 1,094,939 49 128 1,350,368
domestic andinternational
YEaR EWR JfK lga SWf REgiOn
2002 909,772 1,686,846 11,709 20,974 2,629,3012003 975,595 1,740,043 12,333 14,606 2,742,5772004 995,256 1,793,448 14,096 23,091 2,825,8912005 957,603 1,720,927 16,006 26,131 2,720,6672006 968,528 1,706,387 13,998 17,982 2,706,8952007 953,556 1,657,358 9,595 18,433 2,638,9422008 869,449 1,474,820 8,894 17,721 2,370,8842009 761,920 1,161,915 6,712 10,755 1,941,3022010 860,970 1,393,796 7,516 12,934 2,275,2162011 812,341 1,382,949 7,390 16,358 2,219,0382012 742,898 1,319,226 7,009 19,098 2,088,2312013 663,155 1,321,035 6,720 17,490 2,008,4002014 666,841 1,343,055 7,140 15,513 2,032,5492015 704,687 1,329,946 7,721 15,144 2,057,498
note: Data was converted from pounds to short tons and rounded.
3.2.1 Revenue freight in Short tons, annual totals 2002-2015, by airport and Region

60
3.2.2 REVEnuE fREight in ShORt tOnS Monthly Totals 2014 to 2015
domestic REgiOnal ChangEmOnth EWR JfK lga SWf REgiOn 2014 tO 2015
Jan 35,457 18,567 641 1,168 55,833 2.9%Feb 33,685 17,560 606 1,011 52,862 9.3%Mar 35,099 19,086 655 1,047 55,886 1.8%Apr 36,625 19,616 645 1,118 58,003 3.7%May 36,029 19,761 704 1,170 57,663 4.3%Jun 34,441 19,001 585 1,111 55,138 6.4%Jul 36,978 20,285 508 1,277 59,047 5.1%Aug 34,449 18,526 541 1,101 54,617 –Sep 38,436 18,350 664 1,329 58,779 5.9%Oct 40,430 22,007 740 1,360 64,537 4.1%Nov 36,007 18,985 691 1,251 56,934 -1.1%Dec 51,799 23,263 692 2,075 77,829 7.1%total 2015 449,435 235,007 7,672 15,018 707,128 4.1%% Change2014 to 2015 8.6% -3.2% 8.3% -3.0% 4.1%
international REgiOnal ChangEmOnth EWR JfK lga SWf REgiOn 2014 tO 2015
Jan 20,201 82,810 5 12 103,027 3.5%Feb 21,497 81,061 8 – 102,566 5.8%Mar 24,542 98,862 4 98 123,505 1.2%Apr 21,022 93,882 3 – 114,907 4.2%May 20,666 92,418 2 – 113,086 -0.4%Jun 21,285 91,889 5 – 113,179 -0.9%Jul 21,214 91,066 3 18 112,300 -2.0%Aug 19,635 88,162 3 – 107,800 -2.0%Sep 19,262 86,833 1 – 106,096 -5.0%Oct 21,204 98,588 5 – 119,797 -1.3%Nov 22,143 96,916 6 – 119,065 -1.2%Dec 22,581 92,453 4 – 115,038 -3.2%total 2015 255,252 1,094,940 49 128 1,350,366 -0.2%% Change2014 to 2015 0.8% -0.5% -12.5% 433.3% -0.2%
domestic andinternational
REgiOnal ChangEmOnth EWR JfK lga SWf REgiOn 2014 tO 2015
Jan 55,658 101,377 646 1,180 158,860 3.3%Feb 55,182 98,621 614 1,011 155,428 7.0%Mar 59,641 117,948 659 1,145 179,391 1.4%Apr 57,647 113,498 648 1,118 172,910 4.0%May 56,695 112,179 706 1,170 170,749 1.1%Jun 55,726 110,890 590 1,111 168,317 1.4%Jul 58,192 111,351 511 1,295 171,347 0.4%Aug 54,084 106,688 544 1,101 162,417 -1.4%Sep 57,698 105,183 665 1,329 164,875 -1.4%Oct 61,634 120,595 745 1,360 184,334 0.5%Nov 58,150 115,901 697 1,251 175,999 -1.2%Dec 74,380 115,716 696 2,075 192,867 0.7%total 2015 704,687 1,329,947 7,721 15,146 2,057,494 1.2%% Change2014 to 2015 5.7% -1.0% 8.1% -2.4% 1.2%
note: Data was converted from pounds to short tons and rounded.
3.2.2 Revenue freight in Short tons, monthly totals 2015, by airport and Region

61
imports SOuth CEntRal auStRalia nORth YEaR aSia EuROpE amERiCa afRiCa amERiCa & OCEania amERiCa REgiOn
2006 490,579 341,996 31,894 19,305 13,461 2,945 4,038 904,1182007 471,001 365,110 31,115 15,877 12,683 2,910 5,531 904,2272008 413,895 315,790 26,230 15,399 10,707 3,308 4,390 789,7112009 343,111 253,772 21,638 12,031 7,292 3,238 2,177 643,3112010 423,374 335,666 23,723 15,160 7,313 2,637 2,578 810,5302011 351,124 355,786 23,967 13,828 6,710 2,118 2,650 756,3542012 347,203 299,400 25,170 12,889 7,210 1,985 957 694,9962013 352,454 301,252 24,866 12,064 6,156 1,998 1,148 700,0882014 364,793 325,315 26,927 12,487 5,596 2,294 1,109 738,6502015 373,404 349,850 28,430 13,923 6,947 2,410 1,112 776,075
Exports SOuth CEntRal auStRalia nORth YEaR aSia EuROpE amERiCa afRiCa amERiCa & OCEania amERiCa REgiOn
2006 275,589 282,113 15,211 15,784 8,987 13,799 929 612,4122007 298,427 315,968 21,625 19,084 9,303 15,135 1,232 680,7742008 294,798 308,973 19,583 19,899 8,275 15,670 1,428 668,8932009 238,378 260,409 13,578 16,578 6,234 12,925 1,230 549,5392010 317,527 301,656 19,691 18,847 5,504 14,157 1,382 679,0472011 316,575 309,497 19,214 17,532 6,158 15,416 1,351 686,1412012 274,603 265,931 18,584 17,189 5,333 15,687 1,303 598,6122013 258,323 260,216 20,131 15,864 6,084 13,730 1,511 576,1882014 243,243 261,925 19,917 15,170 5,205 10,199 1,153 557,1042015 236,111 248,931 17,627 12,299 5,183 9,397 917 530,465
total SOuth CEntRal auStRalia nORth YEaR aSia EuROpE amERiCa afRiCa amERiCa & OCEania amERiCa REgiOn
2006 766,168 624,109 47,105 34,989 22,448 16,744 4,967 1,516,5302007 769,428 681,078 52,740 34,961 21,986 18,045 6,763 1,585,0012008 708,692 624,763 45,813 35,298 18,982 18,978 5,817 1,458,6842009 581,488 514,182 35,216 28,609 13,526 16,163 3,407 1,192,8502010 740,901 637,321 43,414 34,007 12,817 16,794 3,960 1,489,5762011 667,698 665,283 43,181 31,360 12,868 17,534 4,001 1,442,4952012 621,806 564,791 43,753 30,078 12,543 17,673 2,260 1,293,6082013 610,777 561,468 44,997 27,928 12,240 15,728 2,659 1,276,2752014 608,036 587,241 46,844 27,657 10,802 12,493 2,262 1,295,7542015 609,514 598,781 46,058 26,221 12,130 11,807 2,029 1,306,540
Source: U.S. Dept. of Commerce, Bureau of Census.
3.3.1 REgiOnal fREight in ShORt tOnSreGiOn jkj US Customs Data: Annual Totals 2006-2015 by International Market
3.3.1 Regional freight in Short tons, By international market, annual totals 2006-2015, for Region (uS Customs)

62
3.3.2 REgiOnal fREight in ShORt tOnS reGiOn Top 10 U.S. Trading Districts by Air 2015
tOtal impORtS % Of tOtalRanK CuStOm diStRiCtS ShORt tOnS $ in 000’S tOnS dOllaRS
1 Chicago, IL 824,805 $ 95,916,541 17.3% 17.2%2 New York, NY 776,075 108,706,348 16.3% 19.5%3 Miami, FL 680,457 21,006,107 14.3% 3.8%4 Los Angeles, CA 627,893 51,582,266 13.2% 9.3%5 Cleveland, OH 240,115 39,318,438 5.0% 7.1%6 Savannah, GA 235,986 23,043,483 5.0% 4.1%7 New Orleans, LA 214,199 38,742,120 4.5% 7.0%8 San Francisco, CA 188,497 28,012,018 4.0% 5.0%9 Anchorage, AK 187,445 38,502,048 3.9% 6.9%
10 Dallas/Fort Worth, TX 181,889 32,318,385 3.8% 5.8%all Others 613,473 $ 79,648,650 12.9% 14.3%total 4,770,834 $556,796,403 100.0% 100.0%
tOtal EXpORtS % Of tOtalRanK CuStOm diStRiCtS ShORt tOnS $ in 000’S tOnS dOllaRS
1 New York, NY 530,465 $94,786,745 14.9% 21.6%2 Chicago, IL 525,018 45,873,732 14.7% 10.5%3 Los Angeles, CA 477,262 49,422,982 13.4% 11.3%4 Miami, FL 365,243 32,596,496 10.2% 7.4%5 Cleveland, OH 255,550 32,551,863 7.2% 7.4%6 New Orleans, LA 192,945 32,881,676 5.4% 7.5%7 Savannah, GA 159,901 13,490,910 4.5% 3.1%8 Dallas/Fort Worth, TX 158,162 21,315,250 4.4% 4.9%9 San Francisco, CA 158,019 26,717,639 4.4% 6.1%
10 Houston/Galveston, TX 131,186 9,174,118 3.7% 2.1%all Others 615,222 $ 80,041,542 17.2% 18.2%total 3,568,973 $438,852,955 100.0% 100.0%
tOtal impORtS and EXpORtS % Of tOtalRanK CuStOm diStRiCtS ShORt tOnS $ in 000’S tOnS dOllaRS
1 Chicago, IL 1,349,822 $141,790,273 16.2% 14.2%2 New York, NY 1,306,540 203,493,093 15.7% 20.4%3 Los Angeles, CA 1,105,155 101,005,248 13.3% 10.1%4 Miami, FL 1,045,699 53,602,603 12.5% 5.4%5 Cleveland, OH 495,665 71,870,301 5.9% 7.2%6 New Orleans, LA 407,144 71,623,796 4.9% 7.2%7 Savannah, GA 395,886 36,524,393 4.8% 3.7%8 San Francisco, CA 346,517 54,729,657 4.2% 5.5%9 Dallas/Fort Worth, TX 340,051 53,633,636 4.1% 5.4%
10 Anchorage, AK 291,880 52,128,629 3.5% 5.2%all Others 1,255,448 $155,247,728 15.0% 15.6%total 8,339,807 $995,649,357 100.0% 100.0%
Source: U.S. Dept. of Commerce, Bureau of Census.
3.3.2 Regional freight in Short tons, u.S. trading districts by air, 2015 (uS Customs)

63
3.3.3 REgiOnal fREight in ShORt tOnS reGiOn Top 10 U.S. Trading Districts by Air 2015
tOtal impORtS % Of tOtalRanK COmmOditY ShORt tOnS $ in 000’S tOnS dOllaRS
1 Machinery 126,900 $ 12,996,759 16.4% 12.0%2 Electrical Machinery 73,019 10,989,650 9.4% 10.1%3 Woven Apparel 70,560 3,152,811 9.1% 2.9%4 Fish and Seafood 65,191 405,203 8.4% 0.4%5 Knit Apparel 55,766 1,798,825 7.2% 1.7%6 Optical, Medical Instruments 38,536 7,612,866 5.0% 7.0%7 Plastic 26,655 671,393 3.4% 0.6%8 Vegetables 24,540 60,105 3.2% 0.1%9 Footwear 24,007 1,375,916 3.1% 1.3%
10 Pharmaceutical Products 17,715 10,275,152 2.3% 9.5%all Others 253,186 $ 59,367,669 32.6% 54.6%total 776,075 $108,706,348 100.0% 100.0%
tOtal EXpORtS % Of tOtalRanK COmmOditY ShORt tOnS $ in 000’S tOnS dOllaRS
1 Machinery 82,492 $9,335,328 15.6% 9.9%2 Electrical Machinery 43,767 8,234,589 8.3% 8.7%3 Plastic 35,640 930,116 6.7% 1.0%4 Optical, Medical Instruments 34,714 7,058,621 6.5% 7.5%5 Perfumery, Cosmetic Products 22,558 688,477 4.3% 0.7%6 Books and Newspapers 22,453 574,521 4.2% 0.6%7 Vehicles, Not Railway 20,885 520,515 3.9% 0.6%8 Fish and Seafood 20,795 246,792 3.9% 0.3%9 Iron and Steel Products 17,218 377,097 3.3% 0.4%
10 Misc. Chemical Products 16,060 859,217 3.0% 0.9%all Others 213,883 $ 65,961,472 40.3% 69.6%total 530,465 $ 94,786,745 100.0% 100.0%
tOtal impORtS and EXpORtS % Of tOtalRanK COmmOditY ShORt tOnS $ in 000’S tOnS dOllaRS
1 Machinery 209,393 $22,332,087 16.0% 11.0%2 Electrical Machinery 116,786 19,224,239 8.9% 9.5%3 Fish and Seafood 85,986 651,995 6.6% 0.3%4 Woven Apparel 77,613 3,360,779 5.9% 1.7%5 Optical, Medical Instruments 73,250 14,671,487 5.6% 7.2%6 Plastic 62,296 1,601,509 4.8% 0.8%7 Knit Apparel 60,812 1,925,863 4.7% 1.0%8 Perfumery, Cosmetic Products 39,659 1,242,604 3.0% 0.6%9 Vehicles, Not Railway 35,545 889,902 2.7% 0.4%
10 Pharmaceutical Products 30,804 14,963,791 2.4% 7.4%all Others 514,396 $122,628,836 39.4% 60.3%total 1,306,540 $203,493,093 100.0% 100.0%
Source: U.S. Dept. of Commerce, Bureau of Census.
3.3.3 Regional freight in Short tons, air trade Commodities in the nY/nJ Region, 2015 (uS Customs)

64
3.4.1 2015 REVEnuE fREight BY aiRlinE Top Carriers
tOtal fREightRanK aiRlinE (ShORt tOnS) CumulatiVE %
1 Delta 113,917 8.6%2 Federal Express 102,205 16.3%3 American 71,941 21.7%4 Cathay Pacific 66,015 26.6%5 China Airlines (CAL) 53,331 30.6%6 Korean 50,240 34.4%7 British Airways 49,618 38.1%8 Asiana 47,185 41.7%9 Cargolux Airlines 45,903 45.1%10 United Parcel 43,900 48.4%11 Virgin Atlantic 36,374 51.2%12 TNT Airways 35,839 53.9%13 ANA (All Nippon) 29,803 56.1%14 Air France 29,039 58.3%15 Kalitta Air LLC 27,758 60.4%
Others 526,879 100.0%total airport all airlines 1,329,947
tOtal fREightRanK aiRlinE (ShORt tOnS) CumulatiVE %
1 Federal Express 327,994 46.5%2 United Parcel 140,321 66.5%3 United 111,758 82.3%4 SAS 23,638 85.7%5 ABX Air Inc 17,934 88.2%6 Lufthansa 16,138 90.5%7 Virgin Atlantic 10,325 92.0%8 British Airways 9,971 93.4%9 Jet Airways 7,169 94.4%10 Swiss Int'l Air Lines Ltd 6,695 95.4%11 Delta 6,383 96.3%12 El Al 5,105 97.0%13 Cathay Pacific 3,672 97.5%14 Air Portugal(TAP) 3,274 98.0%15 Southwest Airlines 2,591 98.3%
Others 11,721 100.0%total airport all airlines 704,689
JFK
eWr
Source: Industry, Forecasting, & Traffic Statistics, Port Authority of NY & NJ.
3.4.1 Revenue freight by airlines , top Carriers 2015, by airport and Region
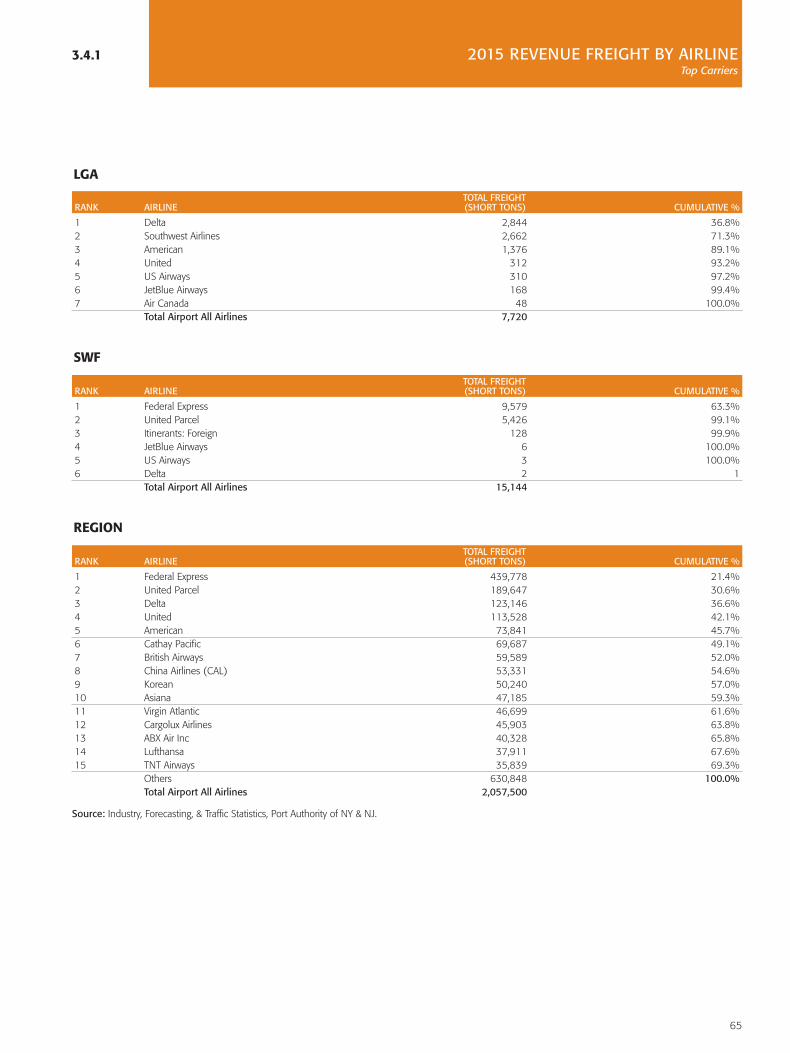
65
3.4.1 2015 REVEnuE fREight BY aiRlinE Top Carriers
tOtal fREightRanK aiRlinE (ShORt tOnS) CumulatiVE %
1 Delta 2,844 36.8%2 Southwest Airlines 2,662 71.3%3 American 1,376 89.1%4 United 312 93.2%5 US Airways 310 97.2%6 JetBlue Airways 168 99.4%7 Air Canada 48 100.0%
total airport all airlines 7,720
tOtal fREightRanK aiRlinE (ShORt tOnS) CumulatiVE %
1 Federal Express 9,579 63.3%2 United Parcel 5,426 99.1%3 Itinerants: Foreign 128 99.9%4 JetBlue Airways 6 100.0%5 US Airways 3 100.0%6 Delta 2 1
total airport all airlines 15,144
tOtal fREightRanK aiRlinE (ShORt tOnS) CumulatiVE %
1 Federal Express 439,778 21.4%2 United Parcel 189,647 30.6%3 Delta 123,146 36.6%4 United 113,528 42.1%5 American 73,841 45.7%6 Cathay Pacific 69,687 49.1%7 British Airways 59,589 52.0%8 China Airlines (CAL) 53,331 54.6%9 Korean 50,240 57.0%10 Asiana 47,185 59.3%11 Virgin Atlantic 46,699 61.6%12 Cargolux Airlines 45,903 63.8%13 ABX Air Inc 40,328 65.8%14 Lufthansa 37,911 67.6%15 TNT Airways 35,839 69.3%
Others 630,848 100.0%total airport all airlines 2,057,500
LGA
sWF
reGiOn
Source: Industry, Forecasting, & Traffic Statistics, Port Authority of NY & NJ.

66
3.5.1 REVEnuE mail in ShORt tOnS Annual Totals 2002 to 2015
domesticYEaR EWR JfK lga SWf REgiOn
2002 31,258 44,004 22,350 – 97,6122003 71,533 45,325 17,740 4 134,6022004 81,434 39,387 14,269 2 135,0922005 66,590 31,057 8,997 6 106,6502006 37,719 38,060 4,568 9 80,3562007 35,565 39,456 396 1 75,4182008 33,738 41,159 1,483 1 76,3812009 26,741 26,932 605 – 54,2782010 21,569 21,970 28 – 43,5672011 25,858 19,349 23 – 45,2302012 32,160 20,164 384 – 52,7082013 25,086 19,621 743 1 45,4512014 26,093 18,925 1,157 – 46,1752015 40,723 25,007 710 1,496 67,936
internationalYEaR EWR JfK lga SWf REgiOn
2002 7,888 42,295 1,468 – 51,6512003 13,058 39,432 1,291 – 53,7812004 9,130 49,351 950 – 59,4312005 23,579 48,862 1,300 – 73,7412006 57,940 61,809 1,150 – 120,8992007 73,497 75,767 1,691 – 150,9552008 74,820 85,033 1,152 – 161,0052009 70,699 78,790 744 – 150,2332010 60,909 80,649 556 – 142,1142011 58,745 80,102 620 – 139,4672012 47,233 73,507 793 – 121,5332013 29,590 83,171 637 – 113,3982014 10,287 68,257 451 – 78,9952015 8,306 63,153 519 – 71,978
domestic andinternational
YEaR EWR JfK lga SWf REgiOn
2002 39,146 86,299 23,818 – 149,2632003 84,591 84,757 19,031 4 188,3832004 90,564 88,738 15,219 2 194,5232005 90,169 79,919 10,297 6 180,3912006 95,659 99,869 5,718 9 201,2552007 109,062 115,223 2,087 1 226,3732008 108,558 126,192 2,635 1 237,3862009 97,440 105,722 1,349 – 204,5112010 82,478 102,619 584 – 185,6812011 84,603 99,451 643 – 184,6972012 79,393 93,671 1,177 – 174,2412013 54,676 102,792 1,380 1 158,8492014 36,380 87,182 1,608 – 125,1702015 49,029 88,160 1,229 1,496 139,914
note: Data was converted from pounds to short tons and rounded.
3.5.1 Revenue mail in Short tons, annual totals 2002-2015, by airport and Region

67
note: Data was converted from pounds to short tons and rounded.
3.5.2 REVEnuE mail in ShORt tOnS Monthly Totals 2015
domestic REgiOnal ChangEmOnth EWR JfK lga SWf REgiOn 2014 tO 2015
Jan 2,351 1,852 86 – 4,289 16.4%Feb 2,818 1,789 67 95 4,769 33.7%Mar 3,571 2,101 62 339 6,073 51.3%Apr 3,845 2,148 68 341 6,402 74.6%May 3,352 2,064 62 25 5,503 41.5%Jun 3,540 2,315 68 89 6,012 79.3%Jul 3,898 2,379 46 52 6,375 61.6%Aug 3,574 2,321 62 94 6,051 56.9%Sep 3,630 2,180 53 133 5,996 61.9%Oct 4,062 2,220 52 168 6,502 49.3%Nov 3,257 1,735 40 159 5,191 34.6%Dec 2,825 1,903 46 – 4,774 11.3%total 2015 40,723 25,007 712 1,495 67,937 47.1%% Change2014 to 2015 56.1% 32.1% -38.5% 100.0% 47.1%
international REgiOnal ChangEmOnth EWR JfK lga SWf REgiOn 2014 tO 2015
Jan 596 5,411 18 – 6,025 -25.8%Feb 533 4,612 35 – 5,180 -13.1%Mar 688 5,156 40 – 5,884 -2.4%Apr 709 4,721 38 – 5,468 -10.3%May 576 4,643 58 – 5,277 -17.3%Jun 706 4,596 40 – 5,342 -8.0%Jul 716 4,857 37 – 5,610 -1.2%Aug 715 4,672 45 – 5,432 -7.7%Sep 682 4,891 47 – 5,620 -10.9%Oct 738 5,841 47 – 6,626 -8.3%Nov 720 5,835 49 – 6,604 -7.6%Dec 926 7,917 63 – 8,906 6.5%total 2015 8,305 63,152 517 – 71,974 -8.9%% Change2014 to 2015 -19.3% -7.5% 14.9% 0.0% -8.9%
domestic andinternational
REgiOnal ChangEmOnth EWR JfK lga SWf REgiOn 2014 tO 2015
Jan 2,947 7,263 104 – 10,314 -12.6%Feb 3,351 6,401 102 95 9,949 4.5%Mar 4,259 7,257 102 339 11,957 19.0%Apr 4,554 6,869 106 341 11,870 21.6%May 3,928 6,707 120 25 10,780 5.0%Jun 4,246 6,911 108 89 11,354 23.9%Jul 4,614 7,236 83 52 11,985 24.6%Aug 4,289 6,993 107 94 11,483 17.8%Sep 4,312 7,071 100 133 11,616 16.0%Oct 4,800 8,061 99 168 13,128 13.4%Nov 3,977 7,570 89 159 11,795 7.2%Dec 3,751 9,820 109 – 13,680 8.2%total 2015 49,028 88,159 1,229 1,495 139,911 11.8%% Change2014 to 2015 34.8% 1.1% -23.5% 100.0% 11.8%
3.5.2 Revenue mail in Short tons, monthly totals 2015, by airport and Region

68
Page is intentionally blank.

GrOUnD trAnsPOrtAtiOn & AirPOrt ecOnOMic iMPAct
Passenger Accessing Airports by Bus & Rail
Paid Parked Cars
Taxi Dispatch Passengers
Ground Transportation Center Bookings
Airport Employment
Economic Impact of the Aviation Industry
- - gROund tRanSpORtatiOn & aiRpORt ECOnOmiC impaCt SECtiOn

69
4.1.1 paSSEngER aCCESSing aiRpORtS BY BuS & Rail Annual Totals 2002 to 2015
EWROlYmpia tRail nEW JERSEY tRanSit
OlYmpia tRail EXpRESS nJt Rail SERViCE YEaR (mOtOR COaCh) #300 BuS and aiR tRain aiRlinK/302 BuS tOtal
2002 308,998 306,300 1,008,821 – 1,624,1192003 314,272 300,784 1,178,822 – 1,793,8782004 387,828 293,250 1,368,067 – 2,049,1452005 374,322 272,357 1,445,035 – 2,091,7142006 229,507 386,227 1,588,163 – 2,203,8972007 225,972 394,490 1,793,796 – 2,414,2582008 271,527 396,581 1,933,100 – 2,601,2082009 275,913 361,321 1,863,718 – 2,500,9522010 279,716 352,753 1,870,237 – 2,502,7062011 275,853 349,016 2,055,623 – 2,680,4922012 263,479 316,300 2,136,446 – 2,716,2252013 262,554 305,149 2,386,467 – 2,954,1702014 279,187 335,178 2,176,316 – 2,790,6812015 226,835 283,085 2,545,232 – 3,055,152
JfK lga SWf REgiOnnY aiRpORt SERViCE aiRtRain JamaiCa StatiOn nEW YORK aiRpORt SERViCE COnnECting BuS gRand tOtal
YEaR (mOtOR COaCh) and hOWaRd BEaCh (mOtOR COaCh) (lEpREChaun) mOtOR COaCh and Rail
2002 482,691 – 377,459 – 860,1502003 532,165 82,293 386,948 – 1,001,4062004 571,048 2,594,236 421,746 – 3,587,0302005 570,468 3,411,762 425,547 – 4,407,7772006 514,561 3,950,014 407,838 – 4,872,4132007 498,755 4,393,258 383,394 – 5,275,4072008 488,459 4,733,128 332,048 8,839 5,562,4742009 491,429 5,236,404 332,947 1,371 6,062,1512010 492,597 5,287,909 400,762 1,320 6,182,5882011 272,274 5,573,116 232,843 1,548 6,079,7812012 356,741 5,706,207 271,382 652 6,334,9822013 386,657 6,002,835 269,360 175 6,659,0272014 420,913 6,522,096 264,760 396 7,208,1652015 420,781 7,130,410 284,969 – 7,836,160
EWROlympia Trails: currently serves Bryant Park and GCT, formerly served lower Manhattan and Penn Station.Express #300 bus: currently serves PABT.NJT Rail Services & AirTrain: currently serves Manhattan and various points in New Jersey and operated by Olympic Trails.Airlink/302 bus: formerly linked Newark Penn Station with EWR but ceased operations with opening of AirTrain.
JfKNew York Airport Service: currently serves GCT and the PABT in Manhattan (formerly known as Carey bus).AirTrain: currently serves various points in the City of New York and Long Island via LIRR and Subway.
lgaNew York Airport Service: currently serves GCT and the PABT in Manhattan (formerly known as Carey bus).
SWfLeprechaun Bus: currently serves Beacon Metro-North commuter rail station.
4.1.1 passengers accessing airports by Bus & Rail, annual totals 2002-2015, by airport and Region

70
4.2.1 paid paRKEd CaRS Annual Totals 2002 to 2015
YEaR EWR JfK lga SWf * REgiOn
2002 4,844,475 4,724,885 2,542,071 – 12,111,4312003 4,398,127 4,958,635 2,314,150 – 11,670,9122004 4,397,346 5,196,064 2,305,507 – 11,898,9172005 4,306,993 4,762,364 2,250,659 – 11,320,0162006 4,466,632 4,283,499 2,092,066 124,608 10,966,8052007 4,246,706 4,753,459 1,874,350 404,505 11,279,0202008 3,762,446 4,570,687 1,645,465 353,075 10,331,6732009 3,272,762 4,429,201 1,467,839 157,363 9,327,1652010 3,105,058 4,337,572 1,530,875 94,400 9,067,9052011 3,063,016 4,273,262 1,481,809 94,574 8,912,6612012 2,926,748 4,154,895 1,494,103 81,934 8,657,6802013 2,862,943 4,202,721 1,452,692 73,664 8,592,0202014 2,844,074 4,132,263 1,245,979 69,443 8,291,7592015 2,872,335 4,112,611 1,170,759 63,795 8,219,500
note: After 2001, LGA metered parking volume detail became unavailable. In 2001 and prior an estimate had been derived from revenue. Metered parking for 2001
and prior is included above.* SWF: Historical data prior to 2006 not available.
4.2.1 paid parked cars, annual totals 2002-2015, by airport and Region

71
4.3.1 taXi diSpatCh paSSEngERS Annual Totals 2002 to 2015
Outboundpassengers
YEaR EWR JfK lga SWf * REgiOn
2002 912,500 2,070,444 3,238,522 – 6,221,4662003 980,000 2,209,365 3,456,575 – 6,645,9402004 875,518 2,398,900 3,714,114 – 6,988,5322005 940,440 2,602,497 3,801,868 – 7,344,8052006 1,019,570 2,647,581 3,726,796 – 7,393,9472007 1,066,032 2,880,015 3,828,857 6,195 7,781,0992008 1,296,643 2,919,327 3,630,833 5,897 7,852,7002009 1,188,024 2,798,833 3,247,619 4,125 7,238,6012010 1,307,449 2,982,192 3,608,390 4,200 7,902,2312011 1,370,930 3,194,816 3,586,124 5,810 8,157,6802012 1,318,801 3,250,056 3,769,163 3,717 8,341,7372013 1,261,864 3,206,289 3,811,038 2,353 8,281,5442014 977,287 3,270,025 3,699,976 577 7,947,8652015 881,155 3,327,222 3,012,440 408 7,221,225
* Visconti Cab Company.
4.3.1 taxi dispatch passengers, annual totals 2002-2015, by airport and Region

72
* A passenger booking a reservation will book for all passengers traveling together, therefore there will be fewer bookings than actual passengers. For example, in 2008 there were 348,362 bookings at the ground transportation centers and 581,859 actual passengers.
4.4.1 gROund tRanSpORtatiOn CEntER BOOKingS* Annual Totals 2002 to 2015
OutboundOnly
YEaR EWR JfK lga SWf REgiOn
2002 165,276 261,423 195,446 – 622,1452003 167,592 238,063 186,444 – 592,0992004 164,206 251,793 184,034 – 600,0332005 105,572 191,131 129,887 – 426,5902006 110,022 166,026 151,795 – 427,8432007 84,304 149,322 122,802 – 356,4282008 94,335 156,553 102,510 – 353,3982009 103,706 169,021 108,489 – 381,2162010 104,697 171,736 115,681 – 392,1142011 99,826 175,785 117,143 – 392,7542012 111,175 204,480 123,988 – 439,6432013 109,757 216,005 111,173 – 436,9352014 104,287 212,343 102,150 – 418,7802015 95,900 216,546 87,595 – 400,041
4.4.1 ground transportation Center Bookings, annual totals 2002-2015, by airport and Region

73
4.5.1 aiRpORt EmplOYmEnt Annual Totals 1994 to 2015
YEaR EWR JfK lga SWf aCY REgiOn
1994 18,572 37,365 9,180 n/a n/a 65,1171995 n/a n/a n/a n/a n/a n/a1996 n/a n/a n/a n/a n/a n/a1997 n/a n/a n/a n/a n/a n/a1998 n/a n/a n/a n/a n/a n/a1999 24,270 37,396 10,034 n/a n/a 71,7002000 n/a n/a n/a n/a n/a n/a2001 n/a n/a n/a n/a n/a n/a2002* 20,000 29,500 9,400 n/a n/a 58,9002003 n/a n/a n/a n/a n/a n/a2004 18,352 29,519 7,874 n/a n/a 55,7452005 n/a 30,988 9,110 n/a n/a 40,0982006 n/a 32,350 9,172 n/a n/a 41,5222007 20,900 34,576 8,796 n/a n/a 64,2722008 22,449 25,201 9,510 n/a n/a 57,1602009 20,304 30,851 9,411 1,194 n/a 61,7602010 20,900 34,576 8,796 n/a n/a 64,2722011 20,716 36,352 10,284 1,139 n/a 68,4912012 20,283 34,924 11,068 1,113 n/a 67,3882013 19,700 36,620 11,353 1,145 n/a 68,8182014 20,505 37,396 11,952 1,239 974 72,0662015 20,268 38,232 11,977 1,258 1,186 72,921
4.5.1 airport Employment, annual totals 2002-2015, by airport and Region
note: n/a = Airport employment survey not available.* Beginning in 2002, a different method is used to arrive at totals. The earlier period figures were based on surveys of employers at the airports. The current method
represents individuals who require airport security badges to work at the airport. There are two types of security badges: SIDA and Sterile.Other airport employees who do not require badges are not included here. Security Identification Display Area (SIDA) badges are held by those with access to ramps, runways, taxiways, baggage areas, terminals and airline offices. Sterile Badges are held by those who have access to the passenger terminals, between passenger screening checkpoints and the boarding gates only.

74
4.6.1 ECOnOmiC impaCt Of thE aViatiOn induStRY New York/New Jersey Region
2015impaCt EWR JfK lga SWf tOtal
passenger Operating impact Wages $ 4,321 $ 8,042 $ 2,930 $ 35 $ 15,082 Sales $ 12,189 $ 22,357 $ 8,294 $ 97 $ 42,293 Jobs-Years 75,140 138,901 50,611 598 261,069
Visitor Economic impact Wages $ 3,605 $ 4,774 $ 3,357 $ 55 $ 11,790 Sales $ 9,564 $ 12,697 $ 8,904 $ 145 $ 31,311 Jobs-Years 82,287 109,507 76,332 1,250 269,376
Cargo impact Wages $ 1,237 $ 2,219 $ 19 $ 26 $ 3,515 Sales $ 3,419 $ 6,594 $ 43 $ 75 $ 10,134 Jobs-Years 18,918 34,418 253 398 54,104
Capital Spending impactWages $ 32 $ 98 $ 115 $ 8 $ 252 Sales $ 123 $ 380 $ 443 $ 30 $ 977 Jobs-Years 534 1,654 1,930 133 4,251
total Economic impactWages $ 9,195 $ 15,133 $ 6,420 $ 123 $ 30,640 Sales $ 25,296 $ 42,028 $ 17,685 $ 347 $ 84,715 Jobs-Years 176,879 284,479 129,126 2,379 588,799
In Million $ 2015
4.6.1 the Economic impact of the aviation industry, 2015 totals for the new York/new Jersey Region
75
creDits
The Honorable Andrew M. Cuomo, Governor, State of New YorkThe Honorable Chris Christie, Governor, State of New Jersey
tHe POrt AUtHOritY OF neW YOrK AnD neW JerseYJohn Degnan, Chairman, Board of Commissioners Patrick Foye, Executive DirectorThomas Bosco, Director, Aviation DepartmentRalph Tragale, Assistant Director, Aviation Customer, Industry and External Affairs
PrODUctiOn stAFFJojo Quayson, Editor & Manager, Forecasting & Traffic Statistics Santiago Grullón, Senior Economist, Forecasting & Traffic StatisticsTushar Japi, Senior EconomistJean Debrosse, Technical AssistantPasquale DiFulco, Editing SupervisorPeter Fushan, Passenger Surveys Technical Assistant Michael Bednarz, Cargo ManagerJohn Olberding, Production Manager Lynn Masterson, Graphic DesignerFlory Danish, Production Supervisor
- - CREditS