Formulation Strategies to Enhance Nose-to-Brain Delivery of ...
Upload
independentCategory
view
0download
0
Airflow and nanoparticle deposition in rat nose under variousbreathing and sniffing conditions:a computational evaluation of the unsteady effect
Jianbo Jianga and Kai Zhaoaa Monell Chemical Senses Center, Philadelphia, PA 19104
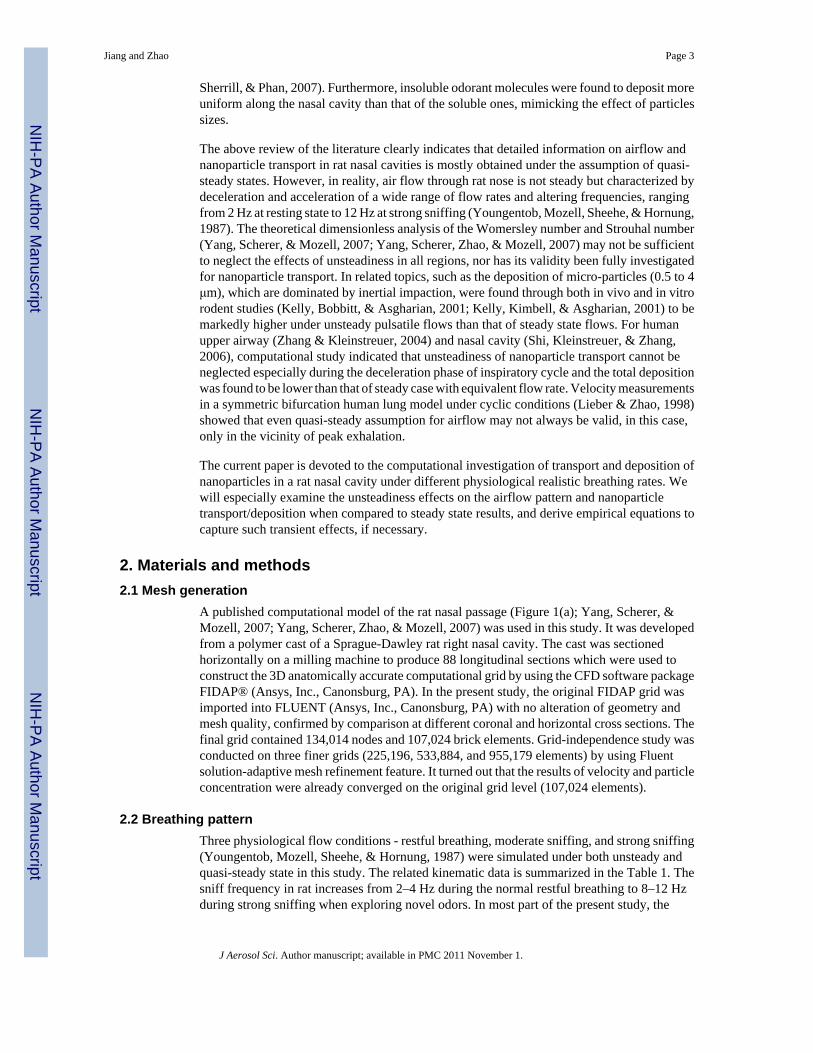
AbstractAccurate prediction of nanoparticle (1~100 nm) deposition in the rat nasal cavity is important forassessing the toxicological impact of inhaled nanoparticles as well as for potential therapeuticapplications. A quasi-steady assumption has been widely adopted in the past investigations on thistopic, yet the validity of such simplification under various breathing and sniffing conditions has notbeen carefully examined. In this study, both steady and unsteady computational fluid dynamics(CFD) simulations were conducted in a published rat nasal model under various physiologicallyrealistic breathing and sniffing flow rates. The transient airflow structures, nanoparticle transport anddeposition patterns in the whole nasal cavity and the olfactory region were investigated and comparedwith steady state simulation of equivalent flow rate. The results showed that (1) the quasi-steadyflow assumption for cyclic flow was valid for over 70% of the cycle period during all simulatedbreathing and sniffing conditions in the rat nasal cavity, or the unsteady effect was only significantduring the transition between the respiratory phases; (2) yet the quasi-steady assumption fornanoparticle transport was not valid, except in the vicinity of peak respiration. In general, the totaldeposition efficiency of nanoparticle during cyclic breathing would be lower than that of steady statedue to the unsteady effect on particle transport and deposition, and further decreased with the increaseof particle size, sniffing frequency, and flow rate. In the contrary, previous study indicated that formicro-scale particles (0.5~4μm), the unsteady effect would increase deposition efficiencies in ratnasal cavity. Combined, these results suggest that the quasi-steady assumption of nasal particletransport during cycling breathing should be used with caution for an accurate assessment of thetoxicological and therapeutic impact of particle inhalation. Empirical equations and effective steadystate approximation derived in this study are thus valuable to estimate such unsteady effects in futureapplications.
KeywordsComputational Fluid Dynamics; Rat nasal cavity; Nanoparticle deposition; Olfactory region; Cyclingbreathing
Jianbo Jiang Address: Monell Chemical Senses Center 3500 Market Street Philadelphia, PA 19104-3308, USA Phone Number: (267)519-4937 Fax Number: (215) 898-2084 [email protected] Zhao Address: Monell Chemical Senses Center 3500 Market Street Philadelphia, PA 19104-3308, USA Phone Number: (267)519-4935 Fax Number: (267) 519-4935 [email protected]'s Disclaimer: This is a PDF file of an unedited manuscript that has been accepted for publication. As a service to our customerswe are providing this early version of the manuscript. The manuscript will undergo copyediting, typesetting, and review of the resultingproof before it is published in its final citable form. Please note that during the production process errors may be discovered which couldaffect the content, and all legal disclaimers that apply to the journal pertain.
NIH Public AccessAuthor ManuscriptJ Aerosol Sci. Author manuscript; available in PMC 2011 November 1.
Published in final edited form as:J Aerosol Sci. 2010 November 1; 41(11): 1030–1043. doi:10.1016/j.jaerosci.2010.06.005.
NIH
-PA Author Manuscript
NIH
-PA Author Manuscript
NIH
-PA Author Manuscript

1. INTRODUCTIONThe nasal cavity is the first line of defense in the respiratory tract that filters out inhaled airborneparticulate matters thus protecting the delicate low airways (Balásházy, Hofmann, &Heistracher, 2003). On the other hand, the deposition of therapeutic particles or droplets in thenasal cavity has been used for clinical treatment of allergies, congestion, blood disorders,migraine headache, and osteoporosis etc (Mathison, Nagilla, & Kompella, 1998). In recentyears, the transport and deposition of nanoparticles (diameter less than or equal to 100 nm) isof increasing concern since nanoparticles are more toxic and diffusible than larger particles(Oberdorster et al., 2004), while its utilization may improve the therapeutic delivery efficiencyof the drugs (Illum, 2002).
Laboratory rats are commonly used as human surrogates to investigate the inhalationtoxicology and applied pharmacology. Extrapolation from the particle deposition data inanimal models allows the estimation of delivered dosage of inhaled particles to target sites inthe human nasal cavities by taking into account the structural differences. Thus detailed andaccurate information about the particle deposition in the rat nasal cavity is an important steptowards this goal.
The complexities in geometry and the small dimensions of the rat nasal cavity have made thedirect in vivo studies of airflow difficult, instead, in vitro models (Morgan et al., 1991) and in-silica models (Kimbell et al., 1997; Yang, Scherer, & Mozell, 2007; Zhao, Dalton, Yang, &Scherer, 2006; Minard et al., 2006) have been the mainstay for the investigation. Resultsgenerated from the in vitro and computational approaches generally agree with each other -that for inspiration, airflow enters into the caudal central domain then diverges into paralleland complex dorsal, lateral and ventral channels. Streamlines that enters dorsal channelgenerally follow an “S-Shape” route into the olfactory ethmoid recesses, while such S-shapedstreamlines become less prevalent during expiration (Yang, Scherer, & Mozell, 2007; Zhao,Dalton, Yang, & Scherer, 2006; Minard et al., 2006). However, in order to significantly reducethe temporal complexity of the computational or experimental setup when analyzing the flowdynamics and transport phenomena, all the above studies employed a common quasi-steadystate approximation that assumes nasal airflow is time-independent. The assumption is basedon theoretical dimensionless analysis of Womersley and Strouhal number for respiratoryairflow in the rat nasal cavity (Grotberg, Sheth, & Mockros, 1990). Most of these studies alsoassumed laminar flow condition, while only one report argued that rat nasal airflow has non-laminar components based on the measured pressure drops at different flow rates (Cheng etal., 1990).
Similarly, the quasi-steady assumption was widely applied when investigating transport anddeposition of nanoparticles in the rat nasal cavities in vivo (Wolff, Kanapilly, Gray, &McClellan 1984; Gerde, Cheng, & Medinsky, 1991; Martonen & Yang, 1990), in plastic nasalmolds (Cheng et al., 1990) and computationally (Garcia & Kimbell, 2009). These steady stateresults generally agree well with each other – that the overall nasal deposition efficiencydecreases with increase of flow rate and particle size (ranging from 5 nm to 200 nm) duringinspiration, while expiratory flow results in slightly higher pressure drop and lower depositionefficiency than inspiratory flow. The spatial deposition patterns for the smaller nanoparticles(for example, 3 nm) are mainly aggregated in the anterior region, but expand more uniformlywith the increase of particle size and flow rate. Under quasi-steady assumption, Zhao, Dalton,Yang, & Scherer (2006) and Yang, Scherer, Zhao, & Mozell (2007) investigated the deposition(uptake) and transport of odorant molecules (whose typical diameter is less than 1 nm) withdifferent water solubility in the rat nasal cavity. One of their important finding is that theincrease of airflow pass through the olfactory region during inspiration than expiration maylead to differences between inspiratory and expiratory olfactory activity (Scott, Acevedo,
Jiang and Zhao Page 2
J Aerosol Sci. Author manuscript; available in PMC 2011 November 1.
NIH
-PA Author Manuscript
NIH
-PA Author Manuscript
NIH
-PA Author Manuscript
Sherrill, & Phan, 2007). Furthermore, insoluble odorant molecules were found to deposit moreuniform along the nasal cavity than that of the soluble ones, mimicking the effect of particlessizes.
The above review of the literature clearly indicates that detailed information on airflow andnanoparticle transport in rat nasal cavities is mostly obtained under the assumption of quasi-steady states. However, in reality, air flow through rat nose is not steady but characterized bydeceleration and acceleration of a wide range of flow rates and altering frequencies, rangingfrom 2 Hz at resting state to 12 Hz at strong sniffing (Youngentob, Mozell, Sheehe, & Hornung,1987). The theoretical dimensionless analysis of the Womersley number and Strouhal number(Yang, Scherer, & Mozell, 2007; Yang, Scherer, Zhao, & Mozell, 2007) may not be sufficientto neglect the effects of unsteadiness in all regions, nor has its validity been fully investigatedfor nanoparticle transport. In related topics, such as the deposition of micro-particles (0.5 to 4μm), which are dominated by inertial impaction, were found through both in vivo and in vitrorodent studies (Kelly, Bobbitt, & Asgharian, 2001; Kelly, Kimbell, & Asgharian, 2001) to bemarkedly higher under unsteady pulsatile flows than that of steady state flows. For humanupper airway (Zhang & Kleinstreuer, 2004) and nasal cavity (Shi, Kleinstreuer, & Zhang,2006), computational study indicated that unsteadiness of nanoparticle transport cannot beneglected especially during the deceleration phase of inspiratory cycle and the total depositionwas found to be lower than that of steady case with equivalent flow rate. Velocity measurementsin a symmetric bifurcation human lung model under cyclic conditions (Lieber & Zhao, 1998)showed that even quasi-steady assumption for airflow may not always be valid, in this case,only in the vicinity of peak exhalation.
The current paper is devoted to the computational investigation of transport and deposition ofnanoparticles in a rat nasal cavity under different physiological realistic breathing rates. Wewill especially examine the unsteadiness effects on the airflow pattern and nanoparticletransport/deposition when compared to steady state results, and derive empirical equations tocapture such transient effects, if necessary.
2. Materials and methods2.1 Mesh generation
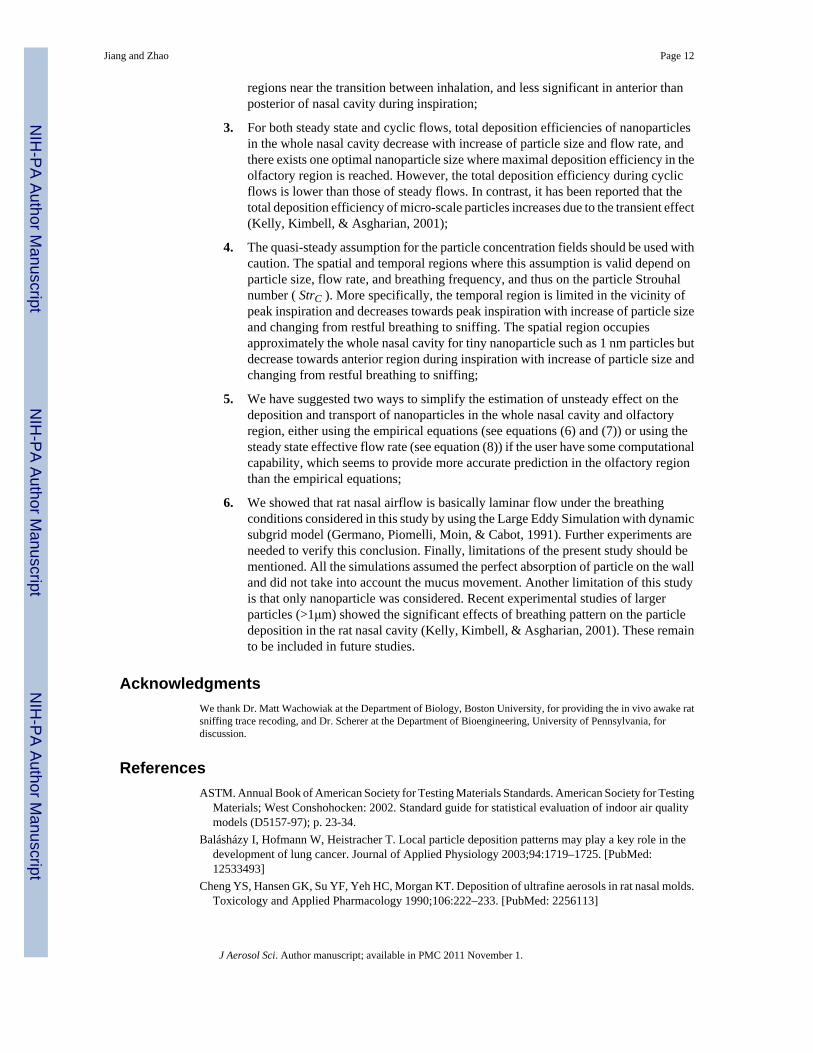
A published computational model of the rat nasal passage (Figure 1(a); Yang, Scherer, &Mozell, 2007; Yang, Scherer, Zhao, & Mozell, 2007) was used in this study. It was developedfrom a polymer cast of a Sprague-Dawley rat right nasal cavity. The cast was sectionedhorizontally on a milling machine to produce 88 longitudinal sections which were used toconstruct the 3D anatomically accurate computational grid by using the CFD software packageFIDAP® (Ansys, Inc., Canonsburg, PA). In the present study, the original FIDAP grid wasimported into FLUENT (Ansys, Inc., Canonsburg, PA) with no alteration of geometry andmesh quality, confirmed by comparison at different coronal and horizontal cross sections. Thefinal grid contained 134,014 nodes and 107,024 brick elements. Grid-independence study wasconducted on three finer grids (225,196, 533,884, and 955,179 elements) by using Fluentsolution-adaptive mesh refinement feature. It turned out that the results of velocity and particleconcentration were already converged on the original grid level (107,024 elements).
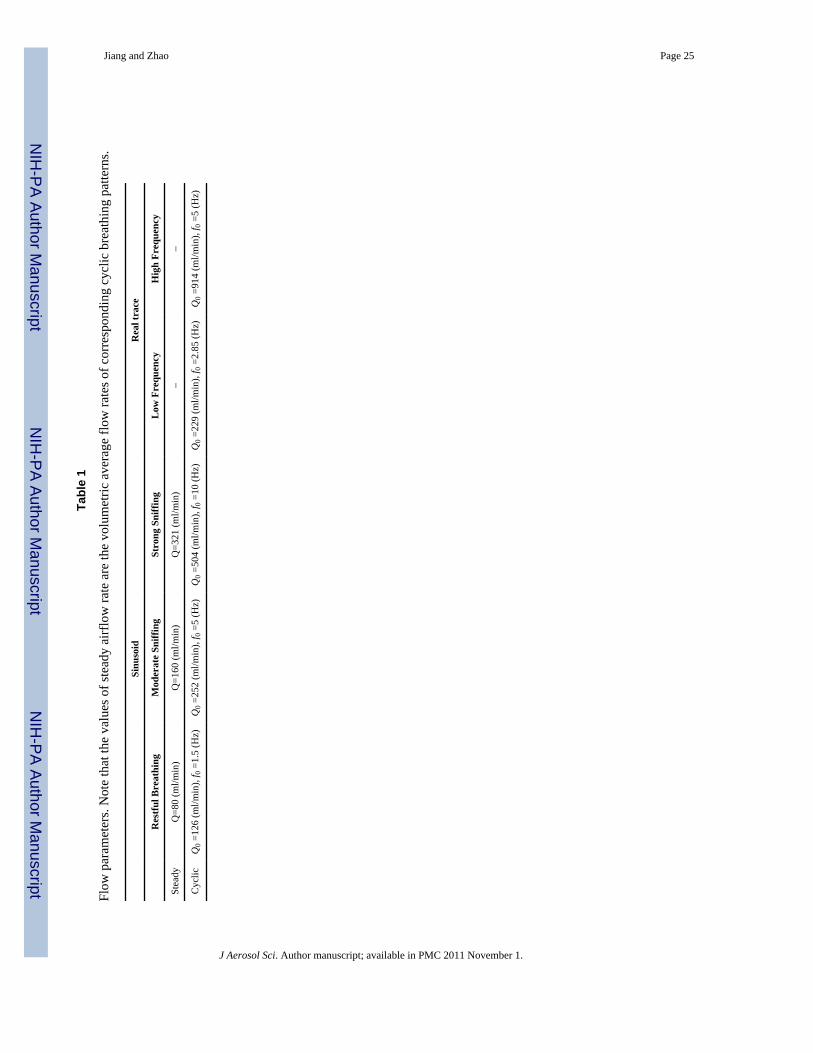
2.2 Breathing patternThree physiological flow conditions - restful breathing, moderate sniffing, and strong sniffing(Youngentob, Mozell, Sheehe, & Hornung, 1987) were simulated under both unsteady andquasi-steady state in this study. The related kinematic data is summarized in the Table 1. Thesniff frequency in rat increases from 2–4 Hz during the normal restful breathing to 8–12 Hzduring strong sniffing when exploring novel odors. In most part of the present study, the
Jiang and Zhao Page 3
J Aerosol Sci. Author manuscript; available in PMC 2011 November 1.
NIH
-PA Author Manuscript
NIH
-PA Author Manuscript
NIH
-PA Author Manuscript

respiration breathing pattern for the unsteady simulation was assumed to be sinusoidal (Figure1(b)). The actual sniffing pattern in rat is not sinusoidal, but consists of varying shapes ofinspiration and expiration profiles, with periods of apnea in between. The use of sinusoidalsniffing waves serves to simplify our numerical computation cost, and such simplification willbe validated by simulation of one in vivo recorded sniffing trace in an awake rat (Figure 1(c);(Cheung Carey, & Wachowiak, 2009)) that contains both low and high sniffing frequencies.
2.3 Governing equations and boundary conditionsThe continuity and momentum equations for the airflow take the following forms under thelaminar flow, incompressible, and isothermal assumption (300 K):
(1)
(2)
where ui, p and ν are the ith component of the velocity vector, pressure, and air kinetic viscosity,respectively.
Nanoparticles ranging from 1 nm to 100 nm were considered in this study, and assumed to besufficiently dilute with negligible effects on airflows. The particle concentration was thenmodeled by advection-diffusion equation, ignoring coagulation, aggregation, surface growth,nucleation, gravity, and other internal and external forces:
(3)
where Da is the molecular diffusivity of particles in the air and is calculated from the Stokes-Einstein equation (Clift, Grace, & Weber, 1978).
For steady case, uniform velocity and particle concentration were specified at the inlet (externalnaris during inspiration and nasopharyngeal end during expiration). Previous numerical study(Yang, Scherer, & Mozell, 2007) have confirmed that flow field in the downstream is notsignificantly affected by the inlet velocity profile for a given flow rate. At the outlet(nasopharyngeal end during inspiration and external naris during expiration), zero-gradient ofvelocity, pressure and particle concentration (Dirichlet condition) was applied. All the wallswere assumed to be non-slip (zero velocity) with perfectly absorbing surfaces (zero particleconcentration) for the nanoparticles.
The cyclic flow rate profile (Figure 1(b)) was specified at the inlet (external naris) by thefollowing expression:
(4)
where Q is the transient flow rate, Q0 is the peak flow rate, and f0 is the frequency. The valuesof Q0 and f0 used in this study are listed in Table 1. The other boundary conditions for cycliccase were same as those for steady case, that is, uniform particle concentration at the inlet
Jiang and Zhao Page 4
J Aerosol Sci. Author manuscript; available in PMC 2011 November 1.
NIH
-PA Author Manuscript
NIH
-PA Author Manuscript
NIH
-PA Author Manuscript
(external naris), Dirichlet condition at the outlet (nasopharyngeal end), and non-slip, perfectlyabsorbing walls.
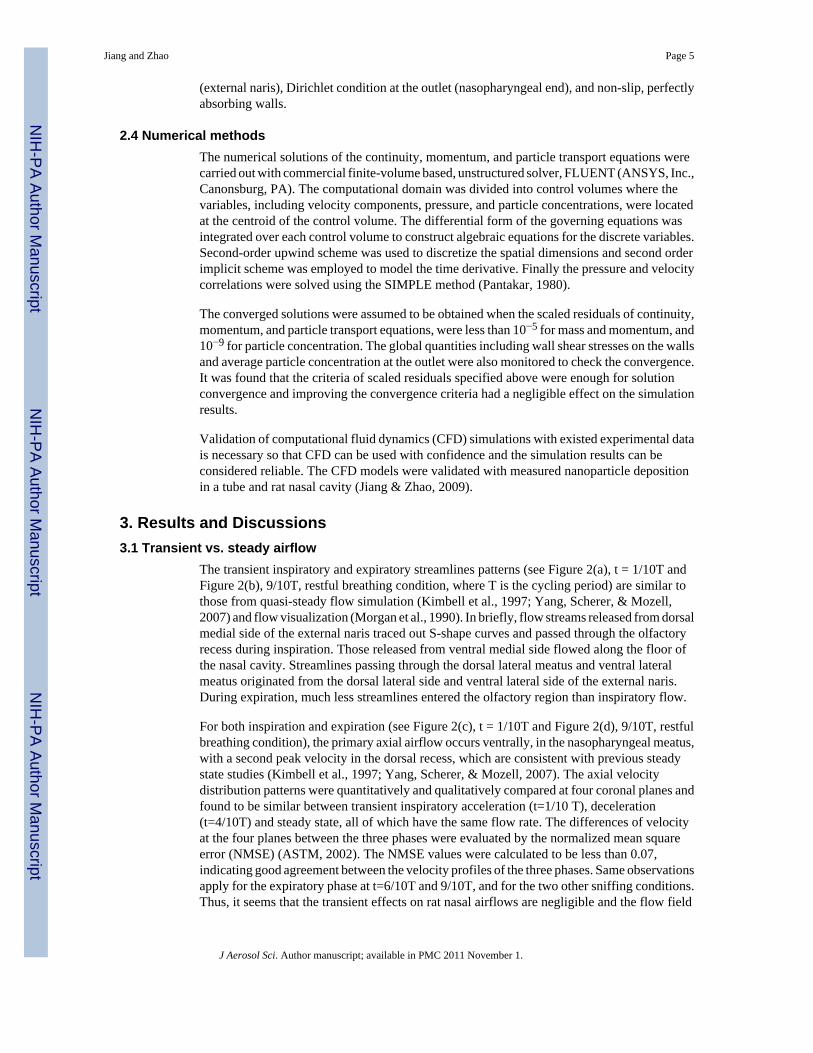
2.4 Numerical methodsThe numerical solutions of the continuity, momentum, and particle transport equations werecarried out with commercial finite-volume based, unstructured solver, FLUENT (ANSYS, Inc.,Canonsburg, PA). The computational domain was divided into control volumes where thevariables, including velocity components, pressure, and particle concentrations, were locatedat the centroid of the control volume. The differential form of the governing equations wasintegrated over each control volume to construct algebraic equations for the discrete variables.Second-order upwind scheme was used to discretize the spatial dimensions and second orderimplicit scheme was employed to model the time derivative. Finally the pressure and velocitycorrelations were solved using the SIMPLE method (Pantakar, 1980).
The converged solutions were assumed to be obtained when the scaled residuals of continuity,momentum, and particle transport equations, were less than 10−5 for mass and momentum, and10−9 for particle concentration. The global quantities including wall shear stresses on the wallsand average particle concentration at the outlet were also monitored to check the convergence.It was found that the criteria of scaled residuals specified above were enough for solutionconvergence and improving the convergence criteria had a negligible effect on the simulationresults.
Validation of computational fluid dynamics (CFD) simulations with existed experimental datais necessary so that CFD can be used with confidence and the simulation results can beconsidered reliable. The CFD models were validated with measured nanoparticle depositionin a tube and rat nasal cavity (Jiang & Zhao, 2009).
3. Results and Discussions3.1 Transient vs. steady airflow
The transient inspiratory and expiratory streamlines patterns (see Figure 2(a), t = 1/10T andFigure 2(b), 9/10T, restful breathing condition, where T is the cycling period) are similar tothose from quasi-steady flow simulation (Kimbell et al., 1997; Yang, Scherer, & Mozell,2007) and flow visualization (Morgan et al., 1990). In briefly, flow streams released from dorsalmedial side of the external naris traced out S-shape curves and passed through the olfactoryrecess during inspiration. Those released from ventral medial side flowed along the floor ofthe nasal cavity. Streamlines passing through the dorsal lateral meatus and ventral lateralmeatus originated from the dorsal lateral side and ventral lateral side of the external naris.During expiration, much less streamlines entered the olfactory region than inspiratory flow.
For both inspiration and expiration (see Figure 2(c), t = 1/10T and Figure 2(d), 9/10T, restfulbreathing condition), the primary axial airflow occurs ventrally, in the nasopharyngeal meatus,with a second peak velocity in the dorsal recess, which are consistent with previous steadystate studies (Kimbell et al., 1997; Yang, Scherer, & Mozell, 2007). The axial velocitydistribution patterns were quantitatively and qualitatively compared at four coronal planes andfound to be similar between transient inspiratory acceleration (t=1/10 T), deceleration(t=4/10T) and steady state, all of which have the same flow rate. The differences of velocityat the four planes between the three phases were evaluated by the normalized mean squareerror (NMSE) (ASTM, 2002). The NMSE values were calculated to be less than 0.07,indicating good agreement between the velocity profiles of the three phases. Same observationsapply for the expiratory phase at t=6/10T and 9/10T, and for the two other sniffing conditions.Thus, it seems that the transient effects on rat nasal airflows are negligible and the flow field
Jiang and Zhao Page 5
J Aerosol Sci. Author manuscript; available in PMC 2011 November 1.
NIH
-PA Author Manuscript
NIH
-PA Author Manuscript
NIH
-PA Author Manuscript

can be approximated as quasi-steady. However, significant differences of velocity distributionwere found between acceleration phase, deceleration phase, and steady case with equivalentflow rate near the transition between respiratory phases, for example, t=1/100T or 99/100T,indicating the non-negligible effects of flow unsteadiness.
What has not been described in details in previous literature are the secondary motion of ratnasal flows, which are induced by curvature, directional changes and rapid expansion of thenasal passages. The secondary flow would extract momentum from the primary (axial) flows,reduce primary velocity, increase the residence time of the inhaled nanoparticles, enhance thelateral mixing of the mass and momentum, and therefore, strongly affect the nanoparticledeposition in the nasal cavities. Figure 3 shows the secondary flow (indicated by arrows) forthe inspiratory acceleration (Figure 3(a), t=1/10T) and expiration deceleration (Figure 3(b),t=9/10T) during restful breathing. In the anterior part the nose (plane1), secondary flows werepredicted to move away from septum and flow into meatus during inspiration but move towardsto septum and/or flow out of meatus during expiration. In the posterior regions, where theolfactory recess is mostly located (plane 2–4), the secondary flows were found to move mainlydownwards towards the nasal floor during inspiration and upwards towards the nasal roofduring expiration. The strength of the secondary flow (SS ) is defined as the ratio of secondary
flow velocity to total velocity, , where u is the velocity component in themain (axial) flow direction, and v and w are the velocity components in the plane perpendicularto u. Figure 3 shows that SS is consistently stronger in the posterior regions than the anteriorones during both inspiration and expiration, which may affect the nanoparticle deposition inthe olfactory region. In accordance with to axial velocity distribution, secondary flow fieldsduring acceleration (t=1/10T) and deceleration (t=4/10T) are quite similar to those of steadystate flow with equivalent flow rate in the region far away from transition between respiratoryphases.
The effects of unsteadiness on the developing flows in finite length channels can be estimatedby the Womersley number W0 (Womersley, 1955) and the Strouhal number S (Schroter &Sudlow, 1969):
(5)
where R is the hydraulic diameter of the external naris, f is the cycling frequency, ν is the airkinematic viscosity, L is the axial length along the nasal cavity, and U is the average velocityduring one cycle or instantaneous velocity at the external naris. By definition, the Womersleynumber is a dimensionless ratio of the unsteady inertial forces in relation to viscous forces.Whereas, the Strouhal number, which is derived from the ratio of the steady boundary layerthickness to the Stokes layer thickness (Pedley, Schroter, & Sudlow, 1977), represents the ratioof unsteady inertial forces or local acceleration to the convective inertial forces. Quasi-steadyflow can be assumed as long as W0 is less than 4 and S is less than 1 (Isabey & Chang, 1981).For the present rat nasal airway, the values of W0 and S based on average velocity wereestimated to be 1.45, 2.64, 3.73 and 0.33, 0.53, 0.54 for restful breathing, moderate sniffingand strong sniffing, respectively. Although these values seems to meet the criteria of flowquasi-steadiness (W0 <4 and S <1), the aforementioned flow unsteadiness near the respiratorytransition indicates that Strouhal number based on average velocity can not adequatelycharacterize flow states. Instead, Strouhal number based on instantaneous velocity is moreappropriate, as shown in Figure 4, which is a Moody plot of non-dimensionalized pressuredrop versus the Reynolds number for the three unsteady respiratory conditions and steady flows
Jiang and Zhao Page 6
J Aerosol Sci. Author manuscript; available in PMC 2011 November 1.
NIH
-PA Author Manuscript
NIH
-PA Author Manuscript
NIH
-PA Author Manuscript

during inspiration (Figure 4(a)) and expiration (Figure 4(b). It is evident from Figure 4 thatunsteadiness is significant only near the transition between inspiration and expiration, andnegligible near peak flow. More specifically, the quasi-steady assumption is valid for about84%, 76%, and 72% of the cycling period for restful breathing, moderate sniffing, and strongsniffing respectively. Furthermore, Figure 4 also shows that resistance during the decelerationis lower than during the acceleration for both inspiratory and expiratory flows when theunsteady effects are significant, indicating energy dissipation during the respiratory cycle. Suchhysteresis of pressure loss has been reported in the human rhinomanometry measurements(Sullivan & Chang, 1991). Finally Figure 4 indicates that, near the transition of respiratoryphases (smaller Re number), unsteady flows during the deceleration deviate more from steadyflows than those during acceleration for both inspiration and expiration.
3.2 Transient vs. steady nanoparticle transport and depositionWe applied the same strategy to compare the nanoparticle transport and deposition at variousacceleration phases (for example, t = 1/10T and 2/10T), deceleration phases (for example, t=3/10T and 4/10T) and steady state to examine the unsteady effects. If the quasi-steadyassumption for particle transport would hold, there wouldn’t be any significant difference ineither the deposition flux or concentration field between these paired conditions, which all hasthe same flow rate. However, the differences observed (Figure 5, deposition flux of 1 nmparticles on the septal wall) are significant for t=1/10T vs. t=4/10T (Figure 5(a)), with moreparticles reaching the downstream during deceleration (t=4/10T) than that during acceleration(t=1/10T) and the steady state. The differences are likely to be resulted from temporalseparation of momentum and mass transport that more nanoparticles are inhaled into nasalcavity during the interval between t=1/10T and t=4/10T due to the higher flow rate than thatduring the interval of 0~1/10T, which results in accumulation of particles within the airstream,and subsequently higher deposition. The accumulation effect weakens near the peak ofinspiration, for example, at t=2/10T and. t=3/10T, where the particle deposition pattern andconcentration is quite similar to that of quasi steady state (Figure 5(b)). Similar effects werealso observed during the expiratory phase. Thus, the quasi-steady assumption of 1 nmnanoparticle transport in rat nasal cavity at restful breathing is only valid in the temporal periodfar away enough from the respiratory transition, in other words, near the vicinity of respirationpeaks. This is similar to flow field but the quasi-steadiness temporal period of nanoparticles isshorter, as seen from above observations. Furthermore, the quasi-steadiness period becomeseven shorter with increase of nanoparticle size and changing from restful breathing to moderateand strong sniffing. For example, when particle size increases from 1 nm to 2.78 nm for therestful breathing, or when restful breathing changes to moderate sniffing for 1 nm particles,the differences of concentration distribution between t=2/10T (or 3/10T) and steady casebecome significant. Within a even narrower temporal window, for example, t=2.3~ 2.7/10Tfor moderate sniffing for 1 nm particles, and t=2.45 ~ 2.65/10T for strong sniffing for 2.78 nmparticles, good agreement can still be found for the unsteady and equivalent steady state inconcentration field.
The validity of quasi-steadiness of nanoparticle field is also spatially dependent. For example,the concentration of 100 nm particles at the peak inspiration during strong sniffing wassignificantly different from that of steady case with equivalent flow rate in the posterior nasalregion (e.g. plane 4, see Figure 2(a) or Figure 2(b)). On the other hand, the concentrationdistributions of unsteady and steady cases in the anterior nasal region (plane 1, see Figure 2(a)or Figure 2(b)) were still similar, indicating the validity of quasi-steadiness of particle field inthis region. Furthermore, it was found that this spatial region expands from anterior towardsposterior nasal cavity with decrease of particle size. Similar trend was found when changingfrom moderate sniffing to restful breathing or from strong sniffing to moderate sniffing.
Jiang and Zhao Page 7
J Aerosol Sci. Author manuscript; available in PMC 2011 November 1.
NIH
-PA Author Manuscript
NIH
-PA Author Manuscript
NIH
-PA Author Manuscript

3.3 Transient vs. steady nasal deposition dosimetry as a function of nanoparticle size andbreathing conditions
CFD simulations were used to calculate the deposition dosimetry as a function of particles sizeand breathing rate, a further comparison of the unsteady effects. Figure 6 summarizes suchfunction for the whole nasal cavity (Figure 6(a)) and olfactory region (Figure 6(b)) for bothsteady and unsteady state. The unsteady state deposition was averaged over the inhalation cycleand the average flow rate for the given inhalation cycle was used for the steady case. Thedeposition efficiency for whole nasal cavity decreases with the increase of particle size andflow rates for both cyclic and steady cases. Particle diffusivity is reversely proportional to theparticle size so larger nanoparticles have lower deposition efficiency. Increase of breathingrates decreases the residence time of nanoparticles in the nasal cavity thus reduces theopportunities to deposit onto the wall. Thus larger deposition efficiency is found for lowerbreathing flow rate. While, the deposition efficiency for cyclic flow is lower than those forsteady case. The reduction increases with nanoparticle size and flow rate. For example,deposition efficiency in cyclic restful breathing condition of 1 nm, 10 nm, and 100 nmnanoparticles decreases about 4%, 20%, and 40%, as compared to their equivalent steady stateflow.
For deposition to the olfactory region, there exists an optimal particle size for maximumdeposition rate. The optimal size decreases with the increase of flow rate. For example, forsteady conditions, it decreases from 5 nm at restful breathing to 3 nm at strong sniffing. Theincrease of flow rate results in higher deposition efficiency before maximal deposition but thetrend is reversed after maximal deposition. Similarly, deposition efficiency for the cyclic caseis slight higher (lower) than those of steady case before (after) reaching the maximal values.The above observation can be explained by the counter-acting effects of particle diffusivity,particle concentration remaining in the airstream when entering the olfactory region, andresidence time of particles in the olfactory region. For a given flow rate, smaller nanoparticles(for example, 1 nm or 2 nm) deposit more in the anterior region than large nanoparticles (3nm, 5 nm or 100 nm) and thus less remaining in the airstream when enter the olfactory region.On the other hand, larger nanoparticles are less diffusive than smaller nanoparticles and hencehave less deposition efficiency than smaller nanoparticles. The counter-balancing effectsresulted in an optimal particle size for maximal deposition. Similarly, as the flow rate increases,less nanoparticles deposit in the anterior region and more nanoparticles remain in the airflowsentering the olfactory region; while the particle residence time in the olfactory region decreaseswith increase of flow rate. These effects combined resulted in the increase of depositionefficiency in the olfactory region for smaller nanoparticles but decreases for large ones withthe increase of flow rate. Thus, smaller optimal particle size is reached for higher flow rates.
One reason for the reduction of particle deposition efficiency during cyclic flow is the increaseof flow rate near the peak flow. Within the inspiratory cycle, the flow rate in the period betweent=0.22T and t=0.39T is higher than that steady flow rate which is about 64% of peak flow rateof cyclic flow. Using the deposition equations for steady flow (See Equation (5) in the followingtext ) and assuming that particle deposition in infinitely small time is steady, integration ofinstantaneous deposition over the inspiratory period of a cycle during moderate sniffing givesdeposition efficiency lower than steady case but higher than cyclic case (Figure 6(a)). Thisindicates that the increase of flow rate near the peak inspiration can not adequately account forthe reduction of particle deposition during cyclic flows. It should be noted that the aboveintegration assumes the instantaneous particle deposition is in the same phase with cyclic flows.
Figure 7 depicts the variation of instantaneous deposition (normalized by peak value) withparticle size and flow rate during the inspiration phase of one cycle. During restful breathingfor 1 nm nanoparticle, the position of maximum instantaneous deposition rate is very close tothat of peak inspiration (t=T/4). With increase of particle size and/or change of respiratory
Jiang and Zhao Page 8
J Aerosol Sci. Author manuscript; available in PMC 2011 November 1.
NIH
-PA Author Manuscript
NIH
-PA Author Manuscript
NIH
-PA Author Manuscript
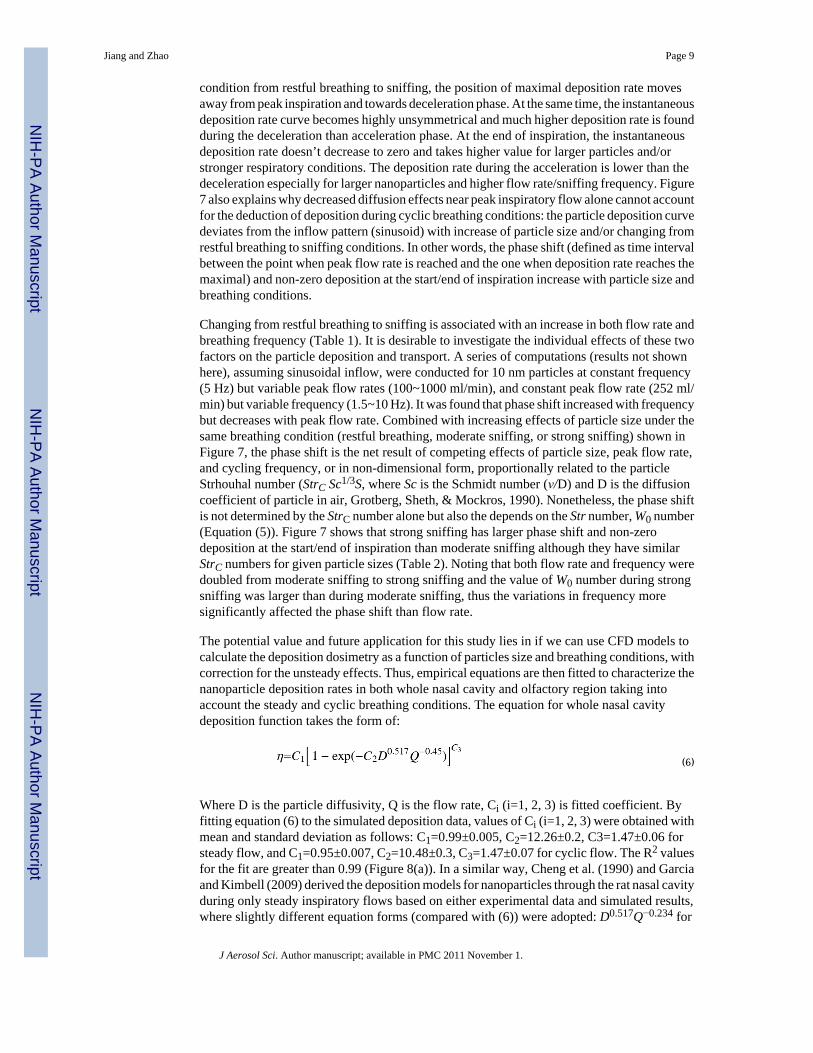
condition from restful breathing to sniffing, the position of maximal deposition rate movesaway from peak inspiration and towards deceleration phase. At the same time, the instantaneousdeposition rate curve becomes highly unsymmetrical and much higher deposition rate is foundduring the deceleration than acceleration phase. At the end of inspiration, the instantaneousdeposition rate doesn’t decrease to zero and takes higher value for larger particles and/orstronger respiratory conditions. The deposition rate during the acceleration is lower than thedeceleration especially for larger nanoparticles and higher flow rate/sniffing frequency. Figure7 also explains why decreased diffusion effects near peak inspiratory flow alone cannot accountfor the deduction of deposition during cyclic breathing conditions: the particle deposition curvedeviates from the inflow pattern (sinusoid) with increase of particle size and/or changing fromrestful breathing to sniffing conditions. In other words, the phase shift (defined as time intervalbetween the point when peak flow rate is reached and the one when deposition rate reaches themaximal) and non-zero deposition at the start/end of inspiration increase with particle size andbreathing conditions.
Changing from restful breathing to sniffing is associated with an increase in both flow rate andbreathing frequency (Table 1). It is desirable to investigate the individual effects of these twofactors on the particle deposition and transport. A series of computations (results not shownhere), assuming sinusoidal inflow, were conducted for 10 nm particles at constant frequency(5 Hz) but variable peak flow rates (100~1000 ml/min), and constant peak flow rate (252 ml/min) but variable frequency (1.5~10 Hz). It was found that phase shift increased with frequencybut decreases with peak flow rate. Combined with increasing effects of particle size under thesame breathing condition (restful breathing, moderate sniffing, or strong sniffing) shown inFigure 7, the phase shift is the net result of competing effects of particle size, peak flow rate,and cycling frequency, or in non-dimensional form, proportionally related to the particleStrhouhal number (StrC Sc1/3S, where Sc is the Schmidt number (ν/D) and D is the diffusioncoefficient of particle in air, Grotberg, Sheth, & Mockros, 1990). Nonetheless, the phase shiftis not determined by the StrC number alone but also the depends on the Str number, W0 number(Equation (5)). Figure 7 shows that strong sniffing has larger phase shift and non-zerodeposition at the start/end of inspiration than moderate sniffing although they have similarStrC numbers for given particle sizes (Table 2). Noting that both flow rate and frequency weredoubled from moderate sniffing to strong sniffing and the value of W0 number during strongsniffing was larger than during moderate sniffing, thus the variations in frequency moresignificantly affected the phase shift than flow rate.
The potential value and future application for this study lies in if we can use CFD models tocalculate the deposition dosimetry as a function of particles size and breathing conditions, withcorrection for the unsteady effects. Thus, empirical equations are then fitted to characterize thenanoparticle deposition rates in both whole nasal cavity and olfactory region taking intoaccount the steady and cyclic breathing conditions. The equation for whole nasal cavitydeposition function takes the form of:
(6)
Where D is the particle diffusivity, Q is the flow rate, Ci (i=1, 2, 3) is fitted coefficient. Byfitting equation (6) to the simulated deposition data, values of Ci (i=1, 2, 3) were obtained withmean and standard deviation as follows: C1=0.99±0.005, C2=12.26±0.2, C3=1.47±0.06 forsteady flow, and C1=0.95±0.007, C2=10.48±0.3, C3=1.47±0.07 for cyclic flow. The R2 valuesfor the fit are greater than 0.99 (Figure 8(a)). In a similar way, Cheng et al. (1990) and Garciaand Kimbell (2009) derived the deposition models for nanoparticles through the rat nasal cavityduring only steady inspiratory flows based on either experimental data and simulated results,where slightly different equation forms (compared with (6)) were adopted: D0.517Q−0.234 for
Jiang and Zhao Page 9
J Aerosol Sci. Author manuscript; available in PMC 2011 November 1.
NIH
-PA Author Manuscript
NIH
-PA Author Manuscript
NIH
-PA Author Manuscript
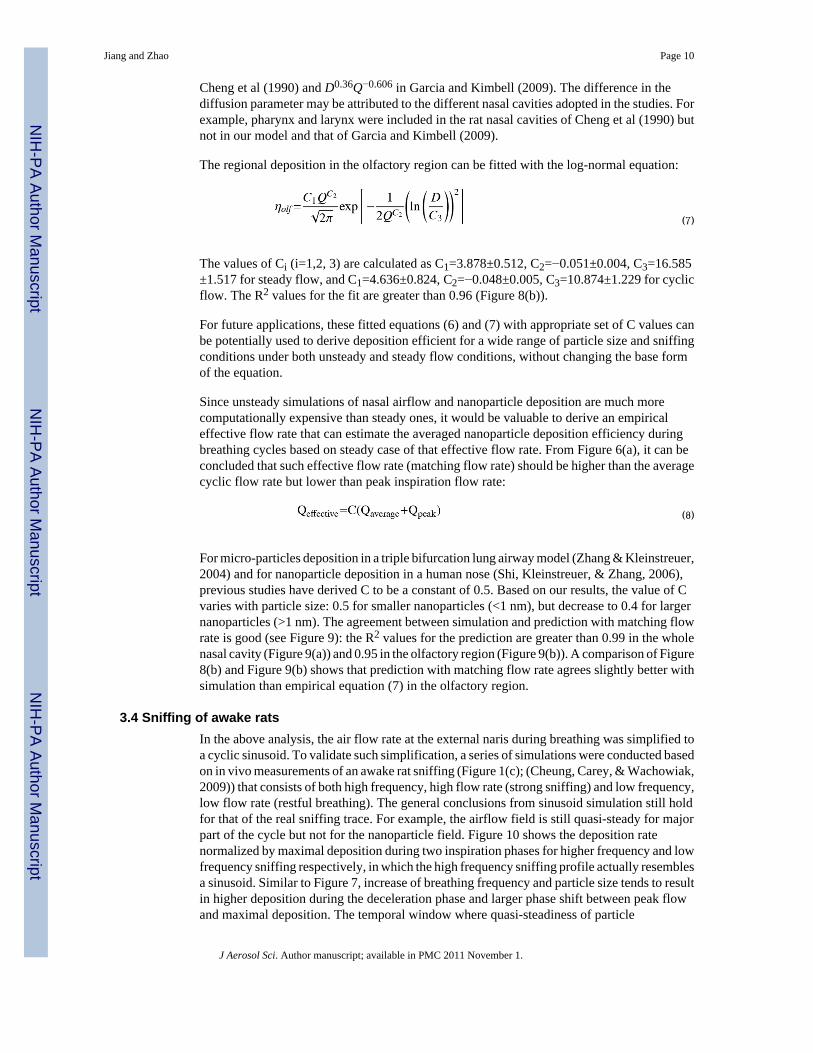
Cheng et al (1990) and D0.36Q−0.606 in Garcia and Kimbell (2009). The difference in thediffusion parameter may be attributed to the different nasal cavities adopted in the studies. Forexample, pharynx and larynx were included in the rat nasal cavities of Cheng et al (1990) butnot in our model and that of Garcia and Kimbell (2009).
The regional deposition in the olfactory region can be fitted with the log-normal equation:
(7)
The values of Ci (i=1,2, 3) are calculated as C1=3.878±0.512, C2=−0.051±0.004, C3=16.585±1.517 for steady flow, and C1=4.636±0.824, C2=−0.048±0.005, C3=10.874±1.229 for cyclicflow. The R2 values for the fit are greater than 0.96 (Figure 8(b)).
For future applications, these fitted equations (6) and (7) with appropriate set of C values canbe potentially used to derive deposition efficient for a wide range of particle size and sniffingconditions under both unsteady and steady flow conditions, without changing the base formof the equation.
Since unsteady simulations of nasal airflow and nanoparticle deposition are much morecomputationally expensive than steady ones, it would be valuable to derive an empiricaleffective flow rate that can estimate the averaged nanoparticle deposition efficiency duringbreathing cycles based on steady case of that effective flow rate. From Figure 6(a), it can beconcluded that such effective flow rate (matching flow rate) should be higher than the averagecyclic flow rate but lower than peak inspiration flow rate:
(8)
For micro-particles deposition in a triple bifurcation lung airway model (Zhang & Kleinstreuer,2004) and for nanoparticle deposition in a human nose (Shi, Kleinstreuer, & Zhang, 2006),previous studies have derived C to be a constant of 0.5. Based on our results, the value of Cvaries with particle size: 0.5 for smaller nanoparticles (<1 nm), but decrease to 0.4 for largernanoparticles (>1 nm). The agreement between simulation and prediction with matching flowrate is good (see Figure 9): the R2 values for the prediction are greater than 0.99 in the wholenasal cavity (Figure 9(a)) and 0.95 in the olfactory region (Figure 9(b)). A comparison of Figure8(b) and Figure 9(b) shows that prediction with matching flow rate agrees slightly better withsimulation than empirical equation (7) in the olfactory region.
3.4 Sniffing of awake ratsIn the above analysis, the air flow rate at the external naris during breathing was simplified toa cyclic sinusoid. To validate such simplification, a series of simulations were conducted basedon in vivo measurements of an awake rat sniffing (Figure 1(c); (Cheung, Carey, & Wachowiak,2009)) that consists of both high frequency, high flow rate (strong sniffing) and low frequency,low flow rate (restful breathing). The general conclusions from sinusoid simulation still holdfor that of the real sniffing trace. For example, the airflow field is still quasi-steady for majorpart of the cycle but not for the nanoparticle field. Figure 10 shows the deposition ratenormalized by maximal deposition during two inspiration phases for higher frequency and lowfrequency sniffing respectively, in which the high frequency sniffing profile actually resemblesa sinusoid. Similar to Figure 7, increase of breathing frequency and particle size tends to resultin higher deposition during the deceleration phase and larger phase shift between peak flowand maximal deposition. The temporal window where quasi-steadiness of particle
Jiang and Zhao Page 10
J Aerosol Sci. Author manuscript; available in PMC 2011 November 1.
NIH
-PA Author Manuscript
NIH
-PA Author Manuscript
NIH
-PA Author Manuscript
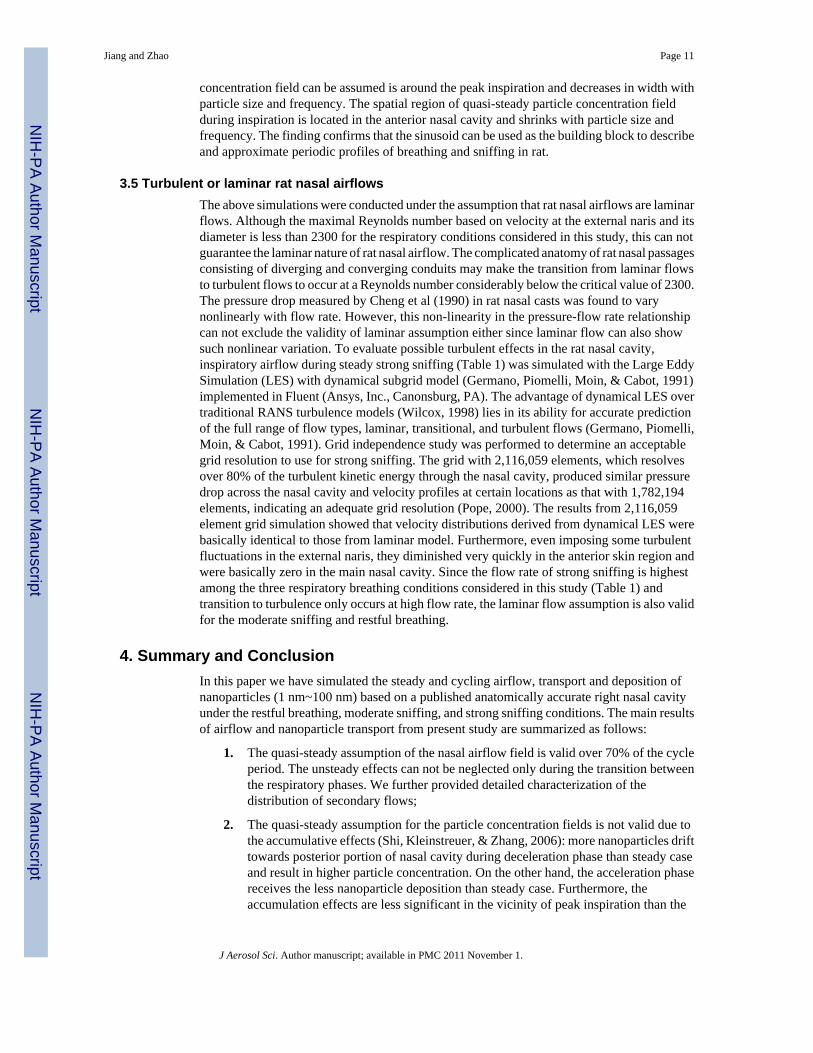
concentration field can be assumed is around the peak inspiration and decreases in width withparticle size and frequency. The spatial region of quasi-steady particle concentration fieldduring inspiration is located in the anterior nasal cavity and shrinks with particle size andfrequency. The finding confirms that the sinusoid can be used as the building block to describeand approximate periodic profiles of breathing and sniffing in rat.
3.5 Turbulent or laminar rat nasal airflowsThe above simulations were conducted under the assumption that rat nasal airflows are laminarflows. Although the maximal Reynolds number based on velocity at the external naris and itsdiameter is less than 2300 for the respiratory conditions considered in this study, this can notguarantee the laminar nature of rat nasal airflow. The complicated anatomy of rat nasal passagesconsisting of diverging and converging conduits may make the transition from laminar flowsto turbulent flows to occur at a Reynolds number considerably below the critical value of 2300.The pressure drop measured by Cheng et al (1990) in rat nasal casts was found to varynonlinearly with flow rate. However, this non-linearity in the pressure-flow rate relationshipcan not exclude the validity of laminar assumption either since laminar flow can also showsuch nonlinear variation. To evaluate possible turbulent effects in the rat nasal cavity,inspiratory airflow during steady strong sniffing (Table 1) was simulated with the Large EddySimulation (LES) with dynamical subgrid model (Germano, Piomelli, Moin, & Cabot, 1991)implemented in Fluent (Ansys, Inc., Canonsburg, PA). The advantage of dynamical LES overtraditional RANS turbulence models (Wilcox, 1998) lies in its ability for accurate predictionof the full range of flow types, laminar, transitional, and turbulent flows (Germano, Piomelli,Moin, & Cabot, 1991). Grid independence study was performed to determine an acceptablegrid resolution to use for strong sniffing. The grid with 2,116,059 elements, which resolvesover 80% of the turbulent kinetic energy through the nasal cavity, produced similar pressuredrop across the nasal cavity and velocity profiles at certain locations as that with 1,782,194elements, indicating an adequate grid resolution (Pope, 2000). The results from 2,116,059element grid simulation showed that velocity distributions derived from dynamical LES werebasically identical to those from laminar model. Furthermore, even imposing some turbulentfluctuations in the external naris, they diminished very quickly in the anterior skin region andwere basically zero in the main nasal cavity. Since the flow rate of strong sniffing is highestamong the three respiratory breathing conditions considered in this study (Table 1) andtransition to turbulence only occurs at high flow rate, the laminar flow assumption is also validfor the moderate sniffing and restful breathing.
4. Summary and ConclusionIn this paper we have simulated the steady and cycling airflow, transport and deposition ofnanoparticles (1 nm~100 nm) based on a published anatomically accurate right nasal cavityunder the restful breathing, moderate sniffing, and strong sniffing conditions. The main resultsof airflow and nanoparticle transport from present study are summarized as follows:
1. The quasi-steady assumption of the nasal airflow field is valid over 70% of the cycleperiod. The unsteady effects can not be neglected only during the transition betweenthe respiratory phases. We further provided detailed characterization of thedistribution of secondary flows;
2. The quasi-steady assumption for the particle concentration fields is not valid due tothe accumulative effects (Shi, Kleinstreuer, & Zhang, 2006): more nanoparticles drifttowards posterior portion of nasal cavity during deceleration phase than steady caseand result in higher particle concentration. On the other hand, the acceleration phasereceives the less nanoparticle deposition than steady case. Furthermore, theaccumulation effects are less significant in the vicinity of peak inspiration than the
Jiang and Zhao Page 11
J Aerosol Sci. Author manuscript; available in PMC 2011 November 1.
NIH
-PA Author Manuscript
NIH
-PA Author Manuscript
NIH
-PA Author Manuscript
regions near the transition between inhalation, and less significant in anterior thanposterior of nasal cavity during inspiration;
3. For both steady state and cyclic flows, total deposition efficiencies of nanoparticlesin the whole nasal cavity decrease with increase of particle size and flow rate, andthere exists one optimal nanoparticle size where maximal deposition efficiency in theolfactory region is reached. However, the total deposition efficiency during cyclicflows is lower than those of steady flows. In contrast, it has been reported that thetotal deposition efficiency of micro-scale particles increases due to the transient effect(Kelly, Kimbell, & Asgharian, 2001);
4. The quasi-steady assumption for the particle concentration fields should be used withcaution. The spatial and temporal regions where this assumption is valid depend onparticle size, flow rate, and breathing frequency, and thus on the particle Strouhalnumber ( StrC ). More specifically, the temporal region is limited in the vicinity ofpeak inspiration and decreases towards peak inspiration with increase of particle sizeand changing from restful breathing to sniffing. The spatial region occupiesapproximately the whole nasal cavity for tiny nanoparticle such as 1 nm particles butdecrease towards anterior region during inspiration with increase of particle size andchanging from restful breathing to sniffing;
5. We have suggested two ways to simplify the estimation of unsteady effect on thedeposition and transport of nanoparticles in the whole nasal cavity and olfactoryregion, either using the empirical equations (see equations (6) and (7)) or using thesteady state effective flow rate (see equation (8)) if the user have some computationalcapability, which seems to provide more accurate prediction in the olfactory regionthan the empirical equations;
6. We showed that rat nasal airflow is basically laminar flow under the breathingconditions considered in this study by using the Large Eddy Simulation with dynamicsubgrid model (Germano, Piomelli, Moin, & Cabot, 1991). Further experiments areneeded to verify this conclusion. Finally, limitations of the present study should bementioned. All the simulations assumed the perfect absorption of particle on the walland did not take into account the mucus movement. Another limitation of this studyis that only nanoparticle was considered. Recent experimental studies of largerparticles (>1μm) showed the significant effects of breathing pattern on the particledeposition in the rat nasal cavity (Kelly, Kimbell, & Asgharian, 2001). These remainto be included in future studies.
AcknowledgmentsWe thank Dr. Matt Wachowiak at the Department of Biology, Boston University, for providing the in vivo awake ratsniffing trace recoding, and Dr. Scherer at the Department of Bioengineering, University of Pennsylvania, fordiscussion.
ReferencesASTM. Annual Book of American Society for Testing Materials Standards. American Society for Testing
Materials; West Conshohocken: 2002. Standard guide for statistical evaluation of indoor air qualitymodels (D5157-97); p. 23-34.
Balásházy I, Hofmann W, Heistracher T. Local particle deposition patterns may play a key role in thedevelopment of lung cancer. Journal of Applied Physiology 2003;94:1719–1725. [PubMed:12533493]
Cheng YS, Hansen GK, Su YF, Yeh HC, Morgan KT. Deposition of ultrafine aerosols in rat nasal molds.Toxicology and Applied Pharmacology 1990;106:222–233. [PubMed: 2256113]
Jiang and Zhao Page 12
J Aerosol Sci. Author manuscript; available in PMC 2011 November 1.
NIH
-PA Author Manuscript
NIH
-PA Author Manuscript
NIH
-PA Author Manuscript

Cheung MC, Carey RM, Wachowiak M. A Method for Generating Natural and User-Defined SniffingPatterns in Anesthetized or Reduced Preparations. Chemical Senses 2009;34:63–76. [PubMed:18791186]
Clift, R.; Grace, JR.; Weber, ME. Bubble, Drops and Particles. Academic Press; New York: 1978.Garcia GJM, Kimbell JS. Deposition of inhaled nanoparticles in the rat nasal passages: Dose to the
olfactory region. Inhalation Toxicology 2009;21:1165–1175. [PubMed: 19831956]Gerde P, Cheng YS, Medinsky MA. Invivo deposition of ultrafine aerosols in the nasal airway of the rat.
Fundamental and Applied Toxicology 1991;16:330–336. [PubMed: 2055363]Germano M, Piomelli U, Moin P, Cabot WH. A dynamic subgrid-scale eddy viscosity model. Physics
of Fluids 1991;3:1760–1765.Grotberg JB, Sheth BV, Mockros LF. An analysis of pollutant gas-transport and absorption in pulmonary
airways. Journal of Biomechanical Engineering-Transactions of the ASME 1990;112:168–176.Illum L. Nasal drug delivery: new developments and strategies. Drug Discovery Today 2002;7:1184–
1189. [PubMed: 12547019]Isabey D, Chang HK. Steady and unsteady pressure-flow relationships in central airways. Journal of
Applied Physiology 1981;51:1338–1348. [PubMed: 7298472]Jiang, JB.; Zhao, K. Deposition of inhaled particles in the olfactory region in rat and human nasal cavities
during breathing. 31th Annual Meeting of Association for Chemoreception Sciences (AChemS);Sarasota, Florida, USA. April 22–26; 2009.
Kelly JT, Bobbitt CM, Asgharian B. In vivo measurement of fine and coarse aerosol deposition in thenasal airways of female Long-Evans rats. Toxicological Sciences 2001a;64:253–258. [PubMed:11719708]
Kelly JT, Kimbell JS, Asgharian B. Deposition of fine and coarse aerosols in a rat nasal mold. InhalationToxicology 2001b;13:577–588. [PubMed: 11452355]
Kimbell JS, Godo MN, Gross EA, Joyner DR, Richardson RB, Morgan KT. Computer simulation ofinspiratory airflow in all regions of the F344 rat nasal passages. Toxicology and AppliedPharmacology 1997;145:388–398. [PubMed: 9266813]
Lieber BB, Zhao Y. Oscillatory flow in a symmetric bifurcation airway model. Annals of BiomedicalEngineering 1998;26:821–830. [PubMed: 9779955]
Martonen TB, Yang Y. Simulation of aerosol deposition in extrathoracic and laryngeal passages of thelaboratory rat. Journal of Aerosol Science 1993;24:103–113.
Mathison S, Nagilla R, Kompella UB. Nasal route for direct delivery of solutes to the central nervoussystem: Fact or fiction? Journal of Drug Targeting 1998;5:415–441. [PubMed: 9783675]
Minard KR, Einstein DR, Jacob RE, Kabilan S, Kuprat AP, Timchalk CA, Trease LL, Corley RA.Application of magnetic resonance (MR) imaging for the development and validation ofcomputational fluid dynamic (CFD) models of the rat respiratory system. Inhalation Toxicology2006;18:787–794. [PubMed: 16774868]
Morgan KT, Kimbell JS, Monticello TM, Patra AL, Fleishman A. Studies of inspiratory air-flow patternsin the nasal passages of the f344 rat and rhesus-monkey using nasal molds - relevance to formaldehydetoxicity. Toxicology and Applied Pharmacology 1991;110:223–240. [PubMed: 1891770]
Oberdorster G, Sharp Z, Atudorei V, Elder A, Gelein R, Kreyling W, Cox C. Translocation of inhaledultrafine particles to the brain. Inhalation Toxicology 2004;16:437–445. [PubMed: 15204759]
Pantakar, V. Numerical heat transfer and fluid flow. McGraw-Hill; New York: 1980.Pedley, TJ.; Schroter, RC.; Sudlow, MF. Gas Flow and Mixing in the Airway. In: West, JB., editor.
Bioengineering Aspects of the Lung. Marcel Dekker; New York: 1977. p. 163-265.Pope, SB. Turbulent Flows. Cambridge University Press; Cambridge, England: 2000.Schroter RC, Sudlow MF. Flow patterns in models of human bronchial airways. Respiration Physiology
1969;7:341–355. [PubMed: 5823844]Scott JW, Acevedo HP, Sherrill L, Phan M. Responses of the rat olfactory epithelium to retronasal air
flow. Journal of Neurophysiology 2007;97:1941–1950. [PubMed: 17215498]Shi H, Kleinstreuer C, Zhang Z. Laminar airflow and nanoparticle or vapor deposition in a human nasal
cavity model. Journal of Biomechanical Engineering-Transactions of the ASME 2006;128:697–706.
Jiang and Zhao Page 13
J Aerosol Sci. Author manuscript; available in PMC 2011 November 1.
NIH
-PA Author Manuscript
NIH
-PA Author Manuscript
NIH
-PA Author Manuscript

Sullivan KJ, Chang HK. Steady and oscillatory transnasal pressure-flow relationships in healthy-adults.Journal of Applied Physiology 1991;71:983–992. [PubMed: 1757337]
Wilcox, DC. Turbulence modeling for CFD. DCW Industries Inc; La Canada, CA: 1998.Wolff RK, Kanapilly GM, Gray RH, McClellan RO. Deposition and retention of inhaled aggregate
(ga203)-ga-67 particles in beagle dogs, fischer-344 rats, and cd-1 mice. American Industrial HygieneAssociation Journal 1984;45:377–381. [PubMed: 6741792]
Womersley JR. Method for the calculation of velocity, rate of flow and viscous drag in arteries when thepressure gradient is known. Journal of Physiology-London 1955;127:553–563.
Yang GC, Scherer PW, Mozell MM. Modeling inspiratory and expiratory steady-state velocity fields inthe Sprague-Dawley rat nasal cavity. Chemical Senses 2007;32:215–223. [PubMed: 17220519]
Yang GC, Scherer PW, Zhao K, Mozell MM. Numerical modeling of odorant uptake in the rat nasalcavity. Chemical Senses 2007;32:273–284. [PubMed: 17220517]
Youngentob SL, Mozell MM, Sheehe PR, Hornung DE. A quantitative-analysis of sniffing strategies inrats performing odor detection tasks. Physiology & Behavior 1987;41:59–69. [PubMed: 3685154]
Zhang Z, Kleinstreuer C. Airflow structures and nano-particle deposition in a human upper airway model.Journal of Computational Physics 2004;198:178–210.
Zhao K, Dalton P, Yang GC, Scherer PW. Numerical modeling of turbulent and laminar airflow andodorant transport during sniffing in the human and rat nose. Chemical Senses 2006;31:107–118.[PubMed: 16354744]
Jiang and Zhao Page 14
J Aerosol Sci. Author manuscript; available in PMC 2011 November 1.
NIH
-PA Author Manuscript
NIH
-PA Author Manuscript
NIH
-PA Author Manuscript
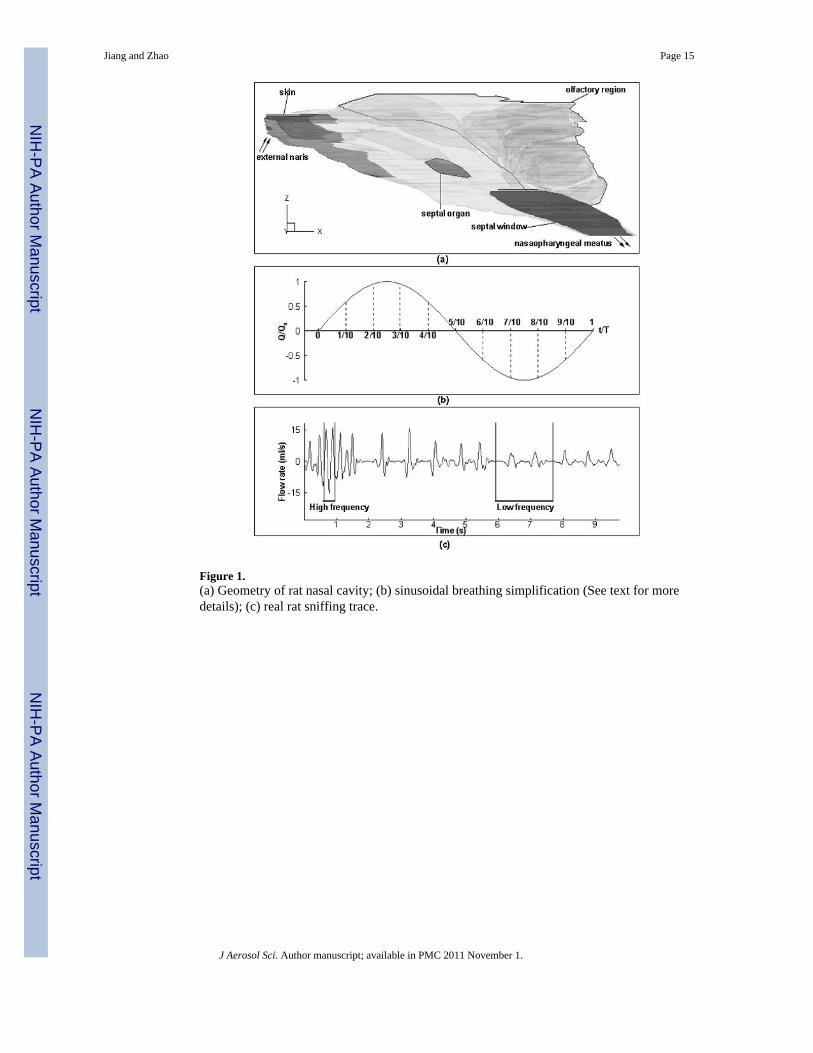
Figure 1.(a) Geometry of rat nasal cavity; (b) sinusoidal breathing simplification (See text for moredetails); (c) real rat sniffing trace.
Jiang and Zhao Page 15
J Aerosol Sci. Author manuscript; available in PMC 2011 November 1.
NIH
-PA Author Manuscript
NIH
-PA Author Manuscript
NIH
-PA Author Manuscript
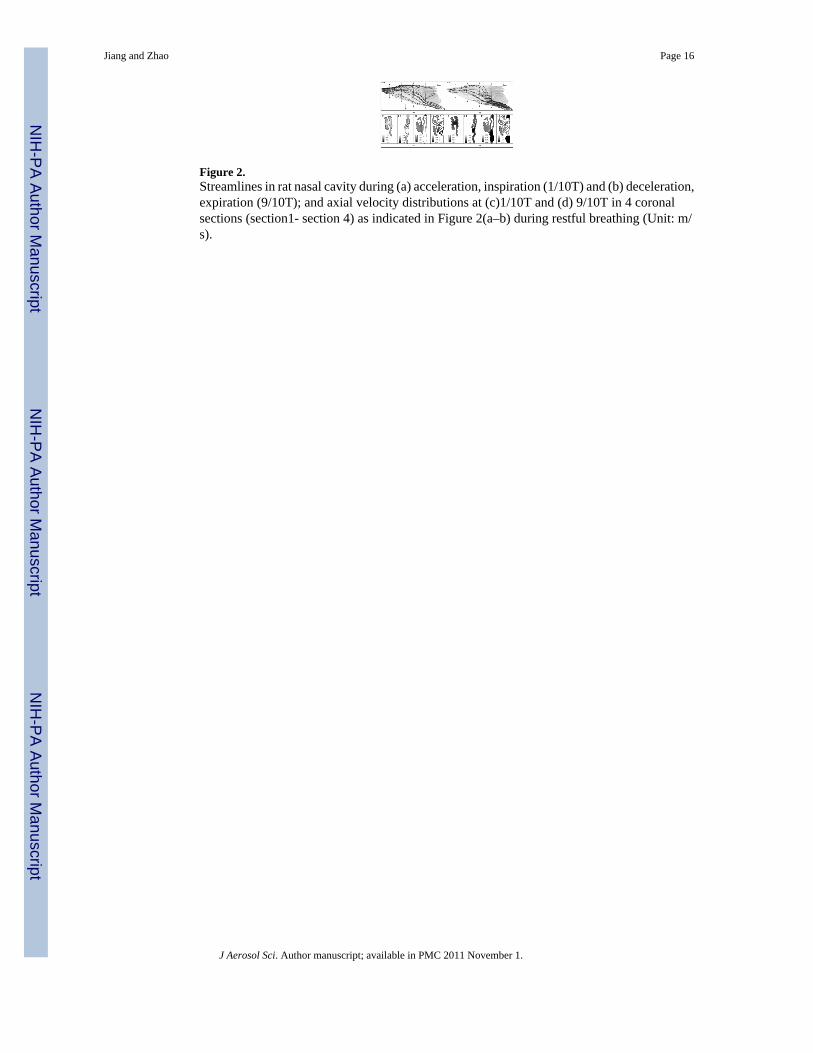
Figure 2.Streamlines in rat nasal cavity during (a) acceleration, inspiration (1/10T) and (b) deceleration,expiration (9/10T); and axial velocity distributions at (c)1/10T and (d) 9/10T in 4 coronalsections (section1- section 4) as indicated in Figure 2(a–b) during restful breathing (Unit: m/s).
Jiang and Zhao Page 16
J Aerosol Sci. Author manuscript; available in PMC 2011 November 1.
NIH
-PA Author Manuscript
NIH
-PA Author Manuscript
NIH
-PA Author Manuscript
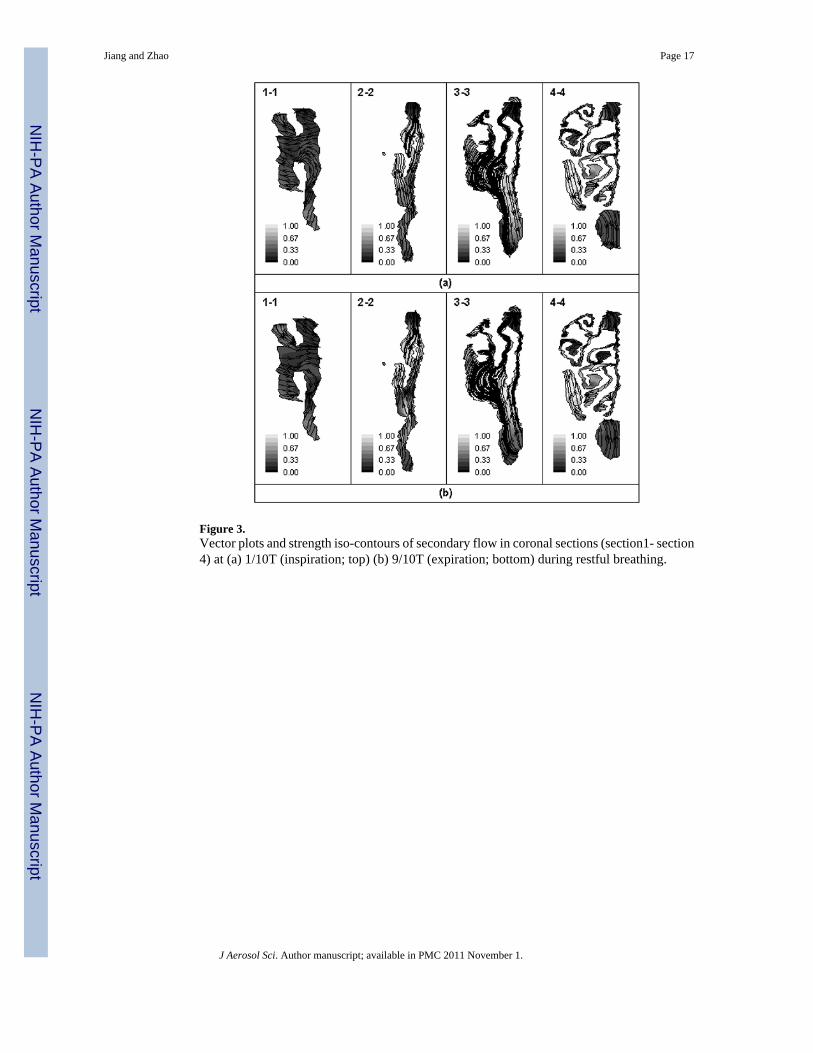
Figure 3.Vector plots and strength iso-contours of secondary flow in coronal sections (section1- section4) at (a) 1/10T (inspiration; top) (b) 9/10T (expiration; bottom) during restful breathing.
Jiang and Zhao Page 17
J Aerosol Sci. Author manuscript; available in PMC 2011 November 1.
NIH
-PA Author Manuscript
NIH
-PA Author Manuscript
NIH
-PA Author Manuscript
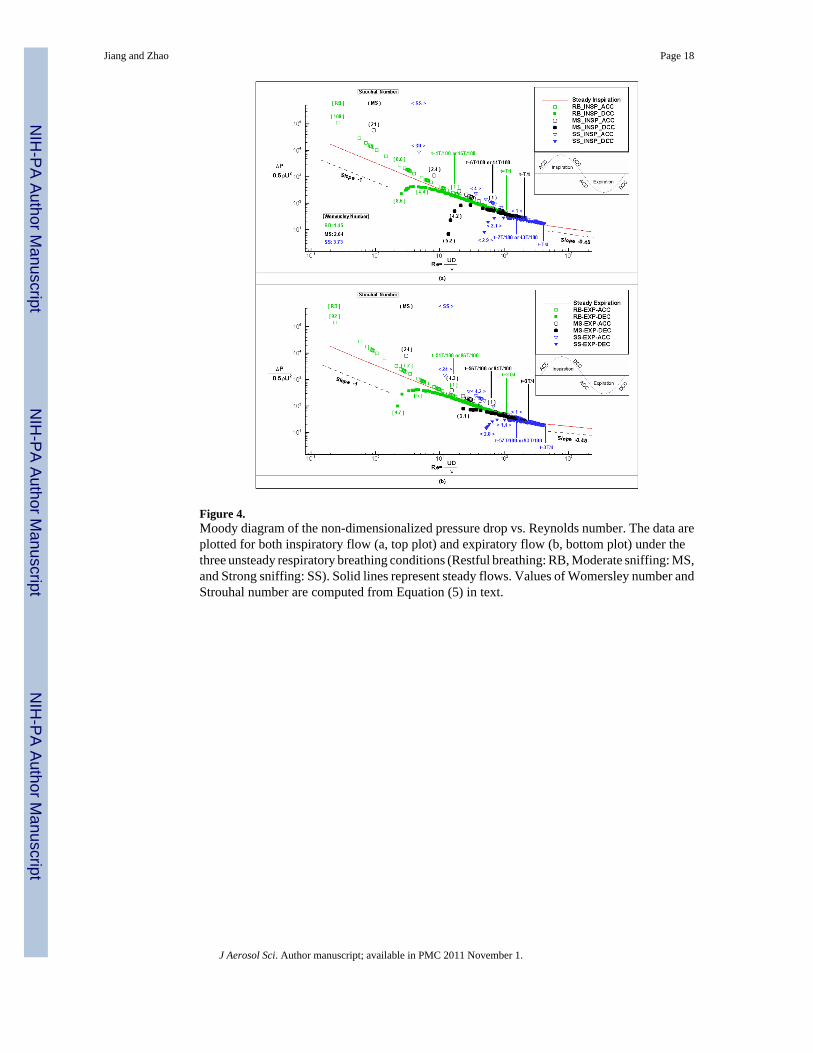
Figure 4.Moody diagram of the non-dimensionalized pressure drop vs. Reynolds number. The data areplotted for both inspiratory flow (a, top plot) and expiratory flow (b, bottom plot) under thethree unsteady respiratory breathing conditions (Restful breathing: RB, Moderate sniffing: MS,and Strong sniffing: SS). Solid lines represent steady flows. Values of Womersley number andStrouhal number are computed from Equation (5) in text.
Jiang and Zhao Page 18
J Aerosol Sci. Author manuscript; available in PMC 2011 November 1.
NIH
-PA Author Manuscript
NIH
-PA Author Manuscript
NIH
-PA Author Manuscript
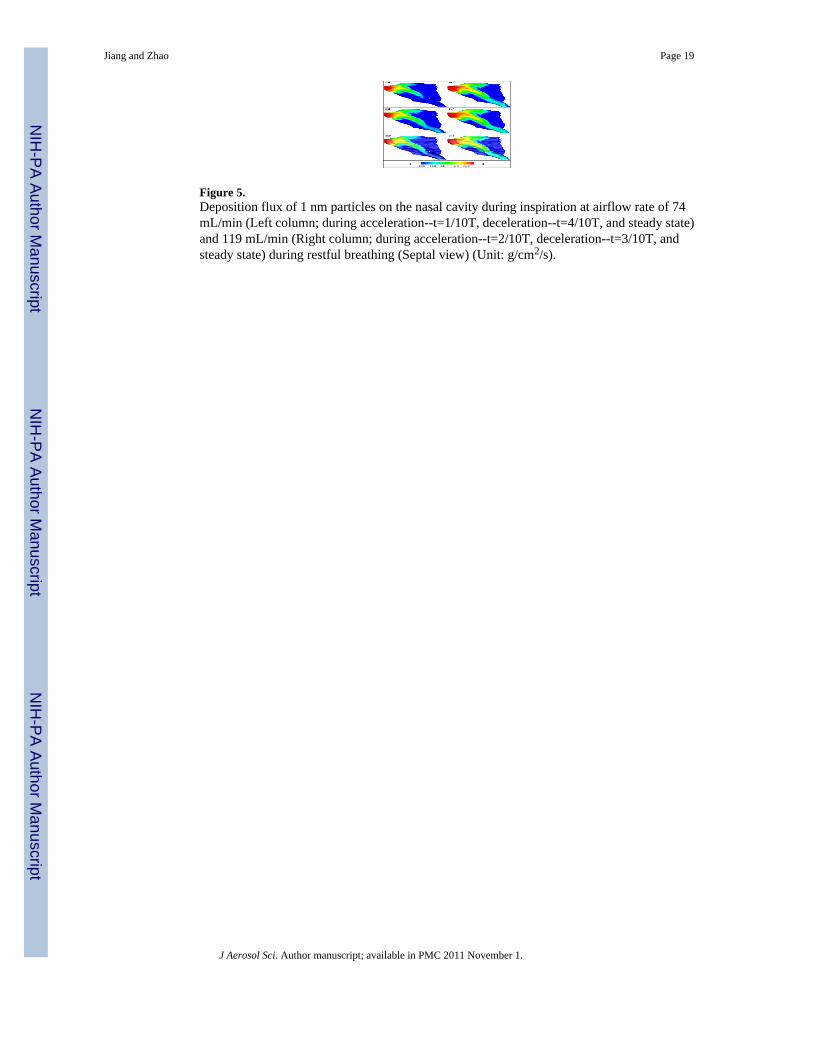
Figure 5.Deposition flux of 1 nm particles on the nasal cavity during inspiration at airflow rate of 74mL/min (Left column; during acceleration--t=1/10T, deceleration--t=4/10T, and steady state)and 119 mL/min (Right column; during acceleration--t=2/10T, deceleration--t=3/10T, andsteady state) during restful breathing (Septal view) (Unit: g/cm2/s).
Jiang and Zhao Page 19
J Aerosol Sci. Author manuscript; available in PMC 2011 November 1.
NIH
-PA Author Manuscript
NIH
-PA Author Manuscript
NIH
-PA Author Manuscript

Figure 6.Comparison the total deposition efficiency between transient and equivalent steady case in thewhole nasal cavity (a, left) and Olfactory region (b, right).
Jiang and Zhao Page 20
J Aerosol Sci. Author manuscript; available in PMC 2011 November 1.
NIH
-PA Author Manuscript
NIH
-PA Author Manuscript
NIH
-PA Author Manuscript

Figure 7.Normalized depositions during inspiration phase in one cycle.
Jiang and Zhao Page 21
J Aerosol Sci. Author manuscript; available in PMC 2011 November 1.
NIH
-PA Author Manuscript
NIH
-PA Author Manuscript
NIH
-PA Author Manuscript

Figure 8.Comparisons of nanoparticle deposition efficiency in the whole nasal cavity (a, left) andolfactory region (b, right) under cyclic breathing conditions and those with fitted equations (6)and (7) respectively.
Jiang and Zhao Page 22
J Aerosol Sci. Author manuscript; available in PMC 2011 November 1.
NIH
-PA Author Manuscript
NIH
-PA Author Manuscript
NIH
-PA Author Manuscript
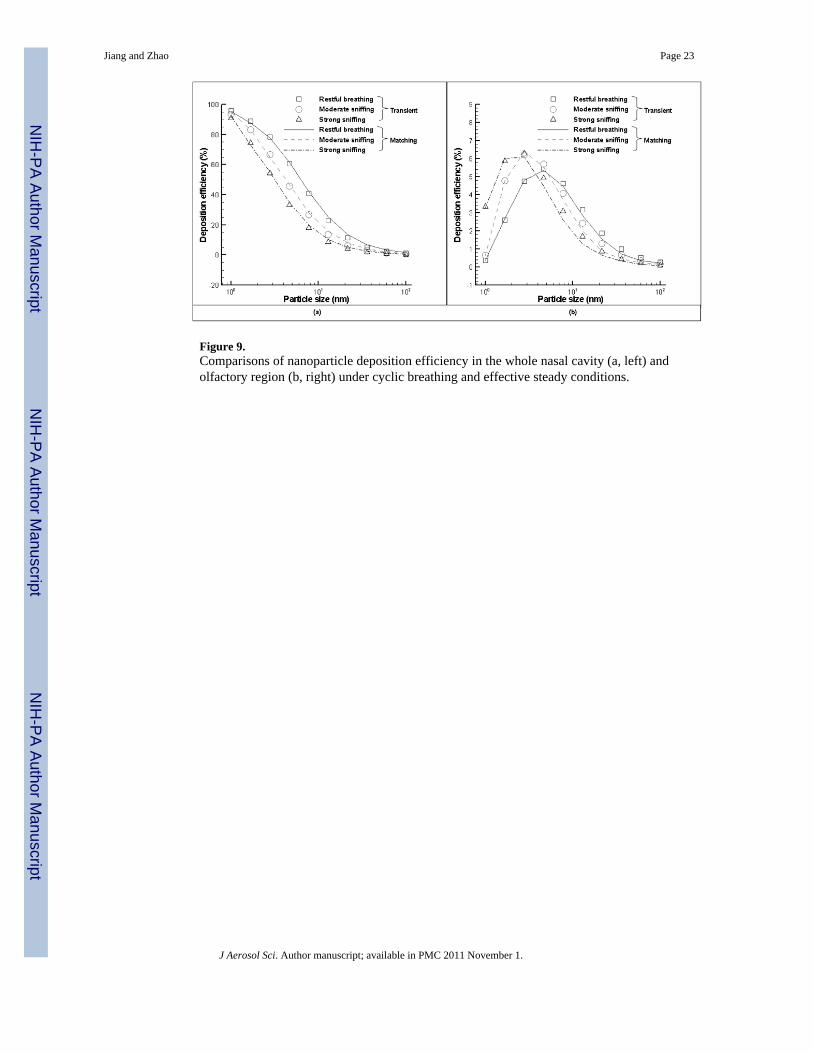
Figure 9.Comparisons of nanoparticle deposition efficiency in the whole nasal cavity (a, left) andolfactory region (b, right) under cyclic breathing and effective steady conditions.
Jiang and Zhao Page 23
J Aerosol Sci. Author manuscript; available in PMC 2011 November 1.
NIH
-PA Author Manuscript
NIH
-PA Author Manuscript
NIH
-PA Author Manuscript

Figure 10.Normalized depositions during inspiration phase for the real sniffing trace.
Jiang and Zhao Page 24
J Aerosol Sci. Author manuscript; available in PMC 2011 November 1.
NIH
-PA Author Manuscript
NIH
-PA Author Manuscript
NIH
-PA Author Manuscript
NIH
-PA Author Manuscript
NIH
-PA Author Manuscript
NIH
-PA Author Manuscript
Jiang and Zhao Page 25
Tabl
e 1
Flow
par
amet
ers.
Not
e th
at th
e va
lues
of s
tead
y ai
rflo
w ra
te a
re th
e vo
lum
etric
ave
rage
flow
rate
s of c
orre
spon
ding
cyc
lic b
reat
hing
pat
tern
s.
Sinu
soid
Rea
l tra
ce
Res
tful B
reat
hing
Mod
erat
e Sn
iffin
gSt
rong
Sni
ffing
Low
Fre
quen
cyH
igh
Freq
uenc
y
Stea
dyQ
=80
(ml/m
in)
Q=1
60 (m
l/min
)Q
=321
(ml/m
in)
––
Cyc
licQ
0 =12
6 (m
l/min
), f 0
=1.5
(Hz)
Q0 =
252
(ml/m
in),
f 0 =5
(Hz)
Q0 =
504
(ml/m
in),
f 0 =1
0 (H
z)Q
0 =22
9 (m
l/min
), f 0
=2.8
5 (H
z)Q
0 =91
4 (m
l/min
), f 0
=5 (H
z)
J Aerosol Sci. Author manuscript; available in PMC 2011 November 1.

NIH
-PA Author Manuscript
NIH
-PA Author Manuscript
NIH
-PA Author Manuscript
Jiang and Zhao Page 26
Tabl
e 2
Ave
rage
Par
ticle
Stro
uhal
num
ber (
Str
C )
Sinu
soid
Rea
l Tra
ce
Part
icle
Siz
e (n
m)
Res
tful B
reat
hing
Mod
erat
e Sn
iffin
gSt
rong
Sni
ffing
Low
Fre
quen
cyH
igh
Freq
uenc
y
10.
290.
470.
480.
30.
13
1.67
0.41
0.67
0.68
––
2.78
0.57
0.94
0.95
––
4.64
0.80
1.32
1.33
––
7.74
1.12
1.86
1.87
––
101.
272.
612.
621.
630.
71
21.5
42.
203.
653.
66–
–
35.9
43.
325.
515.
52–
–
59.9
54.
206.
986.
99–
–
100
5.70
9.46
9.48
5.91
2.57
J Aerosol Sci. Author manuscript; available in PMC 2011 November 1.
Copyright © 2022 FDOKUMEN