The effect of biomass particle characteristics on the sorption hysteresis of 17α-ethinylestradiol
Upload
khangminh22Category
view
4download
0
RESEARCH ARTICLE
Study on the characteristics of induced airflow
and particle dispersion based on the
multivariate two-factor model
Chaonan Fan1,2, Qingjie Qi1, Xi ChenID2*, Shaocheng Ge2
1 College of Safety Engineering and Technology, Liaoning Technical University, Fuxin Liaoning, China,
2 College of safety and emergency management engineering, Taiyuan University of Technology, Shanxi
Taiyuan, China
Abstract
To examine the diffusion characteristics of airflow and dust particles, a multi-factor and
multi-level physical self-developed testing system is established. In this study, bunker
height, chute angle, feeding speed, coal granularity, and belt speed are selected as inde-
pendent variables, and airflow velocity and dust concentration are the response variables.
The two-factor interactive model is established to analyze the primary and secondary rela-
tionship between the independent variables and the response variables. The results demon-
strate a denser contour distribution of three-dimensional curved surfaces, suggesting an
obvious interaction between the factors. The bunker height increases from 0.75 m to 1.15
m, the maximum increment of the induced airflow velocity at the outlet of the guide chute is
observed to be 0.35 m/s, meanwhile, and with the increase in the feed speed from 2t/h to 8t/
h, the increment of the induced airflow velocity at the outlet of the guide chute is recorded to
be 51%. The coal granularity and bunker height depicted the highest influence on induced
air velocity and dust concentration, and the feeding speed proved to be the secondary
parameter. This two-factor interactive model can accurately forecast the actual values with
a deviation of the calculated values limited to 9%. These research results support the exist-
ing research and provide a theoretical foundation to guide the dust control at belt conveyor
transfer stations.
1. Introduction
Conveyor transfer stations are extensively employed in the conveying processes, particularly
those associated with mining and mineral processes. By the joint effort of induced airflow and
shock wave, a large amount of dust particles is carried from the conveyor to other working
areas, which is gradually becoming an alarming environmental problem. Such dust emissions
not only cause great harm to the life and health of miners but also threaten the safety and effi-
ciency of production [1–4]. Currently, China is one of the countries that is severely affected by
dust in the world since its large population is affected by pneumoconiosis and dust-exposed
diseases. Since the 1950s, there are 749,970 cases of occupational diseases, out of which,
676,541 cases of pneumoconiosis are recorded, and 149,110 death cases are found. Besides,
PLOS ONE
PLOS ONE | https://doi.org/10.1371/journal.pone.0263740 February 8, 2022 1 / 17
a1111111111
a1111111111
a1111111111
a1111111111
a1111111111
OPEN ACCESS
Citation: Fan C, Qi Q, Chen X, Ge S (2022) Study
on the characteristics of induced airflow and
particle dispersion based on the multivariate two-
factor model. PLoS ONE 17(2): e0263740. https://
doi.org/10.1371/journal.pone.0263740
Editor: Hongbing Ding, Tianjin University, CHINA
Received: June 28, 2021
Accepted: January 25, 2022
Published: February 8, 2022
Copyright: © 2022 Fan et al. This is an open access
article distributed under the terms of the Creative
Commons Attribution License, which permits
unrestricted use, distribution, and reproduction in
any medium, provided the original author and
source are credited.
Data Availability Statement: All relevant data are
within the manuscript and its Supporting
Information files.
Funding: The authors gratefully acknowledge the
financial supports by the National Natural Science
Foundation of China [52174195 51704145,] and
Doctoral Start-up Foundation of Liaoning Province
[20170520086]. The funders had no role in study
design, data collection and analysis, decision to
publish, or preparation of the manuscript.
Competing interests: The authors have declared
that no competing interests exist.
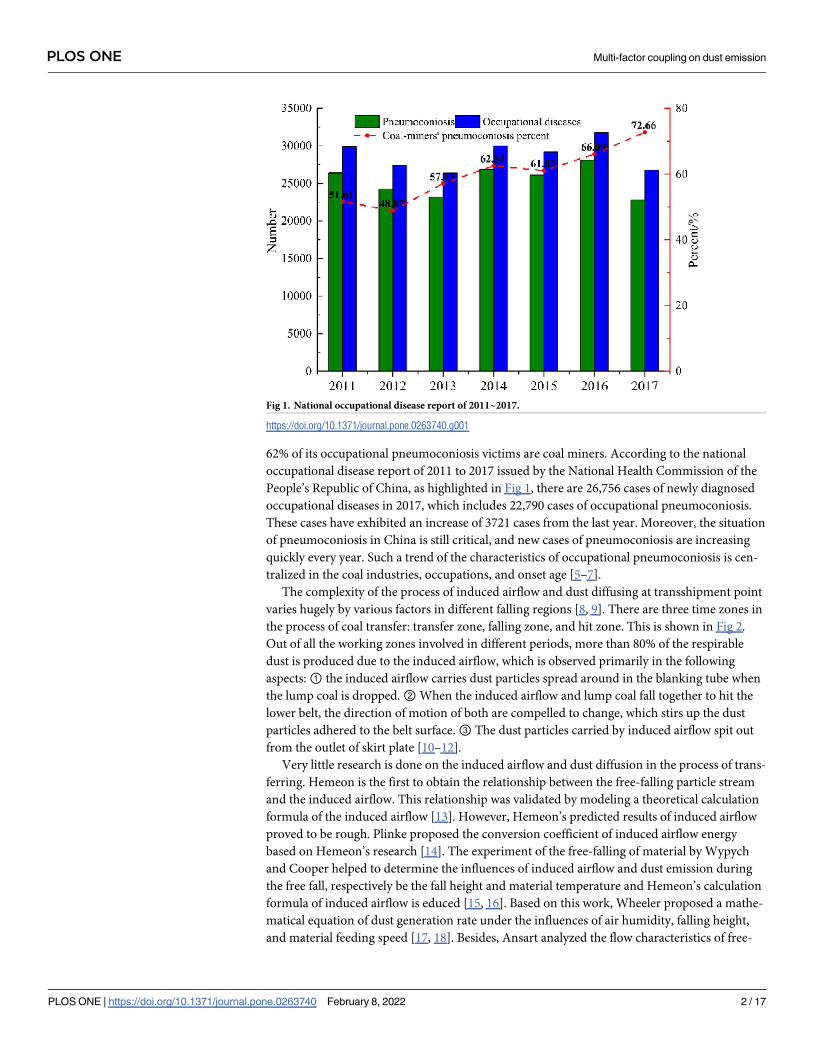
62% of its occupational pneumoconiosis victims are coal miners. According to the national
occupational disease report of 2011 to 2017 issued by the National Health Commission of the
People’s Republic of China, as highlighted in Fig 1, there are 26,756 cases of newly diagnosed
occupational diseases in 2017, which includes 22,790 cases of occupational pneumoconiosis.
These cases have exhibited an increase of 3721 cases from the last year. Moreover, the situation
of pneumoconiosis in China is still critical, and new cases of pneumoconiosis are increasing
quickly every year. Such a trend of the characteristics of occupational pneumoconiosis is cen-
tralized in the coal industries, occupations, and onset age [5–7].
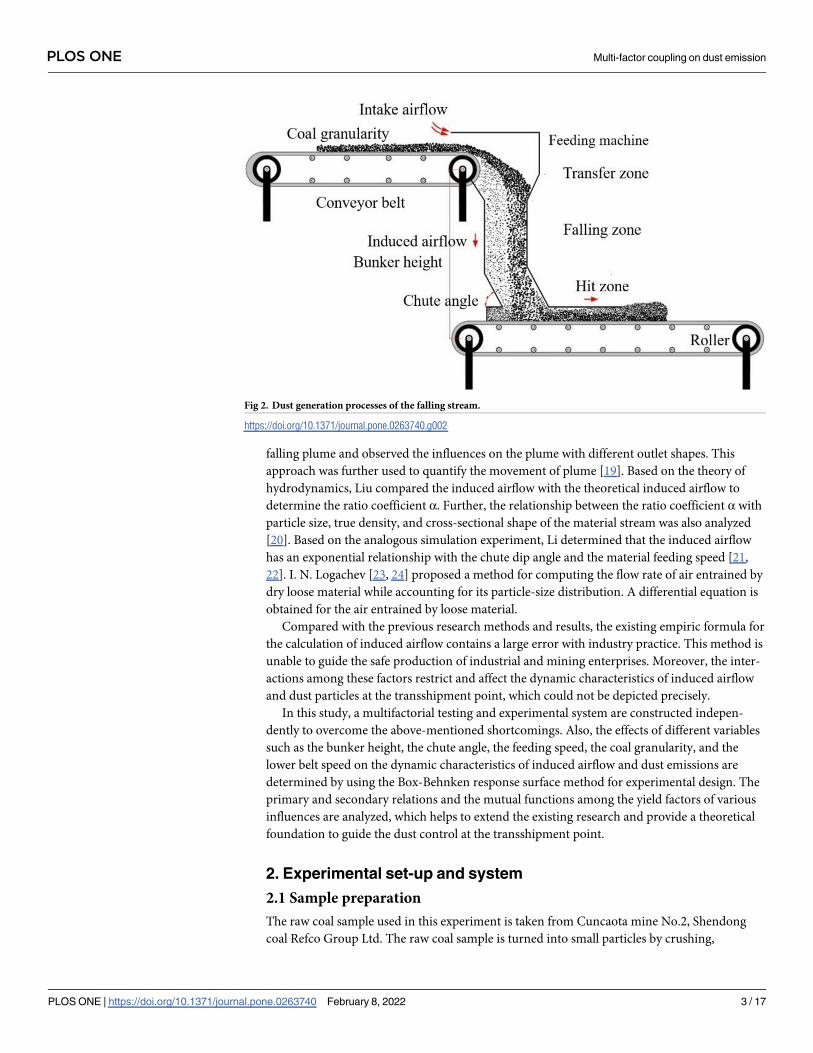
The complexity of the process of induced airflow and dust diffusing at transshipment point
varies hugely by various factors in different falling regions [8, 9]. There are three time zones in
the process of coal transfer: transfer zone, falling zone, and hit zone. This is shown in Fig 2.
Out of all the working zones involved in different periods, more than 80% of the respirable
dust is produced due to the induced airflow, which is observed primarily in the following
aspects:① the induced airflow carries dust particles spread around in the blanking tube when
the lump coal is dropped.②When the induced airflow and lump coal fall together to hit the
lower belt, the direction of motion of both are compelled to change, which stirs up the dust
particles adhered to the belt surface.③ The dust particles carried by induced airflow spit out
from the outlet of skirt plate [10–12].
Very little research is done on the induced airflow and dust diffusion in the process of trans-
ferring. Hemeon is the first to obtain the relationship between the free-falling particle stream
and the induced airflow. This relationship was validated by modeling a theoretical calculation
formula of the induced airflow [13]. However, Hemeon’s predicted results of induced airflow
proved to be rough. Plinke proposed the conversion coefficient of induced airflow energy
based on Hemeon’s research [14]. The experiment of the free-falling of material by Wypych
and Cooper helped to determine the influences of induced airflow and dust emission during
the free fall, respectively be the fall height and material temperature and Hemeon’s calculation
formula of induced airflow is educed [15, 16]. Based on this work, Wheeler proposed a mathe-
matical equation of dust generation rate under the influences of air humidity, falling height,
and material feeding speed [17, 18]. Besides, Ansart analyzed the flow characteristics of free-
Fig 1. National occupational disease report of 2011~2017.
https://doi.org/10.1371/journal.pone.0263740.g001
PLOS ONE Multi-factor coupling on dust emission
PLOS ONE | https://doi.org/10.1371/journal.pone.0263740 February 8, 2022 2 / 17
falling plume and observed the influences on the plume with different outlet shapes. This
approach was further used to quantify the movement of plume [19]. Based on the theory of
hydrodynamics, Liu compared the induced airflow with the theoretical induced airflow to
determine the ratio coefficient α. Further, the relationship between the ratio coefficient α with
particle size, true density, and cross-sectional shape of the material stream was also analyzed
[20]. Based on the analogous simulation experiment, Li determined that the induced airflow
has an exponential relationship with the chute dip angle and the material feeding speed [21,
22]. I. N. Logachev [23, 24] proposed a method for computing the flow rate of air entrained by
dry loose material while accounting for its particle-size distribution. A differential equation is
obtained for the air entrained by loose material.
Compared with the previous research methods and results, the existing empiric formula for
the calculation of induced airflow contains a large error with industry practice. This method is
unable to guide the safe production of industrial and mining enterprises. Moreover, the inter-
actions among these factors restrict and affect the dynamic characteristics of induced airflow
and dust particles at the transshipment point, which could not be depicted precisely.
In this study, a multifactorial testing and experimental system are constructed indepen-
dently to overcome the above-mentioned shortcomings. Also, the effects of different variables
such as the bunker height, the chute angle, the feeding speed, the coal granularity, and the
lower belt speed on the dynamic characteristics of induced airflow and dust emissions are
determined by using the Box-Behnken response surface method for experimental design. The
primary and secondary relations and the mutual functions among the yield factors of various
influences are analyzed, which helps to extend the existing research and provide a theoretical
foundation to guide the dust control at the transshipment point.
2. Experimental set-up and system
2.1 Sample preparation
The raw coal sample used in this experiment is taken from Cuncaota mine No.2, Shendong
coal Refco Group Ltd. The raw coal sample is turned into small particles by crushing,
Fig 2. Dust generation processes of the falling stream.
https://doi.org/10.1371/journal.pone.0263740.g002
PLOS ONE Multi-factor coupling on dust emission
PLOS ONE | https://doi.org/10.1371/journal.pone.0263740 February 8, 2022 3 / 17
screening, and classification. The granularity scale of the particles is 10 mm~40 mm and the
moisture content is 6%.
2.2 Experimental apparatus
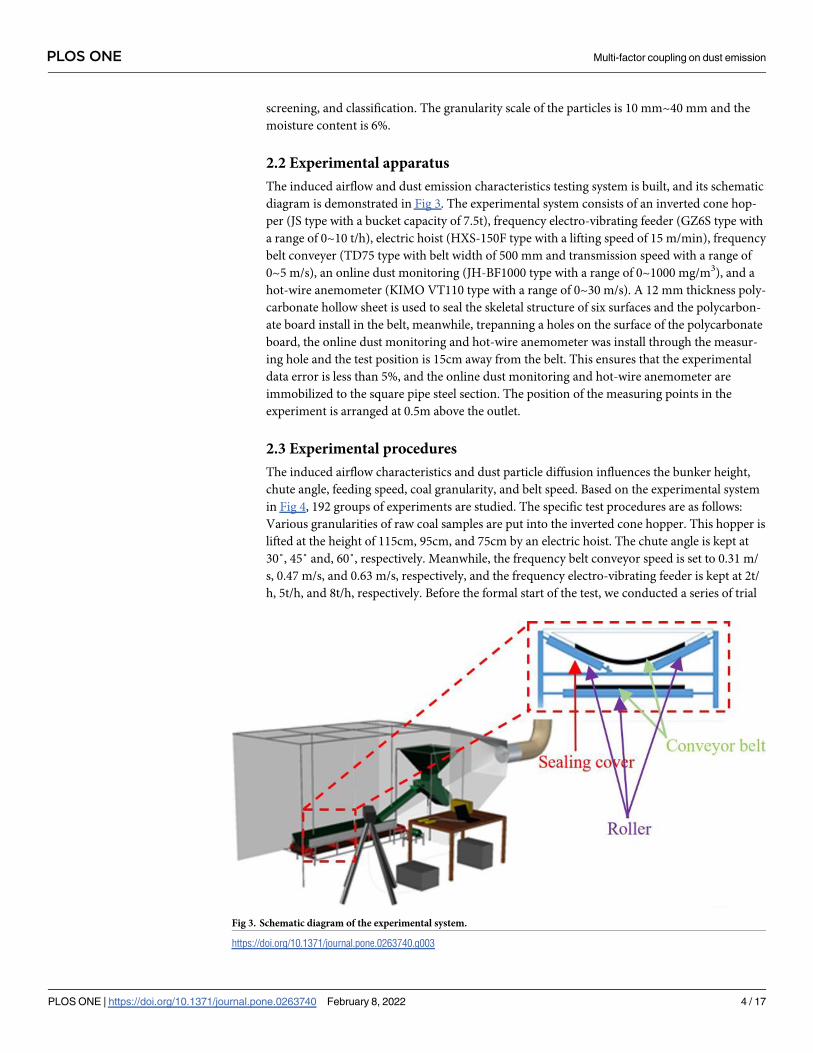
The induced airflow and dust emission characteristics testing system is built, and its schematic
diagram is demonstrated in Fig 3. The experimental system consists of an inverted cone hop-
per (JS type with a bucket capacity of 7.5t), frequency electro-vibrating feeder (GZ6S type with
a range of 0~10 t/h), electric hoist (HXS-150F type with a lifting speed of 15 m/min), frequency
belt conveyer (TD75 type with belt width of 500 mm and transmission speed with a range of
0~5 m/s), an online dust monitoring (JH-BF1000 type with a range of 0~1000 mg/m3), and a
hot-wire anemometer (KIMO VT110 type with a range of 0~30 m/s). A 12 mm thickness poly-
carbonate hollow sheet is used to seal the skeletal structure of six surfaces and the polycarbon-
ate board install in the belt, meanwhile, trepanning a holes on the surface of the polycarbonate
board, the online dust monitoring and hot-wire anemometer was install through the measur-
ing hole and the test position is 15cm away from the belt. This ensures that the experimental
data error is less than 5%, and the online dust monitoring and hot-wire anemometer are
immobilized to the square pipe steel section. The position of the measuring points in the
experiment is arranged at 0.5m above the outlet.
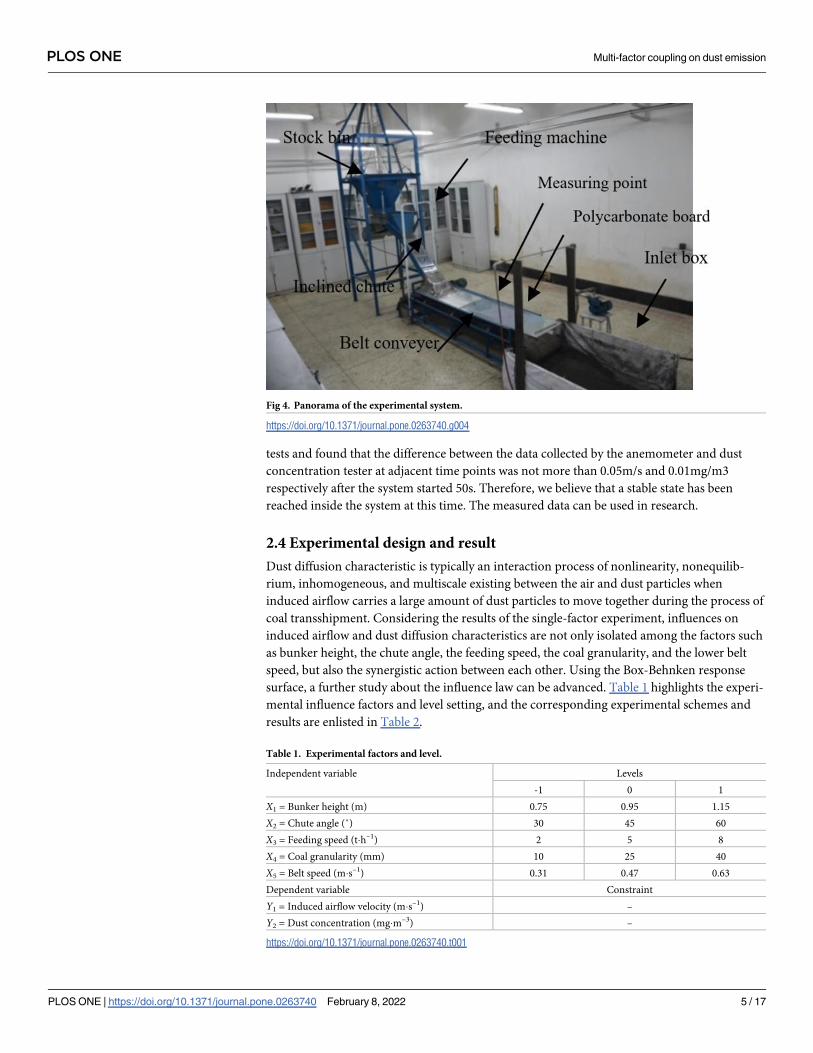
2.3 Experimental procedures
The induced airflow characteristics and dust particle diffusion influences the bunker height,
chute angle, feeding speed, coal granularity, and belt speed. Based on the experimental system
in Fig 4, 192 groups of experiments are studied. The specific test procedures are as follows:
Various granularities of raw coal samples are put into the inverted cone hopper. This hopper is
lifted at the height of 115cm, 95cm, and 75cm by an electric hoist. The chute angle is kept at
30˚, 45˚ and, 60˚, respectively. Meanwhile, the frequency belt conveyor speed is set to 0.31 m/
s, 0.47 m/s, and 0.63 m/s, respectively, and the frequency electro-vibrating feeder is kept at 2t/
h, 5t/h, and 8t/h, respectively. Before the formal start of the test, we conducted a series of trial
Fig 3. Schematic diagram of the experimental system.
https://doi.org/10.1371/journal.pone.0263740.g003
PLOS ONE Multi-factor coupling on dust emission
PLOS ONE | https://doi.org/10.1371/journal.pone.0263740 February 8, 2022 4 / 17
tests and found that the difference between the data collected by the anemometer and dust
concentration tester at adjacent time points was not more than 0.05m/s and 0.01mg/m3
respectively after the system started 50s. Therefore, we believe that a stable state has been
reached inside the system at this time. The measured data can be used in research.
2.4 Experimental design and result
Dust diffusion characteristic is typically an interaction process of nonlinearity, nonequilib-
rium, inhomogeneous, and multiscale existing between the air and dust particles when
induced airflow carries a large amount of dust particles to move together during the process of
coal transshipment. Considering the results of the single-factor experiment, influences on
induced airflow and dust diffusion characteristics are not only isolated among the factors such
as bunker height, the chute angle, the feeding speed, the coal granularity, and the lower belt
speed, but also the synergistic action between each other. Using the Box-Behnken response
surface, a further study about the influence law can be advanced. Table 1 highlights the experi-
mental influence factors and level setting, and the corresponding experimental schemes and
results are enlisted in Table 2.
Fig 4. Panorama of the experimental system.
https://doi.org/10.1371/journal.pone.0263740.g004
Table 1. Experimental factors and level.
Independent variable Levels
-1 0 1
X1 = Bunker height (m) 0.75 0.95 1.15
X2 = Chute angle (˚) 30 45 60
X3 = Feeding speed (t�h–1) 2 5 8
X4 = Coal granularity (mm) 10 25 40
X5 = Belt speed (m�s–1) 0.31 0.47 0.63
Dependent variable Constraint
Y1 = Induced airflow velocity (m�s–1) –
Y2 = Dust concentration (mg�m–3) –
https://doi.org/10.1371/journal.pone.0263740.t001
PLOS ONE Multi-factor coupling on dust emission
PLOS ONE | https://doi.org/10.1371/journal.pone.0263740 February 8, 2022 5 / 17
3. Results and discussion
3.1 Experimental analysis
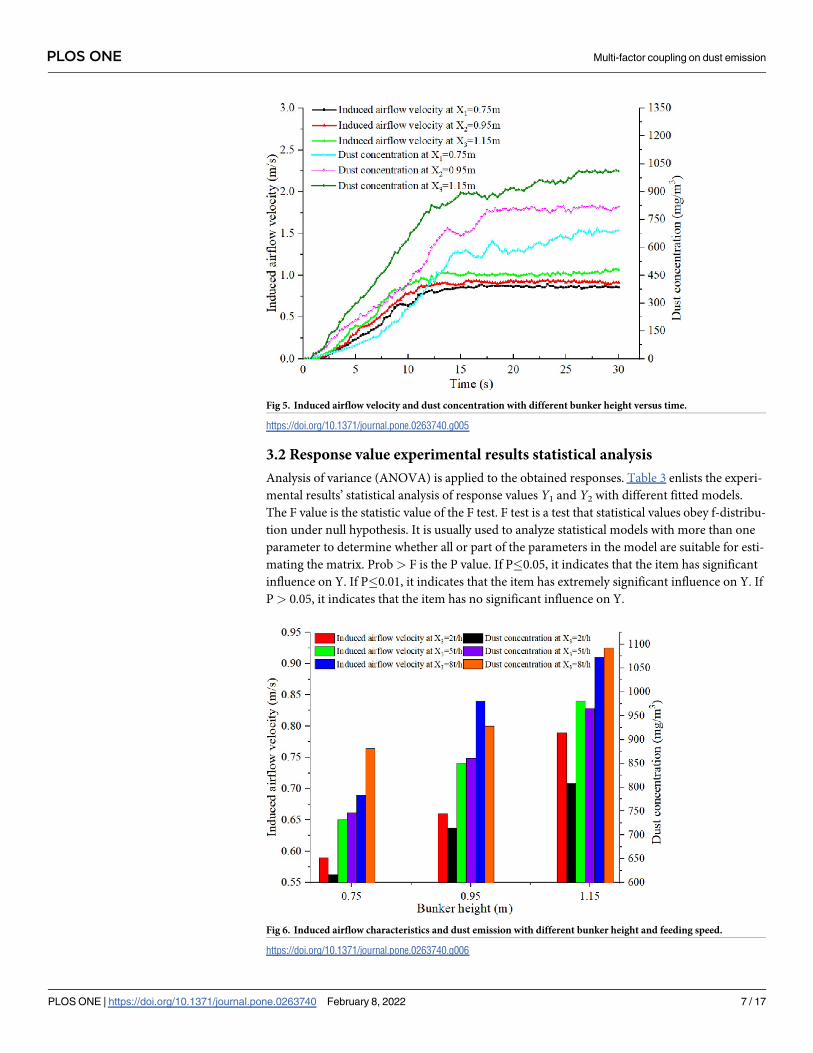
As shown in Figs 5 and 6, since the bunker height increases from 0.75 m to 1.15 m, the maxi-
mum increment of the induced airflow velocity at the outlet of the guide chute is observed to
be 0.35 m/s. This is because the coal potential energy and the final velocity of the falling coal
increase with the increase in the height difference of the falling material. This leads to the
increase in volume and the velocity of the induced airflow. This phenomenon is consistent
with the research done by Professor Peter Wypych of the University of Wollongong [15]. The
dust particles diffused for the first time under the negative pressure of the induced air flow and
diffused for the second time with the direction of induced airflow on the belt vary instantly.
The dust particles diffused in the guide chute move with the air flow and are eventually dis-
charged into the space outside the guide chute. This leads to the rise in serious dust pollution
outside the guide chute.
With the increase in the feed speed from 2t/h to 8t/h, the increment of the induced airflow
velocity at the outlet of the guide chute is recorded to be 51%. When the feed quantity and the
blanking height difference increase simultaneously, the effect of coal on the drag force of air
flow increases with the increase of the amount of dispersed coal in the periphery of the feed
material flow. Since the blanking process is always in a large acceleration state, the amount of
air ensnared by the particle flow increases, and the disturbance of particles to the air strength-
ens. This leads to the increase in the velocity difference with the increase in the height differ-
ence of blanking.
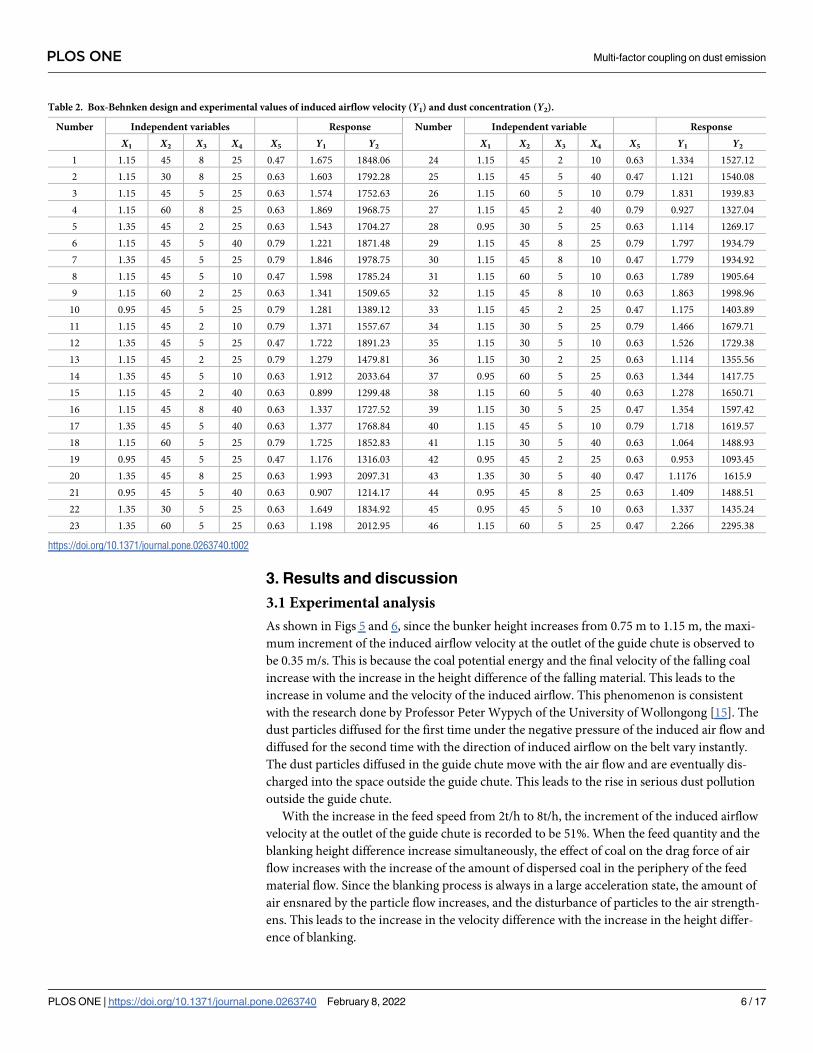
Table 2. Box-Behnken design and experimental values of induced airflow velocity (Y1) and dust concentration (Y2).
Number Independent variables Response Number Independent variable Response
X1 X2 X3 X4 X5 Y1 Y2 X1 X2 X3 X4 X5 Y1 Y2
1 1.15 45 8 25 0.47 1.675 1848.06 24 1.15 45 2 10 0.63 1.334 1527.12
2 1.15 30 8 25 0.63 1.603 1792.28 25 1.15 45 5 40 0.47 1.121 1540.08
3 1.15 45 5 25 0.63 1.574 1752.63 26 1.15 60 5 10 0.79 1.831 1939.83
4 1.15 60 8 25 0.63 1.869 1968.75 27 1.15 45 2 40 0.79 0.927 1327.04
5 1.35 45 2 25 0.63 1.543 1704.27 28 0.95 30 5 25 0.63 1.114 1269.17
6 1.15 45 5 40 0.79 1.221 1871.48 29 1.15 45 8 25 0.79 1.797 1934.79
7 1.35 45 5 25 0.79 1.846 1978.75 30 1.15 45 8 10 0.47 1.779 1934.92
8 1.15 45 5 10 0.47 1.598 1785.24 31 1.15 60 5 10 0.63 1.789 1905.64
9 1.15 60 2 25 0.63 1.341 1509.65 32 1.15 45 8 10 0.63 1.863 1998.96
10 0.95 45 5 25 0.79 1.281 1389.12 33 1.15 45 2 25 0.47 1.175 1403.89
11 1.15 45 2 10 0.79 1.371 1557.67 34 1.15 30 5 25 0.79 1.466 1679.71
12 1.35 45 5 25 0.47 1.722 1891.23 35 1.15 30 5 10 0.63 1.526 1729.38
13 1.15 45 2 25 0.79 1.279 1479.81 36 1.15 30 2 25 0.63 1.114 1355.56
14 1.35 45 5 10 0.63 1.912 2033.64 37 0.95 60 5 25 0.63 1.344 1417.75
15 1.15 45 2 40 0.63 0.899 1299.48 38 1.15 60 5 40 0.63 1.278 1650.71
16 1.15 45 8 40 0.63 1.337 1727.52 39 1.15 30 5 25 0.47 1.354 1597.42
17 1.35 45 5 40 0.63 1.377 1768.84 40 1.15 45 5 10 0.79 1.718 1619.57
18 1.15 60 5 25 0.79 1.725 1852.83 41 1.15 30 5 40 0.63 1.064 1488.93
19 0.95 45 5 25 0.47 1.176 1316.03 42 0.95 45 2 25 0.63 0.953 1093.45
20 1.35 45 8 25 0.63 1.993 2097.31 43 1.35 30 5 40 0.47 1.1176 1615.9
21 0.95 45 5 40 0.63 0.907 1214.17 44 0.95 45 8 25 0.63 1.409 1488.51
22 1.35 30 5 25 0.63 1.649 1834.92 45 0.95 45 5 10 0.63 1.337 1435.24
23 1.35 60 5 25 0.63 1.198 2012.95 46 1.15 60 5 25 0.47 2.266 2295.38
https://doi.org/10.1371/journal.pone.0263740.t002
PLOS ONE Multi-factor coupling on dust emission
PLOS ONE | https://doi.org/10.1371/journal.pone.0263740 February 8, 2022 6 / 17
3.2 Response value experimental results statistical analysis
Analysis of variance (ANOVA) is applied to the obtained responses. Table 3 enlists the experi-
mental results’ statistical analysis of response values Y1 and Y2 with different fitted models.
The F value is the statistic value of the F test. F test is a test that statistical values obey f-distribu-
tion under null hypothesis. It is usually used to analyze statistical models with more than one
parameter to determine whether all or part of the parameters in the model are suitable for esti-
mating the matrix. Prob > F is the P value. If P�0.05, it indicates that the item has significant
influence on Y. If P�0.01, it indicates that the item has extremely significant influence on Y. If
P> 0.05, it indicates that the item has no significant influence on Y.
Fig 5. Induced airflow velocity and dust concentration with different bunker height versus time.
https://doi.org/10.1371/journal.pone.0263740.g005
Fig 6. Induced airflow characteristics and dust emission with different bunker height and feeding speed.
https://doi.org/10.1371/journal.pone.0263740.g006
PLOS ONE Multi-factor coupling on dust emission
PLOS ONE | https://doi.org/10.1371/journal.pone.0263740 February 8, 2022 7 / 17
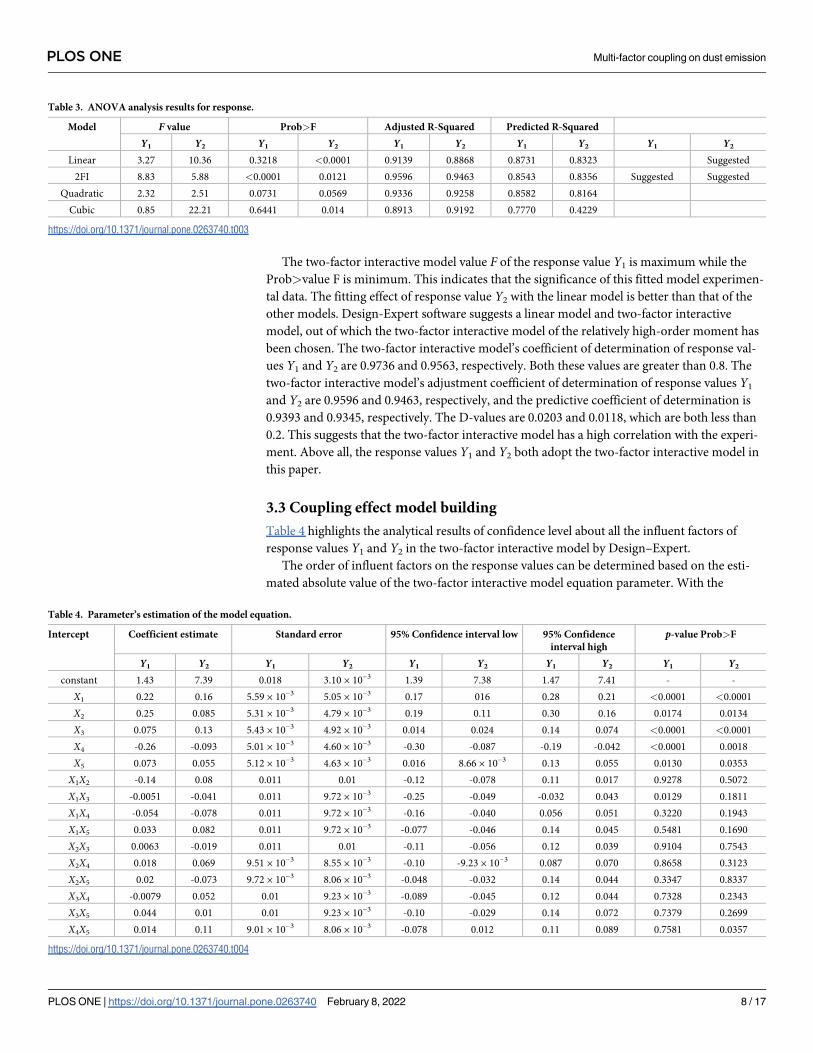
The two-factor interactive model value F of the response value Y1 is maximum while the
Prob>value F is minimum. This indicates that the significance of this fitted model experimen-
tal data. The fitting effect of response value Y2 with the linear model is better than that of the
other models. Design-Expert software suggests a linear model and two-factor interactive
model, out of which the two-factor interactive model of the relatively high-order moment has
been chosen. The two-factor interactive model’s coefficient of determination of response val-
ues Y1 and Y2 are 0.9736 and 0.9563, respectively. Both these values are greater than 0.8. The
two-factor interactive model’s adjustment coefficient of determination of response values Y1
and Y2 are 0.9596 and 0.9463, respectively, and the predictive coefficient of determination is
0.9393 and 0.9345, respectively. The D-values are 0.0203 and 0.0118, which are both less than
0.2. This suggests that the two-factor interactive model has a high correlation with the experi-
ment. Above all, the response values Y1 and Y2 both adopt the two-factor interactive model in
this paper.
3.3 Coupling effect model building
Table 4 highlights the analytical results of confidence level about all the influent factors of
response values Y1 and Y2 in the two-factor interactive model by Design–Expert.
The order of influent factors on the response values can be determined based on the esti-
mated absolute value of the two-factor interactive model equation parameter. With the
Table 3. ANOVA analysis results for response.
Model F value Prob>F Adjusted R-Squared Predicted R-Squared
Y1 Y2 Y1 Y2 Y1 Y2 Y1 Y2 Y1 Y2
Linear 3.27 10.36 0.3218 <0.0001 0.9139 0.8868 0.8731 0.8323 Suggested
2FI 8.83 5.88 <0.0001 0.0121 0.9596 0.9463 0.8543 0.8356 Suggested Suggested
Quadratic 2.32 2.51 0.0731 0.0569 0.9336 0.9258 0.8582 0.8164
Cubic 0.85 22.21 0.6441 0.014 0.8913 0.9192 0.7770 0.4229
https://doi.org/10.1371/journal.pone.0263740.t003
Table 4. Parameter’s estimation of the model equation.
Intercept Coefficient estimate Standard error 95% Confidence interval low 95% Confidence
interval high
p-value Prob>F
Y1 Y2 Y1 Y2 Y1 Y2 Y1 Y2 Y1 Y2
constant 1.43 7.39 0.018 3.10 × 10⁻³ 1.39 7.38 1.47 7.41 - -
X1 0.22 0.16 5.59 × 10⁻³ 5.05 × 10⁻³ 0.17 016 0.28 0.21 <0.0001 <0.0001
X2 0.25 0.085 5.31 × 10⁻³ 4.79 × 10⁻³ 0.19 0.11 0.30 0.16 0.0174 0.0134
X3 0.075 0.13 5.43 × 10⁻³ 4.92 × 10⁻³ 0.014 0.024 0.14 0.074 <0.0001 <0.0001
X4 -0.26 -0.093 5.01 × 10⁻³ 4.60 × 10⁻³ -0.30 -0.087 -0.19 -0.042 <0.0001 0.0018
X5 0.073 0.055 5.12 × 10⁻³ 4.63 × 10⁻³ 0.016 8.66 × 10⁻³ 0.13 0.055 0.0130 0.0353
X1X2 -0.14 0.08 0.011 0.01 -0.12 -0.078 0.11 0.017 0.9278 0.5072
X1X3 -0.0051 -0.041 0.011 9.72 × 10⁻³ -0.25 -0.049 -0.032 0.043 0.0129 0.1811
X1X4 -0.054 -0.078 0.011 9.72 × 10⁻³ -0.16 -0.040 0.056 0.051 0.3220 0.1943
X1X5 0.033 0.082 0.011 9.72 × 10⁻³ -0.077 -0.046 0.14 0.045 0.5481 0.1690
X2X3 0.0063 -0.019 0.011 0.01 -0.11 -0.056 0.12 0.039 0.9104 0.7543
X2X4 0.018 0.069 9.51 × 10⁻³ 8.55 × 10⁻³ -0.10 -9.23 × 10⁻³ 0.087 0.070 0.8658 0.3123
X2X5 0.02 -0.073 9.72 × 10⁻³ 8.06 × 10⁻³ -0.048 -0.032 0.14 0.044 0.3347 0.8337
X3X4 -0.0079 0.052 0.01 9.23 × 10⁻³ -0.089 -0.045 0.12 0.044 0.7328 0.2343
X3X5 0.044 0.01 0.01 9.23 × 10⁻³ -0.10 -0.029 0.14 0.072 0.7379 0.2699
X4X5 0.014 0.11 9.01 × 10⁻³ 8.06 × 10⁻³ -0.078 0.012 0.11 0.089 0.7581 0.0357
https://doi.org/10.1371/journal.pone.0263740.t004
PLOS ONE Multi-factor coupling on dust emission
PLOS ONE | https://doi.org/10.1371/journal.pone.0263740 February 8, 2022 8 / 17
interaction of factors, the order of influent factors about the induced airflow velocity is coal
cinder granularity X4(p<0.0001)>material dropping amount X3(p<0.0001)>material drop-
ping distance X1(p<0.0001)>chute angle X2(p<0.05)>belt conveyor velocity X5(p<0.05). The
order of influent factors about the dust concentration is material dropping distance
X1(p<0.0001)>material dropping amount X3(p<0.0001)>coal cinder granularity
X4(p<0.0001)>chute angle X2(p<0.05)>belt conveyor velocity X5(p<0.05).
The relationship between influent factors and response values are described by the two-
factor interactive model equation parameter. The corresponding regression model is:
Y1 = 1.43+0.22X1+0.075X2+0.25X3−0.26X4+0.073X5-0.14X1X2−0.0051X1X3−0.054X1X4+
0.033X1X5+0.0063X2X3+0.018X2X4+0.02X2X5−0.0079X3X4+0.044X3X5+0.014X4X5
Y2 = 7.39+0.16X1+0.085X2+0.13X3−0.093X4+0.055X5+0.08X1X2−0.041X1X3−0.078X1X4+
0.082X1X5−0.019X2X3+0.069X2X4−0.073X2X5+0.052X3X4+0.01X3X5+0.11X4X5
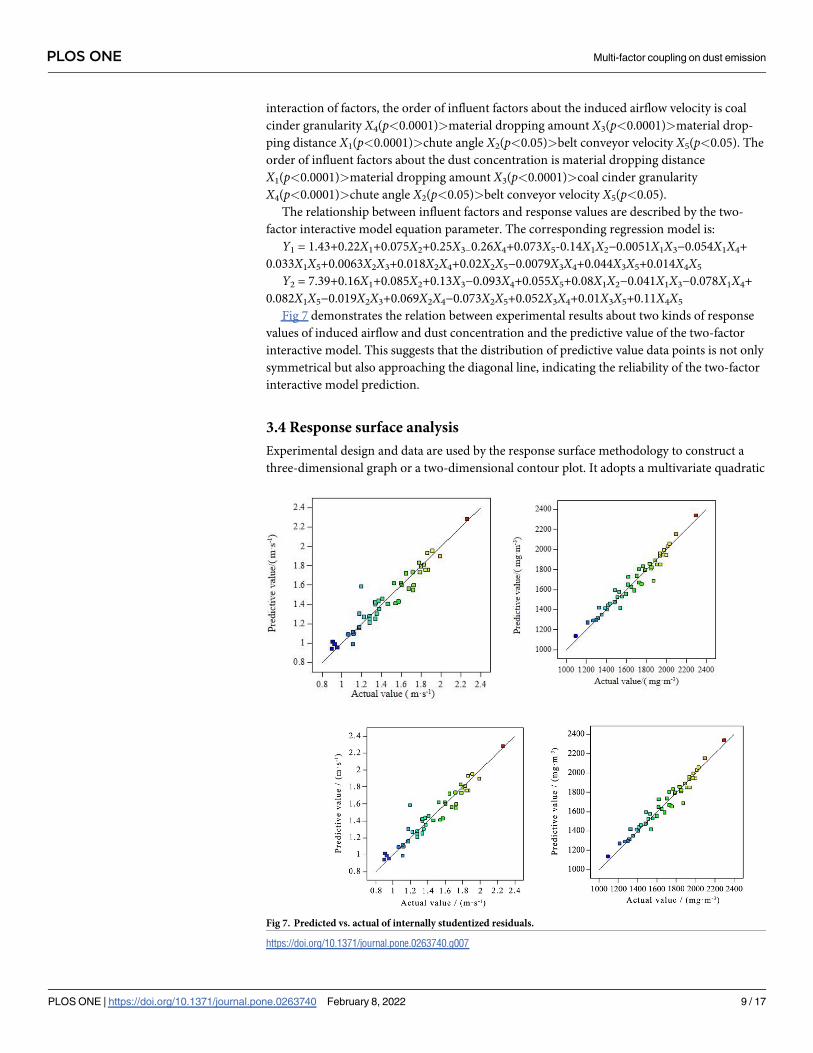
Fig 7 demonstrates the relation between experimental results about two kinds of response
values of induced airflow and dust concentration and the predictive value of the two-factor
interactive model. This suggests that the distribution of predictive value data points is not only
symmetrical but also approaching the diagonal line, indicating the reliability of the two-factor
interactive model prediction.
3.4 Response surface analysis
Experimental design and data are used by the response surface methodology to construct a
three-dimensional graph or a two-dimensional contour plot. It adopts a multivariate quadratic
Fig 7. Predicted vs. actual of internally studentized residuals.
https://doi.org/10.1371/journal.pone.0263740.g007
PLOS ONE Multi-factor coupling on dust emission
PLOS ONE | https://doi.org/10.1371/journal.pone.0263740 February 8, 2022 9 / 17
regression equation to fit functional relation between factors and response values and reflects
the influences of response values on various factors.
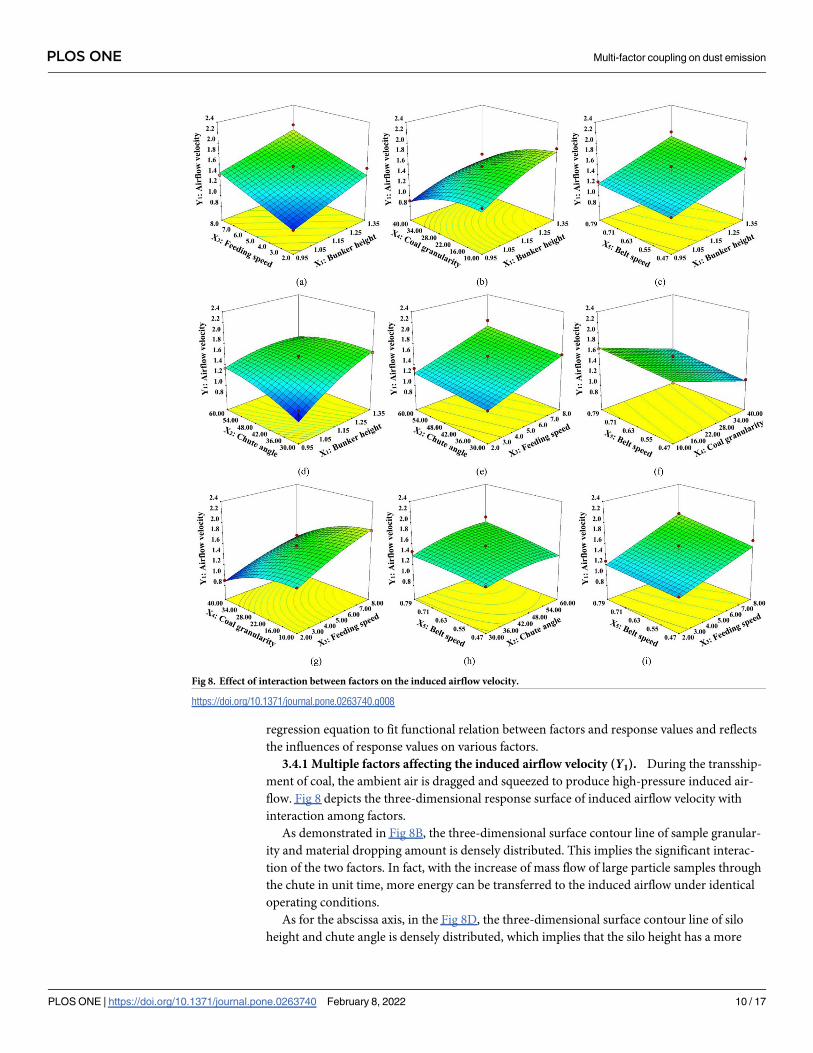
3.4.1 Multiple factors affecting the induced airflow velocity (Y1). During the transship-
ment of coal, the ambient air is dragged and squeezed to produce high-pressure induced air-
flow. Fig 8 depicts the three-dimensional response surface of induced airflow velocity with
interaction among factors.
As demonstrated in Fig 8B, the three-dimensional surface contour line of sample granular-
ity and material dropping amount is densely distributed. This implies the significant interac-
tion of the two factors. In fact, with the increase of mass flow of large particle samples through
the chute in unit time, more energy can be transferred to the induced airflow under identical
operating conditions.
As for the abscissa axis, in the Fig 8D, the three-dimensional surface contour line of silo
height and chute angle is densely distributed, which implies that the silo height has a more
Fig 8. Effect of interaction between factors on the induced airflow velocity.
https://doi.org/10.1371/journal.pone.0263740.g008
PLOS ONE Multi-factor coupling on dust emission
PLOS ONE | https://doi.org/10.1371/journal.pone.0263740 February 8, 2022 10 / 17
remarkable influence on the induced airflow velocity than the chute angle. There is a huge
pressure difference between the upper and the lower surface due to the increase of drop height.
Besides, with the joint effect of shear force on the material surface, more air is inhaled into the
chute, and the induced airflow velocity keeps increasing. But in the Fig 8E, we can found that
three-dimensional surface contour line of the lower belt running velocity and chute angle
shows almost no distortion, which suggests little interaction between the two factors. The
effective cross-sectional area of airflow is reduced due to the stacking thickness on the belt sur-
face influenced by a lower belt running velocity. This has an indirect influence on the chute’s
internal pressure.
3.4.2 Multiple factors affecting dust concentration (Y2). Dust particles entrained by the
induced airflow caused by the self-motion of materials are diffused with the effect of the nega-
tive pressure. Besides, the induced airflow direction of the belt changes at every short interval,
which lets the entrained dust particles to re-diffuse. Fig 7 highlights the three-dimensional
response surface of dust concentration with interaction among the factors.
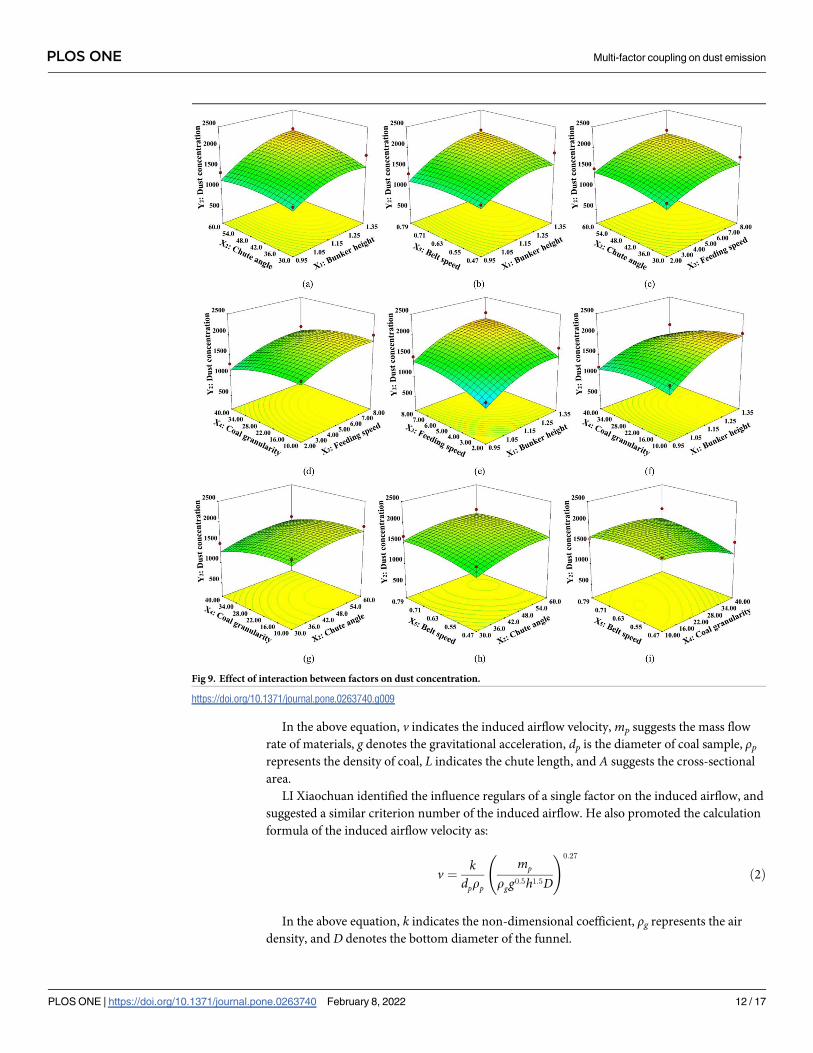
As displayed in Fig 9, when the other four factors are at their selected conditional level, the
three-dimensional surface contour line of dust concentration and silo height are densely dis-
tributed and steeply curve. This indicates the significant effect of the silo height on the dust
concentration. This diagram is in accordance with the analysis of model variance. In fact, in
the entire process of dropping impact, due to the reduction of vertical static pressure and spon-
taneous turbulence, the induced airflow keeps entraining fresh air to form eddy current.
Besides, the dust particles lead to an irregular diffusion with the effect of eddy current.
As for the abscissa axis, in the Fig 9D, the three-dimensional surface contour line of sample
granularity and material dropping amount is more densely distributed. This illustrates that the
material dropping amount has a more remarkable influence on the dust concentration than
the sample’s granularity. Meanwhile, under the conditions of multiple factors and single fac-
tors, the dust concentration disaccords with the changing regularity of sample granularity.
This implies that there exists an obvious interaction among the factors. With the decrease of
sample granularity, the voidage of material heaped on the chute surface reduces. This leads to
the reduction of the volume of induced airflow. But in the Fig 9C and 9J, three-dimensional
surface contour line of the lower belt running velocity, sample granularity, and chute angle
demonstrates almost no distortion, suggesting a little interaction among the factors. Due to the
traction airflow formed around the belt conveyor in the process of lower belt operation, a large
amount of dust particles arise at the moment of material impacting on belt diffuses along the
direction of the belt moving by changing the internal pressure of the chute. However, since the
traction airflow is just around the belt surface, it has little contribution to the dust
concentration.
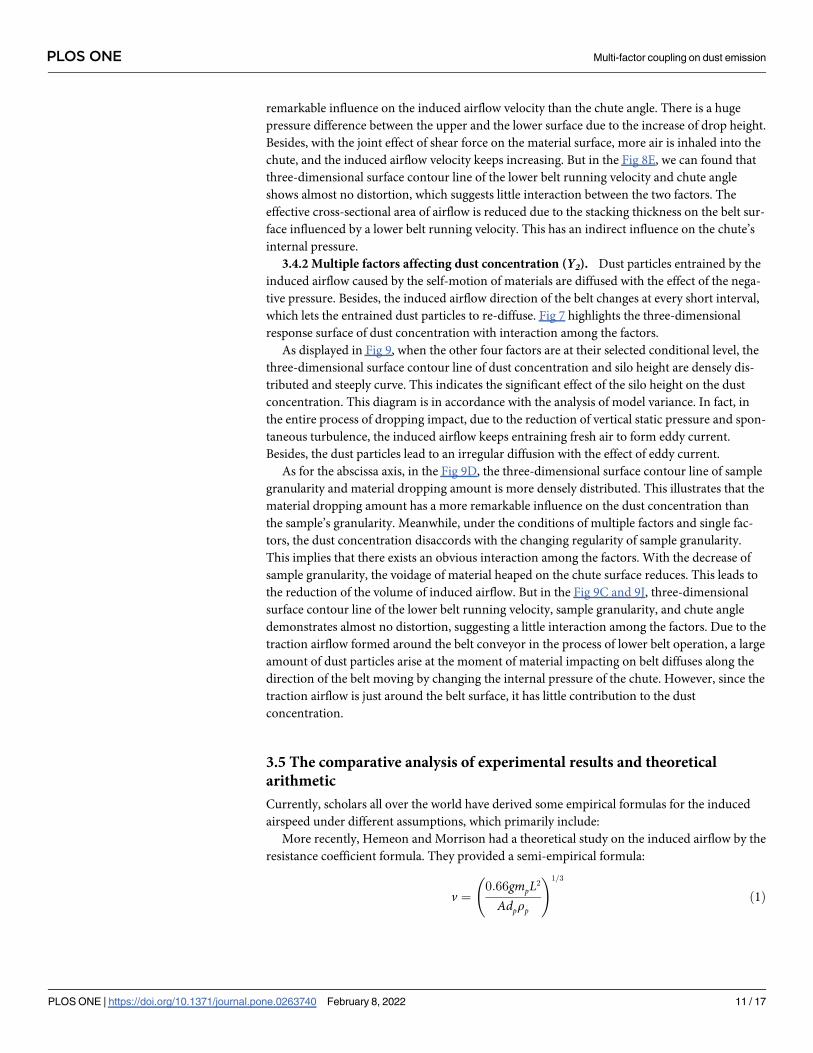
3.5 The comparative analysis of experimental results and theoretical
arithmetic
Currently, scholars all over the world have derived some empirical formulas for the induced
airspeed under different assumptions, which primarily include:
More recently, Hemeon and Morrison had a theoretical study on the induced airflow by the
resistance coefficient formula. They provided a semi-empirical formula:
v ¼0:66gmpL2
Adprp
!1=3
ð1Þ
PLOS ONE Multi-factor coupling on dust emission
PLOS ONE | https://doi.org/10.1371/journal.pone.0263740 February 8, 2022 11 / 17
In the above equation, v indicates the induced airflow velocity, mp suggests the mass flow
rate of materials, g denotes the gravitational acceleration, dp is the diameter of coal sample, ρprepresents the density of coal, L indicates the chute length, and A suggests the cross-sectional
area.
LI Xiaochuan identified the influence regulars of a single factor on the induced airflow, and
suggested a similar criterion number of the induced airflow. He also promoted the calculation
formula of the induced airflow velocity as:
v ¼k
dprp
mp
rgg0:5h1:5D
!0:27
ð2Þ
In the above equation, k indicates the non-dimensional coefficient, ρg represents the air
density, and D denotes the bottom diameter of the funnel.
Fig 9. Effect of interaction between factors on dust concentration.
https://doi.org/10.1371/journal.pone.0263740.g009
PLOS ONE Multi-factor coupling on dust emission
PLOS ONE | https://doi.org/10.1371/journal.pone.0263740 February 8, 2022 12 / 17
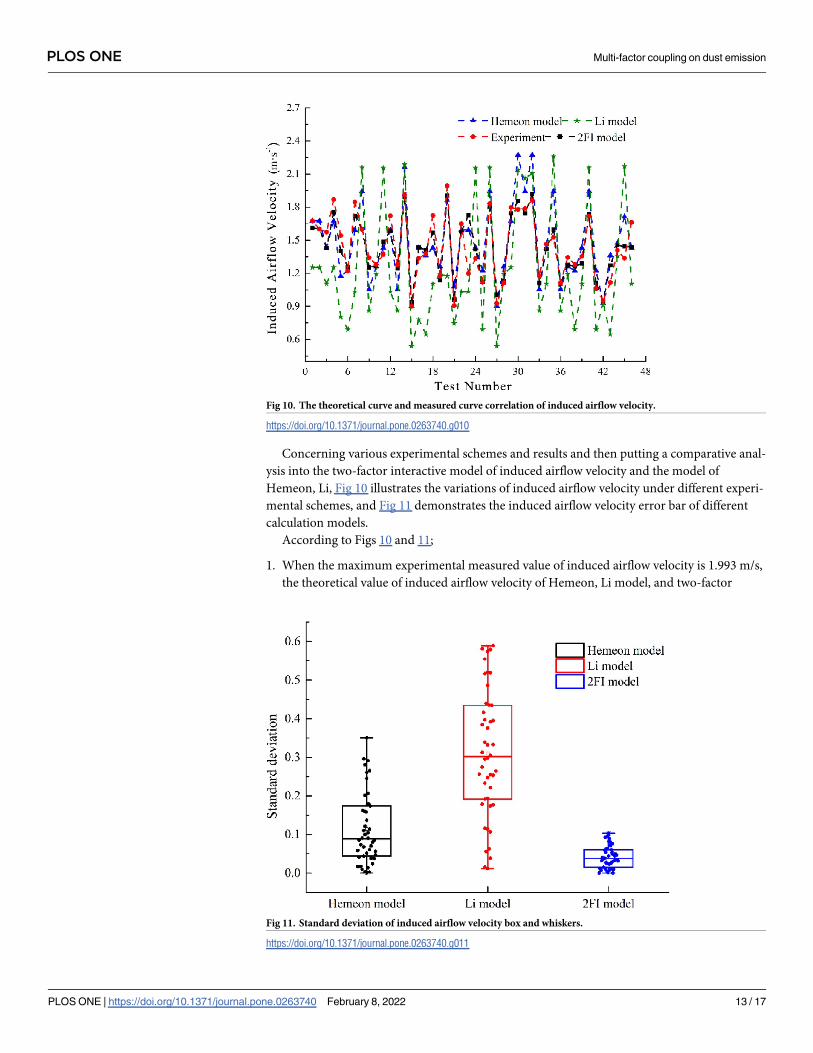
Concerning various experimental schemes and results and then putting a comparative anal-
ysis into the two-factor interactive model of induced airflow velocity and the model of
Hemeon, Li, Fig 10 illustrates the variations of induced airflow velocity under different experi-
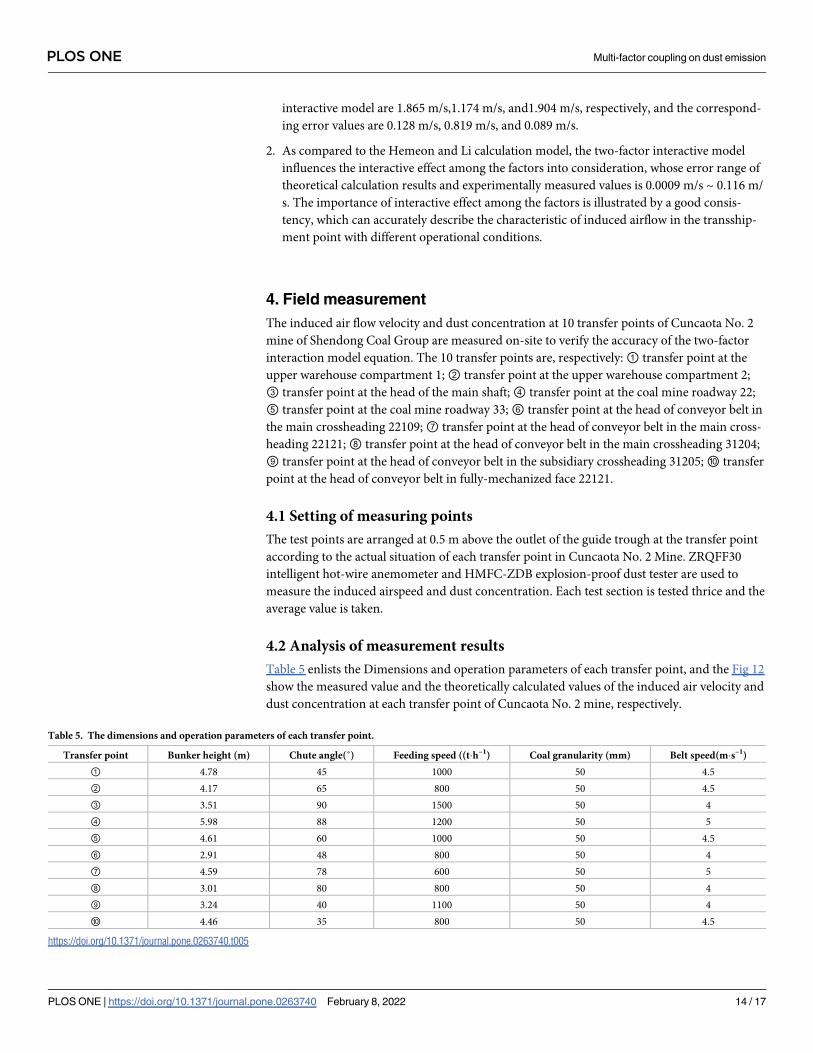
mental schemes, and Fig 11 demonstrates the induced airflow velocity error bar of different
calculation models.
According to Figs 10 and 11;
1. When the maximum experimental measured value of induced airflow velocity is 1.993 m/s,
the theoretical value of induced airflow velocity of Hemeon, Li model, and two-factor
Fig 10. The theoretical curve and measured curve correlation of induced airflow velocity.
https://doi.org/10.1371/journal.pone.0263740.g010
Fig 11. Standard deviation of induced airflow velocity box and whiskers.
https://doi.org/10.1371/journal.pone.0263740.g011
PLOS ONE Multi-factor coupling on dust emission
PLOS ONE | https://doi.org/10.1371/journal.pone.0263740 February 8, 2022 13 / 17
interactive model are 1.865 m/s,1.174 m/s, and1.904 m/s, respectively, and the correspond-
ing error values are 0.128 m/s, 0.819 m/s, and 0.089 m/s.
2. As compared to the Hemeon and Li calculation model, the two-factor interactive model
influences the interactive effect among the factors into consideration, whose error range of
theoretical calculation results and experimentally measured values is 0.0009 m/s ~ 0.116 m/
s. The importance of interactive effect among the factors is illustrated by a good consis-
tency, which can accurately describe the characteristic of induced airflow in the transship-
ment point with different operational conditions.
4. Field measurement
The induced air flow velocity and dust concentration at 10 transfer points of Cuncaota No. 2
mine of Shendong Coal Group are measured on-site to verify the accuracy of the two-factor
interaction model equation. The 10 transfer points are, respectively:① transfer point at the
upper warehouse compartment 1;② transfer point at the upper warehouse compartment 2;
③ transfer point at the head of the main shaft;④ transfer point at the coal mine roadway 22;
⑤ transfer point at the coal mine roadway 33;⑥ transfer point at the head of conveyor belt in
the main crossheading 22109;⑦ transfer point at the head of conveyor belt in the main cross-
heading 22121;⑧ transfer point at the head of conveyor belt in the main crossheading 31204;
⑨ transfer point at the head of conveyor belt in the subsidiary crossheading 31205;⑩ transfer
point at the head of conveyor belt in fully-mechanized face 22121.
4.1 Setting of measuring points
The test points are arranged at 0.5 m above the outlet of the guide trough at the transfer point
according to the actual situation of each transfer point in Cuncaota No. 2 Mine. ZRQFF30
intelligent hot-wire anemometer and HMFC-ZDB explosion-proof dust tester are used to
measure the induced airspeed and dust concentration. Each test section is tested thrice and the
average value is taken.
4.2 Analysis of measurement results
Table 5 enlists the Dimensions and operation parameters of each transfer point, and the Fig 12
show the measured value and the theoretically calculated values of the induced air velocity and
dust concentration at each transfer point of Cuncaota No. 2 mine, respectively.
Table 5. The dimensions and operation parameters of each transfer point.
Transfer point Bunker height (m) Chute angle(˚) Feeding speed ((t�h–1) Coal granularity (mm) Belt speed(m�s–1)
① 4.78 45 1000 50 4.5
② 4.17 65 800 50 4.5
③ 3.51 90 1500 50 4
④ 5.98 88 1200 50 5
⑤ 4.61 60 1000 50 4.5
⑥ 2.91 48 800 50 4
⑦ 4.59 78 600 50 5
⑧ 3.01 80 800 50 4
⑨ 3.24 40 1100 50 4
⑩ 4.46 35 800 50 4.5
https://doi.org/10.1371/journal.pone.0263740.t005
PLOS ONE Multi-factor coupling on dust emission
PLOS ONE | https://doi.org/10.1371/journal.pone.0263740 February 8, 2022 14 / 17

It can be deduced from Fig 12 that the relative errors in the measured and calculated values
of the induced air velocity and dust concentration at each point of Cuncaota No. 2 mine are
marginal, and the relative errors range from 1.02% to 8.76% and 1.68% to 6.39%, respectively.
This indicates that the two-factor interaction model can accurately predict the induced air
velocity and dust concentration at the transfer point.
5. Conclusion
1. The two-factor interactive model of response value is established by aiming at the influent
regularity of the induced airflow velocity and dust diffusion characteristics, influenced by 5
factors: silo height, material dropping amount, chute angle, coal granularity, and lower belt
velocity. This is done using Box-Behnken response surface design. The error scale of the
model is as low as 5%. This model can be used to analyze the interaction effects among the
factors and to carry out optimization and collocation of factors.
2. Three-dimensional surface contour line of sample granularity and material dropping
amount is densely distributed, and the coal granularity has the most significant effect on
the induced airflow velocity. In fact, when the other four factors are at their selected condi-
tional level, the three-dimensional surface contour line of dust concentration and silo
height seems densely distributed and steeply curve. Silo height has the most significant
effect on dust concentration. Lower belt velocity has less influence on the induced airflow
velocity and dust concentration.
3. Under the condition of multiple factors and single factor, dust concentration disaccords
with the change in the regularity of the sample granularity. Since the effect of factors on the
induced airflow is not isolated, it stays connected and restrained to each other. As the sam-
ple granularity reduces, the voidage of material heaped on the chute surface reduces, but
the material dropping amount rises. This leads to the reduction of volume of induced air-
flow. This is the essential reason for the existing complexity in the induced airflow charac-
teristic and dust diffusion with interactive effect among factors during the transshipment.
Fig 12. Measured and calculated values of induced air velocity and dust concentration at the transfer point.
https://doi.org/10.1371/journal.pone.0263740.g012
PLOS ONE Multi-factor coupling on dust emission
PLOS ONE | https://doi.org/10.1371/journal.pone.0263740 February 8, 2022 15 / 17
Supporting information
S1 Data. All the data is in a file called supporting information.
(DOCX)
Acknowledgments
This research did not receive any specific grant from funding agencies in the public, commer-
cial, or not-for-profit sectors.
Author Contributions
Conceptualization: Xi Chen.
Data curation: Chaonan Fan.
Funding acquisition: Xi Chen.
Investigation: Qingjie Qi.
Methodology: Shaocheng Ge.
Project administration: Qingjie Qi, Xi Chen.
Resources: Qingjie Qi, Shaocheng Ge.
Software: Chaonan Fan.
Supervision: Xi Chen.
Validation: Chaonan Fan.
Writing – original draft: Chaonan Fan.
Writing – review & editing: Chaonan Fan, Qingjie Qi.
References1. Zhou Q, Qin BT, Wang J, Wang HT, Wang F. Effects of preparation parameters on the wetting features
of surfactant-magnetized water for dust control in Luwa mine, China. Powder Technology. 2018; 326:7–
15. WOS:000425077200002.
2. Zhou G, Feng B, Yin W, Wang J. Numerical simulations on airflow-dust diffusion rules with the use of
coal cutter dust removal fans and related engineering applications in a fully-mechanized coal mining
face. Powder Technology. 2018; 339:354–67. https://doi.org/10.1016/j.powtec.2018.07.078
3. Yuan Z, Khakzad N, Khan F, Amyotte P. Risk-based optimal safety measure allocation for dust explo-
sions. Safety Sci. 2015; 74:79–92. WOS:000350518200009.
4. Chen X, Ge S-C. Numerical and experimental study on spray characteristics with effect of induced air-
flow on transshipment point. Meitan Xuebao/Journal of the China Coal Society. 2015; 40(3):603–8.
https://doi.org/10.13225/j.cnki.jccs.2014.0564
5. Xu G, Chen YP, Eksteen J, Xu JL. Surfactant-aided coal dust suppression: A review of evaluation meth-
ods and influencing factors. Sci Total Environ. 2018; 639:1060–76. WOS:000436806200105. https://
doi.org/10.1016/j.scitotenv.2018.05.182 PMID: 29929275
6. Wang H, Xuan W, Zhang Z, Qin B. Experimental investigation of the properties of dust suppressants
after magnetic-field treatment and mechanism exploration. Powder Technology. 2019; 342:149–55.
https://doi.org/10.1016/j.powtec.2018.09.099
7. Hua Y, Nie W, Cai P, Liu Y, Peng H, Liu Q. Pattern characterization concerning spatial and temporal
evolution of dust pollution associated with two typical ventilation methods at fully mechanized excava-
tion faces in rock tunnels. Powder Technology. 2018; 334:117–31. https://doi.org/10.1016/j.powtec.
2018.04.059
8. Cheng WM, Yu HM, Zhou G, Nie W. The diffusion and pollution mechanisms of airborne dusts in fully-
mechanized excavation face at mesoscopic scale based on CFD-DEM. Process Saf Environ. 2016;
104:240–53. WOS:000389389400020.
PLOS ONE Multi-factor coupling on dust emission
PLOS ONE | https://doi.org/10.1371/journal.pone.0263740 February 8, 2022 16 / 17
9. Logachev KI, Ziganshin AM, Averkova OA. On the resistance of a round exhaust hood, shaped by out-
lines of the vortex zones occurring at its inlet. Build Environ. 2019; 151:338–47.
WOS:000458611000028.
10. Varona M, Ibanez-Pinilla M, Briceno L, Groot H, Narvaez D, Palma M, et al. Evaluation of the exposure
to coal dust and prevalence of pneumoconiosis in underground mining in three Colombian departments.
Biomedica. 2018; 38(4). WOS:000449455600012. https://doi.org/10.7705/biomedica.v38i4.4183
PMID: 30653860
11. Moreno T, Trechera P, Querol X, Lah R, Johnson D, Wrana A, et al. Trace element fractionation
between PM10 and PM2.5 in coal mine dust: Implications for occupational respiratory health. Int J Coal
Geol. 2019; 203:52–9. WOS:000460492900005.
12. Li S, Zhou F, Wang F, Xie B. Application and research of dry-type filtration dust collection technology in
large tunnel construction. Advanced Powder Technology. 2017; 28(12):3213–21. https://doi.org/10.
1016/j.apt.2017.10.003.
13. Hemeon WCL. Plant and Process Ventilation. Burton DJ, editor. New York: Industrial Press; 1963.
https://doi.org/10.1080/00022470.1963.10468167 PMID: 14117993
14. Plinke MA, Leith D, Holstein DB, Boundy MG. Experimental examination of factors that affect dust gen-
eration. Am Ind Hyg Assoc J. 1991; 52(12):521–8. Epub 1991/12/01. https://doi.org/10.1080/
15298669191365153 PMID: 1781432.
15. Wypych PW, Hastie DB, Frew I, Cook DM. An experimental investigation into the feed rate capacity of
rotary valve and blow tank feeders. Particul Sci Technol. 2006; 24(2):165–79.
WOS:000238200300004.
16. Wypych P, Cook D, Cooper P. Controlling dust emissions and explosion hazards in powder handling
plants. Chemical Engineering and Processing: Process Intensification. 2005; 44(2):323–6. https://doi.
org/10.1016/j.cep.2004.02.026
17. Chen XL, Wheeler CA, Donohue TJ, McLean R, Roberts AW. Evaluation of dust emissions from con-
veyor transfer chutes using experimental and CFD simulation. Int J Miner Process. 2012; 110–
111:101–8. https://doi.org/10.1016/j.minpro.2012.04.008
18. Chen X, Wheeler C. Computational Fluid Dynamics (CFD) modelling of transfer chutes: Assessment of
viscosity, drag and turbulence models. International Journal of Multiphase Flow. 2015; 69:42–53.
https://doi.org/10.1016/j.ijmultiphaseflow.2014.09.010
19. Ansart R, de Ryck A, Dodds JA. Dust emission in powder handling: Free falling particle plume charac-
terisation. Chem Eng J. 2009; 152(2–3):415–20. WOS:000274348500015.
20. Liu Z, Cooper P, Wypych PW. Experimental investigation of air entrainment in free-falling particle
plumes. Particul Sci Technol. 2007; 25(4):357–73. https://doi.org/10.1080/02726350701484006
WOS:000249202400004.
21. Xiaochuan L, Qili W, Qi L, Yafei H. Developments in studies of air entrained by falling bulk materials.
Powder Technology. 2016; 291:159–69. https://doi.org/10.1016/j.powtec.2015.12.021
22. Li XC, Li Q, Zhang D, Jia BB, Luo HQ, Hu YF. Model for induced airflow velocity of falling materials in
semi-closed transfer station based on similitude theory. Advanced Powder Technology. 2015; 26
(1):236–43. WOS:000349758600031.
23. Logachev IN, Popov EN, Logachev KI, Averkova OA. Refining the method for determining the flow rate
of air entrained by freely falling polydisperse loose material. Powder Technology. 2020; 373:323–35.
https://doi.org/10.1016/j.powtec.2020.06.055 WOS:000558909200030.
24. Gol’tsov AB, Logachev KI, Averkova OA, Tkachenko VA. Investigation of the Dust-Air Flow Near a Ver-
tical Rotating Cylindrical Local Exhaust. Refractories and Industrial Ceramics. 2019; 59(6):671–6.
https://doi.org/10.1007/s11148-019-00294-1 WOS:000470233000020.
PLOS ONE Multi-factor coupling on dust emission
PLOS ONE | https://doi.org/10.1371/journal.pone.0263740 February 8, 2022 17 / 17
Copyright © 2022 FDOKUMEN