airbase_6534.pdf - AIVC
15
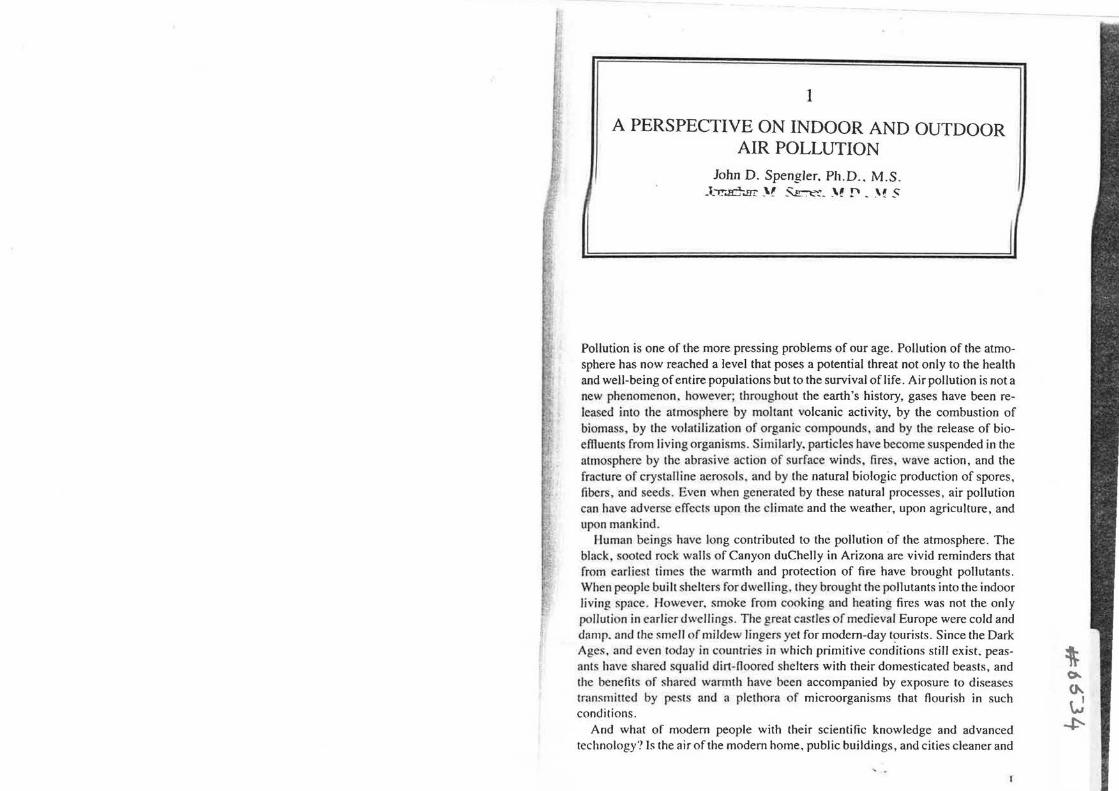
I A PERSPECTIVE ON INDOOR AND OUTDOOR AIR POLLUTION John D. Spengler. Ph.D .. M.S. _l_>e...!C-..m:- • v s I Pollution is one of the more pressing problems of our age. Pollution of the atmo- sphere has now reached a level that poses a potential threat not only to the health and well-being of entire populations but to the survival of life. Air pollution is not a new phenomenon, however; throughout the earth's history, gases have been re- leased into the atmosphere by moltant volcanic activity, by the combustion of biomass by the volatilization of organic compounds, and by the release of bio- effiuents from living organisms. Similarly. particles have become suspended in the atmo phere by the abrasive action of surface wind fires, wave action, and the fracture of crystalline aerosols. and by the natural biologic production of spores, fibers and seeds. Even when generated by these natural processes, air pollution can have adverse effects upon the climate and the weather, upon agriculture, and upon mankind. Human beings have long contributed to the pollution of the atmosphere. The black sooted rock walls of Canyon duChelly in Arizona are vivid reminders that from earliest times the warmth and protection of fire have brought pollutants. When people built shelters for dwelling. they brought the pollutants into the indoor living space. However. smoke from cooking and heating fires was not the only polluti n in earlier dwellings. The great castles of medieval Europe were cold and damp. and the smell of mildew lingers yet for modem-day Since the Dark Ages, and even today in countries in which primitive conditions still exist. peas- ants have shared squalid dirt-Ooored shelters with their domesticated beasts, and the benefits of shared wannth have been accompanied by exposure to diseases transmitted by pests and a plethora of microorganisms that flourish in such conditions. And what of modem people with their scientific knowledge and advanced technology? Is the air of the modem home, public buildings, and cities cleaner and
-
Upload
khangminh22 -
Category
Documents
-
view
3 -
download
0
Transcript of airbase_6534.pdf - AIVC
I
A PERSPECTIVE ON INDOOR AND OUTDOOR AIR POLLUTION
John D. Spengler. Ph.D .. M.S. _l_>e...!C-..m:- )..~ ~"'-'- _\~ ~ • v s
I
Pollution is one of the more pressing problems of our age. Pollution of the atmosphere has now reached a level that poses a potential threat not only to the health and well-being of entire populations but to the survival of life. Air pollution is not a new phenomenon, however; throughout the earth's history, gases have been released into the atmosphere by moltant volcanic activity, by the combustion of biomass by the volatilization of organic compounds, and by the release of bioeffiuents from living organisms. Similarly. particles have become suspended in the atmo phere by the abrasive action of surface wind fires , wave action, and the fracture of crystalline aerosols. and by the natural biologic production of spores, fibers and seeds. Even when generated by these natural processes, air pollution can have adverse effects upon the climate and the weather, upon agriculture, and upon mankind.
Human beings have long contributed to the pollution of the atmosphere. The black sooted rock walls of Canyon duChelly in Arizona are vivid reminders that from earliest times the warmth and protection of fire have brought pollutants. When people built shelters for dwelling. they brought the pollutants into the indoor living space. However. smoke from cooking and heating fires was not the only polluti n in earlier dwellings. The great castles of medieval Europe were cold and damp. and the smell of mildew lingers yet for modem-day t~urists. Since the Dark Ages, and even today in countries in which primitive conditions still exist. peasants have shared squalid dirt-Ooored shelters with their domesticated beasts, and the benefits of shared wannth have been accompanied by exposure to diseases transmitted by pests and a plethora of microorganisms that flourish in such conditions.
And what of modem people with their scientific knowledge and advanced technology? Is the air of the modem home, public buildings, and cities cleaner and
healthier than that in the past? In our more developed societies. we have de igned structures to shield us from the natural elements and to provide comfort. But in the construction of these buildings and in the creation of the infrnstnscture and transportation that are part of the overall comfort design, we have released into the environment many of the by-products of industrialization . The same natural processes that occur over millennia have been accelerated into decades, as extraction of ores and burning of fossil fuels have released metals , sulfur dioxide ($02),
carbon monoxide (CO), carbon dioxide (C02). nitrogen oxide (NOx). and many other organic and inorganic constituent into the atmosphere .
Along with a growing population and expanding economies has come greater utilization of fuels and of agricultural and mineral re ources. As a result . air pollution is no longer a local problem but alTects large segments of the world's population. Both the nature and geographic scale of air pollution have expanded since organization of municipal smoke ordinances and smoke control districts aml inspectors in the late nineteenth century. Air pollution i · no longer con idered just oot and annoying odors in industrial or urban areas. The broader definition for
atmospheric pollution developed by the Commonwealth of Mass3chuse1ts's Departmenl of Public Health in 1961 is appropriate for both indoor and outdoor air pollution today: "Atmospheric pollution is the presence in the ambient air space of one or more air contaminants or combination !hereof in such quantities and r. uch duration as to (a) cause a nuisance; (b) be injurious or, on the basis of current information, be potentially injurious to human or animal life, to vegetation or to property· or (c) unreasonably interfere with the comfortable enjoyment of life and property or the conduct of busines . "
By the end of the 1940s air pollution in the United State obtained national recognition. President Truman directed the secretary of the inlerior to he.ad the interdepartmental committee that organized the first U.S. Technical Conference on Air Pollution , held in May 1950. Five years later Congress enacted the first national legislation, the Air P llution Control Act, which was passed with the strong support of the California delegation. The act authorized $3 mill ion annual! y for five years for research training, and technicaJ assistance to states (Stem 1982). However, ic wa not until the Clean Air Act of 1963 that the federal government e tablished its right over the states to legislate air pollution on the cons1itu1ional basis of interslate commerce. The secretary of health , education. and welrare. through the surgeon general and Public Health Service, struggled for seven years to abate interstate pollution problems through complicated and slow conference abatement procedures. However during this time. Congres pa'>Secl the Motor Vehicle Air Pollution Control Act of 1965 in which the process to establish national emission standards for new motor vehicles was established. By 1he late 1960s, it was clear that the Clean Air Act of 1963 and its 1967 amendments were not sufficient to mount an effective national effort. Financial incentives alone were not adequate to establish individual state legislation and pol lution control pro_!:rams. The Clean ir Act Amendments of 1970 and the establishment of the
' in' •'n 21 Pn.'k' ·ti~'n :\,~ency (EPA) r:idicall.' · chan~i;;J the C(lur~e of JX llmion
r~h" n ~""nolPr ~nrl .Jonathan M . Samet
control. The EPA was required to establish national ambient air. that is, outside air, quality standards and given enforcement authority. Congress imposed federal mobile source emission standards, and states had to establish air pollution implementation plans in compliance with federal criteria. The national ambient air quality standards (NAAQSs) currently in existence are listed in Table I. I along with those of some other nations.
The Clean Air Act has been amended several times since 1970. In 1977 among the issues addressed by Congress was the prevention of significant deterioration of air quality by unrestricted development in areas currently cleaner than the standards. Congress also expr sed its concern about the potential for stratospheric ozone depletion , for hazardous air pollutants emitted from rela1ively few sources, and the revision of automobile standards and ambient air quality standards . Although slated for reauthorization during the 1980s, the Clean Air Act was not amended during the decade. However, in 1980 Congress created the national acid precipitation asse sment program with stalutory responsibility to prepare comprehensive scientific technologic , and economic infonnation relevant to developing policies for the control of acid deposition effects . Acid deposition, commonly referred to as acid rain, is a major environmental problem confronting the United States and Canada as well as other regions of the world. There is substantial ~vidence that the pollutants from fosi;il fuel combustion have damaged lakes, forests, and crops, reduced visibility, and perhaps have resulted in increased morbidity among exposed populations.
As we start the last decade of this century, policies and legislation lo resolve the pressing environmental problems that are no longer local-scale issues have eluded us. Ironically, as we await further amendments to the Clean Air Act to address regionaJ and global-scale air pollution concerns, we are beginning to recognize that air pollution is still very familiar to each of us in our schools, offices, and homes.
Atmospheric concentrations of contaminants depend on many factor , which in themselves vary temporally and spatially. The densi1y and inlensity of pollution sources in urbanized areas often result in higher exposures in cities than in more rural areas. Pollutants released into the atmosphere may be rapidly diluted , but mixing with the atmosphere may be suppressed by temperature inversion or modified by structures and terrain, which thereby increase surface-level pollution .
The atmosphere is never static . Contaminants are tran ported diluted, and removed by surface reactions, precipitated, or disassociated into submolecular components by solar radial ion . Reactive components can undergo transformation . A substantial fraction of the gaseous S02 and nitrogen oxide is transformed to particulate species, existing as sulruric acid nilric acid. or other acids (U.S. Congress, Office of Technology Assessment 1985). In the lower atmosphere , halogenated synthetic gases used as refrigerants propellants, and biocides have reaction half-lives that are measured in dec.ades. However. once these gases are diffused or mixed into the stratosphere by strong convective stonns, they decompose in the unfiltered ultraviolet energy of incoming solar radiation, and the
PERSPECTIVE ON INDOOR ,\ND Ol.ITDOOR AIR rou UTION 3

I Table I.I Air Quality Standards or Guidelines for Contaminants
Pollutant
Particles
Nitrogen dio"ide
Carbon monoxide
Carbon dioxide
Relevant Concentration
150 µg/m 3
150 µg/m 3
120 µg/m 3
70 µg/m 3
480 µg/m3
50 ppb
75 ppb (150 µg/m 3 )
200 ppb (400 µg/m 3 )
9 ppm (10 mg/m3 )
35 ppm (40 mg/m 3 )
3 ppm (30 mg/m3 )
55 ppm (60 mg/m1 )
90 ppm (100 mglm')
5,000 ppm (9,000 mg/m3 )
1,000 ppm (1 ,800 mg/m3 )
650 ppm
350-450 ppm
5,000 ppm 3,000 ppm 1,000 ppm 500 ppm
<1. John D. Soengler and Jonathan M. Samet
Comments
Japanese imloor standard enforced in office buildings (<3.5 µm)
U.S. EPA outdoor NAAQS for particles less than 10-µm diameter, 24-hnur average
European WHO ambient air quality guideline, 24-hour total suspended particulates
European WHO ambient air quality guideline, 24-hour thoracic particles (<I 0 µm)
Germany outdoor standard, I hour, for total particle concentration
NAAQS for N02 annual average set by EPA
European WHO ambient air quality guideline, 24 hours
European WHO ambient air quality guideline, I hour
Germany and U.S. NAAQS for 8 hours. outdoors
Germany and U.S. NAAQS for I hour, outdoors
Eurnpean WHO, I hour European WHO, 30 min nol
to be exceeded in 8 hours, outdoors
European WHO, 15 min not to be exceeded in 8 hours, outdoors
OSHA" standard, 8 hours Japanese indoor air quality
standard not to be exceeded in office buildings; used as indicator of adequate building ventilation without other sources
Commonwealth of Massachusells recommended value for indoors
Typical outdoor levels in ur-ban areas
Indicates 2.25 cfm/person Indicates -4 cfm/person Indicates - 15 cfrn/pcrson Indicates -50 cfm/ person
(co11ti1111ed)
Pollutant
Formaldehyde
Volatile organic compounds (VOCs) (e.g., benzene, styrene, chloroform, methylene chloride, ethylene oxide, tetrachloroethylene)
Styrene
Tetrachloroethylene
Toluene
Trichloroethylene
Semivolatile organics (e.g., chlorinated and brominated hydrocarbons used as insecticides, pesticides, fungicides; polycyclic and aromatic hydrocarbons from combustion, preservatives, transformer fluids)
Table 1. l (Continued)
Relevant Concentration
1.25 ppm (I ,500 µg/m3)
I ppm 0.7 ppm
0.4 ppm (480 µg/m 3 )
0.25 ppm
0. 1 ppm (120 µg/m 3)
0.08 ppm (100 µg/m 3 )
2 mg/m3
800 µg/m3
5 mglm3
8 mg/m3
I mg/m3
5 µg/m 3
... . -
Comments
ACGJHh occupational TLV (threshold limit value)
OSHA, 8 hours, workplace Sweden. maximum allowed
in older buildings Department of Housing and
Urban Development limit for new mobile or manufactured housing
NRCc guide to safeguard against irritant effects for vast majoriry of public
Swedish limit for new homes; ASHRAE indoor guideline
European WHO 30-min outdoor guideline
Mixtures of VOCs commonly found indoors associated with symptoms and performance in Danish studies; several specific voes are known or suspected human carcinogens-EPA has developed cancer risk values; several voes have occupational standards
European WHO 2-hour outdoor guideline for noncancer/odor effects
European WHO 24-hour outdoor guideline for noncancer/odor effects
European WHO 24-hour out-door guideline for noncancer/odor effects
European WHO 24-hour outdoor guideline for noncancer/odor effects
NRC guideline for chlordane concentration in residences; has also been applied lo other termiticides
EPA has developed cancer · risk values for several
known or suspected human carcinogens
Occupational standards exist for many of these compounds
For general guideline, the indoor levels should not
(continued)
PERSPECTIVE ON INDOOR AND OUTDOOR AIR POLLUTION 5
Pollutant
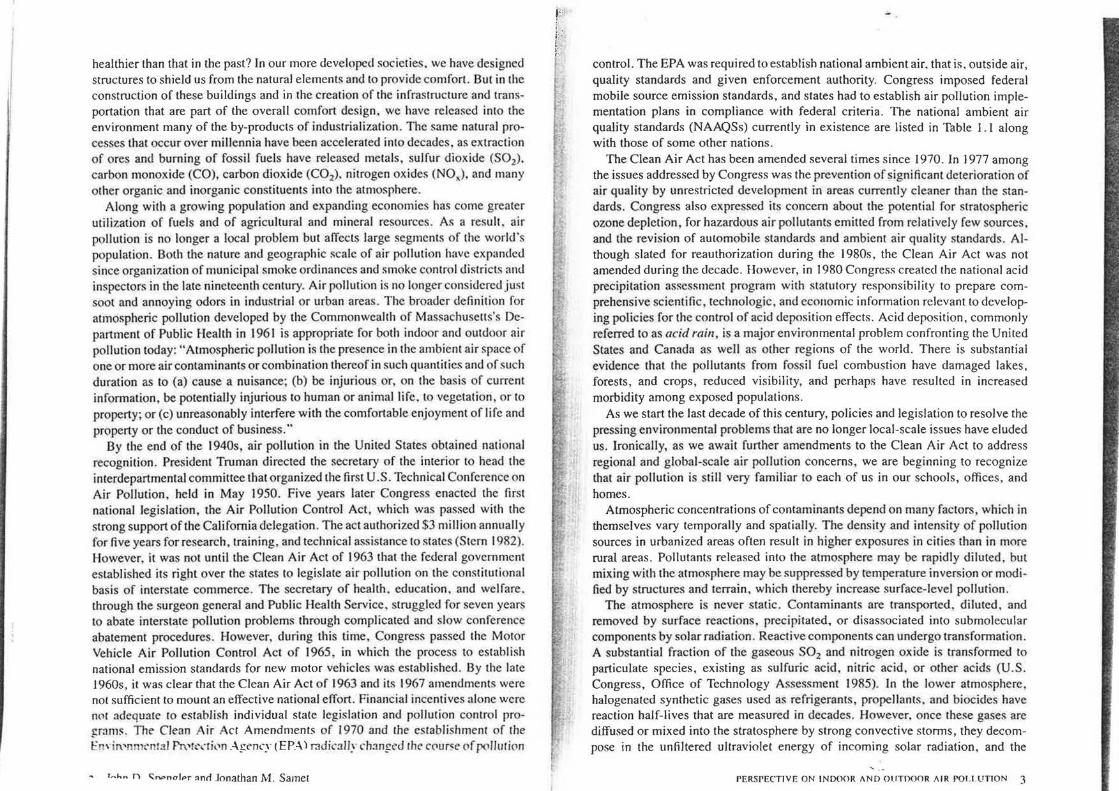
Asbestos fibers (e.g., chrysotile. crocidolite, and other amphiboles)
Radon and radon decay products
Table I. I (conlinued)
Relevant Concentration
0.2 fibers/cm3
0.1 fibers/cm'
Equal to or less than ambient fiber concentration
22 pCi/liter (400 Bcq/m3 )
20 pCilliter
11 pCi/liter
8 pCilliter
5.5 pCi/liter
5 pCi/liter
4 pCilliter
3 pCilliter 2 pCi/liter
0 0SHA, Occupational Safety and Health Administration , •ACGIH, American Conference of Governmental and Industrial Hygienists. 'NRC, National Research Council.
Comments
exceed ambient levels, cause irritation, or contribute to a lifetime cancer risk >I0-5
OSHA. 8-hour workplace average, fibers >5-µm length;
OSHA action level requiring respiratory protection for workers
EPA reoccupancy requirements afler removal by transmission electron microscopy; nonspecific to fiber type
Swedish action level for required remediation
Canadian Radiation Protection Bureau
U .K. action level for existing dwellings
National Council on Radiation Protection action level
Sweden, design level for new buildings
Bonneville Power Administration action level
EPA limit for uraniumprocessing site homes; EPA action guideline
U.K . new dwelling levels ASHRAE guidelines in Stan
dard 62-1981
released atomic components of chlorine. bromine, and fluorine can react quickly to reduce the amount of stratospheric ozone.
In the potential danger that halogenated hydrocarbons pose to the ozone and radiative balance of the earth's atmosphere (Ember et al. 1986), we see an example of a process that sets human activity apart from the "natural" processes of atmospheric pollution. Not only have humans hastened the pollution process, we have also added to the polluting substances volatile and sernivolatile organic molecules that are not produced by natural processes. Many of the polluting compounds are associated with toxic or hazardous air pollutants released from fuel additives, paint solvents, cleaners, degreasers, and insecticides. The pollutants are found outgasing from soils and water near industrial and municipal waste sites.
6 John D. Spengler and Jonathan M. S;imet
Perhaps more important from a human exposure perspective, they are emitted into our indoor environments from furnishings, structural components, and the many other products that modem society has developed.
As we examine air pollution in the world today, we see many reminders of the problems that accompanied urbanization in ancient Rome and the growing cities of Europe in the Middle Ages. Air pollution came from heating and cooking fires, from brick kilns, iron works, smelting, and burning garbage. In the seventeenth century, diarist John Evelyn wrote:
It is this horrid smoke, which obscures our churches and makes our palaces look old, which
fouls our clothes and corrupts the water so that the very rain and refreshing dews which fall
in the several seasons precipitate this impure vapor, which with its black and tenacious quality, spots and contaminates whatever is exposed to it. (Evelyn 1661)
Yet today, the primary emissions of sulfur oxides, nitrogen oxides, CO, particulates, and metals are severely polluting many cities of Asia, Africa, Latin America, and eastern Europe. Even in the nations that have addressed the problem of primary emissions from heavy industry, power plants, and automobiles, new problems are posed by toxic compounds from the newer, modem industries and a more subtle form of air pollution caused by the secondary formation of acids and ozone.
Understanding the changing nature of air pollution problems in the United States and developing countries is important to recognizing the relevance of indoor exposures. The contaminants in the outdoor air contribute to human exposures directly, and indirectly if they penetrate indoors . Indoor sources such as unvented combustion, evaporation of organic compounds, abrasion, release of microorganisms, and intrusion of radon, a soil gas, can be the predominant contributor to human exposures, particularly in locations with low ambient levels. However, for reactive air pollutants formed in the ambient air, human exposures are determined primarily by outdoor concentrations . Ozone and acidic aerosols are examples of outdoor reactive pollutants for which reduction of outdoor concentrations has been shown to reduce indoor concentrations.
The global environmental monitoring system (GEMS), a project sponsored by the World Health Organization (WHO) and the United Nations Environment Program (UNEP), was created in the early 1970s to monitor air quality in countries all over the world. Many urbanized areas in developing co.untries still have ambient S02 and particulate pollution levels that are ten to one hundred times the concentrations currently experienced in the United States and western Europe. In these situations, human exposures will be proportionally more influenced by ambient conditions . Exposure studies in Zagreb, Yugoslavia, demonstrated that the ratio between average personal exposure and respirable particle levels outdoors decreases with the increased outdoor concentration. Sega and Fugas (1982) implied that with outdoor pollution, personal exposures are approximated by the ambient concentrations.
PERSPECTIVE ON INDOOR AND OUTDOOR AIR POLLUTION 7

AMBIENT AIR POLLUTION IN THE UNITED STATES
In examining exposures and concentrations that can occur indoors, comparison with ambient air pollution levels is informative. In the United States and Canada, standardized ambient monitoring for several pollutants has been conducted since the 1950s by federal, state, local, and privately funded organizations. The monitoring sites have been established to determine compliance with standards, to make baseline regulatory measurements, to document trends in rural areas, and to accomplish other special purposes. Ambient monitoring has also been conducted throughout most of western Europe. However, methods and protocols vary, making the direct comparison of concentrations difficult. Comparisons of particle concentrations across countries are particularly difficult because particles vary by size, composition, and other attributes. Some instruments determine mass concentration gravimetrically, and others infer dust loadings by the indirect methods of transmission or reflectance. Comparison of particulate concentrations should, therefore, include a reference to the size fraction collected and the analytical methods.
In the United States and other countries with established air pollution control programs, the ambient concentrations of many contaminants have decreased. Soot-grimed cities, with visible emissions from factories, automobiles, and stacks on buildings, have almost disappeared. There has been a marked decrease in ambient concentrations of total suspended particulates (TSP), S02 , lead and other metals, and CO (U.S. EPA 1989). Fossil fuel-related organic carbon compounds such as benzo[a]pyrene have also decreased substantially since the 1960s. These decreases reflect many factors, including industrial and automobile controls, new electrical power-generating facilities with taller stacks built away from the urban areas, the burning of cleaner fuels with lower sulfur content, and a decline in manufacturing-related industries.
The cleanup of ambient air pollution in the United States has been under way for two decades. As TSP decreased during the 1970s, so did many of the metals and organics included in the particulate matter. Many industrialized urban areas had concentrations of benzo[a]pyrene exceeding 10 ng/m3 when coal was burned in homes, factories, and buildings; today, the annual concentrations are below I ng/m3 (U.S. EPA 1982).
Sulfur dioxide concentrations in urban areas have decreased since the 1960s. A restriction to low-sulfur fuels for residential and commercial use has resulted in impressive improvements in air quality in many cities in colder climates. Presently, all major population centers are in compliance with the NAAQS for S02 .
Annual emissions of S02 have decreased by 15 percent from a 1970 high of more than thirty million tons per year.
Carbon monoxide is emitted primarily by vehicle sources. Federal emission control standards for new vehicles resulted in a 77 percent reduction of emissions between 1975 and 198 l. This decline alone has been responsible for marked improvement in ambient CO levels. For example, Figure I. I shows trends of CO
8 John D. Spengler and Jonathan M. Samet
12
-E a. a. • 9-Statlon Ave. -z 9 All-Station Av~ 0
0
~ a: .... 6 . z w 0 z 0 0
3 0 0
0 68 70 72 7' 76 78 80 82 8' 86
YEAR
Figure 1.1. Trends for third-quarter daily maximum hour CO concentrations (ppm) in the south coast air basin, Los Angeles. Source: Kuntasal and Chang ( 1987). reprinted with permission.
in the south coast air basin of Los Angeles and Orange Counties; a downward trend in maximum hourly CO concentrations was measured during the third quarter of the year between 1968 and t 985 (Kuntasal and Chang 1987). Although similar progress has occurred in many urban areas, with the increase of vehicle miles traveled and congestion in localized "hot spots," the CO concentration still exceeds the NAAQS in many cities.
In contrast to the improvements in ambient concentrations of S02 , TSP, and CO, levels of other pollutants have either shown no change or increased. As newer vehicles have complied with federal mobile source emission standards, the average model year hydrocarbon emissions have been reduced by 88 percent and emissions of nitrogen oxides by 50 percent between 1973 and 1982. These reductions are offset, in part, by increased vehicle miles traveled and a trend toward an aging fleet of cars. Jn terms of actual reductions in transportation-related emissions, only 38 percent hydrocarbon and 2 t percent CO reductions have been realized (Walker 1985). However, both smog-chamber studies and carefu I analysis of data have revealed that ozone production from hydrocarbons becomes more efficient at lower concentrations (Altshuller 1983; Fox, Kamens, and Jeffries 1975). In certain areas of the country, population growth and urban sprawl have caused total automobile and stationary sources of ozone precursors to increase.
PERSPECTIVE ON INDOOR AND OUTDOOR AIR POLLUTION 9
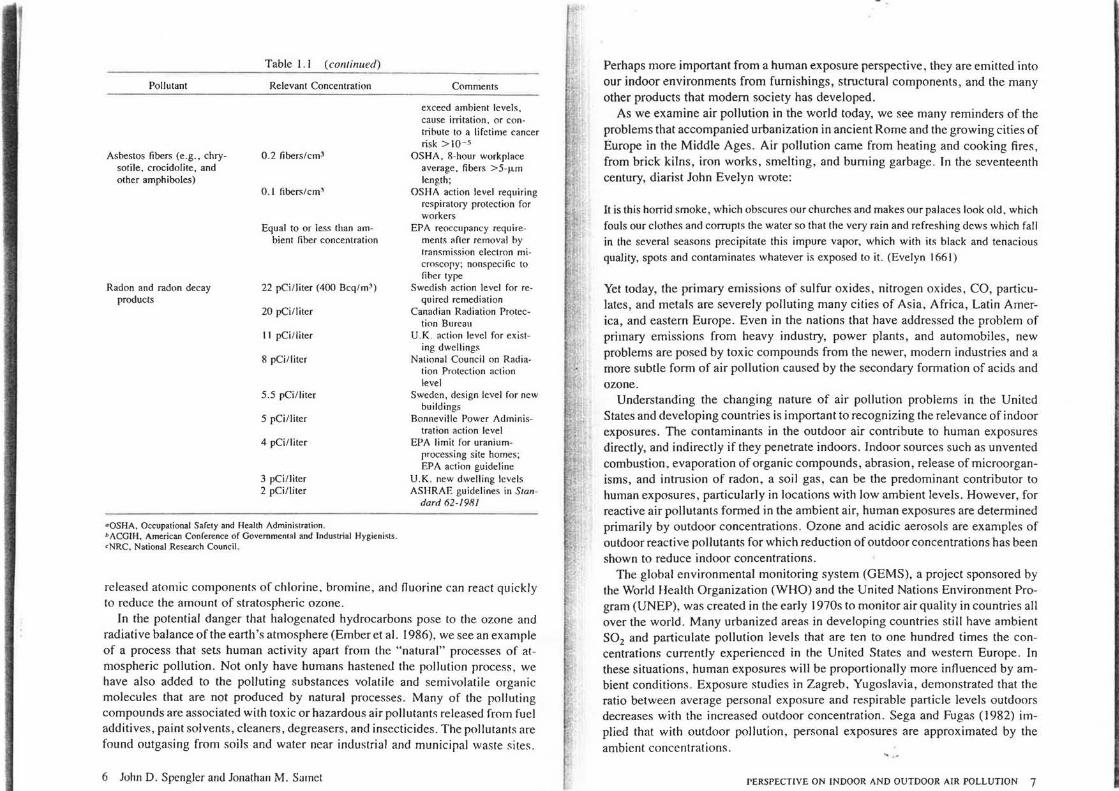
From the mid-1970s to the early 1980s, there was a 2.3 percent per year overall increase in ozone in Texas and a 7 .8 percent per year increase in the number of hours during which ozone concentrations exceeded 120 ppb, the U.S. one-hour standard. In California, the number of hours exceeding I 20 ppb decreased by 5.2 percent per year through the mid- I 980s (Walker 1985). Other measures of ozone in California, such as the annual mean concentration, show little change. There has been a decrease in ozone in Los Angeles, as shown in Figure 1.2, and a noticeable reduction of "smog" days; however, high ozone exposures in the area do still occur.
Most of the U.S. population east of the Mississippi River experiences spring and summer ozone conditions that produce at least one hour exceeding I 00 ppb. EPA estimates that 107 communities and 135 million people live in areas that exceed the NAAQS for ozone. In Europe, elevated ozone levels, with the associated drop in visibility and increase in forest damage, are now being recognized.
Ambient air pollution related to automobile and truck emissions is increasing in most developing countries. The growing population of automobiles without emission controls in many rapidly expanding urban areas in these countries has created serious ozone problems. Mexico City has perhaps the worst of these conditions. Because of the intense sunlight at high altitude and the congested traffic, Mexico
30
- 25 - ,, E
..c: I ~ a. I \ a. - • • .. ~ ... z 20 I • • '\
\ • \ 0
~~ I • \ I ..
JI , ~ • ',/ ' • .... a: 15 - • t-z w (.) z 10 0 • 9-Statlon Ave. u
M o 13-Stat!£!!_ Ave . 0 5 e !-S_!_al_!pn_Av_!.
0 66 68 70 72 74 7.6 78 80 82 84 86
YEAR
Figure 1.2. Trends. fo'. third-quarter daily maximum hour O, (oxidant) concentrations (ppm) across the south coast air hasm m Los Angeles. So11rce: Kuntasal and Chang ( 1987). reprinted with permission.
City is already experiencing ozone levels that routinely exceed 200 ppb. Through complex chemical reactions, precursor gaseous emissions of nitrogen
oxides and S02 can be converted to acidic gases and particles. Common acidic species include sulfuric acid, ammonia bisulfate, acidic particles, and nitrous and nitric acidic gases. The sulfate particulates are in the submicron size range and can serve as efficient condensation nuclei and efficiently scatter visible light. Because 80 percent of S02 emissions in the United States occurs in the eastern third of the nation, it is not surprising that sulfate particles are the most prominent fraction of the inhalable-size particles (U.S. EPA 1982).
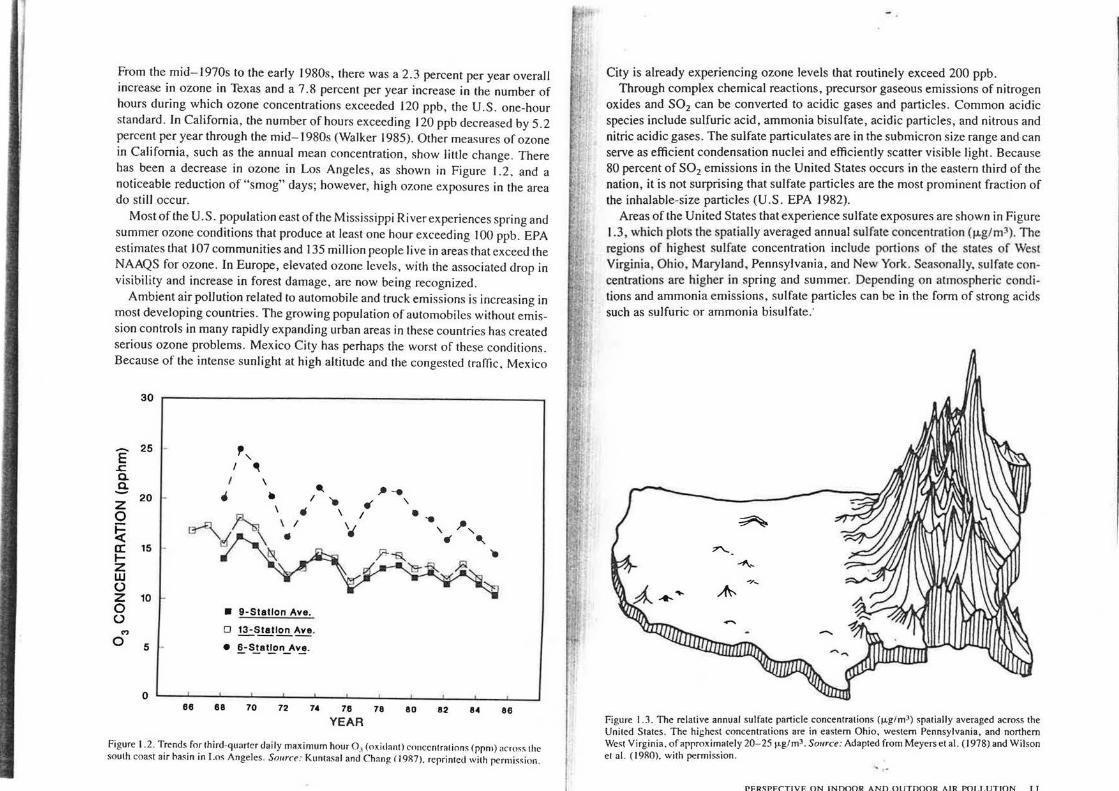
Areas of the United States that experience sulfate exposures are shown in Figure l.3 which plots the spatially averaged annual su'lfate concentration (µg/m3). The regions of highest sulfate concentration include portions of the states of West Virginia Ohio, Maryland, Pennsylvania, and New York. Seasonally, sulfate concentrations are higher in spring and summer. Depending on atmospheric conditions and ammonia emissions, sulfate particles can be in the form of strong acids such as sulfuric or ammonia bisulfate:
Figure 1.3. The relative annual sulfate particle concentrations (µglm 3) spatially averaged across the United States. The highest concentrations are in eastern Ohio, western Pennsylvania, and northern West Virginia. of approximately 20-25 µg/m3. Source: Adapted from Meyers et al. (1978) and Wilson et al. (1980), with permission .
PERSPECTIVE ON INDOOR AND OUTDOOR AIR POLLUTION 11

Atmo pheric concentrations of acidic aerosol and ga es have not been measured on a routine basis in the United States. Monitoring has been done as a component of various research projects. using different methods and averaging times . Most of the published literature is summarized in the United States Environmental Protection Agency's Acid Aerosols Issue Paper (U.S. EPA 1989).
Acidic aerosol events can occur at any time during the year but are more intense and more freq uent during the warmer months . Thus, the highest atmospheric acid concentrations occur at times when people are more likely to be outdoors . Measurement from the mid- United States indicate that duily acid particle concentrations can exceed 15 µg/ rn3 H 2S04 equivalence (Spengler et al. 1989). More recent measurements during the summer of 1988 indicate that daily levels can exceed 20 µ..g / m3 H2S04 . Spengler and co-workers ( 1989) documented an acid aerosol episode in southern Ontario. During this two-day event the highest hourly concentration approached 50 µ..g / m3 H2S04 equivalence. Other episodic acid events in the eastern United States have been shown to last a few h ur to a few days in duration and result in substantial population exposures (Spengler et al. 1986).
Concern over ambient acid concentrations is recent in the United States. In London however, daily measurements of sulfuric acid were made between J 963 and 1973. Unlike conditions in the United States, acidity increa ed during winter months probably because of increased healing fuel use and adverse meteorologic conditions (Ito and Thurston 1987).
Other acid pecies besides sulfuric acid and ammonia bisulfate may be present in the atmosphere. In the Los Angeles basin of outhern California. acidic gases and acidified fog are of concern. The acid species commonly identified include nilric, hydrochloric, acetic formic, benzoic, and other organic acids . Hourly concentrations in the summer clearly show nitric acid increasing late in the morning to an afternoon maximum around 3 P.M. Nitric acid (HN03) dominates during the daytime but there is a substantial amount of fom1ic and acetic acids at night. The pattern is consistent with that of ozone and indicates the reactive chemistry of automobile-related hydrocarbon and nitrogen oxide emissions (Grosjean Williams, and Van Neste 1982).
We have focused on only a few of the many ambient pollutants .. Several monitoring program have examined an array of trace elements and organic compounds in the air. The focus is not on the concentrations of each component but rather on the interpretation. lo infer source contributions. Using a variety of multivariate techniques, the fractional contributions to ambient particulate pollution can be a cribed toa few dominant sources. These techniques have been applied in several areas in the United States which di ff er in local and distant source contributions (Gordon 1988). Morandi (1985) studied the sources of urban particulate pollution in three New Jersey cilies (Figure 1.4). Secondary sulfates contributed the most mass to the measured concentrations of re pirable particles at all three locations . Soil dusl. automobile emissions, and oil burning contributed to ambient particle concentrations. The cities differed in the proportion contributed and in the presence of ci1yspecific indu trial sources. In contras! similar work by Cooper, Watson and I Junt-
12 John D. Spengler and Jonathan M. Samet
CAMDEN
!PM mass • 47 .1 µg/m3
NEWARK
!PH mass = 52 .8 µg/m3
ELIZABETH
!PH mass • 44.7 µg/m3
S£COHOARY SULFAlE SECOHOi\RY sutrAT£
Figure 1.4. Source contributions (percent) to inhalable partic.ulate matter (IMP) _in t~ree New Jersey urban areas . Source: From Toxic Air Pollution : A Comprehensive S111dy of Non-Crrterra ~rr Po//uran!s. by Paul J. Uoy and Joan M. Daisey. Copyright 1987. Lewis Publishers. Inc. , Chelsea. Mich. Used with
permission
zicker (1979) in Portland showed less sulfate contribution and more impact from vegetative burning. Thus, there are substantial regional differences in sources. In the West, agricultural and domestic wood burning are noticeable sources, and the
sulfur fraction is less important.
AMBIENT AIR POLLUTION IN THE INTERNATIONAL SCENE
Many cities throughout the world have heavily contaminated air. Uncontrol~ed industry, growing automobile congestion, polluting cooking methods, and heatmg fuels cause cities of eastern Europe, Asia, Africa, and South America to resemble such cities as London, Pittsburgh, and New York thirty years ago. Since 1973 the WHO through its GEMS has been documenting total suspended particulate and S0
2 pollution. Beginning in 1978, N02 and lead have. been moni~ore? at tra~c
related stations. By 1978, about 43 countries or areas with 170 momtormg stations were participating (WHO 1978). In a study of developing countries, Kirk Smith (1988) illustrated the relationship between pollution and national wealth by plotting urban particle air pollution against personal income (Figure 1.5). _It is not uncommon for winter days in Beijing to be dark and gray because particle concentrations exceed 500 µg/m3 (WHO EHE/EFP/85.5). Similarly, residential coal burning in the black townships of South Africa casts a thick morning pall of pollution in which particle concentrations can exceed I ,000 µg/m 3 (Kemeny, Ellerbeck, and Briggs 1988; Tshangwe, Kgamphe, and Annegam 1988). l.n fac~, regardless of whether or not indoor pollution sources exist? where the ambient air is heavily contaminated, human exposure can be dommated by the outdoor
pollution.
PERSPECTIVE ON INDOOR AND OUTDOOR AIR POLLUTION 13

cc: <( UJ >-cc: UJ c.. z 0 Vl cc: UJ c.. ~
"' cc: .r.... UJ "" c.. ~
f- 0 u.,, ::> Cl • 0 Vl cc: • c.. ::>
....J <(
50,000
10,000
5,000
~ 1,000 ..... f<( z Vl Vl 0 cc: <!>
500
10
CIJ hew York City. U.S.A.
Hontru I, Canada I us I Ku"-a1t _I-~--'
fotyo. Japan ~Copenhagen. Denmark
Frankfurt. F.R.G .
~ ffelbournt. Australia Sydney. Austral fa I I I
I J etrmlngham. United Kingdom
[TI Caracas, Venezuela
Zagreb, Yuqoslavia c:::p I I kua la Lumpur, Ha lays 1 a
Lisbon, Portugal~ Rio de Janeiro, Brazil
Call. Colombia! I Medellin, Colombia
--~-' --~-.....__B•nqkok. Thal land Han fl a. Phi llpplnes I J _ Jakarta. Indonesia
Accra, Ghana L.f--'--- --r----
50 100
TOTAL SUSPENDED PARTICULATES (micrograms per cubic meter of air)
500 1,000
Figure 1.5. Total suspended particulate concentrations (µg/m, in urhan areas versus the grnss natinnnl product per person I U.S. dollars]). Source: Smith ( 1988). reprinted with pemiission.
INDOOR AIR POLLUTION IN THE INTERNATIONAL SCENE
Although a~bient ai~ pollution in developing countries is a problem mainly in urban areas', indoor arr pollution can be quite high even in remote villages . Many of the world spoor people cook and heat their homes with biomass fuels of wood crop residue, or dried animal dung. Some cultures use coal or briquettes mad~ from powd~red coal or charcoal. In his book Bi<~fuels. Air Pollution and Health: A Global Review (1987), Kirk Smith asserted that exposure lo emissions from hio-
14 John D. Spengler and Jona!lwn J\-1. Same!
mass cooking and heating fuels is an important contributing factor to the incidence of early childhood respiratory infections and the development of chronic Jung disease . Smith recounted that in numerous locations around the world the burning of wood, coal, charcoal, crop residue, and animal dung routinely produces indoor particle concentrations exceeding I .000 µg/m 3 , benzo[ a ]pyrene concentrations exceeding l,000 µg/m 3 , and CO concentrations exceeding 35 ppm, levels no longer encountered in developed countries with established ambient air pollution control programs. Concentrations in rural village huts, whose residents bum biomass fuels, exceed by factors of l 0 to 100 the concentrations of particles and organic particulate matter in homes with modem cooking and heating appliances . Studies in India, Africa, China, and Nepal illustrate how universal these conditions are among poorer populations of developing countries (Smith l 987).
Human exposure to air pollutants is determined by concentrations outdoors and indoors. Although this book focuses on the health effects of indoor-generated contaminants, we deliberately set the perspective that contamination of outdoor air has important implications for human health and the earth's ecosystem. Most persons participate in outdoor activities and spend more time outdoors when the weather is good, thereby increasing their exposure to photochemically reactive pollutants like ozone, to acid sulfates, and to acid nitrate compounds. However, these and other less reactive pollutants are also brought into the indoor environment by natural and mechanical ventilation. The pollution of indoor air by ambient air can be minimized by reducing the air exchange, sealing the buildings, and by using filters, condensation coils, and duct work . With an effective ventilation system, contaminants that do penetrate to interior spaces go through several processes that speed removal. Most indoor environments have a large surface area compared with the volume; gases, vapors, and particles can be absorbed or can stick to these surfaces. Larger particles settle out because the indoor air currents are typically one-tenth to one-hundredth of the velocity of outdoor currents. Unless the air exchange is quite rapid, even nonreactive contaminants have lower integrated concentrations indoors than outdoors.
Most indoor living or working environments have air pollutant sources. Even people and pets can be sources of fibers, particles, organic vapors, and microbiologic material. Additional pollution comes from heating and cooking combustion sources, emissions from tobacco, abrasion of surfaces, outgasing of vapors, intrusion of soil gases, and a plethora of biologic sources; thus, it should not be surprising to find indoor environments that are substantially more polluted than the nearby outdoor air. High concentrations of pollution in indoor settings can, at times, dominate short- and long-tenn exposures and may be associated with discomfort. irritation. illness, and even death.
' ..
PERSPECTIVE ON INDOOR AND OUTJ)OOR AIR POLLUTION 15

ACCEPTABLE INDOOR ENVIRONMENTAL QUALITY
Human comfort has always been the primary focus of the design and operation of ven1ilation y terns for buildings. The element of comfort include. among other factors, cemperature, cemperature gradients draftiness. humidity, noise , odor. , and lighting. Subjective component al o influence an occupanl 's perception of the environment. How comfortable, relaxed, or safe a person feels about an indoor space might depend on the furnishings , decoraLions , access to environmental conlrols, view of the exterior, neatness cleanliness. and perception of hazard . Hodgson and co-workers ( 1987) added vibration to the elements that influence com fore. We do not yet have comprehensive data on the bounds for these factors which will lead to a judgment that indoor environmental quality is acceptable.
The American Society of lleating Refrigerating. and Air-Conditioning Engineers (ASHRAE) developed consensus guideline for ventilation rcquiremems. Depending on the structure and use of the internal pace, ASHRAE tandards require different ventilation rates, measured as the cubic feet of outside air per minute per person. The current ventilation standards are published in a document entitled "Venti lation for Acceptable Indoor Air Quality," and are referred to as ASH RAE Standard 62- 1989. This revised tandard recommends 20 cfm/ person as lhe minimum for offices and offers different requirements for other selling . although not less than 15 cfm/person in nonresidential buildings. The previ us ver ion (ASHRAE Srant!ard 62- 1981) advised 5 cfm/person as a minimum for nonsmoking environments and 25 cfm/person for areas with smoking permined . At 15 cfm/person, C02 levels wou ld be about 1,000 ppm in the absence of unvcnted combustion sources . In the pre ence of non-C02-producing sources. even 1.000 ppm of C02 might not be a valid indicator of adequate ventilation .
Table 1.2 Ventilation Standards and Guidelines for Residencesa
Region
Canada California Sweden France South Dakota Wisconsin Northwest Power
Planning Council ASH RAE
Standard
0 .5 ACHb 0.7 ACH 0.5 ACH 0.5 ACH 0.5 ACH
0.35 ACH
15 cfm/person 100 cfm
Comment
Mechanical ventilation, mobile homes Standard for '"tight'" new residential buildings All new structures with mechanical ventilation All new structures with mechanical ventilation All under consideration for mechanically and
naturally ventilated structures
Proposed in the new revised ASHRAE Standard 62-1989 for living areas
ASHRAE Sta11dard 62-1989 Installed mechanical exhaust capacity
(!Standards or guidelines for minimum air exchange or ventilation. b Air exchanges per hour. 0.5 ACH indicares that one-half rhe volume of residence would be exchanged with outside air. In reality. it is applicable only with mechanical venrilation sy.icm. Minimum air cxdrnnge can not be guaranteed by construction alone.
... lr.hn n ""Pnolpr <>nrl lon:ilhan M. Samet
Table 1.3
Area
General living areas and bedrooms
Kitchens
Toilets, bathrooms
Basements, utility rooms
Garages (separateY Garages (common)<
Area
General living areas
Kitchens
Electric stoves 2 rings
>2 rings Gas stoves
Toilets
Ventilation Standards for Rooms within Residences
U.S. Standards
ASHRAE Standard 62-1973; Single-Unit Dwellings
(cfm/person)
Minimum Recommended
5 7-IO
20 30-50
20 30-50
5 5
Proposed Northern European Standards
Minimum
Minimum = 8 dm/bed
ANSl 0/ ASHRAE
Srandard 62-1980; Single or Multiple
Units
Minimum
15 cfm/person
100 (intermittent exhaust capacity)
25 (continuous or windows)
50 (intennittent exhaust capacity)
25 (continuous or windows)
NA•
100 cfm/car space 1.5 cfm/ft2
Continuous = 0 .5 ACH" (measured in spring and autumn) Continuous = 20 cfm, in addition to one of the following, depending
upon stove type:
Minimum = 60-cfm capacity exhaust fan Exhaust fan with capacity to remove 80% cooking fumes Exhaust fan with capacity to remove all combustion products
Continuous = 20 cfm. in addition to either a 60 cfm-capacity exhaust fan or operable windows
"ANSI. American National S1andanls ln•tirule
bNA. "'''applicable. rRecommended by ASHRAE Srnndard 62-1989. "Air change• per hour.
Tables 1.2 to 1.4 summarize some ventilation standards and guidelines for residence and commercial buildings.
In the absence or pollution sources, ventilation air serves 1hree purposes. A minimum amount of fresh air is required lo replace respired oxygen. Under mosc circumslances. less than I cf ml person is needed . About 2 .5 cf ml person is needed to dilute C0
2• ke ping concentrations below 5.000 ppm. Therefore. ventilation
ra1es above the minimum of 2 .5 cfm/person are required to dissipate odors. moisture. and heat. Few people would work without complaining in an environment that hall only the minimum ventilation rate. Thus. ve_nlila1ion is al~o needed
PERSPECTIVE ON INDOOR AND OLITOOOR AIR 1'01 LUTION I 7

Table 1.4 Outdoor Air Requirements for Ventilation in Commercial Facilities
Location
Food and beverage services Dining rooms Kitchens Cafeterias, fast food Bars and lounges
Hotels, motels, resorts Bedrooms Bathrooms Lobbies Conference rooms Assembly rooms Gambling casinos
Offices Office spaces Meeting and waiting Smoking rooms
Retail and shops Sales floors Malls I arcades Barber and beauty Health spas
Sports and recreational Discotheques Bowling alleys Playing floors Spectator areas Jee arenash Swimming pools
Theaters Lobbies and lounges Auditoriums
Transportation Waiting rooms Vehicles
Educational Classrooms Laboratories Training shops Music rooms Libraries Athletic lockers Corridors
Hospitals, nursing and convalescent homes
Patient rooms Medical procedure rooms
Estimated Occupancy (persons per 1,000-ftJ or JOO-mt floor area)
70 20
100 100
5
30 50
120 120
7 60 70
30 20 25 20
100 70 30
150
150
150 150
50 30 30 50 20
JO 10
18 John D. Spengler and Jonathan M. Samet
Ventilation Requirement (cfm/person)
ASHRAE 62-1981 Smoking Nonsmoking
35
35 50
30• 50• 15 35 35 35
20 35 50
25 10 35
35 35
35
0.5
35
35
25
35 35
35d 35
7 10 7
10
15• 25•
5 7 7 7
5 7
5 5
20 15
7 7
20 7
7
7
5 10 7 7 5
ASHRAE 62-1989
20 15 20 30
30• 35• 15 20 15 30
20 20 60
15 20 25 20
25 20 15 0.5< 0.5<
20 15
15 15
15 20 20 15 15 0.5 0. 1
25d 15
(continued)
Table 1.4 (Continued)
Ventilation Requirement (cfm/person)
Location
Operating rooms Recovery/intensive care
units
Estimated Occupancy (persons per 1,000-ftJ or IOO-m2 floor area)
20 20
Source: Adapted from ASHRAE 62-1981 and 62-1989. ocfm/room.
ASHRAE 62-1981 Smoking
•If area has ice cleaner with internal combustion, add special ventilation . <cfmfrt2 based on surface area of ice or pool. •cfm/bed
Nonsmoking
40 15
ASH RAE 62-1989
30 15
to reduce odors and maintain comfort. More than fifty years ago, Yaglou and coworkers (1936, 1937) investigated the acceptability of various ventilation rates. Most experiments were conducted in a chamber that was occupied by the experimental subjects, and the ventilation rate to the chamber was modified. Occupants and visitors were asked to smell the air and rate its acceptability. Through a series of experiments, Yaglou determined that a minimum of I 0 cfm/person was required to provide an "odor-free" indoor environment. This approach assumes that the outdoor fresh air is odor free. Yaglou's experiments have been the primary reference for codes and standards for the last forty years.
Our appreciation of air involves more than just odor or a chemical sensation. We sense temperature. The sensation of heat is dependent upon the accompanying humidity and air motion. The relationship between temperature and humidity has led to the development of an "effective temperature" that relates to comfort . The definition of effective temperature is that temperature at which saturated air would provide the same sensation of comfort as does the actual temperature and humidity. Of course, the insulating property of clothing modifies the perception of comfort.
The concept of effective temperature has practical value. On a cold dry winter day, the relative humidity of a home typically might be 20 percent. With the heat set at 20°C (69°F), increasing the relative humidity to 70 percent would create the sensation of warming the air by close to 4°C, and the temperature would feel more like 75°F. In the summer, very low humidities make hot weather more bearable because of evaporative cooling of the skin.
Most people are familiar with the concept of wind chill. Skin exposed to wind and cold temperatures will have the sensation of lower temperature. Body heat is advected away more quickly with high wind speeds, causing more rapid cooling of heated surfaces . This phenomenon has applications to indoor environments. By the middle of one of the hottest summers on record for the northeastern United States ( 1988), fans were sold out in most commercial retail stores. Since blowing air across the body gives the sensation of cooling, the sensation of air movement in buildings, cars, and homes (drafts) is critical to comfoi:t. Too little air movement
PERSPECTIVE ON INDOOR AND OUTDOOR AIR POLLUTION 19

can give the feeling of stuffiness, and too much draft can result in feeling chilled. Even without pollution, comfort and acceptable indoor air quality are achieved
with an appropriate balance among several factors, including temperature, relative humidity, odors, and airflow. Figure 1.6 describes a rather broad comfort and human tolerance zone. People feel most comfortable if the indoor air temperature is between 20 and 27°C (68 and 80°F) with relative humidities between 30 and 70 percent.
A broader definition of acceptable indoor air quality might also consider physical, chemical, and biologic contaminants . However, of the numerous contaminants that have been identified indoors, standards or guidelines have been published for only a few. In many instances, the standards and guidelines are based on ambient air quality or occupational standards. Some of these values have been modified in consideration of the differences between occupational settings and residences , public buildings, and offices . However, for mo. t indoor contaminants, cpi<lemiologic studies conducted on the exposed popula tions have not been done, and relevant guidelines have not been prepared. fur example, we lack guidelines for most of the numerous volatile organic compounds identified in indoor air
quality surveys. There is no universally adopted comprehensive definition of acceptable indoor
air quality. This is understandable given the diversity of sources and indoor environments. We have prepared a list of air quality standards and guidelines that have been applied to indoor environments (see Table l. l ). Some are standards promulgated by countries or states; others are suggested only as action levels and are not enforceable. Still other values are based on occupational standards or recommendations from professional organizations . The list is not comprehensive; we recognize that even suggesting a universal guideline for many of the indoor contaminants discussed in this book is unreasonable at this time . The levels set fi.>r1h ll>day may m>t pnwe adequate to protect the entire population against all lll!lg-t..-nn h..-:1lth effects. Presentation of these standards here does not imply endorsement by the authors; they are intended merely to serve as a guide to the reader.
Standards should recognize the functional use of the indoor space and characteristics of the occupants. It might be reasonable to have different values for the same contaminant in a preschool and in a nursing home . Contaminants with chronic effects might have limits appropriate for homes, for example, where we may spend two-thirds of our lives, but not for sports arenas. Even in homes, concerns about carcinogenic pollutants may be different for young children than for elderly residents . For example, the response to a slightly elevated radon concentration in the basement might depend on occupant ages and expected length of residency.
Subjective judgments about acceptable indoor environmental conditions are made daily. For comfort and irritation effects, nonsensitized individuals can tolerate a broad range of conditions. In part, tolerance of indoor environmental conditions reflects the perceived benefits derived from that space. Breathing passive
20 John D . Soengler and Jonathan M . Samet
oc 20
w 0:: => I-<t 15 0:: w a.. ::? w I-
I- 10 z 0 a..
3 5 w a
0
-5
-10
of 70
65
60
55
50
45
40
35
30
25 20 15 5
60
20
OPERATIVE 25
TEMPERATURE 3o•c
15
10
5
.D
0 0 0 :::;::: ..c ... 0
O' ~
' O'
0 I-<t 0::
>-I-0
~ ::::> :::c
Figure 1.6. Acceptable ranges of operative temperature and humidiry for a person clo!hed in Typical summer and winter clothing engaged in light activity (mainly sedentary; $ 1.2 metabolic equivalen!s). Source: ASH RAE Standard 55-1981.
cigarette smoke at concentrations of a few hundred micrograms per cubic meter while in a nightclub might be acceptable for a few hours, especially during an enjoyable performance. However, these same levels at work might cause com
plaints. In defining acceptable indoor air quality, it should be recognized that current
knowledge is very limited. Undoubtedly, synergistic effects occur among pollutants in indoor air, but our understanding of the effects of mixtures is limited. The recent work of Molhave and his colleagues illustrates that exposures to mixtures of volatile organic compounds commonly found indoors evoke sensory and perfor-
PERSPECTIVE ON INDOOR AND OUTDOOR AIR POLLUTION 21
mance reactions at levels well below any known threshold limit value (Molhave, Busch, and Pedersen 1986). Berglund and Lindvall (1986) suggested that the response might be deeply rooted in man's psychological "fright-flight" response. They conjectured that with exposure to these mixtures of organic compounds we perceive an irritating chemical sensation. Subconsciously we wish to flee the sensations, but socially we have been conditioned to believe indoor environments are safe or that we must stay at work. Berglund and Lindvall ( 1986) argued that these conflicts create a series of stress-related symptoms. These experiments indicate the need for more studies of the effects of complex mixtures.
In developing indoor air quality guidelines, it must be recognized that a segment of the population may be particularly sensitive or reactive at very low concentrations. For example, prior exposure to biologic or chemical agents may lead to an immunologic response such as development of specific antibodies, and with additional exposure, even at low concentrations, the sensitized person might experience allergic reactions. Many individuals report immediate or delayed reactions to a wide variety of materials or indoor environments. Often, it is difficult to discern whether the person is displaying a physiologic response to a chemical, physical, or biologic agent. or a psychologically mediated response.
Thus, developing a definition of acceptable indoor air quality which addresses all determinants of comfort and health for all individuals seems impossible at present. Simply shifting definitions developed for outdoor air to indoor air is unsatisfactory. Definitions of outdoor air pollution (e.g., the Commonwealth of Massachusetts) emphasize not only health effects but also enjoyment and productivity. Because outdoor air is common property, pollution is controlled through statutory and legal means for the benefit of all persons. By contrast, indoor environments are maintained at direct cost by homeowners and building owners or operators. Shifting social and environmental contexts and changing costs for heating, cooling, and cleaning indoor air may affect concepts of acceptability.
Nevertheless, although a lasting definition of acceptable indoor air quality cannot be given, we suggest that health, comfort, productivity, and cost must all be considered. Even though some may consider the inclusion of cost as inappropriate, rile ~rc·cification of fiscally unachie,·ableconditions would have little value . Achieving the proper balance between cost on the one hand and health, comfort. and pwducti,·ity on the other may be difficult. Searching for consensus among building 1'cl'l1pants may pron· to be a successful approach. Occupants need infonnation about the indoor air they breathe and the systems in place to maintain indoor air quality. Providing occupants with some control over indoor air quality may be needed to assure acceptability.
It is likely that the definition of acceptable indoor air quality will be debated well into the next century. However, guiding principles should be adopted now. Occupants need insight, information, and influence. Regardless of economic considerations, levels of contaminants cannot be allowed which cause or contribute to severe irritation, sensitization, or illness of any type.
22 John D. Spengler and Jonathan M. Samet
POLICY
In the United States and many other countries, regulations have been implemented with the goal of achieving clean outdoor air and thereby improving public health. Reductions in outdoor concentrations of many pollutants have been well documented, and obvious pollution episodes with attendant morbidity and mortality are now rare. As the outdoor air has become cleaner, the importance of indoor air in determining exposures to many inhaled pollutants has become increasingly evident. It is now clear that protection of public health requires satisfactory outdoor and indoor air quality. Moreover, the public also expects a degree of indoor air quality to assure comfort.
The Clean Air Act provides a regulatory framework for the United States which is designed to achieve and maintain lowered pollutant levels in outdoor air, meeting standards established to prevent the occurrence of adverse health effects. This complex legislation specifies that standards should be set for ambient air quality and provides a process for achieving clean outdoor air. The Clean Air Act is administered by the EPA, which has enforcement authority.
We lack a comparable comprehensive legal, regulatory, administrative and technical framework for approaching the problem of indoor air pollution. Indoor air quality problems may result from natural sources, poor buiiding design, inadequate building maintenance, structural components and furnishings, consumer products, and occupant activities. Control of these diverse sources of pollution in the air of public and private buildings poses an unprecedented challenge-a challenge that we are only now recognizing.
The U.S. government has not yet established a framework to develop policies for indoor air as it has for outdoor air. Sexton and co-workers (Sexton 1986, 1987) addressed the sequence of steps which must be followed to evolve responsible and effective control strategies (Table 1.5). Scientific data are needed for the first steps of problem definition and health risk assessment. Sources and exposures must be characterized, not only for health risk assessment but also as a basis for the development of methods for control.
The concepts and terminology of health risk assessment were defined and described in a 1983 report by a committee of the National Research Council (NRC 1983). The concept of health risk assessment is uncomplicated. The first step is hazard identification; that is, agents that pose a risk to human health are identified through epidemiologic observations, animal bioassay, short-term in vitro tests, or other toxicologic evidence. Second, the dose-response relationships that quantify the risk per unit exposure to the agent are established. Third, the distribution of human exposure to the agent is determined. Fourth, by combining the doseresponse relationship with the information on exposure, the magnitude of the human health problem is estimated .
Health risk assessment provides a useful approach for estimating the hazard posed to the population and for identifying uncertainties in the scientific evidence which may require resolution before policy can be evolved. !t .~ay also be used to
PERSPECTIVE ON INDOOR AND OUTDOOR AIR POLLUTION 2~

Table 1.5 Summary of the Major Steps in Addressing Indoor Air Quality Problems
Problem definition Emission sources Dilution Indoor concentrations Activity patterns Exposures Health consequences
Health risk assessment Number of people exposed Severity of exposure Dose-response relationship
Applicability of mitigating measures Ventilation Source removal Source modification Air cleaning Behavioral adjustment
Resolution of policy issues Building "publicness" Conservation benefits Voluntary versus nonvoluntary risks Importance of short-term/long-term health effects Public versus private responsibility Local, state, or federal intervention Appropriate government responses
Alternative government responses No action More research Public information Economic incentives Moral suasion Legal liability Guidelines Rules/regulations
compare the hazards posed by different pollutants as a basis for establishing priorities and to estimate the potential reduction in health risk which would follow intervention .
Sexton's third step is an assessment of the applicability of available measures for mitigation, which may be broadly classified as increased ventilation, source removal, source modification, air cleaning, and change in behavior. Selection of the optimal mitigation approach must balance technological feasibility, efficacy, cost, and acceptability.
Decisions in problem definition, health risk assessment, and applicability of mitigation measures are made primarily on the basis of scientific evidence . However, the answers to critical policy questions require a process that integrates government and private interests and responsibilities. The need to create an approach for dealing with these issues on indoor air quality is immediate. For example, radon is a well-documented cause of lung cancer, it has now been found to be present in all homes, and at high concentrations comparable to levels found in uranium mines in some homes (Samet and Nero 1989). Effective and relatively inexpensive methods are available for measuring radon in indoor air and for lowering concentrations to levels presently judged as acceptable. Yet, we have not evolved a national control strategy for radon which addresses satisfactorily the policy issues and options described by Sexton (Sexton 1986; Nero 1988; Samet and Nero 1989).
The government has diverse options for controlling an indoor air pollution problem, ranging from taking no action to implementing specific rules and regulations . The choice of option should maximize public health protection and acceptability to the population and acknowledge the responsibilities and liabilities of the involved parties. Although this broad basis for selection among options available to the government is evident, a systematic approach to decision making has not yet
24 John D. Spengler and Jonathan M. Samet
been developed. The federal government has so far pursued voluntary industry codes and standards for kerosene space heaters and has offered an "action guideline" for radon; it has also provided guidance on handling asbestos in schools and has now moved to begin eliminating new use of asbestos. Indoor air pollution by environmental tobacco smoke has been handled by some states and municipalities, and public education has been undertaken by governmental and nongovernmental agencies to alter behavior.
Existing statutory authorities do not provide a single federal agency with jurisdiction over indoor air (Table I .6) (Sexton I 986). The EPA is responsible for ambient air through the Clean Air Act. Under the provisions of Title IV of the Superfund Amendments and Reauthorization Act of 1986, Radon and Indoor Air Quality Research, Congress directed the EPA to establish a research program to address radon and other indoor pollutants. The research program was mandated to address data gathering, to coordinate research activities, and to assess federal actions on mitigation of environmental and health risks associated with indoor air.
Table 1.6 Federal Laws Potentially Applicable to Indoor Air
National Environmental Policy Act: A broad act Iha! establi shes as a national goal "to assure for all Americans safe, healthful, productive. and aesihetically and culturally pleasing surroundings."
Clean Air Act: Gives EPA regulatory authorily over outdoor air. Toxic Substances Control Act: Provides EPA with authority to collect and develop data on the risks
of chemicals and to restrict manufacturing. distribution, and use of toxic chemicals, including indoor air contaminants.
Federal Insecticides, Fungicide, and Rodenticide Act: Provides EPA with authority to collect data, to monitor, and to regulate pesticide use , including those used indoors.
Asbestos Hazard Emergency Response Act and the Asbestos School Hazard Detection and Control Act: Requires EPA to develop regulations detailing methods for handling asbestos in schools. The Detection and Control Act creates a task force for the problem.
Superfund Amendments and Reauthorization Act, Title JV: Radon Gas and Indoor Air Quality Research Act: Requires EPA to establish a research program.
Safe Drinking Water Act: Authorizes EPA to perform research on contaminants in drinking water. The regulatory authority extends to contaminants in public water supplies which have adverse effects through indoor air pollution.
Consumer Product Safoty Act: Provides Consumer Product Safety Commission with authority to regulate consumer products causing injury. .
Federal Hazardous Substance Act: Authorizes Consumer Product Safety Commission 10 require labeling for household products that are hazardous.
Occupational Safety and Health Ac!: As a national policy, "To assure as far as possible every working man and woman in the nation safe and healthy working conditions."
National M3nufactured Housing Construction and Safely Standartl5 Acl of 1974: Directs the Department of Housing and Urban Development to establish standards for construction and safety of manufactured housing. Features related to indoor air pollution have been regulated.
Department of Energy Organi1,:uion Act of 1977: Requin:s integration of nati011al environmental protection goals in developing energy programs . Mandates research on energy technologies and programs.
Energy Reorganization Act of 1974: Charges Environmental Research and Development Administration (ERDA) with research on environmental , biomedical, physical, and safety research related to energy.
Atomic Energy Act: Authorizes research relevant to radon and nonionizing radiation . Energy Conservation and Production Act: Has the goal of reducing energy demand . bul Department
of Energy must consider potential health consequences.
PERSPECTIVE ON INDOOR AND OUTDOOR AIR POI l.llTION ?<:

An implementation plan has now been prepared and reviewed by a committee of the agency's Science Advisory Board (U.S. EPA 1987).
In its 1987 report to Congress on indoor air quality, as mandated by Title IV, above, the EPA outlined policy objectives and strategy. Research was proposed to refine understanding of health effects; empha i wa placed on obtaining data for risk assessment. The agency also planned to identify and assess mitigation methods for high-prioriry problems. The proposed strategy for con1rol was multifaceted and included regulating under existing authoriti.cs (Table 1.6), augmenling governmental and private capabilities to manage indoor air quality problem , referring problems to other federal agencies having regulatory authority, and reque ting regulatory authority from Congress. The agency stated a clear preference for avoiding regulation and achieving it goals through research and development dissemination of information, and technical assjstance and training.
In addition to the EPA, other federal agencies are also involved in indoor air quality. The National Institute for Occupational Safety and Health conducts health hazard evaluations of workplaces considered to be unhealthy; large numbers of evaluations have been conducted in nonindustrial settings to evaluate problems related to indoor air qualiry. The Department or Energy oversees energy conservation activities, and it is charged with considering the health consequences of energy conservation programs; it also has its own research program in several areas, including radon. Under the Consumer Product Sarety Act the Con umer Product Safety Commission has authority to regulate products causing injury. The commission has addressed asbestos, urea-formaldehyde foam insulation, biologic dissemination from humidifiers, and unvented combustion appliances. The Department of Housing and Urban Development set building standards for agencyfonded projects and tandards for materials for mobile homes. Federal activiri.es on indoor air are coordinated through the congre sionally mandated lnteragency Committee on indoor Air Quality.
The policy dilemma posed by indoor air pollution has become increasingly evident as the contributions of indoor air pollution to per onal exposures have been described in re earch conducted during the 1970s and 1980s. The complex and expensive activities mandated by the Clean Air Act addres only selected pollutants and only the outdoor c ntrib11tions to personal exposures . The protection of public health will require substantial evolution of our approach to policy-making on indoor air quality.
REFERENCES
Ahshuller. A. P. 1983. Review: Natural volatile organic sul:istances and their effect on air quality in the United States. Atmos. Environ . 17:2131 -65.
American Society of Heating, Refrigerating. and Air-Conditioning Engineers. 1981. ASlfRAE Standard 55-1981: Thermal environmental co11ditio11sfor human occupancy. Atlanta, Ga .: ASHRAE.
T '- -- ~ ~ .............. 10~ "'"~ tnn-:.th~n M s~met
American Society of Heating. Refrigerating, and Air-Conditioning Engineers. 1981. ASH
RAE Standard 62-1981 : Ventilation for acceptable indoor air quality. Atlanta, Ga.: ASH RAE.
American Society of Heating, Refrigerating, and Air-Conditioning Engineers. 1989. ASlfRAE Standard 62-1989: Ventilation for acceptable indoor air quality. Atlanta, Ga.: ASHRAE.
Berglund, B., and Lindvall, T. 1986. Sensory reactions to "sick buildings." Environ. Int. 12:147-59.
Cooper, 1. A.; Watson, J. G.; and Huntzicker, J. J. 1979. Summary oFthe Portland aerosol characterization study. Paper 79-24.4 presented at the seventy-second annual meeting of the Air Pollution Control Association, 24-29 June, Cincinnati, Ohio.
Ember, L. R., et al. 1986. Tending the global commons. Chem. Eng. News 64:14-15. Evelyn, J. 1661. Fumiogorum, or the inconvenience of 1he Aer and Smoake of London
Dissipa1ed. Together with some remedies humbly proposed. 2d printing 1772, quoted in Lodge, J. P. 1969. The Smoke of London: Two Prophecies. Maxwell Reprint Co., Fairview Park. Elmsford, N. Y.
Fox, D. L.; Kamens, R.; and Jeffries, H. 1975. Photochemical smog system: Effect of dilution on ozone formation. Science 188: 1113-14.
Gordon, G. 1988. Receptor models. Environ. Sci. Technol. 22:1132-52. Grosjean, D.; Williams, E.; and Van Neste, A. 1982. Measurements of organic acids in the
south coast air basin . Final report A5-177-32 for California Air Resources Board. Hodgson, M. J., et al. 1987 . Vibration as a cause of tight building syndrome symptoms.
Indoor air '87: Proceedings of the fourllz international conference 011 indoor air quality and climale. Ed . B. Seifert et al., 449-53. Berlin: Institute for Water, Soil, and Air Hygiene.
Ito, K., and Thurston, G. D. 1987. The estimation of London, England, aerosol exposure from historic;il visibility records. Paper 87-42 .2, presented at the eightieth annual meeting of the Air Pollution Control Association, 21-26 June, New York.
Kemeny, E.; Ellerbeck , R.H.; and Briggs , A. B. 1988. An assessment of smoke pollution in Soweto: Residential air pollution . Proceedings of the National Association for Clean Air, 10-1 I November, Pretoria, South Africa, 152-63. Available through NACA. P.O. Box 5777, Johannesburg 2000, South Africa.
Kuntasal, G., and Chang, T. Y. 1987. Trends and relationships of03 , NOx and HC in the south coast air basin of California. J. Air Pollut. Control Assoc. 35: 1158-63.
Meyers, R. E .. et al. 1978. Constraints on coal utilization wi1h respect to air pollution production and transport over long distances: Summary. Upton. N.Y.: Brookhaven National Laboratory Report.
Molh;ive. L.; Busch, B.; and Pedersen, 0. F. 1986. Human reactions to low concentrations of volatile organic compounds . Environ . Int . 12: 169-75.
Morandi, M. T. 1985. Development of source apportionment models for inhalable particulate matter and ils extractable organic fractions in urban areas of New Jersey. New York University.
Morandi, M. T.; Daisey, J. M.; and Lioy. P. J. 1987. lnhalable particulate matter and extractable organic matter receptor source apportionment models for the ATEOS urban sites. In Toxic air pollution: A comprehensive study of non-criteria air pollutants. Ed. P. J. Lioy and J. M. Daisey, 228. Chelsea, Mich .: Lewis Publishers.
National Research Council. 1983 . Committee on the Institutional Means for Assessment of
PERSPECTIVE ON INDOOR AND OUTDOOR AIR POLLUTION 27

Risks to Public Health . Risk Assessment in the Federal Government: Managing the Process. Washington, D.C.: National Academy Press.
Nero, A. V . . Jr. 1988. Controlling indoor air pollution. Sci Am. 258:42-48. Samet, J. M. , and Nero, A. V., Jr. 1989. Indoor radon and lung cancer: A strategy for
control? N. Engl. J. Med. 320:591-94. Sega. K., and Fugas, M . 1982. Personal exposure versus monitoring station data for
respirable particles. Environ. Int. 8:259-63 . Sexton, K. 1986. Indoor air quality: An overview of policy and regulatory issues . Sci.
Technol . Human Values 11 :53-67 . Sexton, K . 1987. Public policy implications of exposure to indoor pollution. In Indoor Air
· 87: Proceedings of the fourth international conference 011 indoor air qualify and climate. Ed. B. Seifert et al., Vol. 4, 105-16. Berlin: Institute for Water, Soil, and Air Hygiene.
Smith, K. 1987. Biofuels. air pollwion, and health. New York: Plenum. Smith , K. R. 1988. Air pollution: Assessing total exposure in developing countries . En
viromnem 30: 16. Spengler, J. D. , et al. 1986. Sulfuric acid and sulfate aerosol events in two U.S. cities . In
Aerosols. Ed. S. D. Lee, et al., 107-20. Chelsea, Mich .: Lewis Publishers. Spengler, J. D. et al. 1989. Exposures to acidic aerosols. Em·iron . Health Perspect. 79:43-
51. Stem, A. C. 1982. History of air pollution legislation in the United States. J. Air Pollut.
Control Assoc. 32:44-6 I. Tshangwe, H. T.; Kgamphe, J. S.; and Annegam, H.J. 1988. Indoor-outdoor air particulate
study in a Soweto home: Residential air pollution. Proceedings of the National Association for Clean Air, 10-11 . November, Pretoria, South Africa, 164-75. Available through NACA, P.O. Box 5777, Johannesburg 2000, South Africa.
U.S. Congress. Office of Technology Assessment. 1985. Acid rain and transported air pollutants. New York: UNIPUB .
U.S. Environmental Protection Agency. 1982. Air quality criteria for particulate matter and sulfur dioxide. Research Triangle Park, N.C. : Office of Health and Environmental Assessment, EPA publication no. EPA/600/8-82/029. Available from NTIS, Springfield, Va . , PBS4-156801/REB.
U.S. Environmental Protection Agency. Office of Air and Radiation . 1987. EPA indoor air quality implementation plan. Washington, D.C.: Government Printing Office . EPA publication oo. EPA/600/8-87 /031 .
U.S . Environmental Protection Agency. Office of Health and Environmental Assessment. 1989. Acid aerosols issue paper. Washington, D.C.: Government Printing Office . EPA publication no. EPA/600/8-88/0005a.
U.S . Environmental Protection Agency. 1989. National air qualify and emission trends report, 1987. Research Triangle Park, N.C.: Office of Air Quality Planning and Standards, Monitoring and Reports Branch. EPA publication no. EPA/450/4-89100 I.
Walker, H. M. 1985. Ten year ozone trends in California and Texas. J Air Pollut. Co111rol Assoc. 35:903-12.
Wilson , R .. et al. 1980. Health effects of .fossil fuels . Cambridge, Mass. : Ballinger Press. World Health Organization. 1978. Air quality in selected urban areas 1975-76. Geneva:
WHO Offset publication no. 41 . World Health Organization. EHE-EFP/85-5 Ur/Jan air pollution in the People's Republic of
'>8 lnhn f) Snenl!'ler and .Jonathan M. Samet
China, 1981-84. (Not a formal publication, prepared to assist with implementation of WHO/UNEP Global Air Monitoring Project.)
Yaglou, C. P.; Riley, E. C.; and Coggins, D. I. 1936. Ventilation requirements. ASHRAE Trans. 42: 133-62.
Yaglou, C. P., and Witheridge, W. N. 1937. Ventilation requirements: Part 2. ASHRAE Trans . 43:423-36.
PERSPECTIVE ON INDOOR AND OUTDOOR AIR POLLUTION 29