Policies, Measures and the Monitoring Needs of Forest Sector Carbon Mitigation
Upload
khangminh22Category
view
2download
0
ETC/CME Eionet Report ǀ 6/2021
Agricultural climate mitigation policies and
measures Good practice, challenges, and future perspectives
Authors:
Richard German (Aether), Justine Raoult (Aether), Carmen Schmid (UBA-
Vienna), Nicole Mandl (UBA-Vienna), Paraskevi Peglidou (EEA) Coordination:
Richard German (Aether), Magdalena Jóźwicka-Olsen (EEA)
ETC/CME consortium partners: AETHER, Interprofessional Technical Centre for Studies on Air Pollution (CITEPA), Czech Hydrometeorological Institute (CHMI), Energy and Environmental Studies and Software Development (EMISIA), Institute for Applied Ecology (ÖKO-INSTITUT), ÖKO-RECHERCHE, Norwegian Institute for Air Research (NILU), Netherlands Environmental Assessment Agency (PBL), National Institute for Public Health and the Environment (RIVM), Environment Agency Austria (UBA), Flemish Institute for Technological Research (VITO)
December 2021
2
Cover photo © Tobias Terman Olsen
Legal notice The contents of this publication do not necessarily reflect the official opinions of the European Commission or other institutions of the European Union. Neither the European Environment Agency, the European Topic Centre on Climate change mitigation and energy nor any person or company acting on behalf of the Agency or the Topic Centre is responsible for the use that may be made of the information contained in this report. Copyright notice © European Topic Centre on Climate change mitigation and energy (2021) Reproduction is authorized provided the source is acknowledged. More information on the European Union is available on the Internet (http://europa.eu).
European Topic Centre on Climate change mitigation and energy Boeretang 200 B-2400 Mol, Belgium Tel.: +32 14 33 59 77 Web: www.eionet.europa.eu/etcs/etc-cme Email: [email protected]

3
Contents
Acknowledgements ....................................................................................................................................... 1
Executive summary ....................................................................................................................................... 2
Introduction ........................................................................................................................................... 2
Assessment of the types of PaMs reported by EU-27 MS ..................................................................... 3
Barriers to uptake and principles of good practice ............................................................................... 5
Future developments ............................................................................................................................ 6
1 Introduction.............................................................................................................................................. 7
1.1 Policy background ......................................................................................................................... 7
1.2 Summary of historical and projected GHG emission trends ......................................................... 8
1.3 Agriculture and the wider food and land system ........................................................................ 10
1.4 Aims, scope and structure of this report ..................................................................................... 15
1.5 Methodology ............................................................................................................................... 17
2 Assessment of reported PaMs, questionnaire responses and interviews by topic ............................... 20
2.1 Policy drivers and instrument types ............................................................................................ 20
2.2 Livestock Measures ..................................................................................................................... 22
2.3 Crops and Soil N2O mitigation measures ..................................................................................... 26
2.4 Carbon storage / sequestration measures .................................................................................. 31
2.5 Energy mitigation measures ........................................................................................................ 34
2.6 Wider food system measures ...................................................................................................... 36
3 Cross-cutting barriers and good practice ............................................................................................... 41
3.1 Barriers ........................................................................................................................................ 41
3.2 Good practice .............................................................................................................................. 42
4 Selected Country Case-studies ............................................................................................................... 45
4.1 Selecting countries for case studies ............................................................................................ 45
4.2 Denmark ...................................................................................................................................... 45
4.3 France .......................................................................................................................................... 51
4.4 Latvia ........................................................................................................................................... 56
4.5 Spain ............................................................................................................................................ 59
5 Future developments for agriculture GHG mitigation ........................................................................... 65
5.1 Achieving further reductions in emissions from EU agriculture ................................................. 65
5.2 Achieving emission reductions through wider food system changes ......................................... 66
5.3 Reflections on effectiveness of previous EU policies and future development .......................... 67
5.4 Avoiding trade-offs with other important outcomes .................................................................. 69
6 Conclusions............................................................................................................................................. 71
6.1 Future perspectives ..................................................................................................................... 72

7 References .............................................................................................................................................. 74
Units of Measurement and symbols ........................................................................................................... 77
Other Abbreviations .................................................................................................................................... 78
Annex 1: Reporting quality assessed from 2019 reported PaMs ................................................................ 79
Completeness and clarity of PaM descriptions ................................................................................... 79
Clarity of type of policy instrument ..................................................................................................... 79
Links between reported PaMs and projected GHG emissions ............................................................ 79
Links to further documentation ........................................................................................................... 79
Reporting of ex-ante and ex-post assessments ................................................................................... 80
Annex 2: MS Questionnaire ......................................................................................................................... 83
Annex 3: List of questionnaire respondents ................................................................................................ 91
Eionet Report - ETC/CME 6/2021 1
Acknowledgements
This report was prepared by the European Environment Agency (EEA) and its European Topic Centre on Climate change Mitigation and Energy (ETC/CME). The ETC/CME is a consortium of European institutes assisting the EEA to support European Union (EU) policy in the field of air pollution and climate change mitigation. Richard German (ETC/CME) and Magdalena Jóźwicka-Olsen (EEA) ensured the coordination of this report. The authors were, in alphabetical order: Richard German (Aether), Nicole Mandl (UBA-Vienna), Paraskevi Peglidou (EEA), Justine Raoult (Aether) and Carmen Schmid (UBA-Vienna). Katrina Young (Aether), Peter Iversen (EEA), Ybele Hoogeveen (EEA), Katarzyna Kowalczewska (EEA) and Andrea Hagyo (EEA) reviewed the report. The project coordinators would also like to extend very warm thanks to the 57 national representatives who responded to the questionnaire issued as part of this work. The responses were a truly vital part of the project. Due to the large number of respondents, names and organisation / role of the people who kindly contributed are provided separately in Annex 3. The project coordinators are also grateful to the following experts who participated in interviews: Dr. Giulia Bazzan (University of Copenhagen), Nicholas Hutchings (Aarhus University), Dr. John Lynch (University of Oxford) and Prof. Werner Zollitsch (University of Natural Resources and Life Sciences, Vienna).
Eionet Report - ETC/CME 6/2021 2
Executive summary
Introduction
This report is the main output of a task under the European Topic Centre for Climate Mitigation and Energy (ETC/CME). The Effort Sharing Legislation (Effort Sharing Decision – ESD, Effort Sharing Regulation - ESR) sets Member State (MS) level targets for reduction in aggregate emissions from a variety of sectors, including agriculture. Since 2005 EU-27 agricultural greenhouse gas (GHG) emissions have been relatively stable, and projected decreases under both “With Existing Measures” (WEM) and “With Additional Measures” (WAM) scenarios are small (see section 1.2). Two key questions motivate this report:
i. What kinds of policies and measures (PaMs) for mitigation of agricultural GHG emissions are currently implemented and planned by EU-27 MS, and why have they not effectively reduced overall agricultural GHG emissions?
ii. What further actions are needed to reduce EU-27 agricultural emissions?
Key messages:
• Agricultural greenhouse gas (GHG) emissions in the EU-27 have changed little since the early 2000s, despite climate mitigation being supported through the Common Agricultural Policy. Based on current policies, projected emissions reductions to 2040 are too small to help the EU to become climate neutral by 2050.
• In recent years, mitigation policies and efficiency gains have reduced the emissions intensity of agriculture, but this has been offset by an increase in agricultural production.
• Looking at relevant policies reported by European countries in 2021, most effective mitigation measures were frequently supported. Reducing nitrogen fertiliser use, management for carbon sequestration, and development of anerobic digestion of manure were most widely supported. Over half of relevant policies are linked to the Common Agricultural Policy.
• Organic farming is widely supported, which can lower local GHG emissions, but the risk of emissions leakage from lower yields also needs to be considered.
• Some effective mitigation measures are infrequently supported by countries’ policies, and demand-side measures addressing food waste and diet choice are, as yet, still rare. More widespread support for such measures is one opportunity for further emission reductions.
• Further emission reductions are also possible through greater uptake of supported measures amongst farmers. Good practice is for policies to provide holistic support to farmers to overcome barriers, as noted by national experts. This includes sufficient financial support, but also research on mitigation impact and cost/benefits, knowledge exchange and advisory services, farmer involvement in policy design, and ensuring schemes are flexible and bring wider benefits. Awareness-raising to change public attitudes to food is vital to bring about demand-side changes.
• The EU Green Deal includes many promising elements, which should stimulate new national policies in the near future to reduce EU agricultural emissions. However, questions remain over whether new policies will be sufficient to meet the 2050 net zero target, and how to navigate complex issues around demand, domestic production, imports/exports, and GHG emissions in the EU versus elsewhere.

Eionet Report - ETC/CME 6/2021 3
By themselves, the historical and projected trends do not imply that GHG mitigation PaMs in the agriculture sector are ineffective. Emissions depend on both production volumes and the emissions intensity of production. It appears that, underlying the flat aggregate emissions trends in recent years, reductions in emissions intensity, counterbalanced by increases in production have occurred (see section 1.3). Emissions intensity of production varies across Europe, which suggests that there may be scope to reduce emissions intensity of many farms to be closer to the level of the best-performing ones. PaMs affecting demand for food and feed have the potential to reduce EU-27 agricultural emissions through influencing production volumes. Being part of a globalized market, changes in EU-27 production can also affect agricultural emissions elsewhere in the world. Furthermore, agricultural PaMs can have impacts in other sectors such as Land Use, Land Use Change and Forestry (LULUCF) and energy. It is important to remember that the impact of PaMs depends on both the types of measures incentivised, and their uptake. To address the questions above, this report brings together information from:
• Reported GHG mitigation PaMs in 2021 by MS under the Governance Regulation (2018/1999) to understand the types of PaMs that are commonly implemented, and if any effective actions or technologies are not frequently supported by PaMs. This also includes PaMs relating to LULUCF and energy sector emissions, and relating to wider food system.
• Experience of national and international agriculture experts, by issuing a questionnaire and conducting interviews to understand key barriers to uptake and good practice (both in particular MS via case studies, and in general), as well as their plans and insights on future priorities.
• Other datasets and literature to provide insights into country-specific circumstances.
See sections 1.4 and 1.5 for details on the scope and methodology.
Assessment of the types of PaMs reported by EU-27 MS
Overall, 292 PaMs were reported by EU-27 MS in 2021 which were relevant to the study. Of these, over half were explicitly related to the Common Agricultural Policy (CAP), with the Nitrates Directive, Effort Sharing Decision/Regulation (ESD/ESR) and LULUCF Regulation / decision being other important EU policy drivers. The majority of PaMs had an economic or regulatory dimension, whereas “softer” measures such as education or research were less common. Quantification of ex ante and ex post expected mitigation impact was not reported for most of the relevant PaMs. Therefore, a quantitative analysis of expected impact could not be carried out, and instead a qualitative analysis was undertaken of the types of action supported by PaMs.
Frequently supported measures
From analysis of the reported PaM descriptions, the most frequent measures incentivised by MS reported PaMs are summarised below. Livestock measures (section 2.2):
• Optimising livestock diets, breeding, and health and disease management were frequently reported, which reduce methane and N2O emissions intensity of production through increased productivity.
• Improving manure management systems (in particular covering manure stores) and anaerobic digestion were key measures supported to reduce nitrogen loss and methane emissions from manure management.

Eionet Report - ETC/CME 6/2021 4
Crop and soil N2O mitigation measures (section 2.3):
• A range of measures were commonly incentivised, key among these being reducing quantity of nitrogen applied to soils, low emission spreading equipment, and replacement of synthetic nitrogen fertilisers with organic fertilisers. These measures help to reduce direct and indirect N2O emissions from soils.
• Supporting organic farming was also frequently mentioned, which reduces emissions related to synthetic fertilizer manufacture and application.
Carbon storage / sequestration measures (section 2.4):
• Maintaining or enhancing woody biomass on farmland (e.g. through agroforestry), grassland management to enhance soil carbon stocks, use of cover crops, and conserving organic soils were most commonly reported.
Energy mitigation measures (section 2.5):
• Improving on-farm energy efficiency was the most commonly supported measure, excluding those relating to biogas (this is covered as a manure management measure)
Wider food system measures (section 2.6):
• Awareness raising and education amongst consumers, food labelling and review of waste-status of certain products were measures proposed to encourage dietary shift and reduction in food waste.
• Some MS included plans to reduce reliance on imports by increasing domestic food and animal feed production.
The specific measures supported vary by country, but most countries report PaMs supporting a range of (potentially) effective mitigation actions.
Gaps in reported PaMs
Based on effective mitigation measures listed in published literature (Ricardo-AEA, 2016; ECA, 2021; Perez-Dominguez et al., 2016), effective actions infrequently mentioned (“gaps”) in reported PaMs were identified. Livestock measures (section 2.2):
• Countries have begun to report PaMs related to reducing livestock numbers, although these are still not common.
• PaMs supporting targeted breeding and feed additives to reduce enteric methane emissions are still comparatively rare, and are mostly yet to be implemented.
• Explicit mention of acidification or cooling of manure, to reduce nitrogen loss and methane emissions, was present in few reported PaMs despite being effective measures (ECA, 2021).
Crop and soil N2O mitigation measures (section 2.3):
• Explicit mention of support for nitrification or urease inhibitors was rare across reported PaMs, despite their potential efficacy.
Carbon storage / sequestration measures (section 2.4):
• Explicit support for conversion of arable land to grassland or wetland was rarely mentioned. Energy mitigation measures (section 2.5):
• Carbon auditing tools were not frequently mentioned, despite high mitigation potential.
Eionet Report - ETC/CME 6/2021 5
Wider food system measures (section 2.6):
• Relatively few countries reported measures to encourage dietary change, reducing food waste or measures to reduce imports of food and feed. This may reflect low palatability of such measures, but could also be due to inconsistent reporting.
Full findings are presented in sections 2.2 to 2.6 of the main report, alongside specific barriers cited by questionnaire respondents and interviewees which may contribute to apparent policy gaps.
Barriers to uptake and principles of good practice
Based on questionnaire responses and expert interview, a number of cross-cutting barriers to uptake of measures were identified, relevant for a variety of measures (see section 3.1) :
• High capital costs of infrastructure improvements (manure stores, housing, biogas), which is a problem for smaller farms without sufficient subsidies. Investment support or communal facilities are ways to address this.
• A lack of awareness of GHG emissions sources amongst farmers, and general lack of formal training.
• A lack of country-specific evidence of the impact and cost of mitigation measures, as well as emissions inventory methods being unable to reflect their impact.
• Problems with retention of younger farmers, which inhibits spread of new practices.
• Limited access to IT infrastructure and poor IT literacy, needed for taking advantage of information available online and digital support tools.
• Highly disaggregated farm structure (i.e. lots of small farms) in some parts of Europe, which compounds issues associated with investment costs and access to training.
• A production-maximising mindset of some farmers, which reduces receptivity to some mitigation schemes.
Principles of good practice in policy implementation, which could be transferable to a variety of countries and policy contexts, were also provided by questionnaire respondents and interviewees. These highlighted several important factors outlined below (see section 3.2).
• The size of the incentive has to be attractive, and guaranteed continuity of support is crucial for long-term investments.
• Procedural aspects of implementation can make a difference, with a greater chance of success if: o Farm advisory services are closely involved to help farmers with admin, decision making
and education. o Implementation is hierarchical through regional administrations or farmer cooperatives,
enabling greater representation of farmers’ views in policy design. o There is trust between farmers and the government. o Training and peer-to-peer knowledge exchange opportunities are provided to farmers,
both to help farmers to understand the rationale for schemes, and to help them implement them well
o Measures are flexible rather than prescriptive.
• Providing a comprehensive package of support (research, training, financial support) is important.
• A system-wide perspective is important, where measures are complementary to each other, and multiple benefits are considered.
Case-studies of selected countries are provided in section 4 of the main report, which describe specific examples of successes and barriers in policy implementation, and contributing factors.
Eionet Report - ETC/CME 6/2021 6
Future developments
Based on the responses to the questionnaire and from interviewees, as well as considering variation in emissions intensity of agricultural products across the EU, there is clearly scope for further reductions in GHG emissions from agriculture. Emissions intensity of production can be further reduced through overcoming some of the barriers that have limited uptake of GHG mitigation practices (section 3), as well as placing emphasis on new technology, circular use of nutrients and other measures not currently supported (Section 5.1). However, to achieve sufficiently deep cuts in emissions from EU agriculture, many (including questionnaire respondents and interviewees for this project; Willett et al., 2019) argue that demand for food and animal feed must be reduced through dietary change and a reduction in food waste (see section 5.2). This can give space to expand organic agriculture and other lower-input systems which emphasise circular nutrient use and bring co-benefits to GHG emissions, water and air quality, and biodiversity, whilst avoiding emissions leakage from increased imports. Land released from food production can also facilitate reductions or removals in the LULUCF sector, or energy sectors though growth of biomass (CCC, 2020). The proposed joint agriculture-LULUCF net-zero emissions target by 2035 under the “Fit-for-55” package recognises the close link between agricultural policy and carbon sequestration on agricultural land (and elsewhere via changes in the land footprint of agriculture). Although carbon sequestration can go some way to achieving the proposed target, significant emission reductions will nonetheless also be required in the agriculture sector. A variety of recent EU policy developments seek to boost GHG mitigation in the agriculture sector by addressing many of the challenges discussed above. Through EU Green Deal, the Farm to Fork strategy, the new CAP, the Carbon Farming Initiative, Circular Economy Action Plan and Fit-for-55 package propose targets and measures to, collectively: reduce fertilizer application, increase circularity of nutrient use, shift consumer diets and reduce food waste, reward farmers for carbon sequestration, invest more in funding and knowledge exchange for uptake of mitigation measures, promote research on effective mitigation technologies, and limit deforestation associated with EU consumption1. These EU-level initiatives will stimulate new PaMs across MS and enhance synergies between agriculture and LULUCF sectors, but given the size of the challenge some key questions remain over whether the EU Green Deal targets can be achieved, and if they are achieved what net impact this will have on global emissions and other overall sustainability considerations. These issues are covered in more detail in section 6.
(1) https://ec.europa.eu/environment/publications/proposal-regulation-deforestation-free-products_en
Eionet Report - ETC/CME 6/2021 7
1 Introduction
This report is the main output of a task under the European Topic Centre for Climate Mitigation and Energy (ETC/CME), aiming to understand the contribution of EU-27 Member States’ policies and measures to climate mitigation in the agriculture sector.
1.1 Policy background
The Effort Sharing Legislation (Effort Sharing Decision – ESD, Effort Sharing Regulation - ESR) sets Member State (MS) level targets for reduction in aggregate emissions from a variety of sectors including agriculture, but there is no specific target for emission reductions from agriculture so far. The emphasis put on emission reductions in agriculture, and the Policies and Measures (PaMs) implemented to achieve the reductions, are set by individual MS. The Common Agricultural Policy (CAP) is the most important policy instrument available to all MS, but is complex and can be implemented differently in each MS (see Box 1). Since 2013, the CAP has climate action as one of its stated goals. Many CAP measures have indirect impacts on greenhouse gas (GHG) emissions or removals, but relatively few of the elements have had GHG emission mitigation or carbon sequestration as an explicit aim (Alliance Environnement, 2018).
Eionet Report - ETC/CME 6/2021 8
Apart from the CAP as the key policy instrument on EU level, the new proposals of the “Fit-for-55” package which were published by the Commission in July 2021, foresee to join the agriculture and LULUCF sector and to create a so-called “land sector” from 2031 onwards with sector specific targets for the EU MS. According to the proposal for the revised LULUCF regulation2 the EU land sector shall be net zero in 2035 and become a net sink afterwards. This implies that both the agriculture and LULUCF sector need to increase their ambition in the next decades and emissions have to be decreased and removals increased.
1.2 Summary of historical and projected GHG emission trends
GHG emissions, projections and PaMs are all reported together under the Governance Regulation (EU 2018/1999)3. This section presents a brief overview of GHG emission trends and projections from the agriculture sector using this data. In the historical trend, agriculture emissions in the EU-27 show strong decreases in the early 1990s and have stabilised around 400 Megatonnes (Mt) of CO2 equivalent (CO2 eq) since then (Figure 1.1), with a
(2) https://eur-lex.europa.eu/legal-content/EN/TXT/?uri=CELEX%3A52021PC0554&qid=1626940138360 (3) https://eur-lex.europa.eu/legal-content/EN/TXT/?uri=uriserv%3AOJ.L_.2018.328.01.0001.01.ENG
Box 1 The Common Agricultural Policy at a glance The CAP takes action with:
• Income support through direct payments ensures income stability, and remunerates farmers for environmentally friendly farming and delivering public goods not normally paid for by the markets, such as taking care of the countryside;
• Market measures to deal with difficult market situations such as a sudden drop in demand due to a health scare, or a fall in prices as a result of a temporary oversupply on the market;
• Rural development measures with national and regional programmes to address the specific needs and challenges facing rural areas.
The CAP is financed through two funds as part of the EU budget:
• The European agricultural guarantee fund (EAGF) which provides direct support and funds market measures;
• The European agricultural fund for rural development (EAFRD) which finances rural development.
Climate mitigation is one of the five stated aims of the CAP since 2013: “help tackle climate change and the sustainable management of natural resources”. Many measures incentivised under the CAP can mitigate GHG emissions, especially:
• Cross-compliance statutory minimum requirements and Good Agricultural and Ecological Condition conditions limiting nitrogen application
• Greening measures to conserve organic soils, permanent grassland and woody biomass on farms
• Specific agri-environment-climate measures under Rural Development Plans (RDP). MS are responsible for the implementation of RDPs and can tailor the measures funded to their own national circumstances

Eionet Report - ETC/CME 6/2021 9
21% decrease overall between 1990 and 2019. In 2019 the agriculture sector was responsible for 10% of the EU-27’s total emissions (386 Mt CO2 eq). In the “with existing measures” projection scenario (WEM), the projected emission trend remains almost flat to 2040, falling by only 1.5%. In the “with additional measures” (WAM) scenario a slightly larger decrease – of 5% - is projected for 2040 compared with 2019. Figure 1.1 only includes the emissions from the agriculture sector (in line with the definition of the GHG inventory), but agricultural practices have also impacts on land use change and the carbon stocks in the biomass, soil and dead organic matter pool. However, the CO2 emissions/removals related to carbon stock changes in Cropland and Grassland are reported under the Land use, Land-use change and Forestry (LULULCF) sector. In the past, Cropland and Grassland have been sources of emissions with a decreasing trend from 100 Mt CO2 eq in 1990 to 54 Mt CO2 eq in 2019 for the EU-27, in particular drained organic soils. Projections show that these emissions remain stable until 2040 in the WEM scenario. Within agricultural GHG emissions, the largest source categories in the EU-27 are methane emissions from enteric fermentation in livestock (43% of total agriculture emissions in 2019), and nitrous oxide (N2O) emissions from agricultural soils (39% of total agriculture emission in 2019) largely due to fertiliser application on soils. Methane and N2O emissions (combined) from livestock manure management is the third largest category, with 14% of the total emissions of agriculture. The other categories are rather small and do not have a big impact on the EU trend.
Figure 1.1 EU-27 historical (1990 - 2019) and projected (2020 - 2040) emissions from the agriculture sector
Note: The WEM scenario is shown by the dotted lines, the WAM scenario is shown by the lines with x-markers. Note that missing years were gap-filled by linear interpolation or extrapolation. The sub-categories of the Netherlands were gap-filled by applying the category share of the latest inventory year.
Source: EEA, Final EU GHG inventory submission 2021 (version 20210508), GHG projections submitted by EU MS in accordance with Art 18 (1) b in 2021 under the Governance Regulation EU (2018/1999)
Eionet Report - ETC/CME 6/2021 10
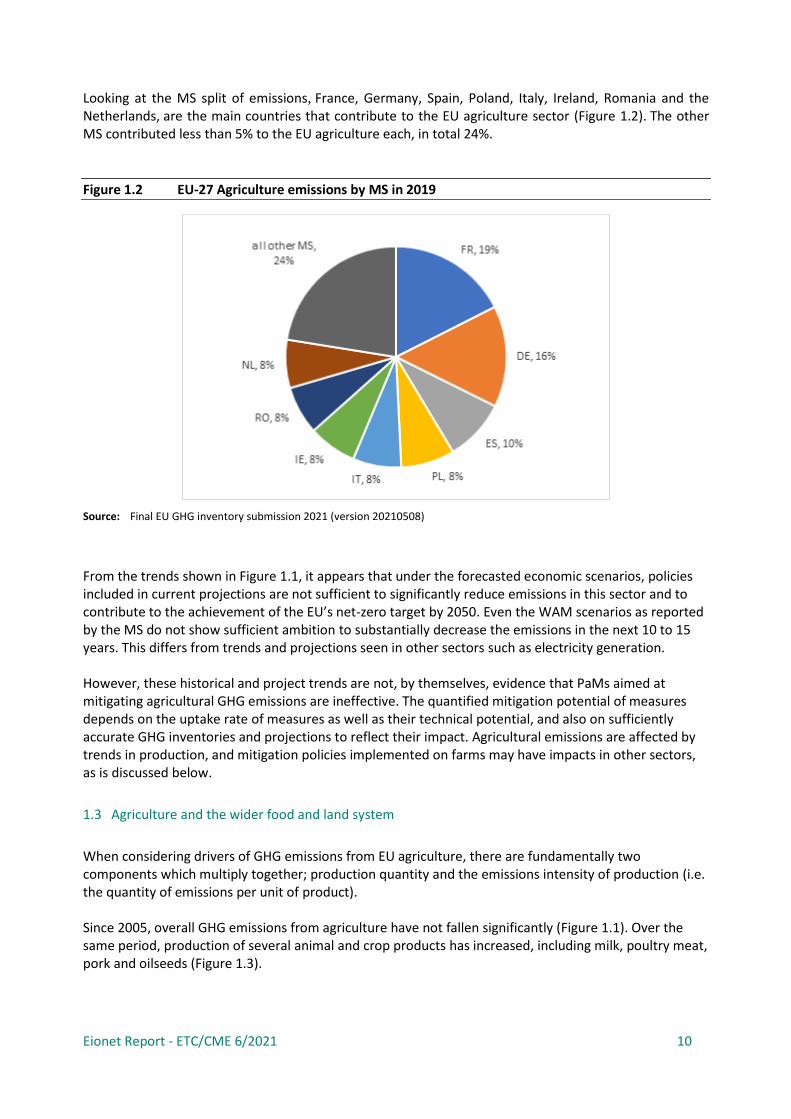
Looking at the MS split of emissions, France, Germany, Spain, Poland, Italy, Ireland, Romania and the Netherlands, are the main countries that contribute to the EU agriculture sector (Figure 1.2). The other MS contributed less than 5% to the EU agriculture each, in total 24%.
Figure 1.2 EU-27 Agriculture emissions by MS in 2019
Source: Final EU GHG inventory submission 2021 (version 20210508)
From the trends shown in Figure 1.1, it appears that under the forecasted economic scenarios, policies included in current projections are not sufficient to significantly reduce emissions in this sector and to contribute to the achievement of the EU’s net-zero target by 2050. Even the WAM scenarios as reported by the MS do not show sufficient ambition to substantially decrease the emissions in the next 10 to 15 years. This differs from trends and projections seen in other sectors such as electricity generation. However, these historical and project trends are not, by themselves, evidence that PaMs aimed at mitigating agricultural GHG emissions are ineffective. The quantified mitigation potential of measures depends on the uptake rate of measures as well as their technical potential, and also on sufficiently accurate GHG inventories and projections to reflect their impact. Agricultural emissions are affected by trends in production, and mitigation policies implemented on farms may have impacts in other sectors, as is discussed below.
1.3 Agriculture and the wider food and land system
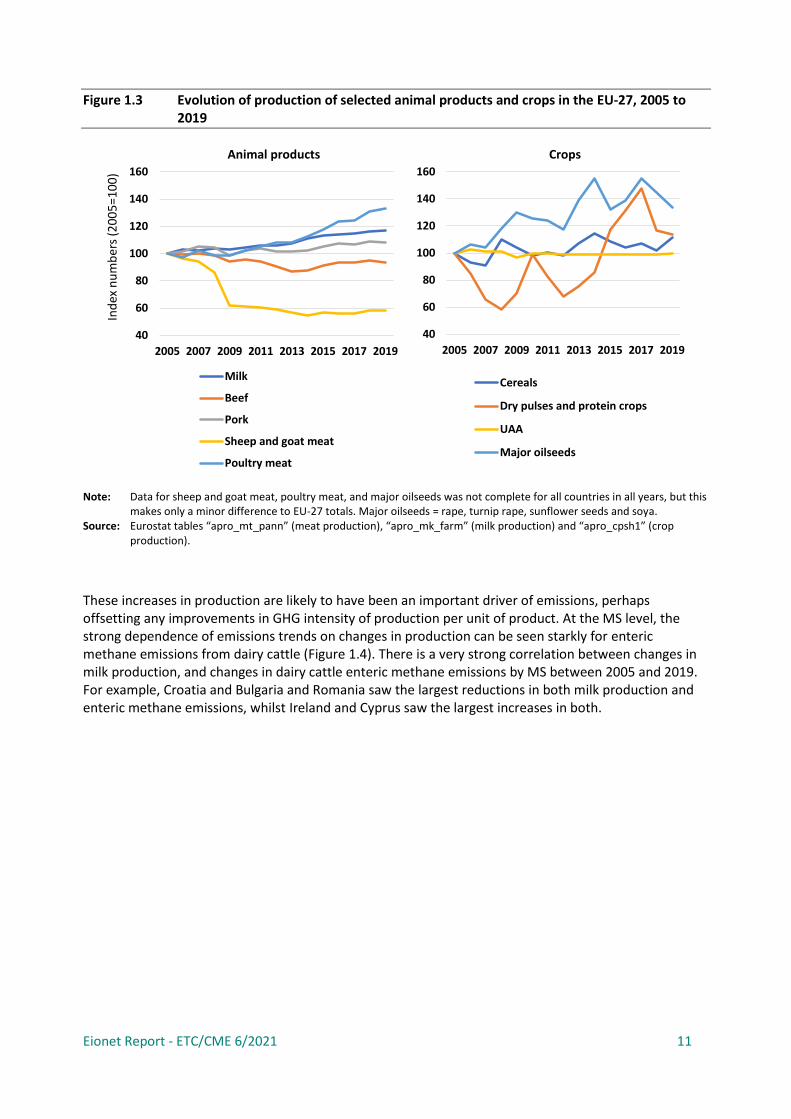
When considering drivers of GHG emissions from EU agriculture, there are fundamentally two components which multiply together; production quantity and the emissions intensity of production (i.e. the quantity of emissions per unit of product). Since 2005, overall GHG emissions from agriculture have not fallen significantly (Figure 1.1). Over the same period, production of several animal and crop products has increased, including milk, poultry meat, pork and oilseeds (Figure 1.3).
Eionet Report - ETC/CME 6/2021 11
Figure 1.3 Evolution of production of selected animal products and crops in the EU-27, 2005 to 2019
Note: Data for sheep and goat meat, poultry meat, and major oilseeds was not complete for all countries in all years, but this makes only a minor difference to EU-27 totals. Major oilseeds = rape, turnip rape, sunflower seeds and soya.
Source: Eurostat tables “apro_mt_pann” (meat production), “apro_mk_farm” (milk production) and “apro_cpsh1” (crop production).
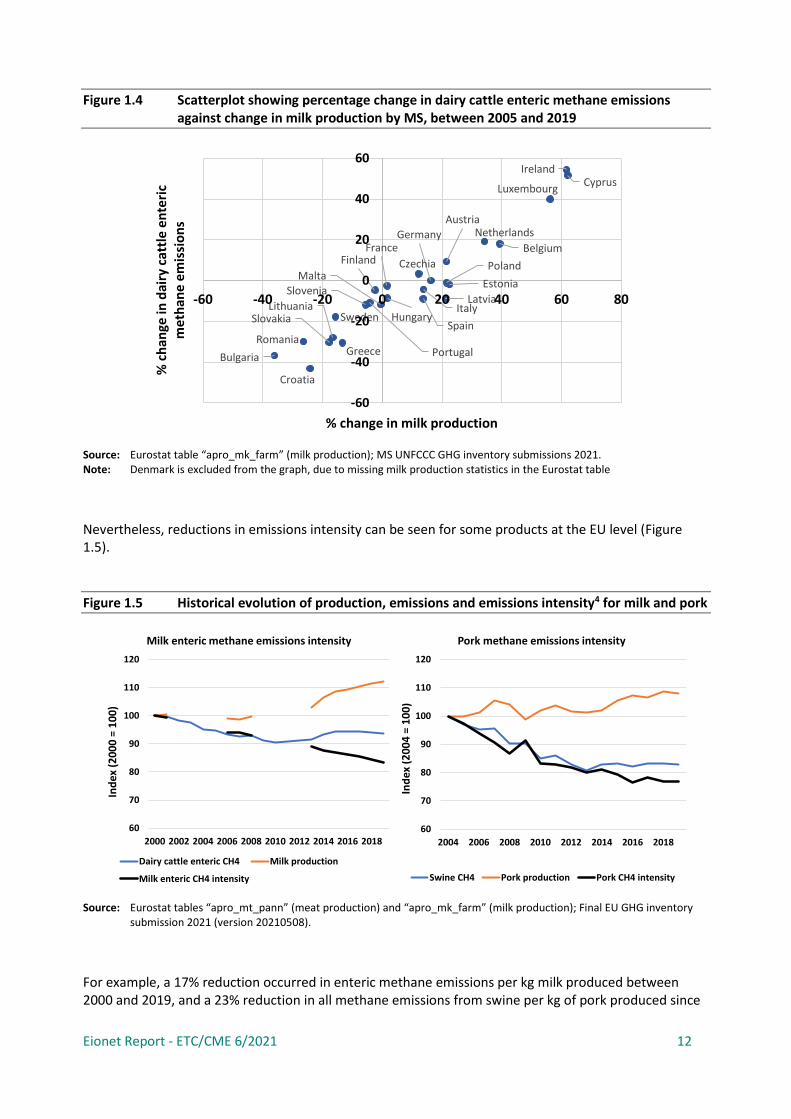
These increases in production are likely to have been an important driver of emissions, perhaps offsetting any improvements in GHG intensity of production per unit of product. At the MS level, the strong dependence of emissions trends on changes in production can be seen starkly for enteric methane emissions from dairy cattle (Figure 1.4). There is a very strong correlation between changes in milk production, and changes in dairy cattle enteric methane emissions by MS between 2005 and 2019. For example, Croatia and Bulgaria and Romania saw the largest reductions in both milk production and enteric methane emissions, whilst Ireland and Cyprus saw the largest increases in both.
40
60
80
100
120
140
160
2005 2007 2009 2011 2013 2015 2017 2019
Cereals
Dry pulses and protein crops
UAA
Major oilseeds
40
60
80
100
120
140
160
2005 2007 2009 2011 2013 2015 2017 2019
Milk
Beef
Pork
Sheep and goat meat
Poultry meat
Animal products Crops
Ind
ex n
um
ber
s (2
00
5=
10
0)
Eionet Report - ETC/CME 6/2021 12
Figure 1.4 Scatterplot showing percentage change in dairy cattle enteric methane emissions against change in milk production by MS, between 2005 and 2019
Source: Eurostat table “apro_mk_farm” (milk production); MS UNFCCC GHG inventory submissions 2021. Note: Denmark is excluded from the graph, due to missing milk production statistics in the Eurostat table
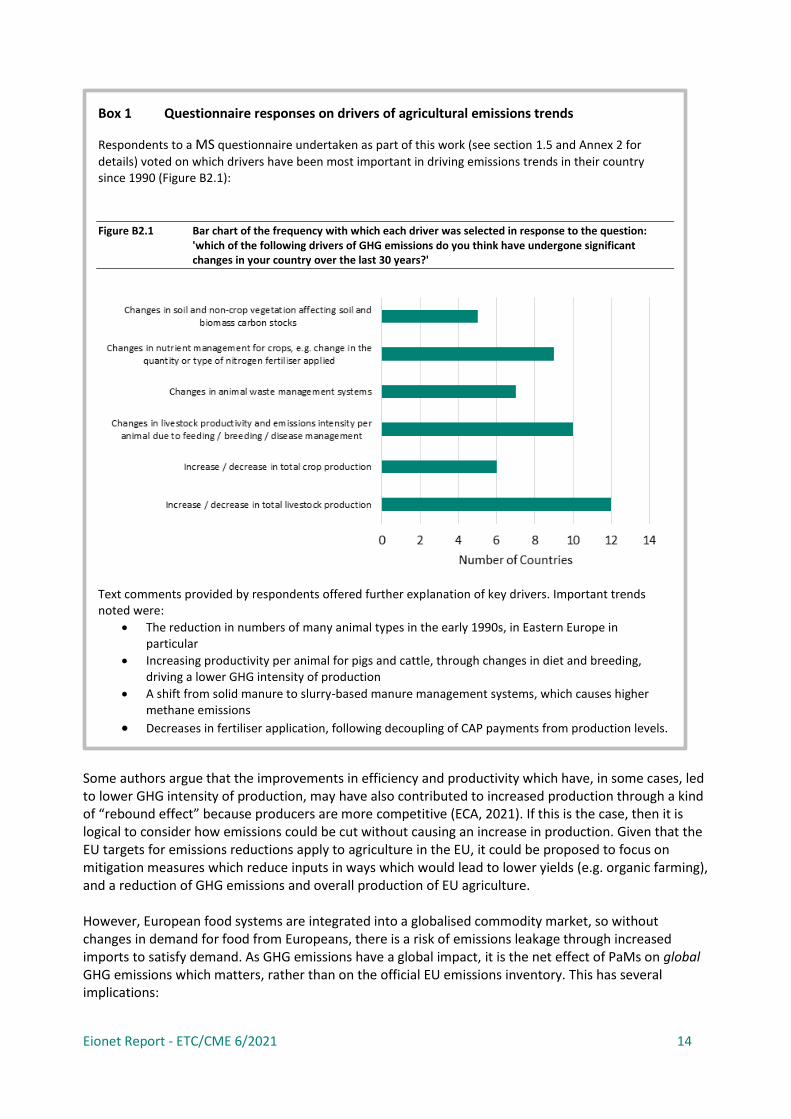
Nevertheless, reductions in emissions intensity can be seen for some products at the EU level (Figure 1.5).
Figure 1.5 Historical evolution of production, emissions and emissions intensity4 for milk and pork
Source: Eurostat tables “apro_mt_pann” (meat production) and “apro_mk_farm” (milk production); Final EU GHG inventory submission 2021 (version 20210508).
For example, a 17% reduction occurred in enteric methane emissions per kg milk produced between 2000 and 2019, and a 23% reduction in all methane emissions from swine per kg of pork produced since
Austria
Belgium
Bulgaria
Croatia
Cyprus
Czechia
Estonia
FinlandFrance
Germany
Greece
Hungary
Ireland
ItalyLatvia
Lithuania
Luxembourg
Malta
Netherlands
Poland
PortugalRomania
Slovakia
Slovenia
SpainSweden
-60
-40
-20
0
20
40
60
-60 -40 -20 0 20 40 60 80
% c
han
ge in
dai
ry c
attl
e e
nte
ric
me
than
e e
mis
sio
ns
% change in milk production
60
70
80
90
100
110
120
2004 2006 2008 2010 2012 2014 2016 2018
Ind
ex (
20
04
= 1
00)
Pork methane emissions intensity
Swine CH4 Pork production Pork CH4 intensity
60
70
80
90
100
110
120
2000 2002 2004 2006 2008 2010 2012 2014 2016 2018
Ind
ex (
20
00
= 1
00)
Milk enteric methane emissions intensity
Dairy cattle enteric CH4 Milk production
Milk enteric CH4 intensity

Eionet Report - ETC/CME 6/2021 13
2004 (Figure 1.5)4. This implies that without the changes in management practices that occurred, emissions would have risen alongside production. A recent evaluation of the GHG mitigation impacts of the 2014-2020 CAP estimated that for CAP measures with quantifiable impacts, emissions in 2016 would have been 0.3% - 8.7% higher without these measures (Alliance Environnement, 2018). Moreover, comparison of emissions intensity of production (Figure 1.6) across NUTS 25 regions in Europe indicates significant variation, and the variation between individual farms or production systems may be even larger. This suggests that there could be considerable scope to reduce emissions intensity of many farms to be closer to the level of the best-performing ones, provided that these patterns are not driven by insurmountable agro-climatic constraints, and would not result in severe trade-offs.
Figure 1.6 Variation in cradle-to-gate emissions intensity of animal products across European countries
Source: Taken from Peyraud and MacLeod (2020) based on data from Leip et al. (2010)
Data on current uptake of GHG mitigation measures is not always available, and this makes it difficult to quantify scope for additional uptake. Nevertheless, it is likely that considerable additional uptake is possible for many measures (Ricardo-AEA, 2016). Box 1 below presents the thoughts of MS representatives, regarding the key drivers of emissions trends in their countries over the last few decades.
(4) These products and emissions sources were chosen because they can be linked reliably on a 1-to-1 basis
from publicly available data, to illustrate the point. However, a full life cycle assessment (LCA) is required to properly account for all emissions sources related to production of a product. This was beyond the scope of this work.
(5) https://ec.europa.eu/eurostat/web/nuts/background
Eionet Report - ETC/CME 6/2021 14
Some authors argue that the improvements in efficiency and productivity which have, in some cases, led to lower GHG intensity of production, may have also contributed to increased production through a kind of “rebound effect” because producers are more competitive (ECA, 2021). If this is the case, then it is logical to consider how emissions could be cut without causing an increase in production. Given that the EU targets for emissions reductions apply to agriculture in the EU, it could be proposed to focus on mitigation measures which reduce inputs in ways which would lead to lower yields (e.g. organic farming), and a reduction of GHG emissions and overall production of EU agriculture. However, European food systems are integrated into a globalised commodity market, so without changes in demand for food from Europeans, there is a risk of emissions leakage through increased imports to satisfy demand. As GHG emissions have a global impact, it is the net effect of PaMs on global GHG emissions which matters, rather than on the official EU emissions inventory. This has several implications:
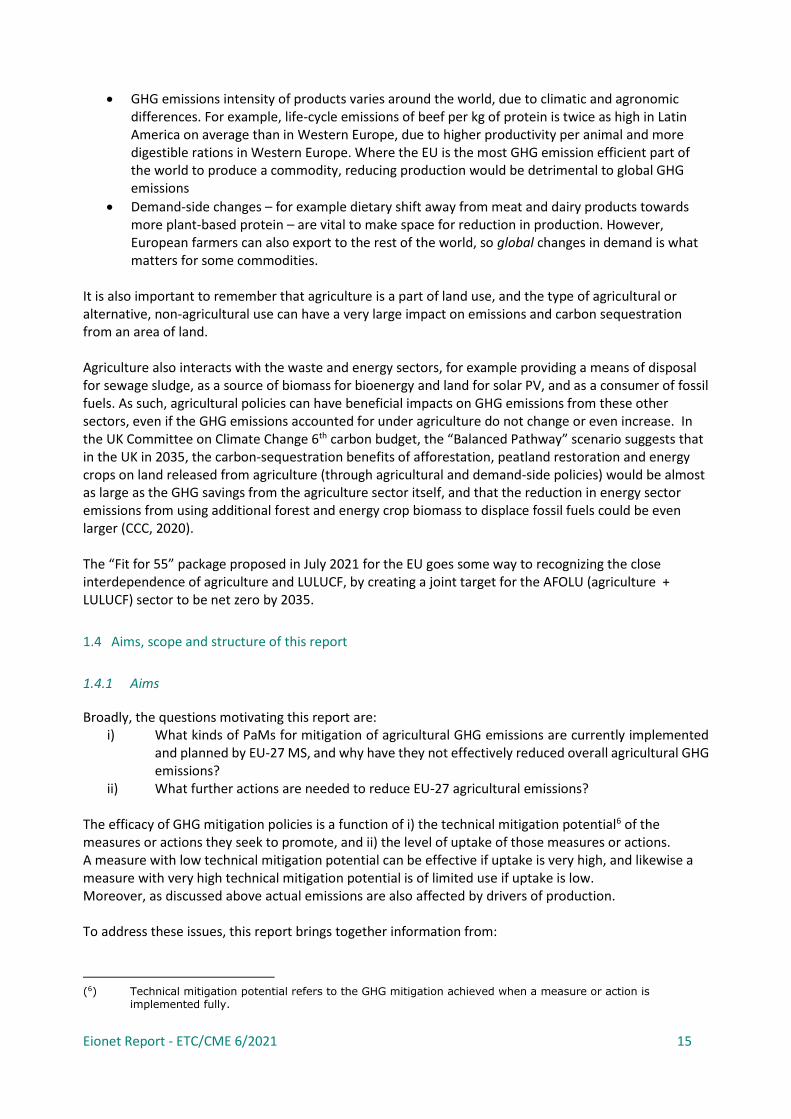
Box 1 Questionnaire responses on drivers of agricultural emissions trends
Respondents to a MS questionnaire undertaken as part of this work (see section 1.5 and Annex 2 for
details) voted on which drivers have been most important in driving emissions trends in their country since 1990 (Figure B2.1):
Figure B2.1 Bar chart of the frequency with which each driver was selected in response to the question:
'which of the following drivers of GHG emissions do you think have undergone significant changes in your country over the last 30 years?'
Text comments provided by respondents offered further explanation of key drivers. Important trends noted were:
• The reduction in numbers of many animal types in the early 1990s, in Eastern Europe in particular
• Increasing productivity per animal for pigs and cattle, through changes in diet and breeding, driving a lower GHG intensity of production
• A shift from solid manure to slurry-based manure management systems, which causes higher methane emissions
• Decreases in fertiliser application, following decoupling of CAP payments from production levels.
Eionet Report - ETC/CME 6/2021 15
• GHG emissions intensity of products varies around the world, due to climatic and agronomic differences. For example, life-cycle emissions of beef per kg of protein is twice as high in Latin America on average than in Western Europe, due to higher productivity per animal and more digestible rations in Western Europe. Where the EU is the most GHG emission efficient part of the world to produce a commodity, reducing production would be detrimental to global GHG emissions
• Demand-side changes – for example dietary shift away from meat and dairy products towards more plant-based protein – are vital to make space for reduction in production. However, European farmers can also export to the rest of the world, so global changes in demand is what matters for some commodities.
It is also important to remember that agriculture is a part of land use, and the type of agricultural or alternative, non-agricultural use can have a very large impact on emissions and carbon sequestration from an area of land. Agriculture also interacts with the waste and energy sectors, for example providing a means of disposal for sewage sludge, as a source of biomass for bioenergy and land for solar PV, and as a consumer of fossil fuels. As such, agricultural policies can have beneficial impacts on GHG emissions from these other sectors, even if the GHG emissions accounted for under agriculture do not change or even increase. In the UK Committee on Climate Change 6th carbon budget, the “Balanced Pathway” scenario suggests that in the UK in 2035, the carbon-sequestration benefits of afforestation, peatland restoration and energy crops on land released from agriculture (through agricultural and demand-side policies) would be almost as large as the GHG savings from the agriculture sector itself, and that the reduction in energy sector emissions from using additional forest and energy crop biomass to displace fossil fuels could be even larger (CCC, 2020). The “Fit for 55” package proposed in July 2021 for the EU goes some way to recognizing the close interdependence of agriculture and LULUCF, by creating a joint target for the AFOLU (agriculture + LULUCF) sector to be net zero by 2035.
1.4 Aims, scope and structure of this report
1.4.1 Aims
Broadly, the questions motivating this report are: i) What kinds of PaMs for mitigation of agricultural GHG emissions are currently implemented
and planned by EU-27 MS, and why have they not effectively reduced overall agricultural GHG emissions?
ii) What further actions are needed to reduce EU-27 agricultural emissions? The efficacy of GHG mitigation policies is a function of i) the technical mitigation potential6 of the measures or actions they seek to promote, and ii) the level of uptake of those measures or actions. A measure with low technical mitigation potential can be effective if uptake is very high, and likewise a measure with very high technical mitigation potential is of limited use if uptake is low. Moreover, as discussed above actual emissions are also affected by drivers of production. To address these issues, this report brings together information from:
(6) Technical mitigation potential refers to the GHG mitigation achieved when a measure or action is
implemented fully.

Eionet Report - ETC/CME 6/2021 16
• Reported GHG mitigation PaMs in 2021 by MS under the Governance Regulation (2018/1999) to understand the types of PaMs that are commonly implemented, and if any effective actions or technologies are not frequently supported by PaMs. This also includes PaMs relating to LULUCF and energy sector emissions, and relating to wider food system.
• Experience of national and international agriculture experts, by issuing a questionnaire and conducting interviews to understand key barriers to uptake and good practice (both in particular MS via case studies, and in general), as well as their plans and insights on future priorities.
• Other datasets and literature to provide insights into country-specific circumstances. The report aims to serve as useful reference for national experts interested in learning from the PaMs and experiences of other MS. In June 2021 an agreement on future CAP reform was reached, and MS have now submitted draft CAP strategic plans for 2023-2027 to the Commission, which outline how each country will use CAP instruments to achieve CAP objectives, one of which is GHG mitigation. This report is therefore timely in the context of the review of CAP strategic plans.
1.4.2 Scope
As discussed above in section 1.2, when assessing agricultural GHG mitigation PaMs, it makes sense to consider the GHG impacts of agricultural PaMs in a broad sense, including emissions from several sectors affected by agricultural policy (agriculture, energy, LULUCF and waste). In addition, it makes sense to consider impacts from a global perspective, not just from an EU territorial one, so PaMs affecting demand for food or imports and exports are also of relevance. The scope of the analysis of reported PaMs and their GHG impacts therefore includes these themes where relevant. By affecting the agricultural land footprint and management practices agricultural policy decisions affect a range of other ecosystem services and negative externalities, relating to hydrology, water and air quality, biodiversity, rural livelihoods and recreation, as well as fundamentally having to ensure food security. Agricultural policies need to balance all of these aspects of sustainability. Evaluation of the impacts of agricultural PaMs on these aspects of sustainability is outside the scope of this report, though such impacts are referred to where relevant, in particular in section 5.4. The geographical scope of the analysis undertaken here is the EU-27 (post-2020). However, questionnaires were also sent to experts in partner countries, and responses received from Turkey and Switzerland which were also taken into account in the report. The scope of information considered when assessing the type of PaMs reported by MS was largely dependent on what was reported by MS under the Governance Regulation (see section 1.5.1).
1.4.3 Structure
The remainder of the report is divided into six main sections:
• In the remainder of this section, the methodology used in the analysis is presented.
• Section 2 presents the results of an EU-wide assessment of agricultural PaMs reported in 2021 in
the PaMs database (which consolidates all PaMs reported under the Governance Regulation),
combined with specific insights on implementation barriers and successes from the questionnaire
and expert interviews.
• Section 3 discusses cross-cutting barriers and good practice emerging from questionnaire
responses, interviews and the wider literature.
Eionet Report - ETC/CME 6/2021 17
• Section 4 presents in-depth case studies which have been carried out for four countries (Denmark,
France, Latvia and Spain), using available databases and literature, to understand in more detail
the drivers of emissions trends, challenges and success in implementing policies, and the plans for
future policies and rationale for projected emissions.
• Section 5 presents perspectives from questionnaire respondents, interviewees on the future of
GHG mitigation in agriculture, as well as upcoming policy developments.
• Section 6 presents conclusions
1.5 Methodology
1.5.1 EU-wide assessment of reported PaMs
An analysis of the PaMs reported in 2021 by MS under the Governance Regulation (2018/1999) (provided by the EEA as the “EEA PaMs database”) was carried out, building on the same work undertaken on PaMs reported in 2019. The purpose of this analysis was to summarise the information in the database, to understand which measures and approaches are commonly supported and which are less frequently across MS. The full EEA PaMs database was filtered to include only PaMs where either:
• the “Sector(s) affected” field included “Agriculture” in the list
• the “Sector(s) affected” field included “LULUCF” or “Waste” in the list and the PaM description showed that it was relevant to agriculture.
After filtering, 292 relevant PaMs were retained. This subset of PaMs is referred to as “agricultural” PaMs in the remainder of the report. The assessment aimed to create a higher-level summary of the information in the database by categorising the very specific measures mentioned in the database into more aggregated categories. Firstly, a shortlist of potential categories of mitigation measure was created in a spreadsheet template, based on those identified in Ricardo-AEA (2016) and CCC (2020). Team members then assessed each PaM in turn, and selected which category(ies) of measure were targeted by that PaM. This judgement was based on the PaM description field, listed objectives, and additional reports or websites referenced in the database. The list of potential categories of mitigation measures was further refined during the assessment process. Categories of measure were grouped into five overarching themes: livestock measures, crop and soil N2O mitigation measures, carbon sequestration measures, energy measures and demand-side / wider food system measures, which is reflected in the structure of results presented in section 2. Other information reported by MS in the PaMs database was also used directly (i.e., without modification by the project team) in the analysis below, including the link to EU policy, type of policy instrument and PaM status (expired, implemented, adopted and planned).
One important caveat to the analysis of reported PaMs is that it was limited by the quality, detail and completeness of information provided by MS. In particular:
• Ex ante and ex post quantification of mitigation impact were reported by only 11 MS, and within those often in an incomplete way. This incompleteness prevented a quantitative analysis of which PaMs have the greatest mitigation potential across MS. However, where present, ex ante quantifications for individual PaMs have been mentioned within the country case studies (section 4). Quantitative information on current level of uptake and potential for future uptake
Eionet Report - ETC/CME 6/2021 18
was also not available across the board, so this was instead assessed qualitatively through the questionnaire, and within country case-studies where information was available.
• The level of detail provided by MS in the PaM description field is highly variable, as is the presence of a URL to locate additional information. Although linked documents were consulted, the project resources did not allow for exhaustive consultation of all published material. Therefore, in some cases this may have led to “false negatives” for vaguely described or broad PaMs, where measures were not explicitly mentioned in the description.
• Similarly, there may have been differing reporting practices across MS regarding which PaMs were included in the PaMs database. For example, several countries did not report measures mandated under pillar 1 of the CAP (such as fertilizer application limits for cross-compliance with the Nitrate Directive) - perhaps because these are assumed a “given” – whereas other countries did report these. The team analysed what was reported on the basis of the information available in the database and linked documents, so in such cases again there may be “false negatives” in the analysis below. Due to this and to the previous caveat on level of detail provided, the report does not emphasise drawing comparisons across MS, in terms of the scope of their reported PaMs.
• The lack of consistency of reporting in the “link to EU policy” field of the PaMs database meant that when considering an individual PaM, the significance of it being related to an EU policy or not could not be reliably assessed. Therefore, analysis of links to EU policy was only undertaken on an aggregate level (section 2.1), and within country case studies (section 4).
A more detailed assessment of reporting quality, undertaken in 2020 on 2019 reported PaMs, is provided in Annex 1.
1.5.2 Questionnaire and Interviews with Members States
The focus of this subtask was to gain more insight into the challenges faced by MS in implementing effective agricultural emission reduction policies and for uptake by farmers, both historically and foreseen in the future. It further provided the opportunity to understand what successful policies have been implemented and understand potential opportunities to implementing such GHG-reducing PaMs across other MS. A short questionnaire (Annex 2 provides the questionnaire in full) was designed and sent to national experts in all EU MS and partner countries, with the aim of obtaining a country-specific perspective of:
i) the historical challenges and successes in implementing GHG reduction policies, and ii) future plans and potential of both further implementation of technical measures to reduce
GHG emissions intensity of production, and also demand-side target measures (dietary shift, food waste).
57 responses were provided from representatives of 13 countries (Austria, Belgium, Czechia, France, Greece, Latvia, Netherlands, Poland, Slovakia, Slovenia, Spain, Switzerland and Turkey). All countries except for Poland provided a single main response (or indicated which response was the main one), whereas in Poland respondents from many different institutions responded separately (45 responses). All responses were taken into account for Poland. Respondents included a mixture of agriculture GHG inventory compilers, policy advisors and researchers. From Poland, respondents also included farmers and agricultural advisors. A list of respondents and their roles is provided in Annex 3. The questions included in the questionnaire were mainly open-ended, text-based questions. This allowed respondents to express their views flexibly and freely to explore the whole scope of the topic (not artificially constrained by a list of multiple-choice options), with some responses providing very rich
Eionet Report - ETC/CME 6/2021 19
information on individual cases. However, open-ended textual answers are difficult to analyse quantitatively. Therefore, a qualitative assessment was carried out on questionnaire responses:
• For each question, a list of distinct themes emerging from responses was built up cumulatively as responses were read
• Where the same theme reoccurred, this was noted by keeping a tally of which countries had mentioned each distinct theme.
The results of this qualitative assessment were then included throughout the text of this report, largely in section 2, but also elsewhere where appropriate. Interviews were conducted with independent national and international experts, designed to capture cross-cutting themes applicable to many countries, as well as opinions on future priorities informed by their expert knowledge, and perhaps less influenced by any political sensitivities which may have affected responses to the MS questionnaire. Four 1-hour long interviews were conducted by the project team, with:
• Dr. Giulia Bazzan, postdoctoral researcher in public policy on the Horizon 2020 EFFECT project7 at the University of Copenhagen, Denmark;
• Dr. Nick Hutchings, senior agricultural emissions researcher in the Department of Agroecology, Aarhus University (Denmark), and member of the UNECE Task forces on emissions inventories and projections (TFEIP) and reactive nitrogen (TFRN);
• Prof. Werner Zollitsch, Division of Livestock Sciences, University of Natural Resources and Life Sciences, Vienna, Austria;
• Dr. John Lynch, postdoctoral researcher on emissions from meat and dairy production, Department of Physics, University of Oxford, UK.
As with the questionnaire responses, the interviews were focused around open-ended questions, and the responses of the interviewers have been incorporated anonymously (as agreed with the interviewees) into the text throughout. The questionnaires and interviews provided MS experts the opportunity to outline the countries long-term ideas and plans for how major emissions reductions could be achieved. The outcomes of the questionnaire and interviews were used to consolidate and build upon the four national case-studies undertaken in 2020 (Spain, Denmark, France and Latvia), and synthesise the EU-wide assessment with more insight into what opportunities and challenges exist in implementing effective mitigation measures.
1.5.3 Selected country case studies
The methodology used to undertake country case studies is provided in section 4.1.
(7) https://project-effect.eu/
Eionet Report - ETC/CME 6/2021 20
2 Assessment of reported PaMs, questionnaire responses and interviews by topic
In this section, first an overall assessment is presented of the EU policy drivers, instrument types and PaM status as reported in the 2021 EEA PaMs database. Following this, an analysis of PaMs is presented for several broad themes, drawing on information from reported PaMs, questionnaire responses as well as insights from interviews and the literature. The broad themes covered are:
• Livestock measures
• Crops and soil nitrogen mitigation measures
• Carbon storage / sequestration measures
• Energy mitigation measures
• Wider food system measures However, it is recognised that there are strong interlinkages between PaMs in these areas, and cross-references are made where appropriate.
2.1 Policy drivers and instrument types
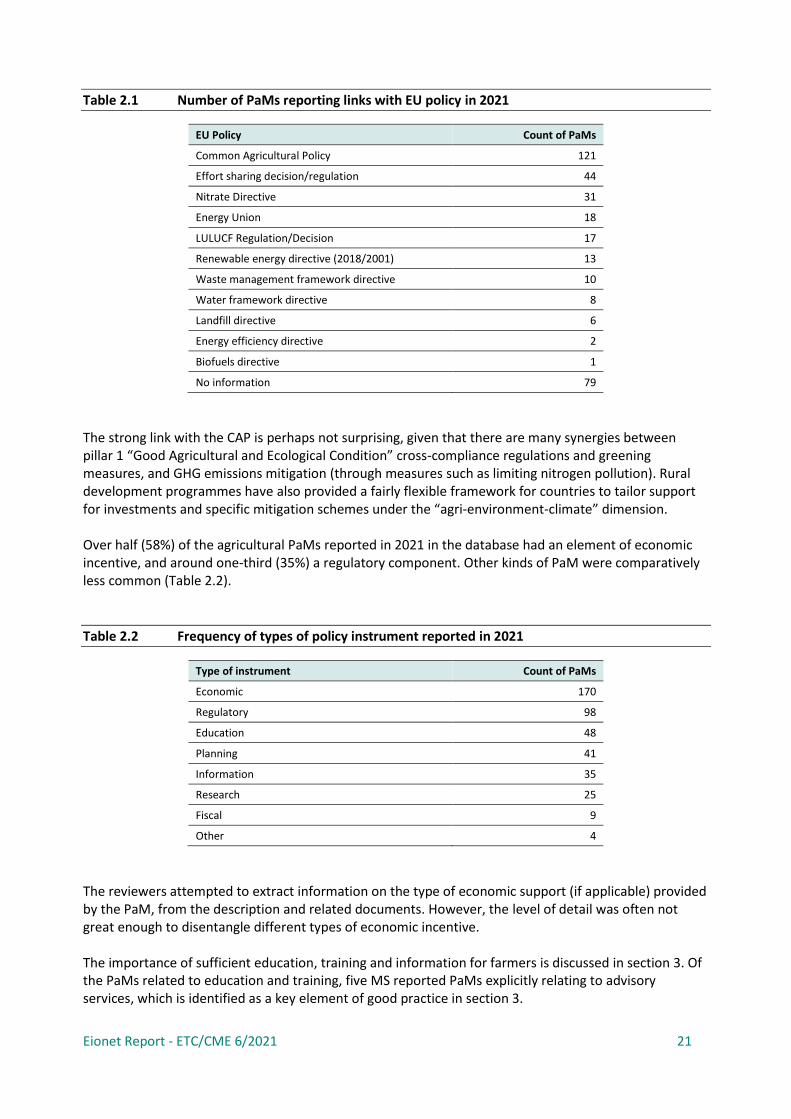
Agriculture-related PaMs in the EEA PaM database8 tend to be multi-functional, and driven by EU policy. Based on an assessment of agricultural PaMs reported in 20199, of the PaMs with sufficient detail for reviewers to make an assessment around one-third had GHG emissions mitigation as their primary aim, but for two-thirds this was a co-benefit. For soils emissions measures, reduction in nitrogen pollution in order to protect aquatic and terrestrial habitats from eutrophication was the most common policy driver, supported by the Nitrate Directive, Water Framework Directive and cross-compliance requirements under the CAP. For livestock, reducing nitrogen losses from manure storage was also a big driver, but so also was increasing efficiency of livestock production (which tends to act to reduce emissions intensity). Nearly three-quarters (73%) of the PaMs reported in 2021 stated a link with at least one EU policy. Of those which provided no information, some are likely to be due to incomplete reporting, rather than a lack of link to EU policies. Aside from the CAP (which around 57% of agricultural PaMs were related to, where information was provided), the Effort Sharing Decision and Regulation and Nitrate Directive were also commonly cited, alongside a variety of other less frequent EU policies (Table 2.1).
(8) http://pam.apps.eea.europa.eu/ (9) This aspect of the analysis was not repeated for 2021 PaMs
Eionet Report - ETC/CME 6/2021 21
Table 2.1 Number of PaMs reporting links with EU policy in 2021
EU Policy Count of PaMs
Common Agricultural Policy 121
Effort sharing decision/regulation 44
Nitrate Directive 31
Energy Union 18
LULUCF Regulation/Decision 17
Renewable energy directive (2018/2001) 13
Waste management framework directive 10
Water framework directive 8
Landfill directive 6
Energy efficiency directive 2
Biofuels directive 1
No information 79
The strong link with the CAP is perhaps not surprising, given that there are many synergies between pillar 1 “Good Agricultural and Ecological Condition” cross-compliance regulations and greening measures, and GHG emissions mitigation (through measures such as limiting nitrogen pollution). Rural development programmes have also provided a fairly flexible framework for countries to tailor support for investments and specific mitigation schemes under the “agri-environment-climate” dimension. Over half (58%) of the agricultural PaMs reported in 2021 in the database had an element of economic incentive, and around one-third (35%) a regulatory component. Other kinds of PaM were comparatively less common (Table 2.2).
Table 2.2 Frequency of types of policy instrument reported in 2021
Type of instrument Count of PaMs
Economic 170
Regulatory 98
Education 48
Planning 41
Information 35
Research 25
Fiscal 9
Other 4
The reviewers attempted to extract information on the type of economic support (if applicable) provided by the PaM, from the description and related documents. However, the level of detail was often not great enough to disentangle different types of economic incentive. The importance of sufficient education, training and information for farmers is discussed in section 3. Of the PaMs related to education and training, five MS reported PaMs explicitly relating to advisory services, which is identified as a key element of good practice in section 3.
Eionet Report - ETC/CME 6/2021 22
2.2 Livestock Measures
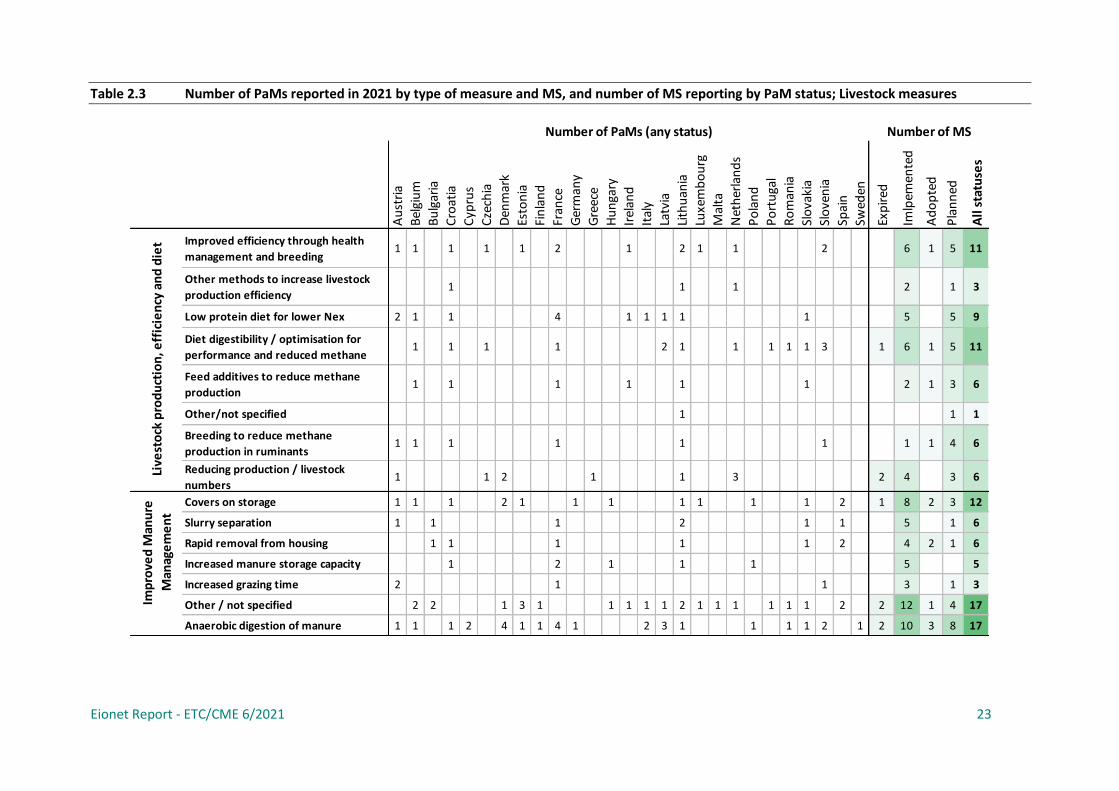
Table 2.3 overleaf summarises livestock-related PaMs reported by MS in 2021.
2.2.1 Improved livestock production efficiency and diets
17 MS reported PaMs relating to livestock production, efficiency and diets (Table 2.3). The following paragraphs discuss more specific themes included in reported PaMs. 11 MS reported PaMs relating to livestock diet optimization and improving digestibility, which can lead to higher feed conversion efficiency and lower enteric methane emissions per unit of product. Six of these MS have already implemented those PaMs. 11 MS reported PaMs relating to general health and disease management, and breeding for increased productivity (e.g. faster growth rates, higher milk yields), which tend to lead to lower emissions per unit of product. The benefit of better health and disease management may sometimes accrue at the herd level rather than for individual animals, through reduction in loss of stock and improved longevity. Five of these MS have already implemented those PaMs. Questionnaire respondents from 3 MS indicated that breeding programmes have been well organised and have contributed to increased productivity, and several MS reported that increases in productivity have occurred historically through changes in diets. Potential barriers cited by some respondents to uptake of measures to reduce enteric fermentation emissions included high costs, difficulty in implementing measures on small farms, and lack of information on the potential or efficacy of measures. On the other hand, the Netherlands indicated that research involving farmers was proving successful at identifying effective measures. Nine MS reported PaMs relating to reducing surplus protein in feed to reduce nitrogen excretion, which leads to a reduction in N2O emissions from manure. Five of these MS have already implemented PaMs, and five are planning to implement further PaMs. One expert interviewed commented that in their country, adjusting pig and poultry rations appropriately is not technically too challenging, but that payment according to lean meat content of animals makes farmers reluctant to reduce protein in feed. Interestingly, six MS reported PaMs related to reducing livestock numbers. In the Netherlands and Denmark, the stated motivation for reducing numbers is local reduction in nitrogen and phosphorus loads in sensitive areas to protect ecosystems, rather than GHG mitigation per se. Greece reported that the decoupling of subsidies from production through green direct payments has already helped to reduce livestock numbers. Of the questionnaire respondents who provided comments on this topic:
• Respondents from 2 countries cited a strong opposition amongst some farmers to “extensification”.
• Respondents from 1 country said that rising global population and demand for animal products means the supply of livestock goods from Europe should not be reduced.
• Respondents from 2 countries indicated there should be other priorities for GHG mitigation before reducing production, such as tackling food waste.
Eionet Report - ETC/CME 6/2021 23
Table 2.3 Number of PaMs reported in 2021 by type of measure and MS, and number of MS reporting by PaM status; Livestock measures
Au
stri
a
Bel
giu
m
Bu
lgar
ia
Cro
atia
Cyp
rus
Cze
chia
Den
mar
k
Esto
nia
Fin
lan
d
Fran
ce
Ger
man
y
Gre
ece
Hu
nga
ry
Irel
and
Ital
y
Latv
ia
Lith
uan
ia
Luxe
mb
ou
rg
Mal
ta
Net
her
lan
ds
Po
lan
d
Po
rtu
gal
Ro
man
ia
Slo
vaki
a
Slo
ven
ia
Spai
n
Swed
en
Exp
ired
Imlp
emen
ted
Ad
op
ted
Pla
nn
ed
All
sta
tuse
s
Improved efficiency through health
management and breeding1 1 0 1 0 1 0 1 0 2 0 0 0 1 0 0 2 1 0 1 0 0 0 0 2 0 0 0 6 1 5 11
Other methods to increase livestock
production efficiency0 0 0 1 0 0 0 0 0 0 0 0 0 0 0 0 1 0 0 1 0 0 0 0 0 0 0 0 2 0 1 3
Low protein diet for lower Nex 2 1 0 1 0 0 0 0 0 4 0 0 0 1 1 1 1 0 0 0 0 0 0 1 0 0 0 0 5 0 5 9
Diet digestibility / optimisation for
performance and reduced methane0 1 0 1 0 1 0 0 0 1 0 0 0 0 0 2 1 0 0 1 0 1 1 1 3 0 0 1 6 1 5 11
Feed additives to reduce methane
production0 1 0 1 0 0 0 0 0 1 0 0 0 1 0 0 1 0 0 0 0 0 0 1 0 0 0 0 2 1 3 6
Other/not specified 0 0 0 0 0 0 0 0 0 0 0 0 0 0 0 0 1 0 0 0 0 0 0 0 0 0 0 0 0 0 1 1
Breeding to reduce methane
production in ruminants1 1 0 1 0 0 0 0 0 1 0 0 0 0 0 0 1 0 0 0 0 0 0 0 1 0 0 0 1 1 4 6
Reducing production / livestock
numbers1 0 0 0 0 1 2 0 0 0 0 1 0 0 0 0 1 0 0 3 0 0 0 0 0 0 0 2 4 0 3 6
Covers on storage 1 1 0 1 0 0 2 1 0 0 1 0 1 0 0 0 1 1 0 0 1 0 0 1 0 2 0 1 8 2 3 12
Slurry separation 1 0 1 0 0 0 0 0 0 1 0 0 0 0 0 0 2 0 0 0 0 0 0 1 0 1 0 0 5 0 1 6
Rapid removal from housing 0 0 1 1 0 0 0 0 0 1 0 0 0 0 0 0 1 0 0 0 0 0 0 1 0 2 0 0 4 2 1 6
Increased manure storage capacity 0 0 0 1 0 0 0 0 0 2 0 0 1 0 0 0 1 0 0 0 1 0 0 0 0 0 0 0 5 0 0 5
Increased grazing time 2 0 0 0 0 0 0 0 0 1 0 0 0 0 0 0 0 0 0 0 0 0 0 0 1 0 0 0 3 0 1 3
Other / not specified 0 2 2 0 0 0 1 3 1 0 0 0 1 1 1 1 2 1 1 1 0 1 1 1 0 2 0 2 12 1 4 17
Anaerobic digestion of manure 1 1 0 1 2 0 4 1 1 4 1 0 0 0 2 3 1 0 0 0 1 0 1 1 2 0 1 2 10 3 8 17
Number of MSIm
pro
ved
Man
ure
Man
age
me
nt
Number of PaMs (any status)
Live
sto
ck p
rod
uct
ion
, eff
icie
ncy
an
d d
iet

Eionet Report - ETC/CME 6/2021 24
The European court of Auditors report (ECA, 2021) identifies voluntary coupled support (VCS) payments through the CAP as one factor which may be artificially maintaining high livestock numbers in the EU. Questionnaire respondents from 2 MS highlighted reduction in livestock production as a key means of GHG mitigation in the future. However, the risk of emissions leakage when reduction in production is not matched by reduction in demand is important, and is discussed in Section 1.
2.2.2 Improved manure management and storage
This group of measures seeks to reduce emissions of methane and nitrous oxide (direct and indirect) from manure storage, by a variety of means. Almost all MS (25) reported measures under this group, varying by country in their specific focus (Table 2.3). The following paragraphs discuss more specific types of measure included in reported PaMs. Twelve MS reported PaMs related to covering of manure stores. When covers are gas-tight, this reduces volatilisation of nitrogen compounds (in turn reducing indirect N2O emissions), and can also reduce methane emissions (IPCC, 2019). Other intrastructure-related measures mentioned less frequently were:
• Separation of liquid and solid fractions of manure, which helps to reduce methane emissions and use nitrogen more effectively.
• Rapid removal of manure from housing in order to reduce nitrogen volatilization.
• Increasing the storage capacity so that manure can be applied to land at appropriate times. Several MS (such as Netherlands, Denmark and Poland) have mandatory and well-enforced requirements for new slurry stores to be covered, resulting in high uptake. Questionnaire respondents indicated that lack of financial resources and space on smaller farms was a limiting factor for upgrading manure management systems. Many reported PaMs do provide investment support, but there may be hurdles to accessing funding. In Romania communal manure storage areas with impermeable bases to prevent leaching have been developed, which has gone some way to overcome the problems caused by a fragmented agricultural sector (Milea, 2020). Three MS (Austria, France and Slovenia) reported PaMs related to increasing grazing time, which reduces methane and indirect N2O emissions form manure management due to lower quantities of stored manure. It also brings animal welfare benefits and contributes to preserving permanent pasture. In Slovenia, land fragmentation can be a problem for successfully implementing this measure, and one expert interviewed mentioned that there may be trade-offs between grazing and simultaneously optimising the feed ration. 17 MS reported some PaMs relating to manure management which were very general in nature, so could not be categorized more specifically.
2.2.3 Anaerobic digestion of manure
Anaerobic digestion of manure to produce biogas is incentivised widely across Europe, with 17 MS reporting PaMs specifically targeting this measure. This measure can reduce methane emissions from manure management, as well as CO2 emissions from fossil fuel combustion when the resulting biogas is used to generate electricity or fed into the natural gas grid. A further co-benefit is that digestate

Eionet Report - ETC/CME 6/2021 25
constitutes a high-quality organic10 nitrogen fertiliser, more suitable to apply to certain crops or at certain times of the year than raw manure or slurry. Due to the capital-intensive nature of establishing anaerobic digesters, incentives focus on grants to help with set-up costs, but further incentives such as feed-in tariffs exist in, for example, in Denmark, Germany, France and Sweden. The share of managed manure which is digested in the EU has grown from less than 1% in 2005 to almost 6% in 201911, implying some degree of success from implemented measures. However, in the questionnaire it was reported by several national experts that although biogas plant expansion has occurred, it has not kept pace with ambitious national projections and targets. There is a perception that there is still scope to expand anaerobic digestion of manure further; questionnaire respondents from two counties identified anaerobic digestion as one of the key opportunities for reducing agricultural emissions over the next 30 years, in areas with a high concentration of livestock production. It is also a good way for large farms to handle overproduction of manure. However, there was concern from respondents representing MS with typically smaller average farm sizes, that on-farm biogas plants require large financial input and construction permits which are difficult to obtain, and the volumes of manure produced are too small. Centralised biogas facilities would help to overcome these issues. However, where ownership and subsidy structures lead to extensive use of energy crops as co-feedstocks, this brings sustainability concerns. One expert interviewed discussed the problems of public acceptance of the impacts of biogas expansion in Bavaria, where high feed-in tariffs triggered a boom in production of forage maize as a co-digestate, to maximise methane yield. Concerns centred around the transformed appearance of the landscape in some areas, as well as the potential impacts on soil erosion and food vs. bioenergy competition. The response by the German government was to restrict the maize share of feedstock in new facilities. The Denmark case study (section 4.2) discusses anaerobic digestion further.
2.2.4 Gaps
Six MS reported PaMs targeting breeding of livestock and feed additives, specifically to inhibit enteric fermentation. However, at the time of reporting most of these were either “adopted” or “planned” as opposed to already implemented. These measures were identified by Ricardo-AEA (2016) and Pérez Domínguez (2016; EcAMPA2) as measures with considerable mitigation potential. Therefore, this can be considered somewhat of a gap in current reported PaMs. Increases in productivity of livestock systems has led to reduced emissions intensity of livestock production, but may have also contributed to a rise in production levels in Europe (ECA, 2021). Breeding and feeding specifically for low enteric methane emissions would perhaps be less likely to lead to increases in production. Experts interviewed highlighted that, given that targeted breeding specifically for low enteric fermentation emissions is a relatively new concept, there could be significant mitigation potential from this measure. However, they also commented that practical challenges - such as how to screen large numbers of cattle for methane emissions - require further research. Among questionnaire respondents, the improvements in feed additives and livestock breeding were quoted as some of the key policies, strategies and technologies which were most promising for reducing GHG emissions from their country’s agricultural production in the next 30 years. However, there is currently limited real-world evidence of the efficacy, cost and impact on production of feed additives (ECA, 2021), and there are also concerns over residues in animal products (Peyraud and McLeod, 2020).
(10) In this context, organic in the sense of being of biological origin (11) Source: European Union 2021 CRF submission to the UNFCCC https://unfccc.int/documents/274754
Eionet Report - ETC/CME 6/2021 26
Another measure identified as having high mitigation potential by Ricardo-AEA (2016), not explicitly mentioned in reported PaMs, is the use of sexed-semen for breeding dairy replacements so that most calves produced are female. This increases efficiency of dairy production if male dairy calves are not suitable for beef production. An alternative approach to the issue, mentioned by one questionnaire respondent but no reported PaMs, is better integration of dairy and beef production using “multi-purpose” breeds where male calves are more suitable for beef production. This could considerably lowers the GHG intensity of beef production, because these calves would not require a dedicated suckler herd (Ricardo-AEA, 2016). ECA (2021) identified two effective manure management measures for which only a handful of MS offered CAP support in the 2014-2019 period: slurry acidification and manure cooling. Neither of these measures were explicitly mentioned in reported PaMs. Both acidification and cooling reduce ammonia volatilization from slurry, and cooling also helps to reduce methane emissions. Currently, within Europe the measures are most common in Denmark.
2.3 Crops and Soil N2O mitigation measures
Table 2.4 overleaf summarises PaMs reported by MS in 2021 related to reducing direct and indirect N2O emissions from agricultural soils.
2.3.1 Reducing nitrogen application and losses from soils
The most commonly reported measures relate to reducing the quantity of nitrogen applied, reported by 20 MS (Table 2.4), with the majority (16) reporting already implemented measures. Reducing nitrogen application directly reduces N2O emissions from soils. These PaMs are implemented in a variety of ways. Application limits and nutrient management plans are part of the cross-compliance rules within the CAP with the nitrates directive and water framework directives, so all MS are required to have appropriate regulations (though some have not reported these separately in the PaMs database). Measures which reduce losses of nitrogen (in the form of NH3 and NOx) from synthetic and organic fertilizer application reduce indirect N2O emissions from soils. In addition, they can also indirectly lead to reduced nitrogen application, though this depends on appropriate adjustment of application rates to account for lower losses (UNECE, 2021). In this context, creation and good implementation of nutrient management plans (where nutrient application is tailored to the needs of the crop) is essential. This is also important to ensure that measure to lower NH3 emissions from housing and manure management do not simply result in higher NH3 emissions from application, or pollution-swapping (increased direct N2O and nitrate leaching). Specific measures reported reduce N losses included (Table 2.1, Table 2.4):
• Use of low NH3 emission spreading techniques for manure and other organic fertilisers (ten MS)
• Low emission synthetic fertilisers, such as switching from urea to other kinds of mineral fertiliser with lower NH3 emissions (eight MS)
• Use of cover / catch crops to reduce nitrogen released when crops are not present (eight MS)
• Precision fertilisation – applying nitrogen only when and where needed to ensure optimal uptake by plants (nine MS)

Eionet Report - ETC/CME 6/2021 27
Table 2.4 Number of PaMs reported in 2021 by type of measure and MS, and number of MS reporting by PaM status; Crop and soil N2O measures
* This category refers to measures directly affecting the quantity of fertilizer applied only, such as an application limit or nutrient management plan. Other measures which reduce N losses can indirectly cause a reduction in N application, but these are covered under other categories.
Au
stri
a
Bel
giu
m
Bu
lgar
ia
Cro
atia
Cyp
rus
Cze
chia
Den
mar
k
Esto
nia
Fin
lan
d
Fran
ce
Ger
man
y
Gre
ece
Hu
nga
ry
Irel
and
Ital
y
Latv
ia
Lith
uan
ia
Luxe
mb
ou
rg
Mal
ta
Net
her
lan
ds
Po
lan
d
Po
rtu
gal
Ro
man
ia
Slo
vaki
a
Slo
ven
ia
Spai
n
Swed
en
Exp
ired
Imlp
emen
ted
Ad
op
ted
Pla
nn
ed
All
sta
tuse
s
Management/reduction in amount of
N fertiliser applied*1 0 1 0 0 2 5 0 1 3 2 1 1 1 0 6 3 1 0 0 1 1 2 1 2 1 2 1 16 2 8 20
Replacement of synthetic nitrogen
fertilisers with organic ones1 1 0 0 0 0 0 1 0 2 0 1 0 0 0 0 4 0 0 0 0 1 1 0 1 0 0 0 9 0 1 9
Urease or nitrification inhibitors 0 0 0 0 0 0 0 0 0 0 0 0 0 1 0 0 0 0 0 0 0 0 0 1 0 0 0 0 0 0 2 2
Low-emission synthetic fertiliser
application0 1 0 1 0 1 0 0 0 1 0 0 0 1 0 1 0 0 0 0 0 0 0 1 2 0 0 0 4 0 4 8
Low-emission organic fertiliser
application1 0 0 1 0 1 2 0 0 0 0 0 1 1 0 1 2 1 0 0 0 0 0 0 2 0 0 1 7 1 3 10
Precision fertilisation 0 1 0 2 0 0 0 1 0 1 1 0 0 0 0 1 1 0 0 0 0 1 0 0 2 0 0 0 5 1 4 9
Catch crops 0 0 1 1 0 0 3 0 0 1 0 0 0 0 0 3 0 0 0 0 1 0 0 0 1 0 1 1 7 0 2 8
Biological N fixation 0 0 1 1 0 0 0 0 0 5 0 0 0 1 0 4 0 1 0 0 0 0 0 0 0 1 0 0 4 0 4 7
Increased recycling of nutrients 0 1 0 0 0 0 0 0 0 0 0 1 1 0 0 0 1 0 0 1 0 1 1 0 1 0 0 0 5 0 3 8
Other / not specified 0 0 0 2 0 1 1 1 1 0 1 0 0 0 1 2 1 0 0 0 0 0 3 0 0 2 1 1 9 0 5 12
Organic farming 1 0 0 0 0 1 1 1 0 5 1 1 0 0 0 2 1 1 0 0 1 1 0 1 0 1 0 2 11 1 2 14
Number of PaMs (any status) Number of MS
Eionet Report - ETC/CME 6/2021 28
Low-emission manure spreading equipment such as a slurry injector is capital intensive, so tend to be supported through capital grants or loans – for example throughout the Targeted Agricultural Modernisation Scheme (TAMS) scheme in Ireland, which offers grant aid of 40% towards the cost of certain investments. Of the questionnaire responses related to this topic:
• Respondents from six MS indicated that agri-environment-climate conditional payments under rural development programmes (RDPs) of the CAP have been successful in promoting measures to reduce N losses.
• In Slovenia, a requirement for N fertilisation based on soil and plant tests had good uptake by farmers.
• One Polish respondent commented on the successful uptake or urease inhibitors in their region.
• Two respondents commented that though successful in the past, measures have not led to reduced nitrogen application in recent years.
• In Slovenia, low-emission manure slurry spreading equipment had low uptake on grassland, due to agronomically unattractive restrictions.
2.3.2 Promoting use of organic fertilisers and biological nitrogen fixation
Measures to promote the use of organic12 nitrogen fertilisers, increased recycling of nutrients and biological N-fixation from legumes to replace synthetic nitrogen fertilisers are reported by 17 MS (Table 2.4). Synthetic nitrogen fertiliser is the largest input of nitrogen into the agricultural system in the EU, making up around 65% in 2004 (Westhoek et al., 2015). Lower synthetic fertiliser use results in lower overall flows of nitrogen through agricultural systems, and lower N2O emissions. Moreover, NH3 synthesis and nitric acid production in fertiliser manufacture is associated with N2O and CO2 emissions, so reducing demand for fertilisers also cuts GHG emissions from industry. Measures to reduce losses of nitrogen from manure management, and in turn losses during application (low-loss spreading equipment, urease inhibitors) increase the amount of nitrogen available in livestock manure. In addition, measures to increase recycling of food and green waste (e.g. grass clippings), organic industrial waste and sewage sludge through composting or anaerobic digestion also provide a source of organic nutrients. Use of organic fertilisers is incentivised by organic farming methods (see section 2.3.3), but are also applicable to conventional farms through measures such as special provisions for accounting for organic fertilisers in nutrient management plans (e.g. in Denmark). Questionnaire respondents from two countries commented that use of organic fertilisers had been successfully increased, and in Poland one respondent commented on how sowing legumes in rotations has resulted in large reduction in synthetic fertilizer use. The key barriers to replacing more synthetic fertiliser with organic fertilisers and biological N fixation cited in the questionnaire (and in the literature) include:
• Farm specialisation away from mixed crop-livestock farming, and large-scale spatial segregation of arable and livestock farming create logistical challenges for manure transport (Martin et al,
(12) In this context, the term “organic” is used to mean nitrogen compounds of biological origin (such as
manure, sewage sludge and compost), as opposed to synthetic nitrogen compounds created through the Haber-Bosch process. Synthetic fertilisers are often called “mineral” fertilisers, though it is also possible to extract mineral nitrogen salts from organic sources such as manure or digestate.
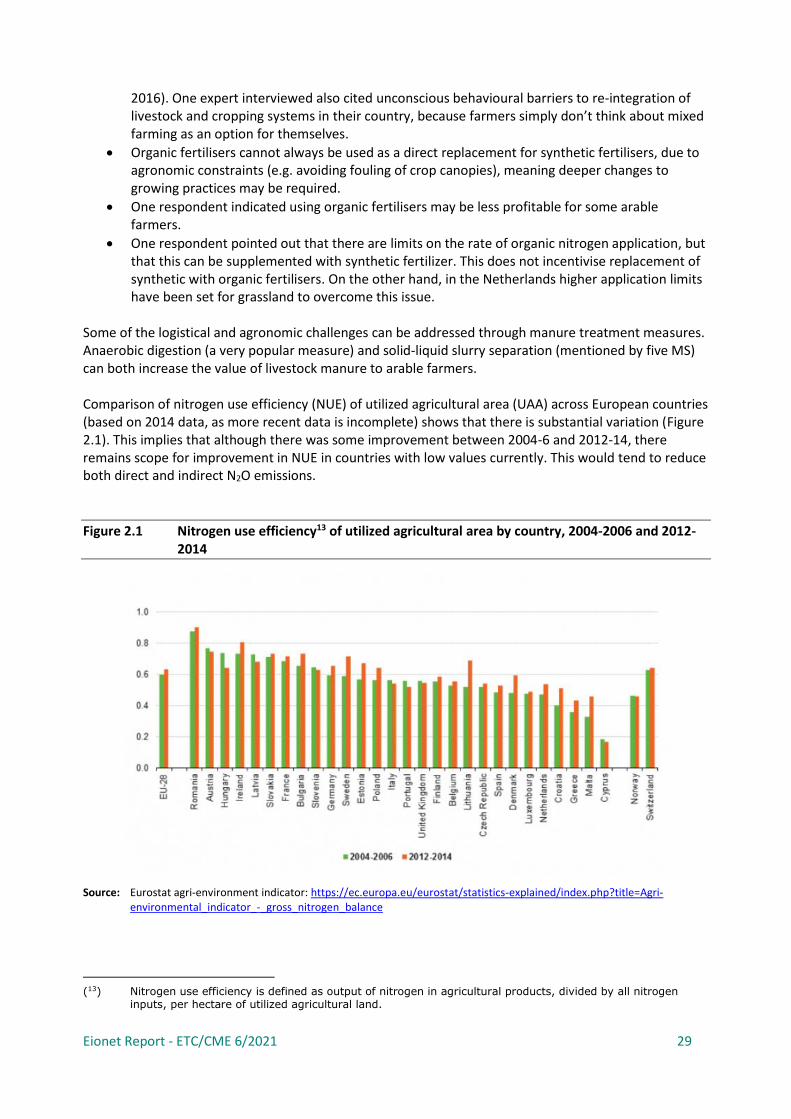
Eionet Report - ETC/CME 6/2021 29
2016). One expert interviewed also cited unconscious behavioural barriers to re-integration of livestock and cropping systems in their country, because farmers simply don’t think about mixed farming as an option for themselves.
• Organic fertilisers cannot always be used as a direct replacement for synthetic fertilisers, due to agronomic constraints (e.g. avoiding fouling of crop canopies), meaning deeper changes to growing practices may be required.
• One respondent indicated using organic fertilisers may be less profitable for some arable farmers.
• One respondent pointed out that there are limits on the rate of organic nitrogen application, but that this can be supplemented with synthetic fertilizer. This does not incentivise replacement of synthetic with organic fertilisers. On the other hand, in the Netherlands higher application limits have been set for grassland to overcome this issue.
Some of the logistical and agronomic challenges can be addressed through manure treatment measures. Anaerobic digestion (a very popular measure) and solid-liquid slurry separation (mentioned by five MS) can both increase the value of livestock manure to arable farmers. Comparison of nitrogen use efficiency (NUE) of utilized agricultural area (UAA) across European countries (based on 2014 data, as more recent data is incomplete) shows that there is substantial variation (Figure 2.1). This implies that although there was some improvement between 2004-6 and 2012-14, there remains scope for improvement in NUE in countries with low values currently. This would tend to reduce both direct and indirect N2O emissions.
Figure 2.1 Nitrogen use efficiency13 of utilized agricultural area by country, 2004-2006 and 2012-2014
Source: Eurostat agri-environment indicator: https://ec.europa.eu/eurostat/statistics-explained/index.php?title=Agri-environmental_indicator_-_gross_nitrogen_balance
(13) Nitrogen use efficiency is defined as output of nitrogen in agricultural products, divided by all nitrogen
inputs, per hectare of utilized agricultural land.

Eionet Report - ETC/CME 6/2021 30
2.3.3 Organic Farming
Whilst the measures relating to organic fertilisers discussed in section 2.3.2 can be applied to all farms, 14 MS explicitly reported policies to increase organic farming14 (as a holistic system) amongst their GHG mitigation measures. Organic farming in the EU has grown from 5.9% of UAA in 2012 to 8.5% of UAA in 2019 (ECA, 2021). The main distinction between organic and conventional farming of relevance to GHG emissions, is that synthetic nitrogen fertilisers are not permitted under rules for organic agriculture certification. Smith et al. (2019) conducted a recent modelling study for the UK, and found that a shift to 100% of agriculture being organic would reduce direct GHG emissions per unit of production for many crop and livestock products, largely due to replacement of synthetic N fertilizer with biological N fixation and lower reducing N2O emissions from soils, and CO2 and N2O emissions from production (as described in section 2.3.2). Other factors such as increased soil carbon sequestration, reduced fossil energy use in housing, and reduced manure methane emissions can also play a part, depending on the specifics of the systems. However, yields per hectare of organic farms tend to be lower than from conventional farms (Ponisio et al., 2015). On the one hand this contributes even further to lower direct GHG emissions from a given farm, but on the other hand risks emissions leakage from increased food imports (from systems that could have higher GHG emissions intensity), as CO2 emissions from land use change caused by agricultural expansion. Smith et al. (2019) calculated that - under current demand for food and animal feed - a 100% organic system in the UK would actually increase emissions globally. Therefore, for expansion of organic farming in Europe to produce a net reduction in GHG emissions globally, demand reduction through tackling food waste and dietary shift are pre-requisites to avoid emissions leakage (Poux and Aubert, 2018). This is discussed further in section 2.6. Of the questionnaire respondents who commented on the topic, most were generally positive about the future of organic farming, with five respondents indicating that increasing organic and agro-ecological farming should play a key role in GHG mitigation over the next 30 years. This aligns with the aims of the Farm to Fork strategy, which targets 25% of agricultural land to be organically farmed by 2030. Other comments on progress and barriers to further uptake of organic farming included:
• In France, although area of organic farmland has increased, it is too slow to hit the targets set by the EU strategies and domestic targets.
• Promotion of organic farming is sometimes through indirect, market-based measures, rather than direct subsidies.
2.3.4 Gaps
In Ricardo-AEA (2016) and ECA (2021), nitrification inhibitors are identified as effective mitigation measures. They work by slowing the conversion of ammonium ions to nitrate to a rate matching plant uptake. However, only 2 MS (Ireland and Slovakia) report a PaM specifically mentioning their use, and both of these are currently “planned”, rather than implemented (Table 2.4). This could be related to their neutral-to-potentially negative effect on crop growth (Ricardo-AEA, 2016), meaning that there is no economic benefit for farmers to use them. However, given their large potential to mitigate emissions, it seems that countries should consider financially supporting their use under RDP measures.
(14) Organic farming is a type of agriculture which minimizes or eliminates synthetic inputs such as synthetic
nitrogen fertilisers and pesticides. In other languages it is referred to as “ecological” or “biological” agriculture.
Eionet Report - ETC/CME 6/2021 31
Measures to encourage use of urease inhibitors (to reduce volatilization of NH3) were only reported explicitly by Ireland. However, this does not mean that they are not used by farmers, as this is a relatively cost-effective measure (Teagasc, 2019). Indeed, one Polish questionnaire respondent commented on the success of introducing urease inhibitors.
2.4 Carbon storage / sequestration measures
Table 2.5 overleaf summarises PaMs reported by MS in 2021 related to carbon storage and sequestration in agricultural soils and biomass in the farmed landscape.
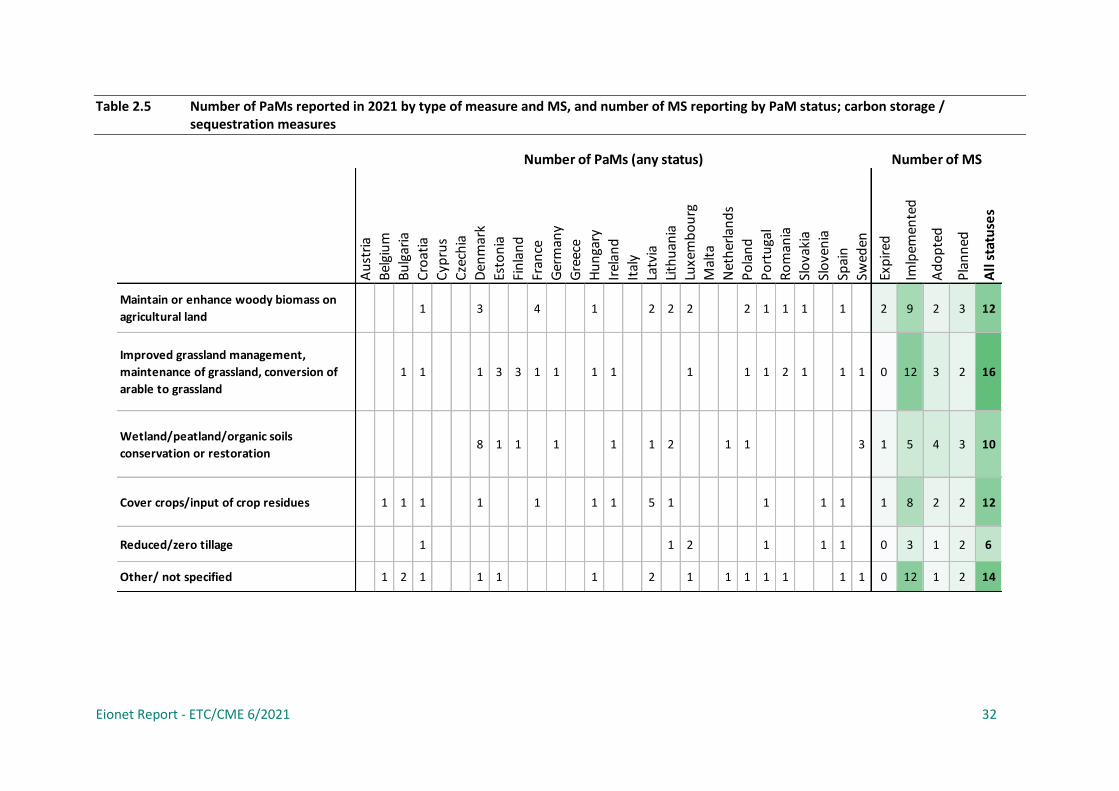
Eionet Report - ETC/CME 6/2021 32
Table 2.5 Number of PaMs reported in 2021 by type of measure and MS, and number of MS reporting by PaM status; carbon storage / sequestration measures
Au
stri
a
Bel
giu
m
Bu
lgar
ia
Cro
atia
Cyp
rus
Cze
chia
Den
mar
k
Esto
nia
Fin
lan
d
Fran
ce
Ger
man
y
Gre
ece
Hu
nga
ry
Irel
and
Ital
y
Latv
ia
Lith
uan
ia
Luxe
mb
ou
rg
Mal
ta
Net
her
lan
ds
Po
lan
d
Po
rtu
gal
Ro
man
ia
Slo
vaki
a
Slo
ven
ia
Spai
n
Swed
en
Exp
ired
Imlp
emen
ted
Ad
op
ted
Pla
nn
ed
All
sta
tuse
s
Maintain or enhance woody biomass on
agricultural land0 0 0 1 0 0 3 0 0 4 0 0 1 0 0 2 2 2 0 0 2 1 1 1 0 1 0 2 9 2 3 12
Improved grassland management,
maintenance of grassland, conversion of
arable to grassland
0 0 1 1 0 0 1 3 3 1 1 0 1 1 0 0 0 1 0 0 1 1 2 1 0 1 1 0 12 3 2 16
Wetland/peatland/organic soils
conservation or restoration0 0 0 0 0 0 8 1 1 0 1 0 0 1 0 1 2 0 0 1 1 0 0 0 0 0 3 1 5 4 3 10
Cover crops/input of crop residues 0 1 1 1 0 0 1 0 0 1 0 0 1 1 0 5 1 0 0 0 0 1 0 0 1 1 0 1 8 2 2 12
Reduced/zero tillage 0 0 0 1 0 0 0 0 0 0 0 0 0 0 0 0 1 2 0 0 0 1 0 0 1 1 0 0 3 1 2 6
Other/ not specified 0 1 2 1 0 0 1 1 0 0 0 0 1 0 0 2 0 1 0 1 1 1 1 0 0 1 1 0 12 1 2 14
Number of PaMs (any status) Number of MS
Eionet Report - ETC/CME 6/2021 33
Most MS (21) reported PaMs addressing a number of aspects of carbon sequestration in soil or biomass on agricultural land (Table 2.5). 12 MS reported PaMs concerning increasing or maintaining woody biomass on agricultural land. Specific measures included:
• Planting new agroforestry
• Conserving traditional permanent crops (e.g. orchards, olive groves)
• Woodland planting
• Good management of existing woody vegetation on agricultural land Questionnaire responses indicated that key barriers to increasing woody biomass on agricultural land include:
• Conflicting incentives through the CAP single area payment system, which causes farmers to fear that land will lose “agricultural” status (and therefore loss of income) if trees are planted.
• One Polish respondent commented that increasing hedgerows and field trees is contrary to the drive for field consolidation for increased mechanisation and efficiency in some areas. In the Netherlands, the complexity of rules regarding agroforestry subsidies was cited as a key barrier.
Nevertheless, respondents indicated that subsidies had been successful for hedge planting (France), orchard creation (Turkey) and increasing forest cover (Poland). 16 MS reported PaMs relating to grassland management to increase soil carbon stocks. Often this related to the CAP pillar 1 greening measure to preserve permanent pasture, which is a key feature of the CAP from 2015. It can therefore be assumed that all MS implemented this measure in the from 2015. In Denmark, Estonia, Slovakia and Sweden, biodiversity conservation is also identified as a driver of grassland conservation. Conservation or restoration of organic soils15 is mentioned in reported PaMs from 10 MS. These soils have a high potential to release CO2 from soil carbon loss when drained and cultivated. Only Denmark and Sweden specifically refer to support to revert agricultural land to wetland habitats. In the case of Denmark, this is partly driven by a need to reduce nitrate leaching into water bodies, rather than only to increase carbon sequestration. These measures are generally incentivised through the CAP, either the greening measures under Pillar 1, or through specific rural development program agri-environment-climate measures. Relevant questionnaire responses highlighted that farming with higher groundwater levels (to prevent loss of soil carbon) requires changes to farming systems, and hence is resisted by farmers. In addition, as with tree planting, there are fears that cessation of drainage will affect agricultural land status. Cover crops and reduced/zero tillage, which both aim to increase soil carbon in arable land and reduce soil erosion, were mentioned in PaMs reported by 12 and six MS respectively. One questionnaire respondent indicated that uptake of reduced tillage is inhibited by high investment costs. 14 MS reported broader aims to increase carbon sequestration or reduce soil loss and degradation without specifying individual measures.
(15) In this context, “organic soils” refers to soils with a high organic matter content (such as peat), sometimes
referred to as “histosols”.
Eionet Report - ETC/CME 6/2021 34
Looking to the future, carbon sequestration in general was identified by questionnaire respondents as one of the key priorities for agricultural GHG mitigation over the next 30 years.
2.4.1 Gaps
Only two MS report PaMs mentioning conversion of arable land to permanent grassland as a possible measure, despite the relatively high mitigation potential reported by Ricardo-AEA (2016) for sequestering carbon in soil organic matter. This may be due to this measure having significant business planning implications for farmers, as it introduces an opportunity cost to own land which cannot be used flexibly. In addition, if the arable production is shifted elsewhere (indirect land use change), emissions may be displaced rather than reduced globally.
2.5 Energy mitigation measures
Table 2.6 overleaf summarises PaMs reported by MS in 2021 related to energy efficiency, renewable energy generation production of biomass for energy and carbon auditing. Improved on-farm energy efficiency was the most commonly targeted energy mitigation measure, reported by 11 MS. Production of biomass feedstocks, and production of renewable electricity or heat16 were further popular categories of measures incentivised under PaMs relating to energy, both reported by seven MS. Production of energy crops does not reduce emissions accounted under the agriculture sector as defined by IPCC, but instead displaces fossil fuel use to reduce CO2 emissions from the energy sector. However, there are important sustainability considerations associated with biomass production, discussed elsewhere in section 1 and 2.2.3. Barriers and successes for implementation of agricultural energy mitigation measures were only mentioned in connection with indoor horticulture in the Netherlands. Here, counterproductive subsidies for natural gas in indoor horticulture have delayed a switch to low carbon energy sources for heating, but education on energy efficiency, and subsidies for use of geothermal energy have proven effective.
2.5.1 Gaps
Carbon auditing tools were only explicitly mentioned in PaMs reported by two MS (Estonia and France). Ricardo-AEA (2016) estimated that this measure has the second highest mitigation potential (after nitrification inhibitors), so it is perhaps surprising that more countries did not highlight this. However, it could be that this measure is included in broader packages of measures under the RDPs for many countries, but that the high-level descriptions reported in the PaMs database do not go into sufficient detail. On the other hand, five MS (Estonia, Lithuania, Luxembourg, Slovenia and Sweden) report PaMs supporting advisory services for farmers, which may fulfil a similar role in auditing and informing farmers about their own farm’s carbon footprint.
((6) Excluding biogas production, which is covered in section 2.2.3.

Eionet Report - ETC/CME 6/2021 35
Table 2.6 Number of PaMs reported in 2021 by type of measure and MS, and number of MS reporting by PaM status; energy measures
Note: RES = Renewable energy sources. * = Excluding PaMs relating solely to anaerobic digestion, as these are accounted for under manure management measures (section 2.2.32.2)
Au
stri
a
Bel
giu
m
Bu
lgar
ia
Cro
atia
Cyp
rus
Cze
chia
Den
mar
k
Esto
nia
Fin
lan
d
Fran
ce
Ger
man
y
Gre
ece
Hu
nga
ry
Irel
and
Ital
y
Latv
ia
Lith
uan
ia
Luxe
mb
ou
rg
Mal
ta
Net
her
lan
ds
Po
lan
d
Po
rtu
gal
Ro
man
ia
Slo
vaki
a
Slo
ven
ia
Spai
n
Swed
en
Exp
ired
Imlp
emen
ted
Ad
op
ted
Pla
nn
ed
All
sta
tuse
s
Carbon auditing tools 0 0 0 0 0 0 0 1 0 1 0 0 0 0 0 0 0 0 0 0 0 0 0 0 0 0 0 0 1 0 1 2
Improved on-farm energy efficiency 0 1 0 1 0 0 0 0 1 4 0 0 1 0 0 0 4 1 0 5 0 2 0 1 0 0 3 1 7 1 4 11
Production of bioenergy crops /
biomass/ biofuels*0 0 0 1 0 1 0 2 0 1 0 0 0 0 0 0 0 0 0 0 0 2 1 0 0 0 1 1 5 0 1 7
Production of electricity/heat from
RES*0 1 0 0 0 0 0 2 0 0 0 2 0 0 0 1 0 0 0 1 0 2 0 1 0 0 0 0 4 0 4 7
Other/ not specified 0 0 0 0 0 0 0 1 0 1 0 0 0 0 1 2 1 0 1 0 0 0 0 0 0 0 0 1 5 0 1 6
Number of PaMs (any status) Number of MS

Eionet Report - ETC/CME 6/2021 36
2.6 Wider food system measures
As set out in Section 0, there is increasing awareness that deep cuts in emissions from agriculture in the EU are only possible through a reduction in demand for products with a high GHG intensity, and that this is possible through a combination of human dietary shift, alternative livestock feeds, and reduction in food waste. Seven MS reported PaMs which targeted demand for food, targeting mostly human dietary changes and reduction of food waste, and most of these are already implemented (Table 2.7, overleaf). Given the importance and potential impact attributed to demand-side measures this may seem a low number, but this may reflect differences in reporting across MS given that these are inherently cross-sectoral PaMs. Alternatively, it could relate to the significant barriers for implementing such policies, discussed below.
2.6.1 Dietary change
Animal products have on average much higher GHG emissions footprints (by typically 10-50 times) than plant products per kg of protein or per calorie (Searchinger et al., 2018), due to the inevitable loss of energy and materials which occurs when animals convert plant food into animal products. This means that a much larger area of land and fertilizer inputs are required to produce the same amount of protein or calories from an animal than from plants. In fact, 68% of all agricultural land in the EU is used for animal production (European Commission, 2020). Not all livestock are equally inefficient however, with feed conversion efficiency being much higher for eggs, poultry and pork production than for beef and lamb, for example. In addition, enteric fermentation further adds to the high GHG intensity of ruminant livestock. The EAT-Lancet Commission report estimates that up to 80% of greenhouse gas emissions associated with food production can be reduced by shifting to a plant-based diet (Willett et al., 2019), and especially away from red (ruminant) meat. However, the mitigation potential is directly proportional to the scale of dietary changes achieved, and many studies addressing the impacts of dietary change consider hypothetical end-point scenarios, rather than realistic projections of what policies are likely to achieve. The fairly extreme changes required to reduce emissions by 80% (a roughly 80% reduction in red meat consumption) may be rather optimistic. Other scenarios (e.g. Westhoek et al., 2015; CCC, 2020) assume smaller changes. Per capita consumption of animal products has shifted in emphasis in the EU over the last decades (Figure 2.2). Total animal protein consumption remained relatively flat between 2000 and 2013, but consumption of beef and fresh milk reduced, as consumption of poultry and cheese increased over the same period.

Eionet Report - ETC/CME 6/2021 37
Table 2.7 Number of PaMs reported in 2021 by type of measure and MS, and number of MS reporting by PaM status; wider food system measures
Au
stri
a
Bel
giu
m
Bu
lgar
ia
Cro
atia
Cyp
rus
Cze
chia
Den
mar
k
Esto
nia
Fin
lan
d
Fran
ce
Ger
man
y
Gre
ece
Hu
nga
ry
Irel
and
Ital
y
Latv
ia
Lith
uan
ia
Luxe
mb
ou
rg
Mal
ta
Net
her
lan
ds
Po
lan
d
Po
rtu
gal
Ro
man
ia
Slo
vaki
a
Slo
ven
ia
Spai
n
Swed
en
Exp
ired
Imlp
emen
ted
Ad
op
ted
Pla
nn
ed
All
sta
tuse
s
Human diet change 0 1 0 1 0 0 0 0 1 5 0 0 0 0 0 0 1 0 0 1 0 0 0 0 0 0 0 0 5 0 1 6
Alternative animal feeds 0 1 0 0 0 0 0 0 0 2 0 0 0 0 0 0 0 0 0 0 0 0 0 0 0 0 0 0 2 0 0 2
Food waste reduction 0 1 0 1 0 0 0 0 1 1 1 0 0 0 0 0 1 0 0 3 0 0 0 0 0 0 0 0 7 0 1 7
Number of PaMs (any status) Number of MS

Eionet Report - ETC/CME 6/2021 38
Figure 2.2 Evolution of animal protein consumption per capita in the EU, 2000 to 2013
Source: EEA indicator Food consumption – animal based protein17
With a rising population, 82% of greenhouse gas emissions from European food consumption still stems from consumption of meat and dairy products. Therefore, PaMs that are able to directly target the demand-side of livestock production, by changing dietary patterns amongst the general public, are extremely useful tools in reducing greenhouse gas emissions. If less land is required for food production, dietary shift is also a facilitative measure to provide space for other changes which reduce GHG emissions. In a “land sparing” scenario where production remains intensive, spared land can provide GHG removals through regeneration of forest, or production of bioenergy crops. In an “agro-ecological” scenario, the reduced pressure on land can allow for more extensive farming systems with minimal synthetic nitrogen inputs (Poux & Aubert, 2018). In the latter scenario ruminants are still required as an important tool in effective nutrient cycling, even if this does limit the GHG emissions savings. Six MS reported planned PaMs related to dietary shift. These include additional research on eating habits (Croatia) and awareness raising (Belgium, Lithuania), and low-carbon food labelling (France). Various questionnaire respondents highlighted the importance of consumer education, and that through the use of effective advice campaigns, and promotional marketing, the public will be more likely to favour plant-based protein sources. Two respondents from France and Poland indicated that there are existing schemes in schools and other public sector buildings such as universities, which encourage daily vegetarian and vegan meals.
(17) https://www.eea.europa.eu/airs/2018/resource-efficiency-and-low-carbon-economy/food-consumption-
animal-based
Eionet Report - ETC/CME 6/2021 39
Questionnaire respondents from three MS commented, however, that there is low political support for dietary change in their country. Furthermore, in Spain dietary change is resisted by livestock farmers, who view it as affecting their livelihoods. Indeed, one respondent current policies encourage consumption of meat and dairy products through reduced VAT rates, which has led to an increase in consumption. Another barrier is the lack of clear information on environmental footprint of different foods, to underpin fiscal or labelling measures. This is a considerable challenge, both to accurately measure and disseminate information which may vary continually over time, as well as capturing the inherently multidimensional concept of environmental sustainability in simple indices. One expert interviewed commented that fiscal measures such as carbon taxes – though unpopular – would likely be effective in reducing consumption of certain goods. One response in the questionnaire states that the Netherlands is considering possible fiscal measures to reflect the sustainability of a product (and production methods) in price. However, there is a risk of disadvantaging domestic producers and subsequent emissions leakage through increased imports. Therefore, additional measures such as a “carbon border adjustment mechanism” (a tariff on imported goods which are not subject to a carbon tax) would be required to prevent leakage.
2.6.2 Reduction of food waste
Reduction in food waste is another factor affecting demand for agricultural products; where waste is higher, production and use of inputs is correspondingly higher. Food waste entering landfill also contributes methane emissions when it breaks down. Food waste occurs at all points through the food system from farmers, processors, distribution, storage, retailers, food service and consumers. In Europe, a 2013 analysis suggested that 34% of all food production is wasted, and the food production (33%) and consumption (42%) stages are the key drivers of waste (Grizzetti et al., 2013). Where food waste cannot be prevented, efficient recycling of nutrients in food waste through composting or anaerobic digestion is the next best option. The EU Platform on Food Losses and Food Waste18 provides comprehensive recommendations for measures to reduce waste at all stages of the food supply chain. Seven MS reported planned measures to reduce food waste. These focus on consumer behaviour (Belgium), legislation to promote short supply chains (Belgium), removal of “waste” status of certain by-products (Croatia), investing in home composting (Croatia), and broader strategies to increase collaboration across the food supply chain (Netherlands). France indicates plans for an “anti-waste” food label certification scheme, with associated technical standards. Questionnaire responses indicated that challenges include overcoming industrial norms and consumer preferences to accept imperfect produce, and logistical constraints such as lack of storage infrastructure in some parts of Europe (Poland). Respondents indicated that better monitoring of food waste, education for producers, process and consumers, and support for farmers to implement low-waste practices are all planned.
(18) https://ec.europa.eu/food/safety/food-waste/eu-actions-against-food-waste/eu-platform-food-losses-and-
food-waste_en
Eionet Report - ETC/CME 6/2021 40
2.6.3 Reducing overseas GHG emissions from imported livestock feed
Another aspect of EU agriculture’s links to the wider food system includes the import of animal feed and food from overseas. Production of soy as a high-protein animal feed in South America is associated with severe GHG and biodiversity impacts (WWF, 2020). One approach to addressing this issue is to increase domestic production of high-protein crops for feed and food. France reported one PaM called the “protein plan”, aimed at increasing domestic production of grain legumes to reduce reliance on imports (and also to increase biological N fixation). From its questionnaire response, the Netherlands also mentioned a National Protein Strategy, though this was not reported in the PaMs database. However, as highlighted by the European Court of Auditors (2021), increasing the area of land growing grain legumes could displace production of other crops overseas. Another approach is to shift towards alternative sources of protein for livestock feed, for example microbial protein, insect protein or waste-derived products. Belgium reported on PaM in its NECP related to a “protein transition” for livestock feed, but no other MS explicitly mentioned this in reported PaMs. Three questionnaire respondents highlighted that research into alternative livestock feeds is ongoing, whilst two other respondents pointed out that making use of waste or by- products such as oil cake, brewers’ and distillers’ grains maximises sustainability, and that this already occurs to some extent. It is possible that making better use of food waste as animal feed is an aspect covered by some of the PaMs reported by six MS relating to food waste reduction, although this was not explicitly stated.

Eionet Report - ETC/CME 6/2021 41
3 Cross-cutting barriers and good practice
This section presents themes emerging from questionnaires and interviews which can be seen as cross-cutting barriers or aspects of good practice in agricultural policy implementation. Many of these are not specific to GHG mitigation policy, but also policies with other environmental aims.
3.1 Barriers
A variety of cross-cutting barriers were raised by questionnaire respondents and interviewees. These are discussed below:
• Farmer knowledge and monitoring of impact o Some respondents highlighted a lack of knowledge on emissions sources and mitigation
measures by farmers as an issue. This makes it more difficult to engage with them to tackle these issues.
o Some respondents commented that more information is needed about the country-specific mitigation potential and cost of measures, so that governments, advisory services and farmers can act in good faith to make the right decisions. The lack of an obligation to assess the impact of schemes in the past may contribute to the deficiency of evidence.
o Statistics for the EU-27 + UK (Figure 3.1) show considerable differences in the level of formal training received by farm managers, with the lowest levels in Southern and South-Eastern Europe (Figure 3.1). This suggests substantial potential to increase the uptake of measures through improved training.
Figure 3.1 Map of the percentage of farm managers with full training, 2016
Source: CAP Context indicators 2014-2020
Eionet Report - ETC/CME 6/2021 42
o Regarding monitoring impact of measures, one inventory compiler responding to the
questionnaire highlighted that current emissions estimation methodologies do not allow GHG mitigation impacts from livestock feeding interventions to be accurately captured in the inventory. This can be a combination of lack of country-specific data on technology uptake or mitigation impacts, as well as a lack of resources within inventory compilation teams.
o One reported PaM from Estonia specifically mentions research to develop country-specific emission factors, to enable the impact of GHG mitigation measures to be reflected in the inventory. The PaM description mentions that this is a prerequisite for development and implementation of some measures, as otherwise they cannot be shown to contribute towards Estonia’s climate objectives. Inventory development is also a key part of France’s National Low Carbon Strategy.
• Human resources o The lack of retention of younger farmers in the sector was highlighted as an issue. This is
important to allow new practices to spread, and introduce innovation and up-to-date knowledge from agricultural colleges, for example.
o Linked to this, IT literacy and access to internet was also identified as a key barrier in some parts of Europe (e.g. Greece) and/or facilitating factor for education, for online administration, and also to use IT decision support tools such as nutrient management planners or software required for precision farming.
• Farm structure o In some parts of Europe (e.g. Romania), agricultural holdings are very fragmented, with
many small farms each with little space and few resources. This makes it more difficult for individual holdings to make capital investments in infrastructure (such as improved manure storage or low-emission spreading equipment). It could also hinder efficient knowledge dissemination.
• Conflicting policy objectives o One questionnaire respondent cited a general conflict between expectations for farmers
to increase production on the one hand, while reducing inputs on the other. o On expert interviewed commented that some younger farmers are very oriented
towards maximizing production, and this can make them less receptive to subsidies aimed at ameliorating environmental impact, if short-term productivity is compromised.
3.2 Good practice
There are a number of cross-cutting themes which can be identified from the responses to the questionnaire, interviews, and wider literature. The first element is the choice of which measures are incentivised. The cross-compliance and greening measures required for obtaining the single-farm payment under the CAP are fairly uniform across MS, but measures supported under the RDP are more flexible. The recent report by the European Court of Auditors (ECA, 2021) highlights that measures frequently funded under the CAP have limited efficacy for GHG mitigation, whereas more effective measures are less frequently supported. This suggests that there is scope for more effective allocation of funds. Another element to this is the recognition that farms are diverse, and there is no one-size-fits-all solution (UNECE, 2021). For example, an organic farm is not permitted to make use of some of the mitigation measures available on conventional farms (for example, use of chemical nitrification inhibitors or

Eionet Report - ETC/CME 6/2021 43
acidification of slurry). As such, providing a diverse “menu” of options which can receive support allows measures to be tailored to a farm. The second element is the degree of support provided. Taking this factor into account when assessing reported PaMs was outside of the scope of the work, but several questionnaire respondents and on interviewee noted that the size of the financial incentive is important to ensure uptake of measures in future. This is particularly important for farms where profitability is the main driver of management practices. However, one expert interviewed commented that it is important to recognize that other factors may be more important for some farmers, such as cultural traditions or their own values on what is “right”. Continuity of (financial) support was identified by some questionnaire respondents as important to provide confidence, in particular for measures with a long payback period (such as anerobic digestion plants, or agroforestry). A third element is – independent of the type of measures and size of support provided – the way that a scheme is implemented. The Horizon 2020 EFFECT project has studied factors affecting the success of agri-environment schemes (not specifically for GHG reduction). One expert interviewed summarized some relevant findings of the project, which suggest that the procedural aspects of policy implementation can be decisive. According to the expert interviewed, given the same kind and size of incentive, schemes are more successful when:
• Farm advisory services are closely involved. These: o Advise policy makers on programme design to make sure it has a high chance of
acceptance. o Help farmers with decision-making, paperwork, and knowledge dissemination. o Help set up research/demonstration projects on farms and build partnerships with
research institutions.
• Implementation is hierarchical, as in the Netherlands. Provinces have freedom to decide how to implement programmes, and farmer cooperatives are influential in this process at the provincial level. This helps to ensure schemes are appropriate for local circumstances.
• There is trust between farmers and the government: farm advisory services and hierarchical governance both help this. Peer-to-peer knowledge sharing and demonstrations are also a key success factor, as seeing a scheme work for a neighbour is very persuasive.
• Training is provided to farmers, both to help farmers to understand the rationale for schemes, and to help them implement them well.
• Measures are flexible, so that implementation is not too tightly prescribed in a top-down way, giving farmers freedom to integrate changes to practices into their operations in the way that best works for them.
Responses to the questionnaire on this subject largely backed up these themes, with several respondents highlighting the importance of farmer training. One respondent wrote that measures must take into account the (various) motivations of farmers, and the revenue models they work to, underlining the importance of flexibility and involving farmers directly or indirectly in policy design. The Danish case-study below (section 4.2) demonstrates how providing a comprehensive package of support including research, training, advisory services and financial incentives successfully promoted uptake of anaerobic digestion of manure.

Eionet Report - ETC/CME 6/2021 44
A perhaps more controversial insight from another expert interview was the observation that “results-based” measures19 can deliver better outcomes than “action-based” measures (for biodiversity at least). Results-based schemes can sometimes be seen as being “unfair”, where factors beyond the farmers control affect results. According to the interviewee, experience from the Burren Programme in Ireland has shown that if results-based schemes are farmer-led and bottom-up, with an appropriate choice of performance indicator, they can be accepted. A system-wide perspective which provides packages of complementary measures is important to make uptake attractive and avoid potential pollution-swapping or emissions leakage. One example of this is measures to reduce nitrogen losses from animal manure (see Section 2.2.2). Analysis of RDP measure 10.1 (Agri-environment-climate commitments) implementation across MS (ENRD, 2021) shows that some countries (such as Ireland, Estonia, Lithuania and UK) offer packages of measures as “schemes” with differing eligibility criteria and levels of ambition, whereas others offer operations singly. However, it is not clear whether one approach has tended to result in better environmental outcomes. Linked to this, two interviewees indicated that providing support to schemes with multiple benefits for farmers and different aspects of the environment (biodiversity, water quality, air quality, as well as GHG mitigation) is probably the most efficient way to improve the environment overall (recognizing that climate change compounds other pressures to increase stress on the environment), as this makes it simpler for farmers and avoids potential trade-offs incurred by focusing on individual goals. A final insight emerging from one expert interview is the importance of messaging, when trying to encourage behavioural change within the general public. Heavy-handed messaging which puts blame onto people, creates expectations of sudden and extreme change, or emphasizes one route to cutting emissions (for example dietary change) over all others can be counter-productive. This could lead to backlash, or a feeling of helplessness, which causes people not to engage in other, easier actions to cut their personal carbon footprint.
(19) Results-based payments refer to schemes where the impact of a management practice is monitored and
farmers receive payment based on a performance indicator.
Eionet Report - ETC/CME 6/2021 45
4 Selected Country Case-studies
4.1 Selecting countries for case studies
Following the EU-wide analysis of reported PaMs, four countries were chosen to perform more in-depth country analysis, hoping to capture important lessons learnt regarding which PaMs have been / are predicted to be effective, what implementation challenges exist, and why. The following criteria shall be considered when selecting a MS:
• A large selection of PaMs are implemented or planned, following the assessment of reported PaMs.
• Ex-ante quantifications in agricultural GHG emissions are available (preferable).
• A reduction is seen in emissions or emissions intensity from the agricultural sector in the historical inventory, or a very low current value; or
• A reduction in emissions from the agricultural sector is expected in the projected inventory, across various scenarios.
On the basis of these criteria, four countries were chosen:
Table 4.1 Selected countries for case studies, and rationale
Country Rationale
Denmark Large historical reductions in overall emissions and in gross nitrogen balance, alongside good reporting of PaMs for the period with an ex-ante assessment for many. Some extra references are reported in the PaMs database too.
France There is a wide spread of addressed measures, a large quantity of reported PaMs reported, and both historical and projected emissions are reducing. Therefore, this could be a good ‘best practice’ example to investigate.
Latvia A very informative PaMs and Projections report from 2021 is available. Emissions are projected to increase with both WEM and WAM scenario even though 30 PaMs targeting the agriculture sector are reported, so may provide insights into challenges.
Spain There are historical decreases in emissions for livestock and slight increases for soils, but emissions are projected to decrease for WaM scenario. Ex-ante assessments are available for several PaMs, and a wide variety of PaMs are reported. Good references (NECP and RDP) are available in Spanish.
Selection of case-study countries was carried out after assessment of the 2019 reported PaMs for the EU-27. The selection was not revised on the basis of 2021 reported PaMs.
4.2 Denmark
4.2.1 National circumstances
Denmark has a moist temperature climate and flat topography, favourable for a variety of agricultural activities. Agricultural land covers around 61% of the land area, with around two-thirds of that used to grow crops, and one-third under permanent or rotational grass and fodder crops (Danish Ministry of
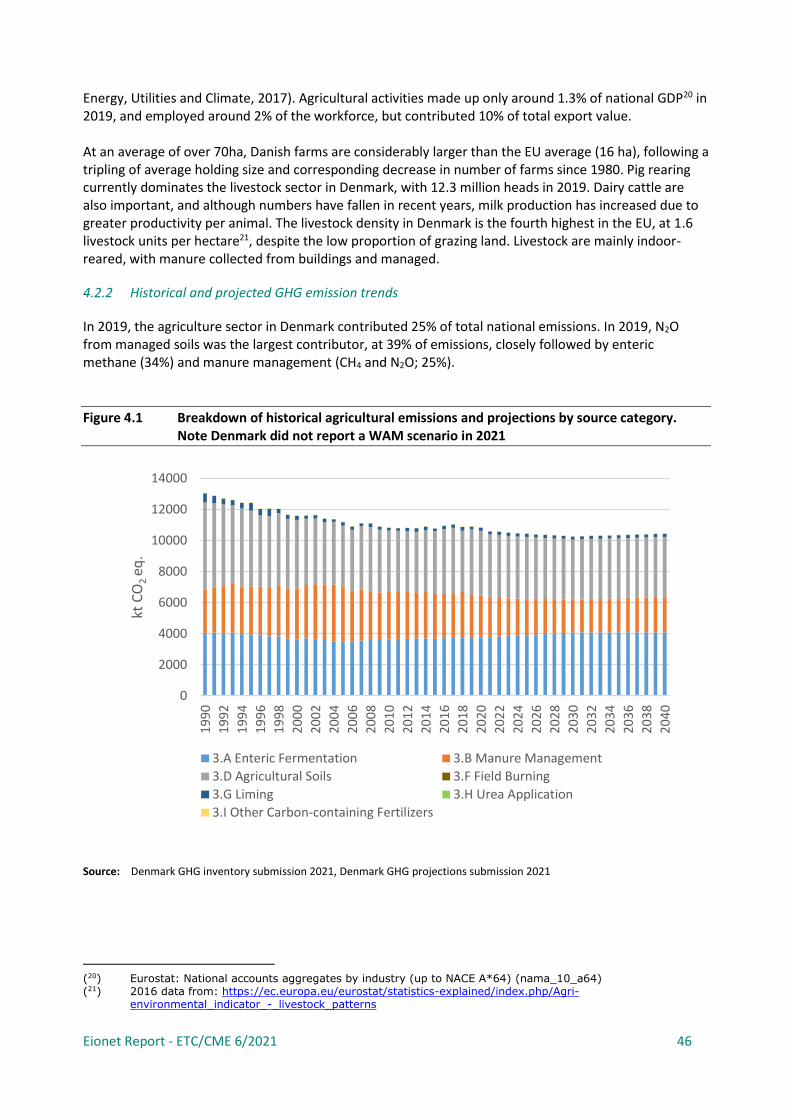
Eionet Report - ETC/CME 6/2021 46
Energy, Utilities and Climate, 2017). Agricultural activities made up only around 1.3% of national GDP20 in 2019, and employed around 2% of the workforce, but contributed 10% of total export value. At an average of over 70ha, Danish farms are considerably larger than the EU average (16 ha), following a tripling of average holding size and corresponding decrease in number of farms since 1980. Pig rearing currently dominates the livestock sector in Denmark, with 12.3 million heads in 2019. Dairy cattle are also important, and although numbers have fallen in recent years, milk production has increased due to greater productivity per animal. The livestock density in Denmark is the fourth highest in the EU, at 1.6 livestock units per hectare21, despite the low proportion of grazing land. Livestock are mainly indoor-reared, with manure collected from buildings and managed.
4.2.2 Historical and projected GHG emission trends
In 2019, the agriculture sector in Denmark contributed 25% of total national emissions. In 2019, N2O from managed soils was the largest contributor, at 39% of emissions, closely followed by enteric methane (34%) and manure management (CH4 and N2O; 25%).
Figure 4.1 Breakdown of historical agricultural emissions and projections by source category. Note Denmark did not report a WAM scenario in 2021
Source: Denmark GHG inventory submission 2021, Denmark GHG projections submission 2021
(20) Eurostat: National accounts aggregates by industry (up to NACE A*64) (nama_10_a64) (21) 2016 data from: https://ec.europa.eu/eurostat/statistics-explained/index.php/Agri-
environmental_indicator_-_livestock_patterns
0
2000
4000
6000
8000
10000
12000
14000
19
90
19
92
19
94
19
96
19
98
20
00
20
02
20
04
20
06
20
08
20
10
20
12
20
14
20
16
20
18
20
20
20
22
20
24
20
26
20
28
20
30
20
32
20
34
20
36
20
38
20
40
kt C
O2
eq
.
3.A Enteric Fermentation 3.B Manure Management
3.D Agricultural Soils 3.F Field Burning
3.G Liming 3.H Urea Application
3.I Other Carbon-containing Fertilizers

Eionet Report - ETC/CME 6/2021 47
Between 1990 and 2019, overall agricultural emissions (excl. LULUCF) fell by 17%, from around 13.1 to 10.9 Mt CO2e. This was largely due to decreases in emissions of N2O from managed soils - which reduced by around 25% - whilst other major source category emissions reduced to a lesser extent. Projected emissions for Denmark show a rather flat trend at the whole sector level between 2020 and 2040, with a 0.7% decrease over the period. Underlying this is a slight increase in enteric methane emissions, and a projected decrease in emissions from manure management and agricultural soils.
4.2.3 Agricultural policy framework and PaMs reporting
In its historical and implemented PaMs, Denmark has focused on two main agricultural policy areas which impact GHG emissions: controlling application of nitrogen to soils, and promoting better management of manure, given the high livestock densities in the country.
Table 4.2 Number of expired, implemented, adopted, and planned PaMs targeting different categories of measure, and ex-ante assessments of impact: Denmark
PaM type
Expired Implemented Adopted Planned
Carbon storage/ sequestration 2 6 3 0
Crops and soil N2O mitigation 4 4 1 0
Livestock measures 4 2 1 0
Energy measures 0 0 0 0
Wider food system measures 0 0 0 0
Total Ex-ante impact (kt CO2 eq) N/A N/A N/A N/A
Total ex-post impact (kt CO2 eq) N/A N/A N/A N/A
Note: Denmark did not report any ex-ante or ex-post quantification of impact in 2021
Management of organic soils to reduce nitrate leaching and decrease loss / increase sequestration of soil carbon is also reflected in reported PaMs. One national expert interviewed stated that the recently proposed cross-party climate agreement continues to emphasise these aspects. Although neither ex-ante nor ex-post quantification of PaMs were reported by Denmark in 2021, the proposed climate agreement aims to reduce emissions by around 7.4 Mt CO2e for the agriculture and LULUCF sectors combined (which represents around 15% of the 2019 national total inc. LULUCF).
4.2.4 Livestock and manure storage measures
The key policies implemented by Denmark affecting emissions from livestock and manure storage are described below.
Biogas incentives Anaerobic digestion reduces CH4 emissions from manure storage, as well as reducing CO2 emissions by displacing fossil fuels in the energy sector. Beginning in 1988, Denmark has provided incentives to develop biogas facilities, providing a subsidy for electricity produced from biogas CHP plants, a subsidy for biogas fed into the gas network (since the
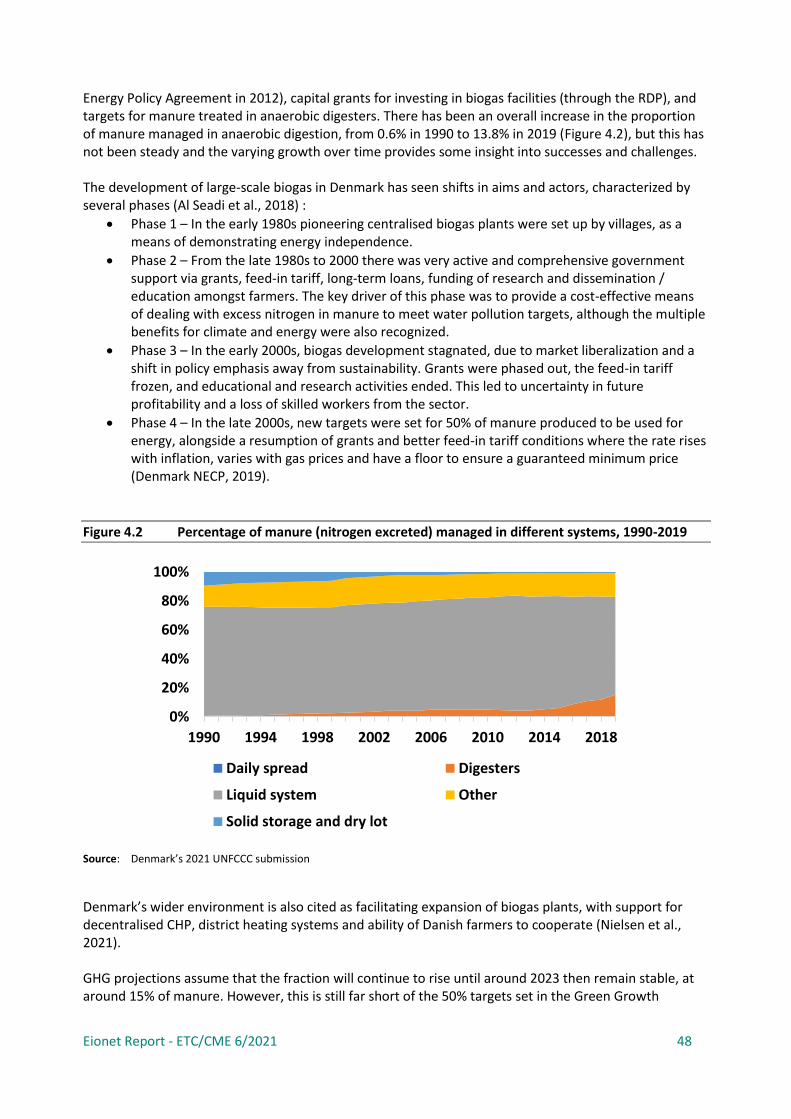
Eionet Report - ETC/CME 6/2021 48
Energy Policy Agreement in 2012), capital grants for investing in biogas facilities (through the RDP), and targets for manure treated in anaerobic digesters. There has been an overall increase in the proportion of manure managed in anaerobic digestion, from 0.6% in 1990 to 13.8% in 2019 (Figure 4.2), but this has not been steady and the varying growth over time provides some insight into successes and challenges. The development of large-scale biogas in Denmark has seen shifts in aims and actors, characterized by several phases (Al Seadi et al., 2018) :
• Phase 1 – In the early 1980s pioneering centralised biogas plants were set up by villages, as a means of demonstrating energy independence.
• Phase 2 – From the late 1980s to 2000 there was very active and comprehensive government support via grants, feed-in tariff, long-term loans, funding of research and dissemination / education amongst farmers. The key driver of this phase was to provide a cost-effective means of dealing with excess nitrogen in manure to meet water pollution targets, although the multiple benefits for climate and energy were also recognized.
• Phase 3 – In the early 2000s, biogas development stagnated, due to market liberalization and a shift in policy emphasis away from sustainability. Grants were phased out, the feed-in tariff frozen, and educational and research activities ended. This led to uncertainty in future profitability and a loss of skilled workers from the sector.
• Phase 4 – In the late 2000s, new targets were set for 50% of manure produced to be used for energy, alongside a resumption of grants and better feed-in tariff conditions where the rate rises with inflation, varies with gas prices and have a floor to ensure a guaranteed minimum price (Denmark NECP, 2019).
Figure 4.2 Percentage of manure (nitrogen excreted) managed in different systems, 1990-2019
Source: Denmark’s 2021 UNFCCC submission
Denmark’s wider environment is also cited as facilitating expansion of biogas plants, with support for decentralised CHP, district heating systems and ability of Danish farmers to cooperate (Nielsen et al., 2021). GHG projections assume that the fraction will continue to rise until around 2023 then remain stable, at around 15% of manure. However, this is still far short of the 50% targets set in the Green Growth
0%
20%
40%
60%
80%
100%
1990 1994 1998 2002 2006 2010 2014 2018
Daily spread Digesters
Liquid system Other
Solid storage and dry lot

Eionet Report - ETC/CME 6/2021 49
agreement. A key barrier for further expansion in Denmark is the availability of sustainable co-feedstock to increase the methane yield, in order to make it more financially viable. Animal slurry has a relatively low methane yield, as much of the easily degradable organic matter has already been digested by the animal. Early in the development of centralized biogas in Denmark, energy crop feedstocks were used for this purpose, but a strong government decision was made to oppose this trend, because of the dilution of GHG savings and other impacts (e.g. indirect land-use change) that it causes. To be eligible for the feed-in tariffs, the Danish Energy Agency currently sets a maximum threshold of 12% energy crop content in feedstock, ensuring the majority is manure22. An increase in use of household and service-sector food waste and other organic wastes as co-feedstock is one solution in the short-term, but will require greater coordination across sectors in how biogas plants are run; historically many are owned by farmer cooperatives with limited links with other sectors.
Enteric methane There are no PaMs reported by Denmark specifically targeting measures to reduce enteric methane emissions, but for dairy cattle (the largest source of enteric methane), feeding efficiency and animal productivity traits have improved so that milk yield per cow has increased to a much greater extent than methane emissions per cow since 1990, resulting in a lower emissions intensity of production (Figure 4.3).
Figure 4.3 Comparison of trends in milk yield and methane emission factor per cow, 1990-2019
Source: Denmark NIR 2021
4.2.5 N2O measures
The key policies implemented by Denmark impacting N2O emissions have primarily targeted reducing nitrogen pollution through leaching and volatilization of ammonia and nitrates, in order to protect
(22) https://ens.dk/en/our-responsibilities/bioenergy/biogas-denmark
Eionet Report - ETC/CME 6/2021 50
terrestrial and aquatic ecosystems from eutrophication. These are linked to compliance with the Nitrates and Water Framework directives. Key programmes have included:
• Action plan for the aquatic environment 1-3
• Action plan for sustainable agriculture
• Ammonia action plan
• Environmental Approval Act for Livestock Holdings
• Political Agreement on a Food and Agricultural Package
• Green Growth agreement
• The upcoming climate agreement
These policies have targeted manure management systems and fertilizer application practices with regulation and financial incentives in order to promote circularity of agriculture by improving utilization of livestock wastes, and reduce losses of nitrogen from all steps from animal to field. Measures such as a ban on ammonia treatment of straw, covering slurry stores and optimization of manure handling in housing has reduced emissions from manure management, by around 25% since 1990. Measures have been effectively implemented through stipulating Best Available Technique (BAT) requirements for all new or modified livestock facilities (Nielsen et al., 2021). Alongside this, considerable reductions in nitrogen excretion of fattening pigs have been achieved through precision feeding, from around 5.1 kg N per pig in 1985 to 2.9 kg N per pig in 2019 (Nielsen et al., 2021). For soils, measures such as regulating timing and method (injection) of applying slurry to fields, setting reduced fertilization norms, use of catch crops and expansion of organic farming have led to a reduction of N2O emissions from soils of 25% since 1990. Denmark took the decision to designate their whole territory as a nitrate vulnerable zone, meaning stricter rules apply than for other areas of Europe under the Nitrate Directive. The decrease in soils emissions is primarily driven through a halving in synthetic fertiliser use, from around 400 000 tonnes of nitrogen in 1990 to 200 000 in 2010-2013. This has reduced the gross nitrogen balance23 from 178 kg N/ha in 1990 to 80 kg N/ha in 2017. The strict implementation of nutrient management and strong enforcement has been a key success factor in reducing application of mineral fertilizer N. Farmers must request to use a specific quantity of mineral fertilizer based on the requirements of the soil and crops set out in nutrient management plans, with available nutrients in livestock manure being included in this calculation. Alongside this, nitrogen limits were set rather low, at a level below the economic optimum before 201524. Though successful in reducing emissions, the impacts of the tight restrictions led to opposition from farmers, and in 2015 the “Political Agreement on a Food and Agricultural Package” relaxed the nitrogen fertilizer limits. This led to an instant increase in mineral fertilizer use between 2015 and 2016 (Nielsen et al., 2021). One expert interviewed noted that compensatory measures such as creation of additional constructed wetlands and catch crops were subsidized to offset the negative impacts of the relaxation, but the uptake of these measures has been slower than the change in fertilizer use.
4.2.6 Soil carbon measures
With its extensive low-lying areas, Denmark has significant areas of wet organic soils which lose soil carbon as CO2 (and N2O from nitrogen mineralized when carbon is lost) when drained and cultivated.
(23) Gross nitrogen balance indicates the difference between nitrogen added and removed in crops and
residues, and indicates the potential surplus nitrogen applied. (24) https://assets.publishing.service.gov.uk/government/uploads/system/uploads/attachment_data/
file/770715/clean-air-strategy-2019.pdf
Eionet Report - ETC/CME 6/2021 51
Denmark has incentivized the protection of organic soils and wetlands through the action plans for the aquatic environment, the 2014-2017 subsidy for converting arable land on organic soils to nature, and the Political Agreement on a Food and Agricultural Package. One expert interviewed noted that through the CAP, there have been some conflicts between policies which have perhaps reduced the effectiveness of measures to restore organic soils. In some areas of Denmark, as cultivated organic soils have lost carbon (“wasted”), this has lowered the level of the land surface and brought the water table closer to the surface, making them unsuitable for agricultural production. However, farmers have tended to keep them in production in order to qualify for direct payments, which is based on area of utilized land. In the adopted measures reported in 2021, there are further measures to incentivise taking land on organic soils out of production altogether or only use if for extensive grazing, to restore wetland habitat. If successful, this will enhance both soil carbon sequestration and reduce nitrate leaching into watercourses.
4.2.7 Synthesis / lessons learned and cross-cutting themes
Denmark’s Biogas policies have overall been effective due to a combination of financial support, education / outreach programmes and research support, and the push factors of needing to store and treat large volumes of slurry. The cooperative nature of Denmark’s farmers has helped establish high levels of manure use in anaerobic digestion, through shared use of large biodigesters allowing economies of scale. Policies to reduce mineral fertilizer use have been effective, halving the application rates since 1990. However, the decrease has stagnated in recent years because most of the “easy” steps have been taken. Reducing fertilizer application limits further would be politically challenging due to the negative impact this would have on farm profits. Achieving greater circularity in nutrient use is a key challenge that would be required for continued progress. Measures to reduce emissions through lower production, especially of livestock products, are not specifically mentioned in Denmark’s 2021 reported PaMs. Ultimately, this would be the most direct way to reduce emissions from both livestock and agricultural soils (linked to the fertilizer requirements of fodder crops), though potential for emissions leakage would need to be considered. Measures to reduce methane from enteric fermentation from dairy cattle specifically appear to be absent from PaMs reported in 2021. Given that dairy cattle feeding is highly intensive in Denmark, use of feed additives would likely be applicable. Indeed, a national expert interviewed thought that such enteric fermentation measures are likely to form part of the proposed cross-party climate agreement.
4.3 France
4.3.1 National circumstances
France is the largest European Union country by land area (551,695 km2), with nearly 60% of the mainland surface used for agriculture. Two thirds of the country is occupied by plains and hills. Due to the size of France, there are five different main climate types, with average temperatures reaching 10 °C in winter and 28.3 °C in summer. Total utilised agricultural area has fallen by 3% from 2005 to 2017, but still remains significant at 29 million ha. Permanent crops and forage crops declined significantly between 2010 and 2015, as a ‘rural exodus’ occurred in France.

Eionet Report - ETC/CME 6/2021 52
However, France is the MS with the largest number of livestock, with 22 million units of livestock reported in 2016. It remains a major livestock farming country, with a large quantity of cattle, which contributes significantly to greenhouse gas emissions. A rising population and changing attitudes to more renewable energy systems, is leading to increased need for energy from the agriculture sector (e.g. biogas).
4.3.2 Historical and project GHG emission trends
Across the historical time series, total greenhouse gas emissions have fallen from 81.4 Mt CO2 eq in 1990 to 73.2 in 2019, a reduction of 10%. Since 1990, the steady reduction in France in emissions from the agricultural sector can be attributed to a reduction in nitrogen fertilization, a decline in the number of cattle, and a drop in energy consumption (France 7th National Communication, 2017). France did not submit a WAM scenario in their 2021 reporting, with no planned agricultural PaMs. Therefore there are no further emission reductions calculated for the agricultural sector beyond the WEM scenario.
Figure 4.4 Historical and projected trend of agriculture emissions in France
The two largest sectors in contributing to agricultural emissions in France are emissions from agricultural soils (largely N2O) and emissions from enteric fermentation (largely CH4). Emissions from both of these sectors are expected to fall, however it is interesting to see that the overall, the largest percentage decrease in emissions is in the manure management sector. Emission from enteric fermentation only reduce by 4.0% and by 2.9% in agricultural soils under a WEM scenario between 2019 and 2035, which is a fairly small reduction for the two largest agricultural emissions sources in France.
4.3.3 Agricultural policy framework
In their seventh national communication, France identified the following objectives of their agricultural PaM: improve control over nitrogen fertilisation; prevent surplus organic nitrogen; reduce livestock effluent emissions; develop agricultural renewable energy sources (particularly methane production);
Eionet Report - ETC/CME 6/2021 53
improve the energy performance of farms and maintain and increase carbon stocks on land and in soils. This indicates a broad range of mitigation measures France plans to target with their Agricultural PaMs, and this is reflected in the analysis conducted throughout this task. France have implemented, and planned, a range of cross-cutting plans which aid to target the key objectives outlined above. This includes a number of specific schemes under the Common Agricultural Policy (CAP), the farm competitiveness and adaptation plan, the plant protein plan, the biogas energy and nitrogen independence plan and the agroforestry development plan. The French National Low Carbon Strategy25 outlines a series of key ‘levers’ which when adopted, will significantly reduce agriculture emissions by a targeted 18% in 2030 compared to 2015, and 46% by 2050. The strategy aims to directly and indirectly reduce GHG emissions through various mitigation measures including optimization of managed nitrogen, increased organic farming, optimising livestock management through breeding and feeding, legume crops etc. The strategy further integrates the demand-side of agriculture, focusing on food consumption and food waste, consistent with further PaMs like the Program National Food and Nutrition (PNAN) presented in September 2019.
4.3.4 Agricultural policy framework and PaM reporting
France reported 21 agricultural PaMs in 2021 with 20 implemented and 1 adopted (all considered in a WEM scenario). France did not report on ex-ante or ex-poste impact savings. France did not submit a WAM scenario in 2021, but one was submitted in 2019. Many of the planned PaMs reported in 2019 are now considered implemented, in addition to new implemented PaMs having been reported in 2021.
Table 4.3 Number of expired, implemented, adopted, and planned PaMs targeting different categories of measure, and ex-ante assessments of impact: France
PaM type
Expired Implemented Adopted Planned
Carbon storage/ sequestration 0 16 0 0
Crops and soil N2O mitigation 0 15 1 0
Livestock measures 0 18 0 0
Energy measures 0 7 0 0
Wider food system measures 0 8 0 0
Total Ex-ante impact (kt CO2 eq) N/A N/A N/A N/A
Total ex-post impact (kt CO2 eq) N/A N/A N/A N/A
Carbon sequestration measures France had a number of implemented PaMs targeting carbon sequestration measures, with four PaMs targeting maintaining or enhancing biomass carbon stocks on agricultural land. This is done through techniques such as tree planting, agroforestry, and maintaining existing vegetation and perennial crops. This links to a key aim identified in the French National Low Carbon Strategy, which aims to increase organic farming and perennial crops; and expand more agroforestry. These measures have been incentive through the CAP in the case of France, which considers greening measures under Pillar 1, and also through specific rural develop program agri-environment-climate measures.
(25) https://www.ecologie.gouv.fr/strategie-nationale-bas-carbone-snbc

Eionet Report - ETC/CME 6/2021 54
A national expert highlighted in the questionnaire however that progress in encouraging carbon sequestration in soils has been slower than expected. The creation of the Low-Carbon Label, which is a national carbon standard, is an effective means of financing farmers in their changes in practices (reduction of GHG emissions and carbon sequestration). The main objective is to promote the emergence of virtuous projects, with the support of carbon finance. Significant developments are expected, thanks to the ongoing approval of new methodologies with dozens of projects bringing together tens of thousands of farmers, representing a significant amount of GHG reductions. Crop and soil N2O mitigation measures A considerable number of France’s agricultural PaMs target soil and nutrient management, with the most targeted mitigation measures being ‘organic farming’ and ‘biological nitrogen fixation’, with five PaMs each. Biological nitrogen fixation is done through the use of legumes in crop rotations and in grassland. Despite various plans, the amount of mineral fertilisers used in agriculture has remained fairly stable in recent years. A tax is expected to be introduced on applied mineral fertilisers however, if the N2O targets in the agricultural sector are not hit by 2025. The new Protein Plan in January 2021 aims to replace mineral fertilisers and develop the culture of legumes, doubling current legume areas to 2 million ha by 2030. Furthermore, the development of organic farming is helping to reduce use of synthetic nitrogen fertilisers. The Farm to Fork strategy (European Commission, 2020) provides the EU with an objective of 25% of agricultural area being organic by 2030, which will require considerable efforts as current rates are only at 9.5%. Livestock Measures France reported several PaMs targeting both improvements to manure management measures, and improved livestock management. National experts further indicated in the questionnaire that generally, emission intensity amongst livestock in France has reduced per animal due to improvements in feeding, breeding and disease management. France has targeted considerably with its PaMs the current demand for protein, within both livestock and humans. The ‘Plan protéines végétales pour la France’ (Plant Protein plan for France) for example, has budgeted 50 million euros to develop further plant protein, appealing to both animal and human feed. Six PaMs specifically aim to target improvement manure management techniques which aim to reduce methane emissions, including rapid removal from housing, increased manure storage capacity and four PaMs targeting anaerobic digestion of manure. This is largely consistent with the questionnaire responses from French national experts. The questionnaire respondents for France indicated that anaerobic digesters have led to considerable increases in the biogas sector, with a total of 380 agricultural and regional digesters in operation by January 2018. This has driven an uptake of anaerobic digestion as a process of reducing emissions from manure management systems, and further led to the provision of 1700 jobs. France has successfully and dynamically developed anaerobic digestion through specific tenders and subsidies. The growth in number of biogas installations in France was facilitated by the larger nature of their farms, with a key barrier to anaerobic digesters identified in the questionnaire by some other MS being the small farm sizes and lack of fiscal resources.
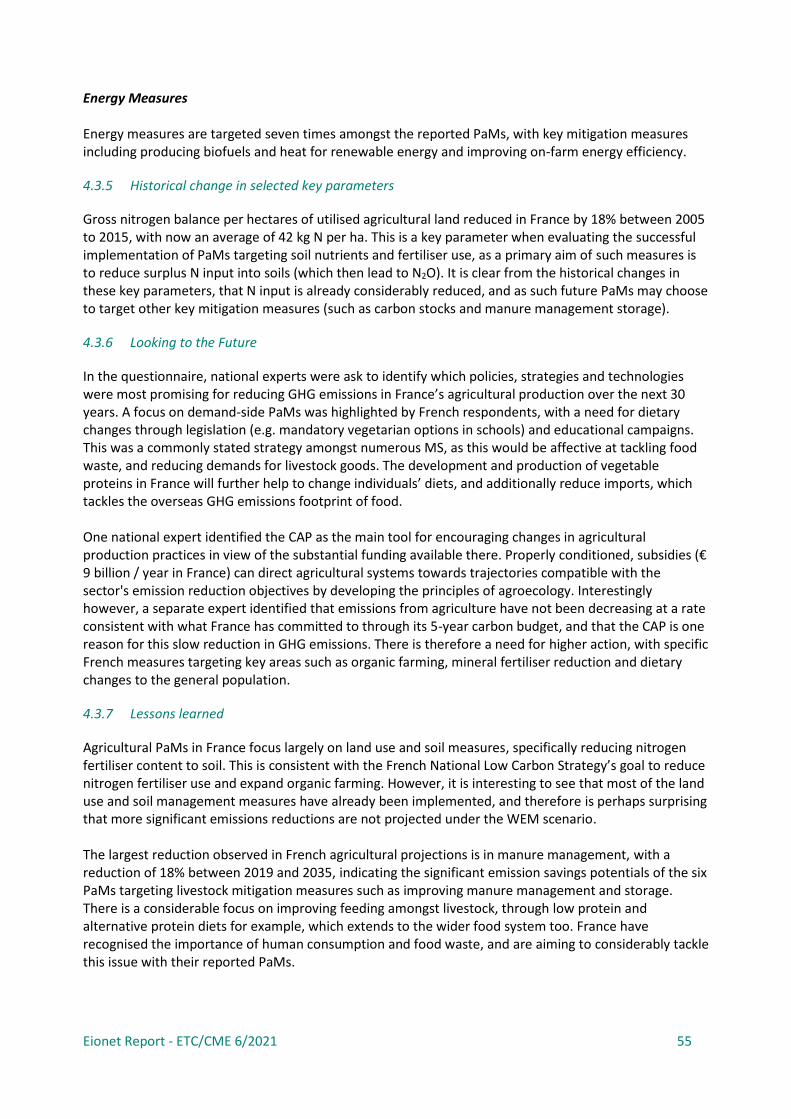
Eionet Report - ETC/CME 6/2021 55
Energy Measures Energy measures are targeted seven times amongst the reported PaMs, with key mitigation measures including producing biofuels and heat for renewable energy and improving on-farm energy efficiency.
4.3.5 Historical change in selected key parameters
Gross nitrogen balance per hectares of utilised agricultural land reduced in France by 18% between 2005 to 2015, with now an average of 42 kg N per ha. This is a key parameter when evaluating the successful implementation of PaMs targeting soil nutrients and fertiliser use, as a primary aim of such measures is to reduce surplus N input into soils (which then lead to N2O). It is clear from the historical changes in these key parameters, that N input is already considerably reduced, and as such future PaMs may choose to target other key mitigation measures (such as carbon stocks and manure management storage).
4.3.6 Looking to the Future
In the questionnaire, national experts were ask to identify which policies, strategies and technologies were most promising for reducing GHG emissions in France’s agricultural production over the next 30 years. A focus on demand-side PaMs was highlighted by French respondents, with a need for dietary changes through legislation (e.g. mandatory vegetarian options in schools) and educational campaigns. This was a commonly stated strategy amongst numerous MS, as this would be affective at tackling food waste, and reducing demands for livestock goods. The development and production of vegetable proteins in France will further help to change individuals’ diets, and additionally reduce imports, which tackles the overseas GHG emissions footprint of food. One national expert identified the CAP as the main tool for encouraging changes in agricultural production practices in view of the substantial funding available there. Properly conditioned, subsidies (€ 9 billion / year in France) can direct agricultural systems towards trajectories compatible with the sector's emission reduction objectives by developing the principles of agroecology. Interestingly however, a separate expert identified that emissions from agriculture have not been decreasing at a rate consistent with what France has committed to through its 5-year carbon budget, and that the CAP is one reason for this slow reduction in GHG emissions. There is therefore a need for higher action, with specific French measures targeting key areas such as organic farming, mineral fertiliser reduction and dietary changes to the general population.
4.3.7 Lessons learned
Agricultural PaMs in France focus largely on land use and soil measures, specifically reducing nitrogen fertiliser content to soil. This is consistent with the French National Low Carbon Strategy’s goal to reduce nitrogen fertiliser use and expand organic farming. However, it is interesting to see that most of the land use and soil management measures have already been implemented, and therefore is perhaps surprising that more significant emissions reductions are not projected under the WEM scenario. The largest reduction observed in French agricultural projections is in manure management, with a reduction of 18% between 2019 and 2035, indicating the significant emission savings potentials of the six PaMs targeting livestock mitigation measures such as improving manure management and storage. There is a considerable focus on improving feeding amongst livestock, through low protein and alternative protein diets for example, which extends to the wider food system too. France have recognised the importance of human consumption and food waste, and are aiming to considerably tackle this issue with their reported PaMs.

Eionet Report - ETC/CME 6/2021 56
France does not report on its ex ante and ex post emissions so it would be useful in future submissions and analysis to have these figures and identify how each specific PaM is influencing total projected emissions. The WEM scenario sees minimal reductions in the key sectors which is interesting considering most reported PaMs for France have already been implemented and are included under the WEM scenario. Interestingly, most of the reported PaMs were identified as having other primary environmental focuses by the reviewers, with GHG emissions as a co-benefit.
4.4 Latvia
4.4.1 National circumstances
Latvia (LV) is situated on the edge of the Eastern European Plain near the Baltic Sea. Its terrain is rather flat, characterized by low areas and hilly elevations. Agricultural land is one of the most significant natural resources in Latvia. The agricultural area in Latvia covers about one third (1.9 million ha) of the total national territory in 2019 (Eurostat 2020a) and can be further divided into 67% cropland with annual crops, 32% is used as permanent grassland and 0.5 % for permanent crops.
Figure 4.5 Breakdown of agricultural land area in Latvia, 2015
Source: Eurostat (2020a)
Climatic conditions and soil fertility are suitable for different branches of agricultural production, including grain, rape and vegetable production. Historically, the dairy sector has always been a priority in agricultural sector of Latvia, in more recent years beef, veal, pork and sheep production is increasing. In 2015, cereals covered about 55% of the arable land and forage plants another 28% (Latvia National Communication, 2017).
The agriculture sector has a minor role in Latvia’s economy and contributes about 1.6% to the GDP in 2018 with 5.1% of the people employed in this sector. The value of agricultural output (production value at basic prices) amounts to 1 629 million EUR in 2019, of which 58% originates from crop production and 38% from animal production (Eurostat 2020a).
Cropland
Permanentgrassland
Permanentcrops
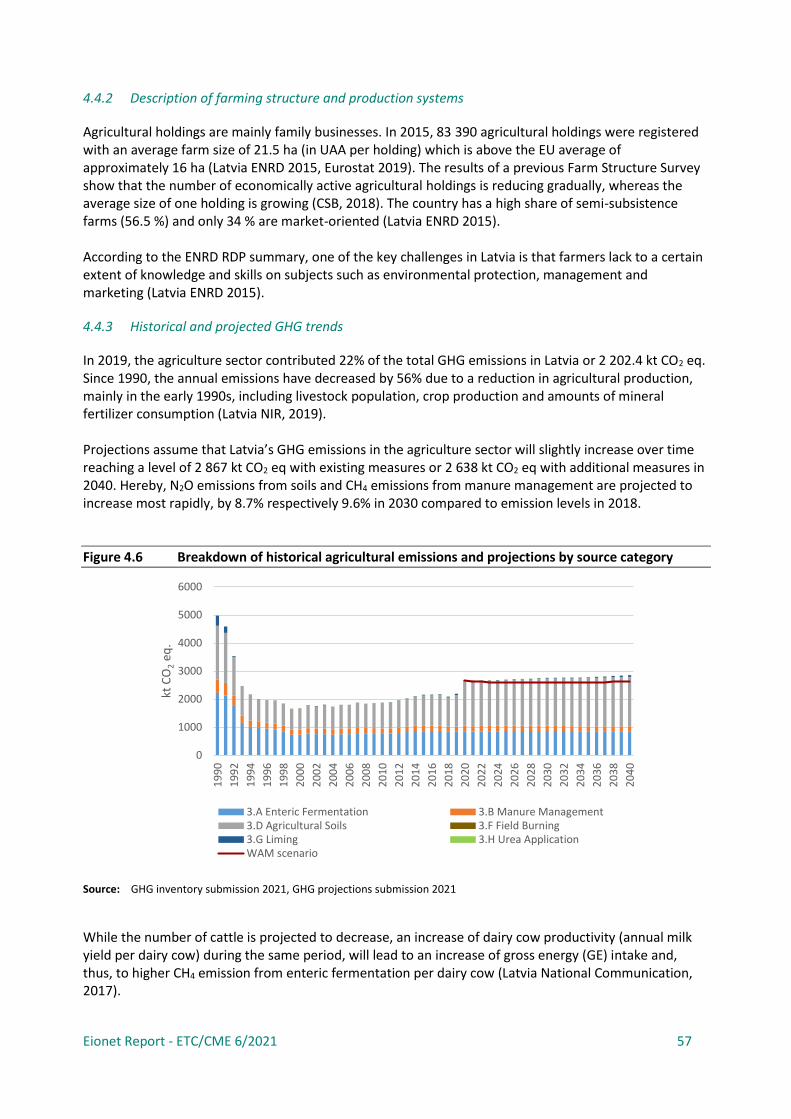
Eionet Report - ETC/CME 6/2021 57
4.4.2 Description of farming structure and production systems
Agricultural holdings are mainly family businesses. In 2015, 83 390 agricultural holdings were registered with an average farm size of 21.5 ha (in UAA per holding) which is above the EU average of approximately 16 ha (Latvia ENRD 2015, Eurostat 2019). The results of a previous Farm Structure Survey show that the number of economically active agricultural holdings is reducing gradually, whereas the average size of one holding is growing (CSB, 2018). The country has a high share of semi-subsistence farms (56.5 %) and only 34 % are market-oriented (Latvia ENRD 2015). According to the ENRD RDP summary, one of the key challenges in Latvia is that farmers lack to a certain extent of knowledge and skills on subjects such as environmental protection, management and marketing (Latvia ENRD 2015).
4.4.3 Historical and projected GHG trends
In 2019, the agriculture sector contributed 22% of the total GHG emissions in Latvia or 2 202.4 kt CO2 eq. Since 1990, the annual emissions have decreased by 56% due to a reduction in agricultural production, mainly in the early 1990s, including livestock population, crop production and amounts of mineral fertilizer consumption (Latvia NIR, 2019). Projections assume that Latvia’s GHG emissions in the agriculture sector will slightly increase over time reaching a level of 2 867 kt CO2 eq with existing measures or 2 638 kt CO2 eq with additional measures in 2040. Hereby, N2O emissions from soils and CH4 emissions from manure management are projected to increase most rapidly, by 8.7% respectively 9.6% in 2030 compared to emission levels in 2018.
Figure 4.6 Breakdown of historical agricultural emissions and projections by source category
Source: GHG inventory submission 2021, GHG projections submission 2021
While the number of cattle is projected to decrease, an increase of dairy cow productivity (annual milk yield per dairy cow) during the same period, will lead to an increase of gross energy (GE) intake and, thus, to higher CH4 emission from enteric fermentation per dairy cow (Latvia National Communication, 2017).
0
1000
2000
3000
4000
5000
6000
19
90
19
92
19
94
19
96
19
98
20
00
20
02
20
04
20
06
20
08
20
10
20
12
20
14
20
16
20
18
20
20
20
22
20
24
20
26
20
28
20
30
20
32
20
34
20
36
20
38
20
40
kt C
O2
eq.
3.A Enteric Fermentation 3.B Manure Management3.D Agricultural Soils 3.F Field Burning3.G Liming 3.H Urea ApplicationWAM scenario

Eionet Report - ETC/CME 6/2021 58
4.4.4 Agricultural policy framework and PaM reporting
PaMs reported by Latvia focus on three main policy areas, which affect GHG emissions, soil and nutrient management measures followed by energy and livestock measures.
Table 4.4 Number of expired, implemented, adopted, and planned PaMs targeting different categories of measure, and ex-ante assessments of impact: Latvia
PaM type
Expired Implemented Adopted Planned
Carbon storage/ sequestration 0 5 0 5
Crops and soil N2O mitigation 0 12 0 8
Livestock measures 1 3 0 3
Energy measures 1 1 0 1
Wider food system measures 0 0 0 0
Total Ex-ante impact (kt CO2 eq) N/A N/A 21 N/A
Total ex-post impact (kt CO2 eq) N/A N/A N/A N/A
The existing PaMs reported strongly relate to the implementation of the Nitrates Directive (ND) 91/676/EEC, the RES Directive and CAP. Key measures implemented by Latvia in these focus areas are described below.
• Main measures affecting N2O emissions from soil and nutrient management: o Crop fertilisation plans: Farmers need to prepare fertilisation plans based on N content
in manure and requirements for certain crop fertilization and expected yield for managed land in vulnerable territories larger than 20 ha.
o Management of nitrate use at vulnerable territories: restriction for nitrogen usage, reduction of nitrogen leaching and indirect N2O emissions. The limit of nitrogen usage is 170 kg of nitrogen from manure and digesters per hectare.
• Improvement of manure management systems: Promotion of an appropriate manure management system allows storing manure in an environmentally friendly way, avoiding/reducing N2O emissions. Specified requirements for farms with more than 10 animal units (AU), and 5 AU in vulnerable territories for storing manure outside of animal sheds.
• Requirements of manure spreading: Increase nutrient uptake efficiency and decrease nutrient
run-off and N2O emissions.
• Integrated farming: This measure promotes environmentally friendly cultivation technology and optimal use of fertilizers by ensuring crop health, yield and soil fertility to reduce N2O emissions.
Main CAP driven economic measures:
• Introduction of leguminous plants on arable land: this measure supports to use of legumes as green manure and fodder in crop rotation and promotes the reduction of nitrogen fertilizer use. This will reduce N2O emissions from use of synthetic and organic fertilizers.
• Organic farming: The state support for organic farmers through subsidies with the aim to increase land area under organic farming relative to total agricultural land.
• Maintenance of amelioration systems: This measure constitutes financial support for reconstruction or renovation of a drainage. This will reduce N2O emissions from use of synthetic and organic fertilizers.
Eionet Report - ETC/CME 6/2021 59
• Promotion of biogas production: The purpose of this measure is to use manure to produce biogas, which is burnt to generate electrical and/or thermal energy. This leads to an efficient use of manure, odour is reduced and high-quality fertilizer is obtained.
• Precision fertiliser application: This measure is market driven and leads to fertiliser savings resulting in reduction of N2O emissions. It involves the use of the newest technologies in planning fertiliser application rates and fertiliser spreading.
• Precision livestock feeding: The measure promotes high quality animal feed use for increased digestibility and thus reduce CH4 emissions.
Planned policies reported focus on two main fields of action, namely crop/soil management and land use measures. In general, their focus areas lie within the range of already implemented measures while one planned PaM is promoting a transition from conventional farming to organic farming systems.
4.4.5 Synthesis / lessons learned
Latvia projects an increasing trend of total GHG emissions in the agriculture sector during the period 2020-2035. Thus, even though Latvia reported 30 PaMs targeting emissions in the agriculture sector these PaMs will not have a significant GHG reducing effect. Changes in other parameters such as the projected increasing annual milk yield per dairy cow seem to counterbalance possible positive effects of reported agriculture PaMs. The majority of measures focus on soil and nutrient management. However, these measures seem to have little effect on projected GHG emissions resulting from agricultural soils, as emissions will continue to increase. Energy measures may have a reducing effect on GHG emissions in the energy sector but apparently not in the agriculture sector. While enteric fermentation from dairy cows is also an important source of GHG emissions, it is not a target area of PaMs aiming to reduce GHG emissions. None of the reported PaMs has a focus on enteric fermentation. Really effective measures are lacking from the agriculture sector in Latvia. However, even though emissions from this sector are projected to increase until 2040, it will still be responsible for a minor part of GHG emissions in the country as agriculture plays a minor role in Latvia’s economy.
4.5 Spain
4.5.1 National circumstances
The agricultural area in Spain (23.8 million ha) covers about half of the total national territory in 2017 (Eurostat 2020a) and can be further divided into 49% of cropland with annual crops, 18% for perennial/woody cropland and approx. 33% is used as permanent grassland (Eurostat, 2020c). The agricultural sector contributes about 2.3% to the GVA in 2018 with 3.7% of people employed in this sector. The value of agricultural output (production value at basic prices) amounts to 52 158 million EUR in 2018 of which 60% is originating from crop production and 36% from animal production (Eurostat, 2020b). Spain is the fourth largest exporting country of agricultural products in the EU and the eight largest worldwide (National communication, 2017). Spain is one of the main fruit and vegetable producers in the EU and it produces about 30% of the total EU fruit production (e.g. more than half of all EU oranges) and more than 20% of all vegetables in the EU (Eurostat 2020e).

Eionet Report - ETC/CME 6/2021 60
Figure 4.7 Utilized agricultural areas split by sub-types in 2016
Source: Eurostat (2020a)
4.5.2 Description of farming structure and production systems
The average farm size in Spain is 24 ha (in UAA per holding) which is above the EU average of approximately 16 ha (Spanish ENRD, 2015; Eurostat, 2019). There are approx. 950 000 agricultural holdings registered and about half of them are considered to be very small farms with less than 8 000 EUR of standard output. In addition, almost 90% of the farms are family farms with more than 50% of the labour is carried out by family members (Eurostat, 2020b). The country has a high share of semi-subsistence farms (56 %) and only 28 000 farms (34 %) are market-oriented (Spanish ENRD, 2015). It should be noted that the agricultural sector in Spain is very diverse in terms of climate system, soil types and cultivation system, reaching from cereal monocultures to tropical fruits and from extensive to intensive livestock keeping (National communication, 2017). The trend in recent years for the livestock unit (LSU) shows an increase for cattle numbers and a decrease for pigs and poultry. However, the overall livestock intensity (the ratio of total livestock to the total UAA which is an indicator for pressure of livestock farming on the environment) has remained stable for Spain (0.6 LSU per ha) and is below the EU average of 0.8 LSU per hectare (Eurostat, 2020d). Regarding the increase in cattle, according to the NIR 2020 this is related to an increase in non-dairy cattle, whereas dairy cattle numbers have slightly decreased.
According to the RDP factsheet, the key challenges in Spain are that the agricultural cooperatives are very fragmented and operations over different regions and across the whole food chain are therefore difficult to manage. There is a need to modernize irrigation systems and to prevent and combat forest fire, which also needs to be managed on a supra-regional level (Spanish ENRD, 2015).

Eionet Report - ETC/CME 6/2021 61
Figure 4.8 Number of livestock units for 2013 and 2016
Source: Eurostat (2020c)
4.5.3 Historical and projected GHG trends
In 2019, the agriculture sector contributed 12% of the total GHG emissions in Spain or 37 794 kt CO2 eq. Since 1990, the annual emissions have increased by 8% due to increases in emissions from the main source categories, namely enteric fermentation, agricultural soils and manure management. In the “with existing measures” scenario, the historical trend of increasing emissions is changed, and slightly declining emissions are reported until 2040, reaching a level of 35 432 kt CO2 eq. With additional measures the emissions are expected to further decrease to 30 759 kt CO2 eq by 2040. The main reductions due to additional measures are projected for the category manure management (-49% in 2040 compared to 2019) and enteric fermentation (-10%).
Figure 4.9 Historical and projected trend of agriculture emissions in Spain
Source: GHG inventory submission 2021, GHG projections submission 2021
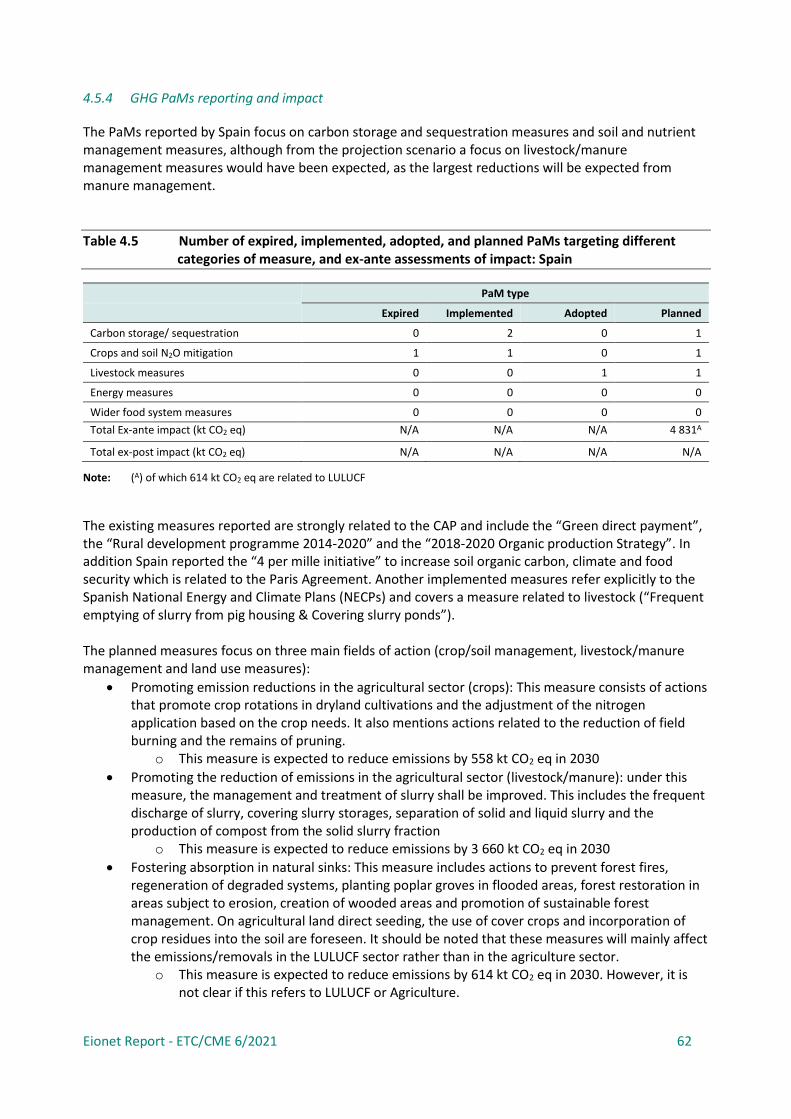
Eionet Report - ETC/CME 6/2021 62
4.5.4 GHG PaMs reporting and impact
The PaMs reported by Spain focus on carbon storage and sequestration measures and soil and nutrient management measures, although from the projection scenario a focus on livestock/manure management measures would have been expected, as the largest reductions will be expected from manure management.
Table 4.5 Number of expired, implemented, adopted, and planned PaMs targeting different categories of measure, and ex-ante assessments of impact: Spain
PaM type
Expired Implemented Adopted Planned
Carbon storage/ sequestration 0 2 0 1
Crops and soil N2O mitigation 1 1 0 1
Livestock measures 0 0 1 1
Energy measures 0 0 0 0
Wider food system measures 0 0 0 0
Total Ex-ante impact (kt CO2 eq) N/A N/A N/A 4 831A
Total ex-post impact (kt CO2 eq) N/A N/A N/A N/A
Note: (A) of which 614 kt CO2 eq are related to LULUCF
The existing measures reported are strongly related to the CAP and include the “Green direct payment”, the “Rural development programme 2014-2020” and the “2018-2020 Organic production Strategy”. In addition Spain reported the “4 per mille initiative” to increase soil organic carbon, climate and food security which is related to the Paris Agreement. Another implemented measures refer explicitly to the Spanish National Energy and Climate Plans (NECPs) and covers a measure related to livestock (“Frequent emptying of slurry from pig housing & Covering slurry ponds”). The planned measures focus on three main fields of action (crop/soil management, livestock/manure management and land use measures):
• Promoting emission reductions in the agricultural sector (crops): This measure consists of actions that promote crop rotations in dryland cultivations and the adjustment of the nitrogen application based on the crop needs. It also mentions actions related to the reduction of field burning and the remains of pruning.
o This measure is expected to reduce emissions by 558 kt CO2 eq in 2030
• Promoting the reduction of emissions in the agricultural sector (livestock/manure): under this measure, the management and treatment of slurry shall be improved. This includes the frequent discharge of slurry, covering slurry storages, separation of solid and liquid slurry and the production of compost from the solid slurry fraction
o This measure is expected to reduce emissions by 3 660 kt CO2 eq in 2030
• Fostering absorption in natural sinks: This measure includes actions to prevent forest fires, regeneration of degraded systems, planting poplar groves in flooded areas, forest restoration in areas subject to erosion, creation of wooded areas and promotion of sustainable forest management. On agricultural land direct seeding, the use of cover crops and incorporation of crop residues into the soil are foreseen. It should be noted that these measures will mainly affect the emissions/removals in the LULUCF sector rather than in the agriculture sector.
o This measure is expected to reduce emissions by 614 kt CO2 eq in 2030. However, it is not clear if this refers to LULUCF or Agriculture.
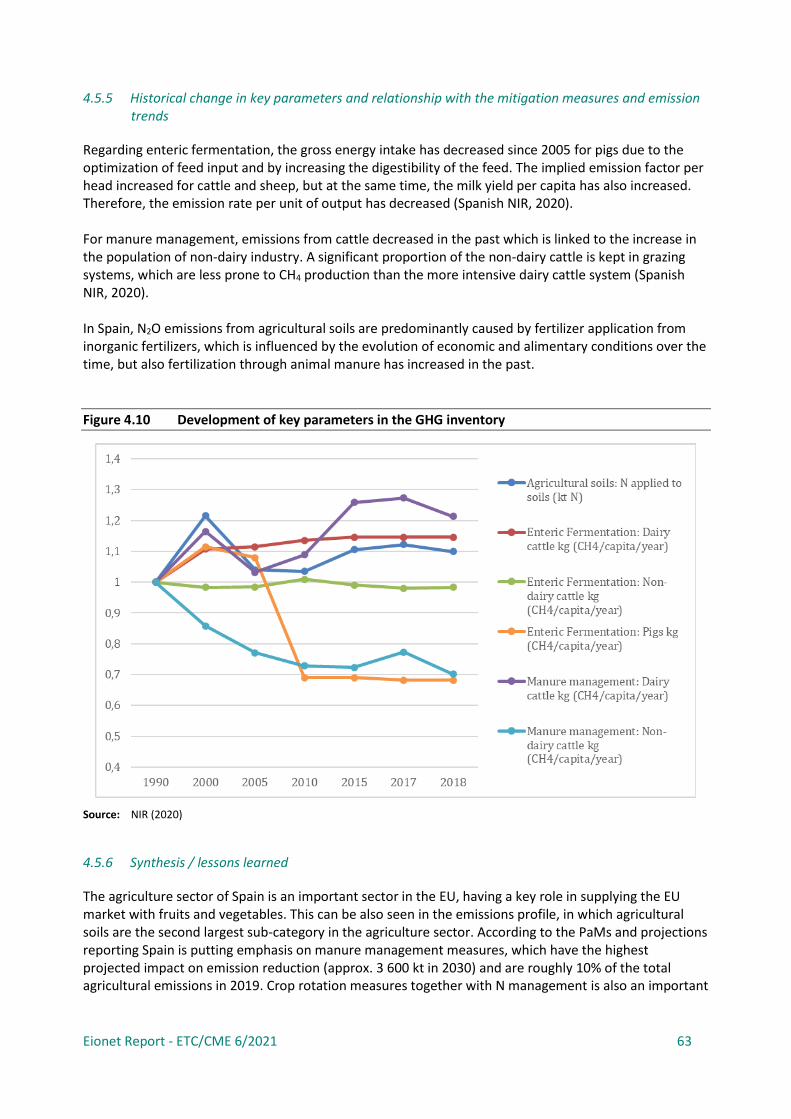
Eionet Report - ETC/CME 6/2021 63
4.5.5 Historical change in key parameters and relationship with the mitigation measures and emission trends
Regarding enteric fermentation, the gross energy intake has decreased since 2005 for pigs due to the optimization of feed input and by increasing the digestibility of the feed. The implied emission factor per head increased for cattle and sheep, but at the same time, the milk yield per capita has also increased. Therefore, the emission rate per unit of output has decreased (Spanish NIR, 2020). For manure management, emissions from cattle decreased in the past which is linked to the increase in the population of non-dairy industry. A significant proportion of the non-dairy cattle is kept in grazing systems, which are less prone to CH4 production than the more intensive dairy cattle system (Spanish NIR, 2020). In Spain, N2O emissions from agricultural soils are predominantly caused by fertilizer application from inorganic fertilizers, which is influenced by the evolution of economic and alimentary conditions over the time, but also fertilization through animal manure has increased in the past.
Figure 4.10 Development of key parameters in the GHG inventory
Source: NIR (2020)
4.5.6 Synthesis / lessons learned
The agriculture sector of Spain is an important sector in the EU, having a key role in supplying the EU market with fruits and vegetables. This can be also seen in the emissions profile, in which agricultural soils are the second largest sub-category in the agriculture sector. According to the PaMs and projections reporting Spain is putting emphasis on manure management measures, which have the highest projected impact on emission reduction (approx. 3 600 kt in 2030) and are roughly 10% of the total agricultural emissions in 2019. Crop rotation measures together with N management is also an important
Eionet Report - ETC/CME 6/2021 64
focus because in Spain, mono-cropping is still very common, therefore this measure could be an important step to reduce emissions from agricultural soils. Another measure is focusing on the natural sinks and affects the LULUCF removals. However, it is noted that there is no mentioning of any specific livestock management measures (such as feed optimization) targeting at the reduction of emissions from enteric fermentation, although this is largest agricultural sub-category in terms of absolute emissions. Although there has been a decrease in dairy cattle, the overall cattle numbers increased due to higher non-dairy cattle livestock numbers. Therefore, emissions from Enteric fermentation and Manure management remained rather stable in the past. For future analyses, it would be interesting to look into energy emissions and fuel consumption of the agriculture sector because of Spain’s dominance in the fruit and vegetable sector, even though these emissions would be reported in the energy sector.
Eionet Report - ETC/CME 6/2021 65
5 Future developments for agriculture GHG mitigation
This section summarises the responses from the MS questionnaire, expert interviews, and the authors’ knowledge of upcoming EU policy to reflect on priorities for GHG mitigation in European agriculture.
5.1 Achieving further reductions in emissions from EU agriculture
Globally, there are still opportunities for reducing emissions intensity of production, with 50% possible globally for livestock (Peyraud and MacLeod, 2020). In sections 1 and 2 of this report, variation in GHG emissions intensity of animal products and nitrogen use efficiency (NUE) was discussed, indicating that there is some scope for emissions intensity to be reduced on many farms towards the level of the best-performing ones. One questionnaire respondent suggested that a further 10-20% reduction in emissions intensity of livestock systems could be feasible in Europe through technical measures. One expert interviewed suggested an up to 30% reduction may be possible through existing measures. However, the same interviewee also pointed out that the additional scope for improvement depends on assumptions about uptake of measures. In the modelling study EcAMPA2, Perez-Dominguez et al. (2016) found that when sufficient subsidies were applied to encourage uptake of mitigation measures, an 18% reduction in GHG emissions from the EU-28 (pre-2020) agriculture sector could be achieved (although around one-fifth of this reduction was offset by emissions leakage due to increase imports). Three questionnaire respondents commented that rather than new technologies, they believed that greater improvements were possible through overcoming barriers to changing farmer behaviour and increasing uptake of existing mitigation measures. Regarding overcoming barriers to uptake set out in Section 3.1, questionnaire respondents indicated that further progress could be made through a variety of means:
• More training for farmers on GHG mitigation, distributed through local knowledge transfer networks and advisory services. Related to this, investing in young farmers to retain them in agriculture, and ensuring rural populations have access to IT infrastructure.
• More financial support for capital-intensive infrastructure such as anaerobic digestion and improved manure management, in areas with high livestock concentrations.
• More research on policy effectiveness, to allow more tailored and high-quality advice to farmers and to persuade them that measures will work.
Connected to the last of these points (as well as to the need highlighted in section 3.1 for GHG inventories to capture the impact of mitigation technology), the ongoing MELS project (Mitigating Emissions from Livestock Systems)26 is currently gathering knowledge and data on the impact of mitigation measures for livestock. The project aims to develop a farm-scale decision support system aimed at farmers and advisors, as well as database of detailed emission factors and mitigation efficiencies, taking into account country-specific factors, to help improve national inventories. One expert interviewed commented on the role of non-governmental organizations or companies in changing management practices. For example, food processors and retailers already require certain production standards to be met by producers for dimensions such as animal welfare and hygiene, so the
(26) https://www.mels-project.eu/the-project/

Eionet Report - ETC/CME 6/2021 66
interviewee thought it probable that GHG emissions footprint (and other aspects of sustainability) may soon be a common part of such requirements. This could drive change alongside or independently of government policy.
Suggestions for the technical focus of measures from questionnaire responses were also varied, including many of the measures already supported. These included:
• Taking a more region-specific approach to fertilizer policy (e.g. considering soil characteristics), and considering stronger financial disincentives for synthetic fertilizer use.
• One respondent mentioned the importance of better integration of dairy and beef production with multi-purpose breeds, to achieve greater system-level efficiency.
• Review of restrictions that currently prevent food waste being fed to livestock, especially to pigs, to allow this to replace purpose-grown feed crops.
• Increased planting of “non-woodland” trees in lanes, agroforestry and hedges, to allow increased carbon sequestration whilst overcoming fears around taking land out of production.
• Respondents from six MS mentioned increasing carbon sequestration in agricultural soils as a key focus.
• Breeding livestock and crop varieties adapted to low energy and nutrient inputs.
• Animal feed improvements, including additives to reduce enteric methane emissions.
• Developing markets for “Renure” products – recovered nutrients from manure - which can be a more agronomically suitable form of fertilizer for use on arable crops than raw manure or slurry. If fertilizer markets are harmonized across the EU to allow trade in Renure then, this would facilitate large-scale redistribution of manure-derived nutrients from regions of excess to those in deficit, displacing synthetic fertilisers.
• Respondents from five MS thought that increases in organic farming and agro-ecological farming practices were of key importance.
Despite uptake of existing measures being a key focus of respondents, novel technology may increase possibilities for reduction in emissions. Questionnaire respondents cited precision agriculture as potentially being important, though to date evidence is not strong that this results in large fertilizer or cost savings. Some novel technological measures are still not considered acceptable in the EU context; for example, using genetic modification to enhance beneficial traits in crops and livestock, such as to reduce enteric fermentation, or to introduce nitrogen fixing abilities to cereals.
5.2 Achieving emission reductions through wider food system changes
Reducing demand for food through dietary change and reduction in food waste was cited by five questionnaire respondents as a key priority for future change. This will enable a reduction in the land required for agriculture in the EU and elsewhere, facilitating carbon removals in the LULUCF sector on spared land and, by using biomass for energy, displacing fossil fuels in the energy sector. It would also make space for a large-scale transition to organic agriculture in Europe without emissions leakage, because the lower yields under organic farming are offset by a reduction in demand. One study found that for a 100% agro-ecological food system across Europe (of which organic farming is an example) to be self-sufficient, it would require about a 50% reduction in animal protein intake per capita compared with current levels (Van Zanten et al., 2018). Given current levels of animal protein consumption (section 2.6.1), there is clearly considerable scope for dietary change, but scenario-based studies may not be a good guide to what is achievable in the short term, and more work is likely needed on this question.
Eionet Report - ETC/CME 6/2021 67
Questionnaire respondents from three MS highlighted that changing consumer attitudes will be important (but possibly difficult), in order to accept (potentially) more expensive food that internalizes environmental costs. Other respondents noted the importance of awareness-raising among consumers of the GHG impacts of different foods. The themes of dietary change, reducing food waste and reducing environmental impacts of agriculture are woven together in the EU Farm to Fork Strategy (European Commission, 2020), which in turn is part of the EU Green Deal and has fed into the 2023-2027 CAP agreements. The strategy targets an increase in the area of organic agriculture to 25% of total agricultural land by 2030, alongside a 50% reduction in nitrogen waste and 20% reduction in synthetic fertilizer use by 2030. If meeting these targets requires reducing production levels, this must be accompanied by demand reduction to avoid exporting emissions. Although few MS currently report PaMs related to demand reduction, the Farm to Fork Strategy incorporates the goal of shifting to more sustainable diets and reducing food waste, and will likely stimulate new policies from MS. The strategy includes actions to develop sustainability labelling schemes, and mandatory public sector sustainable food procurement requirements to encourage sustainable consumption. It will also introduce legally binding targets to reduce food waste in MS as well as reviewing and revising rules on date-marking to avoid consumer confusion. On the topic of reducing overseas environmental footprint of food consumption:
• Six questionnaire respondents discussed increasing domestic production, in particular of plant-based protein crops, to increase self-sufficiency.
• Four questionnaire respondents and one expert interviewed highlighted the importance of establishing internationally-agreed sustainability standards (both within and outside the EU) including a GHG footprint component, or an import tariff (such as the proposed carbon border adjustment mechanism27) linked to such criteria. This would help to lower the GHG footprint of EU consumption by preventing EU producers being undercut on price by other regions of the world with less stringent standards (assuming that some mitigation measures are costly to EU producers), and also by incentivising GHG mitigation measures among overseas producers supplying the EU market.
• One respondent mentioned the idea of restricting human-edible products in animal feed to reduce food-feed competition, which could have far-reaching impacts on demand for cereals and soy among pig and poultry producers.
The proposed EU regulation on deforestation-free products28 seeks to address some of the issues mentioned above by respondents.
5.3 Reflections on effectiveness of previous EU policies and future development
In the past, the CAP policy has not been geared towards climate mitigation, but has improved over time especially thanks to decoupling of subsidies from production, which contributed to a fall in (over)production. Current programming (2014-2020) incorporates climate mitigation as one of the key goals, and many questionnaire respondents thought that the CAP has been reasonably effective in promoting some measures such as organic farming. Simulation analysis by Alliance Environnement (2018) showed that CAP measures did result in emissions savings of 0.3 – 8.7% in 2016 compared to a counterfactual scenario, but also noted that some kinds of direct payment may lead to higher GHG emissions, by keeping marginal land in production. The European court of auditors report (ECA, 2021) highlights that the measures with the greatest uptake have uncertain benefits for GHG mitigation. Problems identified by questionnaire respondents included:
(27) https://ec.europa.eu/commission/presscorner/detail/en/qanda_21_3661 (28) https://ec.europa.eu/environment/publications/proposal-regulation-deforestation-free-products_en
Eionet Report - ETC/CME 6/2021 68
• EU policies have sometimes failed to take into account the diversity of farms.
• There has been little enforcement of the obligation to monitor the impact of measures on GHG emissions, so this has contributed to a lack of real-world evidence of effectiveness.
• Overarching food system issues contributing to GHG emissions have not been addressed in historical policies.
• Education and farm advisory services have not been implemented well in all MS. Looking to the future, the Farm-to-Fork strategy (European Commission, 2020) seeks to address some of these shortcomings, placing emphasis on the wider food system perspectives of dietary change and food waste, and on building up knowledge networks. It also highlights some of the key measures mentioned by questionnaire respondents, such as research on feed additives, EU-grown protein crops for animal feed, expanding biogas plants, and encouraging recycling of the digestate produced from them. The strategy (and the new CAP linked to this) also places emphasis on MS bolstering their support for Agricultural Knowledge and Innovation Systems (AKIS) and farm advisory services, which will help to provide farmers with reliable, objective information to make sustainable management choices. This matches well to the comments from questionnaire respondents and experts interviewed on the importance of these aspects of policy implementation. Quantitatively, there is a target for a greater proportion of CAP budget to be spent on climate action, rising from between 18% and 26% for the 2014-2020 CAP (ECA, 2021), to 40% under the new 2023-2027 CAP29. This should foster greater uptake of a range of measures, although it is not clear whether the effective but controversial technical measures (e.g. nitrification inhibitors) highlighted by ECA (2021) can be incentivised directly through the CAP.
5.3.1 Carbon farming and carbon removal certification
At EU level there are currently several initiatives and plans which target farming practices in order to remove CO2 from the atmosphere. In the Farm to Fork Strategy (European Commission, 2020), the Commission announced in 2021 that it will launch the Carbon Farming Initiative which is a new business model to reward farmers for climate-friendly practices. Such payments could become a new source of income for farmers which can be rewarded e.g. for the following practices: increased soil organic carbon in cropland, afforestation, restoration of forests, improved forest management, biomass supply for long-lasting bio-based products, protection of carbon-rich soils. The payments can either provided via the CAP, but also by the public and private sector. 30,31,32 In addition, as announced in the Circular Economy Action Plan33 the Commission is working on the development of a regulatory framework for certification of carbon removals providing a system with robust and transparent carbon accounting, including monitoring, verification and reporting (MRV). This carbon removal mechanism scheme will include technical and nature based solutions. Nature based solutions also include farming practices, and through the carbon removal certification incentives shall be established for landowners to maintain or increase the carbon stocks in their land. The Commission plans to publish a legislative proposal for the carbon removal mechanism in 202234.
(29) https://ec.europa.eu/info/food-farming-fisheries/key-policies/common-agricultural-policy/new-cap-2023-
27_en (30) https://ec.europa.eu/food/system/files/2020-05/f2f_action-plan_2020_strategy-info_en.pdf (31) https://ec.europa.eu/clima/eu-action/forests-and-agriculture/carbon-farming_en (32) https://ec.europa.eu/info/sites/default/files/food-farming-
fisheries/sustainability_and_natural_resources/documents/analysis-of-links-between-cap-and-green-deal_en.pdf
(33) https://eur-lex.europa.eu/legal-content/EN/TXT/?qid=1583933814386&uri=COM:2020:98:FIN (34) https://ec.europa.eu/info/law/better-regulation/have-your-say/initiatives/13172-Certification-of-carbon-
removals-EU-rules_en

Eionet Report - ETC/CME 6/2021 69
Most of the farming practices that are mentioned in the currently available documents on carbon farming (COWI, 2021) and the information available on the carbon removal certification35 aim to increase or protect carbon stocks (e.g. maintaining soil organic carbon in cropland) and only a few are aiming to reduce or avoid emissions (e.g. peatland rewetting, livestock carbon audits). This means that these initiatives and schemes could lead to increased or maintained removals in the LULUCF sector, but not necessarily lead to reductions in emissions of the agriculture sector. The proposed joint agriculture-LULUCF net-zero emissions target by 2035 under the Fit-for-55 package also recognizes the close link between the two sectors, because the agricultural emissions, even with strong efforts, cannot be completely reduced and therefore the remaining emissions will need to be compensated by the LULUCF sector from 2035 onwards. However, it is important to note that the sequestration potential in the LULUCF sector is limited and therefore, it is inevitable that emissions in the agriculture sector decrease. The current proposals from the “Fit for 55” package do not yet include a concrete target for 2035, but from the impact assessment and the related modelling tasks it can be concluded that the required emission reductions from the agriculture sector by 2035 will be approx. 20% compared to current emissions.36 Current projected agriculture sector emissions, even under the “With additional measures” scenario, fall well short of this.
5.4 Avoiding trade-offs with other important outcomes
Currently, the CAP’s environmental elements consider a broad definition of environmental quality, including reducing nitrogen and phosphorus air and water pollution, and conserving farmland biodiversity. However, if the ambition of the CAP with regard to GHG mitigation must be increased, this could have unintended negative consequences if other impacts are not considered Two interviewees expressed concern that a blinkered focus on reducing GHG emissions (and worse, just EU GHG emissions) from agriculture could potentially result in trade-offs with other important environmental impacts or ecosystem services. For example, feeding ruminants high-sugar grasses can reduce enteric methane emissions compared with rough grazing (CCC, 2020), but this risks requiring additional fertilization (with association nitrogen pollution) and a loss of biodiversity. Questionnaire respondents provided a variety of comments around their perception of the risk of trade-offs, or possibility of synergies, between GHG mitigation strategies and other important outcomes.
• Two respondents highlighted the need for ecosystem-oriented food production systems, an emphasis on ecology and enhanced diversity (which will help to maintain fertility).
• One respondent noted that shifting human diets, by reducing demand and flows of energy and nutrients, creates synergies in almost all aspects of sustainability and public health. On the other hand, they noted that technological solutions to reducing emissions intensity, when production is not reduced, are generally more likely to result in trade-offs through “pollution swapping”, for example among emissions of different nitrogen compounds.
• Several respondents and one expert interviewed touched on the complex relationship between productivity, GHG mitigation, N pollution, profitability and biodiversity. There are often synergies between measures to reduce N pollution and GHG mitigation, because N2O is an important GHG from agriculture. However, depending on how mitigation is achieved and other contextual
(35) See footnotes. Error! Bookmark not defined., Error! Bookmark not defined. and Error! Bookmark not
defined. (36) COM(2021) 554 final: Proposal for a REGULATION OF THE EUROPEAN PARLIAMENT AND OF THE COUNCIL
amending Regulations (EU) 2018/841 as regards the scope, simplifying the compliance rules, setting out the targets of the Member States for 2030 and committing to the collective achievement of climate neutrality by 2035 in the land use, forestry and agriculture sector, and (EU) 2018/1999 as regards improvement in monitoring, reporting, tracking of progress and review, (p. 85-86)

Eionet Report - ETC/CME 6/2021 70
factors there can be different impacts on farm profitability and biodiversity. One expert noted that when GHG mitigation is achieved through increased productivity to lower emissions intensity per product, profitability can increase but local farmland biodiversity usually loses out. On the other hand, agro-ecological farming can reduce GHG emissions, and brings synergies with animal welfare and biodiversity. However, two respondents mentioned that such systems – while potentially more financially viable in the long term – are expensive in transition, and would benefit from better internalizing of external costs across the board to increase competitiveness.
Eionet Report - ETC/CME 6/2021 71
6 Conclusions
This report was motivated by the question of why MS’ mitigation PaMs have not caused total agricultural emissions in the EU to fall significantly in recent years (and are not projected to cause substantial reductions in the near future), and what further actions are required to reduce emissions more significantly. As discussed in section 1.3, trends in production have been important drivers of GHG emissions from agriculture over recent decades. However, reduction in emissions intensity of certain products over time, and variation across regions of the EU, suggest that changes in management practices have had an impact, and that there is likely to be scope for further improvements. In addition, net EU emissions could be reduced through reducing agricultural production, in particular if this facilitates carbon sequestration in biomass and soils. However, the risk of emissions leakage and other negative impacts (such as deforestation and biodiversity loss) through increased imports must be taken into account with such policies. The analysis of PaMs reported in 2021 under the Governance Regulation assessed the scope of measures being incentivised by MS, and attempted to identify where there might be gaps. Overall, it was found that the scope of PaMs implemented or planned by MS covered most of the effective measures identified in the literature (though quantification of the expected impact was not possible). Some effective measures identified in the literature were not commonly mentioned in reported PaMs, including:
• Livestock breeding and feed additives to reduce enteric fermentation emissions
• Manure cooling and acidification
• Reduction of livestock production
• Use of nitrification inhibitors
• Conversion of arable land to grassland
• Measures to encourage dietary change or a reduction in food waste One caveat to this assessment is the possible impact of variability in PaMs reporting practices across MS, which may have resulted in “false negatives” in some cases (see section 1.5.1). This highlights a need for improved reporting completeness and consistency across MS. Questionnaires and interviews provided some possible explanations for why some effective measures may not be common, including: technological immaturity; lack of evidence of the mitigation impact, costs or impacts on production, and political sensitivity related to the impact on producers and consumers. Such challenges also apply to uptake of measures more generally. Other cross-cutting barriers identified by questionnaire respondents included a lack of knowledge and support for farmers, a disaggregated agricultural sector in some regions with associated lack of financial resources, and perceived conflicting agendas of production and environmental protection. Cross-cutting ideas for good practice in policy implementation focus on education, training and advisory services for farmers, as well involving farmers in the decision-making process. Ensuring schemes are flexible, and consider synergistic benefits (e.g. income, water quality, biodiversity) rather than being tightly focused on GHG mitigation is also important. More generally, a holistic support package including research, education/training and financial support is important. For wider food system measures,

Eionet Report - ETC/CME 6/2021 72
changing public attitudes and behaviour towards food choices through awareness-raising and education was deemed important. The case studies (section 4) provided varied examples of successes and challenges in policy implementation, as well as the importance of other key drivers. In Denmark and Latvia, significant historical reductions in emissions have occurred but for different reasons; in Latvia a large drop in production occurred in the early 1990s, whereas in Denmark imposition of strict fertilization rules to protect terrestrial and aquatic habitats from eutrophication caused a sharp fall in emissions from soils. Looking ahead, in Latvia despite many relevant PaMs, emissions are projected to rise due to increased production. Spain projects a substantial reduction in emissions from manure management under the WAM scenario, as the livestock sector there is large, with scope for implementation of low-emission practices. In France, a transition to agro-ecological farming, with a large area of organic agriculture and re-integration of crop and livestock systems across the country, is a key part of future strategies.
6.1 Future perspectives
The EU Green Deal includes a target for the EU-27 to reach net zero GHG emissions by 2050, and achieve a 55% reduction by 2030. Modelling for the “Fit for 55” proposal suggested that to achieve adequate reductions in the agriculture and LULUCF sectors combined, around a 20% reduction in agricultural emissions will be needed. Considering the question of what further actions are required to reduce emissions, this remains an open question. Questionnaire respondents and modelling studies highlighted that further progress can be made by increasing uptake of existing technical measures, but that more significant action to reduce demand (by cutting food waste and shifting diets) would likely be required. Most of the PaMs reported by MS were linked to the CAP or other EU policies, underlining the importance of good policy design at the EU level. EU policy developments such as the EU Green Deal (includes the Farm to Fork Strategy), “Fit for 55” proposal and the new CAP contain many important elements which relate to gaps and challenges highlighted in this report, for example:
• The proposal to create a joint LULUCF and agriculture emissions reduction target, and a model for rewarding farmers for carbon sequestration, recognizing the close link between those sectors.
• Specific elements relating to food waste and dietary change.
• Emphasis on agricultural knowledge transfer and training.
• Research on feed additives to reduce enteric methane, and on increasing circular nutrient use.
• Plans for a large-scale increase in organic farming and reduction in fertilizer use.
• Plans for a carbon border adjustment mechanism to prevent leakage of production and emissions elsewhere.
Some of these developments are incorporated into the new CAP for 2023-2027, and will likely stimulate new or strengthened policies from MS. This report presents a snapshot of reported PaMs, but these may evolve significantly over the next few years. However, some key questions remain which could be addressed by future work:
• Under the new 2023-2027 CAP 40% of the budget will be climate-related, which means 60% is not. Is this enough to stimulate the levels of uptake of measures required to achieve deep cuts in emissions?
• If the GHG reduction targets are achieved through reduced production in Europe (either through extensification, or converting agricultural land to other uses to sequester carbon), what will the impact be on overall global GHG emissions and sustainability of the food system?
Eionet Report - ETC/CME 6/2021 73
• Related to this, what level and nature of demand reduction in the EU is required to facilitate meeting the targets without causing emissions leakage, and how can this translate into reduced production rather than increased exports?
• Currently, how well are MS’ emission inventory methods able to reflect the impact of mitigation measures?

Eionet Report - ETC/CME 6/2021 74
7 References
Al Seadi, T., Stupak, I., Smith, C. T. , 2018, Governance of environmental sustainability of manure-based centralised biogas production in Denmark, Murphy, J.D. (Ed.) IEA Bioenergy Task 37, 2018: 7. https://www.ieabioenergy.com/wp-content/uploads/2018/07/environmental-sustainability_web.pdf
Alliance Environnement, 2018, Evaluation study of the impact of the CAP on climate change and greenhouse gas emissions. Report for Directorate General for Agriculture and Rural Development (European Commission). URL: https://op.europa.eu/en/publication-detail/-/publication/29eee93e-9ed0-11e9-9d01-01aa75ed71a1
CCC (Committee on Climate Change), 2020, The Sixth Carbon Budget: Agriculture and land use, land use change and forestry. https://www.theccc.org.uk/wp-content/uploads/2020/12/Sector-summary-Agriculture-land-use-land-use-change-forestry.pdf
COWI, Ecologic Institute and IEEP, 2021, Technical Guidance Handbook - setting up and implementing result-based carbon farming mechanisms in the EU, Report to the European Commission, DG Climate Action, under Contract No. CLIMA/C.3/ETU/2018/007. COWI, Kongens Lyngby.
CSB, Central Statistical Bureau of Latvia, 2018, Farm Structure in Latvia 2016. https://www.csb.gov.lv/en/statistics/statistics-by-theme/agriculture/agricultural-census/search-in-theme/322-farm-structure-latvia-2016
Danish Ministry of Energy, Utilities and Climate, 2017, Denmark’s Seventh National Communication on Climate Change under the United Nations Framework Convention on Climate Change and the Kyoto Protocol. https://unfccc.int/sites/default/files/resource/8057126_Denmark-NC7-BR3-2-NC7-DNK-Denmarks-NC7-and-BR3_1January2018-12MB.pdf
ECA (European Court of Auditors), 2021, Common Agricultural Policy and climate: Half of EU climate spending but farm emissions are not decreasing, Special report 16/2021. https://www.eca.europa.eu/Lists/ECADocuments/SR21_16/SR_CAP-and-Climate_EN.pdf
ENRD, 2021, RDP analysis: Support to environment & climate change – M10.1 agri-environment-climate commitments. https://enrd.ec.europa.eu/sites/default/files/rdp_analysis_m10-1.pdf
European Commission, 2020, Farm to fork strategy: For a fair, healthy and environmentally-friendly food system. https://ec.europa.eu/food/horizontal-topics/farm-fork-strategy_en
Eurostat, 2020a: Utilised agricultural area by categories. https://ec.europa.eu/eurostat/databrowser/view/tag00025/default/table?lang=en (accessed: 27/11/2020)
Eurostat, 2020b: Agriculture, forestry and fishery statistics, Agriculture, forestry and fishery statistics — 2020 edition (europa.eu) (online: 03/11/2021)
Eurostat, 2020c: Main farm land use by NUTS 2 regions https://ec.europa.eu/eurostat/databrowser/view/ef_lus_main/default/table?lang=de
Eurostat, 2020d: Livestock density at country level in 2016, https://ec.europa.eu/eurostat/statistics-explained/index.php/Agri-environmental_indicator_-_livestock_patterns#Livestock_density_at_country_level_in_2016
Eurostat, 2020e: Agricultural production – crops, https://ec.europa.eu/eurostat/statistics-explained/index.php/Agricultural_production_-_crops#Cereals
Eionet Report - ETC/CME 6/2021 75
Grizzetti, B., et al., 2013, The contribution of food waste to global and European nitrogen pollution, Environmental Science & Policy, 33, 186-195. https://doi.org/10.1016/j.envsci.2013.05.013
IPCC (Intergovernmental Panel on Climate Change), 2019, 2019 Refinement to the 2006 IPCC Greenhouse Gas Inventory Guidelines, Volume 4, Chapter 10. https://www.ipcc-nggip.iges.or.jp/public/2019rf/pdf/4_Volume4/19R_V4_Ch10_Livestock.pdf
Latvia ENRD, 2015: 2014-2020 Rural Development Programme: Key facts & figures Latvia, https://enrd.ec.europa.eu/sites/enrd/files/lv_ rdp_qnt_summary_v1_2.pdf
Latvia’s National Communication, 2017: Latvia’s Seventh National Communication and Third Biennial Report, https://www4.unfccc.int/sites/SubmissionsStaging/NationalReports/Documents/934015_Latvia-NC7-BR3-1-LATVIA_NC7_29122017.pdf
Leip, A., Weiss, F., Wassenaar, T., Perez, I., Fellmann, T., Loudjani, P., Tubiello, F., Grandgirard, D., Monni, S., and Biala, K., 2010, Evaluation of the livestock sector's contribution to the EU greenhouse gas emissions (GGELS) – final report, European Commission, Joint Research Centre. https://op.europa.eu/en/publication-detail/-/publication/38abd8e0-9fe1-4870-81da-2455f9fd75ad
Martin, G., Moraine, M., Ryschawy, J. et al., 2016, Crop–livestock integration beyond the farm level: a review, Agron. Sustain. Dev. 36, 53, https://doi.org/10.1007/s13593-016-0390-x
Milea, 2020, Nitrogen management in Romania – experience and perspectives, presentation for the Effort Sharing Regulation Capacity Building Workshop, Feb 2020 (part of European Commission project for DG CLIMA - Contract No 340201/2018/791993/SER/CLIMA.C.2).
Nielsen, O-K., Plejdrup, M.S., Winther, M., Mikkelsen, M.H., Nielsen, M., Gyldenkærne, S.,Fauser, P., Albrektsen, R., Hjelgaard, K.H., Bruun, H.G. & Thomsen, M, 2021, Annual Danish Informative Inventory Report to UNECE: Emission inventories from the base year of the protocols to year 2019. http://dce2.au.dk/pub/SR435.pdf
Perez-Dominguez I., Fellmann T., Weiss F., Witzke P., Barreiro-Hurle J., Himics M., Jansson T., Salputra G. & Leip A., 2016, An economic assessment of GHG mitigation policy options for EU agriculture (EcAMPA 2), JRC Science for Policy Report, EUR 27973. https://publications.jrc.ec.europa.eu/repository/handle/JRC101396
Peyraud, J-L., MacLeod, M., & Directorate-General for Agriculture and Rural Development, 2020, Future of EU livestock: how to contribute to a sustainable agricultural sector?, European Commission. https://op.europa.eu/en/publication-detail/-/publication/b10852e8-0c33-11eb-bc07-01aa75ed71a1/language-en
Ponisio L.C., M’Gonigle L.K., Mace K.C., Palomino J., de Valpine P. & Kremen C., 2015, Diversification practices reduce organic to conventional yield gap, Proc. R. Soc. B, 282 (1799), 20141396. https://royalsocietypublishing.org/doi/10.1098/rspb.2014.1396
Poux, X., Aubert, P.-M., 2018, An agroecological Europe in 2050: multifunctional agriculture for healthy eating. Findings from the Ten Years For Agroecology (TYFA) modelling exercise, Iddri-AScA, Study N°09/18, Paris, France, 74 p.
Ricardo-AEA, 2016, Effective performance of tools for climate action policy - meta-review of Common Agricultural Policy (CAP) mainstreamin, report for Directorate General for Climate Action (European Commission). URL: https://ec.europa.eu/clima/sites/clima/files/forests/lulucf/docs/cap_mainstreaming_en.pdf
Searchinger, T.D., Wirsenius, S., Beringer, T. et al., 2018, Assessing the efficiency of changes in land use for mitigating climate change, Nature 564, 249–253. https://doi.org/10.1038/s41586-018-0757-z

Eionet Report - ETC/CME 6/2021 76
Smith, L.G., Kirk, G.J.D., Jones, P.J. and Williams, A.G., 2019, The greenhouse gas impacts of converting food production in England and Wales to organic methods, Nat Commun 10, 4641. https://doi.org/10.1038/s41467-019-12622-7
Spanish ENRD, 2015: 2014-2020 Rural Development Programme: Key facts & figures SPAIN – NATIONAL PROGRAMME, https://enrd.ec.europa.eu/sites/enrd/files/es_natprog_rdp_qnt_summary_v1_2.pdf
Spanish National Communication, 2017, Séptima Comunicación de Espana – Convención Marco de Naciones Unidas sobre el Cambio Climatico, https://unfccc.int/sites/default/files/resource/68037591_spain-nc7-1-7cn.pdf
Spanish NIR, 2020: España, Informe Inventarios GEI 1990-2018 (Edición 2020). Spain. 2020 National Inventory Report (NIR) | UNFCCC
Teagasc, 2019, An Analysis of Abatement Potential of Greenhouse Gas Emissions in Irish Agriculture 2021-2030, Prepared by the Teagasc Greenhouse Gas Working Group. https://www.teagasc.ie/media/website/publications/2018/An-Analysis-of-Abatement-Potential-of-Greenhouse-Gas-Emissions-in-Irish-Agriculture-2021-2030.pdf
UNECE, 2021, Guidance document on integrated sustainable nitrogen management ECE/EB.AIR/149. https://unece.org/sites/default/files/2021-04/Advance%20version_ECE_EB.AIR_149.pdf
Van Zanten, HHE, Herrero, M, Hal, OV, et al., 2018, Defining a land boundary for sustainable livestock consumption, Glob Change Biol. 2018; 24: 4185– 4194. https://doi.org/10.1111/gcb.14321
Westhoek H., Lesschen J.P., Leip A., Rood T., Wagner S., De Marco A., Murphy-Bokern D., Pallière C., Howard C.M., Oenema O. & Sutton M.A., 2015, Nitrogen on the Table: The influence of food choices on nitrogen emissions and the European environment, European Nitrogen Assessment Special Report on Nitrogen and Food. https://www.pbl.nl/sites/default/files/downloads/Nitrogen_on_the_Table_Report_WEB.pdf
Willett, W. et al., 2019, Food in the Anthropocene: the EAT–Lancet Commission on healthy diets from sustainable food systems, The Lancet Volume 393, Issue 10170. https://doi.org/10.1016/S0140-6736(18)31788-4
WWF, 2020, Riskier Business: The UK’s Overseas Land Footprint. https://www.wwf.org.uk/riskybusiness

Eionet Report - ETC/CME 6/2021 77
Units of Measurement and symbols
% per cent
AU Animal Units
CO2 eq Carbon Dioxide Equivalent
GE Gross Energy
ha hectare (10 000 m2)
km2 square kilometer
kg kilogram (1000 g)
LSU Livestock unit
Mt Megatonnes (1 000 000 t)
t tonnes (1 000 kg)
Eionet Report - ETC/CME 6/2021 78
Other Abbreviations
AFOLU Agriculture, forestry and land use sector
BAT Best Available Technique
CAP Common Agricultural Policy
CH4 Methane
CO2 Carbon Dioxide
CRF Common Reporting Format
EAFRD European Agricultural Fund for Rural Development
EAGF European Agricultural Guarantee Fund
ECA European Court of Auditors
EEA European Environment Agency
EFFECT Environmental public goods From Farming through Effective Contract Targeting
ENRD European Network for Rural Development
ESD Effort Sharing Decision
ESR Effort Sharing Regulation
ETC/CME European Topic Centre on Climate Change Mitigation and Energy
EU European Union
Eurostat Statistical office of the European Union
GHG Greenhouse Gas
IPCC Intergovernmental Panel on Climate Change
LULUCF Land Use, Land Use Change and Forestry
LU Livestock Unit
MMS Manure Management System
MS Member State(s)
N Nitrogen
N2O Nitrous Oxide
NC National Communication
NECP National energy and climate plans
NH3 Ammonia
NIR National Inventory Report
NUE Nitrogen Use Efficiency
NUTS Nomenclature of territorial units for statistics(NUTS levels 1, 2 and 3)
NUTS 2 Basic regions for the application of regional policies
PaMs Policies and Measures
RDP Rural Development Plans
RES Renewable Energy Sources
RES Directive Directive on the promotion of the use of energy from renewable sources
TAMS Targeted Agricultural Modernisation Scheme
TFEIP Task Force on Emission Inventories and Projections
TFRN Task Force on Reactive Nitrogen
UAA Utilised Agricultural Area
UNECE United Nations Economic Commission for Europe
UNFCCC United Nations Framework Convention on Climate Change
WAM With Additional Measures
WEM With Existing Measures
Eionet Report - ETC/CME 6/2021 79
Annex 1: Reporting quality assessed from 2019 reported PaMs
Completeness and clarity of PaM descriptions
Overall, completeness and clarity of PaM descriptions was found to be quite good, with the exception of some MS (see Table A1.1 ratings). The ideal PaM description clearly outlined how the policy is to work (i.e. the specific policy instrument type), and its expected outcomes with regards to key mitigation measures. One key characteristic which varied across countries was whether the PaM described specific measures, or more “aspirational” PaMs which describe the hoped-for effect of the PaMs. For example, PaM descriptions often state the objective - “improving nitrogen efficiency”, “improved manure storage”, “increased efficiency of livestock production”, “increasing carbon sequestration in soils” - rather than the means of achieving that. This is more common for planned PaMs, and for research / knowledge transfer PaMs where there is not a specific agricultural practice in mind.
Clarity of type of policy instrument
Most MS could increase their transparency when reporting the type of policy instrument type. Initially the EU wide assessment sought to identify the policy instrument for each individual reported PaM, in some detail. Categorical fields included various specific economic instruments such as capital grant/one-off payment or tax relief; payment upon compliance; production-based subsidy; ongoing tax relief or a non-economic instrument. Throughout the assessment, it was difficult to identify these specific economic policy instruments as most PaM descriptions did not provide such detail. Many PaM policy instrument type was generally categorised as ‘economic’, but with a lack of clarity as to what type of economic instrument.
Links between reported PaMs and projected GHG emissions
Only few countries quantified the impact of their PaMs and also the lack of transparency in the reports makes it difficult to understand how the PaMs actually will affect the GHG emissions in the future. As many MS report rather stable trends in the projections, but at the same time report PaMs for the agriculture sector, it is not clear from the reported information if these PaMs just prevent from having increasing emissions in the future or if they have just a very insignificant impact and are able to reduce emissions significantly. A more complete and transparent reporting on the quantified impact of the PaMs would substantially increase the understanding of how the PaMs influence the emissions.
Links to further documentation
Over half of MS required further links and reports to be read outside of the information provided in the PaMs database, in order to effectively assess which key mitigation measure was targeted by a PaM. This was mainly due to a lack of clarity in the description provided for the individual PaM. Further documentation included links to additional policy reports, website links and more. This further documentation was extremely useful in most cases, as it allowed the reviewers to gain a wider understanding of the reported PaM and specific detail on policy instrument type and mitigation measures was easier to obtain.
Eionet Report - ETC/CME 6/2021 80
Reporting of ex-ante and ex-post assessments
In 2019, a total of 10 MS reported on some type of ex-ante or ex-post assessments within the PaMs database for the years 2025 and/or 2035. It is clear that the PaMs database is missing this detailed and reliable information from most MS, as it remains difficult to calculate. The countries that reported some form of ex-ante and ex-post assessments are Czechia, Germany, Greece, Ireland, Latvia, Luxembourg, Malta, Romania, Slovenia and the UK. These MS aim to quantify the expected emission reduction for individual PaMs, but none are able to gain a comprehensive overview as not all PaMs are quantifiable. It would be interesting to try to calculate the reduction reported for each key mitigation measure, but it is clear that reporting is already incomplete and splitting out by measure would be extremely difficult. Table A1.1 presents a summary of the reporting quality for each MS. An overall rating has then been provided with 3 being very clear and transparent reporting, and 1 indicating there is a need for improvement in clarity. It is extremely clear that the quality of reporting will differ greatly between MS, with a large scope for variation.
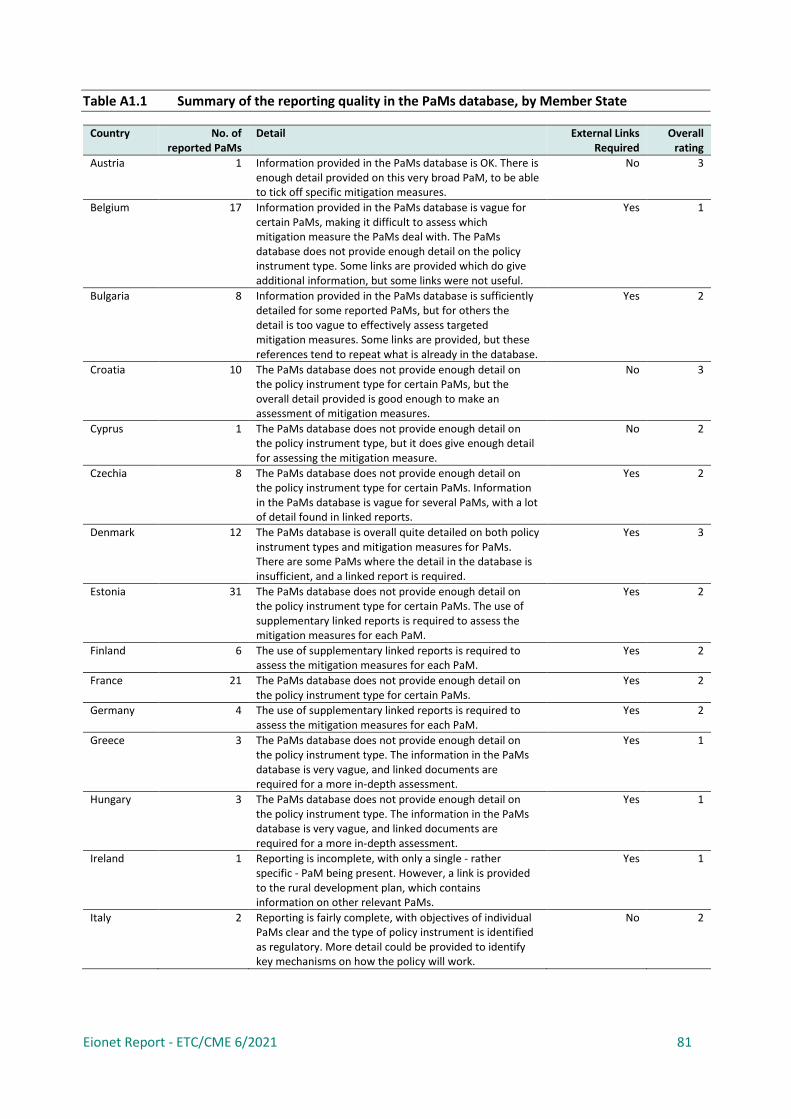
Eionet Report - ETC/CME 6/2021 81
Table A1.1 Summary of the reporting quality in the PaMs database, by Member State
Country No. of reported PaMs
Detail External Links Required
Overall rating
Austria 1 Information provided in the PaMs database is OK. There is enough detail provided on this very broad PaM, to be able to tick off specific mitigation measures.
No 3
Belgium 17 Information provided in the PaMs database is vague for certain PaMs, making it difficult to assess which mitigation measure the PaMs deal with. The PaMs database does not provide enough detail on the policy instrument type. Some links are provided which do give additional information, but some links were not useful.
Yes 1
Bulgaria 8 Information provided in the PaMs database is sufficiently detailed for some reported PaMs, but for others the detail is too vague to effectively assess targeted mitigation measures. Some links are provided, but these references tend to repeat what is already in the database.
Yes 2
Croatia 10 The PaMs database does not provide enough detail on the policy instrument type for certain PaMs, but the overall detail provided is good enough to make an assessment of mitigation measures.
No 3
Cyprus 1 The PaMs database does not provide enough detail on the policy instrument type, but it does give enough detail for assessing the mitigation measure.
No 2
Czechia 8 The PaMs database does not provide enough detail on the policy instrument type for certain PaMs. Information in the PaMs database is vague for several PaMs, with a lot of detail found in linked reports.
Yes 2
Denmark 12 The PaMs database is overall quite detailed on both policy instrument types and mitigation measures for PaMs. There are some PaMs where the detail in the database is insufficient, and a linked report is required.
Yes 3
Estonia 31 The PaMs database does not provide enough detail on the policy instrument type for certain PaMs. The use of supplementary linked reports is required to assess the mitigation measures for each PaM.
Yes 2
Finland 6 The use of supplementary linked reports is required to assess the mitigation measures for each PaM.
Yes 2
France 21 The PaMs database does not provide enough detail on the policy instrument type for certain PaMs.
Yes 2
Germany 4 The use of supplementary linked reports is required to assess the mitigation measures for each PaM.
Yes 2
Greece 3 The PaMs database does not provide enough detail on the policy instrument type. The information in the PaMs database is very vague, and linked documents are required for a more in-depth assessment.
Yes 1
Hungary 3 The PaMs database does not provide enough detail on the policy instrument type. The information in the PaMs database is very vague, and linked documents are required for a more in-depth assessment.
Yes 1
Ireland 1 Reporting is incomplete, with only a single - rather specific - PaM being present. However, a link is provided to the rural development plan, which contains information on other relevant PaMs.
Yes 1
Italy 2 Reporting is fairly complete, with objectives of individual PaMs clear and the type of policy instrument is identified as regulatory. More detail could be provided to identify key mechanisms on how the policy will work.
No 2
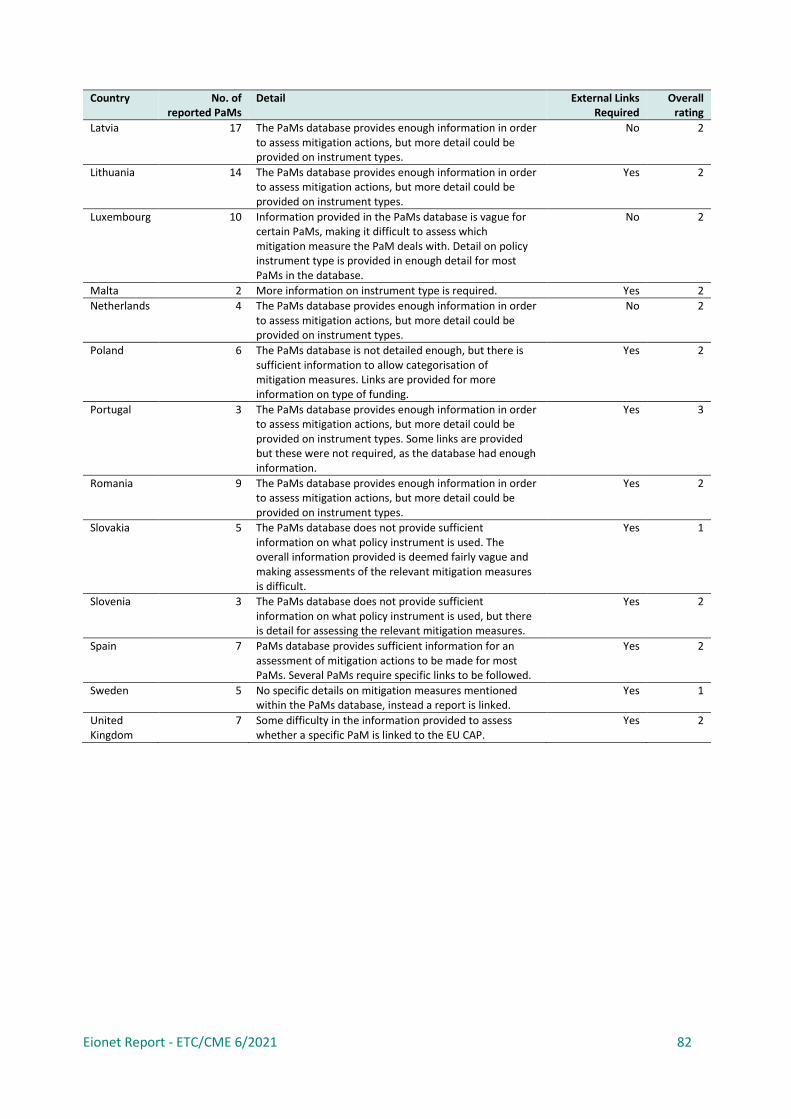
Eionet Report - ETC/CME 6/2021 82
Country No. of reported PaMs
Detail External Links Required
Overall rating
Latvia 17 The PaMs database provides enough information in order to assess mitigation actions, but more detail could be provided on instrument types.
No 2
Lithuania 14 The PaMs database provides enough information in order to assess mitigation actions, but more detail could be provided on instrument types.
Yes 2
Luxembourg 10 Information provided in the PaMs database is vague for certain PaMs, making it difficult to assess which mitigation measure the PaM deals with. Detail on policy instrument type is provided in enough detail for most PaMs in the database.
No 2
Malta 2 More information on instrument type is required. Yes 2
Netherlands 4 The PaMs database provides enough information in order to assess mitigation actions, but more detail could be provided on instrument types.
No 2
Poland 6 The PaMs database is not detailed enough, but there is sufficient information to allow categorisation of mitigation measures. Links are provided for more information on type of funding.
Yes 2
Portugal 3 The PaMs database provides enough information in order to assess mitigation actions, but more detail could be provided on instrument types. Some links are provided but these were not required, as the database had enough information.
Yes 3
Romania 9 The PaMs database provides enough information in order to assess mitigation actions, but more detail could be provided on instrument types.
Yes 2
Slovakia 5 The PaMs database does not provide sufficient information on what policy instrument is used. The overall information provided is deemed fairly vague and making assessments of the relevant mitigation measures is difficult.
Yes 1
Slovenia 3 The PaMs database does not provide sufficient information on what policy instrument is used, but there is detail for assessing the relevant mitigation measures.
Yes 2
Spain 7 PaMs database provides sufficient information for an assessment of mitigation actions to be made for most PaMs. Several PaMs require specific links to be followed.
Yes 2
Sweden 5 No specific details on mitigation measures mentioned within the PaMs database, instead a report is linked.
Yes 1
United Kingdom
7 Some difficulty in the information provided to assess whether a specific PaM is linked to the EU CAP.
Yes 2
Eionet Report - ETC/CME 6/2021 83
Annex 2: MS Questionnaire
Past, Present and Future of Agricultural GHG Emissions
Mitigation Actions
1 Introduction
The European Topic Centre on Climate Change Mitigation and Energy (ETC/CME), funded by the
European Environment Agency, is currently undertaking a project to summarise good practice and
transferable lessons for greenhouse gas emissions mitigation from the agricultural sector. Specifically, we
want to understand the experience of European countries regarding:
Historical and current successes and challenges in implementing agricultural GHG mitigation
policies and measures across European countries.
Approaches to tackling barriers to policy implementation and uptake of measures
Current or upcoming plans to address wider food-system issues
Viewpoints of national experts on where priorities should lie in future for agricultural GHG
mitigation How specific national circumstances influence the above
We are very interested to hear the viewpoints of key national experts, which will help us to build an
understanding of this area and provide a useful summary of good practice and transferable lessons for all
European countries.
We would be very grateful if you could fill in this questionnaire to help us in our work!
There are 8 main questions. Please answer as many of the questions as you can, but there is no
obligation to answer them all - we would rather a short response than none at all.
We expect it to take you around 20-45 minutes to complete, depending on the level of detail you are
able to provide.
If you have any queries regarding the questionnaire or the project in general, please email richard.
[email protected], with [email protected] in CC.
More information about ETC/CME can be found at https://www.eionet.europa.eu/etcs/etc-cme

Eionet Report - ETC/CME 6/2021 84
2 Your details
Please provide contact details, so that we can provide more information about the project and get in
touch if we need to clarify any of the answers (with your permission).
Details will only be used for the purposes of the questionnaire, and will be deleted upon completion of
the work.
* 2.1 Organisation
* 2.2 Name
* 2.3 What is your job role and/or background in this topic area?
* 2.4 Contact email address
* 2.5 Which country do you represent?
3 Historical trends, successes and challenges
The following questions seek to capture your views on drivers of agricultural GHG emissions in your
country, and successes and challenges in implementing effective GHG mitigation policies and measures.

Eionet Report - ETC/CME 6/2021 85
3.1 Which of the following drivers of GHG emissions do you think have undergone significant changes
in your country over the last 30 years?
Tick all that are relevant
Increase / decrease in total livestock production
Increase / decrease in total crop production
2
Increase / decrease in livestock productivity and emissions intensity per animal due to feeding /
breeding / disease management
Changes in animal waste management systems
Changes in nutrient management for crops, e.g. change in the quantity or type of nitrogen fertiliser applied
Changes in soil and non-crop vegetation affecting soil and biomass carbon
stocks Other (please describe below)
3.2 Any further information relating to question 3.1 (max 5000 characters).
Eionet Report - ETC/CME 6/2021 86
3.3 What have been the main successes and challenges faced in your country for implementing policies and measures to reduce agricultural GHG emissions? E.g.
What has worked well? And what has not worked well? And why?
Please provide comments against each of the following themes
Your comments Reducing enteric fermentation emissions (e.g. through breeding, increased efficiency, feeding strategies and additives)
Improving manure storage and encouraging biogas production Reducing nitrogen losses from application of organic and mineral fertilisers (e.g. through nutrient management plans, low-emission application techniques, use of inhibitors, correct timing of application, use of cover/catch crops)
Promoting use of organic nitrogen to replace inorganic nitrogen fertilizer on crops
Encouraging carbon sequestration in soils, or limiting loss of soil carbon from carbon-rich soils (e.g. through re-wetting, reduced tillage)
Encouraging retention of or increase in woody biomass in the farmed landscape (e.g. agroforestry, orchards, farm woodland, hedgerows)
Other - please specify
Eionet Report - ETC/CME 6/2021 87
3.4 Considering the implementation challenges noted in your response to question 3.3, what approaches
have proven effective, or are planned in future, to overcome these barriers? Please provide comments
below (max 5000 characters).
3.5 Do current EU agricultural policies and strategies sufficiently contribute to GHG reduction of the sector?
If not, why?
Please provide comments below (max 5000 characters).
(Ideas for future policy can be given in question 5.1)
4 Wider food system policies and challenges

Eionet Report - ETC/CME 6/2021 88
4.1 What policies and measures are currently in place or planned (if any) in your country to address wider food-system changes that would help to reduce agricultural GHG
emissions?
And what are the key challenges (or what would they be) to implementing such policies and measures in your country?
Please provide comments for each of the following themes
Your comments Reducing food waste, both from field to farm gate and also downstream in the food supply chain
Demand-side policies to encourage dietary shift away from reduced consumption of high GHG intensity foods (e.g. meat and dairy) and/or a switch to alternatives.
Supply-side policies to intentionally reduce levels of crop and livestock production
Use of alternative livestock feeds (such as microbial or insect protein) to reduce potential for land use change and competition with human-edible crops, both in your country and globally
Other - please specify
Eionet Report - ETC/CME 6/2021 89
5 Future policies and challenges
5.1 In your opinion, which policies, strategies or technologies are most promising for reducing GHG
emissions from your country’s agricultural production over the next 30 years, and why?
Please provide comments below (max 5000 characters).
Note this may relate to both well-established measures and those which are not yet available, or not currently permitted e.g. genetic modification).
5.2 Linked to the previous question, which policies, strategies or technologies are most promising for
reducing the overseas GHG emissions footprint of food and animal feed imported into your country?
Please provide comments below (max 5000 characters).
This should focus on actions taken in your country, rather than in the exporting countries
5.3 Over the next 30 years, which policies and measures do you think will bring opportunities for
synergies, or main risks of trade-offs, between GHG mitigation and other agricultural objectives such as
control of nitrogen pollution, maintenance of biodiversity, farm profitability, and food quality?
Please provide comments below (max 5000 characters).
6 Survey Follow-up
Eionet Report - ETC/CME 6/2021 90
* 6.1 Are you willing for us to contact you to follow-up on any of the answers you provide, for clarification
purposes?
Yes
No
6.2 Would you be prepared to take part in a short interview to discuss your responses in more detail?
It would last 30-60 minutes and take place between mid-July and early September.
Yes
No
6.3 If you would like to provide links to any additional information such external reports, please insert
them into the box below.

Eionet Report - ETC/CME 6/2021 91
Annex 3: List of questionnaire respondents
Country Name* Organisation*
Austria Nora Mitterböck Federal Ministry for Climate Action, Environment, Energy, Mobility, Innovation and Technology, Climate Policy Coordination
Belgium Sylviane Thomas Walloon Air & Climate Agency (Awac)
Czechia Jana Beranová IFER - Institute of Forest Ecosystems Research, Ltd.
France Elisabeth Pagnac-Farbiaz Ministry of Ecological Transition
France Gwenaël Podesta Ministry of Ecological Transition
Greece Leonidas E. Kallinikos National Technical University of Athens
Latvia Laima Berzina University
Netherlands Sarah Sijses Ministry of Agriculture, Nature and Food Quality of the Netherlands
Poland Agnieszka Strzelce Op PZDR
Poland Agnieszka Opolski ośrodek doradztwa rolniczego
Poland Andrzej ŚODR w Modliszewicach
Poland City Hall of Toruń Department of environment and ecology
Poland Dawid Ośrodek Doradztwa Rolniczego
Poland Diana Opolski Ośrodek Doradztwa Rolniczego
Poland Edyta Starostwo Powiatowe
Poland Grzegorz Żurek Instytut Hodowli i Aklimatyzacji Roślin, Państwowy Instytut Badawczy
Poland Halina Opolski Ośrodek Doradztwa Rolniczego, PZDR w Kędzierzynie-Koźlu,
Poland Halina PZDR
Poland Iwona PZDR OST
Poland Iwona Prokopiuk Starostwo Powiatowe w Bielsku Podlaskim
Poland Janusz Starostwo Powiatowe w Inowrocławiu
Poland Joanna Opolski Ośrodek Doradztwa Rolniczego w Łosiowie
Poland Joanna Agricultural advisor
Poland Katarzyna Farmer
Poland Krzysztof Labocha City of Częstochowa Municipality Office, Department of Environmental Protection, Agriculture and Forestry
Poland Magdalena Bodył The National Centre for Emissions Management (KOBiZE)
Poland Magdalena Wróbel-Jędrzejewska Prof. Waclaw Dabrowski Institute of Agriculture and Food Biotechnology
Poland Maksymilian Żaba Dolnośląski Ośrodek Doradztwa Rolniczego z siedzibą we Wrocławiu
Poland Małgorzata Farmer
Poland Marian Szałda Farmer
Poland Martyna Próchniak Lubelski Ośrodek Doradztwa Rolniczego w Końskowoli
Poland Maryla Opolski Ośrodek Doradztwa Rolniczego
Poland Mateusz Murzyn Powiat Myślenicki / Lesser Poland / Poland
Poland Patrycja Bożek Starostwo Powiatowe w Pajęcznie
Poland Podlaski Ośrodek Doradztwa Rolniczego w Szepietowie
Podlaski Ośrodek Doradztwa Rolniczego w Szepietowie
Poland Robert Smęt Gmina Siennica Różana
Poland Ruda Śląska Urząd Miasta
Poland Śląski Ośrodek Doradztwa Rolniczego
-
Poland Starostwo Powiatowe w Malborku
-
Poland Starostwo Powiatowe w Pińczowie
-
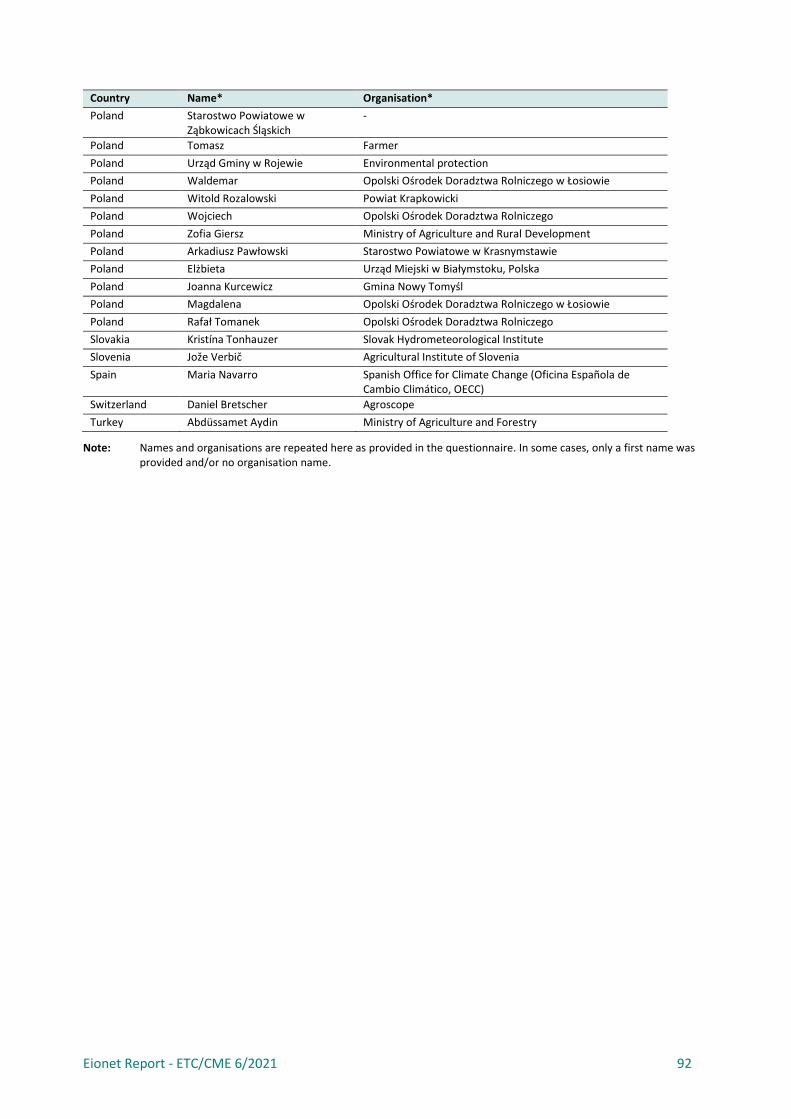
Eionet Report - ETC/CME 6/2021 92
Country Name* Organisation*
Poland Starostwo Powiatowe w Ząbkowicach Śląskich
-
Poland Tomasz Farmer
Poland Urząd Gminy w Rojewie Environmental protection
Poland Waldemar Opolski Ośrodek Doradztwa Rolniczego w Łosiowie
Poland Witold Rozalowski Powiat Krapkowicki
Poland Wojciech Opolski Ośrodek Doradztwa Rolniczego
Poland Zofia Giersz Ministry of Agriculture and Rural Development
Poland Arkadiusz Pawłowski Starostwo Powiatowe w Krasnymstawie
Poland Elżbieta Urząd Miejski w Białymstoku, Polska
Poland Joanna Kurcewicz Gmina Nowy Tomyśl
Poland Magdalena Opolski Ośrodek Doradztwa Rolniczego w Łosiowie
Poland Rafał Tomanek Opolski Ośrodek Doradztwa Rolniczego
Slovakia Kristína Tonhauzer Slovak Hydrometeorological Institute
Slovenia Jože Verbič Agricultural Institute of Slovenia
Spain Maria Navarro Spanish Office for Climate Change (Oficina Española de Cambio Climático, OECC)
Switzerland Daniel Bretscher Agroscope
Turkey Abdüssamet Aydin Ministry of Agriculture and Forestry
Note: Names and organisations are repeated here as provided in the questionnaire. In some cases, only a first name was provided and/or no organisation name.

Eionet Report - ETC/CME 6/2021 93
European Topic Centre on Climate change
mitigation and energy
Boeretang 200
B-2400 Mol, Belgium
Tel.: +32 14 33 59 77
Web: www.eionet.europa.eu/etcs/etc-cme
Email: [email protected]
The European Topic Centre on Climate change
mitigation and energy (ETC/CME) is a consortium of
European institutes under contract of the European
Environment Agency.
Copyright © 2022 FDOKUMEN