Reporting on ambient air quality assessment in the ... - Eionet
54
Reporting on ambient air quality assessment in the European region, 2010 ETC/ACM Technical Paper 2012/7 September 2012 Benno Jimmink, Frank de Leeuw, Jana Ostatnická, Markéta Schreiberová, Linton Corbet The European Topic Centre on Air Pollution and Climate Change Mitigation (ETC/ACM) is a consortium of European institutes under contract of the European Environment Agency RIVM UBA‐V ÖKO AEAT EMISIA CHMI NILU INERIS PBL CSIC
-
Upload
khangminh22 -
Category
Documents
-
view
1 -
download
0
Transcript of Reporting on ambient air quality assessment in the ... - Eionet
Reporting on ambient air quality assessment
in the European region, 2010
ETC/ACM Technical Paper 2012/7 September 2012
Benno Jimmink, Frank de Leeuw, Jana Ostatnická, Markéta Schreiberová, Linton Corbet
The European Topic Centre on Air Pollution and Climate Change Mitigation (ETC/ACM) is a consortium of European institutes under contract of the European Environment Agency
RIVM UBA‐V ÖKO AEAT EMISIA CHMI NILU INERIS PBL CSIC
Front page picture: Accidental air pollution episode in the vicinity of the World Horticultural Expo, Venlo, The Netherlands, 20 September 2012
©
Guus Velders (2012) & Frank de Leeuw (2012)
Author affiliation: Benno Jimmink, Frank de Leeuw: National Institute for Public Health and the Environment (RIVM), Bilthoven, the Netherlands Jana Ostatnická, Markéta Schreiberová, Linton Corbet: Czech Hydrometeorological Institute (CHMI), Praha, Czech Republic
DISCLAIMER
© ETC/ACM, 2012. ETC/ACM Technical Paper 2012/7 European Topic Centre on Air and Climate Change PO Box 1 3720 BA Bilthoven The Netherlands Phone +31 30 2748562 Fax +31 30 2744433 Email: [email protected] Website http://acm.eionet.europa.eu/
This ETC/ACM Technical Paper has not been subjected to European Environment Agency (EEA) member country review. It does not represent the formal views of the EEA.
ETC/ACM Technical Paper 2012/7 page 3 of 54
Summary
The number of designated zones in 2010 in the EU‐27 (784) was lower than in 2009 (925). The zones designated for pollutants having a health related limit or target value is nearly complete for SO2, NO2 and PM as the zones cover 90% or more of the population. For lead, benzene, CO and ozone population coverage is still lower: in a number of Member States less than 80%. The situation with respect to the Fourth Daughter Directive reporting has further improved in 2010. However, one Member State has not yet defined zones for BaP and in three other Member States the defined zones cover less than 60% of the population. In three Member States, zones for the other pollutants were not covering more than 90% of the entire population.
In 2010 the percentage of zones in Member States where the limit or target value was exceeded, was highest for the daily limit value of PM10 (36%) and the health‐related target value of O3 (34%). For the NO2 annual limit value this percentage was 33%. Compared to 2009, the percentage of zones in exceedance of both the PM10 daily limit value and PM10 annual limit value is about the same in 2010.
The number of PM2.5 monitoring stations had still increased in 2010; nearly all stations also reported data under the Exchange of Information Decision. The designation of stations used for the calculation of the averaged exposure indicator (AEI) is far from complete. The number of (sub)urban background stations is in line with the requirements for determining the AEI. However, at present, the representativeness of the stations for estimating population exposure cannot be judged. Estimates of the exposure concentration obligation (based on all available operational (sub)urban background stations in AirBase) results in levels of more than 20 μg/m3 in 8 Member States. With respect to the annual NO2 limit value, the number, population and area of zones where the limit value is exceeded, hardly change over the years. Meeting the limit value remains a problem in about 65% of the agglomerations and in about 23% of the non‐agglomerations. Compliance with the PM10 daily limit value is improving in the urban agglomerations, as the percentage of agglomerations being in non‐attainment has changed from 80% in 2006 to 40% in 2010. Moreover, in the more rural non‐agglomerations a strong improvement is observed in 2007 compared to 2006. In contrast to the situation in agglomerations which shows a continuously downward tendency, no further improvement is seen in non‐agglomeration zones during the more recent years. For ozone, the situation is improving since 2006 although in 2009 an increase in the area of non‐attainment agglomerations is noted.
ETC/ACM Technical paper 2012/7 page 4 of 54
Table of contents
Summary................................................................................................................................................................. 3
1. Introduction .................................................................................................................................................. 5
1.1. Member State reports addressed......................................................................................................... 5
1.2. Reporting under the Exchange of Information Decision ...................................................................... 6
1.3. Common technical errors in data submission ...................................................................................... 6
2. Designation of zones..................................................................................................................................... 8
3. Air Quality assessments.............................................................................................................................. 13
3.1. Zones in exceedance maps for PM10, O3 and NO2 .............................................................................. 14
3.2. Derogation situations......................................................................................................................... 17
4. Observing an improvement in air quality. ................................................................................................. 22
5. Overview of available information on AEI/PM2.5 ...................................................................................... 25
6. Comparison with EoI information .............................................................................................................. 28
References ............................................................................................................................................................ 32
Annex I: List of forms in AQ questionnaire.......................................................................................................... 33
Annex II. Air Quality Standards ........................................................................................................................... 34
Annex III. Exceedance maps ................................................................................................................................ 36
Annex IV. List of zones in relation to AQ standards ........................................................................................... 51
ETC/ACM Technical Paper 2012/7 page 5 of 54
1. Introduction
This document provides an overview of the annual reports from Member States to the European Commission on the results of the assessment of their air quality in 2010. These national reports have been submitted under the Air Quality Framework Directives1, following Commission Decision 2004/461/EC2, which specifies the information to be sent in detail and provides a set of forms to be filled in. This Decision will further be referred to as ‘the questionnaire’ or, when the context is not directly clear, ‘the AQ questionnaire’. Following the 4th Daughter Directive (4th DD)3, in 2007 the questionnaire was changed to include relevant forms covering monitoring of arsenic (As), nickel (Ni), cadmium (Cd), mercury (Hg), benzo(a)pyrene (BaP) and other polycyclic aromatic hydrocarbons (PAH) in ambient air and deposition. In 2010 further changes were introduced in the questionnaire to enable the communication of information on the application of Articles 15 (on PM2.5) and 22 (on time extension) of Air Quality Directive 2008/50/EC. Forms have been added, enabling the Member States to report on the attainment of the PM2.5 target value. The questionnaire consists of 28 forms (see Annex I) with in total 90 sub‐forms. The updated questionnaire and guidance documents have been made available on the website of DG Environment4. Assessments of the air quality in zones in the EU Member States based on the questionnaire for the years 2001‐2009 are also available on DG Environment’s website4. DG Environment requested the European Environment Agency to compile this report. The European Topic Centre on Air Pollution and Climate Change Mitigation (ETC/ACM) prepared the document. On the incoming questionnaires the ETC/ACM performed a number of quality checks. These checks mainly relate to completeness and consistency (both within the Questionnaire as with the information submitted under the Exchange of Information Decision). Based on the checks country specific feedback reports have been prepared. The Reporting countries have been asked to react on these reports. A summary of the quality procedure is given in section 1.1; a more extensive description is been given in an ETC/ACM Working Paper5.
1.1. Member State reports addressed
This document primarily deals with the reports by the EU Member States on the year 2010 submitted under the Air Quality Framework Directives, and the 4th DD. On a voluntary basis Montenegro, Norway and Iceland submitted a questionnaire; Switzerland provided information on the ozone air quality.
All questionnaires have been uploaded by the reporting countries (RC) on Reportnet CDR (http://cdr.eionet.europa.eu/). In October 2011 the ETC/ACM sent out a mailing request to all contact persons in the RC informing on the outcome of a first review of the submitted
1 Directive 2008/50/EC of the European Parliament and of the Council on ambient air quality and cleaner air for Europe.
Official Journal, L 152 11.6.2008, pp 1‐44 which replaced the former Air Quality Framework Directive 96/62/EC. 2 Commission Decision 2004/461/EC laying down an AQ questionnaire to be used for annual reporting on ambient air
quality assessment under Council Directives 96/62/EC and 1999/30/EC and under Directives 2000/69/EC and 2002/3/EC of the European Parliament and of the Council.
3 EC(2004) Directive 2004/107/EC of the European Parliament and of the Council of 15 December 2004 relating to arsenic, cadmium, mercury, nickel and polycyclic aromatic hydrocarbons in ambient air, Official Journal L23, 26/01/2005, pp 3‐16.
4 http://ec.europa.eu/environment/air/quality/legislation/reporting.htm 5 available from http://acm.eionet.europa.eu/databases/aq‐questionnaire/other_info_aqq.html
ETC/ACM Technical paper 2012/7 page 6 of 54
questionnaires. In this request, several tables summarizing the reporting from the countries were included. In March 2012 a second mailing request was sent to the countries, which focused on possible inconsistencies within the questionnaire itself and within the meta‐information as provided under the Exchange of Information decision (see below 1.2). In both mailing requests the countries were invited to check the summaries which had been provided by the ETC/ACM. A number of countries submitted a revised questionnaire or separate form(s) that had been revised.
1.2. Reporting under the Exchange of Information Decision
The Air Quality Directives focus mainly on compliance checking against the obligations (air quality standards and objectives) they set (see Annex II6). In parallel, reporting countries submit detailed information from their monitoring networks under the Exchange of Information Decision (EoI)7 every year. These reports contain monitoring data for a range of pollutants and measured on different temporal scales. Furthermore, they include extensive complementary information about the monitoring stations (metadata). The ETC/ACM publishes an assessment of these reports (see, for the assessment of the 2010‐data: Mol et al., 2012) annually. To avoid double reporting by countries, some of the data necessary for evaluating the reports under the air quality directives are only required under the EoI Decision. This is particularly the case for the meta‐information on monitoring stations. All monitoring stations used for compliance checking under the AQ Directive have to be included in the set of monitoring stations submitting data under the EoI. The deadline for submitting the EoI information was 1 October 2011. In the assessment of those parts of the questionnaire related to monitoring stations, the information extracted from the EoI has been included.
1.3. Common technical errors in data submission
To facilitate the submission of the required data and information by the countries, the European Commission prepared an AQ questionnaire template in Excel format. This format does not reject erroneous data, and during the processing numerous small errors, e.g. spurious spaces, have to be removed before all reports can be joined in a database. A second form of common errors was the use of other symbols than prescribed in the questionnaire or its guidelines, for example, ticking an “x” or “+” instead of the prescribed “y”; or using a comma as separator while the semi‐colon is prescribed. Although in general the information was unambiguous, a time consuming correction of this type of errors was necessary before the data could automatically be processed. There were also errors in the 2010 data that required more insight in order to correct them. Examples are inconsistent use of zone codes and pollutant codes or use of codes that were not allowed. Another type of error is that reporting countries do not use the same codes for stations in the AQ questionnaire and EoI reports. Reporting countries have always reacted actively on the feedback reports of the ETC/ACM. As a result the quality of the data has been improved over the years.
Disclaimer This report contains summary information based on data delivered before 8 May 2012. Revisions prepared by countries after this date have not been included. In order to enable an automatic processing of the national reports, the ETC/ACM has made a number of (in general editorial) changes in the submitted questionnaires. Mistakes or misinterpretations may have been introduced during
6 For more details see http://ec.europa.eu/environment/air/quality/standards.htm 7 Council Decision 97/101/EC establishing a reciprocal exchange of information and data from network and individual stations measuring ambient air pollution within the Member States (amended by Commission Decision 2001/752/EC).
ETC/ACM Technical paper 2012/7 page 7 of 54
this process. Hence, this report presents an overview of the air quality in the reporting countries but it should not be considered the only source of information for legal compliance checking.
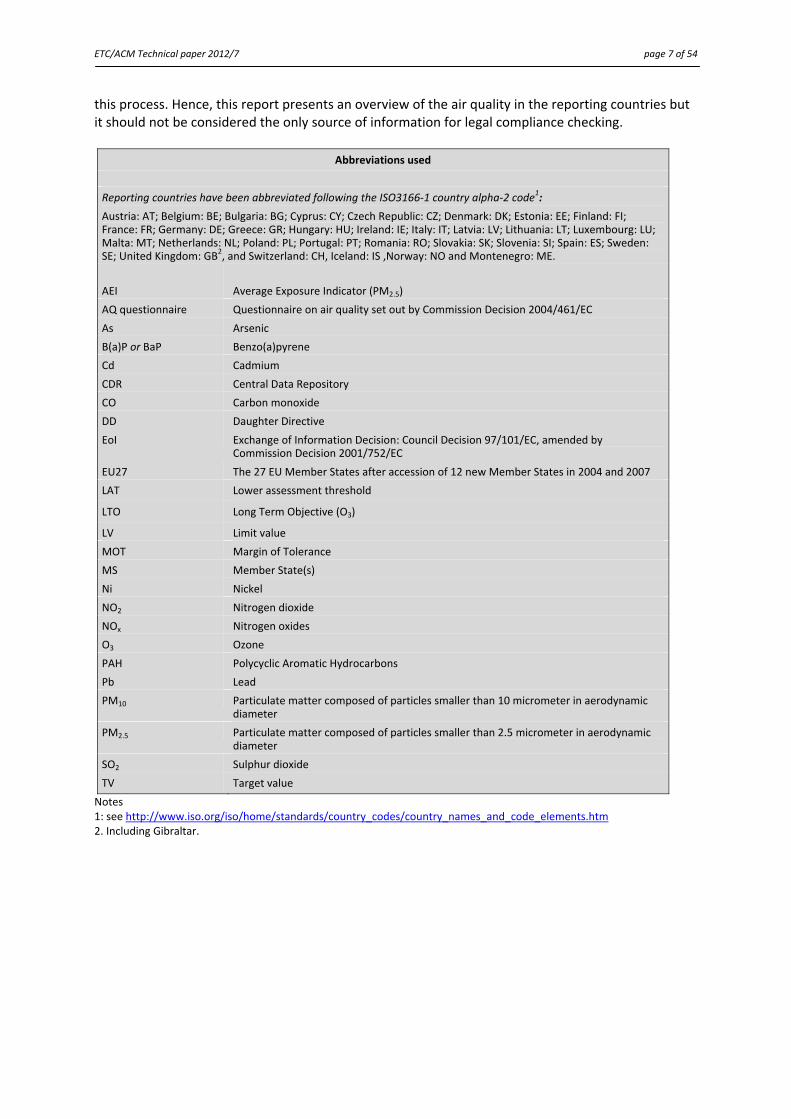
Abbreviations used
Reporting countries have been abbreviated following the ISO3166‐1 country alpha‐2 code1:
Austria: AT; Belgium: BE; Bulgaria: BG; Cyprus: CY; Czech Republic: CZ; Denmark: DK; Estonia: EE; Finland: FI; France: FR; Germany: DE; Greece: GR; Hungary: HU; Ireland: IE; Italy: IT; Latvia: LV; Lithuania: LT; Luxembourg: LU; Malta: MT; Netherlands: NL; Poland: PL; Portugal: PT; Romania: RO; Slovakia: SK; Slovenia: SI; Spain: ES; Sweden: SE; United Kingdom: GB2, and Switzerland: CH, Iceland: IS ,Norway: NO and Montenegro: ME.
AEI Average Exposure Indicator (PM2.5)
AQ questionnaire Questionnaire on air quality set out by Commission Decision 2004/461/EC
As Arsenic
B(a)P or BaP Benzo(a)pyrene
Cd Cadmium
CDR Central Data Repository
CO Carbon monoxide
DD Daughter Directive
EoI Exchange of Information Decision: Council Decision 97/101/EC, amended by Commission Decision 2001/752/EC
EU27 The 27 EU Member States after accession of 12 new Member States in 2004 and 2007
LAT Lower assessment threshold
LTO Long Term Objective (O3)
LV Limit value
MOT Margin of Tolerance
MS Member State(s)
Ni Nickel
NO2 Nitrogen dioxide
NOx Nitrogen oxides
O3 Ozone
PAH Polycyclic Aromatic Hydrocarbons
Pb Lead
PM10 Particulate matter composed of particles smaller than 10 micrometer in aerodynamic diameter
PM2.5 Particulate matter composed of particles smaller than 2.5 micrometer in aerodynamic diameter
SO2 Sulphur dioxide
TV Target value
Notes 1: see http://www.iso.org/iso/home/standards/country_codes/country_names_and_code_elements.htm 2. Including Gibraltar.
ETC/ACM Technical paper 2012/7 page 8 of 54
2. Designation of zones
The countries have designated zones to assess and manage air quality in order to comply with EU‐regulations. To optimize management of air quality due to differences in sources and abatement strategies, the delimitations of zones may differ between pollutants. As the countries are free in defining their own zone structure and characteristics (population and area), the designated zones vary widely, depending on the chosen variable(s): size, population, measured individual pollutant and/or types of protection targets. This complicates mutual comparison of final results between countries.
Table 1 gives an overview of the total number of zones defined for 2010 (Form 2). Compared to reporting year 2009 (de Leeuw et al., 2011) there are various changes in the designation of zones (See also Table 2). 6 Member States have indicated a change in the zone definition for one or more pollutants (Form 0). Romania did not designate zones for B(a)P yet. Belgium, Hungary and Latvia did not yet designate zones for the protection of vegetation for SO2 and NOx and Lithuania for NOx. The lowest number of zones is found for the two objectives related to the protection of vegetation. In relation to the protection of health, the number of zones defined in EU‐27 for NO2 and PM10 – the pollutants showing the largest number of exceedances ‐ tends to be higher (about 680) than for the other pollutants (400‐600). The number of zones defined for the 4th DD‐pollutants is relatively low, 413‐422.
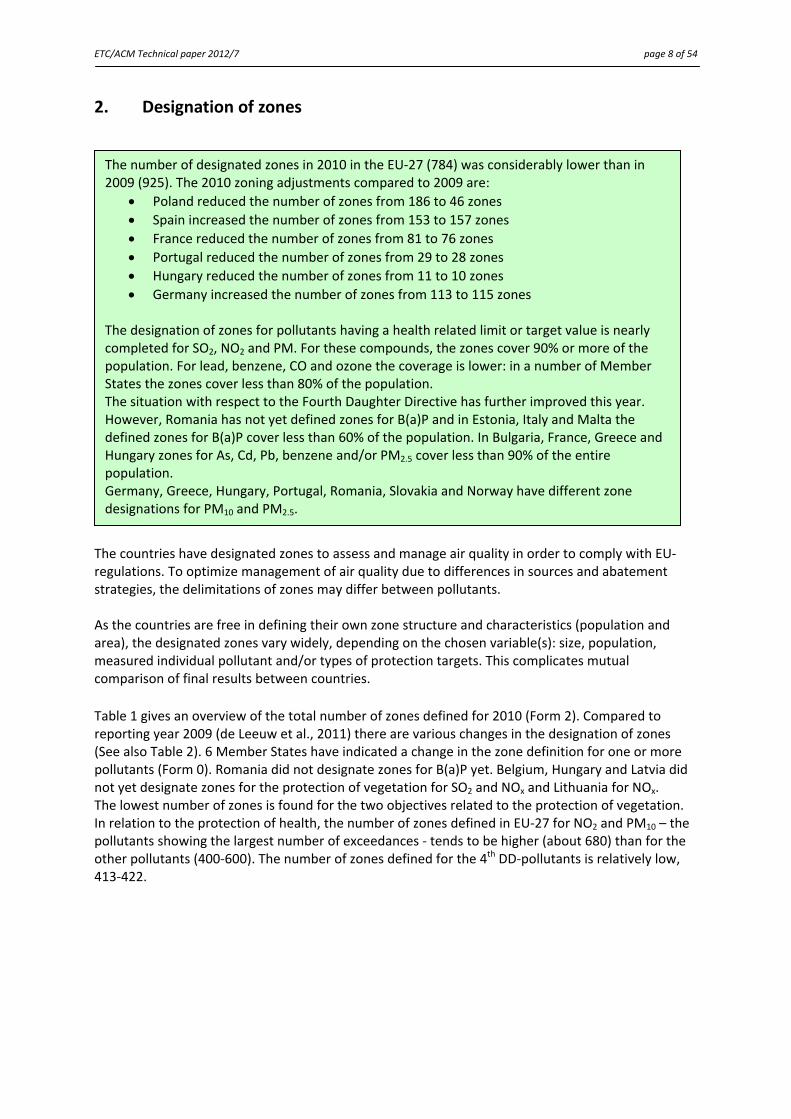
The number of designated zones in 2010 in the EU‐27 (784) was considerably lower than in 2009 (925). The 2010 zoning adjustments compared to 2009 are:
Poland reduced the number of zones from 186 to 46 zones
Spain increased the number of zones from 153 to 157 zones
France reduced the number of zones from 81 to 76 zones
Portugal reduced the number of zones from 29 to 28 zones
Hungary reduced the number of zones from 11 to 10 zones
Germany increased the number of zones from 113 to 115 zones The designation of zones for pollutants having a health related limit or target value is nearly completed for SO2, NO2 and PM. For these compounds, the zones cover 90% or more of the population. For lead, benzene, CO and ozone the coverage is lower: in a number of Member States the zones cover less than 80% of the population. The situation with respect to the Fourth Daughter Directive has further improved this year. However, Romania has not yet defined zones for B(a)P and in Estonia, Italy and Malta the defined zones for B(a)P cover less than 60% of the population. In Bulgaria, France, Greece and Hungary zones for As, Cd, Pb, benzene and/or PM2.5 cover less than 90% of the entire population. Germany, Greece, Hungary, Portugal, Romania, Slovakia and Norway have different zone designations for PM10 and PM2.5.
ETC/ACM Technical paper 2012/7 page 9 of 54
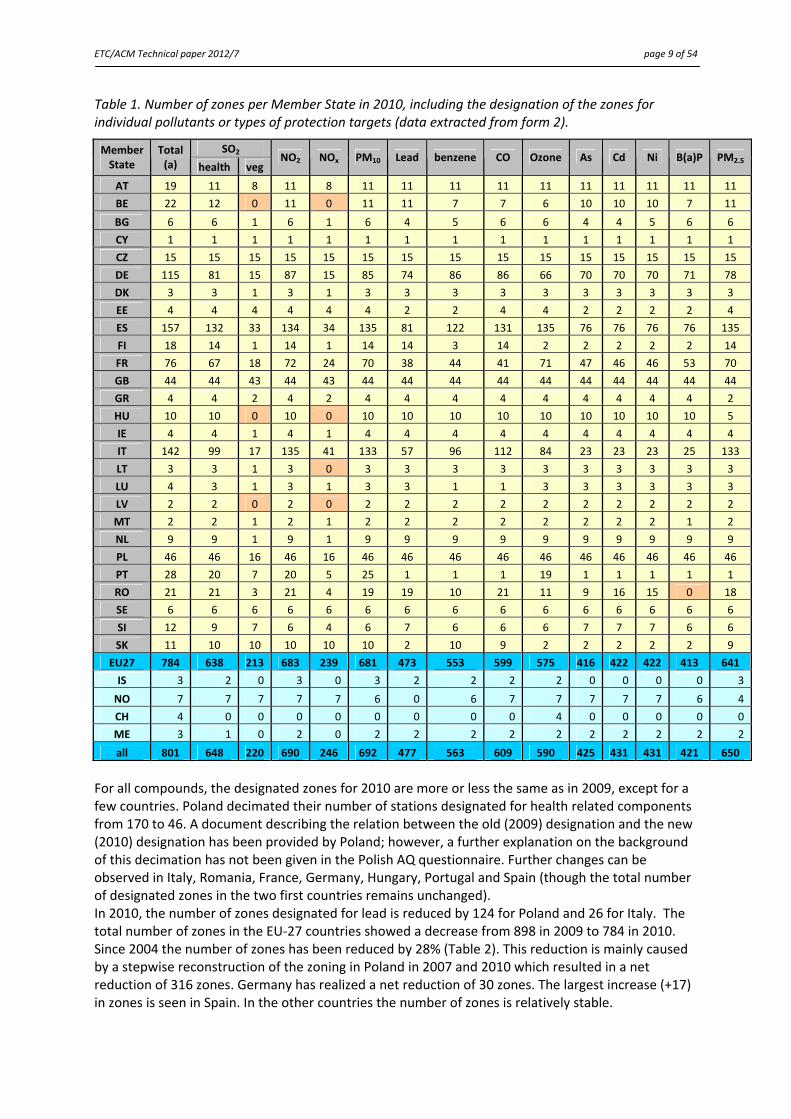
Table 1. Number of zones per Member State in 2010, including the designation of the zones for individual pollutants or types of protection targets (data extracted from form 2).
SO2 Member State
Total (a) health veg
NO2 NOx PM10 Lead benzene CO Ozone As Cd Ni B(a)P PM2.5
AT 19 11 8 11 8 11 11 11 11 11 11 11 11 11 11
BE 22 12 0 11 0 11 11 7 7 6 10 10 10 7 11
BG 6 6 1 6 1 6 4 5 6 6 4 4 5 6 6
CY 1 1 1 1 1 1 1 1 1 1 1 1 1 1 1
CZ 15 15 15 15 15 15 15 15 15 15 15 15 15 15 15
DE 115 81 15 87 15 85 74 86 86 66 70 70 70 71 78
DK 3 3 1 3 1 3 3 3 3 3 3 3 3 3 3
EE 4 4 4 4 4 4 2 2 4 4 2 2 2 2 4
ES 157 132 33 134 34 135 81 122 131 135 76 76 76 76 135
FI 18 14 1 14 1 14 14 3 14 2 2 2 2 2 14
FR 76 67 18 72 24 70 38 44 41 71 47 46 46 53 70
GB 44 44 43 44 43 44 44 44 44 44 44 44 44 44 44
GR 4 4 2 4 2 4 4 4 4 4 4 4 4 4 2
HU 10 10 0 10 0 10 10 10 10 10 10 10 10 10 5
IE 4 4 1 4 1 4 4 4 4 4 4 4 4 4 4
IT 142 99 17 135 41 133 57 96 112 84 23 23 23 25 133
LT 3 3 1 3 0 3 3 3 3 3 3 3 3 3 3
LU 4 3 1 3 1 3 3 1 1 3 3 3 3 3 3
LV 2 2 0 2 0 2 2 2 2 2 2 2 2 2 2
MT 2 2 1 2 1 2 2 2 2 2 2 2 2 1 2
NL 9 9 1 9 1 9 9 9 9 9 9 9 9 9 9
PL 46 46 16 46 16 46 46 46 46 46 46 46 46 46 46
PT 28 20 7 20 5 25 1 1 1 19 1 1 1 1 1
RO 21 21 3 21 4 19 19 10 21 11 9 16 15 0 18
SE 6 6 6 6 6 6 6 6 6 6 6 6 6 6 6
SI 12 9 7 6 4 6 7 6 6 6 7 7 7 6 6
SK 11 10 10 10 10 10 2 10 9 2 2 2 2 2 9
EU27 784 638 213 683 239 681 473 553 599 575 416 422 422 413 641
IS 3 2 0 3 0 3 2 2 2 2 0 0 0 0 3
NO 7 7 7 7 7 6 0 6 7 7 7 7 7 6 4
CH 4 0 0 0 0 0 0 0 0 4 0 0 0 0 0
ME 3 1 0 2 0 2 2 2 2 2 2 2 2 2 2
all 801 648 220 690 246 692 477 563 609 590 425 431 431 421 650
For all compounds, the designated zones for 2010 are more or less the same as in 2009, except for a few countries. Poland decimated their number of stations designated for health related components from 170 to 46. A document describing the relation between the old (2009) designation and the new (2010) designation has been provided by Poland; however, a further explanation on the background of this decimation has not been given in the Polish AQ questionnaire. Further changes can be observed in Italy, Romania, France, Germany, Hungary, Portugal and Spain (though the total number of designated zones in the two first countries remains unchanged). In 2010, the number of zones designated for lead is reduced by 124 for Poland and 26 for Italy. The total number of zones in the EU‐27 countries showed a decrease from 898 in 2009 to 784 in 2010. Since 2004 the number of zones has been reduced by 28% (Table 2). This reduction is mainly caused by a stepwise reconstruction of the zoning in Poland in 2007 and 2010 which resulted in a net reduction of 316 zones. Germany has realized a net reduction of 30 zones. The largest increase (+17) in zones is seen in Spain. In the other countries the number of zones is relatively stable.
ETC/ACM Technical paper 2012/7 page 10 of 54
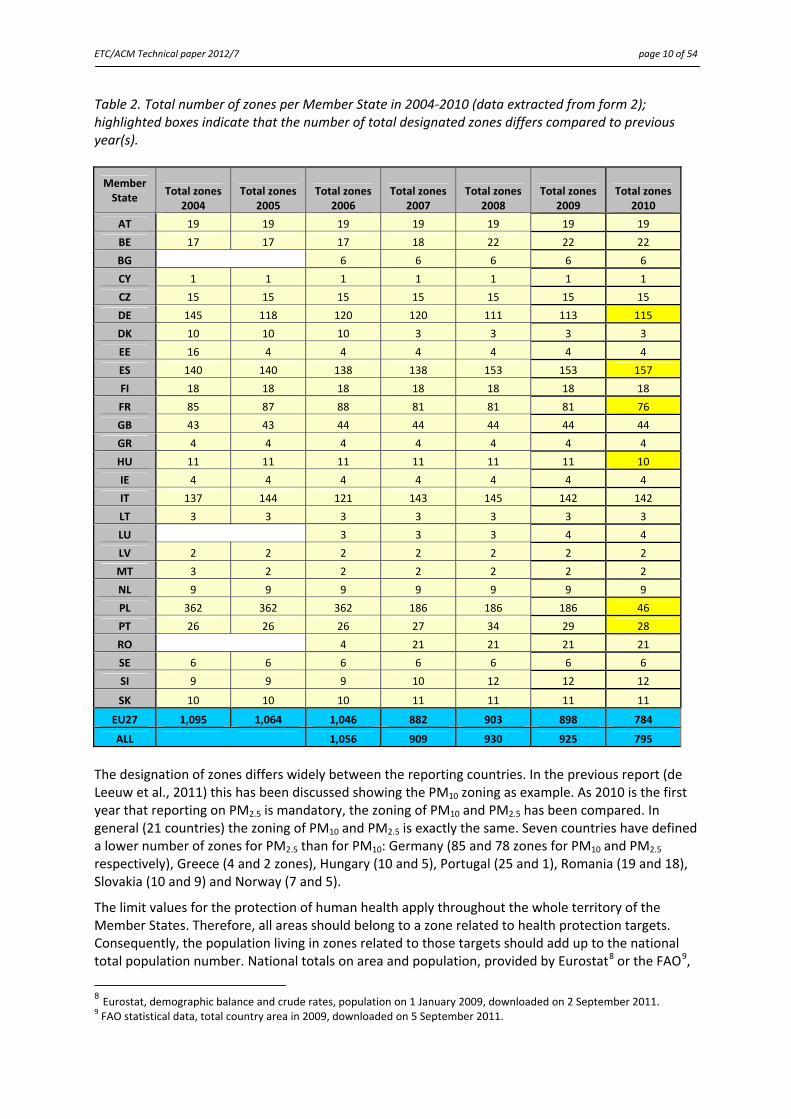
Table 2. Total number of zones per Member State in 2004‐2010 (data extracted from form 2); highlighted boxes indicate that the number of total designated zones differs compared to previous year(s).
Member State
Total zones 2004
Total zones 2005
Total zones 2006
Total zones 2007
Total zones 2008
Total zones 2009
Total zones 2010
AT 19 19 19 19 19 19 19
BE 17 17 17 18 22 22 22
BG 6 6 6 6 6
CY 1 1 1 1 1 1 1
CZ 15 15 15 15 15 15 15
DE 145 118 120 120 111 113 115
DK 10 10 10 3 3 3 3
EE 16 4 4 4 4 4 4
ES 140 140 138 138 153 153 157
FI 18 18 18 18 18 18 18
FR 85 87 88 81 81 81 76
GB 43 43 44 44 44 44 44
GR 4 4 4 4 4 4 4
HU 11 11 11 11 11 11 10
IE 4 4 4 4 4 4 4
IT 137 144 121 143 145 142 142
LT 3 3 3 3 3 3 3
LU 3 3 3 4 4
LV 2 2 2 2 2 2 2
MT 3 2 2 2 2 2 2
NL 9 9 9 9 9 9 9
PL 362 362 362 186 186 186 46
PT 26 26 26 27 34 29 28
RO 4 21 21 21 21
SE 6 6 6 6 6 6 6
SI 9 9 9 10 12 12 12
SK 10 10 10 11 11 11 11
EU27 1,095 1,064 1,046 882 903 898 784
ALL 1,056 909 930 925 795
The designation of zones differs widely between the reporting countries. In the previous report (de Leeuw et al., 2011) this has been discussed showing the PM10 zoning as example. As 2010 is the first year that reporting on PM2.5 is mandatory, the zoning of PM10 and PM2.5 has been compared. In general (21 countries) the zoning of PM10 and PM2.5 is exactly the same. Seven countries have defined a lower number of zones for PM2.5 than for PM10: Germany (85 and 78 zones for PM10 and PM2.5 respectively), Greece (4 and 2 zones), Hungary (10 and 5), Portugal (25 and 1), Romania (19 and 18), Slovakia (10 and 9) and Norway (7 and 5).
The limit values for the protection of human health apply throughout the whole territory of the Member States. Therefore, all areas should belong to a zone related to health protection targets. Consequently, the population living in zones related to those targets should add up to the national total population number. National totals on area and population, provided by Eurostat8 or the FAO9,
8 Eurostat, demographic balance and crude rates, population on 1 January 2009, downloaded on 2 September 2011. 9 FAO statistical data, total country area in 2009, downloaded on 5 September 2011.
ETC/ACM Technical paper 2012/7 page 11 of 54
have been used here as a reference. However, small deviations are to be expected in view of the different information sources and deviating census base years.
Within a deviation of 5%, the total surface area of the health‐related zones indeed added up to the national surface area for most of the reporting countries. For SO2, NO2, PM10 and ozone, the designated zones are in good agreement throughout the entire EU‐27 with deviations only in France (depending on the pollutant 15‐29% of the area is not coveraged) and Italy where the coverage of SO2 zones is 15% too low. For a number of German zones information on population and area is missing; this might causes the systematic underestimation of about 8% in area coverage seen for all pollutant. For the other components the national area is less well covered, although 19 countries are in good agreement. In France, Italy and Estonia, the coverage is less than 80% for nine, seven and five components, respectively.
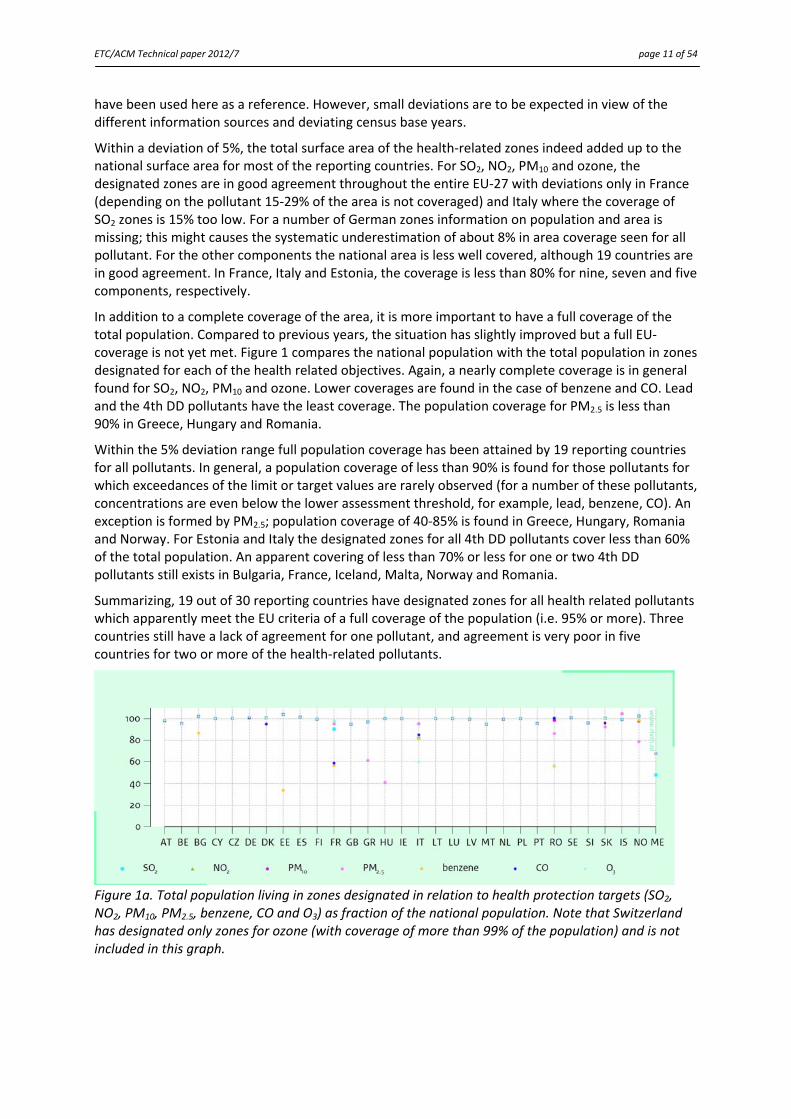
In addition to a complete coverage of the area, it is more important to have a full coverage of the total population. Compared to previous years, the situation has slightly improved but a full EU‐coverage is not yet met. Figure 1 compares the national population with the total population in zones designated for each of the health related objectives. Again, a nearly complete coverage is in general found for SO2, NO2, PM10 and ozone. Lower coverages are found in the case of benzene and CO. Lead and the 4th DD pollutants have the least coverage. The population coverage for PM2.5 is less than 90% in Greece, Hungary and Romania.
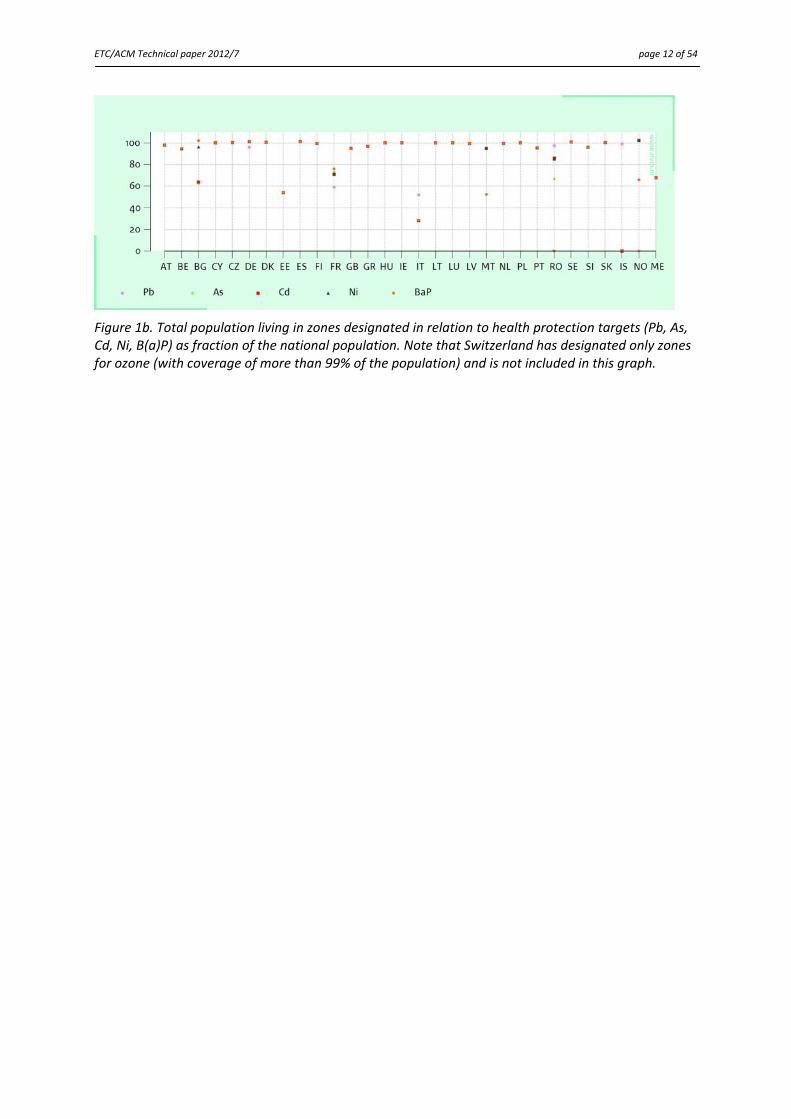
Within the 5% deviation range full population coverage has been attained by 19 reporting countries for all pollutants. In general, a population coverage of less than 90% is found for those pollutants for which exceedances of the limit or target values are rarely observed (for a number of these pollutants, concentrations are even below the lower assessment threshold, for example, lead, benzene, CO). An exception is formed by PM2.5; population coverage of 40‐85% is found in Greece, Hungary, Romania and Norway. For Estonia and Italy the designated zones for all 4th DD pollutants cover less than 60% of the total population. An apparent covering of less than 70% or less for one or two 4th DD pollutants still exists in Bulgaria, France, Iceland, Malta, Norway and Romania.
Summarizing, 19 out of 30 reporting countries have designated zones for all health related pollutants which apparently meet the EU criteria of a full coverage of the population (i.e. 95% or more). Three countries still have a lack of agreement for one pollutant, and agreement is very poor in five countries for two or more of the health‐related pollutants.
Figure 1a. Total population living in zones designated in relation to health protection targets (SO2, NO2, PM10, PM2.5, benzene, CO and O3) as fraction of the national population. Note that Switzerland has designated only zones for ozone (with coverage of more than 99% of the population) and is not included in this graph.
ETC/ACM Technical paper 2012/7 page 12 of 54
Figure 1b. Total population living in zones designated in relation to health protection targets (Pb, As, Cd, Ni, B(a)P) as fraction of the national population. Note that Switzerland has designated only zones for ozone (with coverage of more than 99% of the population) and is not included in this graph.
ETC/ACM Technical paper 2012/7 page 13 of 54
3. Air Quality assessments
If measurements or model calculations indicate that a limit value (or limit value plus margin of tolerance) or a target value is exceeded somewhere in a zone, the whole zone is designated as being in exceedance concerning this threshold. The information presented in this chapter is mainly extracted from forms 2, 8 and 9 of the AQ questionnaire. It focuses on pollutants/protection targets, where compliance poses problems. An overview of the limit and target values is given in Annex II. Please note: The number or percentage of zones in exceedance is a limited indicator for the
actual area in exceedance. First of all, the area in exceedance might be the entire zone or just a few hundred square metres at a hotspot. In addition, some reporting countries have designated a few very large zones for pollutants known to have concentration levels substantially below air quality thresholds in the country. Hence, the number or percentage of zones cannot be used to estimate the area in exceedance or to compare actual population exposure to air pollution between different reporting countries or even between regions within a Member State.
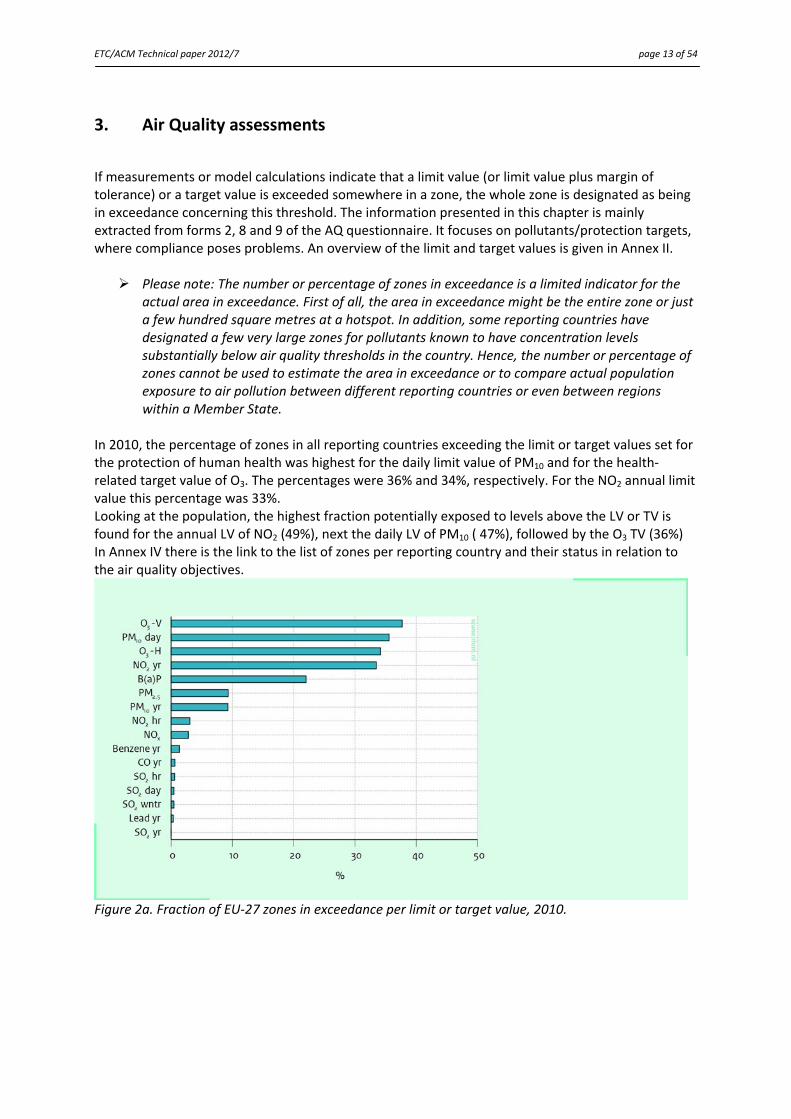
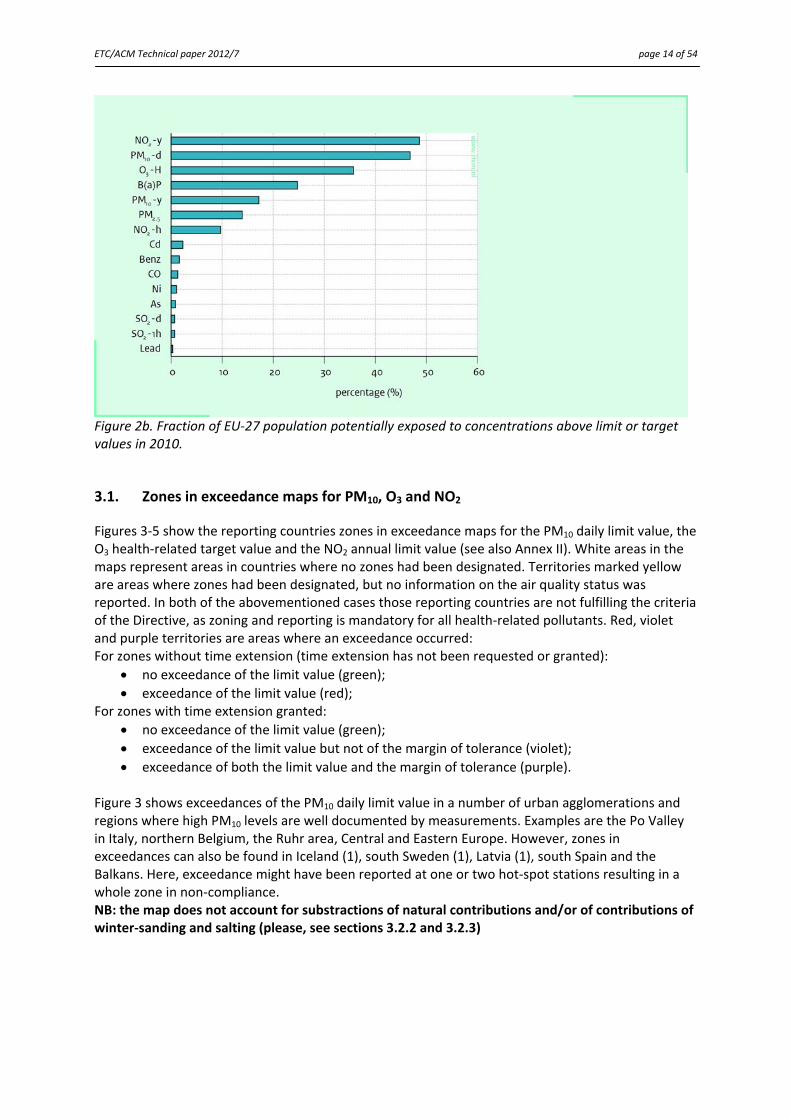
In 2010, the percentage of zones in all reporting countries exceeding the limit or target values set for the protection of human health was highest for the daily limit value of PM10 and for the health‐related target value of O3. The percentages were 36% and 34%, respectively. For the NO2 annual limit value this percentage was 33%. Looking at the population, the highest fraction potentially exposed to levels above the LV or TV is found for the annual LV of NO2 (49%), next the daily LV of PM10 ( 47%), followed by the O3 TV (36%) In Annex IV there is the link to the list of zones per reporting country and their status in relation to the air quality objectives.
Figure 2a. Fraction of EU‐27 zones in exceedance per limit or target value, 2010.
ETC/ACM Technical paper 2012/7 page 14 of 54
Figure 2b. Fraction of EU‐27 population potentially exposed to concentrations above limit or target values in 2010.
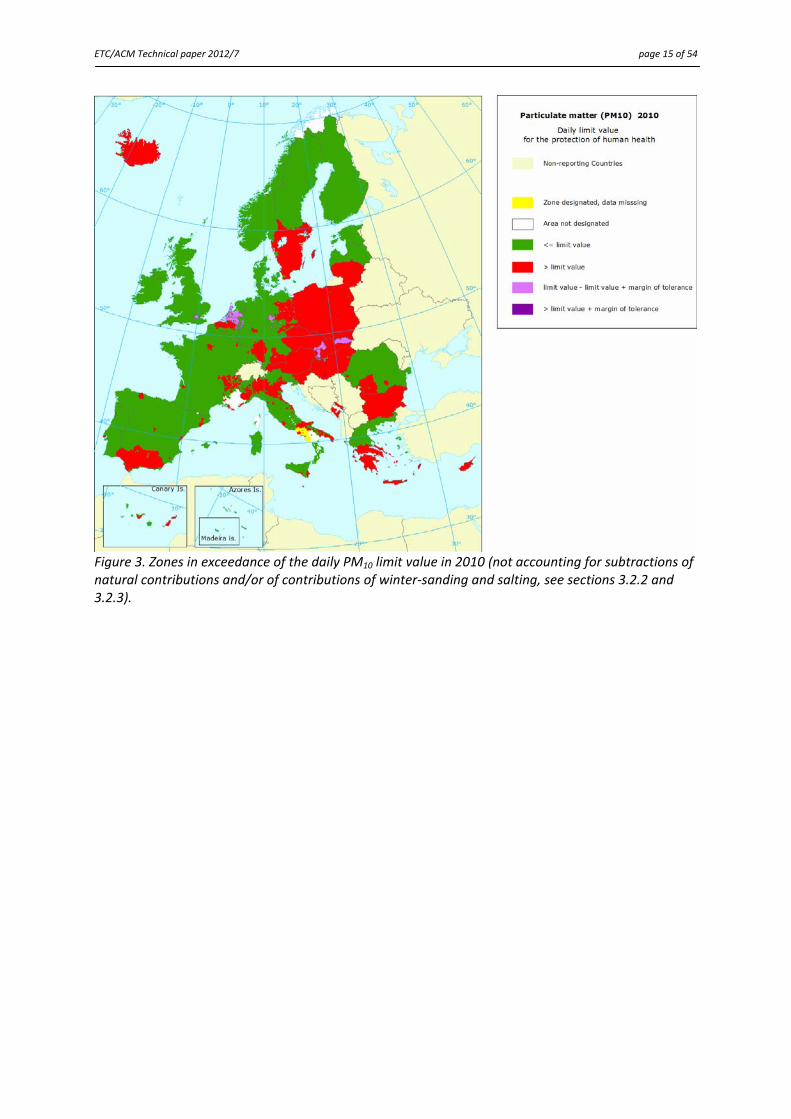
3.1. Zones in exceedance maps for PM10, O3 and NO2
Figures 3‐5 show the reporting countries zones in exceedance maps for the PM10 daily limit value, the O3 health‐related target value and the NO2 annual limit value (see also Annex II). White areas in the maps represent areas in countries where no zones had been designated. Territories marked yellow are areas where zones had been designated, but no information on the air quality status was reported. In both of the abovementioned cases those reporting countries are not fulfilling the criteria of the Directive, as zoning and reporting is mandatory for all health‐related pollutants. Red, violet and purple territories are areas where an exceedance occurred: For zones without time extension (time extension has not been requested or granted):
no exceedance of the limit value (green);
exceedance of the limit value (red); For zones with time extension granted:
no exceedance of the limit value (green);
exceedance of the limit value but not of the margin of tolerance (violet);
exceedance of both the limit value and the margin of tolerance (purple). Figure 3 shows exceedances of the PM10 daily limit value in a number of urban agglomerations and regions where high PM10 levels are well documented by measurements. Examples are the Po Valley in Italy, northern Belgium, the Ruhr area, Central and Eastern Europe. However, zones in exceedances can also be found in Iceland (1), south Sweden (1), Latvia (1), south Spain and the Balkans. Here, exceedance might have been reported at one or two hot‐spot stations resulting in a whole zone in non‐compliance. NB: the map does not account for substractions of natural contributions and/or of contributions of winter‐sanding and salting (please, see sections 3.2.2 and 3.2.3)
ETC/ACM Technical paper 2012/7 page 15 of 54
Figure 3. Zones in exceedance of the daily PM10 limit value in 2010 (not accounting for subtractions of natural contributions and/or of contributions of winter‐sanding and salting, see sections 3.2.2 and 3.2.3).
ETC/ACM Technical paper 2012/7 page 16 of 54
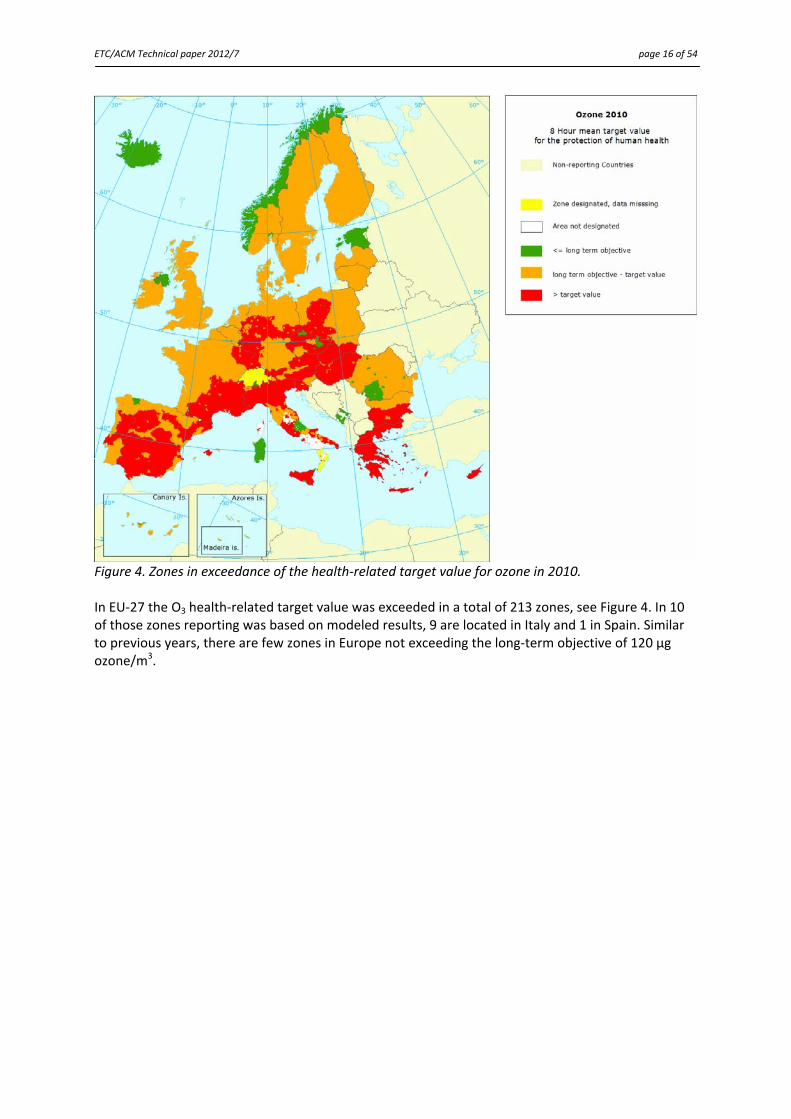
Figure 4. Zones in exceedance of the health‐related target value for ozone in 2010. In EU‐27 the O3 health‐related target value was exceeded in a total of 213 zones, see Figure 4. In 10 of those zones reporting was based on modeled results, 9 are located in Italy and 1 in Spain. Similar to previous years, there are few zones in Europe not exceeding the long‐term objective of 120 µg ozone/m3.

ETC/ACM Technical paper 2012/7 page 17 of 54
Figure 5. Zones in exceedance of the annual limit value for NO2 in 2010. For NO2 the map looks very similar to last year’s. The most agglomeration exceedances of the ALV occur in Germany (59), Italy (47), UK (41) and France (25). For 29 zones in the United Kingdom the reported exceedances are based on modelled results. In the Netherlands all designated zones reported exceedance to the LV, but not the MOT. As the Netherlands were granted time extensions for the annual limit value of NO2 for all zones, they were still compliant to the AQD.
3.2. Derogation situations
In three situations a (temporally) exceedance of the limit value is permitted, according to the AQ Directive 2008/50/EC:
(i) Art. 22 allows under specific conditions a temporally exceedance of the limit value;
(ii) when exceedances are attributable to natural sources (Art. 20); and
(iii) when exceedances are attributable to winter‐sanding or –salting of roads (Art. 21).
3.2.1. Time extensions
Following art. 22 in the AQ Directive, Member States having particular difficulties in achieving compliance with the limit values for particulate matter (PM10), nitrogen dioxide or benzene, may request the Commission for a postponement of attainment by a maximum of five years (NO2 and benzene) or an exemption of the obligation of appliance up to three years (PM10). During those
ETC/ACM Technical paper 2012/7 page 18 of 54
periods the limit values continue to apply plus a margin of tolerance. Derogation is given for individual zones; in all other zones compliance with limit values is required.
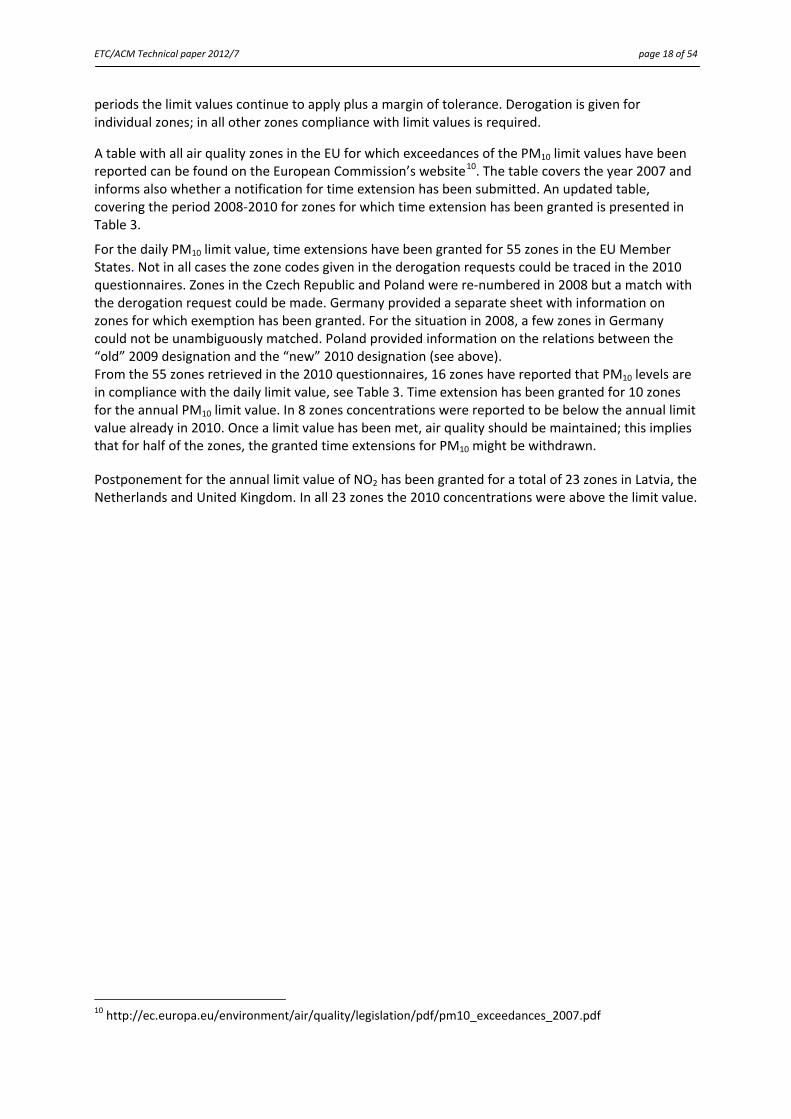
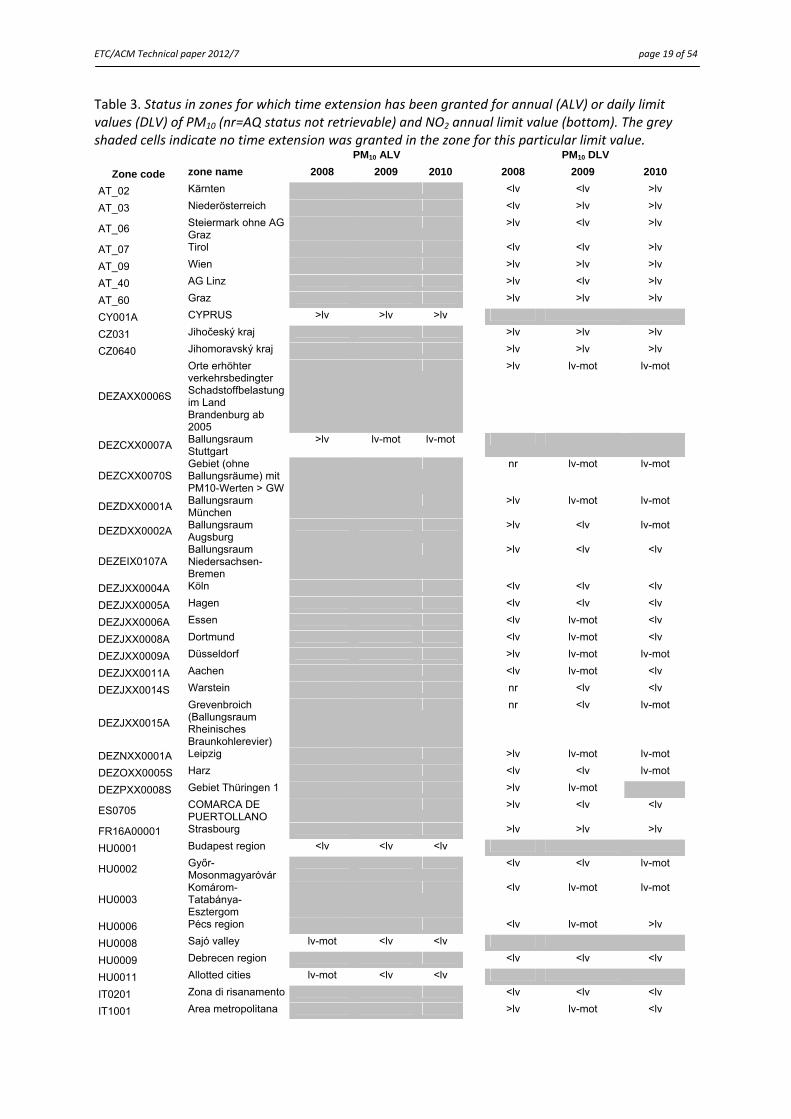
A table with all air quality zones in the EU for which exceedances of the PM10 limit values have been reported can be found on the European Commission’s website10. The table covers the year 2007 and informs also whether a notification for time extension has been submitted. An updated table, covering the period 2008‐2010 for zones for which time extension has been granted is presented in Table 3.
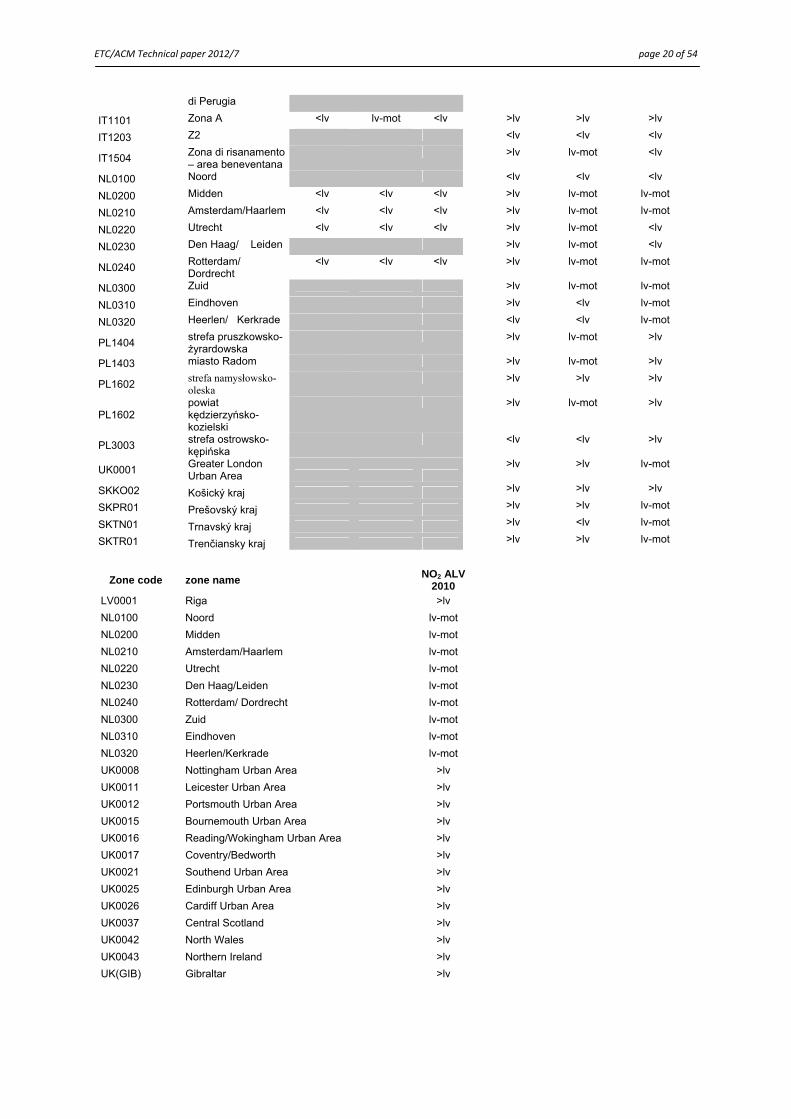
For the daily PM10 limit value, time extensions have been granted for 55 zones in the EU Member States. Not in all cases the zone codes given in the derogation requests could be traced in the 2010 questionnaires. Zones in the Czech Republic and Poland were re‐numbered in 2008 but a match with the derogation request could be made. Germany provided a separate sheet with information on zones for which exemption has been granted. For the situation in 2008, a few zones in Germany could not be unambiguously matched. Poland provided information on the relations between the “old” 2009 designation and the “new” 2010 designation (see above). From the 55 zones retrieved in the 2010 questionnaires, 16 zones have reported that PM10 levels are in compliance with the daily limit value, see Table 3. Time extension has been granted for 10 zones for the annual PM10 limit value. In 8 zones concentrations were reported to be below the annual limit value already in 2010. Once a limit value has been met, air quality should be maintained; this implies that for half of the zones, the granted time extensions for PM10 might be withdrawn.
Postponement for the annual limit value of NO2 has been granted for a total of 23 zones in Latvia, the Netherlands and United Kingdom. In all 23 zones the 2010 concentrations were above the limit value.
10 http://ec.europa.eu/environment/air/quality/legislation/pdf/pm10_exceedances_2007.pdf
ETC/ACM Technical paper 2012/7 page 19 of 54
Table 3. Status in zones for which time extension has been granted for annual (ALV) or daily limit values (DLV) of PM10 (nr=AQ status not retrievable) and NO2 annual limit value (bottom). The grey shaded cells indicate no time extension was granted in the zone for this particular limit value. PM10 ALV PM10 DLV
Zone code zone name 2008 2009 2010 2008 2009 2010
AT_02 Kärnten <lv <lv >lv
AT_03 Niederösterreich <lv >lv >lv
AT_06 Steiermark ohne AG Graz
>lv <lv >lv
AT_07 Tirol <lv <lv >lv
AT_09 Wien >lv >lv >lv
AT_40 AG Linz >lv <lv >lv
AT_60 Graz >lv >lv >lv
CY001A CYPRUS >lv >lv >lv
CZ031 Jihočeský kraj >lv >lv >lv
CZ0640 Jihomoravský kraj >lv >lv >lv
DEZAXX0006S
Orte erhöhter verkehrsbedingter Schadstoffbelastung im Land Brandenburg ab 2005
>lv lv-mot lv-mot
DEZCXX0007A Ballungsraum Stuttgart
>lv lv-mot lv-mot
DEZCXX0070S Gebiet (ohne Ballungsräume) mit PM10-Werten > GW
nr lv-mot lv-mot
DEZDXX0001A Ballungsraum München
>lv lv-mot lv-mot
DEZDXX0002A Ballungsraum Augsburg
>lv <lv lv-mot
DEZEIX0107A Ballungsraum Niedersachsen-Bremen
>lv <lv <lv
DEZJXX0004A Köln <lv <lv <lv
DEZJXX0005A Hagen <lv <lv <lv
DEZJXX0006A Essen <lv lv-mot <lv
DEZJXX0008A Dortmund <lv lv-mot <lv
DEZJXX0009A Düsseldorf >lv lv-mot lv-mot
DEZJXX0011A Aachen <lv lv-mot <lv
DEZJXX0014S Warstein nr <lv <lv
DEZJXX0015A
Grevenbroich (Ballungsraum Rheinisches Braunkohlerevier)
nr <lv lv-mot
DEZNXX0001A Leipzig >lv lv-mot lv-mot
DEZOXX0005S Harz <lv <lv lv-mot
DEZPXX0008S Gebiet Thüringen 1 >lv lv-mot
ES0705 COMARCA DE PUERTOLLANO
>lv <lv <lv
FR16A00001 Strasbourg >lv >lv >lv
HU0001 Budapest region <lv <lv <lv
HU0002 Győr-Mosonmagyaróvár
<lv <lv lv-mot
HU0003 Komárom-Tatabánya-Esztergom
<lv lv-mot lv-mot
HU0006 Pécs region <lv lv-mot >lv
HU0008 Sajó valley lv-mot <lv <lv
HU0009 Debrecen region <lv <lv <lv
HU0011 Allotted cities lv-mot <lv <lv
IT0201 Zona di risanamento <lv <lv <lv
IT1001 Area metropolitana >lv lv-mot <lv
ETC/ACM Technical paper 2012/7 page 20 of 54
di Perugia
IT1101 Zona A <lv lv-mot <lv >lv >lv >lv
IT1203 Z2 <lv <lv <lv
IT1504 Zona di risanamento – area beneventana
>lv lv-mot <lv
NL0100 Noord <lv <lv <lv
NL0200 Midden <lv <lv <lv >lv lv-mot lv-mot
NL0210 Amsterdam/Haarlem <lv <lv <lv >lv lv-mot lv-mot
NL0220 Utrecht <lv <lv <lv >lv lv-mot <lv
NL0230 Den Haag/ Leiden >lv lv-mot <lv
NL0240 Rotterdam/ Dordrecht
<lv <lv <lv >lv lv-mot lv-mot
NL0300 Zuid >lv lv-mot lv-mot
NL0310 Eindhoven >lv <lv lv-mot
NL0320 Heerlen/ Kerkrade <lv <lv lv-mot
PL1404 strefa pruszkowsko-żyrardowska
>lv lv-mot >lv
PL1403 miasto Radom >lv lv-mot >lv
PL1602 strefa namysłowsko-oleska
>lv >lv >lv
PL1602 powiat kędzierzyńsko-kozielski
>lv lv-mot >lv
PL3003 strefa ostrowsko-kępińska
<lv <lv >lv
UK0001 Greater London Urban Area
>lv >lv lv-mot
SKKO02 Košický kraj >lv >lv >lv
SKPR01 Prešovský kraj >lv >lv lv-mot
SKTN01 Trnavský kraj >lv <lv lv-mot
SKTR01 Trenčiansky kraj >lv >lv lv-mot
Zone code zone name NO2 ALV
2010 LV0001 Riga >lv
NL0100 Noord lv-mot
NL0200 Midden lv-mot
NL0210 Amsterdam/Haarlem lv-mot
NL0220 Utrecht lv-mot
NL0230 Den Haag/Leiden lv-mot
NL0240 Rotterdam/ Dordrecht lv-mot
NL0300 Zuid lv-mot
NL0310 Eindhoven lv-mot
NL0320 Heerlen/Kerkrade lv-mot
UK0008 Nottingham Urban Area >lv
UK0011 Leicester Urban Area >lv
UK0012 Portsmouth Urban Area >lv
UK0015 Bournemouth Urban Area >lv
UK0016 Reading/Wokingham Urban Area >lv
UK0017 Coventry/Bedworth >lv
UK0021 Southend Urban Area >lv
UK0025 Edinburgh Urban Area >lv
UK0026 Cardiff Urban Area >lv
UK0037 Central Scotland >lv
UK0042 North Wales >lv
UK0043 Northern Ireland >lv
UK(GIB) Gibraltar >lv
ETC/ACM Technical paper 2012/7 page 21 of 54
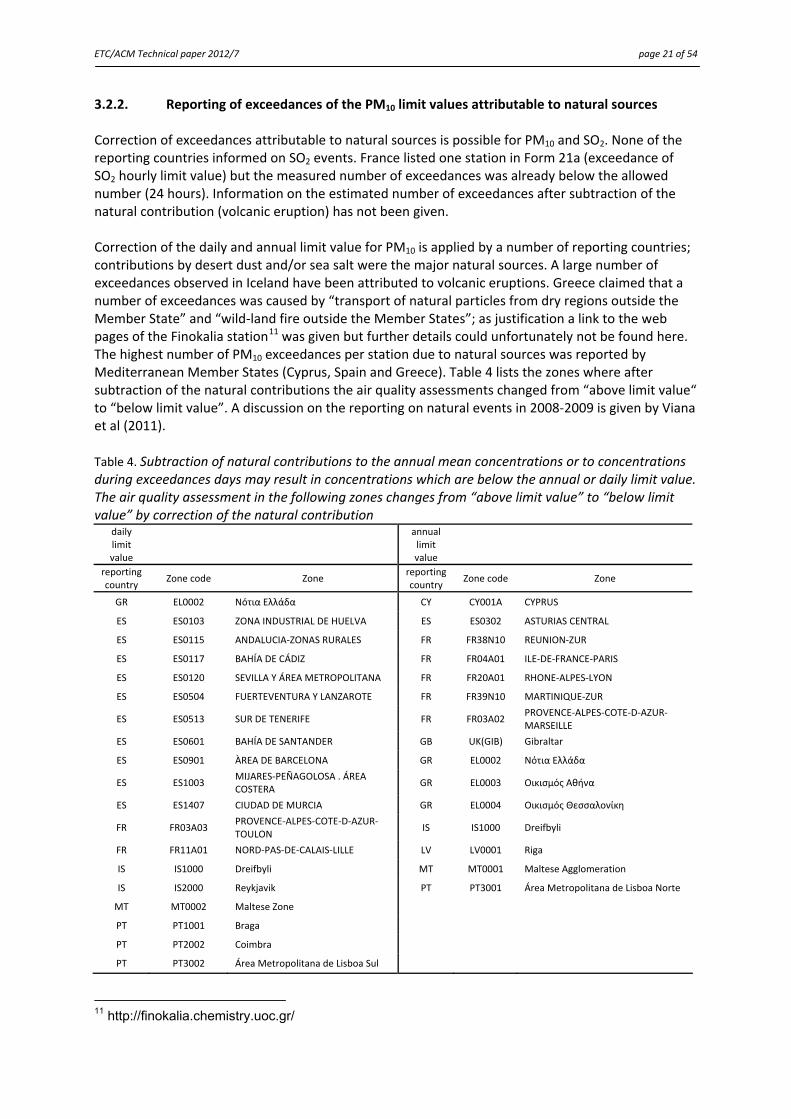
3.2.2. Reporting of exceedances of the PM10 limit values attributable to natural sources Correction of exceedances attributable to natural sources is possible for PM10 and SO2. None of the reporting countries informed on SO2 events. France listed one station in Form 21a (exceedance of SO2 hourly limit value) but the measured number of exceedances was already below the allowed number (24 hours). Information on the estimated number of exceedances after subtraction of the natural contribution (volcanic eruption) has not been given. Correction of the daily and annual limit value for PM10 is applied by a number of reporting countries; contributions by desert dust and/or sea salt were the major natural sources. A large number of exceedances observed in Iceland have been attributed to volcanic eruptions. Greece claimed that a number of exceedances was caused by “transport of natural particles from dry regions outside the Member State” and “wild‐land fire outside the Member States”; as justification a link to the web pages of the Finokalia station11 was given but further details could unfortunately not be found here. The highest number of PM10 exceedances per station due to natural sources was reported by Mediterranean Member States (Cyprus, Spain and Greece). Table 4 lists the zones where after subtraction of the natural contributions the air quality assessments changed from “above limit value“ to “below limit value”. A discussion on the reporting on natural events in 2008‐2009 is given by Viana et al (2011). Table 4. Subtraction of natural contributions to the annual mean concentrations or to concentrations during exceedances days may result in concentrations which are below the annual or daily limit value. The air quality assessment in the following zones changes from “above limit value” to “below limit value” by correction of the natural contribution
daily limit value
annual limit value
reporting country
Zone code Zone reporting country
Zone code Zone
GR EL0002 Νότια Ελλάδα CY CY001A CYPRUS
ES ES0103 ZONA INDUSTRIAL DE HUELVA ES ES0302 ASTURIAS CENTRAL
ES ES0115 ANDALUCIA‐ZONAS RURALES FR FR38N10 REUNION‐ZUR
ES ES0117 BAHÍA DE CÁDIZ FR FR04A01 ILE‐DE‐FRANCE‐PARIS
ES ES0120 SEVILLA Y ÁREA METROPOLITANA FR FR20A01 RHONE‐ALPES‐LYON
ES ES0504 FUERTEVENTURA Y LANZAROTE FR FR39N10 MARTINIQUE‐ZUR
ES ES0513 SUR DE TENERIFE FR FR03A02 PROVENCE‐ALPES‐COTE‐D‐AZUR‐MARSEILLE
ES ES0601 BAHÍA DE SANTANDER GB UK(GIB) Gibraltar
ES ES0901 ÀREA DE BARCELONA GR EL0002 Νότια Ελλάδα
ES ES1003 MIJARES‐PEÑAGOLOSA . ÁREA COSTERA
GR EL0003 Οικισμός Αθήνα
ES ES1407 CIUDAD DE MURCIA GR EL0004 Οικισμός Θεσσαλονίκη
FR FR03A03 PROVENCE‐ALPES‐COTE‐D‐AZUR‐TOULON
IS IS1000 Dreifbyli
FR FR11A01 NORD‐PAS‐DE‐CALAIS‐LILLE LV LV0001 Riga
IS IS1000 Dreifbyli MT MT0001 Maltese Agglomeration
IS IS2000 Reykjavik PT PT3001 Área Metropolitana de Lisboa Norte
MT MT0002 Maltese Zone
PT PT1001 Braga
PT PT2002 Coimbra
PT PT3002 Área Metropolitana de Lisboa Sul
11 http://finokalia.chemistry.uoc.gr/
ETC/ACM Technical paper 2012/7 page 22 of 54
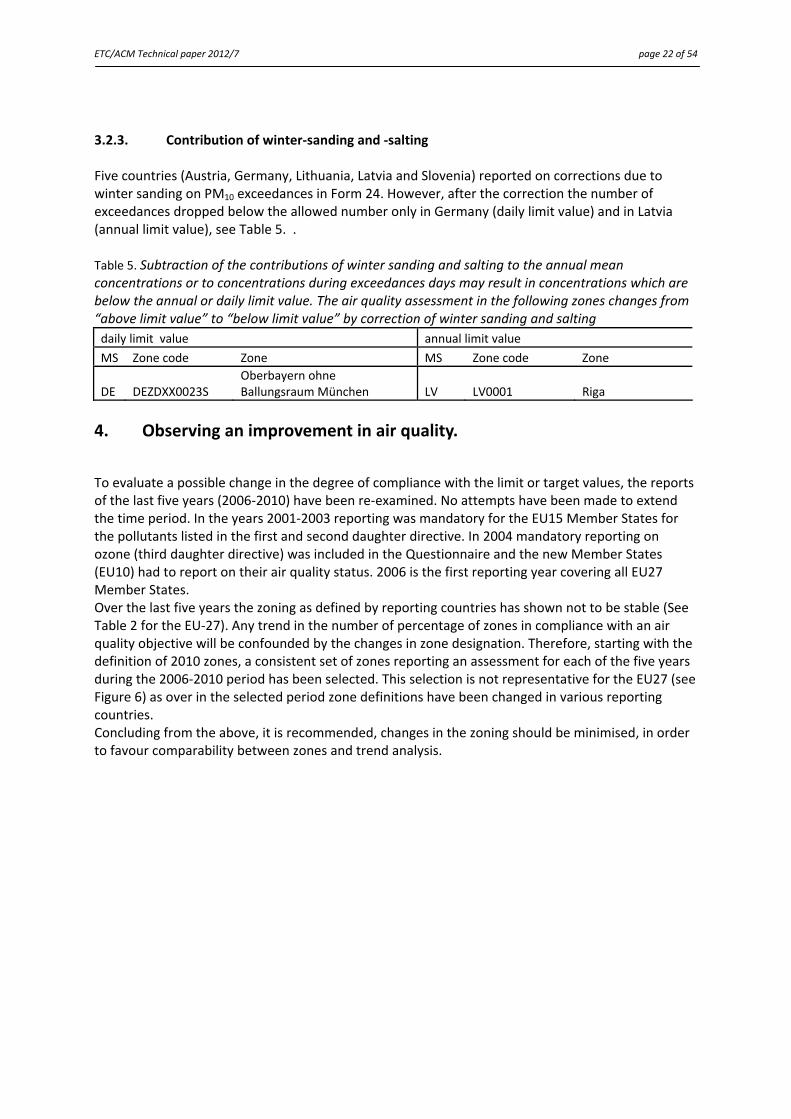
3.2.3. Contribution of winter‐sanding and ‐salting Five countries (Austria, Germany, Lithuania, Latvia and Slovenia) reported on corrections due to winter sanding on PM10 exceedances in Form 24. However, after the correction the number of exceedances dropped below the allowed number only in Germany (daily limit value) and in Latvia (annual limit value), see Table 5. . Table 5. Subtraction of the contributions of winter sanding and salting to the annual mean concentrations or to concentrations during exceedances days may result in concentrations which are below the annual or daily limit value. The air quality assessment in the following zones changes from “above limit value” to “below limit value” by correction of winter sanding and salting
daily limit value annual limit value
MS Zone code Zone MS Zone code Zone
DE DEZDXX0023S Oberbayern ohne Ballungsraum München LV LV0001 Riga
4. Observing an improvement in air quality.
To evaluate a possible change in the degree of compliance with the limit or target values, the reports of the last five years (2006‐2010) have been re‐examined. No attempts have been made to extend the time period. In the years 2001‐2003 reporting was mandatory for the EU15 Member States for the pollutants listed in the first and second daughter directive. In 2004 mandatory reporting on ozone (third daughter directive) was included in the Questionnaire and the new Member States (EU10) had to report on their air quality status. 2006 is the first reporting year covering all EU27 Member States. Over the last five years the zoning as defined by reporting countries has shown not to be stable (See Table 2 for the EU‐27). Any trend in the number of percentage of zones in compliance with an air quality objective will be confounded by the changes in zone designation. Therefore, starting with the definition of 2010 zones, a consistent set of zones reporting an assessment for each of the five years during the 2006‐2010 period has been selected. This selection is not representative for the EU27 (see Figure 6) as over in the selected period zone definitions have been changed in various reporting countries. Concluding from the above, it is recommended, changes in the zoning should be minimised, in order to favour comparability between zones and trend analysis.
ETC/ACM Technical paper 2012/7 page 23 of 54
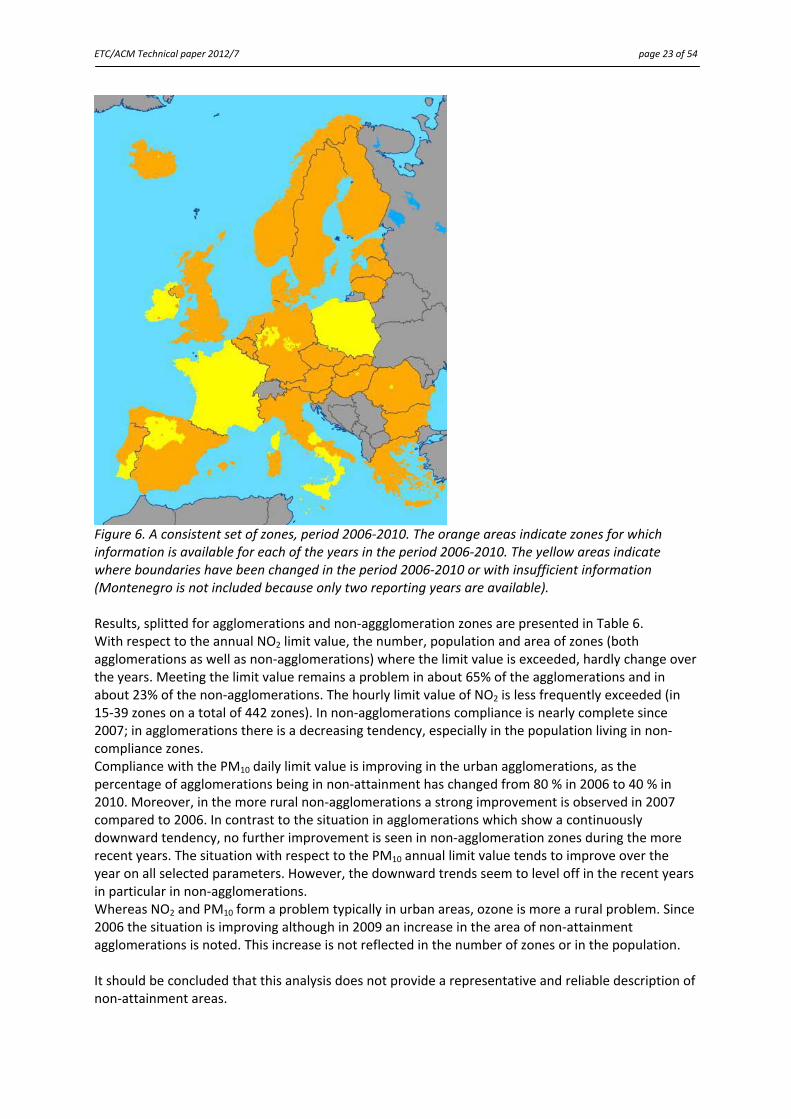
Figure 6. A consistent set of zones, period 2006‐2010. The orange areas indicate zones for which information is available for each of the years in the period 2006‐2010. The yellow areas indicate where boundaries have been changed in the period 2006‐2010 or with insufficient information (Montenegro is not included because only two reporting years are available). Results, splitted for agglomerations and non‐aggglomeration zones are presented in Table 6. With respect to the annual NO2 limit value, the number, population and area of zones (both agglomerations as well as non‐agglomerations) where the limit value is exceeded, hardly change over the years. Meeting the limit value remains a problem in about 65% of the agglomerations and in about 23% of the non‐agglomerations. The hourly limit value of NO2 is less frequently exceeded (in 15‐39 zones on a total of 442 zones). In non‐agglomerations compliance is nearly complete since 2007; in agglomerations there is a decreasing tendency, especially in the population living in non‐compliance zones. Compliance with the PM10 daily limit value is improving in the urban agglomerations, as the percentage of agglomerations being in non‐attainment has changed from 80 % in 2006 to 40 % in 2010. Moreover, in the more rural non‐agglomerations a strong improvement is observed in 2007 compared to 2006. In contrast to the situation in agglomerations which show a continuously downward tendency, no further improvement is seen in non‐agglomeration zones during the more recent years. The situation with respect to the PM10 annual limit value tends to improve over the year on all selected parameters. However, the downward trends seem to level off in the recent years in particular in non‐agglomerations. Whereas NO2 and PM10 form a problem typically in urban areas, ozone is more a rural problem. Since 2006 the situation is improving although in 2009 an increase in the area of non‐attainment agglomerations is noted. This increase is not reflected in the number of zones or in the population. It should be concluded that this analysis does not provide a representative and reliable description of non‐attainment areas.
ETC/ACM Technical paper 2012/7 page 24 of 54
It should be stressed that the shortcomings discussed in the current approach (that is, the selected set is not representative for the EU27 and the binary approach (compliance versus non‐compliance) in a zone does not reflect the actual exposure of the population) also hamper this discussion on (possible) trends.
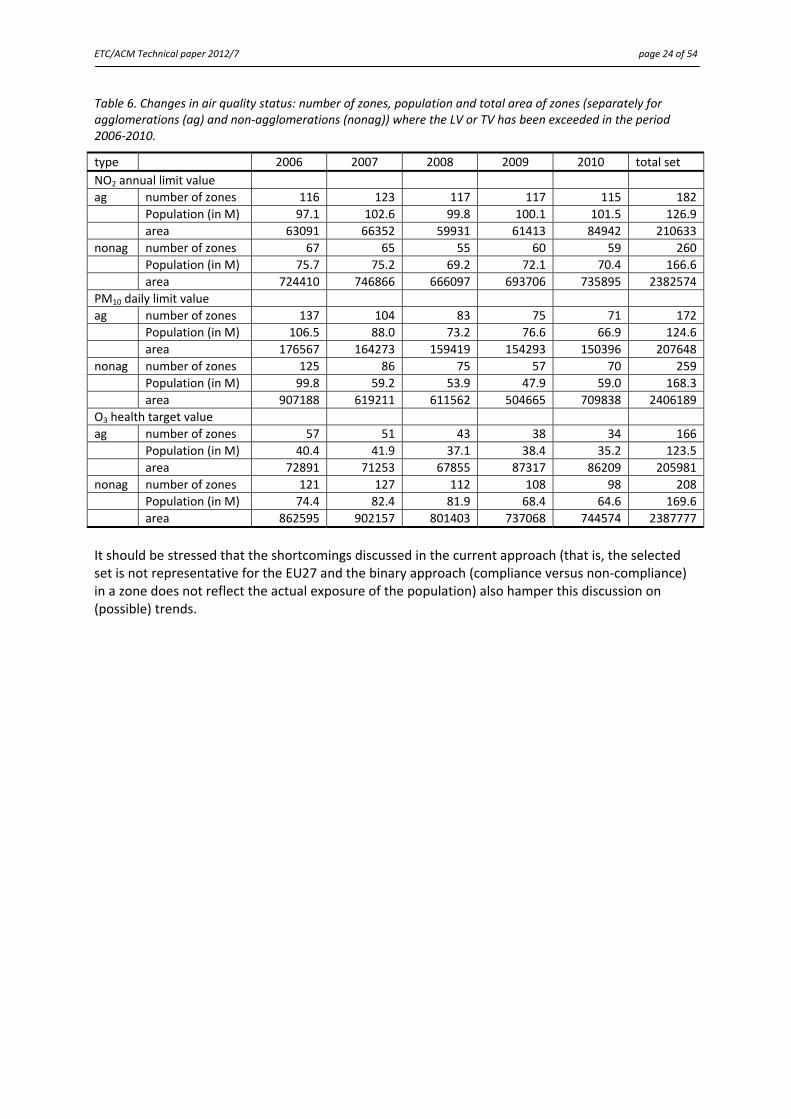
Table 6. Changes in air quality status: number of zones, population and total area of zones (separately for agglomerations (ag) and non‐agglomerations (nonag)) where the LV or TV has been exceeded in the period 2006‐2010.
type 2006 2007 2008 2009 2010 total set
NO2 annual limit value
ag number of zones 116 123 117 117 115 182
Population (in M) 97.1 102.6 99.8 100.1 101.5 126.9
area 63091 66352 59931 61413 84942 210633
nonag number of zones 67 65 55 60 59 260
Population (in M) 75.7 75.2 69.2 72.1 70.4 166.6
area 724410 746866 666097 693706 735895 2382574
PM10 daily limit value
ag number of zones 137 104 83 75 71 172
Population (in M) 106.5 88.0 73.2 76.6 66.9 124.6
area 176567 164273 159419 154293 150396 207648
nonag number of zones 125 86 75 57 70 259
Population (in M) 99.8 59.2 53.9 47.9 59.0 168.3
area 907188 619211 611562 504665 709838 2406189
O3 health target value
ag number of zones 57 51 43 38 34 166
Population (in M) 40.4 41.9 37.1 38.4 35.2 123.5
area 72891 71253 67855 87317 86209 205981
nonag number of zones 121 127 112 108 98 208
Population (in M) 74.4 82.4 81.9 68.4 64.6 169.6
area 862595 902157 801403 737068 744574 2387777
ETC/ACM Technical paper 2012/7 page 25 of 54
5. Overview of available information on AEI/PM2.5
This chapter gives a preliminary overview of the PM2.5 information reported by the reporting countries in their annual questionnaire and EoI submission. For the first time, PM2.5 reporting is mandatory for 2010 data. An overview of the PM monitoring networks in the reporting countries is presented in Table 7 (extracted from Form 3).
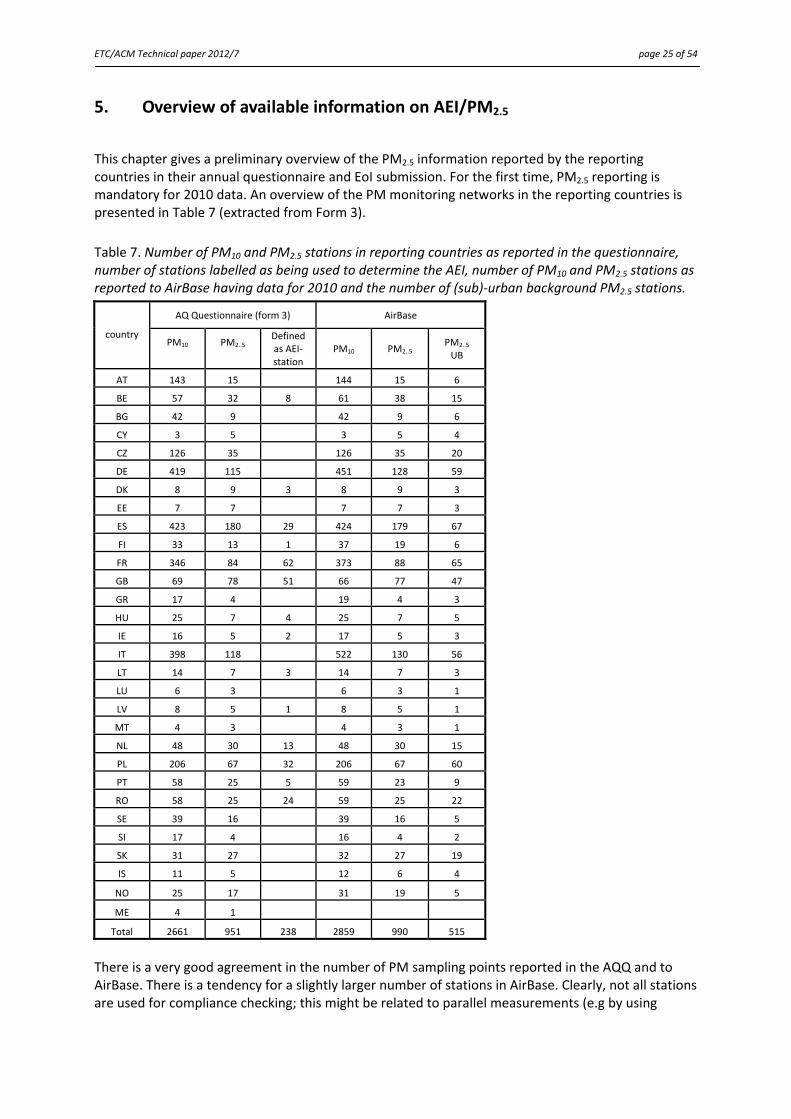
Table 7. Number of PM10 and PM2.5 stations in reporting countries as reported in the questionnaire, number of stations labelled as being used to determine the AEI, number of PM10 and PM2.5 stations as reported to AirBase having data for 2010 and the number of (sub)‐urban background PM2.5 stations.
AQ Questionnaire (form 3) AirBase
country PM10
PM2..5
Defined as AEI‐station
PM10 PM2..5 PM2..5 UB
AT 143 15 144 15 6
BE 57 32 8 61 38 15
BG 42 9 42 9 6
CY 3 5 3 5 4
CZ 126 35 126 35 20
DE 419 115 451 128 59
DK 8 9 3 8 9 3
EE 7 7 7 7 3
ES 423 180 29 424 179 67
FI 33 13 1 37 19 6
FR 346 84 62 373 88 65
GB 69 78 51 66 77 47
GR 17 4 19 4 3
HU 25 7 4 25 7 5
IE 16 5 2 17 5 3
IT 398 118 522 130 56
LT 14 7 3 14 7 3
LU 6 3 6 3 1
LV 8 5 1 8 5 1
MT 4 3 4 3 1
NL 48 30 13 48 30 15
PL 206 67 32 206 67 60
PT 58 25 5 59 23 9
RO 58 25 24 59 25 22
SE 39 16 39 16 5
SI 17 4 16 4 2
SK 31 27 32 27 19
IS 11 5 12 6 4
NO 25 17 31 19 5
ME 4 1
Total 2661 951 238 2859 990 515
There is a very good agreement in the number of PM sampling points reported in the AQQ and to AirBase. There is a tendency for a slightly larger number of stations in AirBase. Clearly, not all stations are used for compliance checking; this might be related to parallel measurements (e.g by using
ETC/ACM Technical paper 2012/7 page 26 of 54
different sampling methods) at one station. Italy forms an exception with 124 additional stations reporting under the EoI. Large differences are found in the PM‐networks. Only in Cyprus, Denmark and the United Kingdom the number of PM2.5 stations exceeded the number of PM10 stations. The criteria set in the directive that the total number of PM2.5 and PM10 sampling points shall not differ more than by a factor of 2 is fulfilled in twelve reporting countries. The smallest possible majority of MS (14 out of 27) has reported on the set of PM2.5 stations used for the assessment of the Averaged Exposure Index (AEI). Compared to the 2009‐reporting (de Leeuw et al, 2011) there is a remarkable increase in the number of AEI‐stations in France: from 33 to 62. In some other countries minor modifications (1‐2 additional stations) are seen. The Directive sets for the density of the AEI‐stations a minimal requirement of one station per million city dwellers. At a first glance the defined sets are in agreement with this requirement if the total urban population is estimated either by summing the population in the agglomerations or by taking the data from the World Population Prospect (UN, 2009).
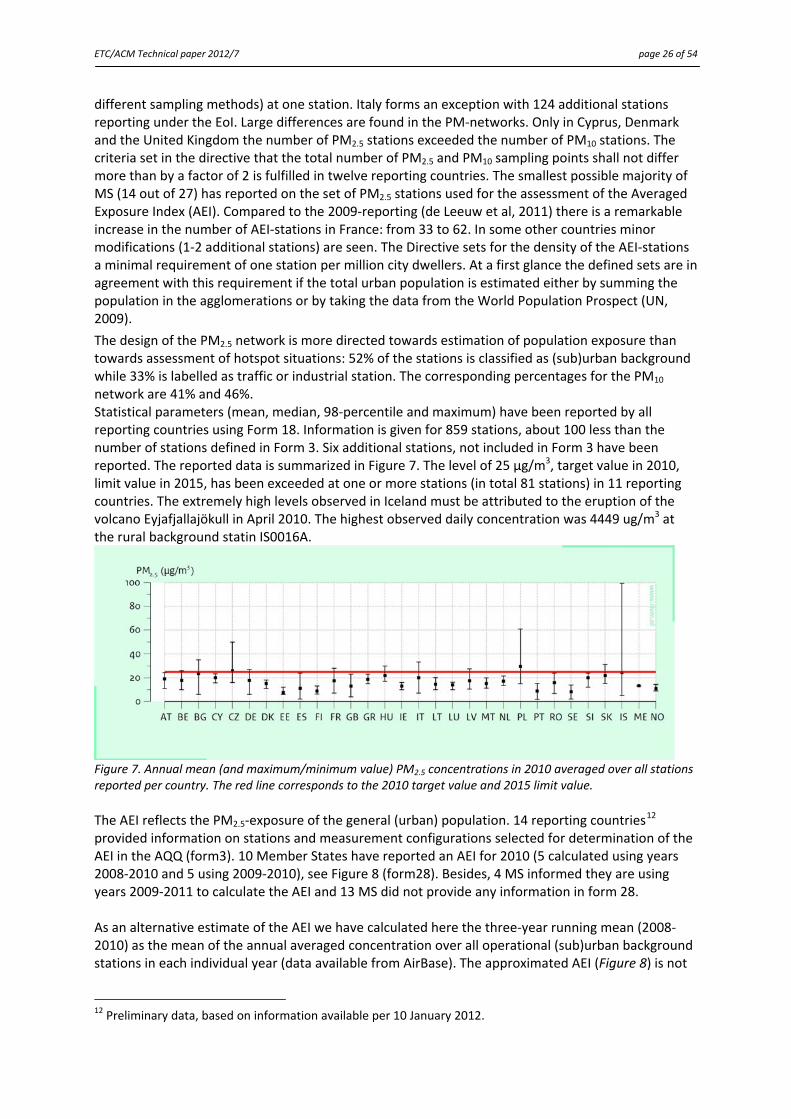
The design of the PM2.5 network is more directed towards estimation of population exposure than towards assessment of hotspot situations: 52% of the stations is classified as (sub)urban background while 33% is labelled as traffic or industrial station. The corresponding percentages for the PM10 network are 41% and 46%. Statistical parameters (mean, median, 98‐percentile and maximum) have been reported by all reporting countries using Form 18. Information is given for 859 stations, about 100 less than the number of stations defined in Form 3. Six additional stations, not included in Form 3 have been reported. The reported data is summarized in Figure 7. The level of 25 μg/m3, target value in 2010, limit value in 2015, has been exceeded at one or more stations (in total 81 stations) in 11 reporting countries. The extremely high levels observed in Iceland must be attributed to the eruption of the volcano Eyjafjallajökull in April 2010. The highest observed daily concentration was 4449 ug/m3 at the rural background statin IS0016A.
Figure 7. Annual mean (and maximum/minimum value) PM2.5 concentrations in 2010 averaged over all stations reported per country. The red line corresponds to the 2010 target value and 2015 limit value.
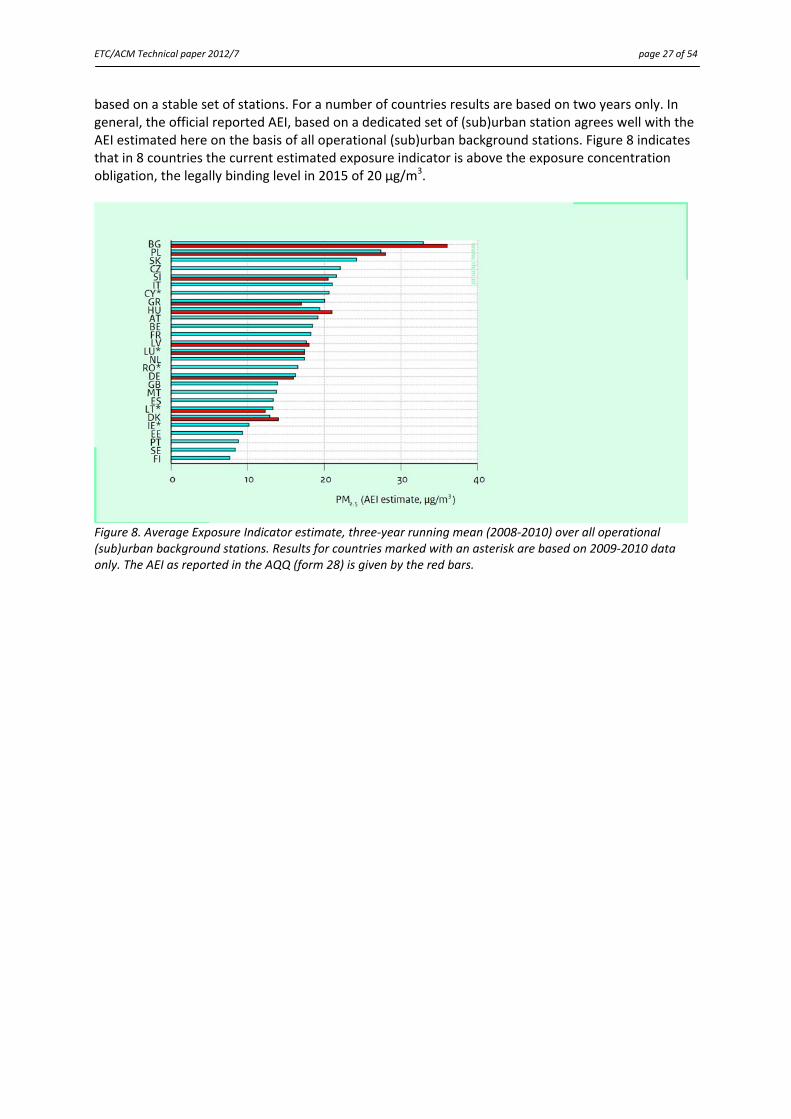
The AEI reflects the PM2.5‐exposure of the general (urban) population. 14 reporting countries
12 provided information on stations and measurement configurations selected for determination of the AEI in the AQQ (form3). 10 Member States have reported an AEI for 2010 (5 calculated using years 2008‐2010 and 5 using 2009‐2010), see Figure 8 (form28). Besides, 4 MS informed they are using years 2009‐2011 to calculate the AEI and 13 MS did not provide any information in form 28. As an alternative estimate of the AEI we have calculated here the three‐year running mean (2008‐2010) as the mean of the annual averaged concentration over all operational (sub)urban background stations in each individual year (data available from AirBase). The approximated AEI (Figure 8) is not
12 Preliminary data, based on information available per 10 January 2012.
ETC/ACM Technical paper 2012/7 page 27 of 54
based on a stable set of stations. For a number of countries results are based on two years only. In general, the official reported AEI, based on a dedicated set of (sub)urban station agrees well with the AEI estimated here on the basis of all operational (sub)urban background stations. Figure 8 indicates that in 8 countries the current estimated exposure indicator is above the exposure concentration obligation, the legally binding level in 2015 of 20 μg/m3.
Figure 8. Average Exposure Indicator estimate, three‐year running mean (2008‐2010) over all operational (sub)urban background stations. Results for countries marked with an asterisk are based on 2009‐2010 data only. The AEI as reported in the AQQ (form 28) is given by the red bars.
ETC/ACM Technical paper 2012/7 page 28 of 54
6. Comparison with EoI information
The Exchange of Information Decision requires that for all stations used for compliance checking (that is, all stations listed in the AQQ) meta‐information and concentration data has to be submitted. A comparison of the information in the AQQ and in AirBase shows that for the stations listed in Form 3 almost 99 % can be retrieved from AirBase. The agreement for ozone stations (Form 4) is nearly complete (more than 99.7 %). When matching at the level of a measurement configuration (that is, checking whether the 2010 concentration data of a station/pollutant combination listed in Form 3 or 4 is available from AirBase) larger differences are found, see Figure 9. For the classical pollutants (SO2, NO2, PM10, PM2.5, CO, O3) for nearly all measurement configurations the concentration data are also included in the national EoI submissions (more than 95 %). For benzene and the 4th DD pollutants a positive match between the two data flows could be found in 65 to 91 % of the cases. For the gaseous pollutants (ozone, SO2, NO2, CO) information on the measurement method is not provided in the questionnaire. Based on the EoI submission Mol and van Hooydonk (2011) present an overview: to a large extent the reference method is applied: ozone (UV absorption, 93%), NO2 (chemiluminescence, 88%), SO2 (UV fluorescence, 89%) and CO (infrared absorption, 86%). For benzene 23% of the stations do not report the method used. 75% of the stations do report the method, but most of them incomplete (chromatography without further specification). 25% of the stations report gas chromatography followed by mass spectroscopy or flame ionisation for quantification. For PM10 and PM2.5 the reference method is gravimetry. According to the information reported in the questionnaire, gravimetric methods are used at 27% of the PM10 and 34% of the PM2.5 stations. Beta absorption is used in 42% (PM10) and 30% (PM2.5) of the cases; TEOM and TEOM‐FDMS are used at 28% and 27% respectively. When a non‐equivalent method is used information on a correction method is expected. This information has not been given for 44% of the non‐equivalent measurement configuration; under the assumption correction is not needed for an TEOM‐FDMS, information on the correction method is missing in 27% of the cases. For PM2.5 information on correction methods is missing for 47% of the non‐equivalent measurement configurations. Heavy metals and BaP has to be measured on PM10 but in 65%, 50%, 50%, 50% and 15% of the cases lead, arsenic, cadmium, nickel and benzo(a)pyrene , respectively, is measured on aerosol with an undefined size fraction.
ETC/ACM Technical paper 2012/7 page 29 of 54
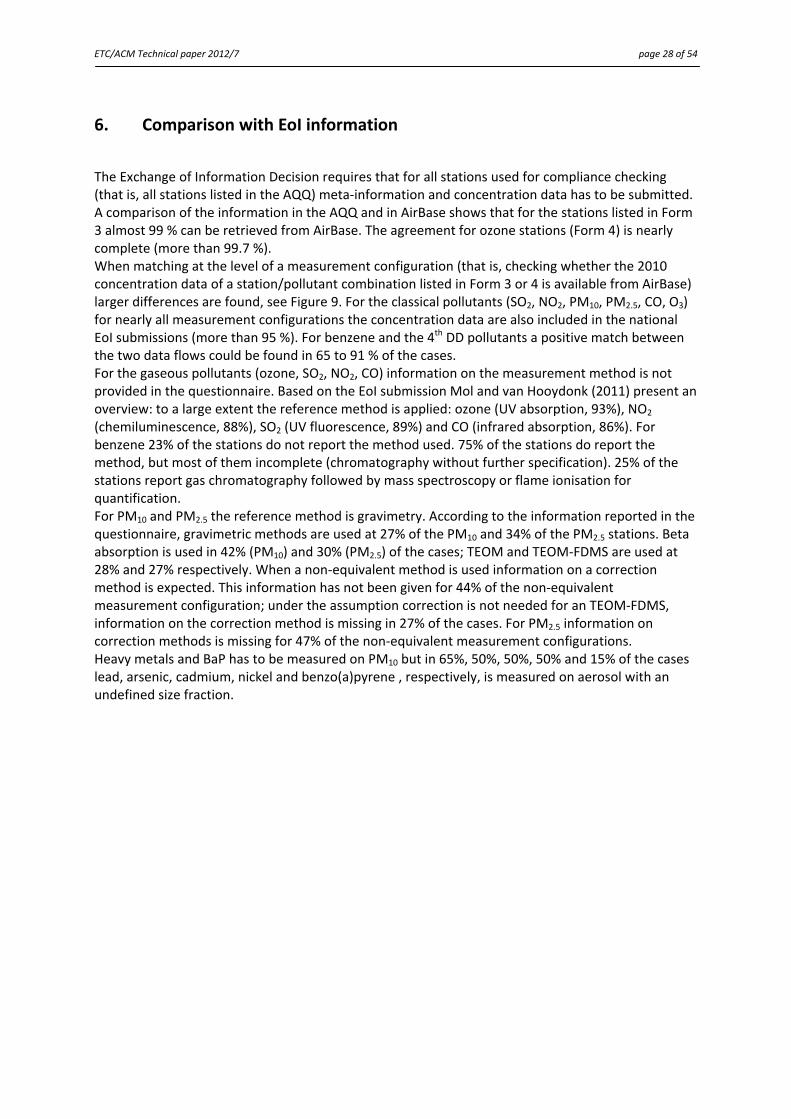
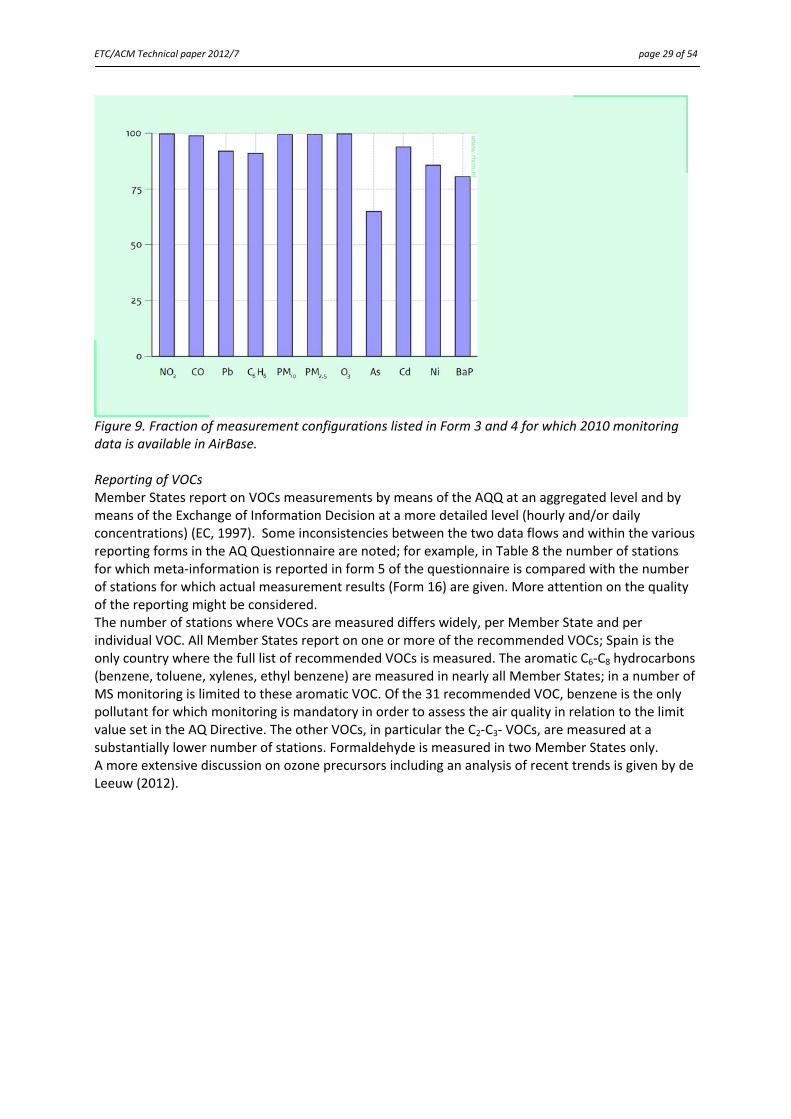
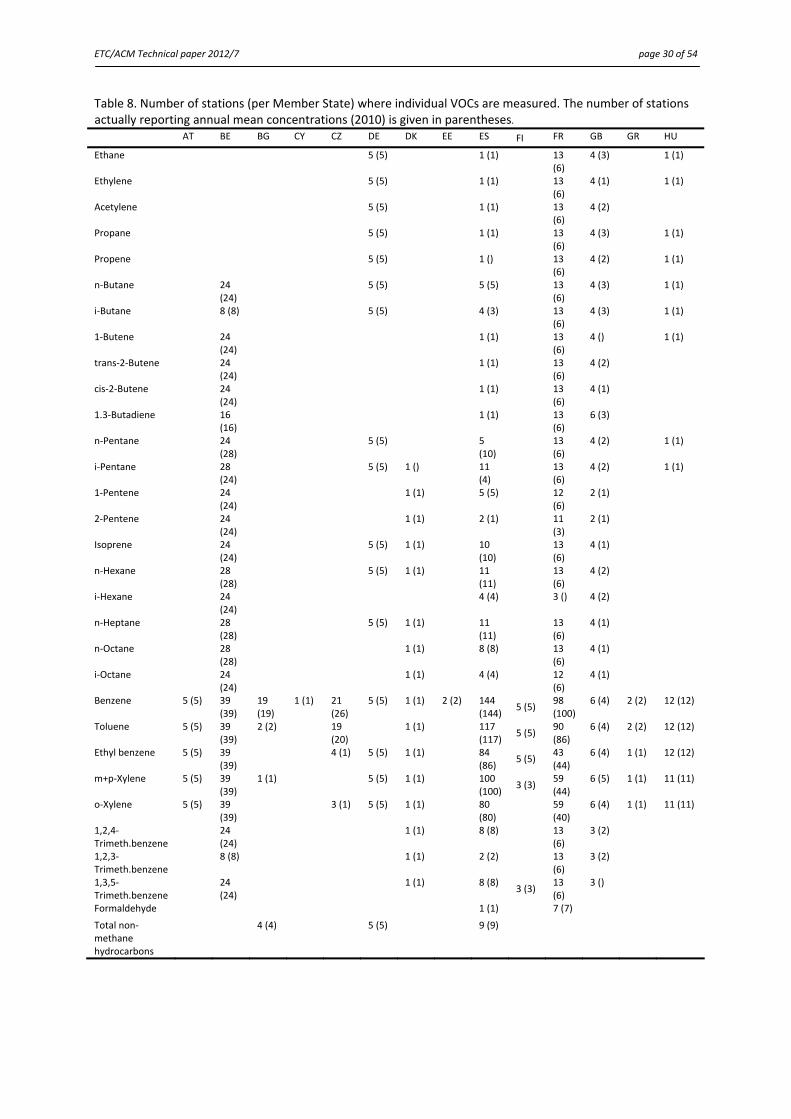
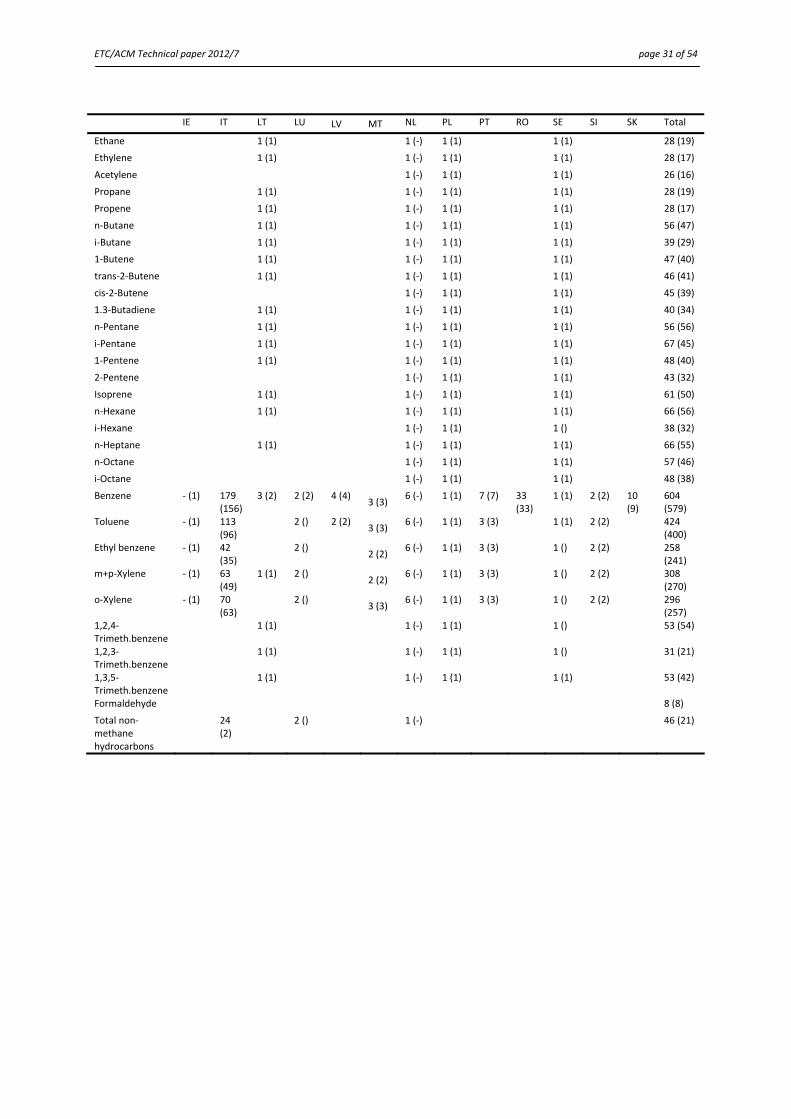
Figure 9. Fraction of measurement configurations listed in Form 3 and 4 for which 2010 monitoring data is available in AirBase. Reporting of VOCs Member States report on VOCs measurements by means of the AQQ at an aggregated level and by means of the Exchange of Information Decision at a more detailed level (hourly and/or daily concentrations) (EC, 1997). Some inconsistencies between the two data flows and within the various reporting forms in the AQ Questionnaire are noted; for example, in Table 8 the number of stations for which meta‐information is reported in form 5 of the questionnaire is compared with the number of stations for which actual measurement results (Form 16) are given. More attention on the quality of the reporting might be considered. The number of stations where VOCs are measured differs widely, per Member State and per individual VOC. All Member States report on one or more of the recommended VOCs; Spain is the only country where the full list of recommended VOCs is measured. The aromatic C6‐C8 hydrocarbons (benzene, toluene, xylenes, ethyl benzene) are measured in nearly all Member States; in a number of MS monitoring is limited to these aromatic VOC. Of the 31 recommended VOC, benzene is the only pollutant for which monitoring is mandatory in order to assess the air quality in relation to the limit value set in the AQ Directive. The other VOCs, in particular the C2‐C3‐ VOCs, are measured at a substantially lower number of stations. Formaldehyde is measured in two Member States only. A more extensive discussion on ozone precursors including an analysis of recent trends is given by de Leeuw (2012).
ETC/ACM Technical paper 2012/7 page 30 of 54
Table 8. Number of stations (per Member State) where individual VOCs are measured. The number of stations actually reporting annual mean concentrations (2010) is given in parentheses.
AT BE BG CY CZ DE DK EE ES FI FR GB GR HU
Ethane 5 (5) 1 (1)
13 (6)
4 (3) 1 (1)
Ethylene 5 (5) 1 (1)
13 (6)
4 (1) 1 (1)
Acetylene 5 (5) 1 (1)
13 (6)
4 (2)
Propane 5 (5) 1 (1)
13 (6)
4 (3) 1 (1)
Propene 5 (5) 1 ()
13 (6)
4 (2) 1 (1)
n‐Butane 24 (24)
5 (5) 5 (5)
13 (6)
4 (3) 1 (1)
i‐Butane 8 (8) 5 (5) 4 (3)
13 (6)
4 (3) 1 (1)
1‐Butene 24 (24)
1 (1)
13 (6)
4 () 1 (1)
trans‐2‐Butene 24 (24)
1 (1)
13 (6)
4 (2)
cis‐2‐Butene 24 (24)
1 (1)
13 (6)
4 (1)
1.3‐Butadiene 16 (16)
1 (1)
13 (6)
6 (3)
n‐Pentane 24 (28)
5 (5) 5 (10)
13 (6)
4 (2) 1 (1)
i‐Pentane 28 (24)
5 (5) 1 () 11 (4)
13 (6)
4 (2) 1 (1)
1‐Pentene 24 (24)
1 (1) 5 (5)
12 (6)
2 (1)
2‐Pentene 24 (24)
1 (1) 2 (1)
11 (3)
2 (1)
Isoprene 24 (24)
5 (5) 1 (1) 10 (10)
13 (6)
4 (1)
n‐Hexane 28 (28)
5 (5) 1 (1) 11 (11)
13 (6)
4 (2)
i‐Hexane 24 (24)
4 (4)
3 () 4 (2)
n‐Heptane 28 (28)
5 (5) 1 (1) 11 (11)
13 (6)
4 (1)
n‐Octane 28 (28)
1 (1) 8 (8)
13 (6)
4 (1)
i‐Octane 24 (24)
1 (1) 4 (4)
12 (6)
4 (1)
Benzene 5 (5) 39 (39)
19 (19)
1 (1) 21 (26)
5 (5) 1 (1) 2 (2) 144 (144)
5 (5) 98 (100)
6 (4) 2 (2) 12 (12)
Toluene 5 (5) 39 (39)
2 (2) 19 (20)
1 (1) 117 (117)
5 (5) 90 (86)
6 (4) 2 (2) 12 (12)
Ethyl benzene 5 (5) 39 (39)
4 (1) 5 (5) 1 (1) 84 (86)
5 (5) 43 (44)
6 (4) 1 (1) 12 (12)
m+p‐Xylene 5 (5) 39 (39)
1 (1) 5 (5) 1 (1) 100 (100)
3 (3) 59 (44)
6 (5) 1 (1) 11 (11)
o‐Xylene 5 (5) 39 (39)
3 (1) 5 (5) 1 (1) 80 (80)
59 (40)
6 (4) 1 (1) 11 (11)
1,2,4‐Trimeth.benzene
24 (24)
1 (1) 8 (8)
13 (6)
3 (2)
1,2,3‐Trimeth.benzene
8 (8) 1 (1) 2 (2)
13 (6)
3 (2)
1,3,5‐Trimeth.benzene
24 (24)
1 (1) 8 (8) 3 (3)
13 (6)
3 ()
Formaldehyde 1 (1) 7 (7)
Total non‐methane hydrocarbons
4 (4) 5 (5) 9 (9)
ETC/ACM Technical paper 2012/7 page 31 of 54
IE IT LT LU LV MT NL PL PT RO SE SI SK Total
Ethane 1 (1) 1 (‐) 1 (1) 1 (1) 28 (19)
Ethylene 1 (1) 1 (‐) 1 (1) 1 (1) 28 (17)
Acetylene 1 (‐) 1 (1) 1 (1) 26 (16)
Propane 1 (1) 1 (‐) 1 (1) 1 (1) 28 (19)
Propene 1 (1) 1 (‐) 1 (1) 1 (1) 28 (17)
n‐Butane 1 (1) 1 (‐) 1 (1) 1 (1) 56 (47)
i‐Butane 1 (1) 1 (‐) 1 (1) 1 (1) 39 (29)
1‐Butene 1 (1) 1 (‐) 1 (1) 1 (1) 47 (40)
trans‐2‐Butene 1 (1) 1 (‐) 1 (1) 1 (1) 46 (41)
cis‐2‐Butene 1 (‐) 1 (1) 1 (1) 45 (39)
1.3‐Butadiene 1 (1) 1 (‐) 1 (1) 1 (1) 40 (34)
n‐Pentane 1 (1) 1 (‐) 1 (1) 1 (1) 56 (56)
i‐Pentane 1 (1) 1 (‐) 1 (1) 1 (1) 67 (45)
1‐Pentene 1 (1) 1 (‐) 1 (1) 1 (1) 48 (40)
2‐Pentene 1 (‐) 1 (1) 1 (1) 43 (32)
Isoprene 1 (1) 1 (‐) 1 (1) 1 (1) 61 (50)
n‐Hexane 1 (1) 1 (‐) 1 (1) 1 (1) 66 (56)
i‐Hexane 1 (‐) 1 (1) 1 () 38 (32)
n‐Heptane 1 (1) 1 (‐) 1 (1) 1 (1) 66 (55)
n‐Octane 1 (‐) 1 (1) 1 (1) 57 (46)
i‐Octane 1 (‐) 1 (1) 1 (1) 48 (38)
Benzene ‐ (1) 179 (156)
3 (2) 2 (2) 4 (4) 3 (3)
6 (‐) 1 (1) 7 (7) 33 (33)
1 (1) 2 (2) 10 (9)
604 (579)
Toluene ‐ (1) 113 (96)
2 () 2 (2) 3 (3)
6 (‐) 1 (1) 3 (3) 1 (1) 2 (2) 424 (400)
Ethyl benzene ‐ (1) 42 (35)
2 () 2 (2)
6 (‐) 1 (1) 3 (3) 1 () 2 (2) 258 (241)
m+p‐Xylene ‐ (1) 63 (49)
1 (1) 2 () 2 (2)
6 (‐) 1 (1) 3 (3) 1 () 2 (2) 308 (270)
o‐Xylene ‐ (1) 70 (63)
2 () 3 (3)
6 (‐) 1 (1) 3 (3) 1 () 2 (2) 296 (257)
1,2,4‐Trimeth.benzene
1 (1)
1 (‐) 1 (1) 1 () 53 (54)
1,2,3‐Trimeth.benzene
1 (1)
1 (‐) 1 (1) 1 () 31 (21)
1,3,5‐Trimeth.benzene
1 (1)
1 (‐) 1 (1) 1 (1) 53 (42)
Formaldehyde 8 (8)
Total non‐methane hydrocarbons
24 (2)
2 ()
1 (‐) 46 (21)
ETC/ACM Technical paper 2012/7 page 32 of 54
References
Viana M, Pey J, de Leeuw F, Querol X, Alastuey A, dallÓsto M, Moreno T (2011) Reporting on natural events in the EU Member States under Directive 2008/50/EC, yers 2008‐2009. ETC/ACM Techical Paper 2011/17.
Mol WJA , van Hooydonk PR (2012) The European exchange of information in 2011 (2012) ETC/ACM Technical Paper 2012/1.
de Leeuw F, Jimmink B, Ostatnicka J, Schreiberova M, Viana M (2011) Reporting on ambient air quality assessment in the EU Member States, 2009. ETC/ACM Technical Paper 2011/7
de Leeuw F (2012) AirBase: a valuable tool inair quality assessments at an European and local level. ETC/ACM Technical Paper 2012/4.
ETC/ACM Technical paper 2012/7 page 33 of 54
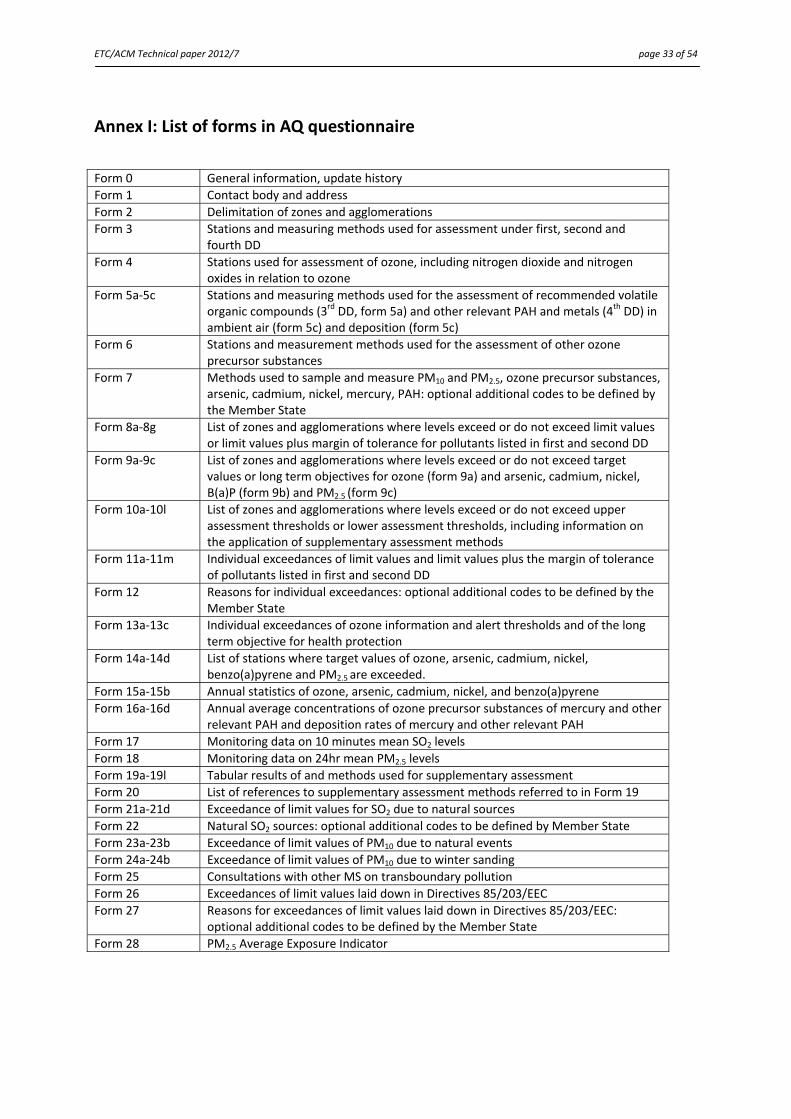
Annex I: List of forms in AQ questionnaire
Form 0 General information, update history
Form 1 Contact body and address
Form 2 Delimitation of zones and agglomerations
Form 3 Stations and measuring methods used for assessment under first, second and fourth DD
Form 4 Stations used for assessment of ozone, including nitrogen dioxide and nitrogen oxides in relation to ozone
Form 5a‐5c Stations and measuring methods used for the assessment of recommended volatile organic compounds (3rd DD, form 5a) and other relevant PAH and metals (4th DD) in ambient air (form 5c) and deposition (form 5c)
Form 6 Stations and measurement methods used for the assessment of other ozone precursor substances
Form 7 Methods used to sample and measure PM10 and PM2.5, ozone precursor substances, arsenic, cadmium, nickel, mercury, PAH: optional additional codes to be defined by the Member State
Form 8a‐8g List of zones and agglomerations where levels exceed or do not exceed limit values or limit values plus margin of tolerance for pollutants listed in first and second DD
Form 9a‐9c List of zones and agglomerations where levels exceed or do not exceed target values or long term objectives for ozone (form 9a) and arsenic, cadmium, nickel, B(a)P (form 9b) and PM2.5 (form 9c)
Form 10a‐10l List of zones and agglomerations where levels exceed or do not exceed upper assessment thresholds or lower assessment thresholds, including information on the application of supplementary assessment methods
Form 11a‐11m Individual exceedances of limit values and limit values plus the margin of tolerance of pollutants listed in first and second DD
Form 12 Reasons for individual exceedances: optional additional codes to be defined by the Member State
Form 13a‐13c Individual exceedances of ozone information and alert thresholds and of the long term objective for health protection
Form 14a‐14d List of stations where target values of ozone, arsenic, cadmium, nickel, benzo(a)pyrene and PM2.5 are exceeded.
Form 15a‐15b Annual statistics of ozone, arsenic, cadmium, nickel, and benzo(a)pyrene
Form 16a‐16d Annual average concentrations of ozone precursor substances of mercury and other relevant PAH and deposition rates of mercury and other relevant PAH
Form 17 Monitoring data on 10 minutes mean SO2 levels
Form 18 Monitoring data on 24hr mean PM2.5 levels
Form 19a‐19l Tabular results of and methods used for supplementary assessment
Form 20 List of references to supplementary assessment methods referred to in Form 19
Form 21a‐21d Exceedance of limit values for SO2 due to natural sources
Form 22 Natural SO2 sources: optional additional codes to be defined by Member State
Form 23a‐23b Exceedance of limit values of PM10 due to natural events
Form 24a‐24b Exceedance of limit values of PM10 due to winter sanding
Form 25 Consultations with other MS on transboundary pollution
Form 26 Exceedances of limit values laid down in Directives 85/203/EEC
Form 27 Reasons for exceedances of limit values laid down in Directives 85/203/EEC: optional additional codes to be defined by the Member State
Form 28 PM2.5 Average Exposure Indicator
ETC/ACM Technical paper 2012/7 page 34 of 54
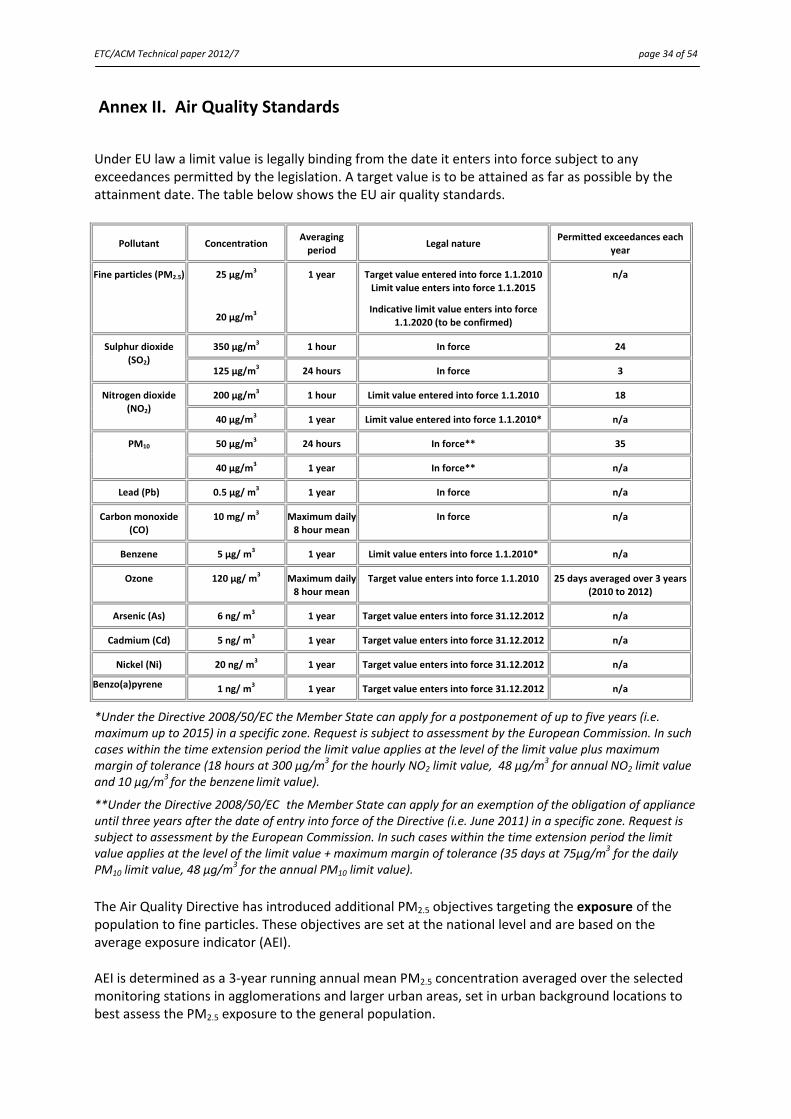
Annex II. Air Quality Standards
Under EU law a limit value is legally binding from the date it enters into force subject to any exceedances permitted by the legislation. A target value is to be attained as far as possible by the attainment date. The table below shows the EU air quality standards.
Pollutant Concentration Averaging
period Legal nature
Permitted exceedances each
year
Fine particles (PM2.5) 25 µg/m3
20 µg/m3
1 year Target value entered into force 1.1.2010
Limit value enters into force 1.1.2015
Indicative limit value enters into force 1.1.2020 (to be confirmed)
n/a
350 µg/m3 1 hour In force 24 Sulphur dioxide
(SO2) 125 µg/m
3 24 hours In force 3
200 µg/m3 1 hour Limit value entered into force 1.1.2010 18 Nitrogen dioxide
(NO2) 40 µg/m
3 1 year Limit value entered into force 1.1.2010* n/a
50 µg/m3 24 hours In force** 35 PM10
40 µg/m3 1 year In force** n/a
Lead (Pb) 0.5 µg/ m3 1 year In force n/a
Carbon monoxide (CO)
10 mg/ m3 Maximum daily
8 hour mean In force n/a
Benzene 5 µg/ m3 1 year Limit value enters into force 1.1.2010* n/a
Ozone 120 µg/ m3 Maximum daily
8 hour mean Target value enters into force 1.1.2010 25 days averaged over 3 years
(2010 to 2012)
Arsenic (As) 6 ng/ m3 1 year Target value enters into force 31.12.2012 n/a
Cadmium (Cd) 5 ng/ m3 1 year Target value enters into force 31.12.2012 n/a
Nickel (Ni) 20 ng/ m3 1 year Target value enters into force 31.12.2012 n/a
Benzo(a)pyrene 1 ng/ m3 1 year Target value enters into force 31.12.2012 n/a
*Under the Directive 2008/50/EC the Member State can apply for a postponement of up to five years (i.e. maximum up to 2015) in a specific zone. Request is subject to assessment by the European Commission. In such cases within the time extension period the limit value applies at the level of the limit value plus maximum margin of tolerance (18 hours at 300 µg/m3 for the hourly NO2 limit value, 48 µg/m3 for annual NO2 limit value and 10 µg/m3 for the benzene limit value).
**Under the Directive 2008/50/EC the Member State can apply for an exemption of the obligation of appliance until three years after the date of entry into force of the Directive (i.e. June 2011) in a specific zone. Request is subject to assessment by the European Commission. In such cases within the time extension period the limit value applies at the level of the limit value + maximum margin of tolerance (35 days at 75µg/m3 for the daily PM10 limit value, 48 µg/m3 for the annual PM10 limit value).
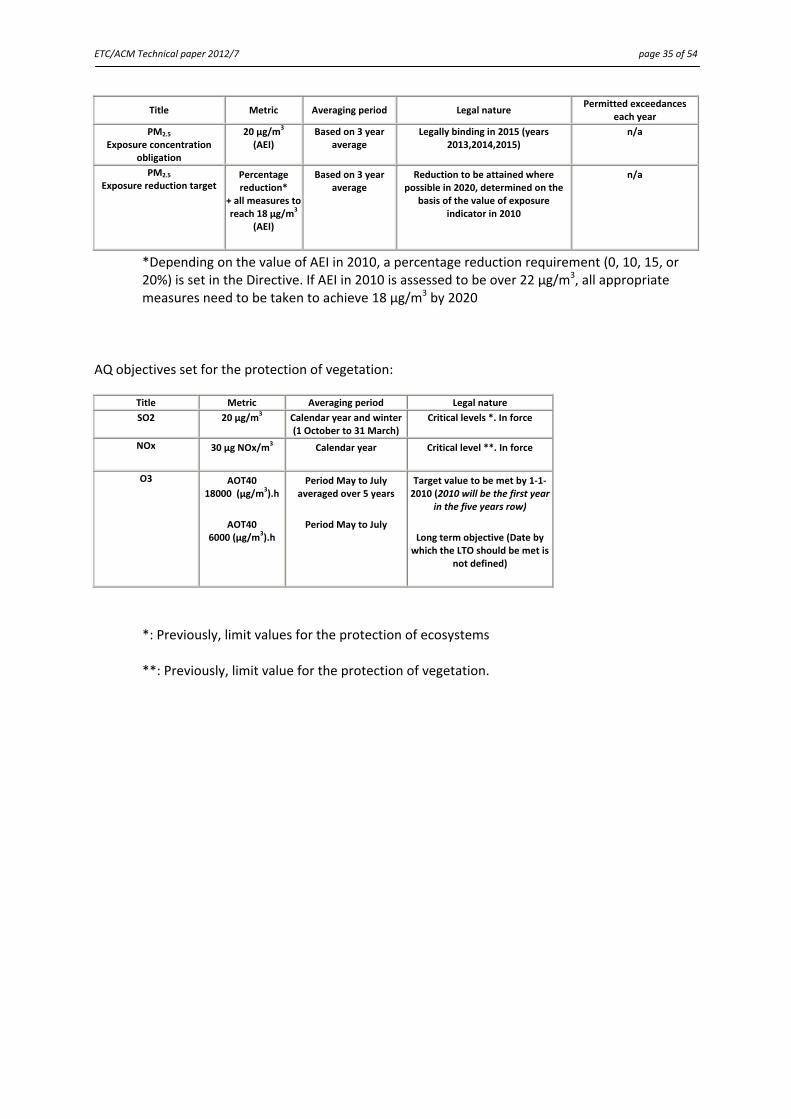
The Air Quality Directive has introduced additional PM2.5 objectives targeting the exposure of the population to fine particles. These objectives are set at the national level and are based on the average exposure indicator (AEI).
AEI is determined as a 3‐year running annual mean PM2.5 concentration averaged over the selected monitoring stations in agglomerations and larger urban areas, set in urban background locations to best assess the PM2.5 exposure to the general population.
ETC/ACM Technical paper 2012/7 page 35 of 54
Title Metric Averaging period Legal nature Permitted exceedances
each year
PM2.5 Exposure concentration
obligation
20 µg/m3
(AEI) Based on 3 year
average Legally binding in 2015 (years
2013,2014,2015) n/a
PM2.5 Exposure reduction target
Percentage reduction*
+ all measures to reach 18 µg/m
3
(AEI)
Based on 3 year average
Reduction to be attained where possible in 2020, determined on the
basis of the value of exposure indicator in 2010
n/a
*Depending on the value of AEI in 2010, a percentage reduction requirement (0, 10, 15, or 20%) is set in the Directive. If AEI in 2010 is assessed to be over 22 µg/m3, all appropriate measures need to be taken to achieve 18 µg/m3 by 2020
AQ objectives set for the protection of vegetation:
Title Metric Averaging period Legal nature
SO2 20 µg/m3
Calendar year and winter(1 October to 31 March)
Critical levels *. In force
NOx 30 µg NOx/m3 Calendar year Critical level **. In force
O3 AOT40 18000 (µg/m
3).h
AOT40 6000 (µg/m
3).h
Period May to July averaged over 5 years
Period May to July
Target value to be met by 1‐1‐2010 (2010 will be the first year
in the five years row)
Long term objective (Date by which the LTO should be met is
not defined)
*: Previously, limit values for the protection of ecosystems
**: Previously, limit value for the protection of vegetation.
ETC/ACM Technical paper 2012/7 page 36 of 54
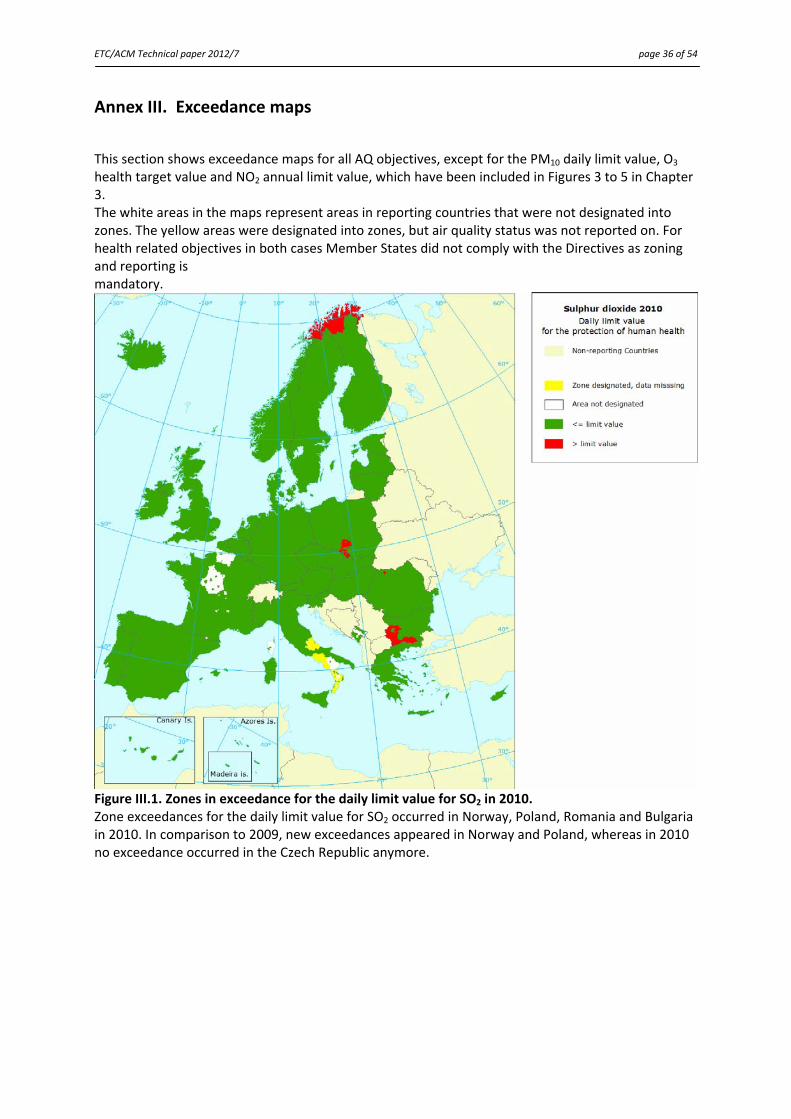
Annex III. Exceedance maps
This section shows exceedance maps for all AQ objectives, except for the PM10 daily limit value, O3 health target value and NO2 annual limit value, which have been included in Figures 3 to 5 in Chapter 3. The white areas in the maps represent areas in reporting countries that were not designated into zones. The yellow areas were designated into zones, but air quality status was not reported on. For health related objectives in both cases Member States did not comply with the Directives as zoning and reporting is mandatory.
Figure III.1. Zones in exceedance for the daily limit value for SO2 in 2010. Zone exceedances for the daily limit value for SO2 occurred in Norway, Poland, Romania and Bulgaria in 2010. In comparison to 2009, new exceedances appeared in Norway and Poland, whereas in 2010 no exceedance occurred in the Czech Republic anymore.
ETC/ACM Technical paper 2012/7 page 37 of 54
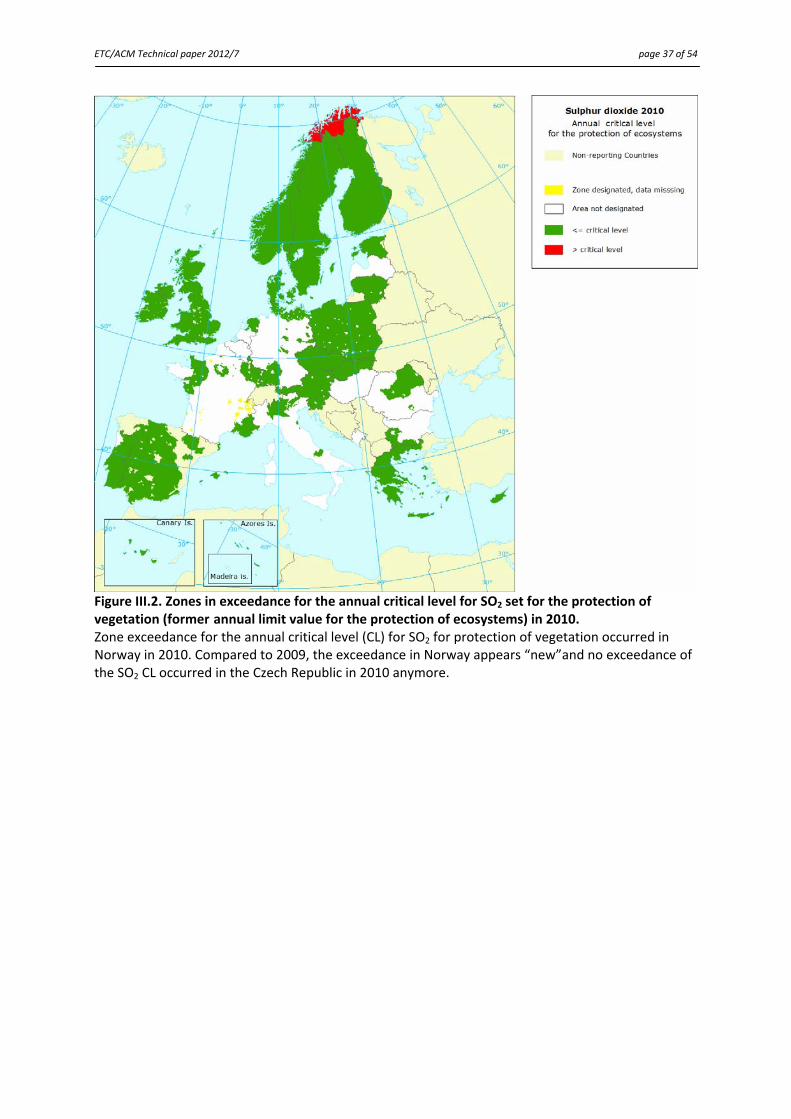
Figure III.2. Zones in exceedance for the annual critical level for SO2 set for the protection of vegetation (former annual limit value for the protection of ecosystems) in 2010. Zone exceedance for the annual critical level (CL) for SO2 for protection of vegetation occurred in Norway in 2010. Compared to 2009, the exceedance in Norway appears “new”and no exceedance of the SO2 CL occurred in the Czech Republic in 2010 anymore.

ETC/ACM Technical paper 2012/7 page 38 of 54
Figure III.3. Zones in exceedance for the winter critical level for SO2 set for the protection of vegetation (former winter limit value for the protection of ecosystems) in 2010. Zone exceedances for the winter critical level for SO2 for protection of vegetation occurred in the Czech Republic and Norway in 2010. In the Czech Republic the number of zones in exceedance of the winter limit value for SO2 for protection of ecosystems has halved from 2 to 1.
ETC/ACM Technical paper 2012/7 page 39 of 54
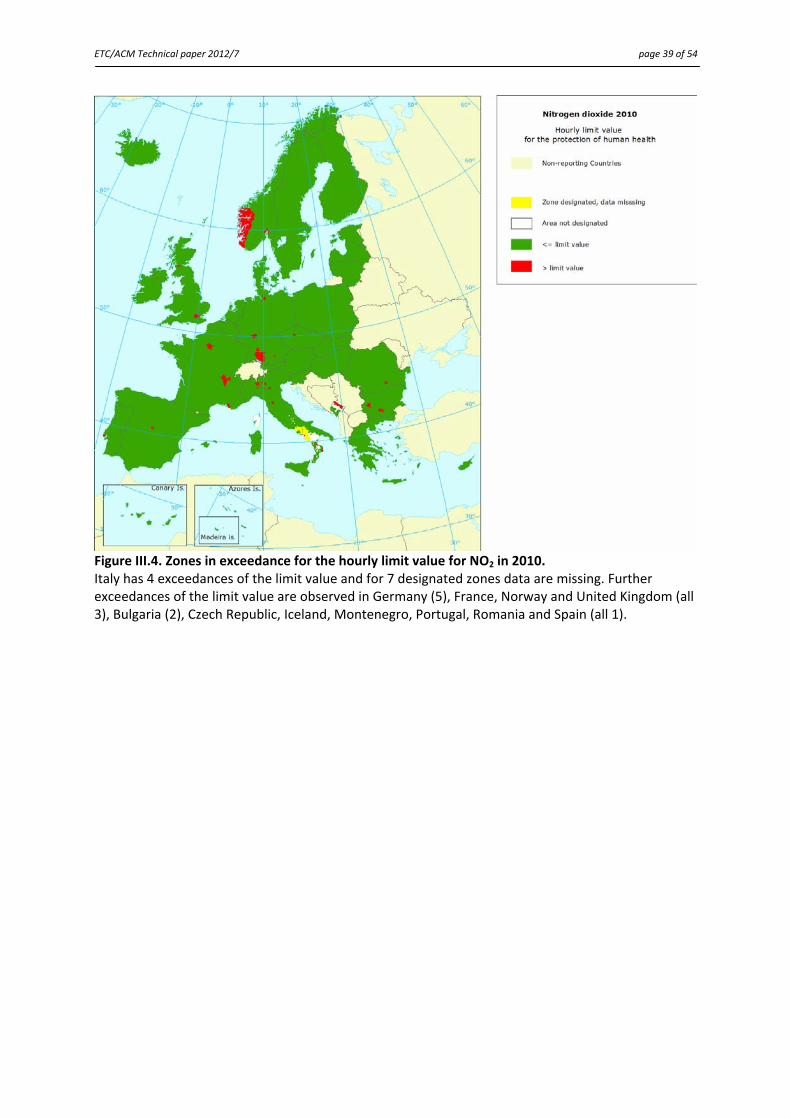
Figure III.4. Zones in exceedance for the hourly limit value for NO2 in 2010. Italy has 4 exceedances of the limit value and for 7 designated zones data are missing. Further exceedances of the limit value are observed in Germany (5), France, Norway and United Kingdom (all 3), Bulgaria (2), Czech Republic, Iceland, Montenegro, Portugal, Romania and Spain (all 1).
ETC/ACM Technical paper 2012/7 page 40 of 54
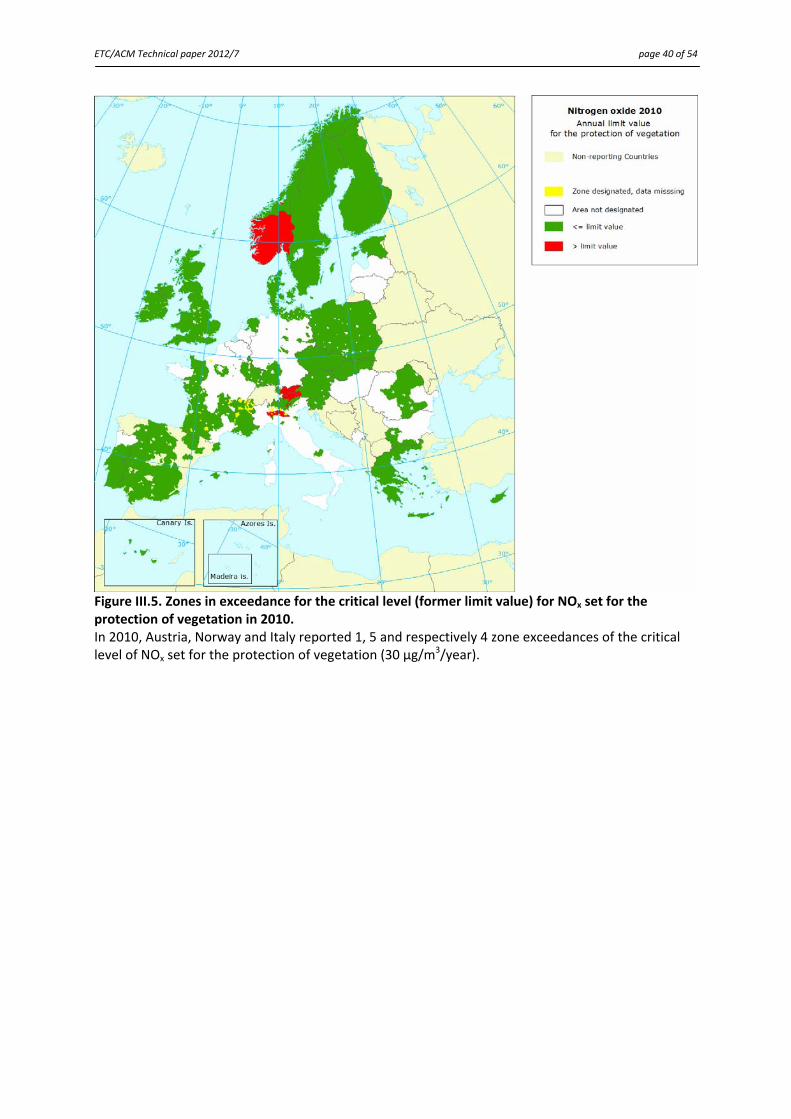
Figure III.5. Zones in exceedance for the critical level (former limit value) for NOx set for the protection of vegetation in 2010. In 2010, Austria, Norway and Italy reported 1, 5 and respectively 4 zone exceedances of the critical level of NOx set for the protection of vegetation (30 µg/m
3/year).
ETC/ACM Technical paper 2012/7 page 41 of 54
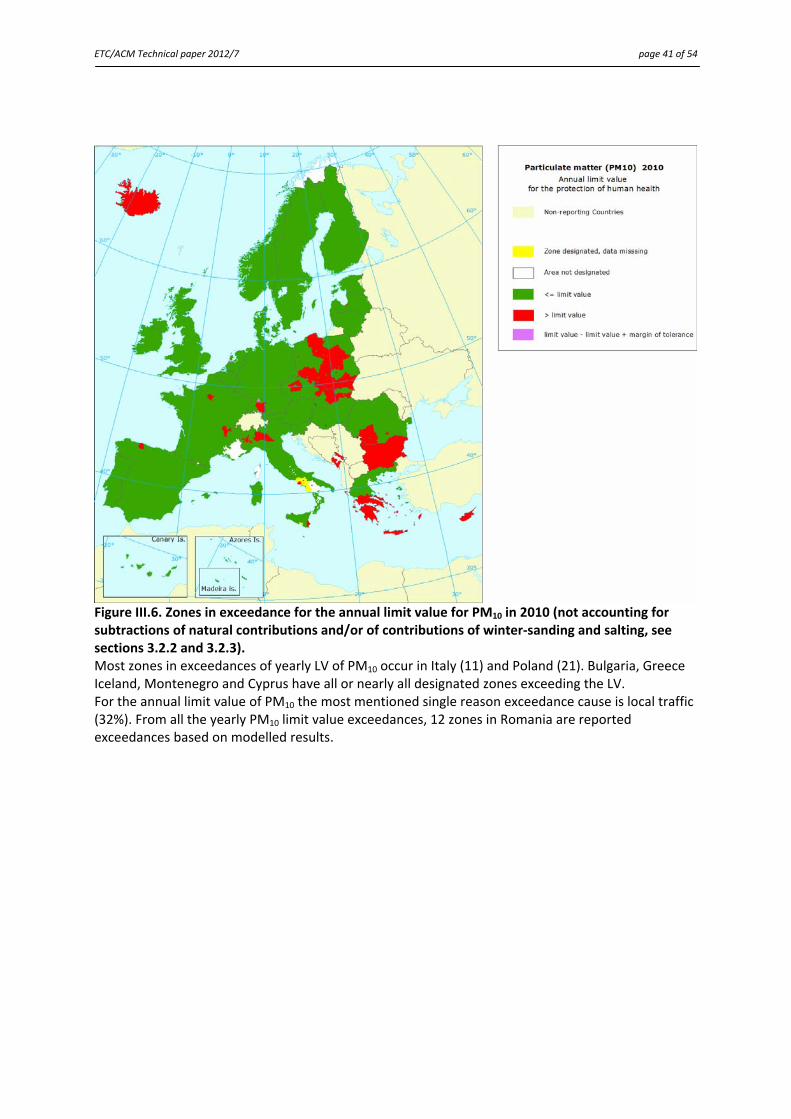
Figure III.6. Zones in exceedance for the annual limit value for PM10 in 2010 (not accounting for subtractions of natural contributions and/or of contributions of winter‐sanding and salting, see sections 3.2.2 and 3.2.3). Most zones in exceedances of yearly LV of PM10 occur in Italy (11) and Poland (21). Bulgaria, Greece Iceland, Montenegro and Cyprus have all or nearly all designated zones exceeding the LV. For the annual limit value of PM10 the most mentioned single reason exceedance cause is local traffic (32%). From all the yearly PM10 limit value exceedances, 12 zones in Romania are reported exceedances based on modelled results.
ETC/ACM Technical paper 2012/7 page 42 of 54
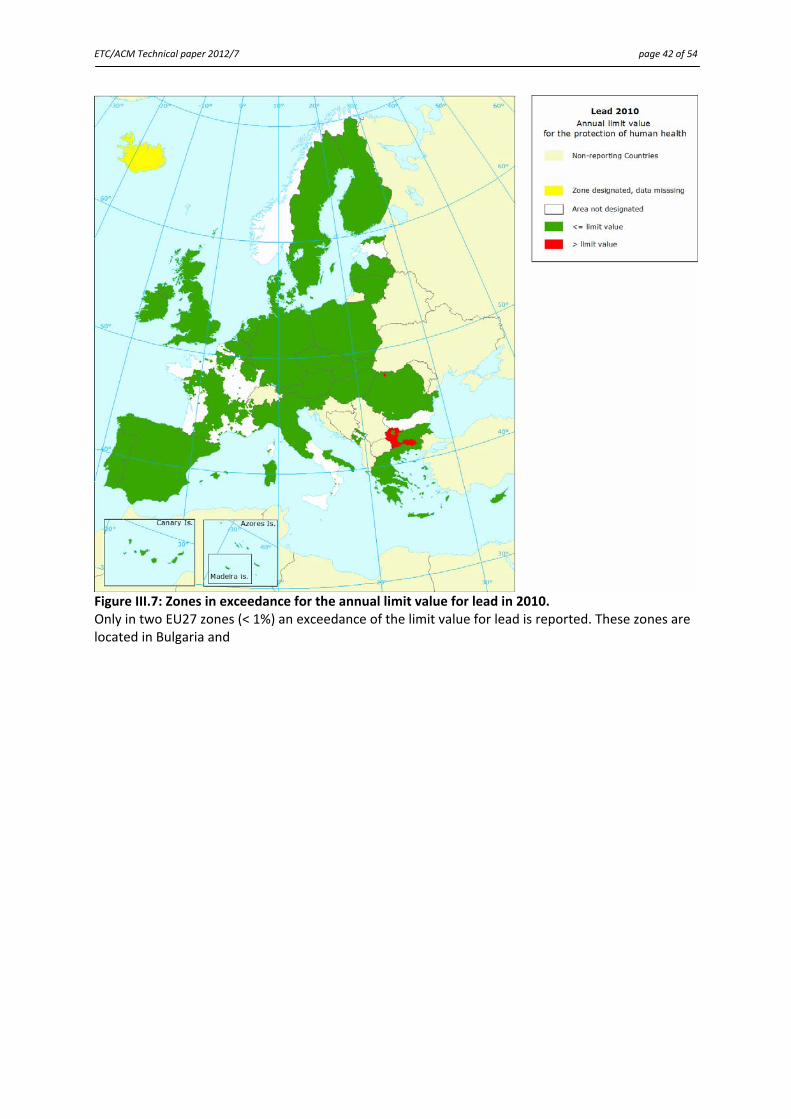
Figure III.7: Zones in exceedance for the annual limit value for lead in 2010. Only in two EU27 zones (< 1%) an exceedance of the limit value for lead is reported. These zones are located in Bulgaria and
ETC/ACM Technical paper 2012/7 page 43 of 54
Romania.
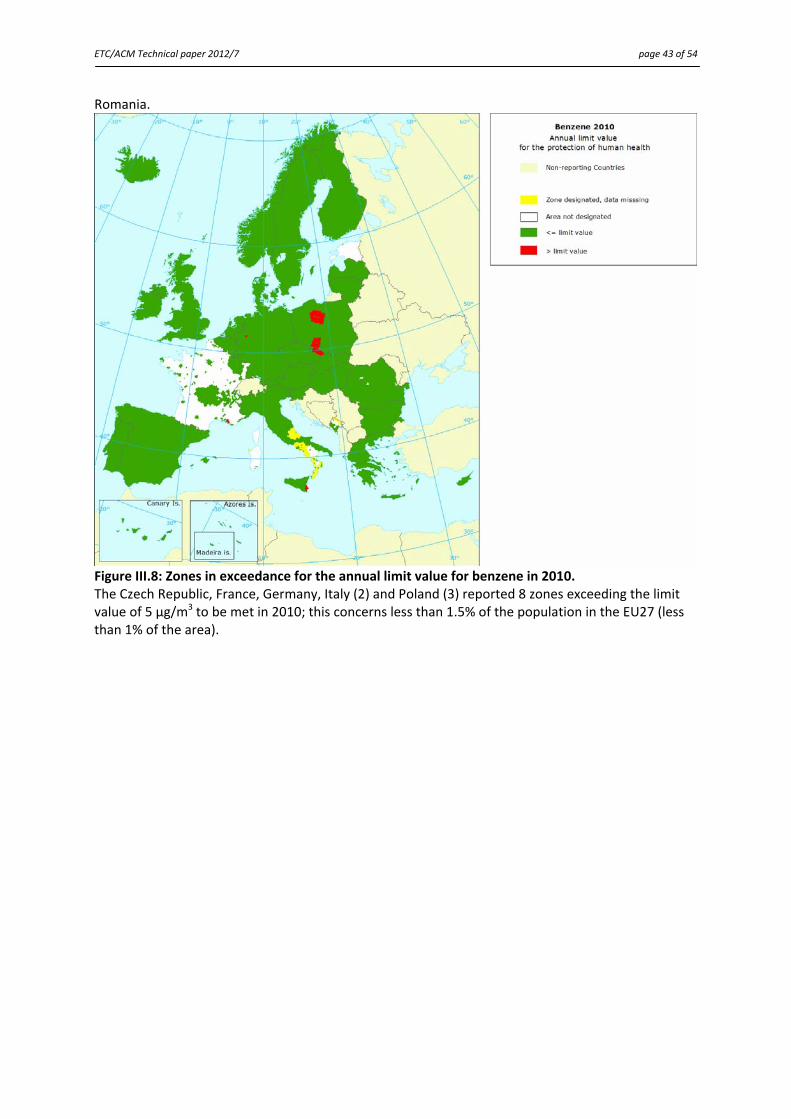
Figure III.8: Zones in exceedance for the annual limit value for benzene in 2010. The Czech Republic, France, Germany, Italy (2) and Poland (3) reported 8 zones exceeding the limit value of 5 μg/m3 to be met in 2010; this concerns less than 1.5% of the population in the EU27 (less than 1% of the area).
ETC/ACM Technical paper 2012/7 page 44 of 54
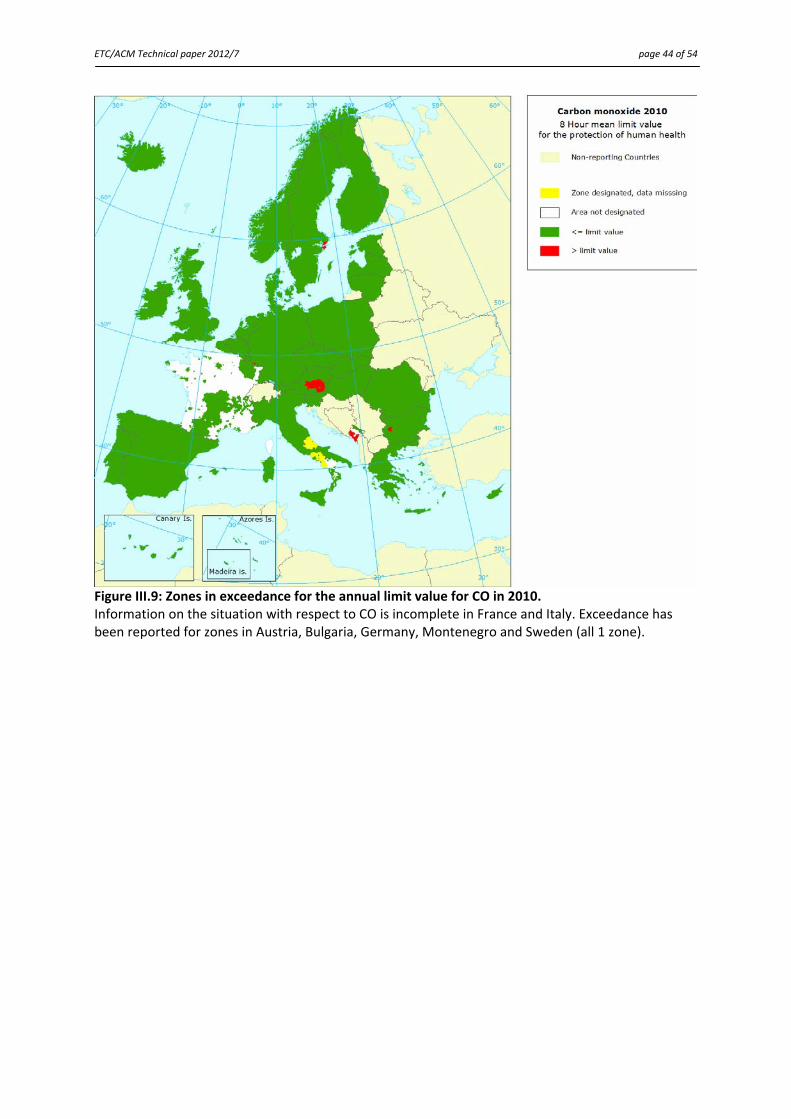
Figure III.9: Zones in exceedance for the annual limit value for CO in 2010. Information on the situation with respect to CO is incomplete in France and Italy. Exceedance has been reported for zones in Austria, Bulgaria, Germany, Montenegro and Sweden (all 1 zone).
ETC/ACM Technical paper 2012/7 page 45 of 54
Figure III.10: Zones in exceedance for the vegetation target value for O3 in 2010. Most zones in exceedance of TV occur in Spain (51), Italy (50), Germany (38) and France (22). Austria, Cyprus, Czech Republic, Greece, Malta, Slovakia and Slovenia have all or nearly all zones exceeding the TV. From all the ozone vegetation target value exceedances, 14 zones in Italy, 1 zone in Spain and 1 zone in Slovenia are reported exceedances based on modelled results.
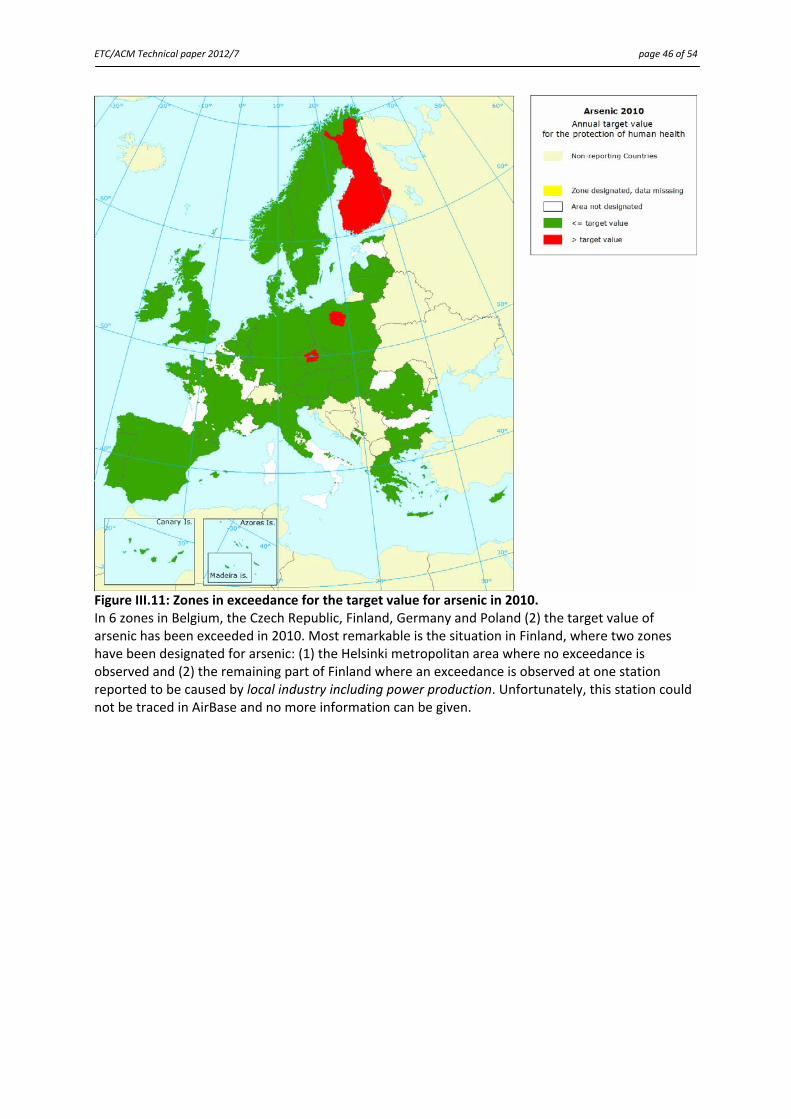
ETC/ACM Technical paper 2012/7 page 46 of 54
Figure III.11: Zones in exceedance for the target value for arsenic in 2010. In 6 zones in Belgium, the Czech Republic, Finland, Germany and Poland (2) the target value of arsenic has been exceeded in 2010. Most remarkable is the situation in Finland, where two zones have been designated for arsenic: (1) the Helsinki metropolitan area where no exceedance is observed and (2) the remaining part of Finland where an exceedance is observed at one station reported to be caused by local industry including power production. Unfortunately, this station could not be traced in AirBase and no more information can be given.
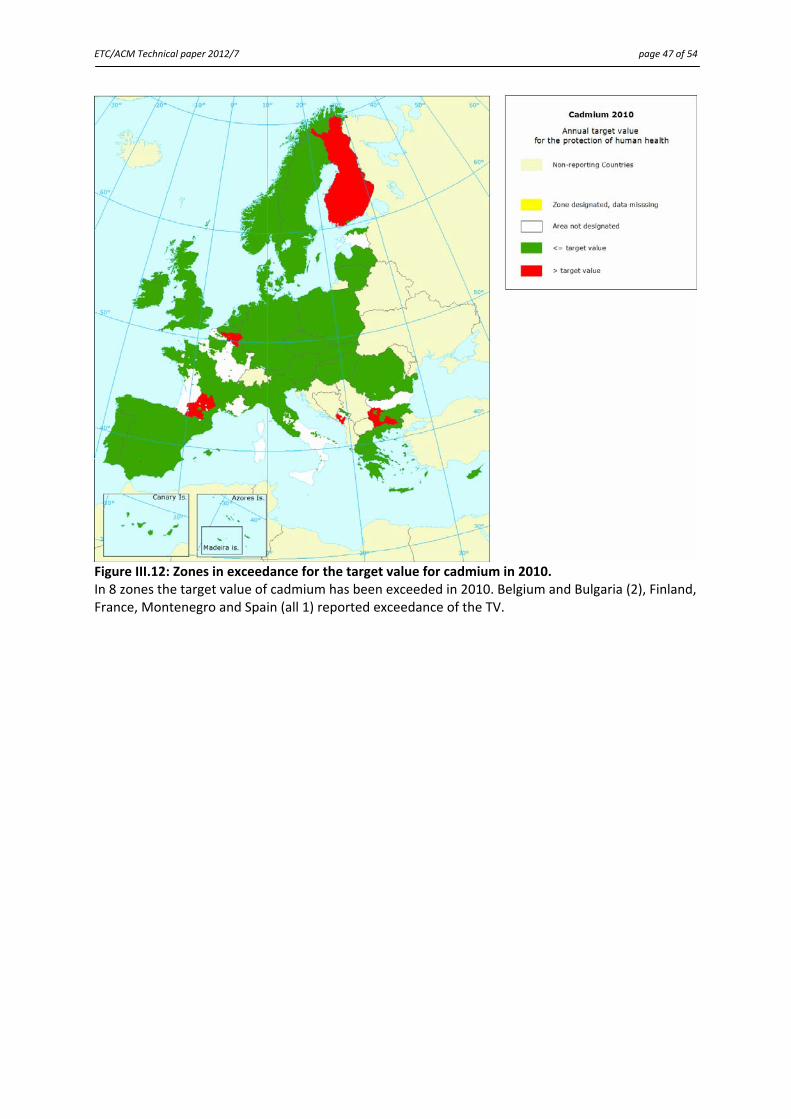
ETC/ACM Technical paper 2012/7 page 47 of 54
Figure III.12: Zones in exceedance for the target value for cadmium in 2010. In 8 zones the target value of cadmium has been exceeded in 2010. Belgium and Bulgaria (2), Finland, France, Montenegro and Spain (all 1) reported exceedance of the TV.
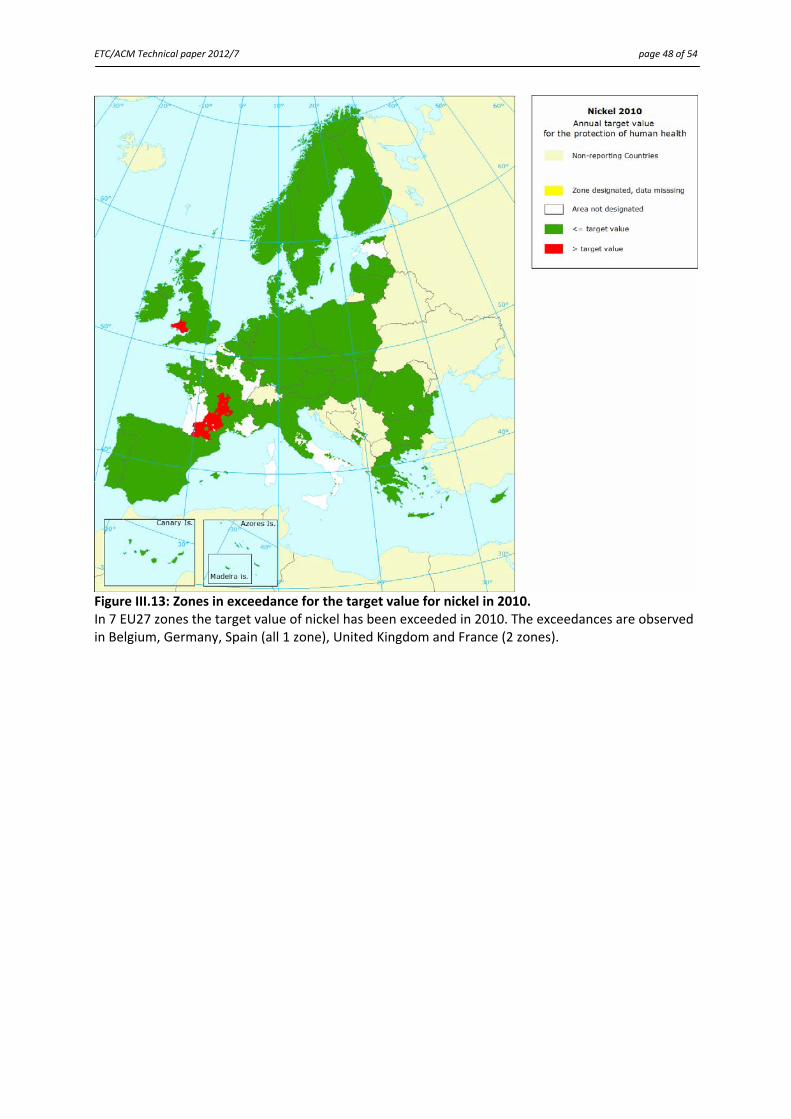
ETC/ACM Technical paper 2012/7 page 48 of 54
Figure III.13: Zones in exceedance for the target value for nickel in 2010. In 7 EU27 zones the target value of nickel has been exceeded in 2010. The exceedances are observed in Belgium, Germany, Spain (all 1 zone), United Kingdom and France (2 zones).
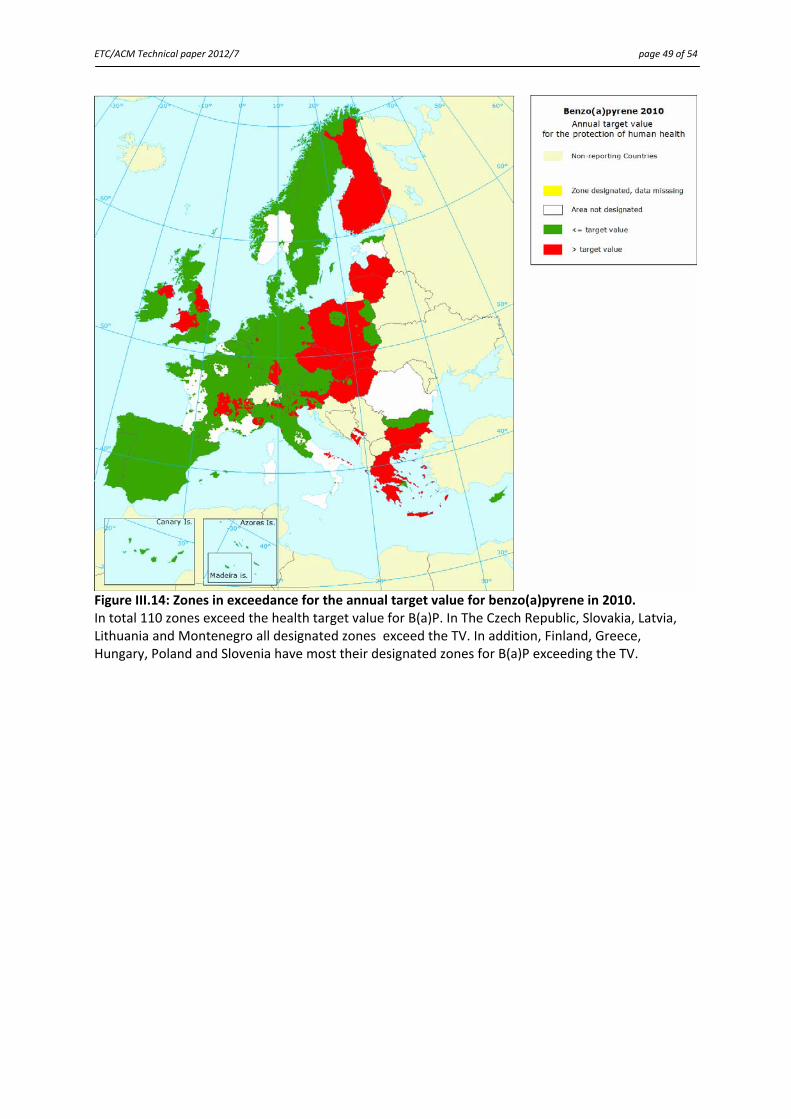
ETC/ACM Technical paper 2012/7 page 49 of 54
Figure III.14: Zones in exceedance for the annual target value for benzo(a)pyrene in 2010. In total 110 zones exceed the health target value for B(a)P. In The Czech Republic, Slovakia, Latvia, Lithuania and Montenegro all designated zones exceed the TV. In addition, Finland, Greece, Hungary, Poland and Slovenia have most their designated zones for B(a)P exceeding the TV.

ETC/ACM Technical paper 2012/7 page 50 of 54
ETC/ACM Technical Paper 2012/7 page 51 of 54
Annex IV. List of zones in relation to AQ standards
This annex presents a summary of air quality status for each pollutant‐pollution target combination at the national level. A full list of zones in EU Member States in relation to the air quality standards as set in the air quality Directive is available as electronic annex List_of_zones_2010.xls from the ETC/ACC website: http://acm.eionet.europa.eu/reports/docs/AQQlist_of_Zones_2010_ETC_ACM_TP_2012_7.xls Information extracted from forms 8 and 9.
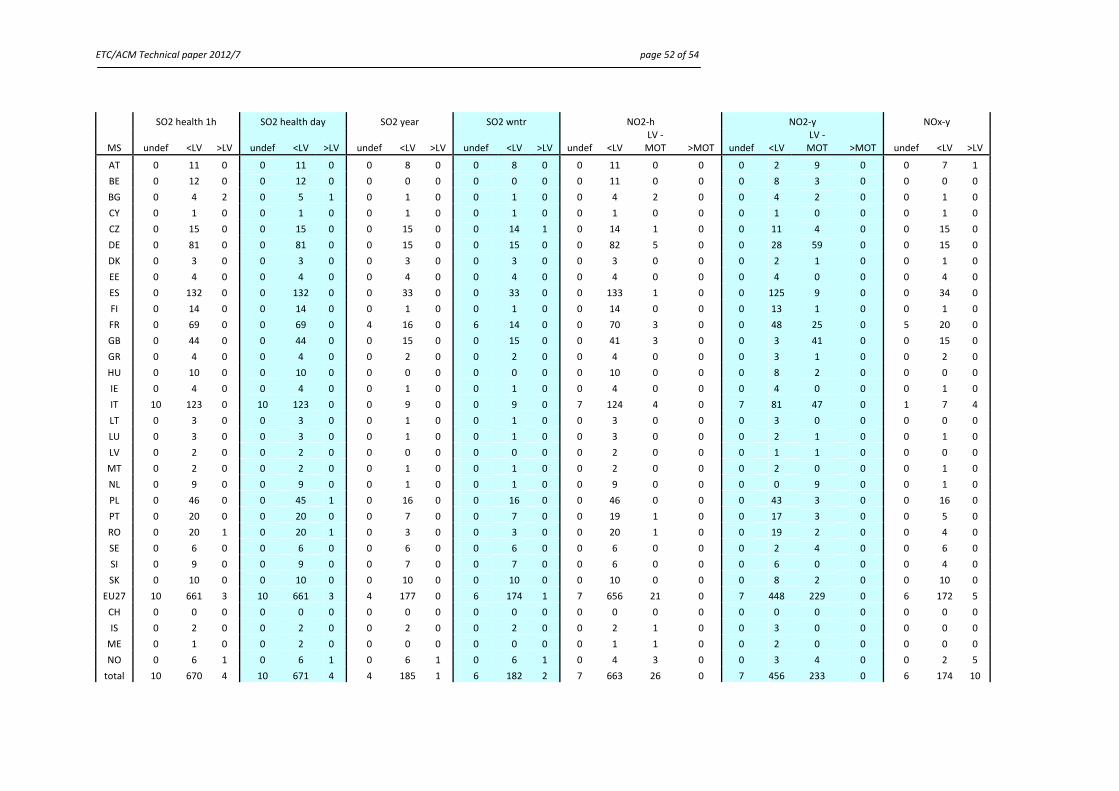
ETC/ACM Technical paper 2012/7 page 52 of 54
SO2 health 1h SO2 health day SO2 year SO2 wntr NO2‐h NO2‐y NOx‐y
MS undef <LV >LV undef <LV >LV undef <LV >LV undef <LV >LV undef <LV LV ‐ MOT >MOT undef <LV
LV ‐ MOT >MOT undef <LV >LV
AT 0 11 0 0 11 0 0 8 0 0 8 0 0 11 0 0 0 2 9 0 0 7 1
BE 0 12 0 0 12 0 0 0 0 0 0 0 0 11 0 0 0 8 3 0 0 0 0
BG 0 4 2 0 5 1 0 1 0 0 1 0 0 4 2 0 0 4 2 0 0 1 0
CY 0 1 0 0 1 0 0 1 0 0 1 0 0 1 0 0 0 1 0 0 0 1 0
CZ 0 15 0 0 15 0 0 15 0 0 14 1 0 14 1 0 0 11 4 0 0 15 0
DE 0 81 0 0 81 0 0 15 0 0 15 0 0 82 5 0 0 28 59 0 0 15 0
DK 0 3 0 0 3 0 0 3 0 0 3 0 0 3 0 0 0 2 1 0 0 1 0
EE 0 4 0 0 4 0 0 4 0 0 4 0 0 4 0 0 0 4 0 0 0 4 0
ES 0 132 0 0 132 0 0 33 0 0 33 0 0 133 1 0 0 125 9 0 0 34 0
FI 0 14 0 0 14 0 0 1 0 0 1 0 0 14 0 0 0 13 1 0 0 1 0
FR 0 69 0 0 69 0 4 16 0 6 14 0 0 70 3 0 0 48 25 0 5 20 0
GB 0 44 0 0 44 0 0 15 0 0 15 0 0 41 3 0 0 3 41 0 0 15 0
GR 0 4 0 0 4 0 0 2 0 0 2 0 0 4 0 0 0 3 1 0 0 2 0
HU 0 10 0 0 10 0 0 0 0 0 0 0 0 10 0 0 0 8 2 0 0 0 0
IE 0 4 0 0 4 0 0 1 0 0 1 0 0 4 0 0 0 4 0 0 0 1 0
IT 10 123 0 10 123 0 0 9 0 0 9 0 7 124 4 0 7 81 47 0 1 7 4
LT 0 3 0 0 3 0 0 1 0 0 1 0 0 3 0 0 0 3 0 0 0 0 0
LU 0 3 0 0 3 0 0 1 0 0 1 0 0 3 0 0 0 2 1 0 0 1 0
LV 0 2 0 0 2 0 0 0 0 0 0 0 0 2 0 0 0 1 1 0 0 0 0
MT 0 2 0 0 2 0 0 1 0 0 1 0 0 2 0 0 0 2 0 0 0 1 0
NL 0 9 0 0 9 0 0 1 0 0 1 0 0 9 0 0 0 0 9 0 0 1 0
PL 0 46 0 0 45 1 0 16 0 0 16 0 0 46 0 0 0 43 3 0 0 16 0
PT 0 20 0 0 20 0 0 7 0 0 7 0 0 19 1 0 0 17 3 0 0 5 0
RO 0 20 1 0 20 1 0 3 0 0 3 0 0 20 1 0 0 19 2 0 0 4 0
SE 0 6 0 0 6 0 0 6 0 0 6 0 0 6 0 0 0 2 4 0 0 6 0
SI 0 9 0 0 9 0 0 7 0 0 7 0 0 6 0 0 0 6 0 0 0 4 0
SK 0 10 0 0 10 0 0 10 0 0 10 0 0 10 0 0 0 8 2 0 0 10 0
EU27 10 661 3 10 661 3 4 177 0 6 174 1 7 656 21 0 7 448 229 0 6 172 5
CH 0 0 0 0 0 0 0 0 0 0 0 0 0 0 0 0 0 0 0 0 0 0 0
IS 0 2 0 0 2 0 0 2 0 0 2 0 0 2 1 0 0 3 0 0 0 0 0
ME 0 1 0 0 2 0 0 0 0 0 0 0 0 1 1 0 0 2 0 0 0 0 0
NO 0 6 1 0 6 1 0 6 1 0 6 1 0 4 3 0 0 3 4 0 0 2 5
total 10 670 4 10 671 4 4 185 1 6 182 2 7 663 26 0 7 456 233 0 6 174 10
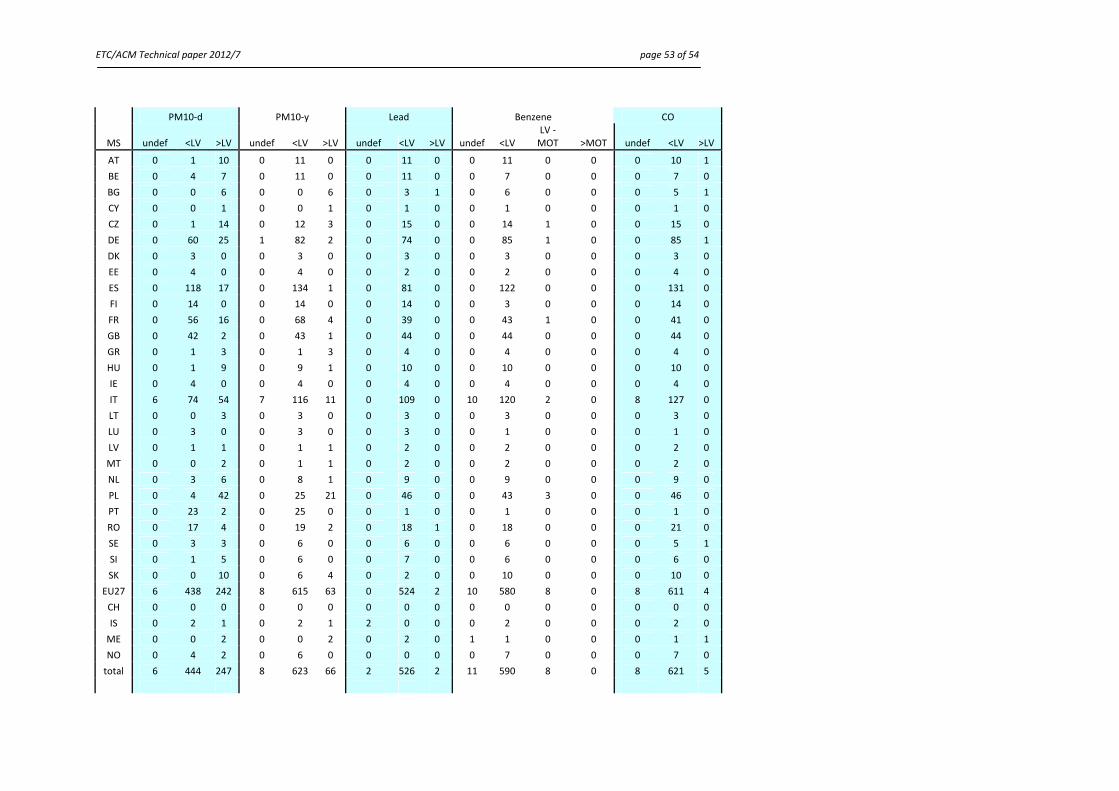
ETC/ACM Technical paper 2012/7 page 53 of 54
PM10‐d PM10‐y Lead Benzene CO
MS undef <LV >LV undef <LV >LV undef <LV >LV undef <LV LV ‐ MOT >MOT undef <LV >LV
AT 0 1 10 0 11 0 0 11 0 0 11 0 0 0 10 1
BE 0 4 7 0 11 0 0 11 0 0 7 0 0 0 7 0
BG 0 0 6 0 0 6 0 3 1 0 6 0 0 0 5 1
CY 0 0 1 0 0 1 0 1 0 0 1 0 0 0 1 0
CZ 0 1 14 0 12 3 0 15 0 0 14 1 0 0 15 0
DE 0 60 25 1 82 2 0 74 0 0 85 1 0 0 85 1
DK 0 3 0 0 3 0 0 3 0 0 3 0 0 0 3 0
EE 0 4 0 0 4 0 0 2 0 0 2 0 0 0 4 0
ES 0 118 17 0 134 1 0 81 0 0 122 0 0 0 131 0
FI 0 14 0 0 14 0 0 14 0 0 3 0 0 0 14 0
FR 0 56 16 0 68 4 0 39 0 0 43 1 0 0 41 0
GB 0 42 2 0 43 1 0 44 0 0 44 0 0 0 44 0
GR 0 1 3 0 1 3 0 4 0 0 4 0 0 0 4 0
HU 0 1 9 0 9 1 0 10 0 0 10 0 0 0 10 0
IE 0 4 0 0 4 0 0 4 0 0 4 0 0 0 4 0
IT 6 74 54 7 116 11 0 109 0 10 120 2 0 8 127 0
LT 0 0 3 0 3 0 0 3 0 0 3 0 0 0 3 0
LU 0 3 0 0 3 0 0 3 0 0 1 0 0 0 1 0
LV 0 1 1 0 1 1 0 2 0 0 2 0 0 0 2 0
MT 0 0 2 0 1 1 0 2 0 0 2 0 0 0 2 0
NL 0 3 6 0 8 1 0 9 0 0 9 0 0 0 9 0
PL 0 4 42 0 25 21 0 46 0 0 43 3 0 0 46 0
PT 0 23 2 0 25 0 0 1 0 0 1 0 0 0 1 0
RO 0 17 4 0 19 2 0 18 1 0 18 0 0 0 21 0
SE 0 3 3 0 6 0 0 6 0 0 6 0 0 0 5 1
SI 0 1 5 0 6 0 0 7 0 0 6 0 0 0 6 0
SK 0 0 10 0 6 4 0 2 0 0 10 0 0 0 10 0
EU27 6 438 242 8 615 63 0 524 2 10 580 8 0 8 611 4
CH 0 0 0 0 0 0 0 0 0 0 0 0 0 0 0 0
IS 0 2 1 0 2 1 2 0 0 0 2 0 0 0 2 0
ME 0 0 2 0 0 2 0 2 0 1 1 0 0 0 1 1
NO 0 4 2 0 6 0 0 0 0 0 7 0 0 0 7 0
total 6 444 247 8 623 66 2 526 2 11 590 8 0 8 621 5
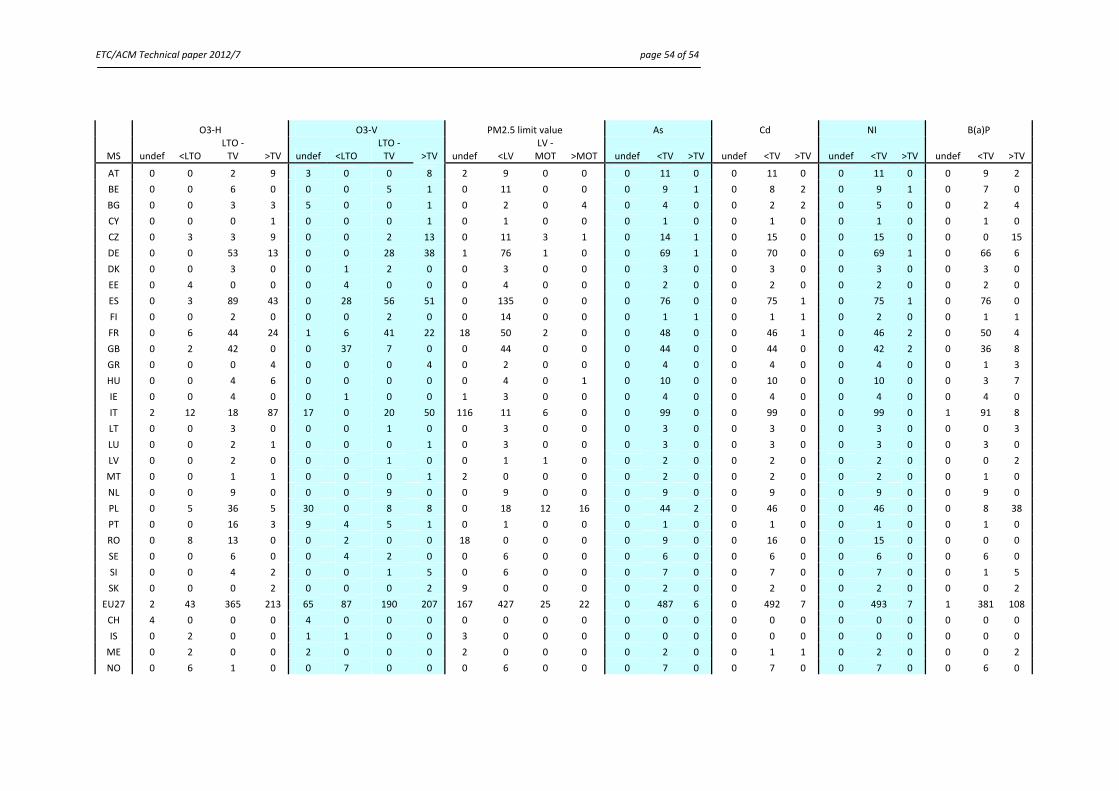
ETC/ACM Technical paper 2012/7 page 54 of 54
O3‐H O3‐V PM2.5 limit value As Cd NI B(a)P
MS undef <LTO LTO ‐ TV >TV undef <LTO
LTO ‐ TV >TV undef <LV
LV ‐MOT >MOT undef <TV >TV undef <TV >TV undef <TV >TV undef <TV >TV
AT 0 0 2 9 3 0 0 8 2 9 0 0 0 11 0 0 11 0 0 11 0 0 9 2
BE 0 0 6 0 0 0 5 1 0 11 0 0 0 9 1 0 8 2 0 9 1 0 7 0
BG 0 0 3 3 5 0 0 1 0 2 0 4 0 4 0 0 2 2 0 5 0 0 2 4
CY 0 0 0 1 0 0 0 1 0 1 0 0 0 1 0 0 1 0 0 1 0 0 1 0
CZ 0 3 3 9 0 0 2 13 0 11 3 1 0 14 1 0 15 0 0 15 0 0 0 15
DE 0 0 53 13 0 0 28 38 1 76 1 0 0 69 1 0 70 0 0 69 1 0 66 6
DK 0 0 3 0 0 1 2 0 0 3 0 0 0 3 0 0 3 0 0 3 0 0 3 0
EE 0 4 0 0 0 4 0 0 0 4 0 0 0 2 0 0 2 0 0 2 0 0 2 0
ES 0 3 89 43 0 28 56 51 0 135 0 0 0 76 0 0 75 1 0 75 1 0 76 0
FI 0 0 2 0 0 0 2 0 0 14 0 0 0 1 1 0 1 1 0 2 0 0 1 1
FR 0 6 44 24 1 6 41 22 18 50 2 0 0 48 0 0 46 1 0 46 2 0 50 4
GB 0 2 42 0 0 37 7 0 0 44 0 0 0 44 0 0 44 0 0 42 2 0 36 8
GR 0 0 0 4 0 0 0 4 0 2 0 0 0 4 0 0 4 0 0 4 0 0 1 3
HU 0 0 4 6 0 0 0 0 0 4 0 1 0 10 0 0 10 0 0 10 0 0 3 7
IE 0 0 4 0 0 1 0 0 1 3 0 0 0 4 0 0 4 0 0 4 0 0 4 0
IT 2 12 18 87 17 0 20 50 116 11 6 0 0 99 0 0 99 0 0 99 0 1 91 8
LT 0 0 3 0 0 0 1 0 0 3 0 0 0 3 0 0 3 0 0 3 0 0 0 3
LU 0 0 2 1 0 0 0 1 0 3 0 0 0 3 0 0 3 0 0 3 0 0 3 0
LV 0 0 2 0 0 0 1 0 0 1 1 0 0 2 0 0 2 0 0 2 0 0 0 2
MT 0 0 1 1 0 0 0 1 2 0 0 0 0 2 0 0 2 0 0 2 0 0 1 0
NL 0 0 9 0 0 0 9 0 0 9 0 0 0 9 0 0 9 0 0 9 0 0 9 0
PL 0 5 36 5 30 0 8 8 0 18 12 16 0 44 2 0 46 0 0 46 0 0 8 38
PT 0 0 16 3 9 4 5 1 0 1 0 0 0 1 0 0 1 0 0 1 0 0 1 0
RO 0 8 13 0 0 2 0 0 18 0 0 0 0 9 0 0 16 0 0 15 0 0 0 0
SE 0 0 6 0 0 4 2 0 0 6 0 0 0 6 0 0 6 0 0 6 0 0 6 0
SI 0 0 4 2 0 0 1 5 0 6 0 0 0 7 0 0 7 0 0 7 0 0 1 5
SK 0 0 0 2 0 0 0 2 9 0 0 0 0 2 0 0 2 0 0 2 0 0 0 2
EU27 2 43 365 213 65 87 190 207 167 427 25 22 0 487 6 0 492 7 0 493 7 1 381 108
CH 4 0 0 0 4 0 0 0 0 0 0 0 0 0 0 0 0 0 0 0 0 0 0 0
IS 0 2 0 0 1 1 0 0 3 0 0 0 0 0 0 0 0 0 0 0 0 0 0 0
ME 0 2 0 0 2 0 0 0 2 0 0 0 0 2 0 0 1 1 0 2 0 0 0 2
NO 0 6 1 0 0 7 0 0 0 6 0 0 0 7 0 0 7 0 0 7 0 0 6 0