
First Application of Large Reactivity Measurement ... - arXiv
Upload
khangminh22Category
view
0download
0
1
Measurement of ambient NO3 reactivity: Design, characterization 1
and first deployment of a new instrument 2
Jonathan M. Liebmann1, Gerhard Schuster1, Jan B. Schuladen1, Nicolas Sobanski1, Jos Lelieveld1 and 3 John N. Crowley1 4 1Atmospheric Chemistry Department, Max-Planck-Institut für Chemie, 55128 Mainz, Germany. 5
Correspondence to: John N. Crowley ([email protected]) 6
Abstract. We describe the first instrument for measurement of the rate constant (s-1) for reactive loss (i.e. the total reactivity) 7
of NO3 in ambient air. Cavity-ring-down spectroscopy is used to monitor the mixing ratio of synthetically generated NO3 (≈ 8
30-50 pptv) after passing through a flow-tube reactor with variable residence time (generally 10.5 s). The change in 9
concentration of NO3 upon modulation of the bath gas between zero-air and ambient air is used to derive its loss rate 10
constant, which is then corrected for formation and decomposition of N2O5 via numerical simulation. The instrument is 11
calibrated and characterized using known amounts of NO and NO2 and tested in the laboratory with an isoprene standard. 12
The lowest reactivity that can be detected (defined by the stability of the NO3 source, instrumental parameters and NO2 13
mixing ratios) is 0.005 s-1. An automated dilution procedure enables measurement of NO3 reactivities up to 45 s-1, this upper 14
limit being defined mainly by the dilution accuracy. The typical total uncertainty associated with the reactivity measurement 15
at the centre of its dynamic range is 16 %, though this is dependent on ambient NO2 levels. Results from the first successful 16
deployment of the instrument at a forested mountain site with urban influence are shown and future developments outlined. 17
18
Atmos. Meas. Tech. Discuss., doi:10.5194/amt-2016-381, 2016Manuscript under review for journal Atmos. Meas. Tech.Published: 29 November 2016c© Author(s) 2016. CC-BY 3.0 License.

2
1 Introduction 19
Large amounts of biogenic and anthropogenic trace gases are emitted annually into the atmosphere. Recent estimates 20
(Guenther et al., 2012) suggest that about 1000 Tg of biogenic volatile organic compounds (bVOC), especially isoprene 21
(contributing 50 %) and monoterpenes (15 %) are emitted annually by vegetation. The global burden of anthropogenic 22
emission is dominated by CO2, CO, N2O, CH4, SO2, NO2 and organic carbon, the latter contributing about 11 Tg (Huang et 23
al., 2015). In particular, nitrogen oxides from combustion and microbial activity in soils have a major impact on the 24
chemistry of the natural atmosphere (Crutzen, 1973). Most VOCs are oxidized efficiently in the Earth’s boundary layer, the 25
oxidizing capacity of which represents 15% of that of the entire atmosphere (Lelieveld et al., 2016). Biogenic and 26
anthropogenic VOCs have a significant impact on air quality and human health and knowing and understanding their 27
lifetimes, which are determined by the oxidizing capacity of the atmosphere, is prerequisite to predicting future atmospheric 28
composition and related climate phenomena (Lelieveld et al., 2008). 29
During day-time, photo-chemically formed OH radicals represent the dominant contribution to the oxidative capacity of the 30
atmosphere. As OH levels are vastly reduced in the absence of sunlight, the NO3 radical (formed by reaction of NO2 with O3, 31
R1) is the major oxidizing agent for many biogenic terpenoids and other unsaturated compounds at night-time (Brown and 32
Stutz, 2012; Ng et al., 2016; Wayne et al., 1991; Atkinson, 2000; Atkinson and Arey, 2003a, b). 33
NO2 + O3 → NO3 + O2 (R1) 34
NO3 reacts rapidly with NO (R2, rate constant 2.6 x 10⁻¹¹ cm3 molecule-1 s-2 at 298 K (Atkinson et al., 2004)) and undergoes 35
rapid photolysis (R5, R6) so that its lifetime is usually of the order of seconds during the day and its concentration too low 36
for it to be considered an important day-time oxidant. 37
At night, NO3 can react with NO2 forming N2O5, which thermally decomposes to set up a thermal equilibrium between NO2, 38
NO3 and N2O5 (R3, R4) with N2O5 formation favoured by lower temperatures. As both NO3 and N2O5 are formed from NOx 39
(NOx = NO + NO2) the loss of either NO3 via gas-phase losses or N2O5 via heterogeneous uptake to particles or deposition 40
implies a reduction in NOx, and thus a reduction in the rate of photochemical O3 formation (Dentener and Crutzen, 1993). In 41
addition, heterogeneous loss of N2O5 can also result in release of ClNO2 from chloride containing particles (R7) (Phillips et 42
al., 2012; Mielke et al., 2011; Osthoff et al., 2008; Riedel et al., 2012; Thornton et al., 2010). The main loss processes of 43
NO3 are summarised in Fig. 1. 44
NO3 + NO → 2 NO2 (R2) 45
NO2 + NO3 + M → N2O5 + M (R3) 46
N2O5 + M → NO3 + NO2 + M (R4) 47
NO3 + hν → NO2 + O (R5) 48
NO3 + hν → NO + O2 (R6) 49
N2O5 + surface → NO3- (and/or ClNO2) (R7) 50
Atmos. Meas. Tech. Discuss., doi:10.5194/amt-2016-381, 2016Manuscript under review for journal Atmos. Meas. Tech.Published: 29 November 2016c© Author(s) 2016. CC-BY 3.0 License.
3
In rural and forested areas reaction with biogenic VOCs can dominate the loss of NO3 (Mogensen et al., 2015). Especially 51
terpenoids like limonene (k = 1.2 x 10⁻¹¹ cm3 molecule-1 s-1), α-pinene (k = 6.2 x 10⁻¹² cm3 molecule-1 s-1) and isoprene (k = 52
6.5 x 10⁻¹³ cm3 molecule-1 s-1) have high rate constants for reaction with NO3 (IUPAC, 2016; Ng et al., 2016). Under such 53
conditions, when NOx levels are low, NO3 mixing ratios may be sub-pptv and below the detection limit for most instruments 54
(Rinne et al., 2012). 55
The reaction of NO3 with traces gases containing unsaturated C=C bonds proceeds via addition to form nitroxy-alkyl radicals 56
that undergo rapid reaction with O2 to form nitroxy-alkyl peroxy radicals. The peroxy radicals react further (with HO2, NO, 57
NO2 or NO3,) to form multi-functional organic nitrates, which can contribute to generation and growth of secondary organic 58
aerosols (Fry et al., 2014; Ng et al., 2016) or be lost by deposition. 59
The role of NO3 as an oxidizing agent may be assessed via its total reactivity (or inverse lifetime). Whereas for OH, 60
experimental methods for measuring total reactivity in ambient air exist (Kovacs and Brune, 2001; Sinha et al., 2008), NO3 61
reactivity has not yet been directly measured. Stationary-state approximations have often been used to calculate NO3 62
lifetimes from its mixing ratio and production rate, the latter being given by: k1[NO2][O3] (Sobanski et al., 2016b; Brown et 63
al., 2009; Brown et al., 2007a; Brown et al., 2007b; Geyer and Platt, 2002; Heintz et al., 1996). Thus the stationary-state 64
turnover lifetime, τss, can be calculated according to expression 1. 65
𝑘𝑘𝑠𝑠𝑠𝑠 = 1𝜏𝜏𝑠𝑠𝑠𝑠
= [𝑁𝑁𝑁𝑁3]𝑘𝑘1[𝑁𝑁3] [𝑁𝑁𝑁𝑁2]
(1) 66
This method is applicable when the chemical lifetime of NO3 is sufficiently short so that stationary-state can be achieved 67
within transport time from emission to measurement location (Brown et al., 2003). Formally it is achieved when the 68
production and loss of NO3 and N2O5 are balanced (Brown et al., 2003; Crowley et al., 2011). The time to acquire stationary-69
state depends on production and loss rates for NO3 and N2O5 and can take several hours. This approach can break down 70
under conditions of moderate to high NO2 levels, strong sinks, low temperatures, or very clean air masses in which the sinks 71
for NO3 and N2O5 become small (Brown et al., 2003). Indeed, Sobanski et al. (2016b) observed much lower stationary-state 72
loss rates compared to those calculated from measured VOC mixing ratios during the PARADE 2011 campaign and 73
concluded that this was mainly the result of sampling from a low lying residual layer with VOC emissions that were too 74
close for NO3 concentrations to achieve stationary-state. They also considered the possibility that NO3 may be formed by the 75
oxidation of NO2 by Criegee Intermediates, which would bias calculations of its reactivity. 76
Summarizing, NO3 reactivity with respect to gas-phase losses is a direct indication of night-time oxidation rates of VOCs, 77
with direct impacts on NOx levels by forming long-lived reservoir species (alkyl nitrates) some of which will partition to the 78
particle phase. Via modification of N2O5 concentrations, the NO3 reactivity indirectly controls heterogeneous NOx losses and 79
ClNO2 formation rates. 80
In this paper we describe a newly developed instrument that enables point measurements of NO3 reactivity in ambient air. 81
After introducing the methodology in section 2, we show the results of extensive laboratory characterization of the 82
Atmos. Meas. Tech. Discuss., doi:10.5194/amt-2016-381, 2016Manuscript under review for journal Atmos. Meas. Tech.Published: 29 November 2016c© Author(s) 2016. CC-BY 3.0 License.

4
instrument along with discussion of the uncertainties associated with those measurements in section 3 to 5. In section 6 we 83
present a dataset of ambient NO3 reactivity obtained at a forested / urban location in south-western Germany. 84
2 Methodology 85
Our experiments to measure NO3 reactivity involve comparison of loss rates of synthetically generated NO3 in zero-air and 86
in ambient air introduced into a flow-tube reactor. In zero-air, the loss of NO3 is due to its reaction with NO2 (present as a 87
necessary component in the generation of NO3, see below) and losses on surfaces of the flow-tube. When zero-air is replaced 88
by ambient air, NO3 is additionally removed by reaction with reactive gases present and its mixing ratio reduced accordingly. 89
An analysis of the change in signal for a fixed reaction time enables the NO3 reactivity to be derived once certain corrections 90
have been applied (see below). 91
Figure 2 displays a schematic diagram of the experimental set-up. The three central components are a dark reactor for 92
generation of NO3, the flow-tube in which NO3 reacts with trace gases in ambient air samples and the detection system for 93
NO3. 94
2.1 Generation of NO3 95
Many laboratory studies of NO3 kinetics have used the thermal decomposition of N2O5 as NO3 source (R4) (Wayne et al., 96
1991). The generation of NO3 from gas-phase N2O5 eluted from samples of crystalline N2O5 (at -80 °C) was found to be 97
insufficiently stable for the present application and is also difficult to use during field campaigns where adequate laboratory 98
facilities for the safe generation and purification of N2O5 are frequently not available. In addition, this method of NO3 99
generation was also accompanied by an NO2 impurity of several parts per billion (ppbv). 100
We therefore generate NO3 and N2O5 in situ, via the oxidation of NO2 by O3 (R1, R3). For this purpose, 400 standard cm3 101
min-1 (sccm) of synthetic air from a zero-air generator (Fuhr Cap 180) are passed over a Hg lamp (low-pressure, Penray type) 102
at a pressure of 1200 Torr. The photo-dissociation of O2 at 184.95 nm results in formation of oxygen atoms that recombine 103
with O2 to form ≈ 400 ppbv O3. The O3 / air flow is then mixed with NO2 in synthetic air (0.93 ppbv, 1-10 sccm) and 104
directed into a temperature stabilized (30 °C), darkened, FEP coated reactor (length 70 cm, diameter 6 cm) also at a pressure 105
of 1200 Torr. The reactor is darkened to prevent the photolysis of NO3 by room lights. Operation at above-ambient pressure 106
extends the reaction time for a given flow rate, thus optimising the conversion of NO2 to NO3 via the reaction between NO2 107
and O3, which has a low rate constant of 4.05 × 10⁻¹⁷ cm3 molecule-1 s-1 at 30 °C. The use of high pressures also optimises the 108
formation of N2O5 in the termolecular reaction R3, and reduces the rate of diffusion and loss of NO3 to the walls of the 109
reactor. A high pressure in the darkened reactor also has the advantage of decoupling it from fluctuations in ambient 110
pressure, which influence the formation of N2O5. Heating the reactor to above room-temperature is carried out to stabilise the 111
formation of N2O5, which otherwise shows strong fluctuations owing to variations in laboratory temperature, typically about 112
Atmos. Meas. Tech. Discuss., doi:10.5194/amt-2016-381, 2016Manuscript under review for journal Atmos. Meas. Tech.Published: 29 November 2016c© Author(s) 2016. CC-BY 3.0 License.

5
3-5 degrees within the course of a day or night. The approximate reaction time for the stepwise conversion of NO2 to N2O5 in 113
the darkened reactor is ≈ 5 min. 114
The gas exiting the darkened reactor passes through a pin-hole (Ø ≈ 250 µm) to reduce the pressure to roughly ambient level 115
and then enters a ≈ 30 cm long piece of ¼ inch (≈ 6.4 mm) PFA tubing (residence time ≈ 0.5 s) which is heated to 140 °C in 116
order to thermally decompose N2O5 to NO3. Calculations using the thermal decomposition rate constant for N2O5 (lifetime = 117
0.001 s at 140°C) indicate that after ≈ 0.1 s the N2O5 is stoichiometrically converted to NO3. The temperature is measured on 118
the outside of the PFA tubing and does not necessarily reflect the temperature of the gas flowing through it. The value of 119
140 °C is chosen based on a series of experiments in which the tubing temperature was varied and the yield of NO3 120
monitored. A PFA T-piece located immediately behind the heated tubing is used to add a 2900 sccm flow of either zero- or 121
ambient-air to the synthetic NO3 sample. After this dilution step the air contains ≈ 50 pptv NO3, ≈ 1 ppbv NO2 and ≈ 50 ppbv 122
O3. As described later, keeping NO2 and O3 levels as low as possible has important consequences for the data analysis. Low 123
levels of NO3 also help to ensure that the addition of NO3 does not significantly change the reactivity of the air, i.e. by 124
removing a large fraction of the reactive trace gases. 125
As described below, the present instrument is a modification of one designed to measure ambient mixing ratios of NO3 and 126
N2O5 and is equipped with a second cavity connected to a heated inlet that measures the sum of NO3 and N2O5. Experiments 127
in which both cavities were used to analyze the flow out of the heated piping indicated that there was no residual N2O5. 128
2.2 Detection of NO3 using cavity-ring-down spectroscopy 129
For detection of the NO3 radical we used Cavity Ring-Down Spectroscopy (CRDS), a sensitive technique for measurements 130
of atmospheric trace gases and often used for measurement of ambient NO3 (Brown et al., 2002). In essence, CRDS is an 131
extinction measurement in a closed optical resonator (cavity) where light is trapped between mirrors with high reflectivity to 132
generate a very long absorption path. Ring-down refers to the decay of light intensity (monitored behind the cavity exit 133
mirror) and the general expression to derive the concentration of an absorbing or scattering gas is given by (Berden et al., 134
2000): 135
[X] = 1cσ(x,λ)
� 1τX− 1
τ0� (2) 136
Where τ0 and τx correspond to decay constants in the absence and presence of an absorbing or scattering trace gas X, 137
respectively and σ(X,λ) is the absorption cross-section / scattering coefficient of X at wavelength λ. 138
The instrument used is a two-channel CRDS that was previously used to measure ambient levels of N2O5 and NO3 (Crowley 139
et al., 2010; Schuster et al., 2009). Important modifications to the previous set-up include use of FEP coated glass cavities of 140
equivalent size and fibre-optics for the coupling of the laser to the cavity. The thermal dissociation cavity previously used for 141
detection of atmospheric N2O5 is not necessary for the measurement of NO3 lifetimes but was used for calibration and 142
characterization experiments. Only the central features and important modifications compared to the prototype described in 143
Schuster et al., (2009) are described in detail here. 144
Atmos. Meas. Tech. Discuss., doi:10.5194/amt-2016-381, 2016Manuscript under review for journal Atmos. Meas. Tech.Published: 29 November 2016c© Author(s) 2016. CC-BY 3.0 License.

6
The light source is a 625 Hz, square-wave modulated, 100 mW laser-diode located in a Thor Labs TCLDM9 housing and 145
thermally stabilized at 36°C using a Thor Labs ITC 502 Laser-Diode Combi Controller to produce light at 661.95 nm (0.5 146
nm full width at half maximum) and therefore close to the NO3 absorption maximum. The effective cross section of NO3 was 147
calculated as 2.09 x 10⁻¹⁷ cm2 molecule-1 by convoluting the temperature dependent NO3 absorption spectrum (Orphal et al., 148
2003; Osthoff et al., 2007) with the laser-diode emission spectrum. Coupling between the laser-diode and the cavities is 149
achieved by using either optical fibres (0.22 NA, 50 µm core, 400-2400 nm) for measuring NO3 reactivity or using fibre-150
optics with a beam splitter (Thor Labs FCMM50-50A-FC, 50:50 ratio) in order to operate both cavities. The beam was 151
collimated (Thor Labs FiberPort Collimator PAF-X-18-PC-A) and directed through an optical isolator (Thorlabs IO-3D-660-152
VLP), focused by a lens (Thorlabs A230TM-A) into the optical-fibre and then collimated again to a beam diameter of about 153
6 mm before entering the cavity. 154
The NO3 cavity (Teflon-coated glass (DuPont, FEP, TE 9568), length 70 cm, volume 79cm3) was operated at room 155
temperature, while the N2O5 cavity was operated at 80°C with a pre-cavity section heated to 85°C in order to convert N2O5 to 156
NO3. The NO3-cavity was connected to the flow-tube using 1/8” (≈ 3.2 mm) PFA tubing that lined the 1/4” (≈ 6.4 mm) 157
injector. The use of small diameter tubing results in short transport times between the flow-tube and CRDS and also induces 158
a pressure drop of 133 mbar, so that the pressure in the cavity was 880 mbar. Gases entered the middle of the cavity via a T-159
piece and were pumped from the ends via a flow controller into the exhaust. The flow rates in both cavities were 3000 cm3 160
(STP) min-1 (sccm) resulting in a residence time of approximately 1.6 s as calculated from the volume flow. Gas entering the 161
CRDS detector was always passed through a 2 µm membrane filter (Pall Teflo) to remove particles. Light exiting the cavities 162
through the rear mirror was detected by a photomultiplier (Hamamatsu E717-500) which was screened by a 662 nm 163
interference filter. The pre-amplified PMT signal was digitized and averaged with a 10 MHz, 12 bit USB scope (Picoscope 164
3424) which was triggered at the laser modulation frequency of 625 Hz. 165
The ring-down constant in the absence of NO3 was obtained by adding NO (1-3 sccm of a 100 ppmv mixture NO in N2) 166
every 40 points of measurement for approximately 15 s. Titration with NO took place at the inlet of the T-shaped glass 167
cavity giving the gas mixture sufficient time to react with NO3. The L/d ratio (the ratio of the distance between the cavity 168
mirrors (L) and the length of the cavity that is filled by absorber (d)) was determined as described previously (Schuster et al., 169
2009; Crowley et al., 2010) and was 1.01 ±0.03. Values of τ0 in dry zero-air at 760 Torr were usually between 140 and 170
160 µs indicating optical path lengths of ≈ 42-48 km. When operated at a flow of 3000 sccm, the noise levels on the NO3 171
signal are such that the precision (3s integration interval) is better than 1 pptv. As we describe later, the NO3 reactivity is 172
derived from measurements of the relative change in the NO3 mixing ratio, so that the precision rather than total uncertainty 173
in the NO3 mixing ratio defines the accuracy of the reactivity measurement. 174
175
Atmos. Meas. Tech. Discuss., doi:10.5194/amt-2016-381, 2016Manuscript under review for journal Atmos. Meas. Tech.Published: 29 November 2016c© Author(s) 2016. CC-BY 3.0 License.

7
2.3 Flow-tube for NO3 reactivity measurement 176
The flow-tube, thermostatted to 20 °C by flowing water through an outer jacket, is an FEP-coated glass tube of length 50 cm 177
and internal diameter 4 cm. Gas enters the flow-tube at one end via a conical section with a 3/8 inch (≈ 9.5 mm) glass fitting 178
through which ¼ inch (≈ 6.4 mm) PFA tubing could be inserted. The total flow through the flow-tube was 3300 sccm, 179
consisting of 400 sccm from the darkened reactor and 2900 sccm zero-air / ambient air. The flow and pressures indicated 180
above, result in a Reynolds number of ≈ 123 (i.e. laminar flow) in the cylindrical part of the flow-tube, but with an entrance 181
length (Le) to acquire laminar flow of 27 cm indicating that the flow-tube operates in a mixed turbulent / laminar flow 182
regime. 183
𝐿𝐿𝐿𝐿 = 0.112 𝑟𝑟 𝑅𝑅𝐿𝐿 (3) 184
Gases exit the flow-tube via a length of 1/8 inch PFA tubing supported in an axially centred stainless-steel tube (length 50 185
cm, diameter ¼ inch) which could be translated along the major flow-tube axis thus changing the contact (reaction) time 186
between NO3 and any reactive species or the flow-tube wall. In principal, this enables the dynamic range of the measurement 187
to be adjusted (i.e. long contact times for low reactivity, short contact times for high reactivity) though we found that 188
reactivity-dependent dilution of the ambient air was a better method to extend the dynamic range to high reactivities as very 189
short reaction times were not possible due to a finite residence time in the CRDS detection system and also due to mixing 190
effects in the flow-tube. In order to prevent formation of a “dead volume” at the back of the flow-tube beyond the tip of the 191
outlet, 400 sccm were removed via a critical orifice to the exhaust pump. During measurement of NO3 reactivity the 192
extraction point was usually set for a reaction time of about 10.5 s, which was determined as described below. 193
As described later, to derive the NO3 reactivity we compare its concentration in zero-air to that in ambient air samples. We 194
found that when switching between sampling ambient air and dry, zero-air, the resulting change in relative humidity caused 195
an abrupt change in NO3 which then slowly recovered towards its original value. Measurement of the wall loss rate of NO3 196
in dry and humidified zero-air by moving the injector (see below) revealed no substantial difference and we conclude that 197
the change in NO3 is due to wall loss at the point of mixing of NO3 flows and the zero-air flow, which is very turbulent. In 198
order to eliminate data loss while waiting for signals to stabilise following zeroing, we humidify the zero-air to the same 199
absolute humidity (±2 %) as ambient. To do this, the ambient relative humidity was monitored by passing 100 sccm air over 200
a sensor that recorded both temperature and relative humidity. The zero-air was humidified by directing a variable fraction of 201
the (constant) total flow through a 2 l gas wash-bottle filled with HPLC grade water. The relative humidity of the resulting 202
mixture was matched to ambient levels by dynamic adjustment of the fractional flow passing through the wash-bottle. The 203
zero-air used for purging the mirrors as well that used for NO3 generation was not humidified. 204
In order to ensure that air from the zero-air generator was free of reactive gases that survived the catalytic purification 205
process, we compared it to hydrocarbon-free, bottled synthetic air (Westfalen). No change in the concentration of [NO3] 206
could be observed when switching between zero-air and bottled air, indicating that the zero-air generator was suitable. 207
Atmos. Meas. Tech. Discuss., doi:10.5194/amt-2016-381, 2016Manuscript under review for journal Atmos. Meas. Tech.Published: 29 November 2016c© Author(s) 2016. CC-BY 3.0 License.

8
However, poisoning of the catalyst of the zero-air generator by amines, sulphides or thiols or contamination of the filters 208
could potentially become problematic when using compressed, highly polluted ambient air. 209
2.3.1 Derivation of the effective reaction time and wall loss rate constant for NO3 210
In flow-tubes where radial, diffusive mixing of gases is rapid (i.e. at low pressures of He and “plug-flow” conditions), the 211
effective reaction time can be close to that calculated from the volumetric flow rate once axial diffusion is accounted for 212
(Howard, 1979). At higher pressures and laminar flow, reactions times are defined by the parabolic velocity distribution and 213
extent of radial mixing whereas high pressure flow-tubes operated under turbulent conditions (Reynold numbers > 3000) 214
plug-flow can be achieved (Donahue et al., 1996; Seeley et al., 1993). According to the calculations of Reynolds numbers 215
outlined above, our flow-tube is not operated in either a pure laminar or turbulent regime, which can make accurate 216
calculation of the reaction time difficult. Using the volumetric flow rate and flow-tube diameter, we calculate an average, 217
linear velocity of the gas of 4.78 cm s-1 at 760 Torr and 298 K in the cylindrical section of the flow-tube. This enables us to 218
calculate the injector position dependent reaction time in the flow-tube, which for 45 cm is 9.5 s. This should be regarded as 219
an initial estimate of the true reaction time as it does not consider the non cylindrical section of the flow-tube (2.5 % of total 220
volume), the radial distribution of velocities in the flow-tube or mixing effects. A further additional 1.6 s must be added to 221
this to take the average reaction time in the cavity into account (calculated from the cavity volume and the flowrate) resulting 222
in an approximate, total reaction time of 11.1 s. 223
A further method to derive an “effective” or averaged reaction time is to add a short pulse of gas to the flow-tube and 224
monitor its arrival time at the detector. However, as NO3 cannot be easily stored, we instead add a pulse of a reactant that 225
removes NO3. A syringe was therefore used to add a short pulse (0.1 cm3 in < 0.5 s) of NO diluted in N2 (0.22 ppbv) to the 226
flow-tube at the T-piece where the NO3 source and zero-air are mixed. 227
The resultant depletion in the NO3 signal (measured at a time resolution of 0.35 s) displayed an inverted Gaussian form with 228
an elongated flank after the minimum (Fig. 3) which can be attributed to non-isothermal effects, secondary flows and 229
recirculation processes in the flow-tube (Huang et al., 2016) which require fluid dynamics simulations to be fully 230
characterised. The average reaction time, t, can however be derived from: 231
𝑡𝑡 = ∑𝐼𝐼𝑗𝑗𝑡𝑡𝑗𝑗∑𝐼𝐼𝑗𝑗
(4) 232
where Ij is the signal recorded at each time step tj 233
In total, 25 experiments were conducted, resulting in an effective reaction time of 11.4 ± 0.5 s determined via expression (4). 234
The two methods outlined above thus provide approximate values for the reaction time which are in good agreement (< 3 % 235
deviation). 236
As the reaction time is a central parameter for calculating the NO3 reactivity, a third method was employed, in which a 237
known amount of NO was added at the usual mixing point and the depletion in NO3 observed. As the rate constant for 238
reaction of NO with NO3 is known with an uncertainty (at room temperature) of 13 %, this should enable derivation of an 239
Atmos. Meas. Tech. Discuss., doi:10.5194/amt-2016-381, 2016Manuscript under review for journal Atmos. Meas. Tech.Published: 29 November 2016c© Author(s) 2016. CC-BY 3.0 License.

9
effective reaction time that also takes all mixing effects (both in the flow-tube and cavity) into account. In a series of 240
experiments, known amounts NO were added to the 2900 sccm flow of zero-air (via a calibrated mass flow controller) at the 241
usual mixing point. In the absence of other processes which remove or form NO3, its change in concentration upon adding 242
NO is described by: 243
[NO3]t = [NO3]0 𝐿𝐿𝑒𝑒𝑒𝑒−(𝑘𝑘2[NO]+𝑘𝑘𝑤𝑤+𝑘𝑘3[𝑁𝑁𝑁𝑁2])𝑡𝑡 (5) 244
Where [NO3]0 and [NO3]t are the concentrations of NO3 before and after addition of NO, respectively. k2 and k3 are the rate 245
constants for reaction of NO3 with NO and NO2, respectively at the flow-tube / cavity temperature, kw is the rate constant (s-246 1) for loss of NO3 at the flow-tube walls and t is the desired parameter. Rearranging, we get a simple expression (6), which 247
shows that a plot of ln([NO3]t versus [NO] should yield a slope of k2t, from which t can be derived using an evaluated and 248
recommended value of k2 (Atkinson et al., 2004). Once corrected for the contribution from 𝑘𝑘5[NO2], the intercept should, in 249
principal, give a value of kw. 250
𝑙𝑙𝑙𝑙 [NO3]0[NO3]t
= 𝑘𝑘2[NO]𝑡𝑡 + 𝑘𝑘𝑤𝑤 + 𝑘𝑘3[NO2] (6) 251
A plot of [NO3]t versus [NO] is displayed in Fig. 4a for three different amounts of added NO2. Although the curve follows 252
roughly exponential behaviour as expected, the slopes and thus the value of t obtained was found to depend on the initial 253
NO2 concentration, with values of 5.7, 5.1 and 4.5 s obtained for NO2 mixing ratios of 2.94, 5.88 and 8.82 ppbv, 254
respectively. This indicates that the kinetics of NO3 formation and loss are more complex than defined by expression (6) and 255
the relative rates of reaction of NO3 with NO (R2) and NO2 (R3) and its formation via N2O5 decomposition (R4) and reaction 256
of O3 with NO2 (R1) in the flow-tube all impact on the NO3 mixing ratio. In Fig. 4b we display the results of a similar 257
experiment in which NO2 as added. In this case, there is obvious curvature in the plot of [NO3]t versus [NO2], which is not 258
predicted by expression (5). The decomposition of N2O5 formed by reaction R3 as well as oxidation of NO2 by O3 (R1, see 259
section 3.1) both lead to the formation of NO3 and are the causes of this behaviour, especially at high [NO2] and low [NO]. 260
At the flow-tube and cavity temperature (circa 298 K), the rate constant for decomposition of N2O5 (k4) is 4.4x10⁻² s-1 261
(Atkinson et al., 2004). 262
Extraction of the reaction time thus required numerical simulation of the data obtained by adding various amounts of NO, to 263
the flow-tube in the presence of different NO3 and NO2 concentrations. The impact of reactions R2, R3 and R4 was assessed 264
by numerical simulations using FACSIMILE (Curtis and Sweetenham, 1987) and considering the reactions listed in Table 1. 265
The input parameters for the simulations were the concentrations of NO, NO2 and O3 and the rate constants, which were 266
taken from IUPAC recommendations (Atkinson et al., 2004). The total reaction time (t) and the wall-loss rate constant for 267
NO3 (kw) were adjusted until each of the six datasets could be reproduced with a single value for each parameter. The initial 268
concentration of [NO3]0, was allowed to float until best agreement was achieved. This way, the reaction time was determined 269
to be 10.5 s, which is in good agreement with that derived by pulsed addition of NO. As our reactivity derivation relies on 270
the change in NO3 signal upon adding a reactant to the flow-tube, we consider the value of 10.5 s, which takes mixing, 271
Atmos. Meas. Tech. Discuss., doi:10.5194/amt-2016-381, 2016Manuscript under review for journal Atmos. Meas. Tech.Published: 29 November 2016c© Author(s) 2016. CC-BY 3.0 License.

10
diffusion etc. into account to be the most appropriate value but assign an uncertainty (± 1 s) that overlaps with the other 272
methods. The wall loss rate of NO3 (which is independent of the NO and NO2 concentrations) was found to be 4 × 10⁻³ s-1. 273
For analysis of ambient reactivity we use a reaction time of 10.5 s as derived from the addition of NO. This means that our 274
ambient reactivities are directly tied to the rate constant for reaction between NO3 and NO. As described later, during 275
ambient measurements we periodically add a known amount of NO to the zero-air to monitor a known reactivity under real 276
operating conditions. 277
Figures 5a and 5b show the correlation between simulated and measured NO3 concentrations in these experiments. In both 278
cases the slope is close to unity (0.97-1.02) with an intercept close to zero. A set of similar experiments performed at 30 % 279
and 80 % humidity also showed excellent agreement using the same values of t and kw. We conclude that the behaviour of 280
NO3 in this system can be very accurately predicted by numerical simulations using a simple reaction scheme under a variety 281
of conditions (initial NO3, NO and NO2 varied), giving us confidence in our ability to extract loss rates for NO3 in ambient 282
air. 283
When gas-phase reactivity is low, a substantial fraction of NO3 may be lost via collisions with the walls rather than due to 284
reactive gases. For this reason, we re-measured the value of kw obtained above in a further set of experiments in which the 285
NO3 concentration was measured as a function of injector position (contact time in the flow-tube) at a constant initial mixing 286
ratio of NO3 and NO2 and in the absence of NO. For this we calculate the reaction time for each of the three injector 287
positions from pulsed addition of NO as described above, but normalized to the reaction time derived from addition of NO 288
with numerical simulation. The results of such an experiment are displayed in Fig. 6 and we draw attention to the fact that, 289
even at maximum reaction time (10.5 s), the change in the NO3 concentration is only about 10 %. This reflects the low 290
efficiency of reaction of NO3 with the FEP coated glass walls. To put this result in context, performing the same experiment 291
in a non-coated glass tube results in the almost complete loss of NO3. The numerical simulation was initialised with the same 292
set of rate parameters described above, a fixed NO2 concentration and only kw and the initial NO3 concentration were varied. 293
The best fit was obtained when kw was 4 × 10⁻³ s-1, in agreement with the simulations at fixed time and variable NO and NO2. 294
Using expression (7), this value of kw can be converted to an approximate uptake coefficient for NO3 to the FEP-coated tube 295
of ≈ 5x10⁻⁷. 296
𝛾𝛾 = 2 𝑟𝑟 𝑘𝑘𝑤𝑤𝑐𝑐
(7) 297
3 Data analysis and derivation of NO3 reactivity 298
We first consider the passage of NO3 through the flow-tube in a flow of zero-air. If NO3 is lost in one or more pseudo-first-299
order processes, its decay should be exponential and its concentration, [NO3]tZA after a reaction time t, is given by expression 300
(8). 301
[NO3]𝑡𝑡ZA = [NO3]0ZA𝐿𝐿𝑒𝑒𝑒𝑒(−𝑘𝑘ZA𝑡𝑡) (8) 302
Atmos. Meas. Tech. Discuss., doi:10.5194/amt-2016-381, 2016Manuscript under review for journal Atmos. Meas. Tech.Published: 29 November 2016c© Author(s) 2016. CC-BY 3.0 License.

11
Where the superscript “ZA” refers to use of zero-air. As NO3 is lost only via reaction with NO2 and to the wall, 𝑘𝑘ZA =303
𝑘𝑘wall + 𝑘𝑘NO2 where kw is the first-order loss rate constant for wall-loss and kNO2 is the first-order loss rate constant for 304
reaction with NO2 and is equal to k3[NO2]. When zero-air is switched for ambient air containing reactive trace gases (RTG), 305
we have: 306
[NO3]𝑡𝑡Amb = [NO3]0Amb𝐿𝐿𝑒𝑒𝑒𝑒(−𝑘𝑘Amb𝑡𝑡) (9) 307
where 𝑘𝑘Amb = 𝑘𝑘w + 𝑘𝑘NO2 + 𝑘𝑘RTG and kRTG is the first-order loss rate constant for reaction of NO3 with trace gases present 308
in ambient air other than NO2. 309
If [NO3]0ZA and [NO3]0
Amb are equivalent, expression 10 is obtained. 310
[NO3]tZA
𝑒𝑒𝑒𝑒𝑒𝑒�−𝑘𝑘ZA𝑡𝑡�= [NO3]t
Amb
𝑒𝑒𝑒𝑒𝑒𝑒�−𝑘𝑘Amb𝑡𝑡� (10) 311
Rearranging and substituting for kZA and kAmb leads to 312
𝑘𝑘RTG =ln�
[NO3]tZA
[NO3]tAmb�
𝑡𝑡= 1 𝜏𝜏� (11) 313
Where τ is the NO3 lifetime. In principal, it should thus be possible to calculate the reactivity of NO3 in ambient air by 314
measuring [NO3]tZA, [NO3]tAmb and knowing the reaction time t. Later we discuss the applicability of this expression and 315
show that corrections are necessary to take the re-formation of NO3 into account, especially when dealing with air-masses 316
with high NO2 content. This is similar to the laboratory experiments described above and required numerical simulation, 317
which we present below. 318
The concentration of NO3 in zero-air measured when the injector is positioned for maximum reaction time, [NO3]tZA, was 319
measured by flushing the inlet with 3000 sccm zero-air creating an overflow of ≈ 100 sccm. When switching to ambient 320
measurements, the zero-air overflow was redirected via a flow controller, F3, that connected the zero-air overflow line to the 321
exhaust and which was set to 3500 sccm. This setup has the advantage of enabling dynamic dilution of ambient air. If the 322
reactivity is so high that the NO3 levels approached the detection limit, F3 does not withdraw the entire 3500 sccm overflow 323
but allows e.g. 2000 sccm to be added to the inlet, resulting in sampling 900 sccm of ambient air plus 2000 sccm of zero-air, 324
a dilution factor of 2900/900 which is slightly increased by the 400 sccm flow from the darkened reactor. A five point 325
dynamic dilution with zero-air is implemented in the software, which changes the set point for F3 and dilutes the ambient air 326
with zero-air if [NO3]tAmb decreases below 10 pptv for an average time period of 30 s. Conversely, the dilution can be 327
decreased again if [NO3]tAmb becomes ≥ [NO3]tZA − 10 ppt. Dilution factors (Di) were determined using a Gilibrator flow 328
meter (Gilian Gilibrator-2) and were: D1=1.14 for the measurement of pure ambient air (here the small dilution effect is 329
caused by the 400 sccm zero-air used in the production of NO3), D2=1.74, D3=3.71, D4=8.98, D5=14.07 when diluting 330
ambient air. With increasing dilution, errors in the measurement will increase as well (see later). 331
The analytical expression given above to derive the NO3 reactivity is an ideal case in which NO3 is lost by a number of first-332
order processes and is not formed in the flow-tube to a significant extent. However, as we already demonstrated in the 333
laboratory experiments to examine the effects of varying NO, NO2 and NO3 concentrations, the formation of N2O5 in the 334
Atmos. Meas. Tech. Discuss., doi:10.5194/amt-2016-381, 2016Manuscript under review for journal Atmos. Meas. Tech.Published: 29 November 2016c© Author(s) 2016. CC-BY 3.0 License.

12
reaction of NO3 with NO2 (R3) and its thermal decomposition back to NO3 can impact on the NO3 concentration as NO2 is 335
present both in the mixture used to generate N2O5 and NO3 and also in ambient air. While the formation of N2O5 from NO2 336
and NO3 (R2) is, to a good approximation, independent of temperature between about 280 and 305 K, the rate constant for 337
thermal decomposition of N2O5 (R3) varies by a factor of 26 over the same temperature range. The simple, analytical 338
approach outlined above thus fails at temperatures where the decomposition of N2O5 is important and when sufficient NO2 is 339
present to account for a significant fraction of the loss of NO3. This is illustrated In Fig. 7a, in which simulations of the NO3 340
concentration at a reaction time of 10.5 s and at different temperatures and amounts of NO2 (as reactant) are displayed and 341
compared with the simple exponential behaviour (black data points) calculated from expression (11). The simulations show 342
that the dependence of the NO3 concentration on NO2 is non-exponential, indicating that re-generation of NO3 from the N2O5 343
formed is significant, especially at higher temperatures. Figure 7b plots the ratio of the true reactivity (i.e. that used as input 344
into the numerical simulation) versus that obtained by analyzing the simultaneous change in NO3 concentration using 345
expression (11). It is evident that the use of this expression generally results in underestimation of the true reactivity due to 346
the formation and decomposition of N2O5. The bias will be largest when sampling polluted air where the reactivity has a 347
large component due to NO2 and small under conditions of low NO2 and high kRTG typical for remote, forested areas. 348
However as previously mentioned the decomposition of N2O5 is strongly temperature dependent so that the bias will increase 349
with rising temperature and decrease with sinking flow-tube temperature. 350
Apart from the formation and thermal dissociation of N2O5, the reaction of NO2 with O3 may, under some conditions, 351
represent a further potential source of NO3 in the flow-tube despite the low rate constant for (R1). Due to the in-situ method 352
of production of N2O5 and NO3 in the dark reactor, NO2 (0.6-3 ppbv) and O3 (40-50 ppbv) are always present in the flow-353
tube. NO3 generated in the flow-tube was therefore simulated for different amounts of O3 and NO2 corresponding to the 354
minimum and maximum mixing ratios used in our experiments. Figure 8 indicates that with 50 ppbv of O3 and 2 ppbv NO2, 355
< 0.5 pptv of NO3 is formed in the 10.5 s available for reaction in the flow-tube, which would not strongly impact on the 356
results if the analytical expressions above were used to derive the NO3 reactivity. Under highly polluted conditions (e.g. 100 357
ppbv O3 and 20 ppbv NO2) the effect is however measureable (> 2 pptv). 358
The discussion above indicates that the use of expression (11) can, under certain circumstances (e.g. low NOx, high NO3 359
reactivity to VOCs) give a reasonable representation of the NO3 reactivity. However, in order to be able to derive NO3 360
reactivities from any air mass we prefer to use numerical simulation take NO3 reformation into account and enable extraction 361
of accurate values in any conditions. 362
3.1 Numerical simulations for extraction of ambient reactivity 363
In this section we outline the experimental procedure and the associated data analysis for extracting the NO3 reactivity from 364
an ambient dataset as exemplified by the data shown in Fig. 9. This data covers a 1 hour period in which several phases of 365
inlet-overfilling with humidified zero-air and titration with NO are apparent as are periods of mixing NO3 with ambient air. 366
Atmos. Meas. Tech. Discuss., doi:10.5194/amt-2016-381, 2016Manuscript under review for journal Atmos. Meas. Tech.Published: 29 November 2016c© Author(s) 2016. CC-BY 3.0 License.

13
The dataset has already been corrected for baseline drift in the NO3 zero during titration, hence each titration-zero is 367
scattered around 0 pptv NO3. 368
The periods marked “ZA” (zero-air) were used to extract the NO3 concentration after a residence time of 10.5 s in flow-tube 369
in the absence of ambient reactive trace gases. The data show that a plateau in the NO3 signal with zero-air is observed after 370
about 2-3 titration cycles are complete, which is the result of slow flushing through the inlet of reactive gases. Once a stable 371
signal is acquired, [NO3]𝑡𝑡=10.5ZA can be taken as an average value for each 300 s zero-air phase. These values are then used to 372
calculate the initial NO3 concentration [NO3]0ZA , i.e. before NO3 enters the flow-tube. This was done in an interative 373
procedure using numerical simulation with FACSIMILE embedded in a separate program. Input values are the O3 and NO2 374
concentration (from the darkened reactor), a first estimate for [NO3]𝑡𝑡=0ZA and the rate coefficients for the NO3 reactions listed 375
in Table 1. At the end of the simulation (a few seconds of computing time) the simulated and measured values of [NO3]𝑡𝑡=10.5ZA 376
are compared and the ratio used to adjust the next input value for [NO3]𝑡𝑡=0ZA . The iteration continued until convergence was 377
reached. Convergence was considered satisfactory when the deviation between measured and simulated values of 378
[NO3]𝑡𝑡=10.5ZA was less ≤1 %. This usually took only 5 simulations per data point as the initial value for each new time point 379
was chosen to be the final value for the preceding time point. Ideally, [NO3]𝑡𝑡=0ZA should be constant over long periods of time. 380
In fact, deviations of several pptv, especially during field measurements, were observed over periods of hours and so values 381
of [NO3]𝑡𝑡=0ZA were linearly interpolated to each time point in which ambient reactivity was recorded. 382
Once initial NO3 concentrations had thus been obtained a new set of simulations was started to simulate the measured values 383
of [NO3]𝑡𝑡=10.5Amb . In this case, the simulation was initialized with the values of [NO3]𝑡𝑡=0ZA obtained as described above and the 384
total NO2 concentration and O3 concentrations, which contained a constant contribution from the dark-reactor and a variable 385
concentration from ambient NO2 and O3 once corrected by the dilution factor (see above). An initial estimate of the total 386
NO3 reactivity, kRTG, was made and the simulated value of [NO3]𝑡𝑡=10.5Amb compared to that measured. The simulation was 387
iterated, with incremental adjustment of kRTG until agreement between simulation was ≤1 %. For ambient datasets, in which 388
the reactivity can be highly variable this sometimes took several iterations, though as each simulation took less than a second 389
this is not a particularly time consuming procedure. 390
4 Reactivity of an isoprene standard. 391
To validate our experimental and analytical procedure, we performed reactivity measurements on a bottled isoprene standard 392
(0.933 ± 0.09 ppmv, Westfalen), diluted in zero-air. Isoprene was chosen as it is an important biogenic reactant for NO3 in 393
the troposphere and also because the rate coefficient, kisoprene, for its reaction with NO3 has been studied on many occasions 394
(Atkinson et al., 2006; IUPAC, 2016) and therefore has a low associated uncertainty (kisoprene = 6.5 ± 0.15 x 10⁻¹³ cm3 395
molecule-1 s-1 at 298 K). 396
Atmos. Meas. Tech. Discuss., doi:10.5194/amt-2016-381, 2016Manuscript under review for journal Atmos. Meas. Tech.Published: 29 November 2016c© Author(s) 2016. CC-BY 3.0 License.

14
Experiments were carried out at various isoprene and NO2 mixing ratios and the results are summarized in Fig. 10, which 397
indicates excellent agreement between the measured reactivity and that calculated from the isoprene mixing ratio and rate 398
coefficient, the slope of an unweighted fit being 1.00 ± 0.03. The error bars on the calculated reactivity represent total 399
uncertainty in the isoprene and NO2 mixing ratio, the reaction time and the rate coefficient. These results confirm that the 400
instrument and data analysis procedure measure accurate values of NO3 reactivity in the presence of NO2 and organic 401
reactants. 402
5 Detection Limit, dynamic range and overall uncertainty 403
While the overall uncertainty associated with absolute NO3 concentration measurement are influenced by factors such as 404
uncertainty in the cross-section as well as in the measurement of the laser emission spectrum the fractional change in 405
concentration used to derive the NO3 reactivity is not impacted. The detection limit for measuring NO3 reactivity is defined 406
by the minimal detectable change (MDCNO3) in the NO3 mixing ratio. This depends on noise levels and drift in ring-down-407
time, i.e. on the precision of the NO3 signal and also on the stability of the synthetically generated NO3. The instrumental 408
noise on the NO3 signal was reduced by averaging over ≈ 3 s per data-point (≈ 1800 ring-down-events) to give a noise 409
limited detection limit of ≈ 0.2 pptv. Precision is limited by the stability of the CRDS setup where changes in the mirror 410
reflectivity induced by thermal or mechanical stress can lead to a drift in the ring-down time. The precision can be estimated 411
from the standard deviation of the signal from one zeroing period to the next over the measurement period. Under typical 412
laboratory conditions this was normally ≈ 0.7 pptv. 413
Since [NO3]0ZA is interpolated onto the measured [NO3]tAmb time series to calculate the reactivity, the stability of the NO3 414
source is of great importance. Changes in the amount of synthetically generated NO3 are caused by fluctuations in the 415
temperature or pressure of the dark-reactor, the flow of NO2 and changes in the intensity of light from the O3 generator. In 416
general, the poorer the stability of the NO3 source chemistry, the more frequently the NO3 mixing ratio in zero-air has to be 417
measured. In laboratory conditions, changes of ±1 pptv within one hour were typical, making [NO3]tZA measurements every 418
1200 s more than sufficient. In field conditions, where the instrument housing may be subject to larger temperature 419
fluctuations, more frequent determination of [NO3]tZA may be necessary. The NO3 source stability was obtained from the 420
standard deviation of the averaged [NO3]tZA concentrations and propagating this with the standard deviation of two 421
consecutive [NO3]tZA measurements, for which typical values in laboratory conditions were ≈ 1 ppt. To define an overall, 422
minimal detectable change in NO3 (MDCNO3), the noise and drift limited precision was combined with the NO3 source 423
stability to result in MDCNO3 = 2.5 pptv. 424
An MDCNO3 of 2.5 pptv results in a lower limit for the measurement of NO3 reactivity of 0.005 s-1 (obtained from expression 425
(11) with [NO3]tZA = 50 pptv and [NO3]tAmb = [NO3]tZA −𝑀𝑀𝑀𝑀𝑀𝑀𝑁𝑁𝑁𝑁3 = 47.5 pptv, at the lowest dilution factor of 1.14). An 426
upper limit for the measurable reactivity is 45 s-1, largely defined by the uncertainty of the dilution factor. Dilution factors 427
Atmos. Meas. Tech. Discuss., doi:10.5194/amt-2016-381, 2016Manuscript under review for journal Atmos. Meas. Tech.Published: 29 November 2016c© Author(s) 2016. CC-BY 3.0 License.

15
were obtained by measurements of the actual flows going into the flow-tube using a Gilibrator flow meter (Gilian Gilibrator-428
2, stated accuracy ±1%). The total uncertainty in the dilution factor is defined by the accuracy of the measurement of the 429
dilution flows as well as by the accuracy of the flow controllers used for flow regulation (± 2 %) and was calculated to be 430
2.5 %. The error in the calculated reactivity is lowest for the lowest dilution but if the [NO3]tAmb gets close to the detection 431
limit this will also have a strong influence on the calculated reactivities making a higher dilution factor favourable. Dilution 432
factors were chosen to keep the instrument operating in a region (10 pptv < NO3 < 40 pptv) where both effects are 433
minimized. 434
A minimum detectable change in NO3 of 2.5 pptv leads to an uncertainty of ≈ 15 %, when NO3 varies between ≈ 10 und 30 435
pptv (starting from 50 pptv in zero-air). The uncertainty increases dramatically when NO3 levels are close to 50 pptv (i.e. 436
very low reactivity) or less than 5 pptv (very high reactivity without dilution). This is illustrated in Figure S1 of the 437
supplementary information. As mentioned in section 2.3.1 the uncertainty in the reaction time (10 %) also contributes to the 438
overall uncertainty. 439
To assess the uncertainty associated with derivation of the NO3-reactivity from numerical simulation, uncertainties 440
associated with the input parameters have to be considered. As previously demonstrated (Groß et al., 2014) this is best 441
assessed in a Monte-Carlo approach in which the key parameters are varied within a range reflecting their uncertainty limits. 442
The parameters that most sensitively influence the derived value of NO3 reactivity are the NO2 mixing ratio and the rate 443
coefficients for N2O5 formation (k3 = 1.2 ± 0.1 x 10⁻¹² cm3 molecule-1 s-1) and decomposition (k4 = 4.4 ± 0.4 x 10⁻² cm3 444
molecule-1 s-1). The rate coefficients listed are for 1 bar and room temperature as appropriate for the experimental conditions, 445
the uncertainties quoted (≈ 10 %) are based on assessment of kinetic data (Burkholder et al., 2016). The Monte Carlo 446
simulations were initiated with a NO3 mixing ratio (in zero-air) of 50 pptv, decreasing to 20 pptv upon reaction with air. In 447
total, 6 sets of ≈ 1200 simulations were carried with variation of the initial NO2 mixing ratio between 1 and 5 ppbv and the 448
associated error in NO2 mixing ratio was taken as 8 %. For any given simulation, the output value of the NO3 reactivity 449
(kRTG) was stored. The 2σ uncertainty was derived from the Gausssian fits to histograms of kRTG (insets at NO2 = 1.0, 3.0 and 450
5.0 ppbv) and is plotted (as a percent of kRTG) versus kRTG / NO2. The latter may be considered a measure of whether NO3 451
reacts predominantly with NO2 to form N2O5 (k3) or with reactive trace gases. Fig. 11 shows that the uncertainty associated 452
with the simulations is very sensitive to ambient NO2 levels, varying between > 100 % (at 5 ppbv NO2 and a reactivity of 453
0.017 s-1) to 3.1 % (at 1 ppbv NO2 and a reactivity of 0.092 s-1) of the extracted kRTG. Clearly, the extraction of kRTG is most 454
accurate in conditions of low NOx and when NO3 lifetimes are short (e.g. forested regions far from anthropogenic activity). 455
Another potential bias in the measurement is the temperature dependence of the rate constant of the reactions of trace gases 456
with NO3. Measurements were normally conducted at 20 °C in the flow-tube whilst outside temperature can differ from this. 457
However, (unlike OH) the NO3 reactions which dominate its reactivity involve addition to double bonds (e.g. of terpenes) 458
and are only weakly temperature dependent. Therefore, to a good approximation, this error can be neglected. Under 459
Atmos. Meas. Tech. Discuss., doi:10.5194/amt-2016-381, 2016Manuscript under review for journal Atmos. Meas. Tech.Published: 29 November 2016c© Author(s) 2016. CC-BY 3.0 License.

16
circumstances where the reactivity is known to be driven by reaction with reactive trace gases for which NO3 has large 460
temperature dependence this error has to be taken into consideration. 461
The overall uncertainty thus derives from a combination of measurement errors (cavity instability, drift in NO3 source etc.) 462
and the need to correct for NO3 reactions with NO2. Under ideal conditions (e.g. as described above for laboratory operation) 463
the former can be reduced to ≈ 16 %. For a scenario in which biogenic VOCs dominate NO3 reactivity in a low NOx 464
(< 1 ppbv) environment an additional uncertainty of ≈ 6-10 % from the numerical simulations results in a total uncertainty of 465
≈ 17-20 %. In a high NOx environment, the total uncertainty will be dominated by that associated with the simulations. For 466
example, at 5 ppbv NO2 and a reactivity of 0.03 s-1 the total error would be close to 45-50 %. 467
6 Deployment in the NOTOMO campaign, 2015 468
The NO3 reactivity set-up described above was deployed for the first time in the field during the NOTOMO campaign 469
(NOcturnal chemistry at the Taunus Observatorium: insights into Mechanisms of Oxidation) in the Taunus mountains (S.W. 470
Germany) in 2016. The site, previously described in detail (Crowley et al., 2010; Sobanski et al., 2016b), is situated on top of 471
the “Kleiner Feldberg” mountain (850 m above sea level) in a forested area with urban influence. The site is impacted by 472
biogenic emissions from forested regions (mainly in the north/west) and by anthropogenic emissions from the local urban 473
centres of Frankfurt, Mainz and Wiesbaden in the south-east to south-west. 474
6.1 Reactivity measurements during NOTOMO 475
The NO3 reactivity instrument was located in a research container and sampled from a common, high-flow inlet together 476
with other instruments. The high-flow inlet was driven by an industrial fan drawing 10 m3 min-1 through a 15 cm diameter 477
stainless steel pipe with its opening about 8 m above the ground. This flow was sub-sampled with a 4 m length of ¼-inch 478
PFA tubing that extracted the required 3300 sccm air from the centre of the stainless steel pipe and directed it through a 1 479
µm PFA filter to the NO3-reactivity instrument. Due to thermostat break-down during NOTOMO, the NO3-reactivity 480
measurements were performed with the flow-tube at container temperature, which was variable (14 - 31 °C). 481
Previous campaigns at the Taunus Observatory have revealed occasionally high night-time mixing ratios of NO3 and N2O5 482
(Sobanski et al., 2016b). As sampling NO3 and N2O5 from ambient air would bias the NO3-reactivity measurements to low 483
values, a 2 l glass flask heated to ≈ 40-50 °C was placed at night in the ambient air stream to decompose N2O5 to NO3 and 484
NO2. Based on its thermal dissociation rate coefficient (0.75 s-1 at 50 °C), N2O5 completely decomposes within the ≈ 40 s 485
residence time in this glass vessel, and the NO3 formed is expected to be lost on the uncoated glass walls, thus preventing 486
reformation of N2O5. Measurements with ≈ 200 pptv of N2O5 added directly to the heated vessel and measured by the 487
ambient and heated channels of the two-cavity CRDS (see section 2.2) confirmed that neither NO3 nor N2O5 survived. As the 488
N2O5 mixing ratio was measured during NOTOMO it is in principal possible to correct the data for the additional NO2 thus 489
generated. However, on most nights N2O5 levels were too low for this to have a significant effect. Further experiments with 490
Atmos. Meas. Tech. Discuss., doi:10.5194/amt-2016-381, 2016Manuscript under review for journal Atmos. Meas. Tech.Published: 29 November 2016c© Author(s) 2016. CC-BY 3.0 License.

17
isoprene and α-pinene indicated that there was no significant change in NO3-reactivity when the glass vessel was used or not, 491
indicating no significant losses of these VOCs in the glass flask. We cannot exclude that other, less volatile organic trace 492
gases including e.g. acids or peroxides may be lost in the glass vessel, but these are not expected to contribute significantly 493
to NO3 losses as their rate coefficients for reaction with NO3 are generally too low. A further potential bias related to the use 494
of the glass trap is the thermal decomposition of PAN and related peroxy nitrates, which can acquire concentrations of up to 495
a few ppb at this site (Thieser et al., 2016; Sobanski et al., 2016c). If PAN decomposes in the glass vessel NO2 will form, 496
thus contributing to the measured reactivity. Simulations indicate that during the 40 s residence time in the heated flask (at 497
50 °C) only a small fraction (≈ 2.6 %) of the PAN decomposes to form NO2. For future experiments in environments of high 498
NOx with N2O5 and NO3 present, the system will be operated at a lower temperature (e.g. 35 °C, τPAN = ~500 s, τ N2O5 = ~6 s) 499
to make sure all of the N2O5/NO3 is removed but PAN is preserved. We note that when measuring NO3-reactivity in regions 500
with large biogenic emissions, the use of the glass vessel to remove NO3 and N2O5 is generally not necessary as high levels 501
of biogenic VOCs and the low levels of NOx often found in forested / rural environments remote from anthropogenic 502
influence will result in very low levels of NO3 or N2O5. 503
During NOTOMO, ambient levels of NO2, NO3, N2O5 and organic nitrates were measured with the CRDS instruments 504
previously described by Sobanski et al. (Sobanski et al., 2016a; Thieser et al., 2016). The uncertainty in the measurements 505
was 8 % for NO2, 20 % for NO3 whereas the uncertainty for PAN was highly variable for each data point (Sobanski et al., 506
2016c). The O3 mixing ratios were measured using a dual beam ozone monitor (2B-Technology Model 202) with an 507
uncertainty of 2 %. [NO] was not directly measured but its day-time concentration was calculated assuming photo-508
stationary-state via expression (12): 509
[NO]calc = J(NO2) [NO2] / k(NO+O3)[O3] (12) 510
where J(NO2) is the photolysis frequency of NO2 and k(NO+O3) is the rate constant for reaction of NO with O3. This expression 511
ignores the oxidation of NO to NO2 via e.g. reactions of peroxy radicals and thus overestimates NO. J(NO2) was measured 512
using a spectral radiometer located close to the inlet (MetCon). 513
In this manuscript we focus on a three-day period, during which NO3-reactivity was measured (Fig. 12a). The NO3 514
reactivity, kRTG, varied from 0.005 to 0.1 s-1 during night-time but reached values as high as 1.4 s-1 during day-time. The total 515
uncertainty of the measurement is depicted by the green, shaded area. The red line indicates that, as expected, day-time 516
losses are dominated by reaction with NO (up to 1.3 s-1). Night-time values of kRTG were between 0.005 and 0.1 s-1. 517
Assuming that NO levels are close to zero as measured previously at this site during night-time (Crowley et al., 2010), kRTG 518
is then expected to be dominated by VOCs. 519
In Fig. 12b, we compare values of kRTG obtained by rigorous data correction (black curve), to those calculated directly from 520
expression (11) (blue curve). The simple analytical expression (blue line) results in an underestimation of the reactivity, 521
especially during night, when the overall reactivity is low, and in periods of high [NO2]. Owing to lack of temperature 522
stabilization of the darkened reactor (at this time not yet incorporated) and break-down of the flow-tube thermostat during 523
the campaign, temperature fluctuations in the container resulted in MDCNO3 = 5.6 pptv and hence an average, measureable 524
Atmos. Meas. Tech. Discuss., doi:10.5194/amt-2016-381, 2016Manuscript under review for journal Atmos. Meas. Tech.Published: 29 November 2016c© Author(s) 2016. CC-BY 3.0 License.

18
reactivity of ≈ 0.01 s-1 during the campaign. As described in section 5 the minimum detectable change in NO3 was combined 525
with the uncertainty associated with the dilution factor, reaction time, [NO2], [PAN] and rate constants used to calculate the 526
overall uncertainty for the reactivity at every data point. The overall uncertainty for the measurement period illustrated in 527
Fig. 12 was ≈ 25 %. 528
In Fig. 13a/b we compare the measured night-time NO3-reactivity with that obtained from the stationary-state analysis using 529
expression (1). For the two nights in the period analysed, NO3 mixing ratios were between 5 and 37 pptv ([NO3]>> 5 pptv) 530
and the calculated stationary-state loss rate coefficients varied between 0.03-0.003 s-1 compared to the measured reactivity 531
which was between 0.05-0.006 s-1 with a short time period in which kRTG fell below the detection limit of the instrument. 532
Within the total uncertainty, the measured and stationary-state reactivities are in reasonable agreement for most of the night 533
from the 17th to the 18th. From the night 18th to the 19th the stationary-state reactivity is much lower (up to a factor of eight) 534
than that measured. This difference and also the higher variability can be attributed to rapid variations in concentrations of 535
VOCs at the inlet (due e.g. to emissions from nearby trees) that are not considered in the stationary-state approach; i.e. very 536
local emissions of reactive gases will result in breakdown of the stationary-state assumption leading to the underestimation 537
of the reactivity of the local mixture of VOCs and NOx. As the direct measurement of the NO3 reactivity with this device 538
sums over all VOCs present in the air mass sampled, it should give the same result as summing each VOC concentration 539
multiplied by the individual rate coefficients for reaction with NO3, i.e NO3 reactivity = σ [VOC]iki. As demonstrated 540
previously for this mountain site (Sobanski et al., 2016b), summed losses based on measurement of VOCs can significantly 541
exceed the reactivity based on a stationary-state analysis especially under some meteorological situations in which a low-542
lying residual layer (with high NO3 concentrations) influences the measurement. 543
7 Conclusion and outlook 544
We present the first instrument for measurement of NO3 reactivity in ambient air. The flow-tube based instrument, utilizes 545
the depletion of synthetically generated NO3 when mixed with ambient air and has a dynamic range of 0.005 s-1 to 45s-1. 546
Following intensive laboratory characterization to determine the effective reaction time, the wall loss constant of NO3 and 547
the effect of NO3 formation and reformation in the flow-tube, it was successfully tested against an isoprene standard. The 548
overall uncertainty depends on the relative rate of reaction of NO3 with NO2 or with other traces gases (e.g. VOCs or NO) 549
that do not generate N2O5 and which, under ideal conditions, is close to 15 %. The instrument is thus best suited for 550
measurement of NO3 reactivity in regions with high biogenic activity and relatively low direct anthropogenic emissions of 551
NOx, i.e. regions where the measurement of NO3 concentrations is difficult owing to low production rates and a high loss 552
term. 553
First deployment of the instrument was during the NOTOMO observational experiment in summer 2015 at a forested, 554
mountain site with urban influence. The measured NO3 reactivity ranged from 0.006 to 0.1 to s-1 at night-time and reached 555
values as high as 1.4 s-1 during day-time. As expected, day-time reactivity was dominated by reaction with NO while night-556
Atmos. Meas. Tech. Discuss., doi:10.5194/amt-2016-381, 2016Manuscript under review for journal Atmos. Meas. Tech.Published: 29 November 2016c© Author(s) 2016. CC-BY 3.0 License.
19
time reactivity involved other (presumably organic) trace gases. A comparison with stationary-state calculations of the NO3 557
reactivity revealed poor agreement on occassions, presumably related to very local emissions causing a breakdown of the 558
stationary-state assumption. 559
Improvements to the dynamic range of the instrument require further stabilization of the NO3 source and cavity-optics to 560
reduce the minimal detectable change in NO3 (presently MDCNO3 = 2.5 pptv). This could also be achieved by the use of 561
larger volume flow-tubes. Future deployment with simultaneous measurements of NO3, NO2, O3 and VOCs will be 562
conducted to compare direct measurements of NO3 reactvity with those obtained from the stationary-state approach and also 563
those calculated from summing losses to individual VOCs. 564
Acknowledgements 565
We would like to thank Heinz Bingemer and the staff and department of the Johann Wolfgang Goethe–University, Frankfurt 566
am Main for logistical support and access to the Taunus Observatory during NOTOMO. We also would like to thank Eva 567
Pfannerstil for providing the isoprene standard. We thank DuPont for the sample of FEP used to coat the walls of the flow 568
tube and darkened reactor. This work was carried out in partial fulfilment of the PhD (Johannes Gutenberg University, 569
Mainz, Germany) of Jonathan Liebmann. 570
571
Atmos. Meas. Tech. Discuss., doi:10.5194/amt-2016-381, 2016Manuscript under review for journal Atmos. Meas. Tech.Published: 29 November 2016c© Author(s) 2016. CC-BY 3.0 License.
20
572
References 573
Atkinson, R.: Atmospheric chemistry of VOCs and NOx, Atmos. Env., 34, 2063-2101, 2000. 574 Atkinson, R., and Arey, J.: Gas-phase tropospheric chemistry of biogenic volatile organic compounds: a review, Atmos. Env., 37, S197-575 S219, 2003a. 576
Atkinson, R., and Arey, J.: Atmospheric degradation of volatile organic compounds, Chem. Rev., 103, 4605-4638, 10.1021/cr0206420, 577 2003b. 578 Atkinson, R., Baulch, D. L., Cox, R. A., Crowley, J. N., Hampson, R. F., Hynes, R. G., Jenkin, M. E., Rossi, M. J., and Troe, J.: Evaluated 579 kinetic and photochemical data for atmospheric chemistry: Volume I - gas phase reactions of Ox, HOx, NOx and SOx species, Atmos. 580 Chem. Phys., 4, 1461-1738, 2004. 581 Atkinson, R., Baulch, D. L., Cox, R. A., Crowley, J. N., Hampson, R. F., Hynes, R. G., Jenkin, M. E., Rossi, M. J., and Troe, J.: Evaluated 582 kinetic and photochemical data for atmospheric chemistry: Volume II - reactions of organic species, Atmos. Chem. Phys., 3625-4055, 583 2006. 584 Berden, G., Peeters, R., and Meijer, G.: Cavity ring-down spectroscopy: Experimental schemes and applications, International Reviews in 585 Physical Chemistry, 19, 565-607, 2000. 586 Brown, S. S., Stark, H., and Ravishankara, A. R.: Cavity ring-down spectroscopy for atmospheric trace gas detection: application to the 587 nitrate radical (NO3), Applied Physics B-Lasers and Optics, 75, 173-182, 2002. 588 Brown, S. S., Stark, H., and Ravishankara, A. R.: Applicability of the steady state approximation to the interpretation of atmospheric 589 observations of NO3 and N2O5, J. Geophys. Res. -Atmos., 108, Art. 4539, 10.1029/2003JD003407, 2003. 590 Brown, S. S., Dube, W. P., Osthoff, H. D., Stutz, J., Ryerson, T. B., Wollny, A. G., Brock, C. A., Warneke, C., De Gouw, J. A., Atlas, E., 591 Neuman, J. A., Holloway, J. S., Lerner, B. M., Williams, E. J., Kuster, W. C., Goldan, P. D., Angevine, W. M., Trainer, M., Fehsenfeld, F. 592 C., and Ravishankara, A. R.: Vertical profiles in NO3 and N2O5 measured from an aircraft: Results from the NOAA P-3 and surface 593 platforms during the New England Air Quality Study 2004, J. Geophys. Res. -Atmos., 112, D22304, doi: 10.1029/2007jd008893, 2007a. 594 Brown, S. S., Dube, W. P., Osthoff, H. D., Wolfe, D. E., Angevine, W. M., and Ravishankara, A. R.: High resolution vertical distributions 595 of NO3 and N2O5 through the nocturnal boundary layer, Atmos. Chem. Phys., 7, 139-149, 2007b. 596 Brown, S. S., Dube, W. P., Fuchs, H., Ryerson, T. B., Wollny, A. G., Brock, C. A., Bahreini, R., Middlebrook, A. M., Neuman, J. A., 597 Atlas, E., Roberts, J. M., Osthoff, H. D., Trainer, M., Fehsenfeld, F. C., and Ravishankara, A. R.: Reactive uptake coefficients for N2O5 598 determined from aircraft measurements during the Second Texas Air Quality Study: Comparison to current model parameterizations, J. 599 Geophys. Res. -Atmos., 114, art. D00F10, 10.1029/2008JD011679, 2009. 600 Brown, S. S., and Stutz, J.: Nighttime radical observations and chemistry, Chem. Soc. Rev., 41, 6405–6447, 2012. 601
Burkholder, J. B., Sander, S. P., Abbatt, J., Barker, J. R., Huie, R. E., Kolb, C. E., Kurylo, M. J., Orkin, V. L., Wilmouth, D. M., and Wine, 602 P. H.: Chemical Kinetics and Photochemical Data for Use in Atmospheric Studies, Evaluation No. 18," JPL Publication 15-10, Jet 603 Propulsion Laboratory, Pasadena, http://jpldataeval.jpl.nasa.gov., 2016. 604 Crowley, J. N., Schuster, G., Pouvesle, N., Parchatka, U., Fischer, H., Bonn, B., Bingemer, H., and Lelieveld, J.: Nocturnal nitrogen oxides 605 at a rural mountain site in south-western Germany, Atmos. Chem. Phys., 10, 2795-2812, 2010. 606 Crowley, J. N., Thieser, J., Tang, M. J., Schuster, G., Bozem, H., Hasaynali Beygi, Z., Fischer, H., Diesch, J.-M., Drewnick, F., Borrmann, 607 S., Song, W., Yassaa, N., Williams, J., Pöhler, D., Platt, U., and Lelieveld, J.: Variable lifetimes and loss mechanisms for NO3 and N2O5 608 during the DOMINO campaign: Contrast between marine, urban and continental air, Atmos. Chem. Phys., 11, 10863-10870, 2011. 609
Crutzen, P.: A discussion of the chemistry of some minor constituents in the stratosphere and troposphere, Pure and Applied Geophysics, 610 106-108, 1385-1399, 1973. 611 Curtis, A. R., and Sweetenham, W. P.: Facsimile, AERE, Report R-12805, in, 1987. 612 Dentener, F. J., and Crutzen, P. J.: Reaction of N2O5 on tropospheric aerosols - Impact on the global distributions of NOx, O3, and OH, J. 613 Geophys. Res. -Atmos., 98, 7149-7163, 1993. 614
Atmos. Meas. Tech. Discuss., doi:10.5194/amt-2016-381, 2016Manuscript under review for journal Atmos. Meas. Tech.Published: 29 November 2016c© Author(s) 2016. CC-BY 3.0 License.
21
Donahue, N. M., Clarke, J. S., Demerjian, K. L., and Anderson, J. G.: Free-radical kinetics at high pressure: A mathematical analysis of 615 the flow reactor, J. Phys. Chem., 100, 5821-5838, 1996. 616
Fry, J. L., Draper, D. C., Barsanti, K. C., Smith, J. N., Ortega, J., Winkle, P. M., Lawler, M. J., Brown, S. S., Edwards, P. M., Cohen, R. 617 C., and Lee, L.: Secondary Organic Aerosol Formation and Organic Nitrate Yield from NO3 Oxidation of Biogenic Hydrocarbons, Env. 618 Sci. Tech., 48, 11944-11953, 10.1021/es502204x, 2014. 619 Geyer, A., and Platt, U.: Temperature dependence of the NO3 loss frequency: A new indicator for the contribution of NO3 to the oxidation 620 of monoterpenes and NOx removal in the atmosphere, J. Geophys. Res. -Atmos., 107, 4431, doi:10.1029/2001JD001215, 621 10.1029/2001JD001215, 2002. 622 Groß, C. B. M., Dillon, T. J., Schuster, G., Lelieveld, J., and Crowley, J. N.: Direct kinetic study of OH and O3 formation in the reaction of 623 CH3C(O)O2 with HO2, The Journal of Physical Chemistry A, 118, 974-985, doi:10.1021/jp412380z, 2014. 624
Guenther, A. B., Jiang, X., Heald, C. L., Sakulyanontvittaya, T., Duhl, T., Emmons, L. K., and Wang, X.: The Model of Emissions of 625 Gases and Aerosols from Nature version 2.1 (MEGAN2.1): an extended and updated framework for modeling biogenic emissions, 626 Geoscientific Model Development, 5, 1471-1492, 10.5194/gmd-5-1471-2012, 2012. 627 Heintz, F., Platt, U., Flentje, H., and Dubois, R.: Long-term observation of nitrate radicals at the tor station, Kap Arkona (Rugen), J. 628 Geophys. Res. -Atmos., 101, 22891-22910, 1996. 629 Howard, C. J.: Kinetic measurements using flow tubes, J. Phys. Chem., 83, 3-9, 1979. 630 Huang, Y., Shen, H. Z., Chen, Y. L., Zhong, Q. R., Chen, H., Wang, R., Shen, G. F., Liu, J. F., Li, B. G., and Tao, S.: Global organic 631 carbon emissions from primary sources from 1960 to 2009, Atmos. Env., 122, 505-512, 10.1016/j.atmosenv.2015.10.017, 2015. 632
Huang, Y., Coggon, M. M., Zhao, R., Lignell, H., Bauer, M. U., Flagan, R. C., and Seinfeld, J. H.: The Caltech Photooxidation Flow Tube 633 Reactor - I: Design and Fluid Dynamics, Atmos. Meas. Tech. Discuss., 2016, 1-36, 10.5194/amt-2016-282, 2016. 634 IUPAC: Task Group on Atmospheric Chemical Kinetic Data Evaluation, (Ammann, M., Cox, R.A., Crowley, J.N., Jenkin, M.E., 635 Mellouki, A., Rossi, M. J., Troe, J. and Wallington, T. J.) http://iupac.pole-ether.fr/index.html., http://iupac.pole-ether.fr/index.html., 2016. 636
Kovacs, T. A., and Brune, W. H.: Total OH loss rate measurement, J. Atmos. Chem., 39, 105-122, 10.1023/a:1010614113786, 2001. 637 Lelieveld, J., Butler, T. M., Crowley, J. N., Dillon, T. J., Fischer, H., Ganzeveld, L., Harder, H., Lawrence, M. G., Martinez, M., 638 Taraborrelli, D., and Williams, J.: Atmospheric oxidation capacity sustained by a tropical forest, Nature, 452, 737-740, 2008. 639 Lelieveld, J., Gromov, S., Pozzer, A., and Taraborrelli, D.: Global tropospheric hydroxyl distribution, budget and reactivity, Atmos. Chem. 640 Phys. Discuss., 2016, 1-25, 10.5194/acp-2016-160, 2016. 641 Mielke, L. H., Furgeson, A., and Osthoff, H. D.: Observation of CINO2 in a mid-continental urban environment, Env. Sci. Tech., 45, 8889-642 8896, doi:10.1021/es201955u, 2011. 643 Mogensen, D., Gierens, R., Crowley, J. N., Keronen, P., Smolander, S., Sogachev, A., Nölscher, A. C., Zhou, L., Kulmala, M., Tang, M. 644 J., Williams, J., and Boy, M.: Simulations of atmospheric OH, O3 and NO3 reactivities within and above the boreal forest, Atmos. Chem. 645 Phys., 15, 3909-3932, 10.5194/acp-15-3909-2015, 2015. 646 Ng, N. L., Brown, S. S., Archibald, A. T., Atlas, E., Cohen, R. C., Crowley, J. N., Day, D. A., Donahue, N. M., Fry, J. L., Fuchs, H., 647 Griffin, R. J., Guzman, M. I., Hermann, H., Hodzic, A., Iinuma, Y., Jimenez, J. L., Kiendler-Scharr, A., Lee, B. H., Luecken, D. J., Mao, 648 J., McLaren, R., Mutzel, A., Osthoff, H. D., Ouyang, B., Picquet-Varrault, B., Platt, U., Pye, H. O. T., Rudich, Y., Schwantes, R. H., 649 Shiraiwa, M., Stutz, J., Thornton, J. A., Tilgner, A., Williams, B. J., and Zaveri, R. A.: Nitrate radicals and biogenic volatile organic 650 compounds: oxidation, mechanisms and organic aerosol, Atmos. Chem. Phys. Discuss., 2016, 1-111, 10.5194/acp-2016-734, 2016. 651 Orphal, J., Fellows, C. E., and Flaud, P. M.: The visible absorption spectrum of NO3 measured by high-resolution Fourier transform 652 spectroscopy, J. Geophys. Res. -Atmos., 108, Art. Nr. 4077, doi:10.1029/2002JD002489, 2003. 653
Osthoff, H. D., Pilling, M. J., Ravishankara, A. R., and Brown, S. S.: Temperature dependence of the NO3 absorption cross-section above 654 298 K and determination of the equilibrium constant for NO3 + NO2 <-> N2O5 at atmospherically relevant conditions, Phys. Chem. Chem. 655 Phys., 9, 5785-5793, 2007. 656 Osthoff, H. D., Roberts, J. M., Ravishankara, A. R., Williams, E. J., Lerner, B. M., Sommariva, R., Bates, T. S., Coffman, D., Quinn, P. 657 K., Dibb, J. E., Stark, H., Burkholder, J. B., Talukdar, R. K., Meagher, J., Fehsenfeld, F. C., and Brown, S. S.: High levels of nitryl 658 chloride in the polluted subtropical marine boundary layer, Nature Geoscience, 1, 324-328, 2008. 659
Atmos. Meas. Tech. Discuss., doi:10.5194/amt-2016-381, 2016Manuscript under review for journal Atmos. Meas. Tech.Published: 29 November 2016c© Author(s) 2016. CC-BY 3.0 License.
22
Phillips, G. J., Tang, M. J., Thieser, J., Brickwedde, B., Schuster, G., Bohn, B., Lelieveld, J., and Crowley, J. N.: Significant 660 concentrations of nitryl chloride observed in rural continental Europe associated with the influence of sea salt chloride and anthropogenic 661 emissions, Geophys. Res. Lett., 39, L10811, doi:10.1029/2012GL051912, 2012. 662 Riedel, T. P., Bertram, T. H., Crisp, T. A., Williams, E. J., Lerner, B. M., Vlasenko, A., Li, S. M., Gilman, J., de Gouw, J., Bon, D. M., 663 Wagner, N. L., Brown, S. S., and Thornton, J. A.: Nitryl Chloride and Molecular Chlorine in the Coastal Marine Boundary Layer, Env. 664 Sci. Tech., 46, 10463-10470, 10.1021/es204632r, 2012. 665
Rinne, J., Markkanen, T., Ruuskanen, T. M., Petaja, T., Keronen, P., Tang, M. J., Crowley, J. N., Rannik, U., and Vesala, T.: Effect of 666 chemical degradation on fluxes of reactive compounds –a study with a stochastic Lagrangian transport model, Atmos. Chem. Phys., 12, 667 4843-4854, 2012. 668 Schuster, G., Labazan, I., and Crowley, J. N.: A cavity ring down / cavity enhanced absorption device for measurement of ambient NO3 669 and N2O5, Atmos. Meas. Tech., 2, 1-13, 2009. 670 Seeley, J. V., Jayne, J. T., and Molina, M. J.: High-Pressure Fast-Flow Technique for Gas-Phase Kinetics Studies, Int. J. Chem. Kinet., 25, 671 571-594, 1993. 672 Sinha, V., Williams, J., Crowley, J. N., and Lelieveld, J.: The comparative reactivity method - a new tool to measure total OH reactivity in 673 ambient air, Atmos. Chem. Phys., 8, 2213-2227, 2008. 674 Sobanski, N., Schuladen, J., Schuster, G., Lelieveld, J., and Crowley, J.: A 5-channel cavity ring-down spectrometer for the detection of 675 NO2, NO3, N2O5, total peroxy nitrates and total alkyl nitrates, Atmos. Meas. Tech. Discuss., 2016, 1-32, 10.5194/amt-2016-191, 2016a. 676 Sobanski, N., Tang, M. J., Thieser, J., Schuster, G., Pöhler, D., Fischer, H., Song, W., Sauvage, C., Williams, J., Fachinger, J., Berkes, F., 677 Hoor, P., Platt, U., Lelieveld, J., and Crowley, J. N.: Chemical and meteorological influences on the lifetime of NO3 at a semi-rural 678 mountain site during PARADE, Atmos. Chem. Phys., 16, 4867-4883, 10.5194/acp-16-4867-2016, 2016b. 679 Sobanski, N., Thieser, J., Schuladen, J., Sauvage, C., Song, W., Williams, J., lelieveld, J., and Crowley, J. N.: Day- and Night-time 680 Formation of Organic Nitrates at a Forested Mountain-site in South West Germany, Atmos. Chem. Phys. Discuss., submitted, 2016c. 681
Thieser, J., Schuster, G., Phillips, G. J., Reiffs, A., Parchatka, U., Pöhler, D., Lelieveld, J., and Crowley, J. N.: A two-channel, thermal 682 dissociation cavity-ringdown spectrometer for the detection of ambient NO2, RO2NO2 and RONO2, Atmos. Meas. Tech., 9, 553-576, 2016. 683 Thornton, J. A., Kercher, J. P., Riedel, T. P., Wagner, N. L., Cozic, J., Holloway, J. S., Dube, W. P., Wolfe, G. M., Quinn, P. K., 684 Middlebrook, A. M., Alexander, B., and Brown, S. S.: A large atomic chlorine source inferred from mid-continental reactive nitrogen 685 chemistry, Nature, 464, 271-274, 10.1038/nature08905, 2010. 686 Wayne, R. P., Barnes, I., Biggs, P., Burrows, J. P., Canosa-Mas, C. E., Hjorth, J., Le Bras, G., Moortgat, G. K., Perner, D., Poulet, G., 687 Restelli, G., and Sidebottom, H.: The nitrate radical: Physics, chemistry, and the atmosphere, Atmos. Env. A, 25A, 1-206, 1991. 688 689
690
691
Atmos. Meas. Tech. Discuss., doi:10.5194/amt-2016-381, 2016Manuscript under review for journal Atmos. Meas. Tech.Published: 29 November 2016c© Author(s) 2016. CC-BY 3.0 License.

23
Table 1: Facsimile1 Simulations 692
693
NO2+O3 → NO3 + O2 k1 = 3.52 × 10⁻¹⁷ cm3 molecule-1 s-1 k1
NO3 + NO → 2 NO2 k2 = 2.60 × 10⁻¹¹ cm3 molecule-1 s-1 k2
NO3 + NO2 + M → N2O5 + M k3 = 1.24 × 10⁻¹² cm3 molecule-1 s-1 k3
N2O5 + M → NO2 + NO3 + M k4 = 4.44 × 10⁻² cm3 molecule-1 s-1 k4
NO+O3 → NO2 + O2 k5 = 1.89 × 10⁻¹⁴ cm3 molecule-1 s-1 k5
NO3 + wall → NO2 kw= 4 × 10⁻³ s-1 kw
kRTG variable / fitted kRTG
1For all simulations FACSIMILE-CHEKMAT (Release H010 DATE 28.04.87 Version 1) was used. The rate constants (ki) listed were 694 taken from the IUPAC recommendations (Atkinson et al., 2004; IUPAC, 2016) at 298 K and 1 bar. 695 696
Atmos. Meas. Tech. Discuss., doi:10.5194/amt-2016-381, 2016Manuscript under review for journal Atmos. Meas. Tech.Published: 29 November 2016c© Author(s) 2016. CC-BY 3.0 License.
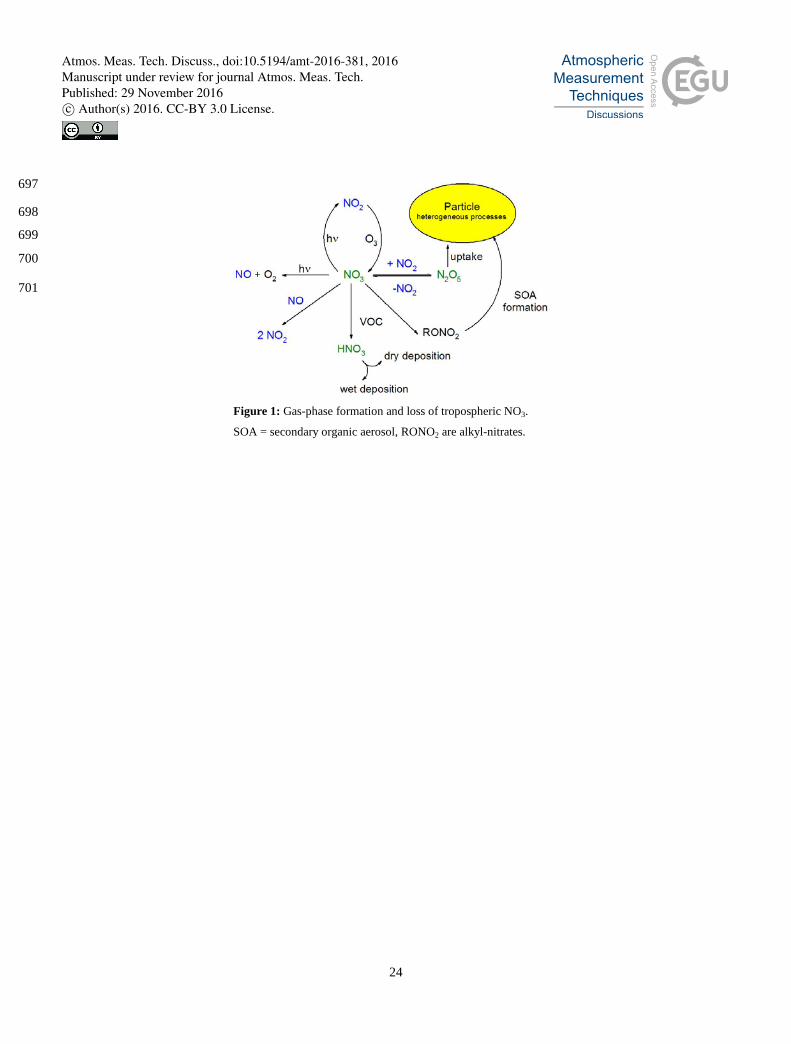
24
697
698
699
700
701
Figure 1: Gas-phase formation and loss of tropospheric NO3.
SOA = secondary organic aerosol, RONO2 are alkyl-nitrates.
Atmos. Meas. Tech. Discuss., doi:10.5194/amt-2016-381, 2016Manuscript under review for journal Atmos. Meas. Tech.Published: 29 November 2016c© Author(s) 2016. CC-BY 3.0 License.

25
702
703
704
705
706
707
708
709
710
711
712
713
714
715
716
717
718
719
720
721
722
723
724
725
726
727
Figure 2: Schematic diagram of the NO3-reactivity measurement. F1-F7 are mass flow-controllers: F1 = mirror purge flow, F2 =
zero-air for O3 generation, F3 = dilution / inlet overflow (switching between zero-air and ambient), F4 = NO2 for NO3 / N2O5
generation, F5 = NO titration of NO3, F6 = cavity flow to pump, F7 = NO flow for online reactivity calibration. CrO = critical
orifice. TD = heated tubing for thermal decomposition of N2O5 to NO3 at 140 °C.
Atmos. Meas. Tech. Discuss., doi:10.5194/amt-2016-381, 2016Manuscript under review for journal Atmos. Meas. Tech.Published: 29 November 2016c© Author(s) 2016. CC-BY 3.0 License.

26
728
729
730
731
732
733
734
735
736
737
738
739
740
741
742
743
744
745
746
747
748
749
750
751
752
753
754
755
Figure 3: Derivation of effective reaction time by addition of a pulse
(at t = 26 s) of NO using a syringe. The subsequent depletion in the
NO3 signal was analysed using expression 4.
Atmos. Meas. Tech. Discuss., doi:10.5194/amt-2016-381, 2016Manuscript under review for journal Atmos. Meas. Tech.Published: 29 November 2016c© Author(s) 2016. CC-BY 3.0 License.

27
756
Figure 4: Characterisation of the flow-tube by numerical simulation of the NO3 change following addition of NO and NO2 at
different mixing ratios. The symbols are measured NO3 mixing ratios, the lines are the results of numerical simulations. The
reactivity scales were calculated from k2[NO] and k3[NO2] using the rate constants listed in Table 1.
Atmos. Meas. Tech. Discuss., doi:10.5194/amt-2016-381, 2016Manuscript under review for journal Atmos. Meas. Tech.Published: 29 November 2016c© Author(s) 2016. CC-BY 3.0 License.

28
757 758 759
760
761
762
763
764
765
766
767
768
769
770
771
772
Figure 5: Left: Measured versus simulated [NO3] for different amounts of added NO (67, 134, 201, 268, 402 pptv) and at three
different mixing ratios of NO2. Right: Measured versus simulated NO3 (initially 77, 128 or 249 pptv) at different amounts (1.5, 3, 4.5,
6 ppbv) of added [NO2]. The solid lines represent 1:1 agreement.
Atmos. Meas. Tech. Discuss., doi:10.5194/amt-2016-381, 2016Manuscript under review for journal Atmos. Meas. Tech.Published: 29 November 2016c© Author(s) 2016. CC-BY 3.0 License.

29
773
774
775
776
777
778
779
780
781
782
783
784
785
786
787
788
789
790
Figure 6: Determination of the wall loss constant of NO3 by variation of
the reaction time (injector position). The simulation indicates a wall loss
constant of kw = 0.004 s-1.
Atmos. Meas. Tech. Discuss., doi:10.5194/amt-2016-381, 2016Manuscript under review for journal Atmos. Meas. Tech.Published: 29 November 2016c© Author(s) 2016. CC-BY 3.0 License.
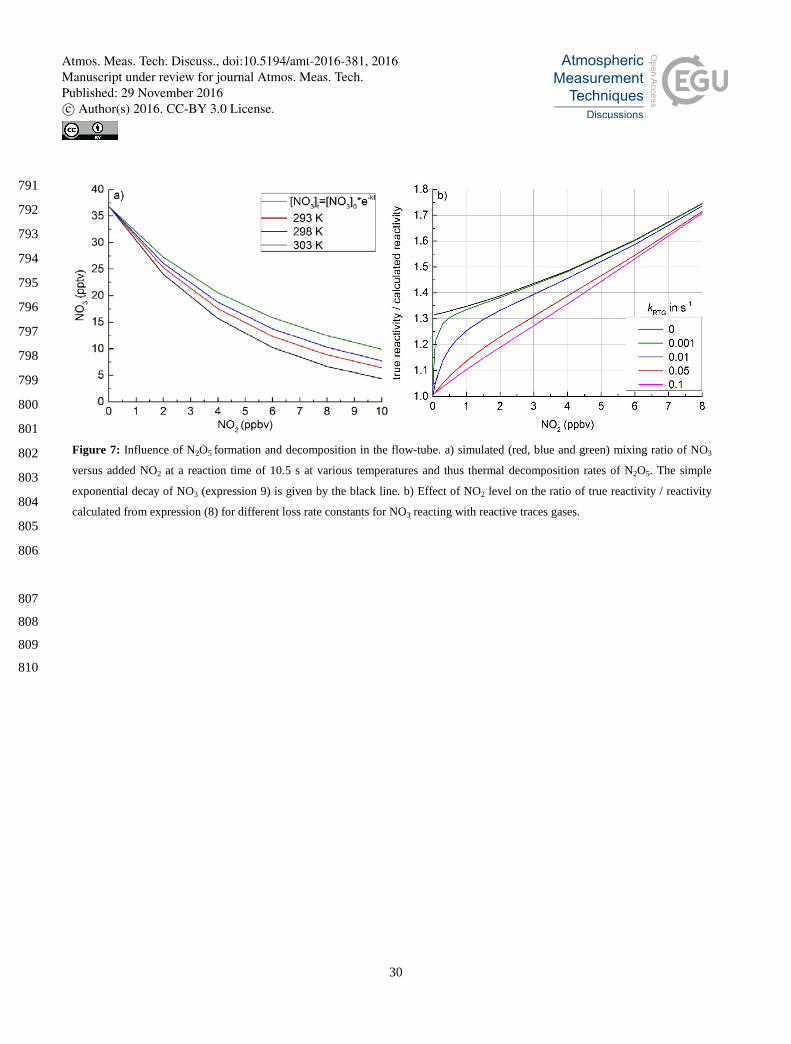
30
791
792
793
794
795
796
797
798
799
800
801
802
803
804
805
806
807
808
809
810
Figure 7: Influence of N2O5 formation and decomposition in the flow-tube. a) simulated (red, blue and green) mixing ratio of NO3
versus added NO2 at a reaction time of 10.5 s at various temperatures and thus thermal decomposition rates of N2O5. The simple
exponential decay of NO3 (expression 9) is given by the black line. b) Effect of NO2 level on the ratio of true reactivity / reactivity
calculated from expression (8) for different loss rate constants for NO3 reacting with reactive traces gases.
Atmos. Meas. Tech. Discuss., doi:10.5194/amt-2016-381, 2016Manuscript under review for journal Atmos. Meas. Tech.Published: 29 November 2016c© Author(s) 2016. CC-BY 3.0 License.

31
811
812
813
814
815
816
817
818
819
820
821
822
823
824
825
826 827 828
Figure 8: Simulated NO3 production in the flow-tube at different O3 and
NO2 mixing ratios at a fixed reaction time of 10.5 s.
Atmos. Meas. Tech. Discuss., doi:10.5194/amt-2016-381, 2016Manuscript under review for journal Atmos. Meas. Tech.Published: 29 November 2016c© Author(s) 2016. CC-BY 3.0 License.

32
829
830
831
832
833
834
835
836
837
838
839
840
841
842
843
844
845
846
847
848
849
850
851
852
853
854
855
856
857
858
859
860
861
Figure 9: Raw data showing the change in NO3 (10.5 s reaction time)
between zero-air (ZA, periods marked with red brackets) and ambient air
(Ambient, blue brackets). The Figure also shows periods of titration of NO3
with NO (≈ 2 min intervals, green brackets), a change in the dilution factor
from 4 to 3 (at ≈ 07:33) and an in-situ reactivity calibration (at ≈ 07:07).
The “skip” periods are those in which data is not analysed due to switching
from ambient air to zero-air and vice versa.
Atmos. Meas. Tech. Discuss., doi:10.5194/amt-2016-381, 2016Manuscript under review for journal Atmos. Meas. Tech.Published: 29 November 2016c© Author(s) 2016. CC-BY 3.0 License.
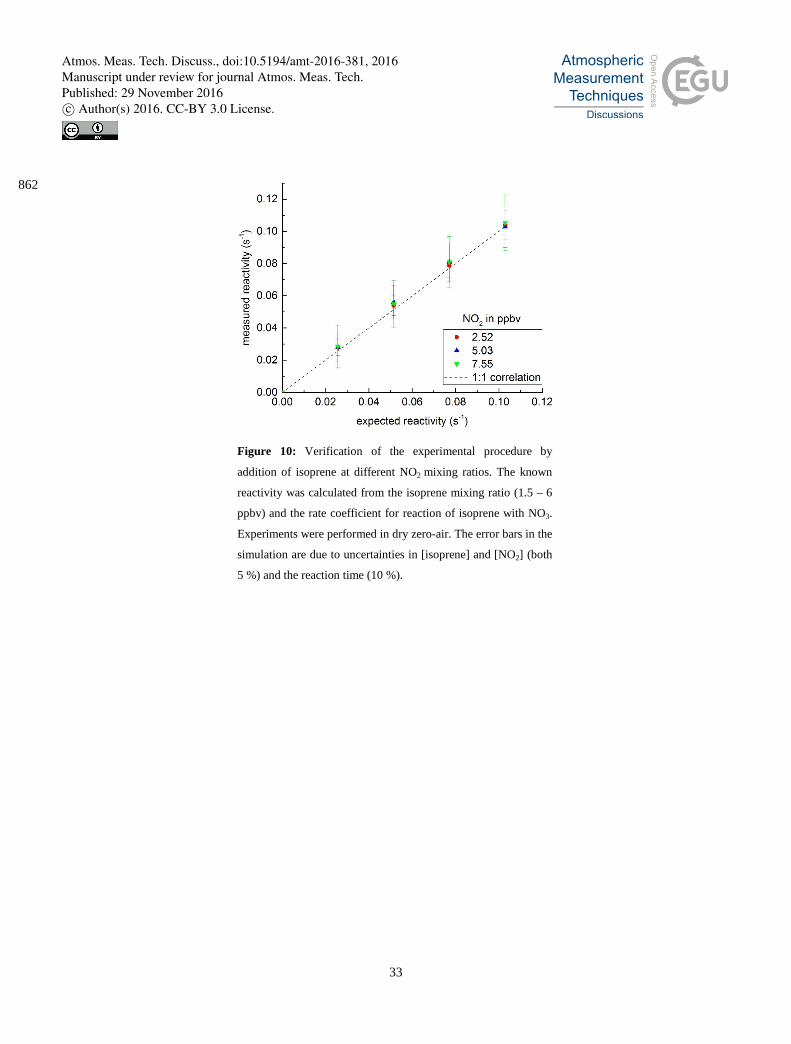
33
862
Figure 10: Verification of the experimental procedure by
addition of isoprene at different NO2 mixing ratios. The known
reactivity was calculated from the isoprene mixing ratio (1.5 – 6
ppbv) and the rate coefficient for reaction of isoprene with NO3.
Experiments were performed in dry zero-air. The error bars in the
simulation are due to uncertainties in [isoprene] and [NO2] (both
5 %) and the reaction time (10 %).
Atmos. Meas. Tech. Discuss., doi:10.5194/amt-2016-381, 2016Manuscript under review for journal Atmos. Meas. Tech.Published: 29 November 2016c© Author(s) 2016. CC-BY 3.0 License.
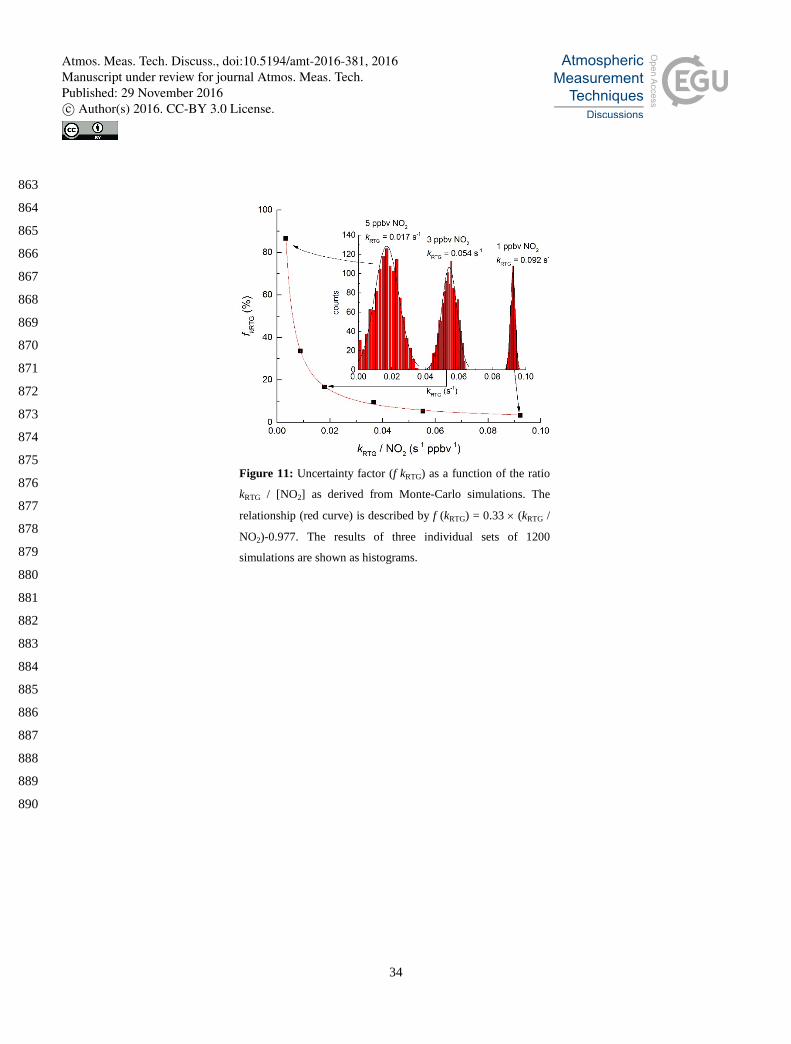
34
863
864
865
866
867
868
869
870
871
872
873
874
875
876
877
878
879
880
881
882
883
884
885
886
887
888
889
890
Figure 11: Uncertainty factor (f kRTG) as a function of the ratio
kRTG / [NO2] as derived from Monte-Carlo simulations. The
relationship (red curve) is described by f (kRTG) = 0.33 × (kRTG /
NO2)-0.977. The results of three individual sets of 1200
simulations are shown as histograms.
Atmos. Meas. Tech. Discuss., doi:10.5194/amt-2016-381, 2016Manuscript under review for journal Atmos. Meas. Tech.Published: 29 November 2016c© Author(s) 2016. CC-BY 3.0 License.

35
891
892 893
894
895
896
897
898
899
900
901
902
903
904
905
906
907
908
909
910
911
912
913
914
915
916
917
918
919
920
921
Figure 12: a) Measured values of kRTG over a 3 day period. The overall uncertainty is represented by the green, shaded area. The
black lines are kRTG obtained by full simulations, the blue lines are calculated using expression (11) (without correction for N2O5
formation and decomposition). The contribution of NO to the NO3 reactivity is displayed as the red line. Yellow regions correspond to
day-time, grey regions correspond to night-time b) Zoom in on a night-time period with low reactivity emphasizing the effect of NO2-
induced formation and decomposition of N2O5.
Atmos. Meas. Tech. Discuss., doi:10.5194/amt-2016-381, 2016Manuscript under review for journal Atmos. Meas. Tech.Published: 29 November 2016c© Author(s) 2016. CC-BY 3.0 License.

36
Figure 13: Comparison of stationary-state and measured NO3 loss rates. Uncertainty in kRTG (see text) are displayed as the green
shaded areas.
Atmos. Meas. Tech. Discuss., doi:10.5194/amt-2016-381, 2016Manuscript under review for journal Atmos. Meas. Tech.Published: 29 November 2016c© Author(s) 2016. CC-BY 3.0 License.
Copyright © 2022 FDOKUMEN


![To Identify the given inorganic salt[Ba(NO3)2] To Identify the ...](https://static.fdokumen.com/doc/165x107/63169e619076d1dcf80b7c23/to-identify-the-given-inorganic-saltbano32-to-identify-the-.jpg)