Aggregation and surface hydrophobicity of selected microorganism due to the effect of substrate, pH...
8
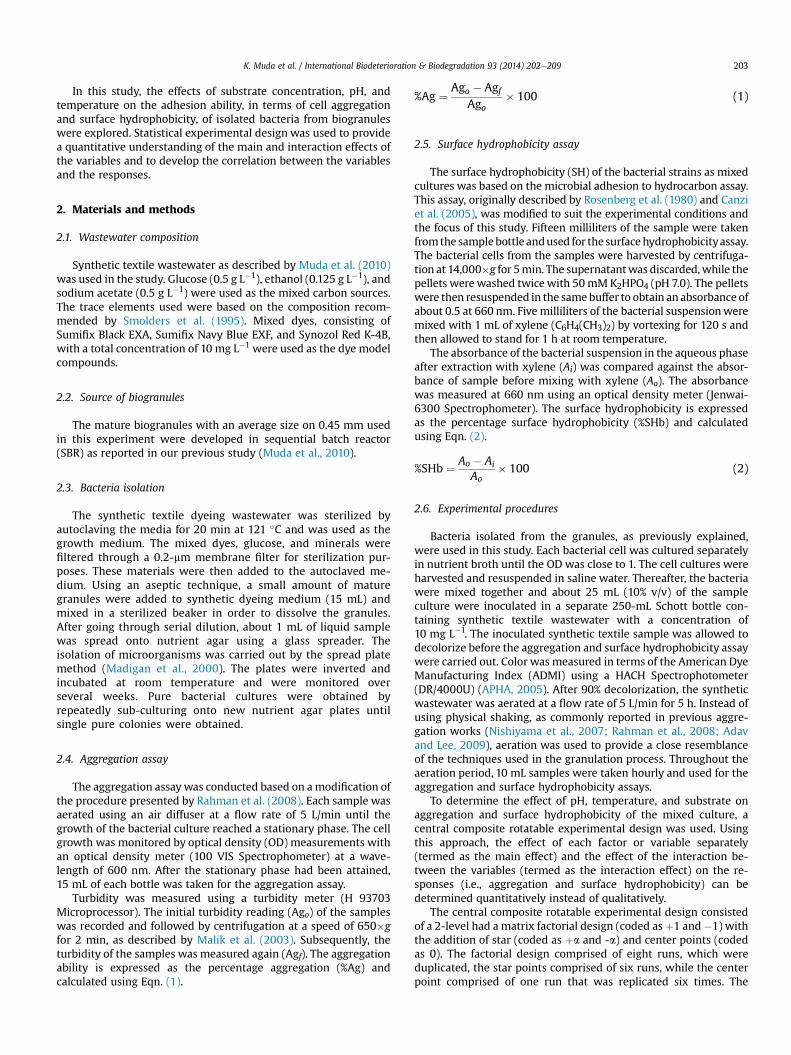
Aggregation and surface hydrophobicity of selected microorganism due to the effect of substrate, pH and temperature Khalida Muda a, b, * , Azmi Aris a, b , Mohd Razman Salim a, b , Zaharah Ibrahim c , Mark C.M. van Loosdrecht d , Mohd Zaini Nawahwi c , Augustine Chioma Affam a, b a Faculty of Civil Engineering, Universiti Teknologi Malaysia, 81310 Skudai, Johor, Malaysia b Institute of Environmental and Water Resource Management, Universiti Teknologi Malaysia, 81310 Skudai, Johor, Malaysia c Faculty of Biosciences and Bioengineering, Universiti Teknologi Malaysia, 81310 Skudai, Johor, Malaysia d Department of Biotechnology, Delft University of Technology, Julianalaan 67,2628BC Delft, The Netherlands article info Article history: Received 22 April 2014 Received in revised form 26 May 2014 Accepted 27 May 2014 Available online Keywords: Biogranules Aggregation pH Substrate Surface hydrophobicity Temperature abstract Aggregation and surface hydrophobicity are two important indicators used to evaluate the successful development of biogranules. The effect of substrate concentration, pH, and temperature on these properties of selected bacteria that are isolated from biogranules used in treating textile wastewater was investigated. Statistical response surface methodology was used to quantitatively determine the effects and to determine the relationship between the responses and variables. Thirty experimental runs were performed at substrate concentrations of 500e3000 mg L 1 , pH of 5e9, and temperatures of 20e40 C. The results show that all variables investigated were either positively or negatively correlated with aggregation and surface hydrophobicity and induced significant linear responses in these indicators. Interaction effects were also observed for some of the variables. An acceptable statistical model describing the relationship between aggregation and surface hydrophobicity of the selected bacteria and substrate concentration, pH, and temperature has been developed for the stated experimental conditions. © 2014 Elsevier Ltd. All rights reserved. 1. Introduction The development of granules is a complex process and is initiated by the formation of small microbial aggregates (Adav et al., 2008). The aggregation of microbial cells can be formed by either cell-to-cell interaction or by combination with other particulates, which eventually lead to the development of granules of stable multicellular associated bioflocs. This initial cell interaction is affected by many factors, including the type and concentration of substrate, nature of the seed sludge, availability of essential nutrients, presence of exopolymeric protein and the ratio between exopolymeric protein and poly- saccharides in the extracellular polymeric substrates (EPS), composition of the media, pH, temperature, and the operational set-up of the reactor system (Dignac et al., 1998; Wang et al., 2009; Zhu et al., 2012). Aggregation ability and surface hydrophobicity of the bacteria are two independent traits that have been used to indirectly eval- uate the adhesion capacity of the bacteria (Marin et al., 1997; Ibrahim et al., 2005; Rahman et al., 2008; Wan et al., 2011). Since the adhesion ability is important in the granulation process, several studies have been conducted to investigate factors that can affect this, measured in terms of aggregation and surface hydrophobicity (Wang et al., 2005; Adav and Lee, 2008). The ability of the Bifido- bacterium spp. to form aggregates was studied against the effect of pH, type of culture media, and temperature, while variations in the surface hydrophobicity were investigated under the influence of superficial velocity and organic loading rate. Nevertheless, most previous studies of this initial granulation stage focused only on the effect of individual factors, without looking into the effects of the interaction of these factors that may cause different outcomes. In reality, there will be more than one factor that can affect the process and there is the possibility of an interaction between these factors. Moreover, most studies that used the traditional one factor at a time approach did not fully explore all phenomena that could take place, and therefore, could result in wrong conclusions. * Corresponding author. Faculty of Civil Engineering, Universiti Teknologi Malaysia, 81310 Skudai, Johor, Malaysia. E-mail address: [email protected] (K. Muda). Contents lists available at ScienceDirect International Biodeterioration & Biodegradation journal homepage: www.elsevier.com/locate/ibiod http://dx.doi.org/10.1016/j.ibiod.2014.05.023 0964-8305/© 2014 Elsevier Ltd. All rights reserved. International Biodeterioration & Biodegradation 93 (2014) 202e209
-
Upload
teknologimalaysia -
Category
Documents
-
view
2 -
download
0
Transcript of Aggregation and surface hydrophobicity of selected microorganism due to the effect of substrate, pH...
lable at ScienceDirect
International Biodeterioration & Biodegradation 93 (2014) 202e209
Contents lists avai
International Biodeterioration & Biodegradation
journal homepage: www.elsevier .com/locate/ ibiod
Aggregation and surface hydrophobicity of selected microorganismdue to the effect of substrate, pH and temperature
Khalida Muda a, b, *, Azmi Aris a, b, Mohd Razman Salim a, b, Zaharah Ibrahim c,Mark C.M. van Loosdrecht d, Mohd Zaini Nawahwi c, Augustine Chioma Affam a, b
a Faculty of Civil Engineering, Universiti Teknologi Malaysia, 81310 Skudai, Johor, Malaysiab Institute of Environmental and Water Resource Management, Universiti Teknologi Malaysia, 81310 Skudai, Johor, Malaysiac Faculty of Biosciences and Bioengineering, Universiti Teknologi Malaysia, 81310 Skudai, Johor, Malaysiad Department of Biotechnology, Delft University of Technology, Julianalaan 67,2628BC Delft, The Netherlands
a r t i c l e i n f o
Article history:Received 22 April 2014Received in revised form26 May 2014Accepted 27 May 2014Available online
Keywords:BiogranulesAggregationpHSubstrateSurface hydrophobicityTemperature
* Corresponding author. Faculty of Civil EnginMalaysia, 81310 Skudai, Johor, Malaysia.
E-mail address: [email protected] (K. Muda).
http://dx.doi.org/10.1016/j.ibiod.2014.05.0230964-8305/© 2014 Elsevier Ltd. All rights reserved.
a b s t r a c t
Aggregation and surface hydrophobicity are two important indicators used to evaluate the successfuldevelopment of biogranules. The effect of substrate concentration, pH, and temperature on theseproperties of selected bacteria that are isolated from biogranules used in treating textile wastewater wasinvestigated. Statistical response surface methodology was used to quantitatively determine the effectsand to determine the relationship between the responses and variables. Thirty experimental runs wereperformed at substrate concentrations of 500e3000 mg L�1, pH of 5e9, and temperatures of 20e40 �C.The results show that all variables investigated were either positively or negatively correlated withaggregation and surface hydrophobicity and induced significant linear responses in these indicators.Interaction effects were also observed for some of the variables. An acceptable statistical modeldescribing the relationship between aggregation and surface hydrophobicity of the selected bacteria andsubstrate concentration, pH, and temperature has been developed for the stated experimentalconditions.
© 2014 Elsevier Ltd. All rights reserved.
1. Introduction
The development of granules is a complex process and isinitiated by the formation of small microbial aggregates (Adavet al., 2008). The aggregation of microbial cells can be formedby either cell-to-cell interaction or by combination with otherparticulates, which eventually lead to the development ofgranules of stable multicellular associated bioflocs. This initialcell interaction is affected by many factors, including the typeand concentration of substrate, nature of the seed sludge,availability of essential nutrients, presence of exopolymericprotein and the ratio between exopolymeric protein and poly-saccharides in the extracellular polymeric substrates (EPS),composition of the media, pH, temperature, and the operationalset-up of the reactor system (Dignac et al., 1998; Wang et al.,2009; Zhu et al., 2012).
eering, Universiti Teknologi
Aggregation ability and surface hydrophobicity of the bacteriaare two independent traits that have been used to indirectly eval-uate the adhesion capacity of the bacteria (Marin et al., 1997;Ibrahim et al., 2005; Rahman et al., 2008; Wan et al., 2011). Sincethe adhesion ability is important in the granulation process, severalstudies have been conducted to investigate factors that can affectthis, measured in terms of aggregation and surface hydrophobicity(Wang et al., 2005; Adav and Lee, 2008). The ability of the Bifido-bacterium spp. to form aggregates was studied against the effect ofpH, type of culture media, and temperature, while variations in thesurface hydrophobicity were investigated under the influence ofsuperficial velocity and organic loading rate.
Nevertheless, most previous studies of this initial granulationstage focused only on the effect of individual factors, withoutlooking into the effects of the interaction of these factors that maycause different outcomes. In reality, there will be more than onefactor that can affect the process and there is the possibility of aninteraction between these factors. Moreover, most studies thatused the traditional one factor at a time approach did not fullyexplore all phenomena that could take place, and therefore, couldresult in wrong conclusions.
K. Muda et al. / International Biodeterioration & Biodegradation 93 (2014) 202e209 203
In this study, the effects of substrate concentration, pH, andtemperature on the adhesion ability, in terms of cell aggregationand surface hydrophobicity, of isolated bacteria from biogranuleswere explored. Statistical experimental design was used to providea quantitative understanding of the main and interaction effects ofthe variables and to develop the correlation between the variablesand the responses.
2. Materials and methods
2.1. Wastewater composition
Synthetic textile wastewater as described by Muda et al. (2010)was used in the study. Glucose (0.5 g L�1), ethanol (0.125 g L�1), andsodium acetate (0.5 g L�1) were used as the mixed carbon sources.The trace elements used were based on the composition recom-mended by Smolders et al. (1995). Mixed dyes, consisting ofSumifix Black EXA, Sumifix Navy Blue EXF, and Synozol Red K-4B,with a total concentration of 10 mg L�1 were used as the dye modelcompounds.
2.2. Source of biogranules
The mature biogranules with an average size on 0.45 mm usedin this experiment were developed in sequential batch reactor(SBR) as reported in our previous study (Muda et al., 2010).
2.3. Bacteria isolation
The synthetic textile dyeing wastewater was sterilized byautoclaving the media for 20 min at 121 �C and was used as thegrowth medium. The mixed dyes, glucose, and minerals werefiltered through a 0.2-mm membrane filter for sterilization pur-poses. These materials were then added to the autoclaved me-dium. Using an aseptic technique, a small amount of maturegranules were added to synthetic dyeing medium (15 mL) andmixed in a sterilized beaker in order to dissolve the granules.After going through serial dilution, about 1 mL of liquid samplewas spread onto nutrient agar using a glass spreader. Theisolation of microorganisms was carried out by the spread platemethod (Madigan et al., 2000). The plates were inverted andincubated at room temperature and were monitored overseveral weeks. Pure bacterial cultures were obtained byrepeatedly sub-culturing onto new nutrient agar plates untilsingle pure colonies were obtained.
2.4. Aggregation assay
The aggregation assay was conducted based on amodification ofthe procedure presented by Rahman et al. (2008). Each sample wasaerated using an air diffuser at a flow rate of 5 L/min until thegrowth of the bacterial culture reached a stationary phase. The cellgrowth was monitored by optical density (OD) measurements withan optical density meter (100 VIS Spectrophometer) at a wave-length of 600 nm. After the stationary phase had been attained,15 mL of each bottle was taken for the aggregation assay.
Turbidity was measured using a turbidity meter (H 93703Microprocessor). The initial turbidity reading (Ago) of the sampleswas recorded and followed by centrifugation at a speed of 650�gfor 2 min, as described by Malik et al. (2003). Subsequently, theturbidity of the samples was measured again (Agf). The aggregationability is expressed as the percentage aggregation (%Ag) andcalculated using Eqn. (1).
%Ag ¼ Ago � AgfAgo
� 100 (1)
2.5. Surface hydrophobicity assay
The surface hydrophobicity (SH) of the bacterial strains as mixedcultures was based on the microbial adhesion to hydrocarbon assay.This assay, originally described by Rosenberg et al. (1980) and Canziet al. (2005), was modified to suit the experimental conditions andthe focus of this study. Fifteen milliliters of the sample were takenfromthe samplebottle andused for thesurfacehydrophobicityassay.The bacterial cells from the samples were harvested by centrifuga-tion at 14,000�g for 5min. The supernatantwas discarded,while thepellets were washed twice with 50mMK2HPO4 (pH 7.0). The pelletswere then resuspended in the samebuffer to obtain an absorbance ofabout 0.5 at 660 nm. Five milliliters of the bacterial suspensionweremixed with 1 mL of xylene (C6H4(CH3)2) by vortexing for 120 s andthen allowed to stand for 1 h at room temperature.
The absorbance of the bacterial suspension in the aqueous phaseafter extraction with xylene (Ai) was compared against the absor-bance of sample before mixing with xylene (Ao). The absorbancewas measured at 660 nm using an optical density meter (Jenwai-6300 Spectrophometer). The surface hydrophobicity is expressedas the percentage surface hydrophobicity (%SHb) and calculatedusing Eqn. (2).
%SHb ¼ Ao � Ai
Ao� 100 (2)
2.6. Experimental procedures
Bacteria isolated from the granules, as previously explained,were used in this study. Each bacterial cell was cultured separatelyin nutrient broth until the OD was close to 1. The cell cultures wereharvested and resuspended in saline water. Thereafter, the bacteriawere mixed together and about 25 mL (10% v/v) of the sampleculture were inoculated in a separate 250-mL Schott bottle con-taining synthetic textile wastewater with a concentration of10 mg L�1. The inoculated synthetic textile sample was allowed todecolorize before the aggregation and surface hydrophobicity assaywere carried out. Color was measured in terms of the American DyeManufacturing Index (ADMI) using a HACH Spectrophotometer(DR/4000U) (APHA, 2005). After 90% decolorization, the syntheticwastewater was aerated at a flow rate of 5 L/min for 5 h. Instead ofusing physical shaking, as commonly reported in previous aggre-gation works (Nishiyama et al., 2007; Rahman et al., 2008; Adavand Lee, 2009), aeration was used to provide a close resemblanceof the techniques used in the granulation process. Throughout theaeration period, 10 mL samples were taken hourly and used for theaggregation and surface hydrophobicity assays.
To determine the effect of pH, temperature, and substrate onaggregation and surface hydrophobicity of the mixed culture, acentral composite rotatable experimental design was used. Usingthis approach, the effect of each factor or variable separately(termed as the main effect) and the effect of the interaction be-tween the variables (termed as the interaction effect) on the re-sponses (i.e., aggregation and surface hydrophobicity) can bedetermined quantitatively instead of qualitatively.
The central composite rotatable experimental design consistedof a 2-level had a matrix factorial design (coded asþ1 and�1) withthe addition of star (coded as þa and -a) and center points (codedas 0). The factorial design comprised of eight runs, which wereduplicated, the star points comprised of six runs, while the centerpoint comprised of one run that was replicated six times. The
Table 1The variables and their values used in the experiments.
Variables Factorial Star points Center point
Lower value (�1) Upper value (þ1) Lower value (-a) Upper value (þa) (0)
A: Substrate (mg/L) 500 3000 1007 2493 1750B: pH 5 9 6 8 7C: Temperature (�C) 20 40 24 36 30
K. Muda et al. / International Biodeterioration & Biodegradation 93 (2014) 202e209204
design and analysis were carried out using Minitab® (Version13.32) and Design Expert® (Version 7.0). The substrate, pH andtemperature range of values that were used in the experiments areshown in Table 1. The responses measured were percentage ag-gregation (%Ag) and percentage surface hydrophobicity (%SHb) ofthe mixed bacteria.
3. Results and discussion
3.1. Isolated bacteria
A total of 12 bacteria were successfully isolated as pure culturedbacteria from the granular sludge developed in the synthetic textilewastewater using the SBR system. All of the bacteria were charac-terized in terms of form, shape, edges, and colony surface for theircolony characteristics. A gram staining procedure was carried outfor each bacterium in order to characterize the cellular morphologyof the isolated bacteria. Among the 12 pure bacterial cultures, sixbacteria were selected and used in this study. The selection of thesix bacteria was based on the percentage chemical oxygen demand(COD) and color removal, aggregation, and surface hydrophobicityof each isolated pure culture (Muda, 2010).
3.2. Factorial analysis
The results of the factorial experiments for aggregation andsurface hydrophobicity are shown in Table 2. Depending on theexperimental conditions, the %Ag and %SHb after 6 h of aerationvaried between 39% to 85% and 19%e54%, respectively. A summaryof the factorial analyses is shown in Table 3. The significance of thevariables tested, i.e., substrate concentration, pH, and temperature,are based on p-values evaluated at a confidence level above 95% (p-value less than 0.05). Based on the experimental conditions used inthe study, the p-value indicates that all factors, i.e., substrate
Table 2Experimental results for 2-level factorial design analysis.
Run no. Substrateconcentration
pH Temperature %Ag %SHb
RUN01 �1 �1 �1 49.6 19.0RUN02 �1 �1 �1 44.7 21.7RUN03 þ1 �1 �1 67.2 33.8RUN04 þ1 �1 �1 64.1 29.4RUN05 �1 þ1 �1 46.8 37.3RUN06 �1 þ1 �1 44.1 41.2RUN07 þ1 þ1 �1 65.6 39.6RUN08 þ1 þ1 �1 62.9 36.9RUN09 �1 �1 þ1 65.2 32.1RUN10 �1 �1 þ1 61.9 31.5RUN11 þ1 �1 þ1 84.5 53.9RUN12 þ1 �1 þ1 85.4 52.0RUN13 �1 þ1 þ1 38.8 20.4RUN14 �1 þ1 þ1 38.7 18.2RUN15 þ1 þ1 þ1 57.4 8.6RUN16 þ1 þ1 þ1 57.6 6.8
concentration, pH, and temperature, have a significant effect onaggregation. A significant interaction effect is observed between pHand temperature (pH � temperature), while the three-way inter-action effect (substrate concentration � pH � temperature) is notsignificant. As for surface hydrophobicity, all model terms (main, 2-way, and 3-way interaction) are significant except for the 2-wayinteraction between substrate concentration and temperature(substrate concentration � temperature).
The significance of the substrate concentration on bacterial ag-gregation and surface hydrophobicity is shown by very low p-values of less than 0.05; their estimated positive main effects are19.36 and 4.95, respectively, which indicates that higher substrateconcentrations enhance the aggregation and surface hydropho-bicity. This can be explained by the fact that an increase in theconcentration of the substrate means more food being supplied tothe bacteria, which results in an increase in bacterial growth. Thepresence of more cell biomass increases the collisions between cellsand causes more aggregation to occur. As reported by Liu and Tay(2002), the collision between particles is one of the key factorsinfluencing the formation and stabilization of biofilm, anaerobic,and aerobic granules.
An increase in substrate concentration may also enhance thebacterial growth rate, which would also increase the productionextracellular polymeric substances, particularly when faced withstarvation (Wang et al., 2006). The presence extracellular polymericsubstances on the cell surface could alter the physicochemicalproperties of the bacterial cell surface, which include surfacecharge and surface hydrophobicity. As reported by Wang et al.(2005), the poorly soluble and non-biodegradable extracellularpolymeric substances on the surface of biogranules is responsiblefor the higher hydrophobicity of the granules, which may facilitatethe adhesion or aggregation processes of the granules (Kjelleberget al., 1987; Jiang et al., 2004). More recently, Lin et al. (2010)found alginate-like exopolysaccharides as one of the dominantcomponents in aerobic granules and that they significantly influ-ence the physical and chemical characteristics of the granules.
The effect of pH on%Ag and %SHbwas also found to be significant,with a p-value of less than 0.05. However, based on the estimatedeffects of �13.84 and �8.05, increases in pH are expected to reduceaggregation and surface hydrophobicity of the bacteria. This phe-nomenon is thought to be related to bacterial surface charge. Underneutral conditions, the bacteria would be negatively charged owingto the ionization of carboxyl, sulfate, and phosphate that act asfunctional groups on the surface of the cell (Sutherland, 2001). Asthey have the same charges, there will be a repulsive force betweenthe two cell surfaces, which inhibits cell aggregation. Under acidicconditions, the presence of excess Hþ will neutralize the cell surfacecharge. This will reduce the repulsion and in turn favors cell-to-cellapproach and the formation of cell aggregates can be initiated(Derjaugin and Lanadau, 1941). However, under alkaline conditions,the excess OH� would enhance the surface charges on the cells andconsequently increase the repulsive forces causing cells to be drivenfurther apart, indicated by the reduction in %Ag and %SHb.
Differences in pH of the media can also be associated with thetype of substrate used in the growth media. Different types of
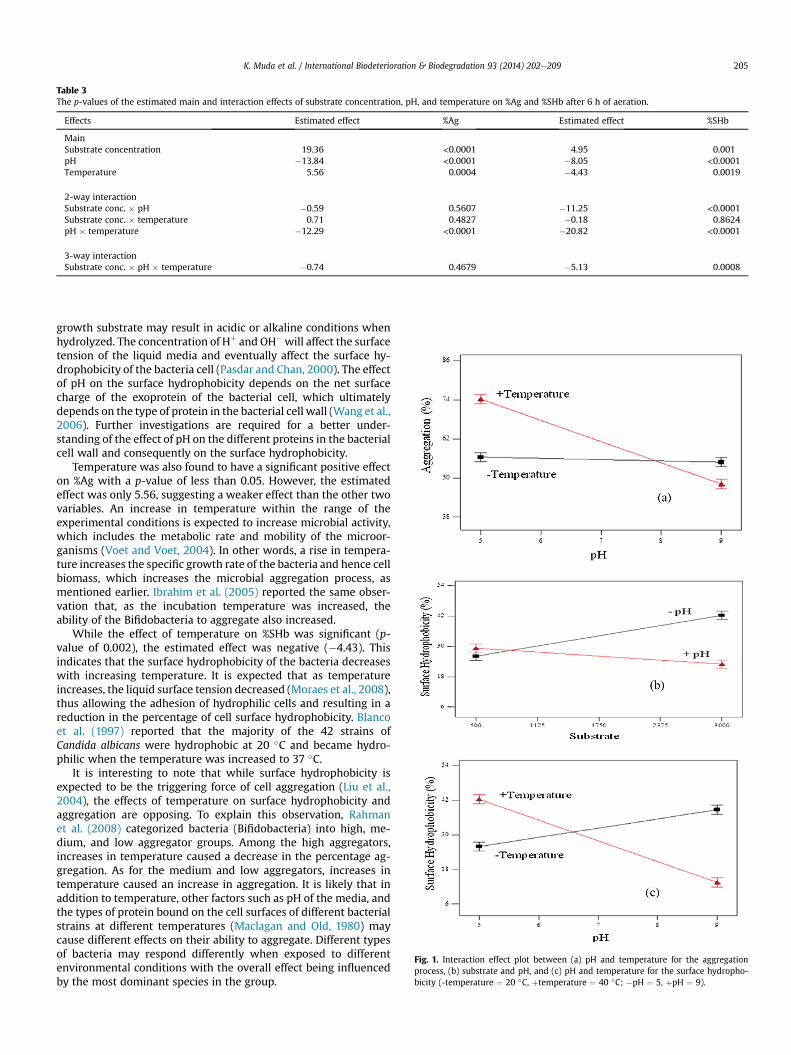
Fig. 1. Interaction effect plot between (a) pH and temperature for the aggregationprocess, (b) substrate and pH, and (c) pH and temperature for the surface hydropho-bicity (-temperature ¼ 20 �C, þtemperature ¼ 40 �C; �pH ¼ 5, þpH ¼ 9).
Table 3The p-values of the estimated main and interaction effects of substrate concentration, pH, and temperature on %Ag and %SHb after 6 h of aeration.
Effects Estimated effect %Ag Estimated effect %SHb
MainSubstrate concentration 19.36 <0.0001 4.95 0.001pH �13.84 <0.0001 �8.05 <0.0001Temperature 5.56 0.0004 �4.43 0.0019
2-way interactionSubstrate conc. � pH �0.59 0.5607 �11.25 <0.0001Substrate conc. � temperature 0.71 0.4827 �0.18 0.8624pH � temperature �12.29 <0.0001 �20.82 <0.0001
3-way interactionSubstrate conc. � pH � temperature �0.74 0.4679 �5.13 0.0008
K. Muda et al. / International Biodeterioration & Biodegradation 93 (2014) 202e209 205
growth substrate may result in acidic or alkaline conditions whenhydrolyzed. The concentration of Hþ and OH�will affect the surfacetension of the liquid media and eventually affect the surface hy-drophobicity of the bacteria cell (Pasdar and Chan, 2000). The effectof pH on the surface hydrophobicity depends on the net surfacecharge of the exoprotein of the bacterial cell, which ultimatelydepends on the type of protein in the bacterial cell wall (Wang et al.,2006). Further investigations are required for a better under-standing of the effect of pH on the different proteins in the bacterialcell wall and consequently on the surface hydrophobicity.
Temperature was also found to have a significant positive effecton %Ag with a p-value of less than 0.05. However, the estimatedeffect was only 5.56, suggesting a weaker effect than the other twovariables. An increase in temperature within the range of theexperimental conditions is expected to increase microbial activity,which includes the metabolic rate and mobility of the microor-ganisms (Voet and Voet, 2004). In other words, a rise in tempera-ture increases the specific growth rate of the bacteria and hence cellbiomass, which increases the microbial aggregation process, asmentioned earlier. Ibrahim et al. (2005) reported the same obser-vation that, as the incubation temperature was increased, theability of the Bifidobacteria to aggregate also increased.
While the effect of temperature on %SHb was significant (p-value of 0.002), the estimated effect was negative (�4.43). Thisindicates that the surface hydrophobicity of the bacteria decreaseswith increasing temperature. It is expected that as temperatureincreases, the liquid surface tension decreased (Moraes et al., 2008),thus allowing the adhesion of hydrophilic cells and resulting in areduction in the percentage of cell surface hydrophobicity. Blancoet al. (1997) reported that the majority of the 42 strains ofCandida albicans were hydrophobic at 20 �C and became hydro-philic when the temperature was increased to 37 �C.
It is interesting to note that while surface hydrophobicity isexpected to be the triggering force of cell aggregation (Liu et al.,2004), the effects of temperature on surface hydrophobicity andaggregation are opposing. To explain this observation, Rahmanet al. (2008) categorized bacteria (Bifidobacteria) into high, me-dium, and low aggregator groups. Among the high aggregators,increases in temperature caused a decrease in the percentage ag-gregation. As for the medium and low aggregators, increases intemperature caused an increase in aggregation. It is likely that inaddition to temperature, other factors such as pH of the media, andthe types of protein bound on the cell surfaces of different bacterialstrains at different temperatures (Maclagan and Old, 1980) maycause different effects on their ability to aggregate. Different typesof bacteria may respond differently when exposed to differentenvironmental conditions with the overall effect being influencedby the most dominant species in the group.
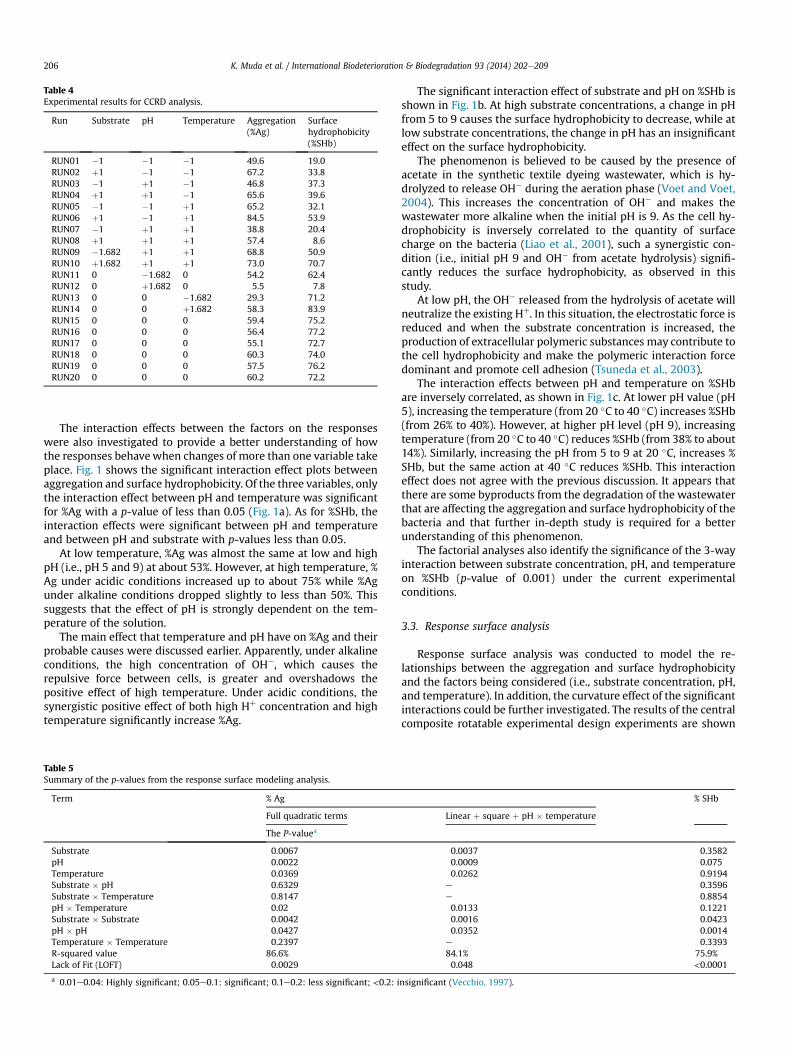
Table 4Experimental results for CCRD analysis.
Run Substrate pH Temperature Aggregation(%Ag)
Surfacehydrophobicity(%SHb)
RUN01 �1 �1 �1 49.6 19.0RUN02 þ1 �1 �1 67.2 33.8RUN03 �1 þ1 �1 46.8 37.3RUN04 þ1 þ1 �1 65.6 39.6RUN05 �1 �1 þ1 65.2 32.1RUN06 þ1 �1 þ1 84.5 53.9RUN07 �1 þ1 þ1 38.8 20.4RUN08 þ1 þ1 þ1 57.4 8.6RUN09 �1.682 þ1 þ1 68.8 50.9RUN10 þ1.682 þ1 þ1 73.0 70.7RUN11 0 �1.682 0 54.2 62.4RUN12 0 þ1.682 0 5.5 7.8RUN13 0 0 �1.682 29.3 71.2RUN14 0 0 þ1.682 58.3 83.9RUN15 0 0 0 59.4 75.2RUN16 0 0 0 56.4 77.2RUN17 0 0 0 55.1 72.7RUN18 0 0 0 60.3 74.0RUN19 0 0 0 57.5 76.2RUN20 0 0 0 60.2 72.2
K. Muda et al. / International Biodeterioration & Biodegradation 93 (2014) 202e209206
The interaction effects between the factors on the responseswere also investigated to provide a better understanding of howthe responses behavewhen changes of more than one variable takeplace. Fig. 1 shows the significant interaction effect plots betweenaggregation and surface hydrophobicity. Of the three variables, onlythe interaction effect between pH and temperature was significantfor %Ag with a p-value of less than 0.05 (Fig. 1a). As for %SHb, theinteraction effects were significant between pH and temperatureand between pH and substrate with p-values less than 0.05.
At low temperature, %Ag was almost the same at low and highpH (i.e., pH 5 and 9) at about 53%. However, at high temperature, %Ag under acidic conditions increased up to about 75% while %Agunder alkaline conditions dropped slightly to less than 50%. Thissuggests that the effect of pH is strongly dependent on the tem-perature of the solution.
The main effect that temperature and pH have on %Ag and theirprobable causes were discussed earlier. Apparently, under alkalineconditions, the high concentration of OH�, which causes therepulsive force between cells, is greater and overshadows thepositive effect of high temperature. Under acidic conditions, thesynergistic positive effect of both high Hþ concentration and hightemperature significantly increase %Ag.
Table 5Summary of the p-values from the response surface modeling analysis.
Term % Ag
Full quadratic terms
The P-valuea
Substrate 0.0067pH 0.0022Temperature 0.0369Substrate � pH 0.6329Substrate � Temperature 0.8147pH � Temperature 0.02Substrate � Substrate 0.0042pH � pH 0.0427Temperature � Temperature 0.2397R-squared value 86.6%Lack of Fit (LOFT) 0.0029
a 0.01e0.04: Highly significant; 0.05e0.1: significant; 0.1e0.2: less significant; <0.2: i
The significant interaction effect of substrate and pH on %SHb isshown in Fig. 1b. At high substrate concentrations, a change in pHfrom 5 to 9 causes the surface hydrophobicity to decrease, while atlow substrate concentrations, the change in pH has an insignificanteffect on the surface hydrophobicity.
The phenomenon is believed to be caused by the presence ofacetate in the synthetic textile dyeing wastewater, which is hy-drolyzed to release OH� during the aeration phase (Voet and Voet,2004). This increases the concentration of OH� and makes thewastewater more alkaline when the initial pH is 9. As the cell hy-drophobicity is inversely correlated to the quantity of surfacecharge on the bacteria (Liao et al., 2001), such a synergistic con-dition (i.e., initial pH 9 and OH� from acetate hydrolysis) signifi-cantly reduces the surface hydrophobicity, as observed in thisstudy.
At low pH, the OH� released from the hydrolysis of acetate willneutralize the existing Hþ. In this situation, the electrostatic force isreduced and when the substrate concentration is increased, theproduction of extracellular polymeric substances may contribute tothe cell hydrophobicity and make the polymeric interaction forcedominant and promote cell adhesion (Tsuneda et al., 2003).
The interaction effects between pH and temperature on %SHbare inversely correlated, as shown in Fig. 1c. At lower pH value (pH5), increasing the temperature (from 20 �C to 40 �C) increases %SHb(from 26% to 40%). However, at higher pH level (pH 9), increasingtemperature (from 20 �C to 40 �C) reduces %SHb (from 38% to about14%). Similarly, increasing the pH from 5 to 9 at 20 �C, increases %SHb, but the same action at 40 �C reduces %SHb. This interactioneffect does not agree with the previous discussion. It appears thatthere are some byproducts from the degradation of the wastewaterthat are affecting the aggregation and surface hydrophobicity of thebacteria and that further in-depth study is required for a betterunderstanding of this phenomenon.
The factorial analyses also identify the significance of the 3-wayinteraction between substrate concentration, pH, and temperatureon %SHb (p-value of 0.001) under the current experimentalconditions.
3.3. Response surface analysis
Response surface analysis was conducted to model the re-lationships between the aggregation and surface hydrophobicityand the factors being considered (i.e., substrate concentration, pH,and temperature). In addition, the curvature effect of the significantinteractions could be further investigated. The results of the centralcomposite rotatable experimental design experiments are shown
% SHb
Linear þ square þ pH � temperature
0.0037 0.35820.0009 0.0750.0262 0.9194
e 0.3596e 0.88540.0133 0.12210.0016 0.04230.0352 0.0014
e 0.339384.1% 75.9%0.048 <0.0001
nsignificant (Vecchio, 1997).
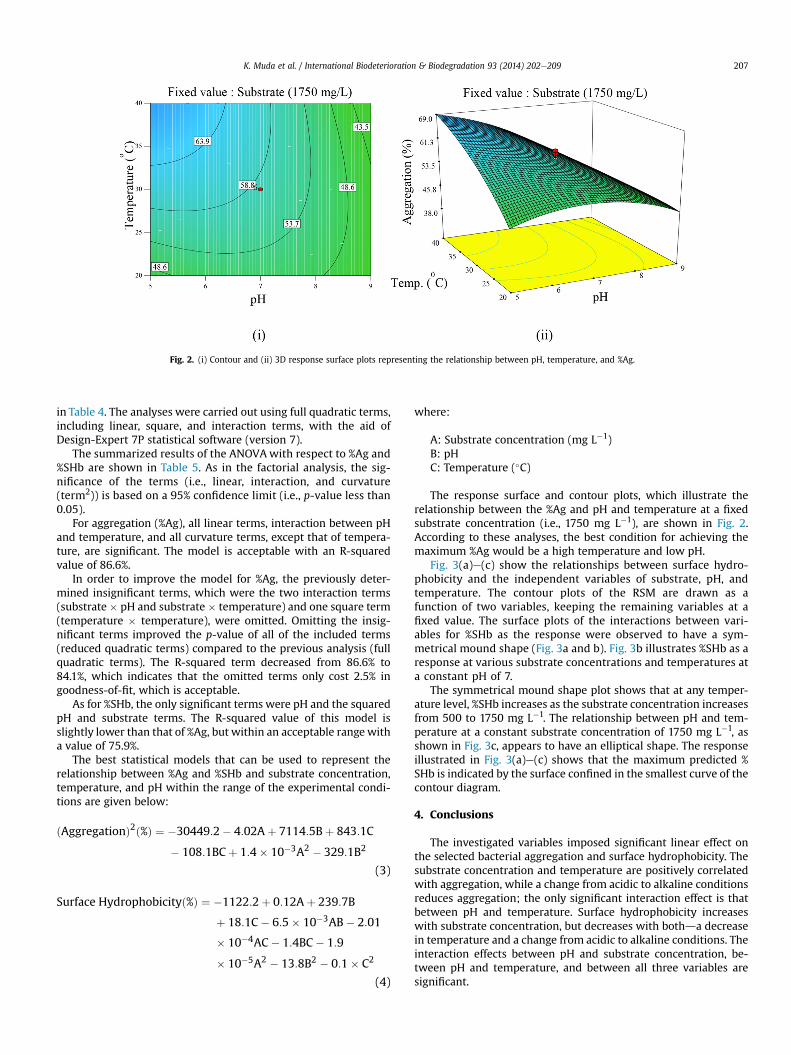
Fig. 2. (i) Contour and (ii) 3D response surface plots representing the relationship between pH, temperature, and %Ag.
K. Muda et al. / International Biodeterioration & Biodegradation 93 (2014) 202e209 207
in Table 4. The analyses were carried out using full quadratic terms,including linear, square, and interaction terms, with the aid ofDesign-Expert 7P statistical software (version 7).
The summarized results of the ANOVAwith respect to %Ag and%SHb are shown in Table 5. As in the factorial analysis, the sig-nificance of the terms (i.e., linear, interaction, and curvature(term2)) is based on a 95% confidence limit (i.e., p-value less than0.05).
For aggregation (%Ag), all linear terms, interaction between pHand temperature, and all curvature terms, except that of tempera-ture, are significant. The model is acceptable with an R-squaredvalue of 86.6%.
In order to improve the model for %Ag, the previously deter-mined insignificant terms, which were the two interaction terms(substrate� pH and substrate� temperature) and one square term(temperature � temperature), were omitted. Omitting the insig-nificant terms improved the p-value of all of the included terms(reduced quadratic terms) compared to the previous analysis (fullquadratic terms). The R-squared term decreased from 86.6% to84.1%, which indicates that the omitted terms only cost 2.5% ingoodness-of-fit, which is acceptable.
As for %SHb, the only significant terms were pH and the squaredpH and substrate terms. The R-squared value of this model isslightly lower than that of %Ag, but within an acceptable range witha value of 75.9%.
The best statistical models that can be used to represent therelationship between %Ag and %SHb and substrate concentration,temperature, and pH within the range of the experimental condi-tions are given below:
ðAggregationÞ2ð%Þ ¼ �30449:2� 4:02Aþ 7114:5Bþ 843:1C
� 108:1BCþ 1:4� 10�3A2 � 329:1B2
(3)
Surface Hydrophobicityð%Þ ¼ �1122:2þ 0:12Aþ 239:7B
þ 18:1C� 6:5� 10�3AB� 2:01
� 10�4AC� 1:4BC� 1:9
� 10�5A2 � 13:8B2 � 0:1� C2
(4)
where:
A: Substrate concentration (mg L�1)B: pHC: Temperature (�C)
The response surface and contour plots, which illustrate therelationship between the %Ag and pH and temperature at a fixedsubstrate concentration (i.e., 1750 mg L�1), are shown in Fig. 2.According to these analyses, the best condition for achieving themaximum %Ag would be a high temperature and low pH.
Fig. 3(a)e(c) show the relationships between surface hydro-phobicity and the independent variables of substrate, pH, andtemperature. The contour plots of the RSM are drawn as afunction of two variables, keeping the remaining variables at afixed value. The surface plots of the interactions between vari-ables for %SHb as the response were observed to have a sym-metrical mound shape (Fig. 3a and b). Fig. 3b illustrates %SHb as aresponse at various substrate concentrations and temperatures ata constant pH of 7.
The symmetrical mound shape plot shows that at any temper-ature level, %SHb increases as the substrate concentration increasesfrom 500 to 1750 mg L�1. The relationship between pH and tem-perature at a constant substrate concentration of 1750 mg L�1, asshown in Fig. 3c, appears to have an elliptical shape. The responseillustrated in Fig. 3(a)e(c) shows that the maximum predicted %SHb is indicated by the surface confined in the smallest curve of thecontour diagram.
4. Conclusions
The investigated variables imposed significant linear effect onthe selected bacterial aggregation and surface hydrophobicity. Thesubstrate concentration and temperature are positively correlatedwith aggregation, while a change from acidic to alkaline conditionsreduces aggregation; the only significant interaction effect is thatbetween pH and temperature. Surface hydrophobicity increaseswith substrate concentration, but decreases with bothda decreasein temperature and a change from acidic to alkaline conditions. Theinteraction effects between pH and substrate concentration, be-tween pH and temperature, and between all three variables aresignificant.
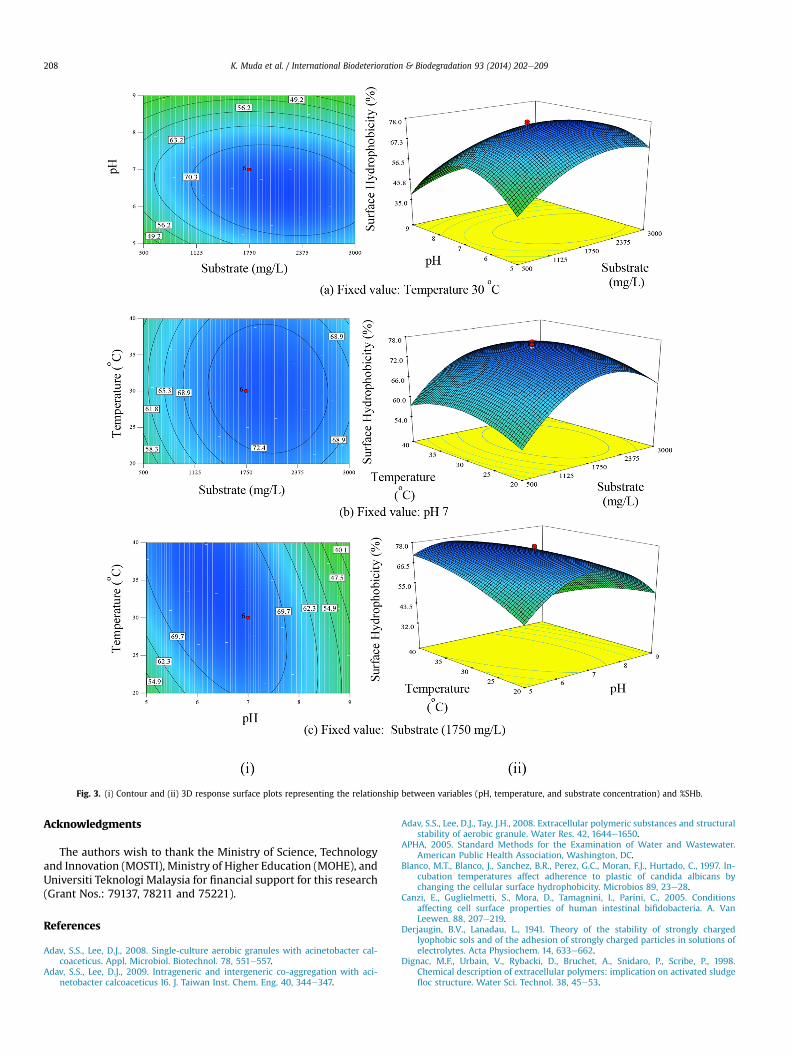
Fig. 3. (i) Contour and (ii) 3D response surface plots representing the relationship between variables (pH, temperature, and substrate concentration) and %SHb.
K. Muda et al. / International Biodeterioration & Biodegradation 93 (2014) 202e209208
Acknowledgments
The authors wish to thank the Ministry of Science, Technologyand Innovation (MOSTI), Ministry of Higher Education (MOHE), andUniversiti Teknologi Malaysia for financial support for this research(Grant Nos.: 79137, 78211 and 75221).
References
Adav, S.S., Lee, D.J., 2008. Single-culture aerobic granules with acinetobacter cal-coaceticus. Appl. Microbiol. Biotechnol. 78, 551e557.
Adav, S.S., Lee, D.J., 2009. Intrageneric and intergeneric co-aggregation with aci-netobacter calcoaceticus I6. J. Taiwan Inst. Chem. Eng. 40, 344e347.
Adav, S.S., Lee, D.J., Tay, J.H., 2008. Extracellular polymeric substances and structuralstability of aerobic granule. Water Res. 42, 1644e1650.
APHA, 2005. Standard Methods for the Examination of Water and Wastewater.American Public Health Association, Washington, DC.
Blanco, M.T., Blanco, J., Sanchez, B.R., Perez, G.C., Moran, F.J., Hurtado, C., 1997. In-cubation temperatures affect adherence to plastic of candida albicans bychanging the cellular surface hydrophobicity. Microbios 89, 23e28.
Canzi, E., Guglielmetti, S., Mora, D., Tamagnini, I., Parini, C., 2005. Conditionsaffecting cell surface properties of human intestinal bifidobacteria. A. VanLeewen. 88, 207e219.
Derjaugin, B.V., Lanadau, L., 1941. Theory of the stability of strongly chargedlyophobic sols and of the adhesion of strongly charged particles in solutions ofelectrolytes. Acta Physiochem. 14, 633e662.
Dignac, M.F., Urbain, V., Rybacki, D., Bruchet, A., Snidaro, P., Scribe, P., 1998.Chemical description of extracellular polymers: implication on activated sludgefloc structure. Water Sci. Technol. 38, 45e53.
K. Muda et al. / International Biodeterioration & Biodegradation 93 (2014) 202e209 209
Ibrahim, S.A., Hassan, O.A., Salameh, M.M., Shahbazi, A., 2005. Effect of mediacomposition and incubation temperatures on auto aggregation behavior ofbifidobacteria. Milchwiss. Milk. Sci. Int. 60, 127e129.
Jiang, H.L., Tay, J.H., Tay, S.T.L., 2004. Bacterial diversity and function of aerobicgranules engineered in a sequencing batch reactor for phenol degradation.Appl. Environ. Microbiol. 70, 6767e6775.
Kjelleberg, S., Hermansson, M., Marden, P., Jones, G.W., 1987. The transient phasebetween growth and nongrowth of heteoprothic bacteria, with emphasis on themarine environment. Annu. Rev. Microbiol. 41, 25e49.
Liao, B.Q., Allen, D.G., Droppo, I.G., Leppard, G.G., Liss, S.N., 2001. Surface propertiesof sludge and their role in bioflocculation and settleability. Water Res. 35,339e350.
Lin, Y., de Kreuk, M., van Loosdrect, M.C.M., Adin, A., 2010. Characterization ofalginate like exopolysaccharides isolated from aerobic granular sludge in pilotplant. Water Res. 44, 3355e3364.
Liu, Y., Tay, J.H., 2002. The essential role of hydrodynamic shear force in the for-mation of biofilm and granular sludge. Water Res. 36, 1653e1665.
Liu, Y., Yang, S.F., Tay, J.H., Liu, Q.S., Qin, L., Li, Y., 2004. Cell hydrophobicity is atriggering force of biogranulation. Enzyme Microbiol. Technol. 34, 371e379.
Maclagan, R.M., Old, D.C., 1980. Heamaglutinins and fimbriae in different serotypesand biotypes of Yersinia enterocolitica. J. Appl. Bacteriol. 49, 353e360.
Madigan, J.E., Pusterla, N., Johnson, E., Chae, J.S., Pusterla, J.B., DeRock, E., Lawler, S.P.,2000. Transmission of Ehrlichia risticii, the agent of potomac horse fever, usingnaturally infected aquatic insects and helminth vectors: preliminary report.Equine. Vet. J. 32, 275e279.
Malik, A., Sakamoto, M., Hanazaki, S., Osawa, M., Suzuki, T., Tochigi, M., Kakii, K.,2003. Coaggregation among nonflocculating bacteria isolated from activatedsludge. Appl. Environ. Microbiol. 69, 6056e6063.
Marin, M.L., Benito, Y., Pin, C., Fernandez, M.F., Garcia, M.L., Selgas, M.D., Casas, C.,1997. Lactic acid bacteria: hydrophobicity and strength of attachment to meatsurfaces. Lett. Appl. Microbiol. 24, 14e18.
Moraes, M.A., Rosa, G.S., Pinto, L.A.A., 2008. Moisture sorption isotherms andthermodynamic properties of apple fuji and garlic. Int. J. Food Sci. Technol. 43,1824e1831.
Muda, K., 2010. Facultative Granular Sludge for Textile Wastewater Treatment. PhDthesis. Universiti Teknologi Malaysia, Malaysia.
Muda, K., Aris, A., Salim, M.R., Ibrahim, Z., Yahya, A., van Loosdrecht, M.C.M.,Ahmad, A., Nawahwi, M.Z., 2010. Development of granular sludge for textilewastewater treatment. Water Res. 44, 4143e4150.
Nishiyama, S., Murakami, Y., Nagata, H., Shizukuishi, S., Kawagishi, I., Yoshimura, F.,2007. Involvement of minor components associated with the fima fimbriae ofporphyromonas gingivalis in adhesive functions. Microbiology 153, 1916e1925.
Pasdar, N.A., Chan, C.Y.L., 2000. Comparison of protein surface hydrophobicitymeasured at various ph values using three different fluorescent probes. J. Agr.Food Chem. 48, 328e334.
Rahman, M.M., Kim, W.S., Kumura, H., Shimazaki, K.K., 2008. Autoaggregation andsurface hydrophobicity of bifidobacteria. World J. Microbiol. Biotechnol. 24,1593e1598.
Rosenberg, M., Gutnick, D., Rosenberg, E., 1980. Adherence of bacteria to hydro-carbons: a simple method for measuring cell surface hydrophobicity. FEMSMicrobiol. Lett. 9, 29e33.
Smolders, G.J.L., Klop, J., van Loosdrecht, M.C.M., Heijnen, J.J., 1995. A metabolicmodel of the biological phosphorus removal process: effect of the sludgeretention time. Biotechnol. Bioeng. 48, 222e233.
Sutherland, I.W., 2001. Biofilm exopolysaccharides: a strong and sticky framework.Microbiology 147, 3e9.
Tsuneda, S., Jung, J., Hayashi, H., Aikawa, H., Hirata, A., Sasaki, H., 2003. Influence ofextracellular polymers on electrokinetic properties of heterotrophic bacterialcells examined by soft particle electrophoresis theory. Colloids Surf. B. 29,181e188.
Vecchio, R.J.D., 1997. Understanding Design of Experiments, a Primer for Technol-ogists. Hanser/Gardner Publications, Cincinnati, USA.
Voet, D., Voet, J.G., 2004. Biochemistry 1. John Wiley & Sons Inc., Hoboken, NewJersey.
Wan, J., Mozoa, I., Filalia, A., Line, A., Bessiere, Y., Sperandio, M., 2011. Evolution ofbioaggregate strength during aerobic granular sludge formation. Biochem. Eng.J. 58e59, 69e78.
Wang, S.G., Gai, L.H., Zhao, L.J., Fan, M.H., Gong, W.X., Gaoa, B.Y., Maa, Y., 2009.Aerobic granules for low strength wastewater treatment: formation, structureand microbial community. J. Chem. Technol. Biotechnol. 84, 1015e1020.
Wang, Z.W., Liu, L., Yao, J., Cai, W., 2006. Effects of extracellular polymeric sub-stances on aerobic granulation in sequencing batch reactors. Chemosphere 63,1728e1735.
Wang, Z.W., Liu, Y., Tay, J.H., 2005. Distribution of EPS and cell surface hydropho-bicity in aerobic granules. Appl. Microbiol. Biotechnol. 69, 469e473.
Zhu, L., Li, M., Dai, X., Yu, Y.W., Qi, H.Y., Xu, X.Y., 2012. Role and significance ofextracellular polymeric substances on the property of aerobic granule. Bio-resour. Technol. 107, 46e54.