Aggregation kinetics of Cryptosporidium parvum oocysts
6
Aggregation kinetics of Cryptosporidium parvum oocysts Venkatesh Shankar Iyer *, Udayan Majumdar, Morris Waskar, Manoj V. Dagaonkar Unilever R&D Bangalore, 64, Main Road, Whitefield, Bangalore 560066, India Introduction The third edition of the WHO Guidelines for Drinking Water Quality (2004) introduced the concept of reference pathogens for drinking water [1]. Cryptosporidium a species of parasitic protozoa that is transmitted as oocyst through drinking water is considered as one such reference pathogen [2]. C. parvum and C. hominis are the two species of Cryptosporidium largely implicated in the waterborne and faecal-orally transmitted disease cryptosporidio- sis in humans. Oocysts, produced by Cryptosporidium as part of its life cycle, are very persistent in the environment, resistant to chemical disinfectants like chlorine, and are difficult to filter due to their small size (4–6 mm). Cryptosporidium is widespread in waters with high levels of exposure and high rates of asymptomatic carriage (10–30%) than illnesses, with a mortality rate of 1:100,000 or lower in healthy adults while the risk is much higher in children, old and immune compromised individuals [2]. C. parvum oocysts have been studied using imaging techniques like scanning electron microscopy (SEM), optical, fluorescence, confocal and more recently atomic force microscopy [3–6]. Coagulation is a process by which very fine dispersed colloids are destabilized in liquid systems, leads to formation of larger agglomerates that allow their sedimentation or filtration. While sedimentation is possible if the particle size is at least 1 mm and a density more than that of water, coagulation/flocculation is commonly achieved by adding various types of chemicals (coagulants, salts of Al and Fe, etc.) to water that promotes destabilization of colloid dispersion and agglomeration of the resulting individual colloidal particles. Most work on characteri- zation of colloids have focused on the structure formed as a function of pH, electrolyte concentration and hydrodynamics and have tried to correlate them to the strength of the resulting structure. In this context, video microscopy has been extensively to study aggregation of particulate matter in real time [7–15]. A comprehensive review of the optical techniques on concentrated colloidal suspensions [16] and a critical review of confocal microscopy for static colloidal suspensions in confined geometries are available [15,17]. Traditionally, in these systems wherein the aggregation is monitored, the number of particles are typically ten million particles/L and involve a very long time for aggregation [14,15,18]. Oocyst and its surrogate (polystyrene latex beads or microspheres) have been characterized in terms of their surface charge (zeta potential) and electrophoretic mobility. The surface charge is a strong function of solution chemistry and has been observed to be negative under most study conditions. [19–25]. Journal of Environmental Chemical Engineering 1 (2013) 504–509 A R T I C L E I N F O Article history: Received 5 March 2013 Accepted 9 June 2013 Keywords: Oocyst Cryptosporidium parvum Surface charge Zeta potential A B S T R A C T Cryptosporidium parvum (C. parvum), an organism of increasing importance in drinking water, spreads to the environment through faeces of infected animals and humans. C. parvum produces infective chlorine- resistant oocyst that are removed from contaminated raw waters primarily using physical methods such as entrapment in surface or depth bed filters and coagulation–flocculation. In this paper, the aggregation properties of gamma-irradiated C. parvum oocysts in dilute concentrations, as a function of stirring time in the presence of bivalent and trivalent cations were studied. The size and surface charge of C. parvum oocysts were characterized before they were used for aggregation experiments. The surface charge of the oocysts, measured using a zeta potential analyzer were in the range of 57 2 mV, which increased to 31 2 mV in presence of bivalent electrolytes. Aggregation of oocyst in dilute suspensions was monitored using confocal laser scanning microscope (CLSM) in presence of bivalent or trivalent electrolytes. Aggregation was not visible in the diluted C. parvum oocyst suspension in Milli Q water system in the time frame of the experiment. Addition of a bivalent or trivalent salt with stirring condition induced aggregation due to the suppression of the surface charge of oocysts, resulting in a decrease in the energy of interaction between oocysts, and a decrease in double layer thickness around the oocysts. Predictive models could be built to understand C. parvum oocyst aggregation in raw waters, which could significantly improve the removal of oocysts from untreated (raw) drinking water. ß 2013 Elsevier Ltd All rights reserved. * Corresponding author. Tel.: +91 80 39831223; fax: +91 80 28453086. E-mail addresses: [email protected], [email protected] (V.S. Iyer). Contents lists available at SciVerse ScienceDirect Journal of Environmental Chemical Engineering jou r n al h o mep ag e: w ww .elsevier .co m /loc ate/jec e 2213-3437/$ – see front matter ß 2013 Elsevier Ltd All rights reserved. http://dx.doi.org/10.1016/j.jece.2013.06.009
Transcript of Aggregation kinetics of Cryptosporidium parvum oocysts
Journal of Environmental Chemical Engineering 1 (2013) 504–509
Aggregation kinetics of Cryptosporidium parvum oocysts
Venkatesh Shankar Iyer *, Udayan Majumdar, Morris Waskar, Manoj V. Dagaonkar
Unilever R&D Bangalore, 64, Main Road, Whitefield, Bangalore 560066, India
A R T I C L E I N F O
Article history:
Received 5 March 2013
Accepted 9 June 2013
Keywords:
Oocyst
Cryptosporidium parvum
Surface charge
Zeta potential
A B S T R A C T
Cryptosporidium parvum (C. parvum), an organism of increasing importance in drinking water, spreads to
the environment through faeces of infected animals and humans. C. parvum produces infective chlorine-
resistant oocyst that are removed from contaminated raw waters primarily using physical methods such
as entrapment in surface or depth bed filters and coagulation–flocculation. In this paper, the aggregation
properties of gamma-irradiated C. parvum oocysts in dilute concentrations, as a function of stirring time
in the presence of bivalent and trivalent cations were studied. The size and surface charge of C. parvum
oocysts were characterized before they were used for aggregation experiments. The surface charge of the
oocysts, measured using a zeta potential analyzer were in the range of �57 � 2 mV, which increased to
�31 � 2 mV in presence of bivalent electrolytes. Aggregation of oocyst in dilute suspensions was monitored
using confocal laser scanning microscope (CLSM) in presence of bivalent or trivalent electrolytes.
Aggregation was not visible in the diluted C. parvum oocyst suspension in Milli Q water system in the time
frame of the experiment. Addition of a bivalent or trivalent salt with stirring condition induced aggregation
due to the suppression of the surface charge of oocysts, resulting in a decrease in the energy of interaction
between oocysts, and a decrease in double layer thickness around the oocysts. Predictive models could be
built to understand C. parvum oocyst aggregation in raw waters, which could significantly improve the
removal of oocysts from untreated (raw) drinking water.
� 2013 Elsevier Ltd All rights reserved.
Contents lists available at SciVerse ScienceDirect
Journal of Environmental Chemical Engineering
jou r n al h o mep ag e: w ww .e lsev ier . co m / loc ate / jec e
Introduction
The third edition of the WHO Guidelines for Drinking WaterQuality (2004) introduced the concept of reference pathogens fordrinking water [1]. Cryptosporidium a species of parasitic protozoathat is transmitted as oocyst through drinking water is consideredas one such reference pathogen [2]. C. parvum and C. hominis arethe two species of Cryptosporidium largely implicated in thewaterborne and faecal-orally transmitted disease cryptosporidio-sis in humans. Oocysts, produced by Cryptosporidium as part of itslife cycle, are very persistent in the environment, resistant tochemical disinfectants like chlorine, and are difficult to filter due totheir small size (4–6 mm). Cryptosporidium is widespread in waterswith high levels of exposure and high rates of asymptomaticcarriage (10–30%) than illnesses, with a mortality rate of 1:100,000or lower in healthy adults while the risk is much higher in children,old and immune compromised individuals [2]. C. parvum oocystshave been studied using imaging techniques like scanning electronmicroscopy (SEM), optical, fluorescence, confocal and morerecently atomic force microscopy [3–6].
* Corresponding author. Tel.: +91 80 39831223; fax: +91 80 28453086.
E-mail addresses: [email protected], [email protected]
(V.S. Iyer).
2213-3437/$ – see front matter � 2013 Elsevier Ltd All rights reserved.
http://dx.doi.org/10.1016/j.jece.2013.06.009
Coagulation is a process by which very fine dispersed colloidsare destabilized in liquid systems, leads to formation of largeragglomerates that allow their sedimentation or filtration. Whilesedimentation is possible if the particle size is at least 1 mm and adensity more than that of water, coagulation/flocculation iscommonly achieved by adding various types of chemicals(coagulants, salts of Al and Fe, etc.) to water that promotesdestabilization of colloid dispersion and agglomeration of theresulting individual colloidal particles. Most work on characteri-zation of colloids have focused on the structure formed as afunction of pH, electrolyte concentration and hydrodynamics andhave tried to correlate them to the strength of the resultingstructure. In this context, video microscopy has been extensively tostudy aggregation of particulate matter in real time [7–15]. Acomprehensive review of the optical techniques on concentratedcolloidal suspensions [16] and a critical review of confocalmicroscopy for static colloidal suspensions in confined geometriesare available [15,17]. Traditionally, in these systems wherein theaggregation is monitored, the number of particles are typically tenmillion particles/L and involve a very long time for aggregation[14,15,18]. Oocyst and its surrogate (polystyrene latex beads ormicrospheres) have been characterized in terms of their surfacecharge (zeta potential) and electrophoretic mobility. The surfacecharge is a strong function of solution chemistry and has beenobserved to be negative under most study conditions. [19–25].
Fig. 1. Schematics of the set-up for image analysis of C. parvum oocysts.
V.S. Iyer et al. / Journal of Environmental Chemical Engineering 1 (2013) 504–509 505
The objective of this work was to look at aggregation kinetics ofC. parvum oocysts in dilute concentrations (as per ANSI/NSFstandard [26]) as a function of stirring time in the presence ofdivalent or trivalent cationic salts. Physical characterization of C.
parvum oocyst was carried out to ensure that the oocysts wereconforming to the values reported in literature. Imaging ofaggregation in such dilute suspensions using CLSM is beingreported for the first time.
Materials and methods
Materials
Gamma irradiated C. parvum (IOWA Strain) oocysts wereobtained as Custom EasySeed from BTF (Australia, http://www.btfbio.com). The master stock had a concentration of4 � 105 oocysts/ml in standard phosphate buffered saline solution(pH = 7.5, TDS = 5860 ppm). C. parvum oocyst was visualized bystaining with a fluorescein-tagged monoclonal antibody (EasyStain kit, BTF, Australia), that binds to the oocyst wall components.Fluorescent carboxylated polystyrene-based latex microspheres,which were used as a surrogate for oocyst, were procured fromPolysciences Inc. as a 2.5 wt% aqueous suspension(�1.68 � 109 microspheres/ml, average size 4.5 mm). LR gradesodium bicarbonate (NaHCO3), calcium chloride (CaCl2), alumini-um chloride (AlCl3) and Tween 20 were procured from SigmaAldrich.
Methods
Size distribution of oocysts by image analysis
The oocysts from the master stock were diluted in Milli-Q waterand mixed vigorously. The suspended oocysts were then filteredthrough a 0.45 mm black filter (HTBP, Millipore), washed with0.01% Tween 20 and Milli-Q water, stained using fluorescein-labelled monoclonal antibodies (Easy Stain, BTF Australia) andwashed with the supplied wash buffer post incubation. The filterswere then mounted in the mounting medium (provided in the EasyStain kit) and observed. The oocysts stained apple green withbright edges and a relatively less bright oocyst body. The slide wasmounted on the platform of Olympus BX40 Optical microscope andthe images captured and analyzed using Image-Pro Plus software.The digital images of oocyst were acquired using a 40� objective influorescent mode, converted to grey scale and after thresholding,the mean diameter of oocyst was measured using the imageanalysis software.
Size distribution of oocysts by light scattering
The particle size distribution of oocyst was measured usingMalvern Master Sizer 2000, Hydro 2000S. The tank that held thesample and dispersant was filled with de-ionized double distilledwater. The speed of the circulation pump was kept around2000 rpm during the experiment. The laser intensity was >75%before starting the experiment. 10 ml of oocyst master stocksuspension was poured in the sample tank and the readingsrecorded.
Surface charge of oocysts
Zeta potential measurements of the aggregates at variousstirring time points were carried out using a Zeta Plus zetapotential and particle size analyzer from Brookhaven InstrumentsCorporation, Holtsville, NY. The oocyst master stock was diluted 10times and 100 times respectively by adding Milli-Q water andmixed well. The cell of the zeta potential meter was filled with thissuspension and the electrodes (Molybdenum as an anode &Platinum as cathode) were fitted to the cell. The electrodes were
energized at 150 V and the oocyst movement was tracked. Thesame process was followed to measure the surface charge ofoocysts in presence of CaCl2 and NaHCO3 in Milli-Q water. Thesame procedure was followed to measure the surface charge ofmicrosphere (surrogates of oocysts).
Aggregation of oocyst
Aggregation experiments were performed with dilute concen-trations (50,000 oocysts/L) of irradiated C. parvum oocysts. Thesewere tagged with antibody-FITC dye and a suspension wasprepared with Milli-Q water. The colloidal suspensions werestirred at 100 rpm for one hour to ensure that only monomers werepresent in the stock. Presence of monomers was verified byviewing the sample under fluorescence microscope. The resultantpH of the solution was 7.5. To this monomer suspension,destabilizing salts (either CaCl2 or AlCl3) of specified molarconcentration was added and stirred further. Aliquots were takenat 30 min time intervals from the stirred suspension into 5 mlcuvettes and imaged with CLSM at 20� magnification.
Imaging of aggregated and non-aggregated oocysts
C. parvum oocyst from stock vial was diluted to a concentrationof 10,000 oocysts/ml and washed with saline and Milli-Q water at1 ml volume in an Eppendorf tube. The final C. parvum oocyst pelletwas re-suspended in 50 mL of Milli-Q water, incubated with 1%glutaraldehyde or 10% formaldehyde overnight, washed, sequen-tially dehydrated in ethanol (50–100%), then spotted on HTBPmembranes under negative pressure and left for drying. Alter-nately, the processed samples were spotted on clean glass coverslips for imaging. The filters and cover slips were mounted on SEMsupports, coated with a gold layer and observed.
Field Emission Scanning Electron Microscopy (FE-SEM, HitachiFE-4500) was used to image irradiated C. parvum oocysts. Imageswere recorded with typical gun voltage(s) ranging between 10–20 kV and magnifications up to 50,000�. CLSM, Leica TCS SP5 wasused to capture images of the suspensions at various time frames.Five ml aliquots from the stock were taken into plastic cuvetteswhich were of 4.5 cm in length and 1 cm in width. Imaging wasdone using 499 nm excitation, 488/543 dichroic and 500–600 nmemission slit widths. The cuvette was tightly closed so that therewas no water leakage. Multiple samples were prepared each timeand the images were acquired using CLSM. Since the cuvette wastransparent, particles at various depths were imaged easily. Fig. 1shows the schematic of the set-up used for imaging.
Since C. parvum oocysts in suspension were in constantBrownian motion, the images were acquired at higher capturefrequency. By varying the focal plane, oocysts at various depthswere imaged. For each of the time intervals, multiple aliquots ofsample were taken into the cuvette and images acquired.Approximate number of oocysts present in 5 ml of suspensionin the cuvette was determined by the initial suspension

0.1
1.0
10.0
100.0
0 2 4 6 8 10
Num
ber %
Size (μm)
Fig. 2. Particle size distribution data of C. parvum oocyst in master stock.
V.S. Iyer et al. / Journal of Environmental Chemical Engineering 1 (2013) 504–509506
concentration. These were separated into monomers, dimers andn-mers (n-mers defined as any aggregate which has three ormore monomers). The number of oocysts in the suspension wasalso verified by counting the colloidal particles from imagesacquired and direct counting while imaging the suspension.Percentage monomers, dimers and n-mers were calculated withreference to the total number of colloidal particles present in thecuvette.
pH
Input and output water pH was measured using a calibratedControl Dynamic pH meter; model APX175EC, manufactured by CDInstrumentation Private Limited, Bangalore, India.
Total dissolved solids (TDS)
Total dissolved solids content of water was directly measured inppm by using Equinox TDS meter, model TDS5031.
Results
Surface charge of C. parvum oocysts
The zeta potential values of oocysts at 1:100 dilution with Milli-Q water was found to be in the range of �57 � 2 mV which uponaddition of to 2 mM CaCl2, became relatively more positive to�31 � 2 mV.
Size of C. parvum oocysts
The size distribution of C. parvum oocysts is plotted in Fig. 2. It isevident from the data that many suspended particulate impuritieswere present in the stock along with the oocysts. Data analysis ofthe size distribution indicated only 39% of the total particles in theoocyst size range of 3.8–5.8 mm. In our experimental system sincewe dilute the master stock of oocyst 8000 times, the impact ofthose impurities would be minimal.
The diameter of C. parvum oocyst by Image analysis techniquewas found to be in the range of 4–5 mm (refer Fig. 3), as reported inliterature [3,5]. Table 1 mentions the size of the individual cysts ascalculated by Image Pro Plus software. The average diameter of C.
Fig. 3. Imaging (400�) of C. parvum oocyst ta
parvum oocysts is based on analyses of six samples done at twodifferent thresholds.
Image analysis of C. parvum oocyst
FE-SEM micrographs of the C. parvum oocysts were visible asempty structures (cyst walls) without any sporozoites (Fig. 4a andb). This may be due to incomplete fixation step or the C. parvum
oocyst may not have completely dehydrated. C. parvum oocyststructure and imaging vastly improved when the system was fixedin 10% formaldehyde (Fig. 4c and d).
Aggregation of C. parvum oocyst
To visualize a stable colloidal suspension, the C. parvum oocystswere dispersed in Milli-Q water and imaged at different timepoints. Aggregation was not observed in the absence of any addedsalt for up to 3 h when the experiment was run (Fig. 5a–c). The C.
parvum oocysts started to form aggregates i.e., started to clumptogether, once salts of divalent and trivalent cations were added tothe system. In 2 mM AlCl3 the aggregate formation started at30 min of stirring and n-mers were found to be maximum at 3 h ofstirring time (Fig. 5d–f). C. parvum oocyst aggregation was also
gged with Fluorescein labelled antibody.
Table 1Size of C. parvum oocyst measured using Image-Pro Plus.
Image no. Mean diameter (mm) Size range (mm)
Threshold 1 Threshold 2 Average size
1 4.5 4.9 4.7 4.5–4.7
2 4.4 4.5 4.5
3 4.6 4.5 4.5
4 4.8 4.6 4.7
5 4.7 4.7 4.7
6 4.6 4.9 4.7
V.S. Iyer et al. / Journal of Environmental Chemical Engineering 1 (2013) 504–509 507
observed in 2 mM CaCl2, but the aggregate formation was slowerthan that observed for AlCl3 (Fig. 5g–i).
Fig. 6 shows the resultant cluster size distribution of C. parvum
oocyst suspension as a function of stirring time in 2 mM AlCl3. Theconcentration of monomer reduced with time while aggregates(dimers, trimers and n-mers) started forming after 30 min ofcontinuous stirring at 100 rpm. The concentration of dimers wasthe maximum after 1 h of continuous stirring while n-mers tookmore time to form. Similar trend was observed with 2 mM CaCl2.
The effect of presence of bivalent and trivalent cations on thesurface charge of microsphere particles (surrogates of C. parvum
oocysts) was studied. The surface charge was measured at varyingconcentration of CaCl2 (Table 2) and AlCl3 (Table 3).
The divalent and trivalent cations suppressed the negativecharge on the microspheres, which helped in reducing therepulsion between the species, thus favouring their aggregation.It was interesting to observe that in case of CaCl2, it took almost1.5 h to aggregate the C. parvum oocysts, in spite of the fact that
Fig. 4. SEM images of C. parvum oocyst, prepared using 0.5% gluta
CaCl2 was readily soluble in water and the pH of the water postaddition was still neutral (�7.1). In case of AlCl3 however, theaggregation was very fast and took place at much lower molarconcentrations due to the valence effect.
Discussion
To understand the effect of addition of bivalent and trivalentsalts on aggregation of C. parvum oocysts (or surrogates), it isimportant to understand the change in the energy of interactionbetween the two particles at various separation distances. Thepotential energy of interaction, EDLVO, between the two sphericalparticles was predicted using DLVO theory using the followingequation:
EDLVO ¼ Evdw þ EEDL (1)
Evdw is the interaction potential due to van der Waals forces andEEDL is the interaction potential due to electrical double layerrepulsion force. Evdw is determined as:
Evdw ¼�Hr1r2
6dðr1 þ r2Þ(2)
EEDL for a sphere–sphere system is written as [31]:
EEDL ¼ 2pr1r2ni1kBT’2
1 þ ’22
ðr1 þ r2Þk2
� 2’1’2
’21 þ ’2
2
ln1 þ e�kd
1 � e�kd
!þ lnð1 � e�2kdÞ
" #(3)
’i ¼zezi
kBT(4)
raldehyde (a,b) and post fixing (c,d) with 10% formaldehyde.
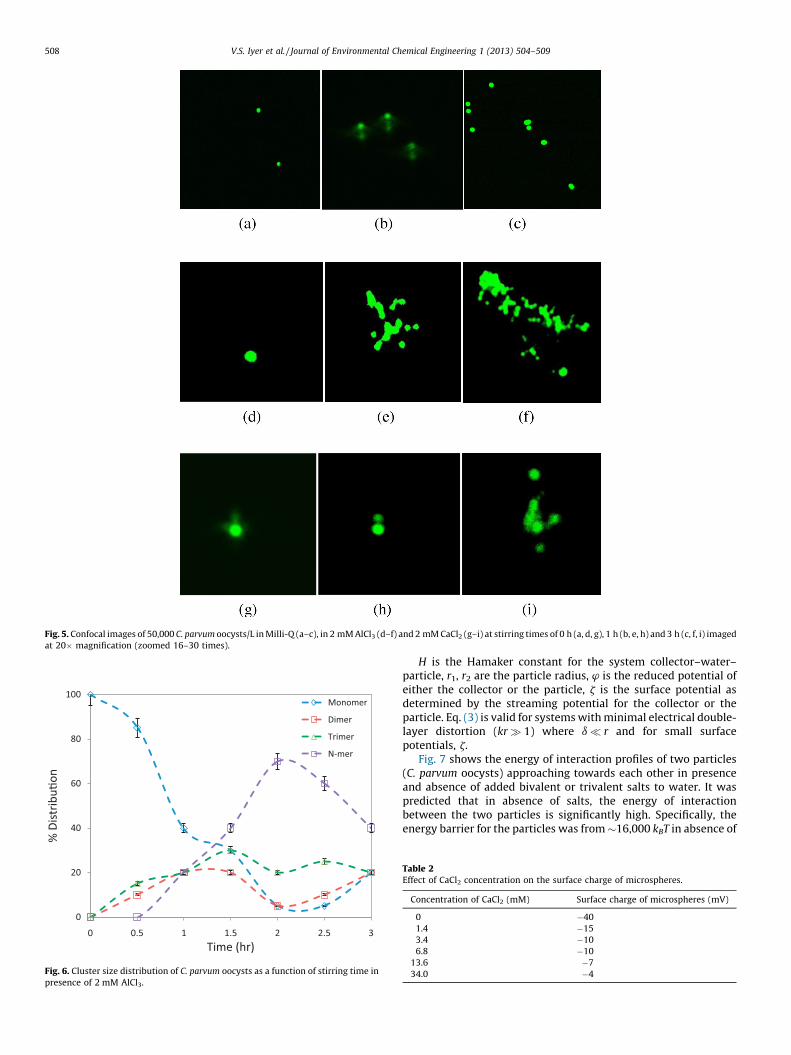
Fig. 5. Confocal images of 50,000 C. parvum oocysts/L in Milli-Q (a–c), in 2 mM AlCl3 (d–f) and 2 mM CaCl2 (g–i) at stirring times of 0 h (a, d, g), 1 h (b, e, h) and 3 h (c, f, i) imaged
at 20� magnification (zoomed 16–30 times).
0
20
40
60
80
100
0 0.5 1 1.5 2 2.5 3
% D
istrib
u�on
Time (hr)
Monomer
Dimer
Trimer
N-mer
Fig. 6. Cluster size distribution of C. parvum oocysts as a function of stirring time in
presence of 2 mM AlCl3.
V.S. Iyer et al. / Journal of Environmental Chemical Engineering 1 (2013) 504–509508
H is the Hamaker constant for the system collector–water–particle, r1, r2 are the particle radius, w is the reduced potential ofeither the collector or the particle, z is the surface potential asdetermined by the streaming potential for the collector or theparticle. Eq. (3) is valid for systems with minimal electrical double-layer distortion (kr � 1) where d � r and for small surfacepotentials, z.
Fig. 7 shows the energy of interaction profiles of two particles(C. parvum oocysts) approaching towards each other in presenceand absence of added bivalent or trivalent salts to water. It waspredicted that in absence of salts, the energy of interactionbetween the two particles is significantly high. Specifically, theenergy barrier for the particles was from �16,000 kBT in absence of
Table 2Effect of CaCl2 concentration on the surface charge of microspheres.
Concentration of CaCl2 (mM) Surface charge of microspheres (mV)
0 �40
1.4 �15
3.4 �10
6.8 �10
13.6 �7
34.0 �4

Table 3Effect of AlCl3 concentration on the surface charge of microspheres.
Concentration of AlCl3 (mM) Surface charge of microspheres (mV)
0.0 �40
0.008 �24
0.024 �21
0.04 �20
0.12 �20
0.16 �21
0.2 0
2 10
-40
-20
0
20
40
10 100 10 00E DLV
O/K
BT
No salts
CaCl2 (2m M)
AlCl3 (2mM)
δ (nm)
Fig. 7. Energy of interaction profiles between two microspheres (C. parvum oocyst
surrogates) in absence and presence of added bivalent or a trivalent salt as
predicted by DLVO theory.
V.S. Iyer et al. / Journal of Environmental Chemical Engineering 1 (2013) 504–509 509
any salt and became negative in presence of CaCl2 and AlCl3. Thehigh energy barrier in absence of any added salt suggests that theparticle aggregation is highly unlikely. However, addition of 2 mMCaCl2 and 2 mM AlCl3 reduced the energy barrier significantlywhich resulted in aggregation of particles. The predicted values ofdouble layer thickness (between two C. parvum oocysts) was30 nm in absence of any added salt, 3.9 nm in presence of 2 mMCaCl2 and 1.8 nm in presence of 2 mM AlCl3.
In the present context, we have used C. parvum oocysts at aconcentration that has been recommended in the ANSI/NSFstandard [26]. This concentration is still an order of magnitudehigher than what one may encounter in the raw untreated waterunder an extreme condition. Municipal water treatment plantsprimarily rely on adsorption filtration on coarse media (mostlysand/gravel mixture) for cyst removal. This is more likely to failwhen the filter media is either new or has been recentlyregenerated. Under such situations, presence of divalent ortrivalent cationic salts in the system (and stirred sufficiently)could enhance the efficiency of filtration of C. parvum oocysts. Ourexperiments were carried out with Milli Q water with added
divalent and trivalent salts to enhance aggregation. Going forward,it might be important to study in detail, the effect of othercomponents like ions, particulate matter, humic substance andmicrobes in water on aggregation of C. parvum oocysts.
Conclusions
In this study, an attempt was made to carry out physicalcharacterization of C. parvum oocysts in terms of size, surfacecharge, and morphology and to study their aggregation behaviourin presence of bivalent and trivalent ions. Aggregation experimentsat low concentration of C. parvum oocysts were carried out inpresence of CaCl2 and AlCl3. In the absence of any added salt,aggregation was not observed. Addition of bivalent or trivalent saltinduced the aggregation of C. parvum oocyst. The aggregation wasdue to the net increase in the surface charge of C. parvum oocystsresulting in decrease in the energy of interaction between the twooocysts and a decrease in double layer thickness of the oocysts.Particle size distribution as a function of time suggested that theconcentration of monomers reduced and concentration of dimers,trimers and n-mers increased with time. Dimers and trimersbecame unstable after reaching a critical size. Further studies needto be carried out to validate these observations in a realisticscenario using raw untreated water and with reduced parasiteload. One can further attempt to build a predictive model towardsC. parvum oocyst aggregation from first principles, by systemati-cally varying the salts and oocyst concentrations.
References
[1] Guidelines, Guidelines for Drinking Water Quality, 3rd ed., WHO, Press, Geneva,Switzerland, 2008.
[2] Guidelines, Guidelines for Drinking Water Quality, 4th ed., WHO, Press, Geneva,Switzerland, 2011.
[3] D.W. Reduker, C.A. Speer, J.A. Blixt, J. Protozool. 32 (4) (1985) 708.[4] J.R. Harris, F. Petry, J. Parasitol. 85 (5) (1999) 839.[5] Y.Y. Feng, S.L. Ong, J.Y. Hu, L.F. Song, X.L. Tan, W.J. Ng, Appl. Environ. Microbiol. 69
(2003) 1898.[6] T.L. Byrd, J.Y. Walz, Environ. Sci. Technol. 39 (2005) 9574.[7] P. Habdas, E.R. Weeks, Curr. Opin. Colloid Interf. Sci. 7 (2002) 196.[8] M. Hermawan, G.C. Bushell, V.S.J. Craig, W.Y. Toh, R. Amal, Langmuir 20 (2004)
6450.[9] W.P. Cheng, Y.P. Kao, R.F. Yu, Water Res. 42 (2008) 2691.
[10] V.A. Tolpekin, M.H.G. Duits, D. van den Ende, J. Mellema, Langmuir 20 (2004)2614.
[11] J. Gregory, Adv. Colloid Interface Sci. 109 (2009) 147.[12] K. Rajat, J.F. Chakraborti, Environ. Sci. Technol. 34 (2000) 18.[13] R. Besseling, L. Isa, E.R. Weeks, C.K. Wilson Poon, Adv. Colloid Interface Sci. 146
(2000) 1.[14] A.D. Dinemore, E.R. Weeks, V. Prasad, Appl. Opt. 40 (2001) 24.[15] V. Prasad, E.R. Weeks, J. Phys. Condens. Matter 19 (2007) 113102.[16] M.S. Elliot, W.C.K. Poon, Adv. Colloid Interface Sci. 92–94 (2001) 133.[17] D. Semwogerere, E.R. Weeks, Confocal Microscopy, Encyclopaedia of Biomaterials
and Biomedical Engineering, Taylor & Francis, 2005.[18] J. Chatterjee, S.K. Gupta, Environ. Sci. Technol. 43 (2009) 3694.[19] N. Tufenkji, D.R. Dixon, R. Considine, C.J. Drummond, Water Res. 40 (2006) 3315.[20] X. Dai, R.M. Hozalski, Water Res. 36 (2002) 3523.[21] Amirbahman, T.M. Olson, Colloid Surf. A: Physicochem. Eng. Asp. 95 (1995) 249.[22] C.J. Davis, E. Eschenazi, K.D. Papadopolous, Colloid Polym. Sci. 280 (2002) 52.[23] A. Franchi, C.R. O’Melia, Environ. Sci. Technol. 37 (2003) 1122.[24] Xiaojun Dai, Raymond M. Hozalski, Environ. Sci. Technol. 37 (2003) 1037.[25] D.B. Hogg, L.R. White, Adv. Colloid Interface Sci. 14 (1980) 3–41.[26] ANSI/NSF, ANSI/NSF Standard 53: Drinking Water Treatment Units – Health
Effects, NSF International, Ann Arbor, USA, 2002.