Adsorption Properties of Tetracycline onto Graphene Oxide: Equilibrium, Kinetic and Thermodynamic...
9
Adsorption Properties of Tetracycline onto Graphene Oxide: Equilibrium, Kinetic and Thermodynamic Studies Ehsan Ezzatpour Ghadim 1 , Firouzeh Manouchehri 2 , Gholamreza Soleimani 3 , Hadi Hosseini 4 , Salimeh Kimiagar 3 , Shohreh Nafisi 2 * 1 Young Researchers and Elite Club, Central Tehran Branch, Islamic Azad University (IAUCTB), Tehran, Iran, 2 Department of Chemistry, Islamic Azad University, Central Tehran Branch (IAUCTB), Tehran, Iran, 3 Department of Physics, Islamic Azad University, Central Tehran Branch (IAUCTB), Tehran, Iran, 4 Department of Chemistry, Shahid Beheshti University, Evin, Tehran, Iran Abstract Graphene oxide (GO) nanoparticle is a high potential effective absorbent. Tetracycline (TC) is a broad-spectrum antibiotic produced, indicated for use against many bacterial infections. In the present research, a systematic study of the adsorption and release process of tetracycline on GO was performed by varying pH, sorption time and temperature. The results of our studies showed that tetracycline strongly loads on the GO surface via p–p interaction and cation–p bonding. Investigation of TC adsorption kinetics showed that the equilibrium was reached within 15 min following the pseudo-second-order model with observed rate constants of k 2 = 0.2742–0.5362 g/mg min (at different temperatures). The sorption data has interpreted by the Langmuir model with the maximum adsorption of 323 mg/g (298 K). The mean energy of adsorption was determined 1.83 kJ/mol (298 K) based on the Dubinin–Radushkevich (D–R) adsorption isotherm. Moreover, the thermodynamic parameters such as DHu, DSu and DGu values for the adsorption were estimated which indicated the endothermic and spontaneous nature of the sorption process. The electrochemistry approved an ideal reaction for the adsorption under electrodic process. Simulation of GO and TC was done by LAMMPS. Force studies in z direction showed that tetracycline comes close to GO sheet by C 8 direction. Then it goes far and turns and again comes close from amine group to the GO sheet. Citation: Ghadim EE, Manouchehri F, Soleimani G, Hosseini H, Kimiagar S, et al. (2013) Adsorption Properties of Tetracycline onto Graphene Oxide: Equilibrium, Kinetic and Thermodynamic Studies. PLoS ONE 8(11): e79254. doi:10.1371/journal.pone.0079254 Editor: Heidar-Ali Tajmir-Riahi, University of Quebect at Trois-Rivieres, Canada Received August 14, 2013; Accepted September 20, 2013; Published November 26, 2013 Copyright: ß 2013 Ghadim et al. This is an open-access article distributed under the terms of the Creative Commons Attribution License, which permits unrestricted use, distribution, and reproduction in any medium, provided the original author and source are credited. Funding: This work is supported by Azad University, Central Tehran Branch (IAUCTB). The funders had no role in study design, data collection and analysis, decision to publish, or preparation of the manuscript. Competing Interests: The authors have declared that no competing interests exist. * E-mail: [email protected] Introduction Graphene oxide (GO) (Fig. 1a), a derivative of graphene, is a non-toxic and more biocompatible than other existing nanopar- ticles, such as quantum dots, noble metals (gold/silver nano- particles), and rare-earth ions (upconversion nanocrystals) [1]. It is a sp 2 -bonded carbon sheets with individual physical and chemical properties which has attracted remarkable attention since 2004 [2]. Many researches have explored the potential of GO for variety biomedical applications such as electrochemical devices [3,4], energy storage [5,6], catalysis [7], adsorption of enzyme, cell imaging and drug delivery, as well as biosensors. Most of the antibiotic drugs like TC have appropriate interaction with GO via p-p stacking [8,9]. Large quantities of oxygen atoms in the forms of epoxy, hydroxyl, carboxyl groups and delocalized conjugated p electrons on the surface of the GO [5] builds it extremely hydrophilic and provides the capability to apply GO in the aquatic and biological environment. Tetracycline (TC, C 22 H 24 N 2 O 8 ) (Fig. 1b) is the second greatest antibiotic which is extensively used in the world. It exhibits broad- spectrum antimicrobial activity against a variety of diseases. Tetracyclines are pluripotent drugs that inhibit the activity of matrix metalloproteinases (MMPs) and affect many cellular functions including proliferation, migration, and matrix remodel- ing [10]. TC has a planar structure consisting of four fused rings with hydrophilic groups on one face, hydrophobic groups on the other face and each ring including phenol, alcohol, ketone and amino. Controlling delivery systems are used to improve therapeutic efficacy and safety of drugs by delivering them at a rate dictated which is needed due to the physiological environment during a period of treatment to the site of action [11]. Many problems are minimized when the drug release process is slow [12]. New drug delivery vehicles such as liposomes, dendrimers and graphene oxide nanoparticles offer a promising way to improve bioavail- ability, efficacy and specificity of pharmaceutical compounds in general [13]. In the present work, GO was prepared and used as an adsorbent to deal with tetracycline at different pHs, sorption times and concentrations. Free Gibbs energy, enthalpy, entropy, and activation energy due to pseudo first and second order equations were calculated. The adsorption kinetics, isotherms and thermo- dynamics of TC on GO were systematically approved the p-p interaction mechanism between them. The mechanism for adsorption of tetracycline on GO was deduced from fitting adsorption isotherms. In order to study the behavior of TC on GO surface, simulation of GO and TC was done by LAMMPS. PLOS ONE | www.plosone.org 1 November 2013 | Volume 8 | Issue 11 | e79254
Transcript of Adsorption Properties of Tetracycline onto Graphene Oxide: Equilibrium, Kinetic and Thermodynamic...

Adsorption Properties of Tetracycline onto GrapheneOxide: Equilibrium, Kinetic and Thermodynamic StudiesEhsan Ezzatpour Ghadim1, Firouzeh Manouchehri2, Gholamreza Soleimani3, Hadi Hosseini4,
Salimeh Kimiagar3, Shohreh Nafisi2*
1 Young Researchers and Elite Club, Central Tehran Branch, Islamic Azad University (IAUCTB), Tehran, Iran, 2 Department of Chemistry, Islamic Azad University, Central
Tehran Branch (IAUCTB), Tehran, Iran, 3 Department of Physics, Islamic Azad University, Central Tehran Branch (IAUCTB), Tehran, Iran, 4 Department of Chemistry, Shahid
Beheshti University, Evin, Tehran, Iran
Abstract
Graphene oxide (GO) nanoparticle is a high potential effective absorbent. Tetracycline (TC) is a broad-spectrum antibioticproduced, indicated for use against many bacterial infections. In the present research, a systematic study of the adsorptionand release process of tetracycline on GO was performed by varying pH, sorption time and temperature. The results of ourstudies showed that tetracycline strongly loads on the GO surface via p–p interaction and cation–p bonding. Investigationof TC adsorption kinetics showed that the equilibrium was reached within 15 min following the pseudo-second-ordermodel with observed rate constants of k2 = 0.2742–0.5362 g/mg min (at different temperatures). The sorption data hasinterpreted by the Langmuir model with the maximum adsorption of 323 mg/g (298 K). The mean energy of adsorption wasdetermined 1.83 kJ/mol (298 K) based on the Dubinin–Radushkevich (D–R) adsorption isotherm. Moreover, thethermodynamic parameters such as DHu, DSu and DGu values for the adsorption were estimated which indicatedthe endothermic and spontaneous nature of the sorption process. The electrochemistry approved an ideal reaction forthe adsorption under electrodic process. Simulation of GO and TC was done by LAMMPS. Force studies in z directionshowed that tetracycline comes close to GO sheet by C8 direction. Then it goes far and turns and again comes close fromamine group to the GO sheet.
Citation: Ghadim EE, Manouchehri F, Soleimani G, Hosseini H, Kimiagar S, et al. (2013) Adsorption Properties of Tetracycline onto Graphene Oxide: Equilibrium,Kinetic and Thermodynamic Studies. PLoS ONE 8(11): e79254. doi:10.1371/journal.pone.0079254
Editor: Heidar-Ali Tajmir-Riahi, University of Quebect at Trois-Rivieres, Canada
Received August 14, 2013; Accepted September 20, 2013; Published November 26, 2013
Copyright: � 2013 Ghadim et al. This is an open-access article distributed under the terms of the Creative Commons Attribution License, which permitsunrestricted use, distribution, and reproduction in any medium, provided the original author and source are credited.
Funding: This work is supported by Azad University, Central Tehran Branch (IAUCTB). The funders had no role in study design, data collection and analysis,decision to publish, or preparation of the manuscript.
Competing Interests: The authors have declared that no competing interests exist.
* E-mail: [email protected]
Introduction
Graphene oxide (GO) (Fig. 1a), a derivative of graphene, is a
non-toxic and more biocompatible than other existing nanopar-
ticles, such as quantum dots, noble metals (gold/silver nano-
particles), and rare-earth ions (upconversion nanocrystals) [1]. It is
a sp2-bonded carbon sheets with individual physical and chemical
properties which has attracted remarkable attention since 2004
[2]. Many researches have explored the potential of GO for
variety biomedical applications such as electrochemical devices
[3,4], energy storage [5,6], catalysis [7], adsorption of enzyme, cell
imaging and drug delivery, as well as biosensors. Most of the
antibiotic drugs like TC have appropriate interaction with GO via
p-p stacking [8,9]. Large quantities of oxygen atoms in the forms
of epoxy, hydroxyl, carboxyl groups and delocalized conjugated pelectrons on the surface of the GO [5] builds it extremely
hydrophilic and provides the capability to apply GO in the aquatic
and biological environment.
Tetracycline (TC, C22H24N2O8) (Fig. 1b) is the second greatest
antibiotic which is extensively used in the world. It exhibits broad-
spectrum antimicrobial activity against a variety of diseases.
Tetracyclines are pluripotent drugs that inhibit the activity of
matrix metalloproteinases (MMPs) and affect many cellular
functions including proliferation, migration, and matrix remodel-
ing [10]. TC has a planar structure consisting of four fused rings
with hydrophilic groups on one face, hydrophobic groups on the
other face and each ring including phenol, alcohol, ketone and
amino.
Controlling delivery systems are used to improve therapeutic
efficacy and safety of drugs by delivering them at a rate dictated
which is needed due to the physiological environment during a
period of treatment to the site of action [11]. Many problems are
minimized when the drug release process is slow [12]. New drug
delivery vehicles such as liposomes, dendrimers and graphene
oxide nanoparticles offer a promising way to improve bioavail-
ability, efficacy and specificity of pharmaceutical compounds in
general [13].
In the present work, GO was prepared and used as an
adsorbent to deal with tetracycline at different pHs, sorption times
and concentrations. Free Gibbs energy, enthalpy, entropy, and
activation energy due to pseudo first and second order equations
were calculated. The adsorption kinetics, isotherms and thermo-
dynamics of TC on GO were systematically approved the p-pinteraction mechanism between them. The mechanism for
adsorption of tetracycline on GO was deduced from fitting
adsorption isotherms. In order to study the behavior of TC on GO
surface, simulation of GO and TC was done by LAMMPS.
PLOS ONE | www.plosone.org 1 November 2013 | Volume 8 | Issue 11 | e79254

Materials and Methods
MaterialsTetracycline hydrochloride, graphite flakes (150 mm flakes) were
purchased from Sigma-Aldrich chemical Co. USA. GO nanopar-
ticles were manufactured by improved Hummers method [14].
Other chemicals used were of analytical reagent grade and used
without further purification.
FTIR SpectroscopyInfrared spectra were recorded on a FTIR spectrometer (100 N
model), equipped with deuterated triglycine sulphate (DTGS)
detector and KBr beam splitter, using AgBr windows. Solution of
TC (4 g/L) was added dropwise to the GO (4 g/L) solution and
mixed thoroughly by a vortex mixer. The suspension was
incubated at 25uC overnight and wrapped in aluminum foil to
avoid possible photodegradation of tetracycline. The suspension
was centrifuged at 12000 rpm for 15 min. The supernatant was
collected for FTIR measurements using hydrated films [15].
Interferograms were accumulated over the spectral range 4000–
600 cm21 with a nominal resolution of 4 cm21 and 100 scans.
UV-Visible SpectroscopyThe UV-Vis spectra were recorded on a Perkin-Elmer Lambda
spectrophotometer with a slit of 2 nm and scan speed of 400 nm/
min. Quartz cuvettes of 1 cm were used. The absorbance
assessments were performed at pH 7.0 by concentration of GO
(20 mg/L), TC (100 mg/L) and GO-TC.
Voltammetric ExperimentsVoltammetric experiments were performed using a mAutolab
Type III electrochemical system. A conventional three-electrode
cell consisting of a glassy carbon working electrode (modified and
unmodified), a platinum wire counter electrode and a saturated
Ag/AgCl reference electrode were used. Glassy carbon electrode
(GCE) was cleaned by polishing with 0.05 mm alumina slurry on a
polishing cloth to create a mirror finish; the electrode was then
rinsed thoroughly with double-distilled water and then dried under
ambient temperature. Typically, a stable suspension of graphene
oxide containing 2.0 mg/ml in DMF using 30 min ultrasonic
agitation was prepared. After the electrode surface was air dried,
5.0 mL of this suspension was cast onto the surface of the
pretreated GC electrode by a micro syringe and then it was dried
in air.
General Adsorption ExperimentsTo demonstrate the release efficiency directly, the adsorption
experiments were performed using a series of 50 mL flasks
containing 20 mg/L GO and 25 mL (6–180 mg/L) TC solutions.
The pH of the solutions were adjusted to 6–7 by adding HCl or
NaOH. The mixtures of GO and TC solutions were incubated
overnight and used for determination by UV–Vis absorbance at
356 nm.
To deliberation the influence of pH on adsorption, the mixtures
of GO (2 ml of 20 mg/L) and TC solutions (4 ml of 10–100 mg/
L) were prepared. The pH of solutions were adjusted from 2 to 10
using NaOH and HCl and incubated overnight. The supernatant
Figure 1. Structure of graphene oxide (a), Structure of tetracycline and pKa values (b).doi:10.1371/journal.pone.0079254.g001
Figure 2. FTIR spectra of free TC, free GO and TC afteradsorption on GO (GO-TC).doi:10.1371/journal.pone.0079254.g002
Tetracycline-Graphene Oxide
PLOS ONE | www.plosone.org 2 November 2013 | Volume 8 | Issue 11 | e79254

was collected for determination by UV–Vis absorbance at
356 nm. The adsorption percentage (Ads. %) was calculated
based on the equation (1) :
Ads:% ~C0 { Ce
Ce
| 100 ð1Þ
C0 and Ce are the initial and the equilibrium concentrations of
TC in solution phase, respectively.
To investigate the kinetics of the adsorption, 2 mL GO (20 mg/
L) was mixed with 4 mL of different concentrations of tetracycline
(6–180 mg/L) (pH = 3.6). The mixtures were taken for centrifu-
gation with 15 min interval after vigorous mixing by vortex
mixture. On regular time intervals, the concentrations of
tetracycline in supernatant were determined successively by UV–
Vis absorbance at 356 nm. The rate constants were calculated
using the conventional rate expression.
The effect of temperature on the sorption of tetracycline by GO
was estimated by incubating the samples (2 ml GO 20 mg/L) and
4 mL of different concentrations of tetracycline (6–180 mg/L)
overnight and then beneath different temperatures (298, 308, and
318 K). The temperature was preserved through the procedure of
investigation including under centrifugation. The supernatant was
collected for determination by UV–Vis absorbance at 356 nm.
Adsorption isotherm studies were carried out with constant
concentration of GO (20 mg/L) and different concentrations of
tetracycline solutions (6–180 mg/L), pH = 3.6 and different
temperatures; 298, 303 and 308 K [16]. GO solutions were
incubated with tetracycline overnight and covered by aluminum
foil to refraining probable photo degradation of tetracycline [17].
Then suspension was centrifuged at 6000 rpm for 30 min. The
supernatant was gathered for determination by UV–Vis absor-
bance at 356 nm, drawing a calibration curve manufactured with
tetracycline solutions of different concentrations. The absorption
experiments were performed under the same condition, but
different temperatures (298, 303 and 308 K).
SimulationLAMMPS (Large-scale Atomic/Molecular Massively Parallel
Simulator) is a classical molecular dynamics code that models an
ensemble of particles in a liquid, solid, or gaseous state. It can
model atomic, polymeric, biological, metallic, granular, and
coarse-grained systems using a variety of force fields and boundary
conditions. In the most general sense, LAMMPS integrates
Newton’s equations of motion for collections of atoms, molecules,
or macroscopic particles that interact via short- or long-range
forces with a variety of initial and/or boundary conditions. For
computational efficiency, LAMMPS uses neighbor lists to keep
track of nearby particles. The lists are optimized for systems with
particles that are repulsive at short distances, so that the local
density of particles never becomes too large.
Figure 3. The UV–Vis absorption spectra of free TC, free GO and TC after adsorption on GO (GO-TC).doi:10.1371/journal.pone.0079254.g003
Figure 4. Effect of pH on the adsorption efficiency of TC (10.0–100.0 mg/L) on GO (20.0 mg/L); Temp. 25±0.1.doi:10.1371/journal.pone.0079254.g004
Tetracycline-Graphene Oxide
PLOS ONE | www.plosone.org 3 November 2013 | Volume 8 | Issue 11 | e79254

In the present research, we used adaptive intermolecular
reactive bond order (AIREBO) potential using numerical. Both
the repulsive and attractive pair interaction functions are modified
to fit bond properties. Long range atomic interactions and single
bond torsional interactions are also included [18,19].
Results
Adsorption of Tetracyclines by Graphene OxideSuspension
FT-IR and UV–Vis spectroscopy were employed to investigate
the adsorption of tetracycline on GO.
FTIR Spectral Analysis of Tetracycline-graphene OxideTransform Infrared (FTIR) spectra of TC showed apparent
characteristic bands at 3465 cm21 (O–H), 3457, 3441 cm21 (N–
H), 1624 cm21 (C = O) and 1463 cm21 ( = C–N) (Fig. 2). In GO-
TC complex, shifting of the TC absorption bands to 3450 cm21
(O-H), 1729 cm21 (C = O), and appearance of the new bands at
1224 cm21 (C-OH), and 1050 cm21 (C-O), suggesting that
oxygen-containing groups are introduced into the graphene
structure (Fig. 2). Go and TC stick to each other and form
bundles, and the space between the bundles provides more
adsorption sites [20]. Water molecules could form H-bands with
functional groups on GO, which blocks the access of TC molecules
into the sorption sites.
UV-Visible SpectraThe absorption spectra of GO, tetracycline, and GO–TC are
shown in Fig. 3. The GO dispersion displays a maximum
absorption at 231 nm, which is due to the p–p* transition of
aromatic C = C bands (Fig. 3). Furthermore, a similar shoulder
band around ,300 nm is observed which can be attributed to
nRp* transitions of the carbonyl groups [21]. The TC absorption
bands are located at 356 and 275 nm which blue shifted and
appeared at 265 and 220 nm upon adsorption on GO. The
adsorption process is possibly the non-electrostatic–dispersion
interaction between bulk systems on GO surface and TC
molecules contained both benzene rings and double bands
(C = C, C = O), or hydrophobic and p–p electron donor–accepter
interaction between GO and TC. The cation–p bonding may
happen between the easily protonated amino group which is on
the ring C4 of the tetracycline molecule and the graphene
Figure 5. The pseudo-first-order (a) and the pseudo-second-order (b) kinetics model for adsorption of tetracycline on GOsuspension (20.0 mg/L), pH = 3.6, T = 298, 308, 318 K.doi:10.1371/journal.pone.0079254.g005
Table 1. Kinetic parameters for TC adsorption on GO atdifferent temperatures.
Pseudo-second-order model
T (K) k2 (1/min) q2 (mg/g) h (mg/g min) r2
298 0.3468 198.54 68.89 0.996
308 0.2742 381.77 104.7 0.994
318 0.5362 411.76 221.8 0.986
doi:10.1371/journal.pone.0079254.t001
Figure 6. Isotherm of TC (6.0–180.0 mg/L) adsorption on GO(20.0 mg/L) at different temperatures (298, 303, 308 K).doi:10.1371/journal.pone.0079254.g006
Tetracycline-Graphene Oxide
PLOS ONE | www.plosone.org 4 November 2013 | Volume 8 | Issue 11 | e79254

p-electrons. Similar interactions are observed in graphite and
carbon nanotubes [9,22].
Effect of pHIn the present research, different concentrations of TC (6.0–
180.0 mg/L) were applied to examine the sorption behavior of TC
on a constant concentration of GO (2 ml of 20 mg/L) at different
pH values (2–10 with an interval 1 unit) using UV-Vis
spectroscopy. The adsorption percentage (Ads. %) was calculated
based on the equation (1).
It should be noted that tetracycline has variable charges on
different sites depending on solution pH. When pH is under 4, TC
exists as a cation (TCH3+), due to the protonation of dimethyl-
ammonium group. At pH between 3.5 and 7.5, TC exists as a
zwitterion (TCH20), due to the loss of a proton from the phenolic
diketone moiety. At pH upper than 7, TC exists as anion (TCH2
or TC22) due to the loss of protons from the tri-carbonyl system
and phenolic di-ketone moiety [23]. By increasing the pH from 4
to 7, the adsorption of TC on GO increases (Fig. 4). The
maximum adsorption occurs at pH 7. At pH higher than 7, the
adsorption percentages decreases. For concentrations less than
40 mg/L, the adsorption percentage was found to be above 50%
(pH 5–7). The variation in pH can not only focuses on the
protonation–deprotonating transition of functional groups on GO,
but also results in a change in chemical speciation for ionizable
organic compounds. The above results are comparable with
biological systems in which the pH inside the cell is 5 and out of
cell is 7. This phenomena sufficiently approves that pH affects
absorption of TC on GO and can be used to predict the TC
release from GO inside the cells. The above results show that GO
can act as an appropriate carrier for drug delivery systems.
Adsorption KineticsIn order to investigate the adsorption process of TC on GO,
pseudo-first-order and pseudo-second-order kinetics model were
used.
Pseudo-first-order model:
The pseudo-first-order equation is given as Eq. (2) [16,20,24]:
Ln q1 { qtð Þ~ ln q1 { k1t ð2Þ
Where q1 and qt are the amount of TC adsorbed on the sorbent
(mg/g) at equilibrium and at time t, respectively, and k1 is the rate
constant of the first-order adsorption (min21). The values k1 for
TC adsorption on GO were defined from the plot of Ln (q1 2 qt)
against t (Fig. 5a).
Pseudo-second-order model:
The pseudo-second-order model is represented as Eq. (3) [25]:
t
qt
~1
k2q22
zt
q2ð3Þ
Where k2 is the rate constant of the second-order adsorption (g/
mg min). The straight-line plots of qt versus t (Fig. 5b) have been
tested to obtain rate parameters. The second-order rate constants
were used to calculate the initial sorption rate h (mg/g min) [26],
given by:
h ~ k2 q22 ð4Þ
The batch kinetic data based on our investigation were
appropriately satisfying the condition of second-pseudo order
models. In the present study, Ho’s pseudo-second-order kinetics
model was exploited to examine the fitness of the experimental
data and to evaluate the kinetics of the adsorption of tetracycline
on GO. The pseudo-second-order kinetics model was based on the
hypothesis that the rate-limiting step includes chemisorption,
which has been extensively applied to the sorption of contaminants
from aqueous solutions in recent years [27]. So, only second-
pseudo order models effectively describe the kinetic data at 95%
confidence level. The consequences of the kinetic parameters and
the calculated initial sorption rate values are recorded in Table 1.
Based on the correlation coefficients, the adsorption of TC is finest
described by the pseudo-second-order model. In an assumed
adsorption system, the initial adsorption rate intensified by
increasing the temperature. Furthermore, it was probable to
calculate the activation energy (Ea) for the adsorption employing
the Arrhenius equation [28] based on the k values.
k ~ A exp({Ea
RT) ð5Þ
Where A is the frequency factor (min21), Ea is the activation
energy (kJ/mol), R is the ideal gas constant (kJ/mol K), and T is
the temperature (K) [29].
Table 2. Langmuir, Freundlich and D–R constants and correlation coefficients of TC adsorption on GO at different temperatures.
Langmuir Freundlich D–R*
T (K) qm(mg/g) RL r2 KF (mg/g) n r2 qm(mg/g) E(kj/mol) r2
298 322.4361.25 0.01787 0.997 21.40 3.656 0.943 24.6260.74 1.83 0.961
303 101.8761.08 0.00846 0.993 20.09 3.762 0.962 22.9260.59 1.69 0.988
308 73.5360.55 0.2546 0.998 20.13 3.721 0.983 24.9460.61 1.40 0.988
*Dubinin–Radushkevich.doi:10.1371/journal.pone.0079254.t002
Table 3. Thermodynamic parameters for the adsorption of TCon GO.
DG6 (kJ/mol)
C0(mg/L)
DH6(kJ/
mol)
DS6(kJ/
mol K) 298 K 303 K 308 K
20.0 44.045 0.2553 22.0068 23.2704 22.1731
doi:10.1371/journal.pone.0079254.t003
Tetracycline-Graphene Oxide
PLOS ONE | www.plosone.org 5 November 2013 | Volume 8 | Issue 11 | e79254

Eq. (5) can be converted into Eq. (6) by taking logarithm:
Ln k ~ ln A { Ea =RT ð6Þ
Thus, Ea could be obtained from the slope of the line plotting ln
k versus 1000/T, the estimated Ea for TC adsorption on GO was
3.2411 kJ/mol. The lower the Ea was, the fewer sensitive the
temperature effected on the adsorption reaction. It has been
proved that the process can be simply conducted.
Adsorption IsothermsAdsorption isotherms describe how solutes interact with
sorbents. Adsorption isotherms and the equilibrium adsorption
amount of TC on GO as a function of equilibrium concentration
of TC is depicted in Fig. 6. The absorption data were fitted to both
Langmuir and Freundlich model which are often described by
equilibrium sorption isotherms model [30]:
Ce
qe
~Ce
qm
z1
bqm
ð7Þ
Where Ce is the equilibrium concentration of TC (mg/L), qm is
the maximum monolayer adsorption (mg/g), qe is the amount of
TC adsorbed per unit weight of GO at equilibrium concentration
(mg/g) and b is the Langmuir constant related to the affinity of
binding sites (L/mg). The equilibrium concentration (Ce) of TC
was calculated mentioning to the calibration curve of TC [31].
Moreover, the widely used empirical Freundlich equation basis on
sorption on a heterogeneous surface is given by [32]:
Lg qe~lg KF z1
nlg Ce ð8Þ
where KF and n are Freundlich constants indicating the sorption
capacity (mg/g) and intensity, respectively. The Langmuir-
Freundlich isotherm constants were determined from the plots of
Ce/qe against Ce, lg qe versus lg Ce, respectively, at 298, 303,
308, 310 and 313 K. The isothermal constants and the correlation
coefficients are depicted in Table 2. Langmuir and Freundlich
isotherm models were statistically important at a 95% confidence
level. It is found that the adsorption of TC on GO correlated well
(r.0.99) with the Langmuir equation as compared to the
Freundlich equation (r.0.95) underneath the studied concentra-
tion range. Therefore, the Langmuir isotherm fits appropriate
compared with the Freundlich isotherm in all conditions according
to the correlation coefficients r. The maximum adsorption
Figure 7. CV curve of tetracycline (1 mM, in phosphate buffer solution, 0.1 M, pH = 7) at 50 mV/s (a); CV curve of tetracycline(1 mM) at different scan rates: (from Bottom to up) 25, 50, 75, 100, 150, 200, 250, 300, 350, 400 mV/s (b); Observed dependence ofpeak current on the scan rate (c); Plot of variation of peak current with the logarithm of scan rate (d).doi:10.1371/journal.pone.0079254.g007
Tetracycline-Graphene Oxide
PLOS ONE | www.plosone.org 6 November 2013 | Volume 8 | Issue 11 | e79254

capacity of TC on GO was 322.43, 101.87, 73.53 mg/g at 298,
303, 308 respectively. The shape of the isotherm has been
discussed in order to predict whether an adsorption system is
desirable or undesirable. The vital property of the Langmuir
isotherms can be expressed by means of ‘RL’, a dimensionless
constant related to the separation factor or equilibrium parameter.
RL is computed using the following equation [25,31]:
RL~1
1zbC0ð9Þ
Where, C0 is the initial TC concentration (mg/L) and b is the
Langmuir adsorption of equilibrium constant (L/mg). The
calculated RL values are recorded in Table 2. In the present
investigation, the equilibrium parameter RL was found to be
between 0 and 1, hence the sorption process was quite favorable
and the adsorbent employed demonstrated a good potential for the
sorption of TC. Finally, the Dubinin–Radushkevich (D–R)
isotherm was also examined in its linearized form:
Ln qe ~ ln qm { Ke2 ð10Þ
Where qe and qm have the same meaning as above, K is the
parameter linked to the adsorption energy. e is the adsorption
potential, explained the Polanyi as the free energy change needed
to transfer a molecule from bulk solution to the adsorption region.
The Polanyi potential differences with the concentration according
to [33]:
e ~ RT ln (1 z1
Ce
) ð11Þ
where R is the ideal gas constant and T is the temperature (K). A
linear correlation is manufactured by plotting ln qe versus e2(shown in Table 2), indicating that TC adsorption also obeys the
D–R equation. The adsorption energy for TC adsorption can be
determined by:
E ~ {2Kð Þ{1=2 ð12Þ
The values of the adsorption energy were estimated as 1.83, 1.69
and 1.4 kJ/mol, at 298, 303, 308 K respectively, indicating that
the values lie within the energy range of physical adsorption, i.e.,
,8 kJ/mol.
Thermodynamic StudiesThe sorption manners of different concentrations of TC onto
GO were critically explored at 298, 303, 308, 310 and 313 K,
respectively. Thermodynamic parameters were computed from
following equations:
DG0 ~{RT ln Kc ð13Þ
where R is the universal gas constant (8.314 kJ/mol K), T is the
temperature (K) and Kc is the distribution coefficient. Gibbs free
energy change of adsorption (DGu) was calculated using ln Kc
values for different temperatures. The Kc value was calculated
using following equation [34]:
Kc ~qe
Ce
ð14Þ
where Ce is the equilibrium concentration of TC and qe is the
amount of TC adsorbed per unit weight of GO at equilibrium
concentration (mg/g). The enthalpy change (DHu) and entropy
change (DSu) of adsorption were estimated from the following
equation [35]:
DG0 ~DH0 { TDS0 ð15Þ
According to Eq. 15, DHu and DSu factors can be calculated from
the slope and intercept of the plot of DGu against T, respectively.
The thermodynamic parameters were shortened in Table 3. The
positive values of DHu and the negative values of DGu show the
endothermic and spontaneous nature of sorption process.
Figure 8. Variation of z vs. time for C8 (triangle symbol) andamino (circle symbol). Square symbol is z average over all TCmolecules.doi:10.1371/journal.pone.0079254.g008
Figure 9. Variation of z and x vs. time.doi:10.1371/journal.pone.0079254.g009
Tetracycline-Graphene Oxide
PLOS ONE | www.plosone.org 7 November 2013 | Volume 8 | Issue 11 | e79254
Electrochemical StudiesThe voltammetric response of graphene oxide/glassy carbon
electrode (GO/GCE) in the absence and presence of tetracycline
(1.0 mM in phosphate buffer, 0.1 M, pH 7.0, scan rate of
50.0 mV/s) is shown in Fig. 7. The cyclic voltammetric behavior
of the tetracycline evidenced one broad oxidation peak with the
peak potential at Epa = 0.84 V during the anodic scan (Fig. 7a).
No peaks were observed in the reverse scan, suggesting the
irreversible nature of the oxidation process of tetracycline at the
GO/GCE.
In the electrochemical investigations, useful information involv-
ing the electrochemical reaction mechanisms usually can be
obtained from the potential scan rate. Therefore, the electro-
chemical behavior of tetracycline (1.0 mM) was investigated at
pH 7.0 and scan rate from 25 to 400 mV/s by cyclic voltammetry
(Fig. 7b). As shown in Fig. 7c, by increasing the scan rate from 25
to 400 mV/s, a linear relationship was observed between the peak
intensity Ipa and the scan rate u (Fig. 7b), indicating that the
oxidation of tetracycline at GO/GCE is an adsorption-controlled
process. The effect of scan rate on peak current was also studied
under the above conditions with a plot of log I (logarithm of peak
current) vs. log u (logarithm of scan rate), giving a straight line with
a slope of 0.91 (Fig. 7d). This value is close to the theoretical value
of 1, which is expected for an ideal reaction for the adsorption
controlled electrodic process [36].
SimulationThe behavior of TC near the GO sheet was studied by Lammps
code. GO was considered as 25625 nanometer square sheet and
z = 25 position with periodic boundary condition using the
Adaptive Intermolecular Reactive Empirical Bond Order (AIR-
EBO) potential. The AIREBO model is a function for calculating
the potential energy of covalent bonds and the interatomic force.
In this model, the total potential energy of system is a sum of
nearest-neighbor pair interactions which depends not only on the
distance between atoms but also on their local atomic environ-
ment. A parameterized bond order function was used to describe
chemical pair bonded interactions. The adaptive intermolecular
reactive bond order (AIREBO) potential, in which both the
repulsive and attractive pair interaction functions are modified to
fit bond properties, and the long-range atomic interactions and
single bond torsional interactions are included [18]. The AIREBO
model has been used in recent studies using numerical [19].
Center of TC is at the zero point of coordinate and force cut of
radius is 10 A. Temperature increases to 25uC after 1000 run step
and steady state has been considered after 26105 run step. It has
been averaged over z. Figure 8 shows variation of z vs. time for C8
(triangle symbol) and amino (circle symbol). It can be seen that the
distance between TC (from the C8 side) and GO sheet decreases to
14400 fs. Then TC turns and goes close to GO sheet from the
amino side. In this case the center of TC is 7 A far from GO sheet.
The closest distances for the C8 and amino side are 2.6 and 5 A
respectively. The curve with square symbol is z average across TC
molecules (Fig. 8).
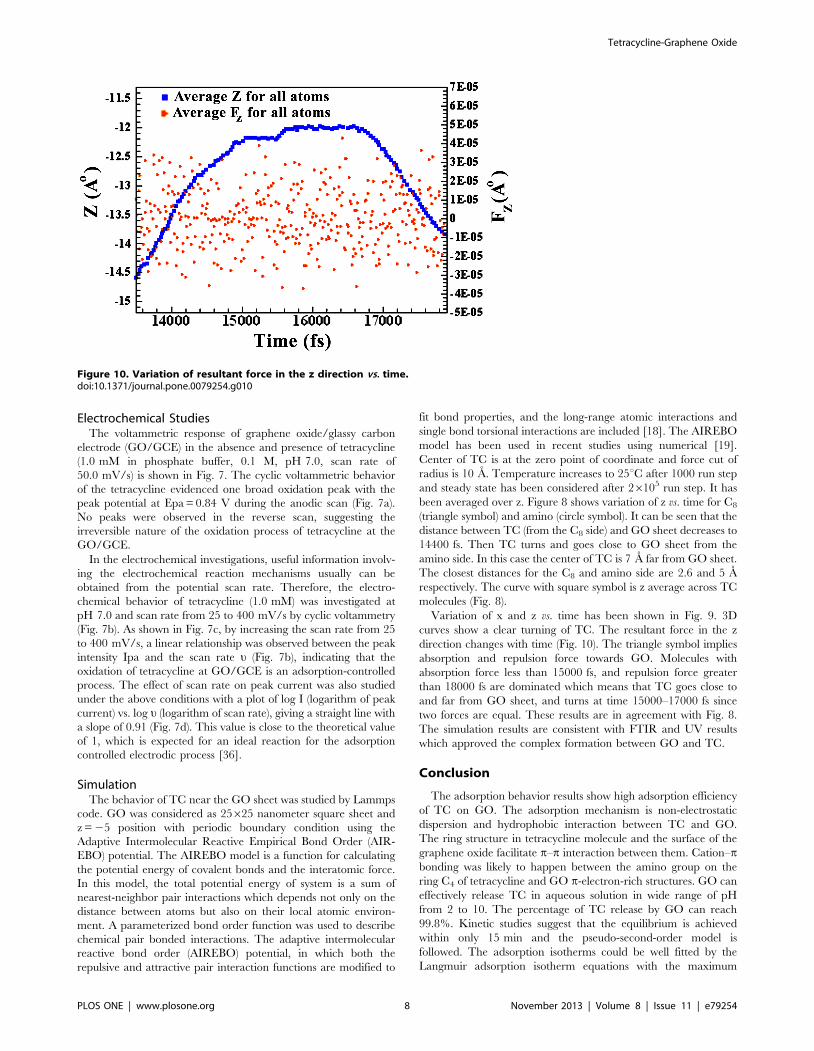
Variation of x and z vs. time has been shown in Fig. 9. 3D
curves show a clear turning of TC. The resultant force in the z
direction changes with time (Fig. 10). The triangle symbol implies
absorption and repulsion force towards GO. Molecules with
absorption force less than 15000 fs, and repulsion force greater
than 18000 fs are dominated which means that TC goes close to
and far from GO sheet, and turns at time 15000–17000 fs since
two forces are equal. These results are in agreement with Fig. 8.
The simulation results are consistent with FTIR and UV results
which approved the complex formation between GO and TC.
Conclusion
The adsorption behavior results show high adsorption efficiency
of TC on GO. The adsorption mechanism is non-electrostatic
dispersion and hydrophobic interaction between TC and GO.
The ring structure in tetracycline molecule and the surface of the
graphene oxide facilitate p–p interaction between them. Cation–pbonding was likely to happen between the amino group on the
ring C4 of tetracycline and GO p-electron-rich structures. GO can
effectively release TC in aqueous solution in wide range of pH
from 2 to 10. The percentage of TC release by GO can reach
99.8%. Kinetic studies suggest that the equilibrium is achieved
within only 15 min and the pseudo-second-order model is
followed. The adsorption isotherms could be well fitted by the
Langmuir adsorption isotherm equations with the maximum
Figure 10. Variation of resultant force in the z direction vs. time.doi:10.1371/journal.pone.0079254.g010
Tetracycline-Graphene Oxide
PLOS ONE | www.plosone.org 8 November 2013 | Volume 8 | Issue 11 | e79254

adsorption capacity of 322.43 mg/g (298 K) of TC on GO. The
thermodynamic parameters imply that the adsorption is a
spontaneous, endothermic and physisorption process.
Simulation studies show the presence of p–p stacking interac-
tions between tetracycline and graphene’s surface. The closest
distance between TC and GO is 6.2 A. After 15000 fs and where
the distance between center of TC and GO sheet is 7 A, TC starts
to turn. After 17000 fs, the amine group side of TC is moving far
from graphene surface to 5 A distance. Simulation results show
that at any moment, some of the TC molecules are adsorbed and
some of them are repulsed by graphene sheet which represent the
equilibrium concentration (Ce). TC molecules are in the mode of
adsorption and desorption from graphene surface and the total
energy of adsorption and desorption is equal to 26800 J.
Author Contributions
Conceived and designed the experiments: EEG FM GS HH SK ShN.
Performed the experiments: EEG FM GS HH SK ShN. Analyzed the data:
EEG FM GS HH SK ShN. Contributed reagents/materials/analysis tools:
EEG FM GS HH SK ShN. Wrote the paper: EEG FM GS HH SK ShN.
References
1. Namgung R, Zhang Y, Fang QL, Singha K, Lee HJ, et al. (2011)Multifunctional silica nanotubes for dual-modality gene delivery and MR
imaging. Biomaterials 32: 3042–30521.2. Singh V, Joung D, Zhai L, Das S, Khondaker SI, et al. (2011) Graphene based
materials: Past, present and future. Prog Mater Sci 56: 1178–1271.
3. Li JL, Bao HC, Hou XL, Sun L, Wang XG, et al. (2012) Graphene oxidenanoparticles as a nonbleaching optical probe for two-photon luminescence
imaging and cell therapy. Angew Chem Int Ed Engl 51: 1830–1834.4. Park S, Lee KS, Bozoklu G, Weiwei C, Nguyen ST, et al. (2008) Graphene
oxide papers modified by divalent ions-Enhancing mechanical properties via
chemical cross-linking. ACS Nano 2: 572–578.5. Dreyer DR, Park S, Bielawski CW, Ruoff RS (2009) The chemistry of graphene
oxide, Chem Soc Rev 39: 228–240.6. Margine ER, Bocquet ML, Blase X (2008) Thermal stability of graphene and
nanotube covalent functionalization. Nano Lett 8: 3315–3319.
7. Dikin DA, Stancovich S, Zimney EJ, Piner RD, Dommett GH, et al. (2007)Preparation and characterization of graphene oxide paper. Nature 448: 457–
460.8. Zhang JL, Yang HJ, Shen GX, Cheng P, Zhang JY, et al. (2010)
Biocompatibility of graphene oxide. Chem Commun, 46: 1112–1114.9. Sun X, Liu Z, Welsher K, Robinson JT, Goodwin A, et al. (2008) Nano-
graphene oxide for cellular imaging and drug delivery. Nano Res 1: 203–212.
10. Islam MM, Franco CD, Courtman DW, Bendeck MP (2003) A nonantibioticchemically modified tetracycline (CMT-3) inhibits intimal thickening.
Am J Pathol 163: 1557–1566.11. Caroni ALPF, de Lima CRM, Pereira MR, Fonseca JLC (2012) Tetracycline
adsorption on chitosan: A mechanistic description based on mass uptake and
zeta potential measurements. Colloids Surf B: Biointerfaces 100: 222–228.12. Castillo C, Criado S, Dıaz M, Garcıa NA (2007) Riboflavin as a sensitizer in the
photodegradation of tetracyclines. Kinetics, mechanism and microbiologicalimplications. Dyes Pigments 72: 178–184.
13. Branham ML, Moyo T, Abdallah HMI, Masina P (2013) Tetracycline-ferritenanocomposites formed via high-energy ball milling and the influence of milling
conditions. Eur J Pharm Biopharm 83: 184–192.
14. Marcano DC, Kosynkin DV, Berlin JM, Sinitskii A, Sun Z, et al. (2010)Improved synthesis of graphene oxide. ACS Nano 4: 4806–4814.
15. Froehlich E, Mandeville JS, Jenning R, Sedaghat-Herati R, Tajmir-Riahi HA(2009) Dendrierms bind human serum albumin. J Phys Chem B 11: 6986–6993.
16. Gao Y, Li Y, Zhang L, Huang H, Hu J, et al. (2012) Adsorption and removal of
tetracycline antibiotics from aqueous solution by graphene oxide. J ColloidInterface Sci 368: 540–546.
17. Wammer KH, Slattery MT, Stemig AM, Ditty JL (2011) Tetracycline photolysisin natural waters: Loss of antibacterial activity. Chemosphere 85: 1505–1510.
18. Brenner DW, Shendrova OA, Harrison JA, Stuart SJ, Ni B, et al. (2002) Asecond-generation reactive empirical bond order (REBO) potential energy
expression for hydrocarbons. J Phys: Condens Matter 14: 783–802.
19. Van Duin ACT, Dasgupta S, Lorant F, Goddard WA (2001) ReaxFF: A reactiveforce field for hydrocarbons. J Phys Chem A 105: 9396–9409.
20. Zhang L, Song X, Liu X, Yang L, Pan F, et al. (2011) Studies on the removal of
tetracycline by multi-walled carbon nanotubes. Chem Eng J 178: 26–33.
21. Shen J, Li N, Shi M, Hu Y, Ye M (2010) Covalent synthesis of organophilic
chemically functionalized graphene sheets. J Colloid Interface Sci 348: 377–383.
22. Brigante M, Schulz PC (2011) Remotion of the antibiotic tetracycline by titania
and titania–silica composed materials. J Hazard Mater B 192: 1597–1608.
23. Zhao Y, Gu X, Gao S, Geng J, Wang X (2012) Adsorption of tetracycline (TC)
onto montmorillonite: Cations and humic acid effects. Geoderma 183–184: 12–
18.
24. Domingues ZR, Cortes ME, Gomes TA, Diniz HF, Freitas CS, et al. (2004)
Bioactive glass as a drug delivery system of tetracycline and tetracycline
associated with b-cyclodextrin. Biomaterials 25: 327–333.
25. Liu P, Liu WJ, Jiang H, Chen JJ, Li WW, et al. (2012) Modification of bio-char
derived from fast pyrolysis of biomass and its application in removal of
tetracycline from aqueous solution. Bioresour Technol 121: 235–240.
26. Malkoc E (2006) Ni(II) removal from aqueous solutions using cone biomass of
Thuja orientalis. J Hazard Mater B 137: 899–908.
27. Zhang P, Wang L (2010) Extended Langmuir equation for correlating multilayer
adsorption equilibrium data. Separation and Purification Technology 70: 367–
371.
28. Schwaab M, Lemos LP, Pinto JC (2008) Optimum reference temperature for
reparameterization of the Arrhenius equation. Part 2: Problems involving
multiple reparameterizations. Chem Eng Sci 63: 2895–2906.
29. Chang YP, Ren CL, Qu JC, Chen XG (2012) Preparation and characterization
of Fe3O4/graphene nanocomposite and investigation of its adsorption
performance for aniline and p-chloroaniline. Appl Surf Sci 261: 504–509.
30. Fan L, Luo C, Sun M, Li X, Qiu H (2013) Highly selective adsorption of lead
ions by water-dispersible magnetic chitosan/graphene oxide composites.
Colloids Surf B: Biointerfaces 103: 523–529.
31. Yang X, Li J, Wen T, Ren X, Huang Y, et al. (2013) Adsorption of naphthalene
and its derivatives on magnetic graphene composites and the mechanism
investigation. Colloids Surf A: Physicochemical and Engineering Aspects 422:
118–125.
32. Ramesha GK, Kumara AV, Muralidhara HB, Sampath S (2011) Graphene and
graphene oxide as effective adsorbents toward anionic and cationic dyes.
J Colloid Interface Sci 361: 270–277.
33. Petrou AL (2012) The free energy of activation as the critical factor in
geochemical processes. Chem Geol 308–309: 50–59.
34. Yao Y, Miao S, Liu S, Ma LP, Sun H, et al. (2012) Synthesis, characterization,
and adsorption properties of magnetic Fe3O4@graphene nanocomposite. Chem
Eng J 184: 326–332.
35. Song L, Wang S, Jiao C, Si X, Li Z, et al. (2012) Thermodynamics study of
hydrogen storage materials. J Chem Thermodyn 46: 86–93.
36. Bagheri A, Hosseini H (2012) Electrochemistry of raloxifene on glassy carbon
electrode and its determination in pharmaceutical formulations and human
plasma. Bioelectrochemistry 88: 164–170.
Tetracycline-Graphene Oxide
PLOS ONE | www.plosone.org 9 November 2013 | Volume 8 | Issue 11 | e79254