Adsorption of α-picoline onto rice husk ash and granular activated carbon from aqueous solution:...
11
Chemical Engineering Journal 147 (2009) 139–149 Contents lists available at ScienceDirect Chemical Engineering Journal journal homepage: www.elsevier.com/locate/cej Adsorption of -picoline onto rice husk ash and granular activated carbon from aqueous solution: Equilibrium and thermodynamic study Dilip Hiradram Lataye a , Indra Mani Mishra b,∗ , Indra Deo Mall b a Department of Civil Engineering, Visvesvaraya National Institute of Technology, Nagpur 440010, India b Department of Chemical Engineering, Indian Institute of Technology Roorkee, Roorkee 247667, India article info Article history: Received 12 July 2007 Received in revised form 5 June 2008 Accepted 28 June 2008 Keywords: -Picoline Rice husk ash (RHA) Granular activated carbon (GAC) Adsorption isotherms Chi-square abstract In the present study, the batch adsorption experiments were carried out to calculate the adsorption capac- ities of rice husk ash (RHA) and commercial grade granular activated carbon (GAC) for the adsorption of -picoline (Pi) from aqueous solutions. The effect of various parameters like initial pH (pH 0 ), adsorbent dose (m), contact time (t), initial concentration (C 0 ) and temperature (T) on the adsorption of Pi from the aqueous solutions was studied. The maximum uptake of Pi was observed to be 2.34 mg g −1 at lower concentration (50 mg dm −3 ) and 15.46 mg g −1 at higher concentration (600 mg dm −3 ) using 20 kg m −3 of RHA and the maximum uptake of Pi by GAC was observed to be 4.55 mg g −1 at lower concentration (50 mg dm −3 ) and 36 mg g −1 at higher concentration (600 mg dm −3 ) using 10 kg m −3 of GAC at normal temperature. The equilibrium data can be best represented by Radke–Prausnitz isotherm equation. How- ever, Toth and Redlich–Peterson isotherm equations also represent the equilibrium data adequately. The values of change in Gibb’s free energy (G ◦ ), enthalpy (H ◦ ) and entropy (S ◦ ) were calculated. Thermo- dynamic study revealed that the adsorption of Pi onto RHA and GAC is an endothermic process. Isosteric heat of adsorption was found to be decreasing with an increase in surface loading. The acidic water and dilute acids showed higher desorption efficiency for Pi from RHA and GAC. Thus GAC can be regenerated by using acidic water and acids. However, RHA can be disposed off by using it as a fuel in furnaces to recover its energy value. © 2008 Elsevier B.V. All rights reserved. 1. Introduction -Picoline (Pi), or 2-picoline, a derivative of pyridine, is a colour- less liquid with nauseating odour and is used as a solvent, and as a raw material for various chemicals used in the manufacture of various polymers, textiles, fuels, agrochemicals, pharmaceuticals and colorants [1]. Pi is considered to be a hazardous chemical. Its properties are given in Table 1. Various industrial units manufacturing pyridine and its deriva- tives, pharmaceutical units, etc. discharge Pi-bearing wastewaters. The typical concentration of Pi in wastewaters produced in a mul- tidrug intermediates-product plant manufacturing pyridine and pyridine derivatives ranges from 20 to 200 mg dm −3 . The concen- trations may exceed the range in case of emergency discharge and spill-episodes. ∗ Corresponding author. Tel.: +91 1332 285715; fax: +91 1332 273560. E-mail address: [email protected] (I.M. Mishra). Various physico-chemical and biological treatment techniques are suggested for the treatment of Pi-bearing wastewaters, which include concentration followed by incineration [4], adsorption [5], biodegradation [6], etc. Adsorption can be used, provided that the adsorbents are cheap, easily available, and, if possible, regenerable, and that they have large surface area and high sorption capac- ity for Pi. Agri-solid wastes generally fulfill these requirements. They have high affinity towards organic compounds and, in most cases, desorption of solutes from spent agri-solids may not be fea- sible. In such cases, the spent agri-wastes can be filtered from the aqueous solution, dewatered, dried and used as a fuel in the fur- naces/incinerators to chemically transform the adsorbates and the carbonaceous matter of the adsorbents into innoccuous combus- tion products with energy recovery. Bagasse fly ash (BFA) and Rice husk ash (RHA are agri-waste materials and are available almost free of cost from the dust collection equipment attached to the flue gas line downstream of the furnaces which use bagasse or rice husk as the fuel. RHA has high adsorption efficiency for the removal of Cd, Ni, Zn, Pb, Hg, etc. and also various dyes and carbonaceous com- pounds present in wastewaters [7–9]. Lataye et al. have used RHA 1385-8947/$ – see front matter © 2008 Elsevier B.V. All rights reserved. doi:10.1016/j.cej.2008.06.027
-
Upload
independent -
Category
Documents
-
view
2 -
download
0
Transcript of Adsorption of α-picoline onto rice husk ash and granular activated carbon from aqueous solution:...
Aat
Da
b
a
ARRA
K�RGAC
1
lavap
tTtpts
1d
Chemical Engineering Journal 147 (2009) 139–149
Contents lists available at ScienceDirect
Chemical Engineering Journal
journa l homepage: www.e lsev ier .com/ locate /ce j
dsorption of �-picoline onto rice husk ash and granularctivated carbon from aqueous solution: Equilibrium andhermodynamic study
ilip Hiradram Latayea, Indra Mani Mishrab,∗, Indra Deo Mallb
Department of Civil Engineering, Visvesvaraya National Institute of Technology, Nagpur 440010, IndiaDepartment of Chemical Engineering, Indian Institute of Technology Roorkee, Roorkee 247667, India
r t i c l e i n f o
rticle history:eceived 12 July 2007eceived in revised form 5 June 2008ccepted 28 June 2008
eywords:-Picolineice husk ash (RHA)ranular activated carbon (GAC)dsorption isotherms
a b s t r a c t
In the present study, the batch adsorption experiments were carried out to calculate the adsorption capac-ities of rice husk ash (RHA) and commercial grade granular activated carbon (GAC) for the adsorption of�-picoline (Pi) from aqueous solutions. The effect of various parameters like initial pH (pH0), adsorbentdose (m), contact time (t), initial concentration (C0) and temperature (T) on the adsorption of Pi fromthe aqueous solutions was studied. The maximum uptake of Pi was observed to be 2.34 mg g−1 at lowerconcentration (50 mg dm−3) and 15.46 mg g−1 at higher concentration (600 mg dm−3) using 20 kg m−3
of RHA and the maximum uptake of Pi by GAC was observed to be 4.55 mg g−1 at lower concentration(50 mg dm−3) and 36 mg g−1 at higher concentration (600 mg dm−3) using 10 kg m−3 of GAC at normaltemperature. The equilibrium data can be best represented by Radke–Prausnitz isotherm equation. How-
hi-square ever, Toth and Redlich–Peterson isotherm equations also represent the equilibrium data adequately. Thevalues of change in Gibb’s free energy (�G◦), enthalpy (�H◦) and entropy (�S◦) were calculated. Thermo-dynamic study revealed that the adsorption of Pi onto RHA and GAC is an endothermic process. Isostericheat of adsorption was found to be decreasing with an increase in surface loading. The acidic water anddilute acids showed higher desorption efficiency for Pi from RHA and GAC. Thus GAC can be regeneratedby using acidic water and acids. However, RHA can be disposed off by using it as a fuel in furnaces to
aibaaiTcsa
recover its energy value.
. Introduction
�-Picoline (Pi), or 2-picoline, a derivative of pyridine, is a colour-ess liquid with nauseating odour and is used as a solvent, and as
raw material for various chemicals used in the manufacture ofarious polymers, textiles, fuels, agrochemicals, pharmaceuticalsnd colorants [1]. Pi is considered to be a hazardous chemical. Itsroperties are given in Table 1.
Various industrial units manufacturing pyridine and its deriva-ives, pharmaceutical units, etc. discharge Pi-bearing wastewaters.he typical concentration of Pi in wastewaters produced in a mul-
idrug intermediates-product plant manufacturing pyridine andyridine derivatives ranges from 20 to 200 mg dm−3. The concen-rations may exceed the range in case of emergency discharge andpill-episodes.∗ Corresponding author. Tel.: +91 1332 285715; fax: +91 1332 273560.E-mail address: [email protected] (I.M. Mishra).
ncthfgaCp
385-8947/$ – see front matter © 2008 Elsevier B.V. All rights reserved.oi:10.1016/j.cej.2008.06.027
© 2008 Elsevier B.V. All rights reserved.
Various physico-chemical and biological treatment techniquesre suggested for the treatment of Pi-bearing wastewaters, whichnclude concentration followed by incineration [4], adsorption [5],iodegradation [6], etc. Adsorption can be used, provided that thedsorbents are cheap, easily available, and, if possible, regenerable,nd that they have large surface area and high sorption capac-ty for Pi. Agri-solid wastes generally fulfill these requirements.hey have high affinity towards organic compounds and, in mostases, desorption of solutes from spent agri-solids may not be fea-ible. In such cases, the spent agri-wastes can be filtered from thequeous solution, dewatered, dried and used as a fuel in the fur-aces/incinerators to chemically transform the adsorbates and thearbonaceous matter of the adsorbents into innoccuous combus-ion products with energy recovery. Bagasse fly ash (BFA) and Riceusk ash (RHA are agri-waste materials and are available almost
ree of cost from the dust collection equipment attached to the flueas line downstream of the furnaces which use bagasse or rice husks the fuel. RHA has high adsorption efficiency for the removal ofd, Ni, Zn, Pb, Hg, etc. and also various dyes and carbonaceous com-ounds present in wastewaters [7–9]. Lataye et al. have used RHA
140 D.H. Lataye et al. / Chemical Engineering Journal 147 (2009) 139–149
Nomenclature
aR R–P isotherm constant (dm3 mg−1)b constant in Temkin equation (J mol−1)B1 constant in Temkin equation (dm3 g−1)C0 initial concentration of Pi (mg dm−3)Ce equilibrium concentration of Pi (mg dm−3)Cr residual concentration of Pi (mg dm−3)�G◦ Gibbs free energy change (kJ mol−1)�H◦ enthalpy change (kJ mol−1)�Hst,0 isosteric heat of adsorption at zero surface coverage
(kJ kg−1)krp Radke–Prausnitz isotherm constant ((mg g−1)/
(mg dm−3)1/P)Kad Equilibrium constant for adsorption (dm3g−1)KF Freundlich constant (dm3 mg−1)KL Langmuir constant (dm3 mg−1)KR Redlich–Peterson constant (dm3 mg−1)KRP Radke–Prausnitz isotherm constant (dm3 mg−1)KT constant in Temkin equation (dm3 mg−1)KTh Toth isotherm constant ((mg dm−3)Th)m adsorbent dose (g)n heterogenity factorP Radke–Prausnitz isotherm constantq adsorptive uptake of �-picoline (mg g−1)qe adsorptive uptake of Pi at equilibrium (mg g−1)qt adsorptive uptake of Pi at any time t (mg g−1)qe, calc calculated qe (mg g−1)qe, exp experimental qe (mg g−1)qm monolayer adsorptive uptake (mg g−1)qTh monolayer adsorptive uptake (mg g−1)R universal gas constant (J mol−1 K−1)�S◦ entropy change (kJ mol−1 K−1)t contact time (min)T temperature (K)Th Toth isotherm constantV volume (dm3)W weight of adsorbent (g)
Greek lettersˇ exponent in Redlich–Peterson equation
apmosaPaT(toEteRmoa
Table 1Properties of Pi [1–3]
S. no. Property �-Picoline
1 Synonyms 2-Picoline, �-methylpyridine2 Chemical formula C6H7N3 Molecular weight 93.134 Physical properties Colourless liquid, strong unpleasant odor5 Boiling point 129 ◦C6 Freezing point −70 ◦C7 Flash point 102 ◦C8 Soluble in Water, alcohol, ether9 OSHA PEL TWA 2 mg dm−3 (8 h exposure)10 ACGIH TLV 5 mg dm−3 (STEL, 15 min)11 Health effects Poison by intraperitorial route, moderately toxic by
ingestion, skin contact, intravenous and subcutaneous
co
2
2
wIafraaPsdma(dg1
GbBMBm
2
gwrw1so
�max wavelength (nm)
nd granular activated carbon (GAC) for the adsorptive removal ofyridine [10]. Mohan et al. [11] have used activated carbons (ACs)anufactured from agri-waste materials for the sorptive removal
f pyridine and picolines. In our previous paper [5], we have pre-ented the use of BFA as an adsorbent for the removal of Pi fromqueous solutions. In the present paper, we report the sorption ofi from aqueous solutions onto RHA and commercial-grade GAC inbatch process, and compare the results with that of BFA and ACs.he effect of initial pH of the solution (2 ≤ pH0 ≤ 12), adsorbent dose2 ≤ m ≤ 60 g dm−3), contact time (0 ≤ t ≤ 3 d), initial Pi concen-ration (50 ≤ C0 ≤ 600 mg dm−3) and temperature (283 ≤ T ≤ 323 K)n the sorption of Pi onto RHA and GAC has been investigated.quilibrium characteristics of the sorption process have been inves-igated and the experimental data have been fitted to variousquilibrium isotherm equations viz. Langmuir, Freundlich, Temkin,
edlich–Peterson, Toth and Radke–Prausnitz equations. The ther-odynamic aspects of Pi removal, viz. the effect of temperaturen the sorption process has been studied and the isosteric heat ofdsorption has been estimated. Desorption experiments have been
2
i
routes. Mildly toxic by inhalation, skin and severe eyeirritant. Can cause CNS depression, gastrointestinalupset, and liver and kidney damage
arried out to determine the recovery of Pi and to check the stabilityf the Pi-loaded adsorbent.
. Materials and methods
.1. Adsorbent and its characterization
RHA, obtained from Bhawani Paper Mills, Raebareli, U.P. (India)as washed once with hot tap water (70 ◦C), dried and sieved using
S sieves (IS: 437, 1979). The sieved mass fraction between 180nd 600 �m was used for the sorption study. The GAC, obtainedrom Zeotec Adsorbents, New Delhi (India), in the sieved sizeange of 500–1700 �m was used for the sorption of Pi from itsqueous solutions. The physico-chemical characteristics of RHAnd GAC were determined using standard methods [APHA, 1998].roximate analysis of both the adsorbents was carried out usingtandard procedure (IS: 1350, 1984, part-I). Bulk density wasetermined using a MAC bulk density meter. Scanning electronicroscopy (SEM) micrographs of samples were obtained usingscanning electron microscope (LEO 435 VP). X-ray diffraction
XRD) analyses of the adsorbents were carried out using Phillipsiffraction unit (Model PW 1140/90), with copper as the tar-et and nickel as the filter media and K radiation maintained at.542 Å.
The specific surface area and the pore diameter of RHA andAC particles were measured by nitrogen adsorption isothermy using an ASAP 2010 Micromeritics instrument and by therunaer–Emmett–Teller (BET) method, using the software oficromeritics. Nitrogen was used as cold bath (77.15 K). The
arrett–Joyner–Halenda (BJH) method was used to calculate theesopore distribution.
.2. Adsorbate
All the chemicals used in the study were of analytical reagentrade. The adsorbate, Pi (chemical formula = C6H7N, formulaeight = 93.13) was supplied by Acros Organics (USA). An accu-
ate volume of aqueous Pi solution was taken and mixed wellith double-distilled water (DDW) to prepare a stock solution of
000 mg dm−3 Pi concentration. The stock solution was succes-ively diluted with DWW to obtain the desired test concentrationf Pi.
.3. Analytical measurements
The stability of Pi in the concentration range of 50–600 mg dm−3
n aqueous solution has been studied. No change in the Pi
ineering Journal 147 (2009) 139–149 141
cdcats(cfptwuPwi
2
eai1vMtrwdtwwmcpom(rsbittP
q
waa(a
3
3
dvab
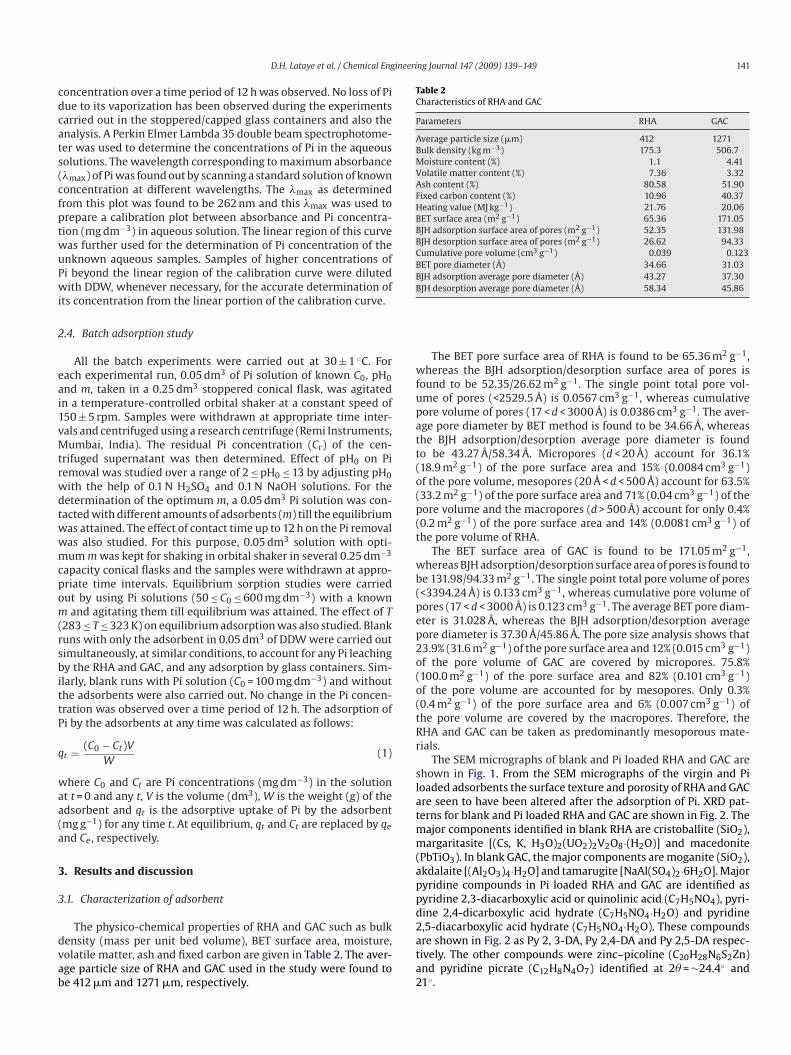
Table 2Characteristics of RHA and GAC
Parameters RHA GAC
Average particle size (�m) 412 1271Bulk density (kg m−3) 175.3 506.7Moisture content (%) 1.1 4.41Volatile matter content (%) 7.36 3.32Ash content (%) 80.58 51.90Fixed carbon content (%) 10.96 40.37Heating value (MJ kg−1) 21.76 20.06BET surface area (m2 g−1) 65.36 171.05BJH adsorption surface area of pores (m2 g−1) 52.35 131.98BJH desorption surface area of pores (m2 g−1) 26.62 94.33Cumulative pore volume (cm3 g−1) 0.039 0.123BET pore diameter (Å) 34.66 31.03BJH adsorption average pore diameter (Å) 43.27 37.30B
wfupatt(o(p(t
wb(pep2o(o(tRr
slatmm(appd
D.H. Lataye et al. / Chemical Eng
oncentration over a time period of 12 h was observed. No loss of Piue to its vaporization has been observed during the experimentsarried out in the stoppered/capped glass containers and also thenalysis. A Perkin Elmer Lambda 35 double beam spectrophotome-er was used to determine the concentrations of Pi in the aqueousolutions. The wavelength corresponding to maximum absorbance�max) of Pi was found out by scanning a standard solution of knownoncentration at different wavelengths. The �max as determinedrom this plot was found to be 262 nm and this �max was used torepare a calibration plot between absorbance and Pi concentra-ion (mg dm−3) in aqueous solution. The linear region of this curveas further used for the determination of Pi concentration of thenknown aqueous samples. Samples of higher concentrations ofi beyond the linear region of the calibration curve were dilutedith DDW, whenever necessary, for the accurate determination of
ts concentration from the linear portion of the calibration curve.
.4. Batch adsorption study
All the batch experiments were carried out at 30 ± 1 ◦C. Forach experimental run, 0.05 dm3 of Pi solution of known C0, pH0nd m, taken in a 0.25 dm3 stoppered conical flask, was agitatedn a temperature-controlled orbital shaker at a constant speed of50 ± 5 rpm. Samples were withdrawn at appropriate time inter-als and centrifuged using a research centrifuge (Remi Instruments,umbai, India). The residual Pi concentration (Cr) of the cen-
rifuged supernatant was then determined. Effect of pH0 on Piemoval was studied over a range of 2 ≤ pH0 ≤ 13 by adjusting pH0ith the help of 0.1 N H2SO4 and 0.1 N NaOH solutions. For theetermination of the optimum m, a 0.05 dm3 Pi solution was con-acted with different amounts of adsorbents (m) till the equilibriumas attained. The effect of contact time up to 12 h on the Pi removalas also studied. For this purpose, 0.05 dm3 solution with opti-um m was kept for shaking in orbital shaker in several 0.25 dm−3
apacity conical flasks and the samples were withdrawn at appro-riate time intervals. Equilibrium sorption studies were carriedut by using Pi solutions (50 ≤ C0 ≤ 600 mg dm−3) with a known
and agitating them till equilibrium was attained. The effect of T283 ≤ T ≤ 323 K) on equilibrium adsorption was also studied. Blankuns with only the adsorbent in 0.05 dm3 of DDW were carried outimultaneously, at similar conditions, to account for any Pi leachingy the RHA and GAC, and any adsorption by glass containers. Sim-larly, blank runs with Pi solution (C0 = 100 mg dm−3) and withouthe adsorbents were also carried out. No change in the Pi concen-ration was observed over a time period of 12 h. The adsorption ofi by the adsorbents at any time was calculated as follows:
t = (C0 − Ct)VW
(1)
here C0 and Ct are Pi concentrations (mg dm−3) in the solutiont t = 0 and any t, V is the volume (dm3), W is the weight (g) of thedsorbent and qt is the adsorptive uptake of Pi by the adsorbentmg g−1) for any time t. At equilibrium, qt and Ct are replaced by qe
nd Ce, respectively.
. Results and discussion
.1. Characterization of adsorbent
The physico-chemical properties of RHA and GAC such as bulkensity (mass per unit bed volume), BET surface area, moisture,olatile matter, ash and fixed carbon are given in Table 2. The aver-ge particle size of RHA and GAC used in the study were found toe 412 �m and 1271 �m, respectively.
2ata2
JH desorption average pore diameter (Å) 58.34 45.86
The BET pore surface area of RHA is found to be 65.36 m2 g−1,hereas the BJH adsorption/desorption surface area of pores is
ound to be 52.35/26.62 m2 g−1. The single point total pore vol-me of pores (<2529.5 Å) is 0.0567 cm3 g−1, whereas cumulativeore volume of pores (17 < d < 3000 Å) is 0.0386 cm3 g−1. The aver-ge pore diameter by BET method is found to be 34.66 Å, whereashe BJH adsorption/desorption average pore diameter is foundo be 43.27 Å/58.34 Å. Micropores (d < 20 Å) account for 36.1%18.9 m2 g−1) of the pore surface area and 15% (0.0084 cm3 g−1)f the pore volume, mesopores (20 Å < d < 500 Å) account for 63.5%33.2 m2 g−1) of the pore surface area and 71% (0.04 cm3 g−1) of theore volume and the macropores (d > 500 Å) account for only 0.4%0.2 m2 g−1) of the pore surface area and 14% (0.0081 cm3 g−1) ofhe pore volume of RHA.
The BET surface area of GAC is found to be 171.05 m2 g−1,hereas BJH adsorption/desorption surface area of pores is found to
e 131.98/94.33 m2 g−1. The single point total pore volume of pores<3394.24 Å) is 0.133 cm3 g−1, whereas cumulative pore volume ofores (17 < d < 3000 Å) is 0.123 cm3 g−1. The average BET pore diam-ter is 31.028 Å, whereas the BJH adsorption/desorption averageore diameter is 37.30 Å/45.86 Å. The pore size analysis shows that3.9% (31.6 m2 g−1) of the pore surface area and 12% (0.015 cm3 g−1)f the pore volume of GAC are covered by micropores. 75.8%100.0 m2 g−1) of the pore surface area and 82% (0.101 cm3 g−1)f the pore volume are accounted for by mesopores. Only 0.3%0.4 m2 g−1) of the pore surface area and 6% (0.007 cm3 g−1) ofhe pore volume are covered by the macropores. Therefore, theHA and GAC can be taken as predominantly mesoporous mate-ials.
The SEM micrographs of blank and Pi loaded RHA and GAC arehown in Fig. 1. From the SEM micrographs of the virgin and Pioaded adsorbents the surface texture and porosity of RHA and GACre seen to have been altered after the adsorption of Pi. XRD pat-erns for blank and Pi loaded RHA and GAC are shown in Fig. 2. The
ajor components identified in blank RHA are cristoballite (SiO2),argaritasite [(Cs, K, H3O)2(UO2)2V2O8·(H2O)] and macedonite
PbTiO3). In blank GAC, the major components are moganite (SiO2),kdalaite [(Al2O3)4·H2O] and tamarugite [NaAl(SO4)2·6H2O]. Majoryridine compounds in Pi loaded RHA and GAC are identified asyridine 2,3-diacarboxylic acid or quinolinic acid (C7H5NO4), pyri-ine 2,4-dicarboxylic acid hydrate (C7H5NO4·H2O) and pyridine,5-diacarboxylic acid hydrate (C7H5NO4·H2O). These compoundsre shown in Fig. 2 as Py 2, 3-DA, Py 2,4-DA and Py 2,5-DA respec-
ively. The other compounds were zinc–picoline (C20H28N6S2Zn)nd pyridine picrate (C12H8N4O7) identified at 2� = ∼24.4◦ and1◦.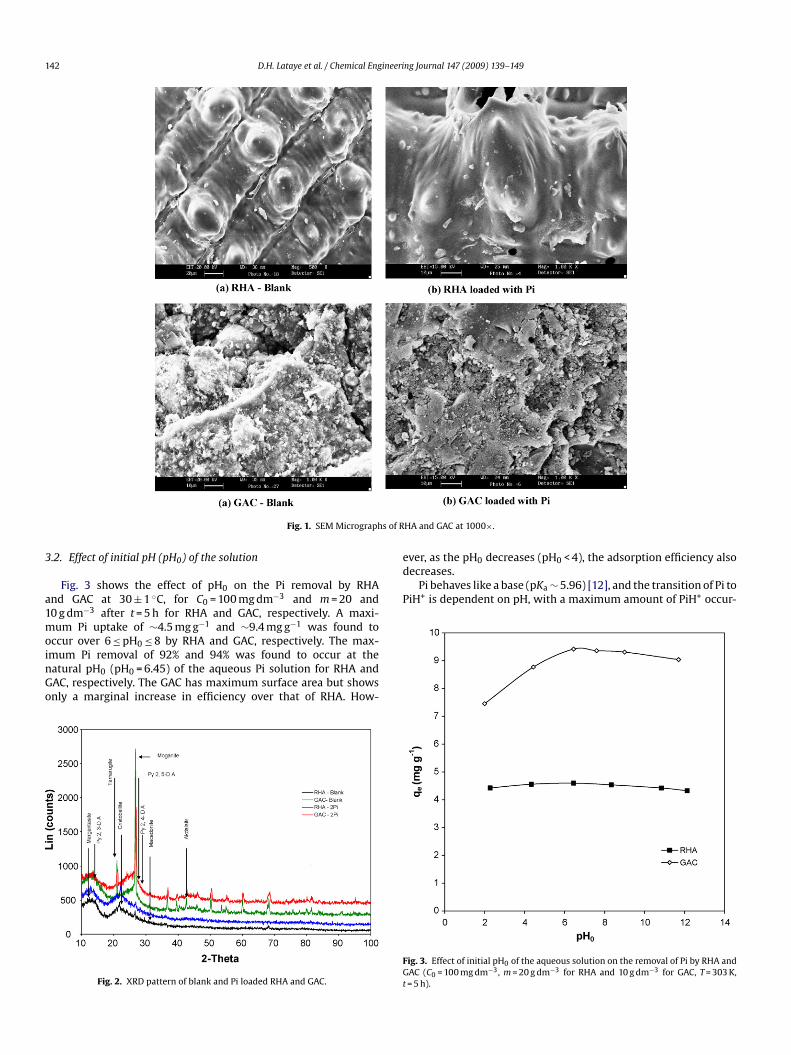
142 D.H. Lataye et al. / Chemical Engineering Journal 147 (2009) 139–149
s of R
3
a1moinGo
ever, as the pH0 decreases (pH0 < 4), the adsorption efficiency alsodecreases.
Pi behaves like a base (pKa ∼ 5.96) [12], and the transition of Pi toPiH+ is dependent on pH, with a maximum amount of PiH+ occur-
Fig. 1. SEM Micrograph
.2. Effect of initial pH (pH0) of the solution
Fig. 3 shows the effect of pH0 on the Pi removal by RHAnd GAC at 30 ± 1 ◦C, for C0 = 100 mg dm−3 and m = 20 and0 g dm−3 after t = 5 h for RHA and GAC, respectively. A maxi-um Pi uptake of ∼4.5 mg g−1 and ∼9.4 mg g−1 was found to
ccur over 6 ≤ pH0 ≤ 8 by RHA and GAC, respectively. The max-
mum Pi removal of 92% and 94% was found to occur at theatural pH0 (pH0 = 6.45) of the aqueous Pi solution for RHA andAC, respectively. The GAC has maximum surface area but showsnly a marginal increase in efficiency over that of RHA. How-Fig. 2. XRD pattern of blank and Pi loaded RHA and GAC.
FGt
HA and GAC at 1000×.
ig. 3. Effect of initial pH0 of the aqueous solution on the removal of Pi by RHA andAC (C0 = 100 mg dm−3, m = 20 g dm−3 for RHA and 10 g dm−3 for GAC, T = 303 K,= 5 h).
ineering Journal 147 (2009) 139–149 143
rctpbt
eZ
P
P
P
H
H
P
tpvaatiRPtErra
3
C
Fp
F(
rimfGdmati
D.H. Lataye et al. / Chemical Eng
ing in the pH range of 4–10. The solution pH affects the surfaceharge of the adsorbents and, therefore, the adsorption proceedshrough dissociation of functional groups, viz. surface oxygen com-lexes of acid character such as carboxyl and phenolic groups or ofasic character such as pyrones or chromens, on the active sites ofhe adsorbent. pH can also affect the structural stability of Pi.
The chemical interaction of Pi with RHA or GAC (ADS) may bexplained on the basis of the explanation put forth by Weber [13],hu et al. [14] and Lataye et al. [4,5,10]:
i + H+ � PiH+ (a)
i + ADS � Pi-ADS (b)
iH+ + M+-ADS � PiH+-ADS + M+ (c)
+ + PiH+-ADS � H+-ADS + PiH+ (d)
+ + ADS � H+-ADS (e)
i + H+-ADS � PiH+-ADS (f)
Since Pi contains a nitrogen atom, which is more electronega-ive than an SP2 hybridized C, Pi gets preferentially adsorbed on aositively charged surface [15]. At low pH (pH0 ≤ 4), the Pi gets con-erted to PiH+ through protonation via Eq. (a) resulting in the lowdsorption of protonated Pi on the positively charged ADS surfaces shown by Eq. (c). At higher pH (pH ≥ 4), �–� dispersion interac-ions also take place [16,17] and electrostatic interactions becomemportant and Pi molecules are sorbed onto the adsorbents. TheHA and GAC have maximum affinity to Pi and PiH+ for 6 ≤ pH0 ≤ 8.iH+ adsorption rate is lower than that of Pi molecules. Therefore,he dominant sorption reaction (at pH0 ≈ 6.45) is perhaps given byq. (b). Other reactions given by Eq. (a) and (c)–(f) play insignificantole in the overall sorption process of Pi onto RHA and GAC. Similaresults were observed earlier for the adsorptive removal of pyridinend 2-picoline by bagasse fly ash [4,5].
.3. Effect of adsorbent dose (m)
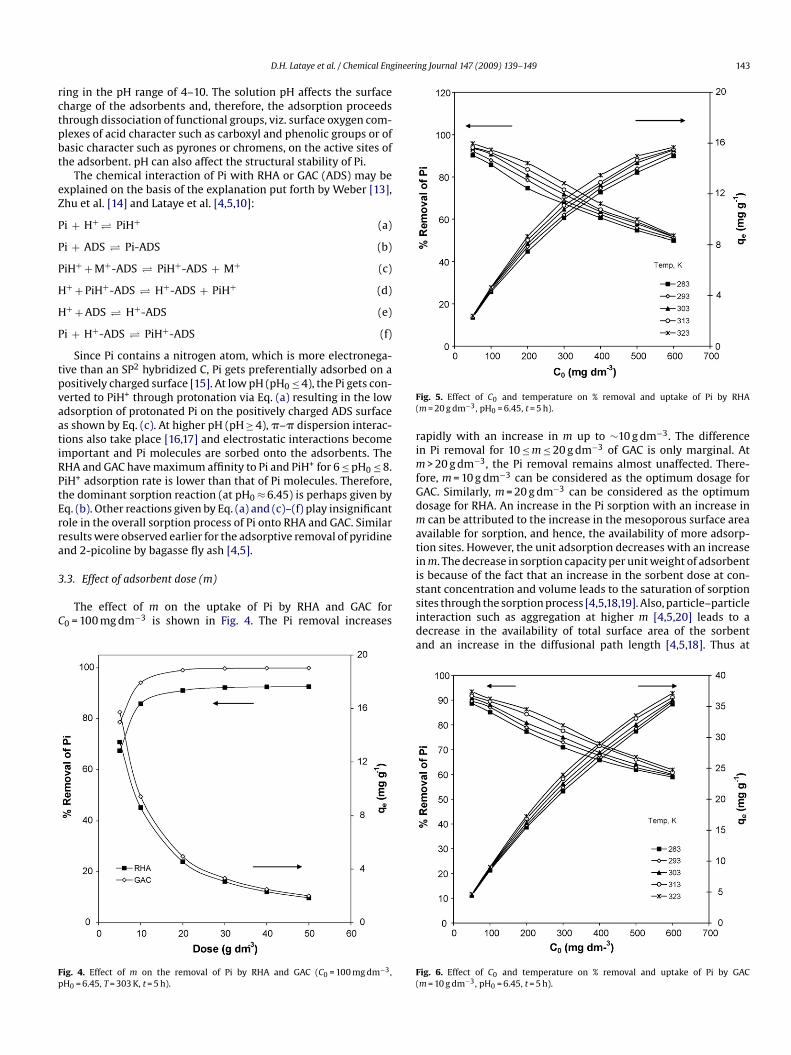
The effect of m on the uptake of Pi by RHA and GAC for0 = 100 mg dm−3 is shown in Fig. 4. The Pi removal increases
ig. 4. Effect of m on the removal of Pi by RHA and GAC (C0 = 100 mg dm−3,H0 = 6.45, T = 303 K, t = 5 h).
issida
F(
ig. 5. Effect of C0 and temperature on % removal and uptake of Pi by RHAm = 20 g dm−3, pH0 = 6.45, t = 5 h).
apidly with an increase in m up to ∼10 g dm−3. The differencen Pi removal for 10 ≤ m ≤ 20 g dm−3 of GAC is only marginal. At
> 20 g dm−3, the Pi removal remains almost unaffected. There-ore, m = 10 g dm−3 can be considered as the optimum dosage forAC. Similarly, m = 20 g dm−3 can be considered as the optimumosage for RHA. An increase in the Pi sorption with an increase incan be attributed to the increase in the mesoporous surface area
vailable for sorption, and hence, the availability of more adsorp-ion sites. However, the unit adsorption decreases with an increasen m. The decrease in sorption capacity per unit weight of adsorbents because of the fact that an increase in the sorbent dose at con-tant concentration and volume leads to the saturation of sorption
ites through the sorption process [4,5,18,19]. Also, particle–particlenteraction such as aggregation at higher m [4,5,20] leads to aecrease in the availability of total surface area of the sorbentnd an increase in the diffusional path length [4,5,18]. Thus atig. 6. Effect of C0 and temperature on % removal and uptake of Pi by GACm = 10 g dm−3, pH0 = 6.45, t = 5 h).
144 D.H. Lataye et al. / Chemical Engineering Journal 147 (2009) 139–149
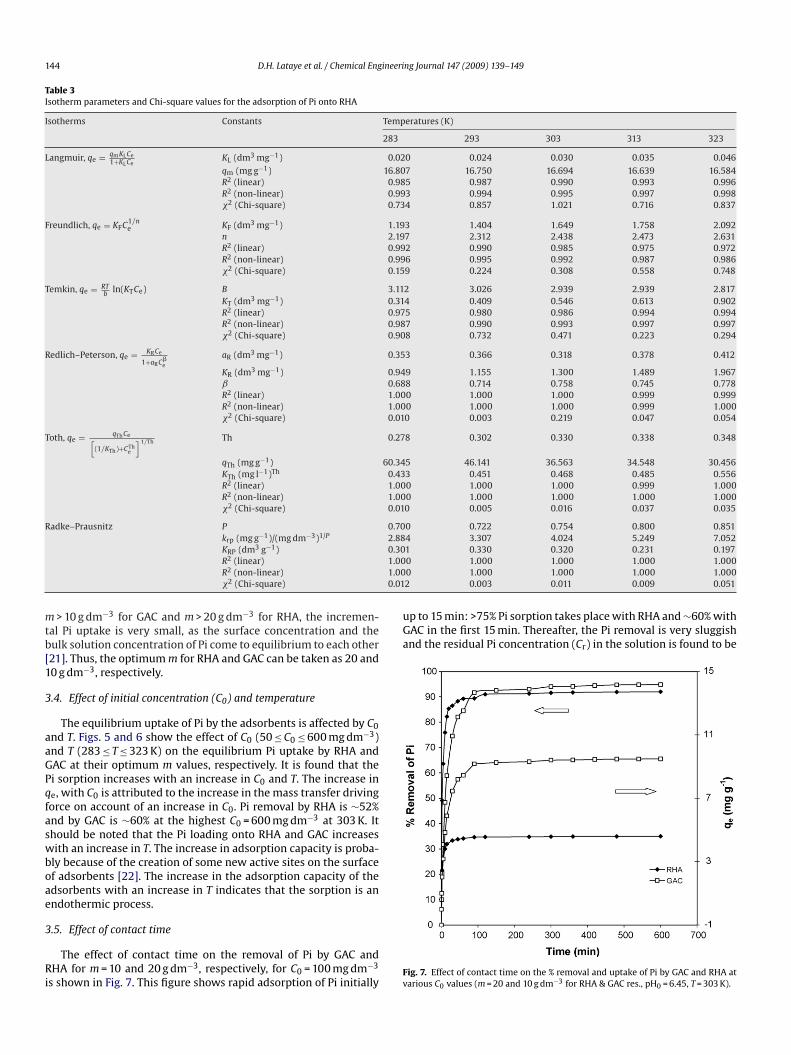
Table 3Isotherm parameters and Chi-square values for the adsorption of Pi onto RHA
Isotherms Constants Temperatures (K)
283 293 303 313 323
Langmuir, qe = qmKLCe1+KLCe
KL (dm3 mg−1) 0.020 0.024 0.030 0.035 0.046
qm (mg g−1) 16.807 16.750 16.694 16.639 16.584R2 (linear) 0.985 0.987 0.990 0.993 0.996R2 (non-linear) 0.993 0.994 0.995 0.997 0.998�2 (Chi-square) 0.734 0.857 1.021 0.716 0.837
Freundlich, qe = KFC1/ne KF (dm3 mg−1) 1.193 1.404 1.649 1.758 2.092
n 2.197 2.312 2.438 2.473 2.631R2 (linear) 0.992 0.990 0.985 0.975 0.972R2 (non-linear) 0.996 0.995 0.992 0.987 0.986�2 (Chi-square) 0.159 0.224 0.308 0.558 0.748
Temkin, qe = RTb
ln(KTCe) B 3.112 3.026 2.939 2.939 2.817KT (dm3 mg−1) 0.314 0.409 0.546 0.613 0.902R2 (linear) 0.975 0.980 0.986 0.994 0.994R2 (non-linear) 0.987 0.990 0.993 0.997 0.997�2 (Chi-square) 0.908 0.732 0.471 0.223 0.294
Redlich–Peterson, qe = KRCe
1+aRC�e
aR (dm3 mg−1) 0.353 0.366 0.318 0.378 0.412
KR (dm3 mg−1) 0.949 1.155 1.300 1.489 1.967ˇ 0.688 0.714 0.758 0.745 0.778R2 (linear) 1.000 1.000 1.000 0.999 0.999R2 (non-linear) 1.000 1.000 1.000 0.999 1.000�2 (Chi-square) 0.010 0.003 0.219 0.047 0.054
Toth, qe = qThCe[(1/KTh)+CTh
e
]1/Th Th 0.278 0.302 0.330 0.338 0.348
qTh (mg g−1) 60.345 46.141 36.563 34.548 30.456KTh (mg l−1)Th 0.433 0.451 0.468 0.485 0.556R2 (linear) 1.000 1.000 1.000 0.999 1.000R2 (non-linear) 1.000 1.000 1.000 1.000 1.000�2 (Chi-square) 0.010 0.005 0.016 0.037 0.035
Radke–Prausnitz P 0.700 0.722 0.754 0.800 0.851krp (mg g−1)/(mg dm−3)1/P 2.884 3.307 4.024 5.249 7.052
0.301.001.000.01
mtb[1
3
aaGPqfaswboae
3
Ri
up to 15 min: >75% Pi sorption takes place with RHA and ∼60% withGAC in the first 15 min. Thereafter, the Pi removal is very sluggishand the residual Pi concentration (Cr) in the solution is found to be
KRP (dm3 g−1)R2 (linear)R2 (non-linear)�2 (Chi-square)
> 10 g dm−3 for GAC and m > 20 g dm−3 for RHA, the incremen-al Pi uptake is very small, as the surface concentration and theulk solution concentration of Pi come to equilibrium to each other21]. Thus, the optimum m for RHA and GAC can be taken as 20 and0 g dm−3, respectively.
.4. Effect of initial concentration (C0) and temperature
The equilibrium uptake of Pi by the adsorbents is affected by C0nd T. Figs. 5 and 6 show the effect of C0 (50 ≤ C0 ≤ 600 mg dm−3)nd T (283 ≤ T ≤ 323 K) on the equilibrium Pi uptake by RHA andAC at their optimum m values, respectively. It is found that thei sorption increases with an increase in C0 and T. The increase ine, with C0 is attributed to the increase in the mass transfer drivingorce on account of an increase in C0. Pi removal by RHA is ∼52%nd by GAC is ∼60% at the highest C0 = 600 mg dm−3 at 303 K. Ithould be noted that the Pi loading onto RHA and GAC increasesith an increase in T. The increase in adsorption capacity is proba-
ly because of the creation of some new active sites on the surfacef adsorbents [22]. The increase in the adsorption capacity of thedsorbents with an increase in T indicates that the sorption is anndothermic process.
.5. Effect of contact time
The effect of contact time on the removal of Pi by GAC andHA for m = 10 and 20 g dm−3, respectively, for C0 = 100 mg dm−3
s shown in Fig. 7. This figure shows rapid adsorption of Pi initiallyFv
1 0.330 0.320 0.231 0.1970 1.000 1.000 1.000 1.0000 1.000 1.000 1.000 1.0002 0.003 0.011 0.009 0.051
ig. 7. Effect of contact time on the % removal and uptake of Pi by GAC and RHA atarious C0 values (m = 20 and 10 g dm−3 for RHA & GAC res., pH0 = 6.45, T = 303 K).
D.H. Lataye et al. / Chemical Engineering Journal 147 (2009) 139–149 145
Table 4Isotherm parameters and Chi-square values for the adsorption of Pi onto GAC
Isotherms Constants Temperatures (K)
283 293 303 313 323
Langmuir, qe = qmKLCe1+KLCe
KL (dm3 mg−1) 0.015 0.017 0.021 0.023 0.027
qm (mg g−1) 42.553 42.194 42.017 41.841 41.667R2 (linear) 0.970 0.977 0.983 0.992 0.991R2 (non-linear) 0.985 0.988 0.991 0.996 0.995�2 (Chi-square) 1.251 1.187 1.310 0.664 0.889
Freundlich, qe = KFC1/ne KF ((mg g−1) (mg dm−3)−1/n) 1.875 2.085 2.313 2.572 2.983
n 1.855 1.899 1.948 1.977 2.067R2 (linear) 0.996 0.992 0.991 0.982 0.982R2 (non-linear) 0.998 0.996 0.996 0.991 0.991�2 (Chi-square) 0.161 0.331 1.288 1.101 1.237
Temkin, qe = RTb
ln(KTCe) B 8.021 7.990 7.902 7.687 7.771KT (dm3 mg−1) 0.219 0.249 0.287 0.351 0.414R2 (linear) 0.955 0.964 0.970 0.983 0.983R2 (non-linear) 0.977 0.982 0.985 0.992 0.991�2 (Chi-square) 5.698 3.909 3.731 1.613 2.815
Redlich–Peterson, qe = KRCe
1+aRC�e
aR (dm3 mg−1) 0.336 0.274 0.231 0.200 0.239
KR (dm3 mg−1) 1.566 1.590 1.665 1.752 2.226ˇ 0.618 0.653 0.691 0.717 0.729R2 (linear) 1.000 0.999 0.999 0.999 0.999R2 (non-linear) 1.000 0.999 1.000 0.999 0.999�2 (Chi-square) 0.023 0.035 0.013 0.046 0.063
Toth, qe = qThCe
[(1/KTh)+CThe ]
1/Th Th 0.231 0.305 0.336 0.371 0.405
qTh (mg g−1) 406.643 172.422 131.181 105.394 84.628KTh (mg l−1)Th 0.368 0.300 0.291 0.278 0.280R2 (linear) 0.999 0.999 0.999 0.999 0.999R2 (non-linear) 1.000 0.999 1.000 0.999 1.000�2 (Chi-square) 0.026 0.050 0.018 0.056 0.054
Radke–Prausnitz, qe = KRPkrpCe
1+KRPCPe
P 0.570 0.623 0.669 0.765 0.761
krp (mg g−1)/(mg dm−3)1/P 3.532 4.873 6.382 11.211 11.0010.61.01.00.0
∼1trisovcafvSc
3
[iRttes
wt(
l
wag
q
wbTt
q
w
KRP (dm3 g−1)R2 (linear)R2 (non-linear)�2 (Chi-square)
10% and ∼15% after 1 h, ∼8% and ∼6% after 5 h, ∼8% and ∼5% after2 h, ∼7.8% and 4.7% after 24 h and ∼7.4% and 4.5% after 72 h con-act time for RHA and GAC, respectively. The initial sorption rate isapid because of the availability of more adsorption sites. As theres not much difference in the Cr at t = 5 h, and 12 h, the steady-stateorption is assumed after 5 h and further experiments were carriedut at t = 5 h only. The adsorptive uptake of Pi by GAC and RHA isery fast when compared to the adsorption rate of Pi onto activatedarbons derived from coconut fibres and shells, with and withoutcid treatment, as reported by Mohan et al. [11]. This, despite theact, that these ACs have higher surface area of 378 m2 g−1 (acti-ated carbon derived from coconut shells without any treatment,AC) and 380 m2 g−1 (activated carbon derived from acid-treatedoconut shells, ATSAC).
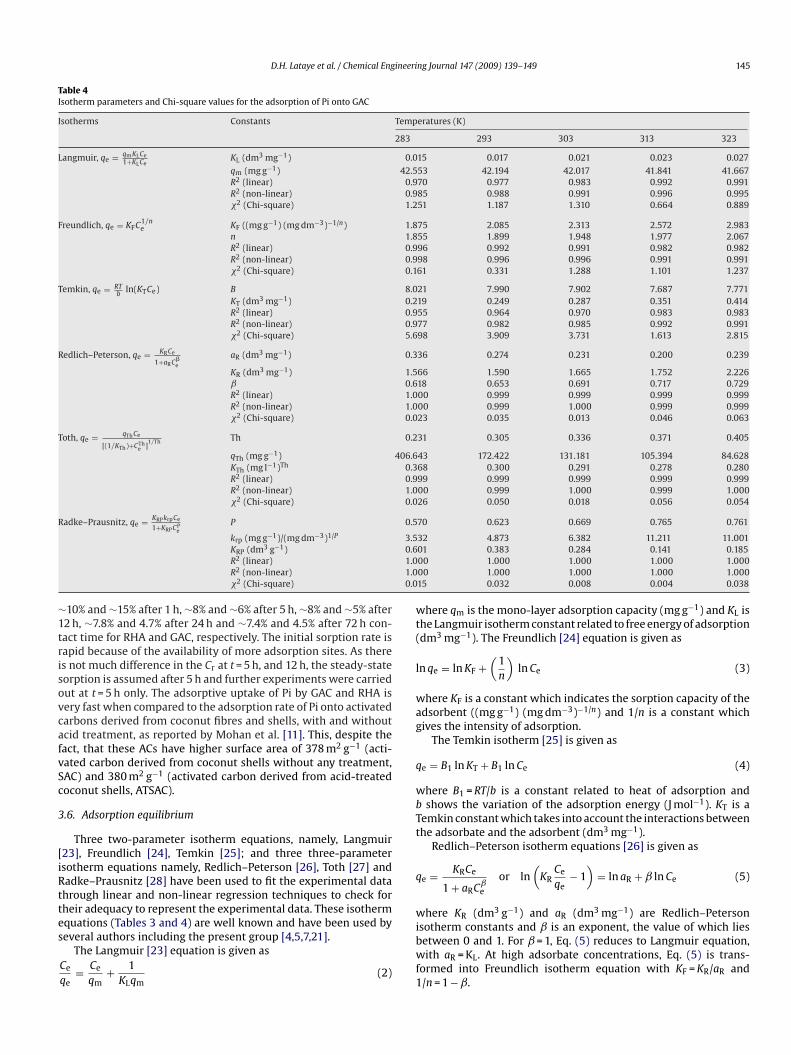
.6. Adsorption equilibrium
Three two-parameter isotherm equations, namely, Langmuir23], Freundlich [24], Temkin [25]; and three three-parametersotherm equations namely, Redlich–Peterson [26], Toth [27] andadke–Prausnitz [28] have been used to fit the experimental datahrough linear and non-linear regression techniques to check forheir adequacy to represent the experimental data. These isotherm
quations (Tables 3 and 4) are well known and have been used byeveral authors including the present group [4,5,7,21].The Langmuir [23] equation is given asCe
qe= Ce
qm+ 1
KLqm(2)
ibwf1
01 0.383 0.284 0.141 0.18500 1.000 1.000 1.000 1.00000 1.000 1.000 1.000 1.00015 0.032 0.008 0.004 0.038
here qm is the mono-layer adsorption capacity (mg g−1) and KL ishe Langmuir isotherm constant related to free energy of adsorptiondm3 mg−1). The Freundlich [24] equation is given as
n qe = ln KF +(
1n
)ln Ce (3)
here KF is a constant which indicates the sorption capacity of thedsorbent ((mg g−1) (mg dm−3)−1/n) and 1/n is a constant whichives the intensity of adsorption.
The Temkin isotherm [25] is given as
e = B1 ln KT + B1 ln Ce (4)
here B1 = RT/b is a constant related to heat of adsorption andshows the variation of the adsorption energy (J mol−1). KT is a
emkin constant which takes into account the interactions betweenhe adsorbate and the adsorbent (dm3 mg−1).
Redlich–Peterson isotherm equations [26] is given as
e = KRCe
1 + aRCˇe
or ln(
KRCe
qe− 1
)= ln aR + ˇ ln Ce (5)
here KR (dm3 g−1) and aR (dm3 mg−1) are Redlich–Peterson
sotherm constants and ˇ is an exponent, the value of which liesetween 0 and 1. For ˇ = 1, Eq. (5) reduces to Langmuir equation,ith aR = KL. At high adsorbate concentrations, Eq. (5) is trans-ormed into Freundlich isotherm equation with KF = KR/aR and/n = 1 − ˇ.

146 D.H. Lataye et al. / Chemical Engineering Journal 147 (2009) 139–149
Ft
q
wTTtut
q
wRP
adsimtf
�
w(t
sTde
Ft
vtoic
3
rV
�
Ia
�
F
l
wii(t
�
Tw
ig. 8. Comparison of the fit of the various isotherm equations with the experimen-al sorption data for Pi onto RHA (T = 303 K, m = 20 g dm−3, pH0 = 6.45, t = 5 h).
Toth equation [27] is given as
e = qThCe
[(1/KTh) + CThe ]
1/Thor
[Ce
qe
]= 1
(qTh)ThKTh
+ Ce
(qTh)Th(6)
here qTh is the monolayer adsorptive uptake (mg g−1), KTh is theoth isotherm constant (mg dm−3)Th, and Th is the dimensionlessoth isotherm exponent which characterizes the heterogeneity ofhe system and is usually less than unity. The more Th deviates fromnity, the larger is the heterogeneity of the adsorbent. When Th = 1,he Toth isotherm Eq. (6) reduces to Langmuir Eq. (2).
Radke–Prausnitz isotherm equation [28] is given as
e = KRPkrpCe
1 + KRPCPe
orCe
qe= 1
KRPkrp+ CP
ekrp
(7)
here KRP (dm3 g−1) and krp [(mg g−1)/(mg dm−3)1/P] areadke–Prausnitz constants and P is a dimensionless exponent. For= 1, Eq. (7) reduces to the Langmuir Eq. (2).
The isotherm parameters were determined by using the solverdd-in function of the MS excel, for the fitting of the experimentalata. The linear coefficient of determination and a non-linear Chi-quare test have been used for the purpose. The Chi-square tests the sum of the squares of the differences between the experi-
ental data and calculated data by using isotherm equations, withhe square difference divided by the corresponding data calculatedrom the models. The Chi-square error analysis is given by
2 =∑ (qe,exp − qe,calc)2
qe,calc(8)
here qe, exp is the experimental equilibrium adsorption capacitymg g−1) and qe, calc is the adsorption capacity calculated by usinghe model equation.
The estimated values of the isotherm parameters, regres-ion coefficients and Chi-square error functions are presented inables 3 and 4. Figs. 8 and 9 show the comparative fit of the pre-icted values from all the equilibrium isotherm equations with thexperimental data. By comparing the results for the Chi-square
oF�
t
ig. 9. Comparison of the fit of the various isotherm equations with the experimen-al sorption data for Pi onto GAC (T = 303 K, m = 10 g dm−3, pH0 = 6.45, t = 5 h).
alues and the correlation coefficients for the isotherms for a par-icular adsorbent (Tables 3 and 4), it is found that the Pi adsorptionnto RHA and GAC can be best represented by Radke–Prausnitzsotherm. However, Toth and Redlich–Peterson isotherms also giveomparative fit and can also be used.
.7. Estimation of thermodynamic parameters
The Gibbs free energy change (�G◦) of the adsorption process iselated to the adsorption equilibrium constant (Kad) by the classicalan’t Hoff equation [29]:
G◦ = −RT ln Kad (9)
t is also related to the change in entropy, �S◦ and the heat ofdsorption, �H◦ at a constant temperature as follows:
G◦ = �H◦ − T �S◦ (10)
rom the two equations, one gets,
n K = −�G◦
RT= �S◦
R− �H◦
R
1T
(11)
here �G◦ is the free energy change (kJ mol−1), �H◦ is the changen enthalpy (kJ mol−1), �S◦ is the entropy change (kJ mol−1 K−1), Ts the absolute temperature (K) and R is the universal gas constant8.314 J mol−1 K−1). Thus, �H◦ can be determined by the slope ofhe linear Van’t Hoff plot i.e. ln Kad versus (1/T), using the equation:
H◦ =[
Rd ln Kad
d(1/T)
](12)
his �H◦ corresponds to the isosteric heat of adsorption (�Hst,0)ith zero surface coverage (i.e. qe = 0) [30]. Kad, at qe = 0 was
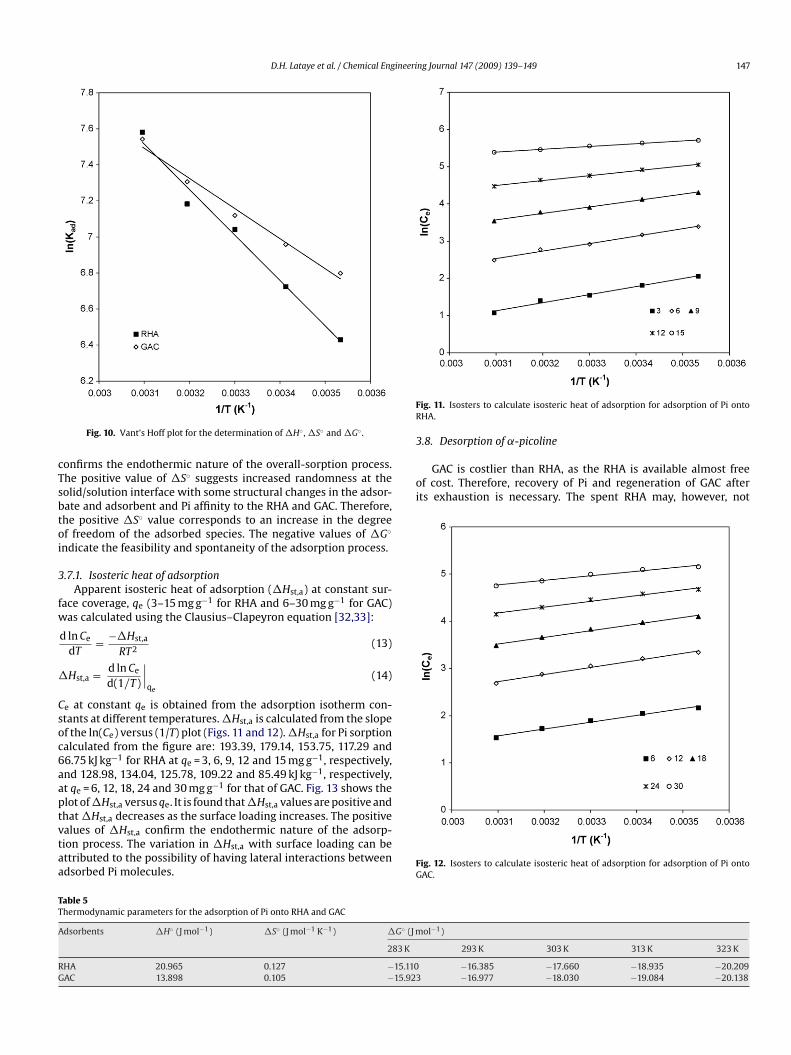
btained from the intercept of the ln(qe/Ce) versus qe plot [31,32].ig. 10 shows the Van’t Hoff’s plot from which the values of �H◦,S◦ and �G◦ for RHA and GAC have been calculated (Table 5).It is observed from Table 5 that �H◦ and �S◦ have posi-
ive values, and �G◦ has negative values. The positive �H◦ value
D.H. Lataye et al. / Chemical Engineering Journal 147 (2009) 139–149 147
cTsbtoi
3
fw
�
Csoc6aaptvtaa
FR
3.8. Desorption of ˛-picoline
GAC is costlier than RHA, as the RHA is available almost freeof cost. Therefore, recovery of Pi and regeneration of GAC afterits exhaustion is necessary. The spent RHA may, however, not
TT
A
RG
Fig. 10. Vant’s Hoff plot for the determination of �H◦ , �S◦ and �G◦ .
onfirms the endothermic nature of the overall-sorption process.he positive value of �S◦ suggests increased randomness at theolid/solution interface with some structural changes in the adsor-ate and adsorbent and Pi affinity to the RHA and GAC. Therefore,he positive �S◦ value corresponds to an increase in the degreef freedom of the adsorbed species. The negative values of �G◦
ndicate the feasibility and spontaneity of the adsorption process.
.7.1. Isosteric heat of adsorptionApparent isosteric heat of adsorption (�Hst,a) at constant sur-
ace coverage, qe (3–15 mg g−1 for RHA and 6–30 mg g−1 for GAC)as calculated using the Clausius–Clapeyron equation [32,33]:
d ln Ce
dT= −�Hst,a
RT2(13)
Hst,a = d ln Ce
d(1/T)
∣∣∣qe
(14)
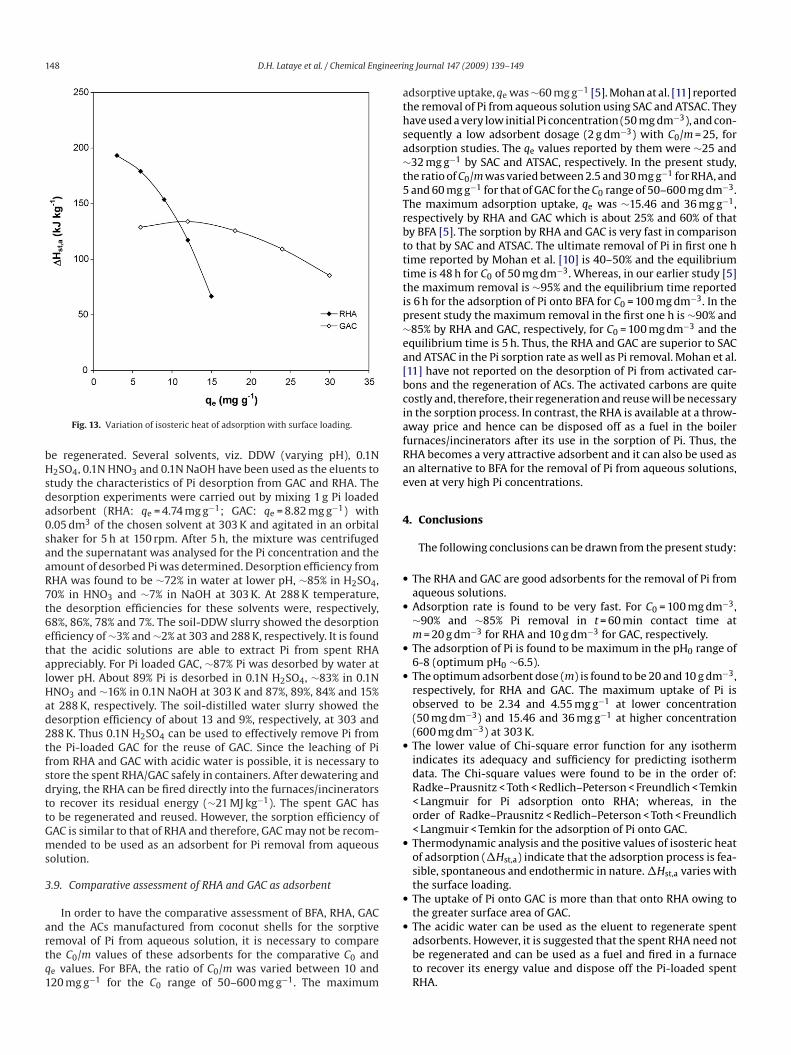
e at constant qe is obtained from the adsorption isotherm con-tants at different temperatures. �Hst,a is calculated from the slopef the ln(Ce) versus (1/T) plot (Figs. 11 and 12). �Hst,a for Pi sorptionalculated from the figure are: 193.39, 179.14, 153.75, 117.29 and6.75 kJ kg−1 for RHA at qe = 3, 6, 9, 12 and 15 mg g−1, respectively,nd 128.98, 134.04, 125.78, 109.22 and 85.49 kJ kg−1, respectively,t qe = 6, 12, 18, 24 and 30 mg g−1 for that of GAC. Fig. 13 shows thelot of �Hst,a versus qe. It is found that �Hst,a values are positive and
hat �Hst,a decreases as the surface loading increases. The positivealues of �Hst,a confirm the endothermic nature of the adsorp-ion process. The variation in �Hst,a with surface loading can bettributed to the possibility of having lateral interactions betweendsorbed Pi molecules.FG
able 5hermodynamic parameters for the adsorption of Pi onto RHA and GAC
dsorbents �H◦ (J mol−1) �S◦ (J mol−1 K−1) �G◦ (J m
283 K
HA 20.965 0.127 −15.110AC 13.898 0.105 −15.923
ig. 11. Isosters to calculate isosteric heat of adsorption for adsorption of Pi ontoHA.
ig. 12. Isosters to calculate isosteric heat of adsorption for adsorption of Pi ontoAC.
ol−1)
293 K 303 K 313 K 323 K
−16.385 −17.660 −18.935 −20.209−16.977 −18.030 −19.084 −20.138
148 D.H. Lataye et al. / Chemical Engineeri
bHsda0saaR7t6etalHad2tfsdttGms
3
artq1
athsa∼t5Trbttttip∼ea[bciafRae
4
•
•
•
•
•
•
•
Fig. 13. Variation of isosteric heat of adsorption with surface loading.
e regenerated. Several solvents, viz. DDW (varying pH), 0.1N2SO4, 0.1N HNO3 and 0.1N NaOH have been used as the eluents to
tudy the characteristics of Pi desorption from GAC and RHA. Theesorption experiments were carried out by mixing 1 g Pi loadeddsorbent (RHA: qe = 4.74 mg g−1; GAC: qe = 8.82 mg g−1) with.05 dm3 of the chosen solvent at 303 K and agitated in an orbitalhaker for 5 h at 150 rpm. After 5 h, the mixture was centrifugednd the supernatant was analysed for the Pi concentration and themount of desorbed Pi was determined. Desorption efficiency fromHA was found to be ∼72% in water at lower pH, ∼85% in H2SO4,0% in HNO3 and ∼7% in NaOH at 303 K. At 288 K temperature,he desorption efficiencies for these solvents were, respectively,8%, 86%, 78% and 7%. The soil-DDW slurry showed the desorptionfficiency of ∼3% and ∼2% at 303 and 288 K, respectively. It is foundhat the acidic solutions are able to extract Pi from spent RHAppreciably. For Pi loaded GAC, ∼87% Pi was desorbed by water atower pH. About 89% Pi is desorbed in 0.1N H2SO4, ∼83% in 0.1NNO3 and ∼16% in 0.1N NaOH at 303 K and 87%, 89%, 84% and 15%t 288 K, respectively. The soil-distilled water slurry showed theesorption efficiency of about 13 and 9%, respectively, at 303 and88 K. Thus 0.1N H2SO4 can be used to effectively remove Pi fromhe Pi-loaded GAC for the reuse of GAC. Since the leaching of Pirom RHA and GAC with acidic water is possible, it is necessary totore the spent RHA/GAC safely in containers. After dewatering andrying, the RHA can be fired directly into the furnaces/incineratorso recover its residual energy (∼21 MJ kg−1). The spent GAC haso be regenerated and reused. However, the sorption efficiency ofAC is similar to that of RHA and therefore, GAC may not be recom-ended to be used as an adsorbent for Pi removal from aqueous
olution.
.9. Comparative assessment of RHA and GAC as adsorbent
In order to have the comparative assessment of BFA, RHA, GAC
nd the ACs manufactured from coconut shells for the sorptiveemoval of Pi from aqueous solution, it is necessary to comparehe C0/m values of these adsorbents for the comparative C0 ande values. For BFA, the ratio of C0/m was varied between 10 and20 mg g−1 for the C0 range of 50–600 mg g−1. The maximum•
ng Journal 147 (2009) 139–149
dsorptive uptake, qe was ∼60 mg g−1 [5]. Mohan at al. [11] reportedhe removal of Pi from aqueous solution using SAC and ATSAC. Theyave used a very low initial Pi concentration (50 mg dm−3), and con-equently a low adsorbent dosage (2 g dm−3) with C0/m = 25, fordsorption studies. The qe values reported by them were ∼25 and32 mg g−1 by SAC and ATSAC, respectively. In the present study,
he ratio of C0/m was varied between 2.5 and 30 mg g−1 for RHA, andand 60 mg g−1 for that of GAC for the C0 range of 50–600 mg dm−3.he maximum adsorption uptake, qe was ∼15.46 and 36 mg g−1,espectively by RHA and GAC which is about 25% and 60% of thaty BFA [5]. The sorption by RHA and GAC is very fast in comparisono that by SAC and ATSAC. The ultimate removal of Pi in first one hime reported by Mohan et al. [10] is 40–50% and the equilibriumime is 48 h for C0 of 50 mg dm−3. Whereas, in our earlier study [5]he maximum removal is ∼95% and the equilibrium time reporteds 6 h for the adsorption of Pi onto BFA for C0 = 100 mg dm−3. In theresent study the maximum removal in the first one h is ∼90% and85% by RHA and GAC, respectively, for C0 = 100 mg dm−3 and thequilibrium time is 5 h. Thus, the RHA and GAC are superior to SACnd ATSAC in the Pi sorption rate as well as Pi removal. Mohan et al.11] have not reported on the desorption of Pi from activated car-ons and the regeneration of ACs. The activated carbons are quiteostly and, therefore, their regeneration and reuse will be necessaryn the sorption process. In contrast, the RHA is available at a throw-way price and hence can be disposed off as a fuel in the boilerurnaces/incinerators after its use in the sorption of Pi. Thus, theHA becomes a very attractive adsorbent and it can also be used asn alternative to BFA for the removal of Pi from aqueous solutions,ven at very high Pi concentrations.
. Conclusions
The following conclusions can be drawn from the present study:
The RHA and GAC are good adsorbents for the removal of Pi fromaqueous solutions.Adsorption rate is found to be very fast. For C0 = 100 mg dm−3,∼90% and ∼85% Pi removal in t = 60 min contact time atm = 20 g dm−3 for RHA and 10 g dm−3 for GAC, respectively.The adsorption of Pi is found to be maximum in the pH0 range of6-8 (optimum pH0 ∼6.5).The optimum adsorbent dose (m) is found to be 20 and 10 g dm−3,respectively, for RHA and GAC. The maximum uptake of Pi isobserved to be 2.34 and 4.55 mg g−1 at lower concentration(50 mg dm−3) and 15.46 and 36 mg g−1 at higher concentration(600 mg dm−3) at 303 K.The lower value of Chi-square error function for any isothermindicates its adequacy and sufficiency for predicting isothermdata. The Chi-square values were found to be in the order of:Radke–Prausnitz < Toth < Redlich–Peterson < Freundlich < Temkin< Langmuir for Pi adsorption onto RHA; whereas, in theorder of Radke–Prausnitz < Redlich–Peterson < Toth < Freundlich< Langmuir < Temkin for the adsorption of Pi onto GAC.Thermodynamic analysis and the positive values of isosteric heatof adsorption (�Hst,a) indicate that the adsorption process is fea-sible, spontaneous and endothermic in nature. �Hst,a varies withthe surface loading.The uptake of Pi onto GAC is more than that onto RHA owing tothe greater surface area of GAC.
The acidic water can be used as the eluent to regenerate spentadsorbents. However, it is suggested that the spent RHA need notbe regenerated and can be used as a fuel and fired in a furnaceto recover its energy value and dispose off the Pi-loaded spentRHA.
ineeri
A
RIfIh
R
[
[
[[
[
[
[
[
[
[
[
[
[
[
[
[
[
[
[
[
[[
D.H. Lataye et al. / Chemical Eng
cknowledgements
The financial assistance provided by the Ministry of Humanesources Development (MHRD), Govt. of India and the Indian
nstitute of Technology (IIT), Roorkee to Mr. Dilip H. Lataye is grate-ully acknowledged Dr. Lataye also thanks Visvesvaraya Nationalnstitute of Technology, Nagpur (India) for allowing him to pursueis Ph.D. work under QIP at IIT Roorkee.
eferences
[1] F.S. Yates, Pyridine and their benzo derivatives. VI. Applications, in: A.R.Katritzky, C.W. Rees (Eds.), Comprehensive Heterocyclic Chemistry: The Struc-ture, Reaction, Synthesis and Uses of Heterocyclic compounds, vol. 2, PergamanPress, Oxford, 1984, pp. 511–524 (Part 2A).
[2] K. Othmer, Encyclopedia of Chemical Technology, vol. 15, 3rd ed., John Wiley,New York, 1982, pp. 454–480.
[3] R.J.S.R. Lewis, Sax’s Dangerous Properties of Industrial Materials, 11th edition,John Wiley & Sons, New Jersey, 2004, p. 3106.
[4] D.H. Lataye, I.M. Mishra, I.D. Mall, Removal of pyridine from aqueous solutionby adsorption on bagasse fly Ash, Ind. Eng. Chem. Res. 45 (11) (2006) 3934–3943.
[5] D.H. Lataye, I.M. Mishra, I.D. Mall, Adsorption of 2-picoline onto bagasse fly ashfrom aqueous solution, Chem. Eng. J. 138 (2008) 35–46.
[6] G.K. Sims, L.E. Sommers, Biodegradation of pyridine derivatives in soil suspen-sion, Environ. Toxicol. Chem. 5 (1986) 503–510.
[7] V.C. Srivastava, I.D. Mall, I.M. Mishra, Characterization of mesoporous rice huskash (RHA) and adsorption kinetics of metal ions from aqueous solution ontoRHA, J. Hazard. Mater. 134 (1-3) (2006) 257–267.
[8] Q. Feng, Q. Lin, F. Gong, S. Sugita, M. Shoya, Adsorption of lead and mercury byrice husk ash, J. Colloid Interf. Sci. 278 (2004) 1–8.
[9] F. Adam, J.H. Chua, The adsorption of palmytic acid on rice husk ash chemicallymodified with Al (III) ion using the sol–gel technique, J. Colloid Interf. Sci. 280(2004) 55–61.
10] D.H. Lataye, I.M. Mishra, I.D. Mall, Pyridine sorption from aqueous solutionby rice husk ash (RHA) and granular activated carbon (GAC): Parametric,kinetic, equilibrium and thermodynamic aspects, J. Hazard. Mater. 154 (2008)858–870.
11] D. Mohan, K.P. Singh, S. Sinha, D. Gosh, Removal of pyridine derivatives fromaqueous solution by activated carbon developed from agricultural waste mate-rials, Carbon 43 (2005) 1680–1693.
12] T.L. Gilchrist, Heterocyclic Chemistry, Pitmax Press, London, 1985.13] J.B. Weber, Molecular structure and pH effects on the adsorption of 1,3,5-
triazine compounds on montmorillonite clay, Am. Miner. 51 (1966) 1657–1690.
[
[
ng Journal 147 (2009) 139–149 149
14] S. Zhu, P.R.F. Bell, P.F. Greenfield, Adsorption of pyridine onto spent Rundle oilshale in dilute aqueous solution, Water Res. 22 (10) (1988) 1331–1337.
15] M.C. Carlos, Adsorption of organic molecules from aqueous solutions on carbonmaterials, Carbon 42 (2004) 83–94.
16] L.R. Radovic, C. Moreno-Castilla, J. Rivera-Utrilla, Carbon materials as adsor-bents in aqueous solutions, in: L.R. Radovic (Ed.), Chemistry and Physics ofCarbon, vol. 27, Marcel Dekker, New York, 2000.
17] L.R. Radovic, I.F. Silva, J.I. Ume, J.A. Menedez, L.Y. Leon, A.W. Scaroni, Anexperimental and theoretical study of the adsorption of aromatics possessingelectron-withdrawing and electron-donating functional groups by chemicallymodified activated carbons, Carbon 35 (9) (1997) 1339–1348.
18] A. Shukla, Y.H. Zhang, P. Dubey, J.L. Margrave, S.S. Shukla, The role of sawdustin the removal of unwanted materials from water, J. Hazard. Mater. B 95 (1/2)(2002) 137–152.
19] L.J. Yu, S.S. Shukla, K.L. Dorris, A. Shukla, J.L. Margrave, Adsorption of chromiumfrom aqueous solutions by maple sawdust, J. Hazard. Mater. 100 (1–3) (2003)53–63.
20] M. Ozacar, I.A. Sengil, Adsorption of metal complex dyes from aqueous solutionsby pine sawdust, Bioresource Technol. 96 (7) (2005) 791–795.
21] I.D. Mall, V.C. Srivastava, N.K. Agarwal, I.M. Mishra, Removal of congo red fromaqueous solution by bagasse fly ash and activated carbon: kinetic study andequilibrium isotherm analyses, Chemosphere 61 (2005) 492–501.
22] S.P. Mishra, V.K. Singh, Radiotracer technique in adsorption study. II. Adsorptionof barium and strontium ions on hydrous ceric oxide, Appl. Radiat. Isot. 46(1995) 75–81.
23] I. Langmuir, The adsorption of gases on plane surfaces of glass, mica and plat-inum, J. Am. Chem. Soc. 40 (1918) 1361–1403.
24] H.M.F. Freundlich, Over the adsorption in solution, J. Phys. Chem. 57 (1906)385–471.
25] M.I. Temkin, V. Pyzhev, Kinetics of ammonia synthesis on promoted iron cata-lysts, Acta. Physiochim. URSS 12 (1940) 327–356.
26] O. Redlich, D.L. Peterson, A useful adsorption isotherm, J. Phys. Chem. 63 (1959)1024–1026.
27] J. Toth, State equations of the solid gas interface layer, Acta Chem. Acad. Hung.69 (1971) 311–328.
28] C.J. Radke, J.M. Prausnitz, Thermodynamics of multisolute adsorption fromdilute liquid solutions, AIChE J. 18 (1972) 761.
29] J.M. Smith, H.C. Van Ness, Introduction to Chemical Engineering Thermody-namics, 4th ed., McGraw-Hill, Singapore, 1987.
30] M. Suzuki, Adsorption Engineering, Kodansha–Elsevier, Tokyo, 1990.31] A.A. Khan, R.P. Singh, Adsorption thermodynamics of carbofuran on Sn(IV)
arsenosilicate in H+, Na+ and Ca2+ forms, Colloid Surf. 24 (1987) 33.32] V.C. Srivastava, I.D. Mall, I.M. Mishra, Adsorption thermodynamics and isosteric
heat of adsorption of toxic metal ions onto bagasse fly ash (BFA) and rice huskash (RHA), Chem. Eng. J. 132 (1–3) (2007) 267–278.
33] D.M. Yong, A.D. Crowell, Physical Adsorption of Gases, Butterworths, London,1962.