Defense Technical Information Center Compilation Part Notice
Upload
khangminh22Category
view
7download
0
Technical Report 2732.O1/40Prepared for JANAIR
-: •:•S•:• "" Z T
PICTORIAL DISPLAYS FOR FLIGHT ••.•.-/
W. L. CAREL
P •,-...•"•',• ....... ,
DDC.IRA •:
AEPIO•PACE GROUP
IHUGHES :
HUCHES AIRCRAFT COMPAN'f
CULVER CITY. CALIFORNIA DECEMBER 1965
t•ISTRIBUT|ON OF Ttt15 DOCUMI'NT Ia UNI,,IMITI•ID,

BestAvailable
Copy

PICTORIAL DISPLAYS FOR FLIGHT
HUGHES AIRCRAFT COMPANY
CULVER CITY, CALIFORNIA
DISTRIBUTION OF THIS DOCUMENT IS UNLIMITED.
w •
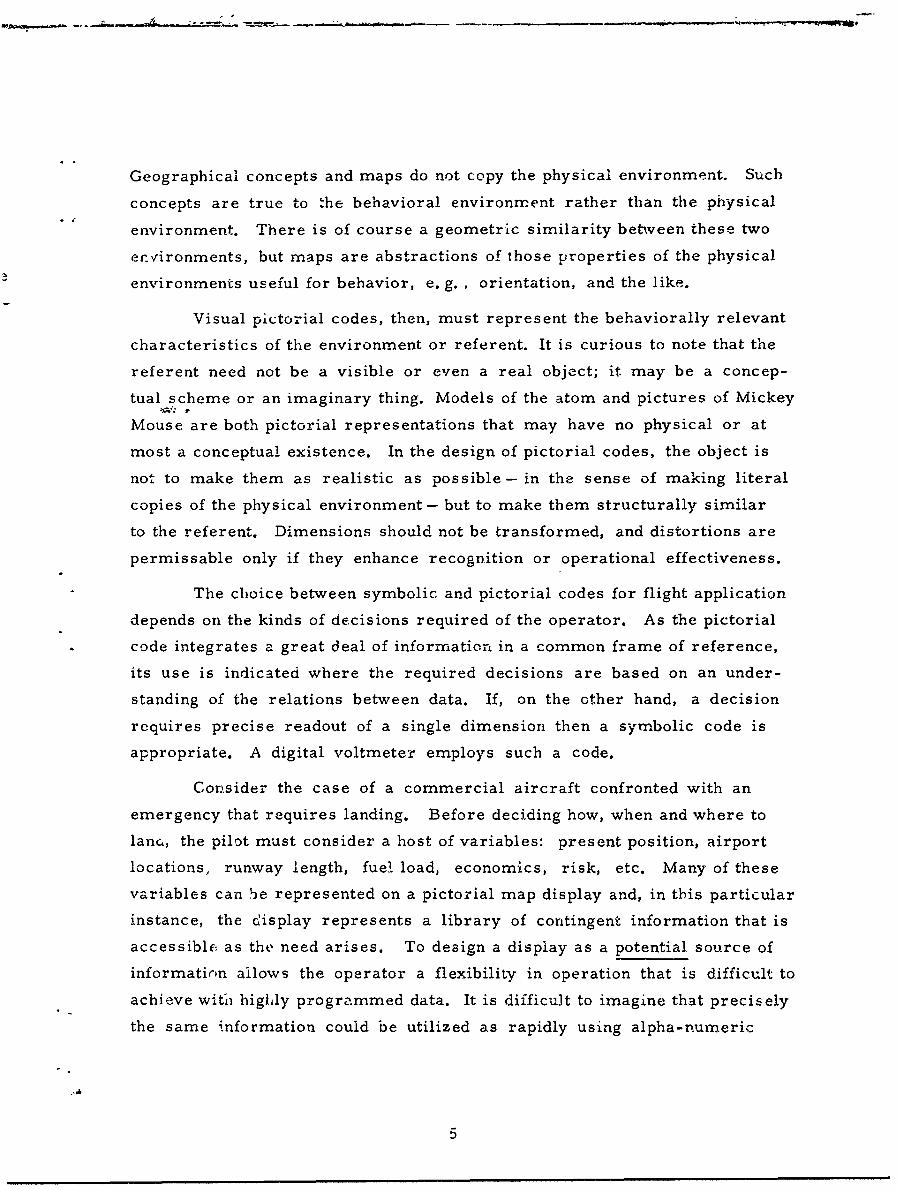
PICTORIAL DISPLAYS
FOR FLIGHT
W. L. CAREL
Prepared for: JANAIR under
Office of Naval ResearchContract NONR 4468(00)
Prepared by:
Research and Development DivisionHughes Aircraft CompanyCulver City, California
December 1965
DISTRIBUTION OF THIS DOCUMENT 1 UNLIMITED.
C

This report presents work vhich was performed under the Joint
Army-Navy Aircraft Instrumentation Research (JANAIR) Project, a research
and d';velopment program directed by the United States Navy, Office of Naval
Research. Special guidance is provided to the program for the Army
Material Command, the Office of Naval Research and the Bureau of Naval
Weapons through an organization known as the JANAIR Committee. The
Committee is currently composed of the following representatives:
U. S. Navy, Office of Naval ResearchCDR. D. Kilpatrick
U. S. Navy, Bureau of Naval WeaponsCDR. W.A. Engdahl
U. S. Army, Material CommandMr. W. C. Robinson
The goals of JANAIR are:
a. The Joint Army-Navy Aircraft Instrumentation Research
(JANAIR) project, is a research project, the objective of
which is to improve the state of the art of piloted aircraft
instrumentation.
b. The JANAIR Project is to be responsive to specific problems
assigned, and shall provide guidance for aircraft instrumentation
research and development programs.
iii

c. The JANAIR Project will conduct •easibility studies and develop
concepts in support of service requirements.
d. These efforts shall result in reports and the knowledge to form
the basis for development of improved instrumentation systems,
components, and subsystems.
iv

ACKNOWLEDGMENTS
Although the author takes responsibility for the contents of this report,
the work accomplished was really conducted by an organization, and several
people were called upon for contributions. Dr. S. N. Roscoe wrote the
sections on the requirements for and display of wire avoidance information.
He also wrote parts of the discussion of HSD functions and the operational
use of map displays. Mr. F. K. Schonlau derived the bulk of the detailed
requirements for the HSD map displays. The discussion of the various
measures of resolution was written by Mr. M. Weihrauch and was based on
earlier work done by Mr. H. L. Mi-Cord. Dr. R. R. Law wrote the section
on display devices. The greater part of the analyses of the sensing and data
processing requirements was written by Mr. C. C. French: Navigation
Updating, Obstacle and Wire Detection, and Velocity Vector Sensing.
Mr. E. P. Hechtman and Mr. S. B. Demkowicz contributed the method for
deriving the command velocity vector. The tedious job of compilation was
r-atien-.y carried out by Mr. F. Rossetti, who also drew the art work. To
all of these contributors the author is grateful.
7

TABLE OF CONTENTS
Page
ACKNOWLEDGMENTS v
FOREWORD 1
PICTORIAL DISPLAYS 3
Definition 3
Pictorial Codes 4
Characteristics of Pictorial Displays 6
DERIVATION OF PILOT DISPLAYS 8
Information Requirements 8
Sample Analysis of Pilot's Task 11
Concept of Pilot Task Heirarchy 14
General Characteristics of Vertical Displays 20
General Characteristics of Horizontal Displays 21
Design Rules for Pictorial Displays 22
VERTICAL SITUATION PICTORIAL DISPLAYS 24
Literal Vertical Situation Displays 25
Analog Vertical Situation Displays 41
Skeletal Vertical Situation Displays 53
Control of Velocity Vector 62
Head-up Displays 63
vi

TABLE OF CONTENTS (Continued)
Page
HORIZONTAL SITUATION PICTORIAL DISPLAYS 70
Display Functions 70
Map Displays 73
Sensor Displays 84
PICTURE QUALITY REQUIREMENTS 103
Brightness and Grey Scale 103
Field Rate 115
Data Rate 120
Measures of Resolution 121
Display Size 136
DISPLAY DEVICES 140
Possible Approaches 140
Preferred Approach 146
Specific Design 148
Areas Requiring Future Work 152
SENSING AND DATA PROCESSING 154
Overview 154
Navigation Updating 163
Obstacle and Wire Detection 178
Velocity Vector Sensing 189
Determination of Command Velocity Vector 095
REFERENCES 203
vii

• .. __.. - - _ . ='-.--- • :- - , •- V=, ' :'••- • •.. . , • •• • - = =•_• • = :•'=-'
FOREWORD
This is the final report of a study to examine the potential of raster
scan pictorial displays for aircraft application. By mutual agreement with
the Office of Naval Research the scope of the effort was restricted to four
mission segments for both normal and steep gradient vehicles for one- or
two-place aircraft. The mission segments are:
1) Take off
" "2) Climb out
3) Point to point navigation
4) Landing
The program was divided into two phases; 1) The analysis of the potential of
pictorial displays and, 2) The definition of the associated sensor and data
processing requirements.
The study was coxducted with no particular avionics system or air-
A• craft in mind with the result that the report that follows deals with generic
problems rather than the tradeoff and design issues specific to a particular
system.
Because this is not an exhaustive review of all possible display tech-
"niques there is. in a report like this, a cachet of approval for the displays
studied even though such displa, a may be cited as mere examples. In this
instance such an approval is explicit -- with the exceptions noted all the
displays studied are believed to have merit. However, the reader should
know that it has been necessary to make value judgments that are not
supported by direct empirical evidence, Every attempt will b,: made to
show what evidence there is to justify or reject such choices, but it must

be acknowledged that the evidence is incomplcte as it always will be.
The design and evaluation of information divplays is, alas, not yet an
exact science.
2

PICTORIAL DISPLAYS
DEFINITION
The color "red" cannot be described; examples of it can only be
pointed to. Many words are of this type - words for which it is difficult to
find a concise and satisfactory denotative definition. "Pictorial" belongs to
this class of words and although the term can be defined to serve the general
meaning, the way in which the term will be used in this report can also
be defined by connotation and illustration - by pointing.
The most comprehensive definition of pictorial as it a_:plies to visual
pictorial codes is that such codes are ways of showing the relations between
a great many variables in a common frame of reference by the topology
or dynamics of the elements displayed. Schematic wiring diagrams are
pictorial codes as is the movie STAGECOACH. The one is abstract and static,
the other literal and dynamic. Most of us dre familiar with static pictorial
codes and the use of such codes enables us to envision how a system works or
what it looks like in Cambodia. We can envision this because the code enables
us to comprehend simultaneously the relationship between a large number of
variables - relationships indicated by the topological arrangement of the
elements comprising the code: to the left of, above, inside, following, in
front of, etc. Visual pictorial codes employing dynamics are less familiar
although complete movies have been made with totally abstract figures where
the meaning of the movie was derived solely from the motions of the figures
in relation to each other. In the laboratory it has been shown that considerable
information of a specific type is transmitted simply by manipulation of the
temporal relations between moving abstract figures. This point has been
belabored because in the utilization of pictorial displays for flight, the
3

importance of display dynamics in the portrayal of dynamic events cannot be
too strongly emphasized.
PICTORIAL CODES
The design of pictorial codes for use in flight has as its object the
creation of the appropriate microcosm in the cockpit. Manufactured informa-
tion sources such as displays are substitutes for the direct sensing of
environmental events, and an objective in the design of such substitutes is to
represent the environmental events so that little or no misinterpretation of
the action environment may be made by the observer. The action environ-
ment comprises those dimensions that affect the decisions required of the
operator. When that environment is represented by a pictorial. code, the
implication is that the observer may easily recognize the referent state or
object when looking at its representation.
A visual pictorial display is the result of the mapping of certain
characteristics of the reference space to the spac.! of the display by a simple
transform. Therefore, such displays usually retain the topological relations
of the reference space or model and the extent to which they maintain precise
geometric congruence - albeit with a change of scale - is the extent to which
the display maintains fidelity. Map displays are projections of certain
characteristics of the earth's surface plus some conventions describable in
the same coordinate system. The contact analog display is the perspective
transform from a three-dimensional model to the display face. Tracking
displays are maps of some selected characteristics of the control system
mapped from the control to the plane of the display. Pictorial means a one-
to-one correspondence between the display and reference domains with no
differential transforms along a given axis.
The.,e are degrees of realism in pictorial representation; a stereo
full color photograph is highly literal whereat, the map is a severe, although
conventional, abstraction.
Most maps do not look like the world we see around us but theydo
look somewhat like the conceptual pictures we carry in our heads for the
perfectly good reason that those concepts were formed by looking at maps.
4
Geographical concepts and maps do not copy the physical environment. Such
concepts are true to the behavioral environment rather than the physical
environment. There is of course a geometric similarity between these two
er.iironments, but maps are abstractions of those properties of the physical
environments useful for behavior, e. g. , orientation, and the like.
Visual pictorial codes, then, must represent the behaviorally relevant
characteristics of the environment or referent. It is curious to note that the
referent need not be a visible or even a real object; it may be a concep-
tual scheme or an imaginary thing. Models of the atom and pictures of Mickey
Mouse are both pictorial representations that may have no physical or at
most a conceptual existence. In the design of pictorial codes, the object is
not to make them as realistic as possible -in the sense of making literal
copies of the physical environment - but to make them structurally similar
to the referent. Dimensions should not be transformed, and distortions are
permissable only if they enhance recognition or operational effectiveness.
The choice between symbolic and pictorial codes for flight application
depends on the kinds of decisions required of the operator. As the pictorial
code integrates a great deal of information in a common frame of reference,
its use is indicated where the required decisions are based on an under-
standing of the relations between data. If, on the other hand, a decision
requires precise readout of a single dimension then a symbolic code is
appropriate. A digital voltmeter employs such a code.
Cornsider the case of a commercial aircraft confronted with an
emergency that requires landing. Before deciding how, when and where to
lanc, the pilot must consider a host of variables: present position, airport
locations, runway length, fuel load, economics, risk, etc. Many of these
variables can be represented on a pictorial map display and, in this particular
instance, the display represents a library of contingent information that is
accessible as tho need arises. To design a display as a potential source of
informatirn allows the operator a flexibility in operation that is difficult to
achieve with highly programmed data. It is difficult to imagine that precisely
the same information could be utilized as rapidly using alpha-numeric
5

displays. A second effect of multiplying information is that the uncertainty
about what is actually happening is reduced, and the likelihood of the oper-
ator selecting the correct action is increased.
CHARACTERISTICS OF PICTORIAL DISPLAYS
Displays that present a L.rge number of variables in a coherent frame
of reference also enhance the ability of the operator to detect a failure or
error in the display system itself. Characteristically, pictorial displays
deal with highly redundant and correlated information, and it is this feature
which permits rapid error detection. In a cockpit with standard flight
instruments, it is sometimes the case that one of the gauges is suspected of
malfunctioning. If the gyro-horizon indicates a left bank and the compass
indicates a turn to the right, the pilot can decide which is correct by con-
sulting other instruments or by estimates of the probable reliability of each
of the candidate culprits. In this sense the instruments are being used not
so much for control as they are for diagnosis. In order to make any sort of
diagnosis, the pilot needs either redundant information or a thorough
knowledge of the reliability of the suspected instruments. That such diagno-
ses present the pilot with a dilemma can be seen from the number of incidents
where an airline pilot will make an unscheduled landing because a warning
light has illuminated, and he has no way of knowing whether the defect lies
in the warning system or the referent system. Because the penalty for a
wrong diagnosis may be fatal, he lands. In integrated displays, the simple
recognition of a discrepancy may be quickly noted. For example, when using
the contact analog display if the bank angle is not corre]ated with turn rate
and direction, this fact is detected immediately. To decide, however,
whether the bank channel or the heading channel is in error depends on
precisely the same kind of redundant information or reliability history that
operates with any instrument system whether symbolic or pictorial. In this
particular instance what the pictorial diLplay promises is rapid erior
detection and ease in correlating similar information.
A general property of pictorial displays is that because they charac-
teristically use many dimensions rather than steps within a dimension to
convey information they take advantage of a human property; a human can
6

process mure information by the addition of perceptual dimensions than by
increasing the discrimability along a dimension. Related to this is the fact
that, because the information portrayed by the dimensions is inherently
related, the observer doesn't have to change "set" when going from one class
of information to another. Because such codes are based on highly developed
population stereotypes or on the psychophysical and ccgn't;ve properties of man,
they are easily learned. In summary, pictorial codes are easily learned,
provide operational flexibility, and enhance failure detection and diagnosis.
7

DERIVATION OF PILOT DISPLAYS
INFORMATION REQUIREMENTS
In order to understand whether or not pictorial displays are applicable
to the problems of flight, one must first create a concept of the pilot's job.
The problem is not usually phrased this way for according to conventional
dogma the way to determine the applicability of pictorial or any other coding
technique for flight operations is to assay the worth of the code against pilot
information requirements. * The information requirements are determined
by examining, in turn, the mission requirements, the system functions, the
crew functions, performance criteria, and the information the crew needs in
order to carry out their assigned functions.
We have cut short this procedural ritual by using representative lists
of pilot information requirements that already exist. Funded analyses to
yield pilot information requirements have been made for many systems over
the course of the past few years, and the outputs of some representative
analyses were examined with the object of determining whether or not a
*In actual avionics systems work the choice of display design characteristicsoften depends not on formal analysis but on:
1) Familiarity with the system - with few exceptions, pilots and ex-pilotsmake the most significant contributions to the design of aircraftinstrument displays.
2) Panel space.3) Engineering feasibility and available hardware.4) User acceptance.
Design is followed up, of course, by iterative evaluations whether they b-paper, simulation, or flight test. It is here that formal error and otherforms of analysis are called for.
8
1.

consensus could be reached on pilot information requirements. Lists which
purport to be pilot information requirements for landing as they appear in
four different reports are shown in Table I. While each of these lists,
admittedly, is derived from analysis of a different system, it can be seen
that there is marked difference of opinion among these exper" authors,
differences revealed not so much by contradiction as by omission of items.
When confronted -,vth four such lists, what does one do ? There is
indeed a minor commonality among these lists, but to extracL these common
elements and use the least common denominator aý the basic items of infor-
mation seems a blind and imprecise procedure. In fact none of these lists,
nor all of them taken together, is an exhaustive statement of the pilot's
information requirements for much of the information the pilot rztquires is
obtained through training and is never explicitly displayed in the cockpit.
The output of most studies of pilot information requirements is not a totai
description of pilot information requirements but is a list of information
presented by current or proposed instruments or a selection of those param-
eters that should be displayed in the cockpit for a given system according to
the judgment of the investigator. The lists shown in the tab. t obviously deal
with partial requirements and are constrained by assumptions about
instrumentation available, the nature of the pilot's task, etc.
One may conclude that lists of pilot information requirements as they
exist are almost useless as a basis for deciding what information to include
in pictorial displays for the pilot. Furthermore it can be argued that even if
the information requirements for the pilot were exhaustively known and the
required performance for each displayed variable specified numerically, a
creative leap is still required to vault the gap between those requirements
and the best way of encoding the information, There is no logical or
necessary connection between these lists of information requirements and
methods of encoding the information.
The main reason that the connection between information requirements
and methods of encoding remains obscure is that the information require-
ments often consist of lists that imply no necessary relation between items
9,

ww!
0z I C <
M' J I. 0
Ff t<<00002 Izi,-
0i i 4 La1- 'i~z':ww
00
P4 O E -C ~ Wz0 0 I- m 0
zX c< w U -U)-ui 0 w
*-A 00 1- U. J w 00
EWcro< W W IOO0. U.
0 iii I- J ooz)Oa 0OOH~~~ I- 40:i 4z z Id j~~"~ J iLWWWWW0Z0Z
0W0ý4 E 0 a ~ ~ N~ W ~ ~ 5. o a m~ (( 0 W 00l
00
0 -W0
a:
0 wz W DOM
H z 00 000 0.
-- w 0-W 0,
rY4j~ I- w 0 Uu uf' i~ U. w z (
0 ~ u 01ox~ 0Ic6J~ W 0 ýM 0
cWZ O 0.~~
.0.0
W < m.
a & M
I 0 0 _. x Wt 0. L. w '- W a. - I < Cc
0(u 0u 0 LL; j -4 F_ I- Zw < MO-'-W7%
_.Y t L UIr z0ýwo 0 L<U10r

of information. In fact such lists discoura.ge the consideration of the
information requirements as an organic system to serve a complex of
necessarily related crew functions.
Sample Analysis of Pilot's Task
An alternzati-vre approach to determine the applicability of pictorial
display is to examine the pilot's job in the context of current or near future
systems. To this end, a partial analysis of the pilot's job in the approach
and landing to a carrier while using a data link was conducted. The mission
segment chosen is schematized in Figure 1. The aircraft starts about 10
miles aft of the carrier, intercepts the ACL gate at about 4 miles, and pro-
ceeds to land on the carrier. The aircraft was presumed to be under data
link control using control messages 4, 5, and 6. In the diagram, aiscrete
messages are shown below the line and control messages above. Although
the sequence of discretes may not be precisely as shown, one may, using
this information, constract a rough diagram which illustrates the tasks of
the pilot as they cluster around use of the data link information. Such a
diagram is shown in Figure 2. It is evident that much of the data link
information the pilot must deal with does not lend itself to pictorial display -
all the discretes are in fact displayed as legends. It is equally apparent that
the pilot is being tightly controlled by the ground through the data link andthat no provision has been made to provide the pilot with position and traffic
information that would enable him to make his own decisions about altitude,2
speed, and the like or would permit him to evaluate the likelihood that the
data link commands are correct.
Although the pilot may not relish working in such an impoverished
information environment, it cannot be denied that pilots may operate success-
fully with such systems for the required information is still in the system
albeit it is now on the ground. In systems employing tight ground control the
need for a complex pictorial display in the cockpit is seldom realized, for
the pilot is relegated to the role of a servomechanism, and in that role he is
"characteristically supplied :nly with lower loop commands. It .s his function
merely to null errors. This philosophy of operafion contradicts what we
11

0Z
iZ4 0
.z 0
~; ~ 0~ 1> 00~z 2
z1- I
4~0Sz-K -4
00z z
0 a
OO 092 0 Z-
8 o- 0 04
00x 0 0
0 0.
z to
ozu -V- '-I- U ~'
z 0-
z~ v z z- 4-
0Z~
z o.2V_ _ _ _ _ _ _
zS
12

ADJUSTS AFC TOMAKE GOODCOMMANDS
LNMOIOSM(ONITS IF. IF:AUS1NG MSEONI:TOS SELECTS , ( MESSAGE CHG ADJ
USIG ELETSPOSITION OR NO.;A
DAIA M•DA CHA14NEL O A%;AL O.SCHAN A;J
DL "ESA"E DISCRETSALIN( NO C
SRECIuESIS FFLIES MANUALLYLANDING TO MAKE GOOD
INSIRCMIONANDS
COftRECTS CHANGE AVOICPOS:TION CHANNEt AIRCRAIF NEEDED , _
AA
ALT D COMPARES
NOTSLTL
____________ NO .0 ANDALTITUCE ERROR -
SPEEDEROPILT PED COMPARES INDI-
SEEN OR•PELCAHEAR) _NOIES AND
A O) SEEDERROR 01_•
DOESMAES C MPS
H GN
O T E S C A L C IHEADING ERROR AND
0
ZMDCOMPARES INDI-
NOTES CAND
R CERROR
Figure 2. R(presentative Pilot Tasks iA.

IF 'rV•• EVTSTO
IF IFADJ C A ALL SELECTS AFCOF CREADY Ok MANUAL
MONITORS AFCI AND LANDS
IF , r ENERTSI MEA19B.LL VISUAL
IF AT : ( 1 XECU_~~ T CMD OR MILE LANDI
EXECUTES CONTROLAVOIDS EXECUTES WAVE-OFF
AIRCRAFT LANDING CHECK SOP
T0OSPN-IO OCOMMANDS
IFNO W.AT EXECUTESSALL AT GO-ARCO
I 4 MILE
TIS CALCULTSSZ ADJUSTSTEE AND DIRECTION THROTTLESERROR OF ERROR
EXAMINES CONSTP'NTS,
CONFLICTING RE )Ui I MINTS,CALCULATrS SIZk AND CORPELAT' PARAMETERS - ADJUSTS
AND DIRECTIONBOTH THOSE I Nv,CA TED ANDSTCERROR OF ERROR THOSE STORED IN HIS (TH!
PILOT'Si HEAD
e TIME PRESSURE. ' LIMITS PROGRAMS TIME
• VEHICLE DYNAMICS HISTORY OF* PRESENT POWER CONTROL ACTION
* PRESENT ALPHAETC
ES CALCULASIZEt ADJUSTSERROR -- ATRIMS OF ERROR
CALCULATES SIZ E,TES -bAND DIRECTION UL ADJUSTSqROR OF ERROR I BRAKE
-J ,
_AIRCRAFTSPtRFORMAN
At Tasks in Landing While Using Data Link
13

between a way of structuring the pilot's job and pictorial displays. This
relationship provides t:he rationale for the choice of pictorial displays and
will be elucidated in the following paragraphs.
With no intcntien of writing a treatise on guidance we shall outline the
broad functions of a veh-icle guidance and control system in order to provide
a starting point for discussion of the pilot's overall guidance and control task.
The development and operational use of a vehicle guidance and control system
implies the following:
1) the selection of a go;,l (for example, a ground target or
destination)
12) the measurement of the position of the vehicle relative to the goal
3) the selection of a path to the goal consistent with vehicle
constraints
4) the measurement of path error or the computation of predicted
error at the terminal goal given present performance
5) the selection and use of sensing and control mechanisms to
physically realS.ze a control law and thus reduce the error or
make good the path
6) the selection of components for the synthesis of the sensing and
control mechanisms
7) the selection of material for the required components
In completely automatic vehicle systems, all of these steps are
carried out either directly or implicitly by the design team. In symbiotic
systems containing men and machines, some of these steps are left to the
operational crew. The type of information and displays needed by the crew
will depend heavily, of course, on which of these functions they carry out.
In primitive aircraft the designer implemented step 7 and parts of
steps 5 and 6. The pilot was coupled to the air foils by a simple linkage,
and he acted as the primary sensing, measuring, computing, and control
power device. The end goal may have been selected by his superiors, but
15

the pilot did all else. In those early aircraft the instrumentation was simole-
the pilot obtained much of his information from the outside world. As air-
craft became more sophisticated and their missions more demanding, the
pilot had to depend more and more on artificial devices for sensing, control,
and the display of information about aircraft performance but even in modern
aircraft the pilot has to translate the long term goal objectives which at'e
typically expressed in terms of time and space into instantaneous objectives
for each individual instrument which are typically needle positions. hi
order to relate the space-time requirements of the eventual goal to each ef
these instrument sub-goals he must understand completely the dynamic
relations between aircraft performance, instrument respon- 3, and control
action.
The linking of the chain of mental and motor events that enables the
pilot to select an appropriate control act in order to bring the aircraft cioser
to the final goal constitutes the overall task of the pilot, and it is the discovery
and mastery of the relationships between subtasks within this chain that makes
flight both interesting and difficult. To make the relationship between thesre
subtasks more explicit should be the intent of any sophisticated display
system, and in order to do this the relationships among these tasks must be
teased out.
For the pilot, the major task clusters within the overall task deal
with four general questions.
1) where in the world am I with respect to my end goal?
2) what is and what should be my velocity vector-?
3) what is and should be my attitude and/or angle of attack?
4) what should I do with the controls?
These questions constitute categories of information, and for each "f these
categories there is a desirable state of affairs at some particular time,
i. e: there are goals for each of these categories. In principle the pilot could
be commanded directly with respect to each of these goals separately. By
way of audio or visual displays he could have his terminal goal defined for
16

hini, be told what path to take, what attitude to assume, or be informed how,
when, ana where to move the control stick.
The categories however are not independent but are inherently
related because of the way the aircraft operates. They are in fact related
in a hierarchical fashion and the pilot's overall job is therefore comprised
of a hierarchical series of tasks in which he is required to realize a goal at
one level of the hierarchy by programming a set of sub-goals for the task at
the next subordinate level in the hierarchy. Figure 3 is a diagram. illustrating
this concept and is intended to show that the pilot's taskb are interrelated in-'
a hierarchical fashion and that the higher order loops impose a forcing
function on the subordinate loops. Each of these loops can be considered as
a closed loop system, and all too often only the closed loop aspect of the
pilot's job for each loop taken separately is considered. The consequence is
that we have tracking displays that deal with loop 4, attitude displays that*y deal with loop 3, navigation displays that deal with loop 2, etc. The facts - that the information required in adjacent loops is related is seldom taken
into account in display design, and the way the subordinate variables affect
the attainment of the next superior set of goals is not often displayed.
The operational disadvantage of considering each of these loops
separately is that such a procedure may not take advantage of the flexibility
and adaptability of the human crew. In general man's behavior is goal
directed, and he will adopt any of a number of paths to reach a goal. Systems
that exhibit a fixed goal or constant output through adaptation are called self-
regulating, homeostatic, etc. The hallmark of such systems is the adaptation
of the system to changing conditions to achieve a steady state or reach a
criterion objective.
When using the tools and implements he invents, man continues to
exhibit adaptable and goal-directed behavior. At times, to reach highly
desirable goals, he surpasses the intentions of the tool designer. He may
use a screw driver to open a bee" can. Tools - and aircraft systems are
tools - can be thought of as simply extensions of the man's body anri intellect:
as amplifiers for his physical strength, sensory range, or data processing
17

EVIRONMENTAL AND
TACTICAL OTHER CONSIDERATIONS
CO.$SIDERAT:ONS 0 *EATHER
"* TERRAIN
"* OEFEtNSES
"* PERFORMANCE LIM;TS
P R O G A M SL O O P
COORDINATESTIME
WITH PROGRAMSDES!RED
NORT POSSUSGOAL NO I IAIRCRAFT PATH
F u 3.T Pil NORTH POSITION HEAST POSITION A' TIME T
TIMEPOSHEIGHT POSITION
ACTUAL PILOTWITH PROGRAMS
DESIREDSLOOP3
N2 VELOC ITY, VECTOR, THR
Sa ,THRt;",T , ,., THRUST, LIFT
•JLOOP 4
AIRCRAFT SURFACESDYNA"MICS H AND ENGINE FORCE, POSITION
Figure 3. Pilot Task Hierarchy
18

capability. A man-machine complex, then, will exhibit the same behavioral
properties as man; that is, goal direction and path alternation. Of course,
this will only apply in systems where there is more than one way of achieving
the goal. If the possibility of alternate solutions does jot exist because there
is a unique solution, then the addition of man to the system will yield no
benefit with regard to adaptability.
Even if each loop is displayed separately the pilot will exhibit the
human property of adaptability. Each such individual display may define a
sub-goal for the pilot but the adaptability he exhibits will only be that
necessary to reach the particular sub-goal represented in the display.
Taken separately the display of each of these types of information
alone will have certain operational and procedural consequences. With a
steering signal display the only decision the pilot has to make is where,
when, and how to move the control. The only adaptability he may show is to
adopt a transfer function to minimize his mean square tracking error, and
so forth. If one relied on a steering signal display alone one could accept
a very low skill level for with a properly designed tracking display employing
quickening, highly precise correct control responses can be learned by a
naive operator in a matter of minutes. Of course, such a display taken alone
leads to cognitive blindness in the sense that the operator has no idea what
the aircraft is doing.
A map display showing the terminal goal is more like a potential
source of information where the informatio.-i extracted will depend on the
operational demands. The proper use of these displays demands a greater
range of intellectual skills, but the consequence is a greater potential for
adaptable behavior with the characteristic opp4.rtunity for great brilliance
or alarming stupidity.
The kinds of pilot behavior demanded by each of these loops also
differs markedly. It can be seen that as one progresses down the hierarchical
structure, the pilot tasks require increasing degrees of psycho-motor
involvement. The pilot decisions based on the map display at the highest
19
K
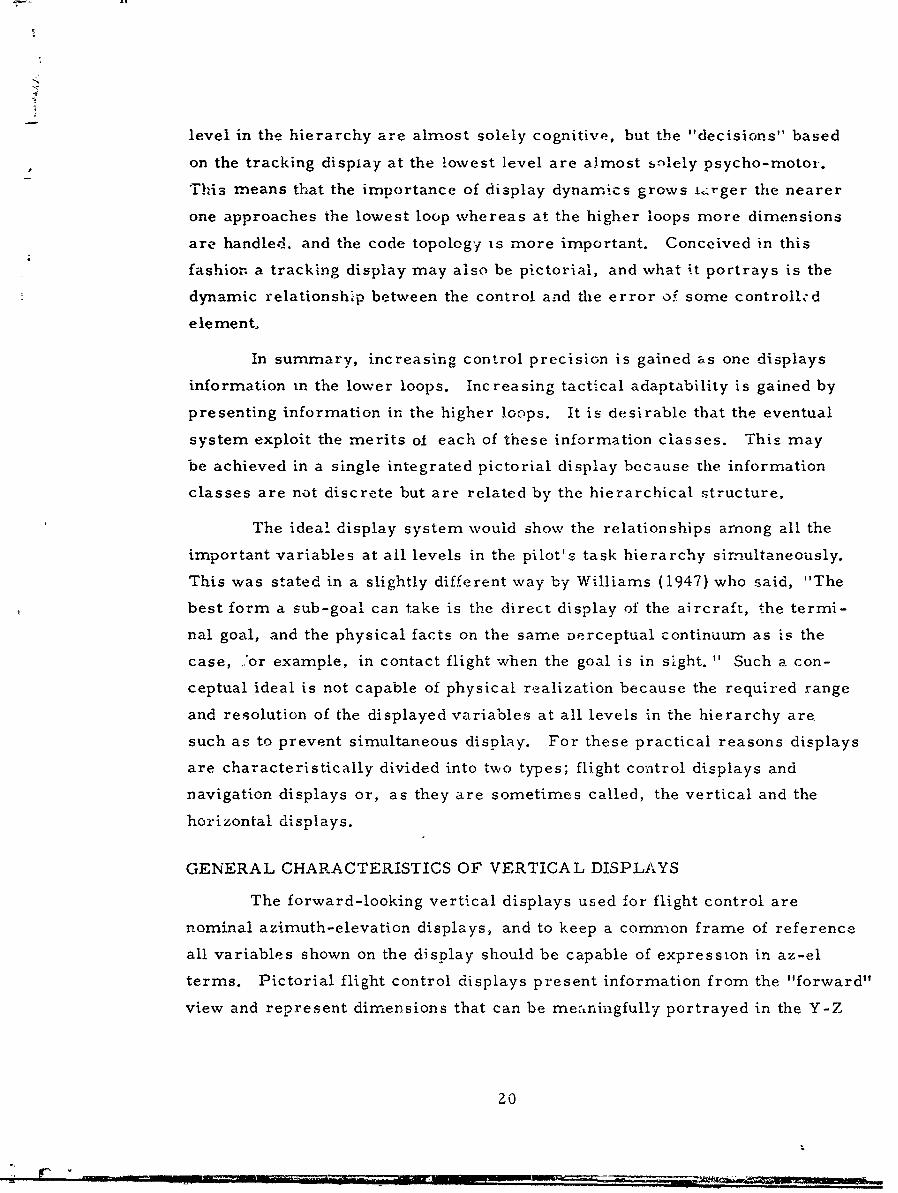
level in the hierarchy are almost solely cognitive, but the "decisions" based
on the tracking display at the lowest level are almost s.1lely psycho-motor.
This means that the importance of display dynamics grows L:rger the nearer
one approaches the lowest loop whereas at the higher loops more dimensions
are handled, and the code topology is more important. Conceived in this
fashion a tracking display may also be pictorial, and what it portrays is the
dynamic relationship between the control and the error of some controlhcd
element,
In summary, increasing control precision is gained as one displays
information in the lower loops. Increasing tactical adaptability is gained by
presenting information in the higher loops. It is desirable that the eventual
system exploit the merits of each of these information classes. This may
be achieved in a single integrated pictorial display because the information
classes are not discrete but are related by the hierarchical structure,
The ideal display system would show the relationships among all the
important variables at all levels in the pilot's task hierarchy simultaneously.
This was stated in a slightly different way by Williams (1947) who said, "The
best form a sub-goal can take is the direct display of the aircraft, the termi-
nal goal, and the physical facts on the same Derceptual continuum as is the
case, .or example, in contact flight when the goal is in sight. " Such a con-
ceptual ideal is not capable of physical realization because the required range
and resolution of the displayed variables at all levels in the hierarchy are
such as to prevent simultaneous display. For these practical reasons displays
are characteristically divided into two types; flight control displays and
navigation displays or, as they are sometimes called, the vertical and the
horizontal displays.
GENERAL CHARACTERISTICS OF VERTICAL DISPLAYS
The forward-looking vertical displays used for flight control are
nominal azimuth-elevation displays, and to keep a common frame of reference
all variables shown on the display should be capable of expression in az-el
terms. Pictorial flight control displays present information from the "forward"
view and represent dimensions that can be meaningfully portrayed in the Y-Z
20
r . .• - -- • .u " •. n • 'd,-,,,m• • _-... •'-...• •..-. . . .

plane of the aircraft: pitch, roll, heading, angle of attack, glide slope error,
carrier az-el, steering error, and the like. They are commonly called
vertical situation displays (VSD) but usually deal with problems of flight
control.
Because such displays are concerned heavily with tracking behavior
the important variables are, in addition to content and symbology, element
dynamics and sensitivity. The use of quickening and short-term prediction
is thereby indicated.
One might call the information displayed thereon information about
the present space, for the display will represent objects that are local and
parameters that change rapidly with time. It will be design policy to represent
as many levels of the pilot's task hierarchy as possible without destroying
comprehension or simple legibility. For this reason, wherever possible the
display will represent simultaneously the terminal goal, the path to the goal,
aircraft attitude and flight path information, and steering commands.
A display based on this design policy will allow the pilot either to
direct or monitor the activities of the system as parameters low in the
hierarchy are controlled in terms of the progress being made towards goals
specified in the higher order loops. Wherever possible and useful, prediction
of the consequence of lower loop behavior in terms of attainment of higher
order goals will be displayed. Most of the pilot's training is concerned with
learning how to make such predictions, and if they could be made explicit on
the display, the difficulties of flight would certainly be reduced. Thus, the
flight path in the contact analog display which is normally conceived as a
command path could equally well be used as an indicator of predicted flight
path so that if the terminal goal is represented - an airstrip - the flight path
used as a predictor would show the consequence of control action in terms of
interception of the airstrip.
GENERAL CHARACTERISTICS OF HORIZONTAL DISPLAYS
The downward-looking horizontal displays are usually plan position
indicators at a scale useful for navigation or geographic orientation. Here
21

again the rule is to maintain a consistent frame of reference and at the same
time represent as many levels in the pilot's task hierarchy as may be com-
patible without confusion. To represent the required information pictorially
implies only that the topology that obtains in the real world (or sometimes
the conceptual world) is maintained in the display.
The increasing use of the highly versatile cathode ray tube in the
cockpit permits the use of the HSD for many tases other than navigation during
different phases of the mission. This display can be used to show raw radar
data, IR data, a picture or a map, a variety of symbols, a set of verbal
instructions, or a mixture of several types of information depending on the
particular mission phase.
DESIGN RULES FOR PICTORIAL DISPLAYS
Integrated displays imply merely that all display elements answer to
the same laws and follow the same rules. More iZ implied in pictorial dis-
plays: elements not only follow the same rules but the information displayed
must necessarily have a spatial character. While it is true that "pictorial"
in the larger sense connotes a sensory similarity between an event and its
representation -- the sound of a phonograph recording is a "pictorial display"
of an acoustic event -- the discussion in this report refers only to visual
representations. The design of pictorial displays for flight then, must be
bounded by representations of the spatial parameters important for the
hierarchical tasks of flight.
Whether topological or dynamic relations are portrayed, the trick in
the design of visual pictorial codes is to remove unnecessary visual structure
by "skeletonizing" the information using abstraction but not delete so much
visual articulation that the relationship between displayed elements is obscure.
The natural physical world is very "noisy" in terms of information useful for
any given task, and the display designer attempts to remove the noise without
removing the signal. For predominantly topological displays this means
altering the content, number of dimensionq, or steps within a dimension.
For dynamic displays it means altering the time characteristics and scale of
the movement relations between control and the display of controlled element
error.
22

These two notions, the notion of a task hierarchy and the notion of
spatial pictorial represetntations, constitute the grounds for conceiving and
selecting those displays having to do with flight control and navigation.
23
VER rICAL SITUATION PICTORIAL DISPLAYS
The candidate vertical pictorial displays -- those that use an azimuth-
elevation coordinate system - -- fall on a continuum of liter•Iness. We have
isolated three classes along this continuum, have named them arbitrarily,
and can illustrate them best by example. Type I displays may be called lit-
eral and are exemplified by ordinary closed loop T. V. systems. The displays
are literal pictures of the real world, albeit they may lack color and binocular
visual cues. Type II displays are analog displays like those generated by the
Norden and General Electric "contact analog" computers. They are accurate
perspective pictures of a three dimensional model, and the dynamic response
of the pictured elements is analogous to that which obtains in the visual world
of contact flight. Type III displays are skeletal like those used by Sperry in
their head-up displays. The display is still pictorial but the content is nlini-
mal and made up of fragments, e. g. , the horizon line, a representation of
the runway, etc.
These three types of displays may all be called pictorial on two
grounds. First, geometric similarity between the elements in the display
and the structure of the contact visual environment. Second, the motion of
the displayed elements is similar to that of their real world correlates.
These types differ in the amount of visual realism they contain with the
literal display at onc end of the continuum and the skeletal at the other. All
have been proposed as £Iight displays for landing operations; all are in vari-
ous stages of development; n.one is in operational aircraft.
24

THE LITERAL VERTICAL SITUATION DISPLAY
Consider a vertical, pictorial, raster scan display to be used for
approach and landing. The advantage of the raster scan CRT display is that
one can paint many symbols upon it and not be held to the few elemental
lines, pointers, and indices characteristic of conventional instruments.
For landing, a presumed advantage of this pictorial raster display is that
the landing strip or pad can be shown in an easily comprehended relation-
ship to other significant features. When mixed with other more conventional
symbols such an arrangement affords the pilot the opportvunity cf cross-
checking instantaneous control commands or ,osition errors with reference,
for example, to a glide slope in terms of the tcrminal goal of the aircraft.
The conditions under which a raster display might show, to advantage will be
the goal of this analysis. We shall deal first with the potential of a literal
display.
Experimental Evaluation of Periscope Displays
The most literal displays that have been tried for landing are those
obtained by periscope. Two separate studies are reported in the literature:
Roscoe (1952); Campbell (1955). The study of Roscoe was one in a se-ies of
experiments using a projection periscope mounted in a Cessna T-50. The
periscope was pointed dead ahead (a vertical display). What the pilot saw was
the forward view on an 8-inch square ground glass screen. At the eye the
screen subtended a monocular visual angle of 30 degrees. A series of
lenses allowed the experimenter to change the outside angle represented to
15, 25, or 35 degrees which correspond to magnifications of 2.00, 1.20, and
0. 86. It was concluded that pilots could land using such a device if design
parameters were correctly chosen. Of interest to this dizcussion is a quota-
tion from Roscoe*
"While safe take-offs and landings were made by periscope
under all experimental conditions, the accuracy of the land-
ings both in terms of constant and variable errors, was
significantly influenced by the image miagnification being
employed. The mean point of touchdown for periscope landings
25
.1

t7A'A "4 Z&A00
was found to be an inverse linear function of image magnifi-
cation, the optimal magnification being the one that resulted
in the correct apparent distance of objects viewed through
the periscope. Variable errors in point of touchdown, as
well as constant errors, were increased as a result of depar-
tures in either direction from this optimum magnification
factor."
The optimum magnification tested by Roscoe was 1. 2. An example of
the data obtained in Roscoe's study are shown in Figures 4 and 5. The data
show that, with respect to variability, periscope performance was equiva-
lent to contact landing at the end of the experimental series. This suggests
that the subjects had just learned to respond to some invariant property of
the display in a consistent way by the end of the experiment. Hdd the experi-
ment continued, the pilot probably could have adapted to the distorted worlds
of magnification 0.86 and 2.00 and removed the bias so that their mean error
would approximate that of contact landing. How long this process would take
is unknown and of course it would be hindered each time the pilot made a
landing with normal contact vision. We have placed emphasis on the implica-
tions of this study because it deals with magnification and magnification is a
display characteristic that will differentially affect the optimum design of the
three types of pictorial displays; literal, analog, and skeletal. Our premise
is that the mors realism in the display the more one must recommend a mag-
nification close to unity, or more precisely, 1. 2.
In a similar study using a highly realistic literal display, Campbell,
et al mounted a binocular periscope for a prone pilot in a B-17 and investi-
gated pilot performance during approach and landing. The outside world was
viewed directly, as in binoculars, instead of being projected on a viewing
screen as in Roscoe's study. The authors conclude that approach and land-
ing may be accomplished using such a device even though the number of
touchdowns attempted by the experimental subjects were few. This pilot
conservatism was attributed to t1eir lack of expe.ience with and confidence
in the unfamiliar periscope system. Of interest is the fact that the field of
view was 70 degrees on all axes and even this was considered too small to
26

1o00500 - CONDITION A: MAG 0.86
CONDITION B: MAG 120
LANDING LANDING"0IOt ....
SPOT"
-50 -
-100
CONDITION C MAG 2.00
-2001- M tl1-iO M tII- 20
MEAN POINT OF TOUCHDOWN MEAN POINT OF TOUCHDOWNFOR FIRST TEN LANDING TRIALS FOR SECOND TEN LANDINGIN EACH CONDITION BY ALL TRIALS IN EACH CONDITIONSUBJECTS BY ALL SUBJECTS
Figure 4. Pilot Performance With Periscope, Average
CONDITION A- iMAGE MAGNIFICATION = 0 86W .... CONDITION B. IMAGE MAGNIFICATION z I 20"" T N N C B CONDITION C IMAGE MAGNIFICATION = 2 0014. ------ , CONTACT CONDITION CONTACT VISIBILITY
z 200W
4 I0 'N.....
100 LEVEL OF BEST PERFORMANCE WITH CONTACX,•" VISIBILITY I
tmO I--
BLOCK OF FIVE TRIALS
Figure 5. Pilot Performance with Periscope, "Variability
27 :

adequately fly the then existing traffic pattern. There was also general
agreement that with a one power magnification, the apparent m-gnification is
0. 8 if the scan is centered about the flight axis. In other words, to make
things look normal a magnification of about 1.2 is required - a finding simi-
lar to that reported in Roscoe's study.
Experimental Evaluation of Television Displays
A .lightly less realistic display was tested by Bell Helicopter Co.
(Elam, 1964) as part of the JANAIR effort. A closed loop TV system wa
installed in a helicopter. The system was such that the lens covered an out-
side angle of 22 by 2-8 degrees that was displayed on a 5. 25 by 7. 25 inch dis-
play. The format of the camera vidicon was apparently different from the
format of the display tube so that under the study conditions the magnifica-
tions were 1.27 horizontally and 1.37 vertically.
In addition to the TV monitor the subject pilot could use thc radio alti-
meter, an airspeed indicator, and a rotor RPM indicator. The TV camera
was mounted either on the sKids or at eye level and could be slewed or ren-
dered immobile. The results for the tested flight phases ".s as follows.
Take Off: There was no appreciable difference between performance
using the TV and performance under VFR. There also was nc marked
difference due to camera mounting or mobility.
Low Level Cross Country: Three sets of insLru-tions were used.
For VFR the pilots were asked to fly as fast and low as possible, for one of
the TV flights to hold airspeed at 60 knots and fly as low as possible, for the
other TV flight to hold absolute altitude at 300 feet and fly as fast as possible,
The performance under the threr. sets of rules is summarized in Table II.
It should be remembered however that there was always a check
pilot aboard who was VFR, The numbers might be slightly different if the
situation were operational and the pilot were solely dependent on the dis-
played information.
28
tiiVi

TABLE IH. MEAN AIRSPEED AND ALTITUDE FOR EACH FLIGHTOF THE CROSS-COUNTRY LOW ALTI•TLUDE MANEUVERS
TV TVVFR Constant Alt. Constant A/S
Variable A, S Variable Alt.
Subject A] titude 140 318 232fI
Airspeed 64 68 60
Subject Altitude 126 306 216
Airspeed 72 65 58
Hover: Performance with the various displays when attempting to
hover is shown in Table III.
TABLE Ill. MEAN ABSOLUTE ERRORS FOR THE DIFFERENTMEASUREMENTS OBTAINED FOR HOVERING OPERATIONS
Condition Fore/aft, Left/right, Altitude, HeadingI Feet Feet Feet Degree
VFR 2.53 1.60 1.7 1. 1
Eye level - mobile 7. 12 2.. 00 1.1 2.0
Eye level - immobile 6.90 2.22 1. 9 1.7
Skid level - mobile 7.08 2.15 2.1 2.2
Skid level - immobile 7.98 2.71 J 1.7 1.0
There were no differences between any of the TV treatments, but
there is a marked and significant difference between TV and VFR in fore/aft
displacement errors. Otherwise there is little difference between TV and
VFR.
Landing: Altitude and airspeed performances comparing TV with
VFR are shown in Figures 6 and 7. Using the TV, the pilot has a tendency
to "sneak up" on the landing pad and sort of feel his way down. This techni-
que may be simply due to the field of view of the TV which is such that if a
large flare is used the ground disappears. The position error at touchdown
was also recorded. With TV the mean lateral error was 12. 8 feet aild the
29

O.-.O-O TVP FLIGHT PATHN.-- O--o FIGHT PAGTHPT
DISTANCE LANDINGSITE
Figure 6. Schematic Representation of Typical Landing Patternfor VFR and TV Viewing Conditions
- SPEZIFIED AIRSPEED
VFR AIRSPEED
~ 0 0TTV AIRSPEED
DITNE ADNSIT
Fiue7 ceaicRpeetto f eaieArpe
DuigLnig o VadVRCniin
h30

mean fore-aft error was 39. 4 feet. No measurements were made for the
VFR flights but these can be considcred as being negligible.
The study showed that the helicopter can be landed in a restricted
area using the TV as a primary instrument if conditions are highly favorable.
This means little or no crosswind and an approach to the pad that is obstacle
free.
The authors of the study interestingly suggest that the contact analog
affords better control than TV for landing but, of course, the displayed TV
data is highly reliable. They conclude that, "The best: answer seems to lie
in a synthesis of the two systems. The TV is best for validating and updating
the contact analog. The latter display will give the pilot something that is
easy to respond to. "
In a similar study Kibort and Drinkwater (1964) used an R4D (DC3)
aircraft fitted with a closed circuit TV to test the effectiveness of the TV
display for the final phase of landing. A turreted camera was mounted on
the itose of the aircraft and an additional camera just forward of the tail
wheel. The output of the tail camera or the nose camera with any of the
three lenses could be fed to a 17-inch monitor (14-inch width) that was
mounted to subtend about 16 to 17 degrees at the pilot's eye. The fields of
view and magnifications corresponding to the tested conditions are shown
in Table IV. A.11 flights were scheduled in clear weather when the wind was
between 0 to 15 knots. "The safety pilot flew the aircraft until it was aligned
with the runway on a 3 degree glide path (using the visual mirror glide path
system) 2 to 3 miles from the runway threshold. Control was then given to
the subject pilot who continued the landing approach through the touchdown
phase and rollout. "
Results are shown in Table IV. There werE no significant differences
among conditions with respect to contact g. The standard deviation touch-
down error scores for TV were all significantly diffcrent from normal flight,ING at the 2 percent confidence level. "Analysis of the mean touchdown error
("T" test) indicated a significant difference between aMl the TV type landings
and the normal visual approach."
31
W_ _MT ____ k

TABLE IV: PERFORMANCE WITH TV DURING LANDING
Approx:- I Imate Standard Absolute IField Dew, ation Average (Mean) Standard[ Number
Of View. Magnification Touchdown TTouchdown Deviaion.[ Mean of AbortedDisplay Degree Factor Error, Ft. Error. Ft. Error. Ft. Contact g Contact g Landings
Normal 373 -90 1 270 0. 1-9 0.339 43 0
4 inch 18 - 35 426 -132 284 0.141 0.341 4Z 0Aperture 0
Nose TV 48 0. 34 479 159 395 0.175 0.378 431Z mm
Nose TV 23 0.73 652 59 518 0.205 I 0.396 41 425 inm I I I
Nose TV 11 1.,5 726 -126 542 0.130 0.326 337 050 mmn _
Tail TV 48 0.34 764 270 607 0.159 ).324 38 11Z m I
i_ 1 1
1 1
In the approach phase the authors state that the pAot needs airspeed
information when flying normal contact, airspeed and rate of 'zlirnb with the
4-inch aperture, and airspeed, rate of climb, and altitude with the TV dis-
plays. They also conclude that magnification is one of the most important
variables and that high magnification is desirable because it results in
increased display gain. This view t.hould however be tempered with judgment
for during flare and touchdown using the telephoto lens the field of view was
so narrow that at times the runway was lost due to cross winds.
The authors implication is that TV displays may prove highly useful
for landing provided the system is carefully designed, provided height and
height rate information is added, and provided the pilot is afforded sufficient
practice with such novelties, The authors suggest that a possible idealized
display would have an acceptance angle of at least 45 degrees with height,
height rate, and displacement information superimposed along with a gain
similar to that obtained with the telephoto lens (1.55 magnification ratio).
Unfortunately these idealized requirements yield a display that, if viewed
from 18 inches, would be about 30 inches across.
In all of these studies the issue of magnification is paramouit.
Apropos of the general problem of magnification one might consider what is
predicted from perceptual theory. For purposes of this discussion et
3
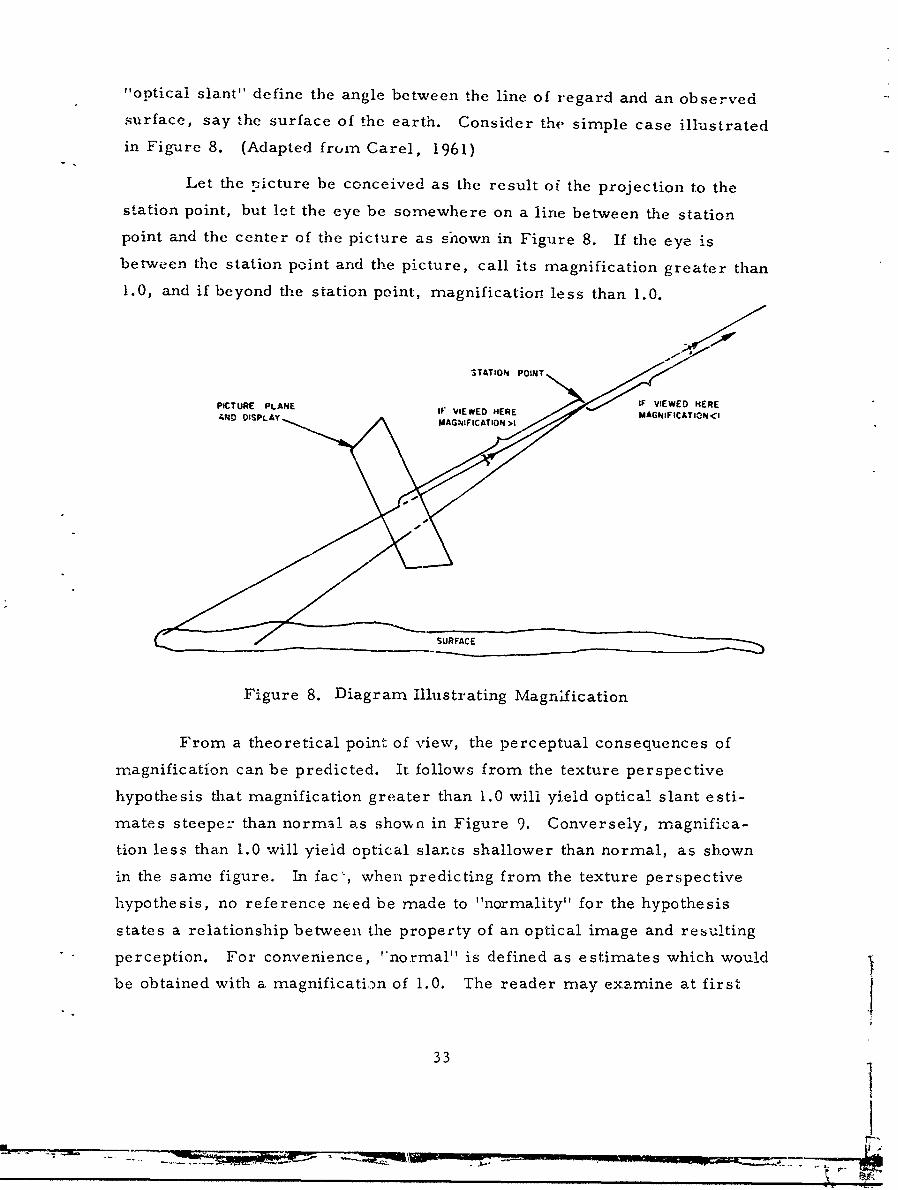
"optical slant" define the angle between the line of regard and an observed
surface, say the surface of the earth. Consider the simple case illustrated
in Figure 8. (Adapted from Carel, 1961)
Let the picture be conceived as the result o[ the projection to the
station point, but lct the eye be somewhere on a line between the station
point and the center of the picture as shown in Figure 8. If the eye is
between the station point and the picture, call its magnification greater than
1.0, and if beyond the station point, magnification less than 1.0.
STATION POINT •
IF VIEWED HERE
PICTURE PLANE IF VIEWED HERE MAGNIFICATION<1AND DISPLAY MAGNIFICATION >1
SURFACE
Figure 8. Diagram Illustrating Magnification
From a theoretical point of view, the perceptual consequences of
magnification can be predicted. It follows from the texture perspective
hypothesis that magnification greater than 1.0 will yield optical slant esti-
mates steeper than normal as shown in Figure 9. Conversely, magnifica-
tion less than 1.0 will yield optical slanrts shallower than normal, as shown
in the same figure. In fac', when predicting from the texture perspective
hypothesis, no reference need be made to "normality" for the hypothesis
states a relationship between the property of an optical image and resulting
perception. For convenience, "normal" is defined as estimates which would
be obtained with a magnification of 1.0. The reader may examine at first'
33
,.I,,,.,.,q

hand some of the effects of magnification by locking through the right and
wronf ends of binoculars.
80 " i __'
70
.4 /M:2 0
u,50
W
-M-10
CL
30
h 40 0___
2-
0oO 20 30 40 511 60 70 80 so
ACTUAL SLANT (dogr~es)
Figure 9. Relation between Physical and Predicted PerceptualSlant with Magnification as a Parameter (Individual
Subject's Constant. E-'ror Must 'c,e Added)
3
!hi
•--j

Magnification also has some qualitative effects on the impression of
the ride of the vehicle. With compression (magnification less than 1. 0) the
ride appears very silky and sm.nooth. If a 3. 1 compression, i. e. , magnifica-
tion 0.33, is represented as
then unit magnification, 1.0, might be represented as
and magniiication of 3.0 as
Therefore a discrepancy may arise between the "g" profile and the
"visual" profile. For other than unit magnification this could make the pilot
som,,what uncomfortable. There is some evidence that a conflict of informa-
tion ½rom the visual and postural senses makes people sick.
35
* W- _

The entire theoretical argument is based on the supposition that the
display medium itself is unobtrusive. The attempt to make the display
screen itself "invisible" is much sought after in the mrovi', industry where
the intent is to have the observer pay attention to the image on the screen,
not the screen itself. Practically, however, it is likely that the eye will be
accommodated to the focus of the display medium, for the plane of the dis-
playitself maybe perfectly visible. The perceptual effects of this fact coupled
with the presumed effects of magnification are difficult to predict. The
issue has not been settled experimentally and the matter stands unresolved.
Some Requirements for Literal Displays
The conclusiom, drawn fronm the above cited empirical studies may be
used to aid in establishing the limits of a literal display for landing. Froin
the foregoing studies we know that in a literal display there is increasing
hazard in departing from a magnification factor of 1. 2. If this value is
accepted then the appropriate size of the display may be determined by
analysis. In general it is desirable that the pilot see where he is going - not
where the aircraft is pointed but where it is going. For fixed wing aircraft
the incongruenc3 between the a.rcraft longitudinal axis and its velocity vector
relative to the ground is dete;-mined by wind and angle of attack. During
landing either drift angle or angle of attack may be larger depending on
conditions and type of aircraft. In either case these angles may vary from
a few degrees to larger than twelve degrees. For high performance single
or dual place aircraft the angle of atta-k in approach and landing will usually
exceed the lateral drift angle. This flight characteristic then should be used
as the basis for establishing minimum display size for this type aircraft. In
the elevation dimension the general rule for the size of the literal display may
be calculated from the relation:
S = d tan (aL + 30)
where
S 1/2 display height
36
r~V

d = viewing distance
a L = maximum angle o1 attack during landing
30 = constant to assure visibility of this amount around the velocity
vector.
The assumptions buried in this simple calculation are that the horizon
null is at display center when aircraft pitch equals 0 degrees and that unit
magnification is used. One must multiply by whatever magnification factor
is desired. For example, with a display viewing distance ot 24 inches in an
aircraft whose maximum angle of attack during landing is 7 degrees, the
appropriate vertical display dimension is: 24 by . 176 by 2 = 8.4 inches. in
a raster display with a normal 4:3 format and the major dimension horizontal,
the display size is 11.2 by 8.4 inches. This is a simple way of calculating
the minimum size for a literal display unde± the assumptions noted. The
display size could be reduced somewhat by letting the horizon null position
be above display center at zero pitch. This would be feasible if the display
were used as a flight display only during landing when the aircraft is
predominantly nose-high. However the display will be used for flight controlin other modes of flight -- for example, terrain following - where it is not
advantageous to have the horizon offset. It is not desirable to have the
horizon offset in one mode and centered in another as the pilot would be
required to change "set" from mode to mode. This would undoubtedly lead
to error so the gambit of using the offset horizon to reduce display size
should not be employed without empirical test. The physical display size
could also be markedly reduced by placing the display very close to the eye -
as in the helmet mounted CR'i. The important thing is the angle subtended
by the display and in the helmet mounted display the angular size can probabiý
be made sufficiently large.
In the previous paragraphs the problems of longitudinal control and
display coverage were emphasized. In con',idering the problem of lateral
control during landing, the importance of azimuth coverage in a. literal display
is even more evident. In contact landings the incidence of accidents,
37
_________________________________________ _______________
-IJ

go-arotmds, or hard landings due to mis-alignment with the runway are few
compared with incidents caused by under or over shooting. When seen, the
runway and its surroundings provide excellent lateral but mediocre longitu-
dinal guidance. This guidance depends, of course, on the runway being
visible and in a literal display if the landing spot, whether strip or carrier,
is not visible then many of the advantages of the literal pictorial display will
have been lost. The consideration for lateral coverage is the maximum cross
track heading likely to occur during the approach phase when the runway is
being used for guidance. A reasonable value to start with is * 15 degrees.
The size and magnification factor of a literal display determine only whether
or not the runway will be shown continuously in the space represented on the
display during approach and landing. Whether it will be seen or not depends
on runway size and contrast as well as system resolution. Runway size as
it appears on the display may be easily calculated. Figure i) shows the
literal size of a 200 by 1000 foot patch"' with unit magnification on a display
viewed at 18 inches. The same information is presented numerically in
Table V. At a 2-degree depression angle which would correspond to a con-
stant flight path angle of 2-degrees, the "carrier", subtends only . 025-inch in
elevation at a range of 4 miles (the acquisition range of SPN-10 ACL mode).
On a 500-line 8-inch display this is only two raster lines at most and in the
conditions of flight it is difficult to predict whether or not it would be visible.
With a.dequate contrast it could certainly be seen at one mile.
From the evidence gathered to date, the use of an unaided literal
vertical raster scan display as the primary instrument for landing cither a
fixed or rotary wing aircraft appears risky in spite of the promising results
obtained in the periscope and television studies. The major difference between
the periscope display used by Roscoe and practical raster scan displays are
size and resolutiol.. Roscoe used an 8 by 8 inch display - a large piece of
cockpit real estate -and a system whose resoluti on approached that of the eye.
*The length of the Enterprise is 1040 feet and the widest part of the deck is252 feet.
38

20 z0z 0
(f)u 11 cr
Id d )ULLI~~( Z(.0 -C
o 0 zwoN N' N 0
Izir & & -I 40
CD4
IC39

TABLE V. DIMENSIONS OF RUNWAY ON DISPLAY, INCHES
Depression Range to RunwayAngle,
degrees 24000 12000 6000 3000 1500
Distance below 2 0.69 0. 69 0.69 0.69 0.69horizon 4 1.26 1.26 1.26 1.26 1.26
6 1.89 1.89 1 1.89 1.89 1.89
Width far enci 2 0.14 0.28 . 0.51 0.90 1.44
4 0.14 0.28 0.51 0.90 1.44
6 0. 14 0.28 0.51 0.90 1.44
Width near end 2 0. 15 0.30 0.60 1.20 2.40
4 0. 15 0.30 0.60 1.20 2.40
6 0. 15 0.30 0.60 1.20 2.40
Height, near to 2 0.025 0.048 0.090 0.157 0.251far end 4 0.050 0.097 0.180 0.315 0.504
6 0.076 0.145 0.270 0.472 0.756
Unless the CRT could approach this size and have at least a 1000-line raster
scan without sacrifice of f-ame rate, an unaided literal raster vertical display
as the primary instrument for landing does not appear promising. If the literal
display is mixed with additional guidance information then the display has
considerable merit for there are some intrinsic advantages lo the. literal display
for landing. The informaticn the display shows is undoubtedly reliable, land-
marks can be used for navigation checks, and because of the great amount of
potential information in the display, the pilot may choose an alternative course
of action should things go awry. ?he literal display also takes advantag of
the ingrained perceptual habits that pilots have spent years acquiring. These
advantages can only be obtained if the systein satisfie,-i the requirements of
high resolution, near unit magnification, and large coverage,
40

THE ANALOG VERTICAL SITUATION DISPLAY
Display Characteristics
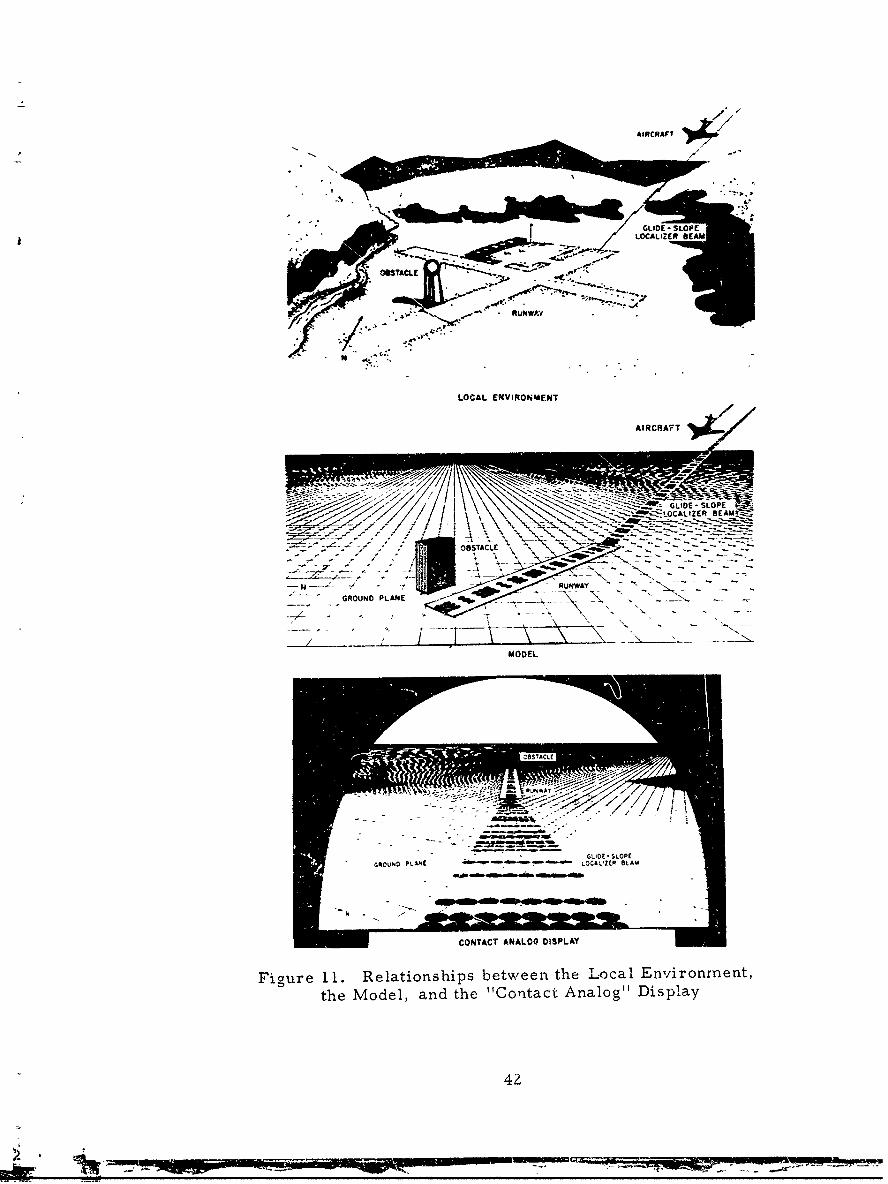
The contact analog display is the point perspective projection of a
three-dimensional model to a picture plane. The model contains reference
objects significant for flight performance such as a surface representing th!:o
local horizontal, usually called dhe ground plane, a surface representing the
command path for the pilot to follow, usually called the flight path, and other
surfaces or objects useful during different phases of the mission. An illustra-
tion showing the relation between the environment, the model, and the display
is shown in Figure 11. The computer that paints the display may also paint
conventional non-perspective symbols in the plane of the display; circles,
crosses, and the like. The hallmark of a contact analog is the display of
surfaces whose kinematics are similar to those of real surfaces in the
natural visual environment. In the microcosm of the panel mounted display
where magnification may be other than unity, the displayed surfaces will still
follow the laws of motion perspective and thus provide information coded in a
fashion analogous to the co)ding provided in visual contact flight.
The major element; in the contact analog display are the ground plane
and the command flight path -- the "highway in the sky. " The use of the
ground plane is fairly well tnderstood, although it must be said in passing
that it does not necessarily 2'epresent the ground but, for aircraft application,
simply a horizontal referenc,, surface that, on the display, moves precisely
in the same way as does the real ground in response to aircraft maneuvers.
The intended application of the command flight path, however, is not so well
understood for in some version- of a so-called contact analog the flight path
has been used as a compensatory tracking display to provide heading and
elevation steering errors, a singularly inappropriate use of this display
concept. As the distinction between the use of the flight path to provide
steering error information and the use of it to provide a command path in
space bears emphasis, we shall clarify the issue by reproducing here an
excerpt from an earlier discussion by Carel (1960).
4i
GLID -SLOPE
LOCALCALIZE* SEAM
- OBSnnCACLE
GROUNDPLANRUNWAY A
MODGIDELOP
Figure ~ ~ ~ ~ ~ ~ ~ LCLIE S1 eainhp ewe h oa ni xEntM
the Model, and OStheCoLE c Aao" ipa
4UWA

"Normally the pathway represents a fixed path in space alongwhich the pilot flies much like driving a car down the road.Presumably the trajectory of this pathway is generated torealize the optimum safe performance potential of the air-craft. It represents, in short, the best path to the end goal.To date it has been taken as axiomatic that this pathway isliterally fixed in space. This has been done because indisplay, it is desirable that any motion of the ribbon or pathbe attributable only to rotation or displacement of the air-craft. The whole intent of this display is to induce in thepilot a sense of motion so that he is always under theimpression that he, rather than the represented surface, isrotating or translating. How to induce this perception in thepilot is not compAetely understood. However, the writerbelieves that this perception would be seriously compromisedif, at times, the path on the display moved because theaircraft moved and at times it moved because the path wasrecomputed without the knowledge of the pilot. To bebelievable as a real world substitute this display musL reflectthe expectancies of the pilot.
An additional argument in favor of keeping the pathway fixedis related to one of the reasons why a pursuit tracking taskis easier than a compensatory tracking task. In pursuittracking the tracker has knowledge of both target changesand his error. In compensatory tracking he has knowledgeof only the total error. In the pursuit case the tracker canseparate out his error and target perturbations. Pursuittracking is similar to 'lying the stable path and compensatorytracking to flying a cui.tsnually recomputed unstable path.
As a simple instance of the ambiguity inherent in using anunstable ribbon for path director, consider the following:
1) Let the pilot be flying straight and level, dead center ona flight ribbon. The picture might look like .is:
43mew- 1:

2) Let him fly the same heading, twenty seconds laterthe picture looks like this:
If it is assumed that the path took its new position gradually(smoothed computation) the pilot may interpret this in oneof three ways:
1) He has drifted off track.
2) A new track is being computed.
3) A portion of the computer or generator has failed.
It may be argued that the distinction between 1) and 2) makesno difference sir~ce in both instances he should turn left.Let us see what happens if he turns left. If he turns left andgets back on the track either hypothesis 1) or 2) may havebeen correct. Let us suppose, however, that he rolls left.
44
I -

However, the path stays out in front of him because it isstill being recomputed.
*
He may then conclude that:
1) The path is teing recomputed
Z) A portion of tCe computer or generator has failed.
It is obvious that ti e display is still ambiguous.
Such examples of ribbon configurations could be multipliedad infinitum and it s•ems, at times, that well wishershave indeed made an infinite number of such suggestions.However, most of thorn violate the basic hypothesisdirecting the efforts: t'ae surfaces represented in thedisplav encode information in a fashion similar to the wayit is encoded in natural visual world. One of the mostimportant display characteristics that must be met :oachieve this perceptual similarity is display dynamics.The displayed surfaces must behave like natural surfaces.They may be placed at 50, 000 feet; they may be curved,banked, or vertical, but they must respond exactly as ifthey were rigid fixed surfaces in the real world. If theydo not respord correctly what the pilot expects to se iscontradicted, representing a possible source of error andconfusion. The concept o:" "expectancy" as it applies tothe dynamics or motion of this type of display cannot beto strongly emphasized. 'lhrough experience the pilot hasbuilt up a knowledge and lI-rary of expectancies of howthe visual world responds to various aircraft maneuvers.A display system that is intended to be a compellingsubstitute for this visual woi'ld must have the same kindof response characteristics.
4E-mMWZ-- 74,T7
A still different way of using the flight path is to use it as a
predictor instrument. Essentially this instrument predictsthe future of the variable the operator is controlling. inthe case of the aircraft this could be the flight path of theaircraft (the pathway in the contact analog display could beused for just such a purpose). For example, it could showthe path the aircraft will take as a consequence of holdingthe control stick constant. This, of course is a completelydifferent use of the ribbon. The merit of using the ribbonto indicate predicted flight path rzther thatý command flightpath is open to considerable question. If the end targetwere shown in the display the pilot's job when using thepathway as part of a predictor instrument would be simplyto move the controls until the path intercepts the target.This use of the path in the vertical display is very similarto the use of the. range ring in the horizontal display wherethe range ring predicts available range as a function ofpresent performance. "
The value of the flight path as a stable comr.i.o:,d remains unevaluated
except in the few instances that will be discussed in the followv--,g paragraphs.
To use the path image to provide steering information, however, seems
without advantage for the same information can be displayed more cheaply
and with less probability of misinterpretation by emplying a simple steering
dot or circle.
As far as the writer knows there are two designs for contact analog
displays that meet the criteria suggested above: the one by Norden and the
one by General Electric. Because I am most familiar with the General
Electric development, the features of that particular design as well as the
G. E. nomenclature will be used to illustrate the contact analog. This is
without prejudice to Norden and implies no evaluation; it is only done for the
sake of convenience.
We must a~ssume for this report that the display is familiar to most
of our readers, arid we shall not burden these pages with a further description
of its characteristics. A detailed discussion of the human factors require-
mentr for such a display may be found in Care! (1961).
Figure 12 is a pilot's eye view of a portion of the display in one mode
of operation. This sequence illustrates a change in heading and altitude with
46
540

Figure 12. Partial Contact Analog Display
47

reference to the ground plane. The complete display has the following
elements (only the ground plane is shown in the illustration).
1) A ground plane (six degrees of freedom).
2) A sky plane (three degrees of freedom - rotation only).
3) A flight path (six degrees of freedom).
4) A few three 1irmensional objects - obstacles or similar objects
(six degrees of freedom).
5) A ground patch - runway, checkpoint, I. P. , or target
(six degrees of freedom).
6) Numerous symbols in the display plane.
A sketch of the display elements in the landing mode is shown in
Figure 13.
Experimental Evaluation
As far as the writer knows, nieither the Norden nor General Electric
contact analog display has been flight tested in fixed wing aircraft. However,
considerable simulator and flight test work has beer, carried out by Bell
Helicopter using the Norden display for rotary wing application.
Bell conducted a systematic and long series of studies using both a
dynamic simulator and a test helicopter to determine the utility of the co,,tact
analog as a flight instrument. A long series has to do with the evaluation of
various features important for the design of the display. Representative of
such studies is the experiment (Emery, et al, 1964) in which pilot subjects
performed various maneuvers in the Bell dynamic simulator. The display
content was varied and the four conditions tested were 1) ground plane alone,
2) ground plane %ýith landing pad, 3) ground plane with pathway border, and
4) ground plane with pathway border and "tarstrips" (black strips perpen..
dicular to pathway edges).
The result of this particular study was that performance improved
as command guidance information was added so that pilots did better with
the flight path than without.
48
-

CONTACT ANALOGAPPROACH AND LANDING (CARRIER)
ANGLEOF
ATTACK
0R IE B N
GROUND
VIEW DISTANCE - 28 in. MANUAL INPUTS
SIZE 8 in. FIELD ALTITUDE
COVERAGE tIS' AZ-EL APPROACH HEADING
MAGNIFIC ' 0.5 PITCH TRIM
FIELD RATE - 60 cps R!.BON OFFSET (Nf)p
PARAMETERS DISPLAYED - DRIVE CARRIER WITH
GROUND SKY RIBBON OTHER CARRIER GROUND OR SEPARATELY?
PITCH OPTIONAL SAME AS VELOCITY INITIAL N * CHANGE RE-AL SIZE OF
ROLL CLIMB OUT VECTOR INITIAL E CARRIER AS FUNCTION
HEADING ANGLE OF ATTACK N VEL OF RANGE
N VEL PITCH RATE E VEL
E VEL TURN RATE HDG
MANUALS LENGTHWIDTH!•,
Figure 13. Contact Analog Display for Fixed Wing Aircraft
I,4Q !
I~~Aa

The consensus of these studies as a whole is that the contact analog,
if designed correctly, provides the helicopter pilot with one of the few tech-
niques that allows instrument approach and hover. In the most recent study
published by Bell (Dougherty, 1964) a ccmparison was made between per-
formance using the contact analog and performance using standard instrumen-
tation. Two groups were trained to criterion and performance equivalence
using either of the two display systems. The Bell simulation facility was used.
Subjects were required to hold command altitude, heading, course, and air-
speed. A digit reading side task was then introduced in which the required
reading rate was varied. The argument is that the display system that is
easier to use will allow more time for the side task before suffering a
performance decrement.
The results indicate that there was little difference in performance
using either display system when the pilot was not stressed. When the task
load due to the side task increased, performance with the contact analog
remained relatively stable whereas performance with the standard instruments
deteriorated with increasing load.
A figure summarizing the performance data is reproduced in Figure 14.
The clear result is that information can be assimilated more rapidly with the
contact analog pictorial display with the happy consequence that the pilot has
time available for the side task. The authors suggest that the superiority of
the pictorial display may be attributed to three factors.
1) The pilot may more quickly assimilate qualitative information
from the pictorial display.
2) Using conventional information the pilot samples one parameter
of information per glance. With the pictorial display he
accumulates information on more than one Parameter per glance.
3) Because of its size, the pictorial display permits use of
peripheral vision.
50

300 ICOMBINED ERROR
I-z 0
0 250
200-- - .
0 STANDARD ;NSTRUMEt.T&, FLIGHT DISPLAY1a: 50
WJ - JANAIR FLIGHTI.-D- 00 DISPL AY,
o '000
z4 50w
0 27 40 67 120
NUMBER OF PRESENT;TIONS PER MINUTE OF ADDITIONAL VISUAL INFORMATION
Figure 14. Performance Using a Contact Analog Displayand a Standard Instrument Panel Under
Different Amounts of External Load
An additional possibility not considered by the authors, is that because
of the scale and resultant sensitivity of the display, the contact analog allows
error detection sooner and thus permits tighter control. This view would
have to be checked by closet analysis but certainly insofar as attitude control
is concerned, the sensitivity advantage is all with the contact analog. In a
completely unrelated study, Gainer and Obermayer (1964) have shown that in
general within the range of values tested between competing multi-dimensional
display systems, the display that is most sensitive will yield tightest control
of the displayed parameter.
We have placed some emphasis on this particular Bell study because
it is one of the few carefully conducted and documented empirical studies
that makes a direct comparison between performance using the contact
analog and standard instrumentation.
51

Although the co-, act analog was originally conceived in the context of
fixed wing application, almost all of the simulation and flight test evaluation
of the physical embodiment of the concept has been carried out in helicopters.
This may simply be historical accident or may be the consequence of relative
need -the pressures for adequate helicopter all weather instrumentation are
more acute than for fixed wing aircraft. Instrumentation for helicopters wastaken over bodily from standard aircraft in spite of the fact that the helicopteris a far different beast -- particularly when flying slower than 30 to 40 knots.
The helicopter has more degrees of freedom than the conventional aircraft
and the distinction between where the aircraft is pointed and where the air-
craft is going is much more pronounced. The pilot of t.he helicopter, there-
fore, is more interested in the relationship between his attitude, his velocity
vector, and critical objects on the ground than is the fixed wiag pilot. A
display like the contact analog which provides him with this information in a
coherent fashion fills a lacuna in the complex of standard instruments. Our
opinion, unsupported by evidence, is that the contact analog is much more
useful and applicable to the helicopter than to the fixed wing aircraft.
As in the literal display, the selection of appropriate magnification,
for the contact analog is important. It will be recalled that suitable magnifi-
cation for literal displays is on the order of 1. 2. There is little or no
empirical flight performance data on how magnification in the contact analog
affects performance as, to date, this has not been a parameter that could be
varied. Analytically, one might suppose that the most pronounced effect of
display magnification is on display sensitivity with the concomitant change in
performance solely due to that. However, it has been shown analytically
that in this particular display, magnification will affect the perceived attitude
of the aircraft any time the horizon is not on the display. This effect was
discussed previously and will not be belabored here. Theoretically, any
distortion is undesirable, but in practice considerable distortion is tolerated
if the face of the display medium can be seen. What would happen if the tube
face per se could be rendered invisible as, for example, in a high quality
head-up display where the image is at virtual infinity is unknown. For prac-
tical purposes the magnification limits in panel mounted contact analog
displays are from 0. 33 to 2. 0.
52

There should be no differential magnification of the ,razious surface
elements painted in perspective. Elements in the model may change size,
e. g. , conceivably to gain detection range the runway could change size in
the model as a function of range until range is reached where it can easily
be seen on the display at its true size and then locked in at its true size.
Howevet, magnification as strictly defined, takes place in the perspective
transformation to the picture plane, and differential magnification cannot
be recommended unless it can be shown to be beneficial by incontrovertible
empirical data.
SKELETAL VERTICAL SITUATION DISPLAY
We have drawn up a series of skeletal flight performance displays for
landing that embody the principles expounded in the previous discussion.
For modes other than landing, the displays are similar but simpler. These
displays show the relationships between a set of inherently related variables
by use of a pictorial code. In constructing this pictorial code we have paid
no particular attention to shape coding of the various symbols used. While it
may be admitted that the physiognomic properties of such symbols are of
some importance in order to take the "nonsense" out of the usual assemblage
of squares, circles, diamonds and the like, we have chosen to slight symbol
shape in order to emphasize the notion that in pictorial displays for flight
performance, the way the symbol moves and its relationship to other symbols
and their movements is more important than what the individual symbols look
like statically. In.i too many cases the static appearance ( f competing displays
are very simila':, and it is only when they move that the striking difference
between an organized display and a bag of worms becomes evident. Symbol
kinematics are just as important as symbol physiognomy.
It is, of course, not possible to illustrate kinematics in this report,
but wc have done the next best thing and that is to describe the signals that
drive each symbol so that the interested reader - and he will indeed have to
be interested - may gc through the exercise of visualizing what happens in
response to control actions or aircraft maneuvers. The landing maneuver
has been chosen to illustrate the display action.
53

Figures 15 and 16 illustrate ihe nomenclature used to describe the
positioning and action of the display symbols. Figure 17 "s a sketch of
three different landing situations used to demonstrate how the display will
appear in different situations, and Table VI presents the numerical values
used to draw the displays. Figure 18 is an annotated sketch of a representa-
tive pictorial landing display as it would appear in situation I. Figure 19
shows sketches of the display as it would appear .in the situations described
in Figure 17 and Table VI. To these displays could be added altitude,
angle of attack, and stick commands. Illustrations of display appearance
in other flight phases is shown in Figures 20 and 21.
These particular displays evidence certain characteristics desirable
in pictorial displays. A pictorial topology is maintained between the position
of various symbols. If, in the real world, A is to the left of B is to left of C,
so it is also on the display.
The shape of the symbols themselves would undoubtedly benefit from
improvement; for it is a requirement that they be easily discriminable from
one another and easily associ-.ted with the referent object.
In this particular aet of displays the information presented is
situational with the errc. s sorted out so that the pilot is not reduced to
tracking a compensatory dot.
Experimental Evaluaticr
With one exc:zptti-,n the merit of the skeletal type of display remains
unevaluated by empir.cal test, The structure of the displays illustrated
bears a great deal of similarity to the encoding used on the Sperry HUD, and
the Sperry HUD has been tested. A picture of the Sperry HUD display is
shown in Fig-,ure 22. In a recent article Gold and Workman (1965) evaluated
the so-called "windshield display" using a modified B-47 flight AImulator.
"Windshield displays with and without flight director havebeen investigated in a f.ight simulation program conductedin a modified B-47 f1.'-ht trainer. Standard panel instrumentswere also evaluate(_ for comparison. Test subjects includedpilots with schedt2_!d air ýarriers and Federal AviationAgency (FAA) pilots. Automatic approaches were simulated,
54

- o # -.. -. ._ .,: - -•- •• :: •
tW h
a 0 FRL
HORIZON
---
HTV GLIDE SLOPEI
DESIRED TOUCHDOWN POINT
o - AIRCRAFT PITCH
a -)ANGLE OF ATTACKG
OT FLIGHT PATH ANGLE
- VELOCITY VECTOR, i.4., FLIGHT PATH ANGLE WITH RESPECT TO GROUND
0T= DEPRESSION ANGLE OF LINE OF SIGHT TO DESIRED TOUCHDOWN POINT
DV - ANGULAR DISPLACEMENT OFF DESIRED GLIDE SLOPE (VERTICAL DEVIATION)
8 - DEPRESSION ANGLE OF DESIRED GLI!)E SLOPE
H 8 ,' - (H IHDISTANCEA vFROM GLDVELOCITYs PEVECTOR TO ', LIDE SLOPE - .J- TO V.V.
(HIH ABOVE GLIEOSOPE
- DISTANCE FROM FLIGHT PATH ANGLE TO GLIDESLOPE - 1 TO)'
HT,, - HEIGHT OF FLIGHT PATH ABOVE TOUCHDOWN POINT
O'TYG = HEIGHT OF VELOCITY VECTOR ABOVE TOUCHDOWN POINT
S 1 Figure 15. Nomenclature, Side Elevation
55
(H I H A B V G L D SLO PE)• m mu • • w • m ~ ~ m m m m • m m m m n

SFRL
PG L
IR
DH - ANGULAR DISPLACEMENT OFF RUNWAY CENTERLINE
(HORIZONTAL DEVIATION)
LR -- DISTANCE TO RUNWAY CENTERLINE (TOCTRACK)
LT - DISTANCE FROM TRACK TO TOUCHDOWN POINT (.L TO TRACK)
S- Figure 16. Nomenclature, Plan View
PON
*5
OT -
PG -RIFTANGL
i~~~~~~~~~~~ H AN U A D-;a - . . IiiII!IllIII! I S L C M N OF RU WA CENTERL lIl ! ! I NE !im
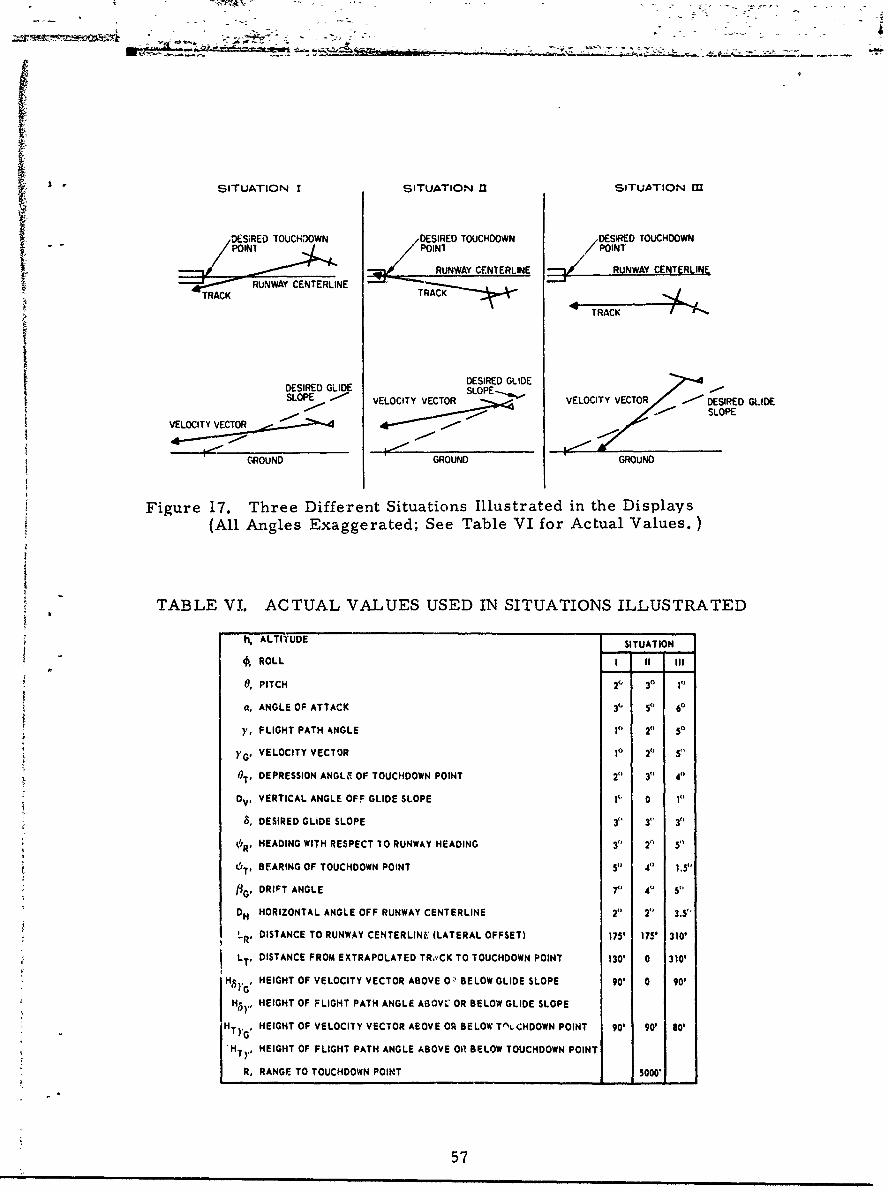
. SITUATION I SITUATION n SITUATION M
TR_,/ DESIRED TOUCHDOWN DESIRED TOUCHDOWN DESIRED TOUCHDOWN
RUNWAY CENTERLINE RUNWAY CENTERLINE
C ~ ~ 4UNAY CENTERLINE _TRACKTRC
DESIRED GLIDEDESIRED GLIDE SLOPE--..-.=SLOPE G VELOCITY VC OR VELOCITY VECTOR DESIRED GLIDE
/ - SLOPE
VELOCITY VECTOR
GROUND GROUND GROUND
Figure 17. Three Different Situations Illustrated in the Displays(All Angles Exaggerated; See Table VI for Actual Values.)
TABLE V1. ACTUAL VALUES USED IN SITUATIONS ILLUSTRATED
h, ALTITUDE SITUATION
SROLL I II III
0, PITCH 2' 30 I0
a, ANGLE OF ATTACK 3V 5 6.
y, FLIGHT PATH 14NGLE It 2' 50VELOCITY VECTOR I0 20 50
0 T, DEPRESSION ANGLF OF TOUCHDOWN POINT 2V 30 40
DV, VERTICAL ANGLE OFF GLIDE SLOPE 1• 0 1"
5, DESIRED GLIDE SLOPE 3" 3' 3"
HEADING WITH RESPECT TO RUNWAY HEADING 30 2" 5"
OT, BEARING OF TOUCHDOWN POINT V 4() 1.5"
DRIFT ANGLE 7" 4 S"
DH HORIZONTAL ANGLE OFF RUNWAY CENTERLINE 2" 2" 3.5"
, DISTANCE TO RUNWAY CENTERLINE (LATERAL OFFSET) 175' 175' 310'
LT, DISTANCE FROM EXTRAPOLATED TR.,'CK TO TOUCHDOWN POINT 130' 0 310'
H5 ,, HEIGHT OF VELOCITY VECTOR ABOVEO' BELOW GLIDE SLOPE 90' 0 90'
Hs),, HEIGHT OF FLIGHT PATH ANGLE ABOVL OR BELOW GLIDE SLOPE
HT)., HEIGHT OF VELOCITY VECTOR ABOVE OR BELOW T'ILCHDOWN POINT 90' 90' so'
HT ,, HEIGHT OF FLIGHT PATH ANGLE ABOVE Oil BELOW TOUCHDOWN POINT
R, RANGE TO TOUCHDOWN POINT 5000'
57
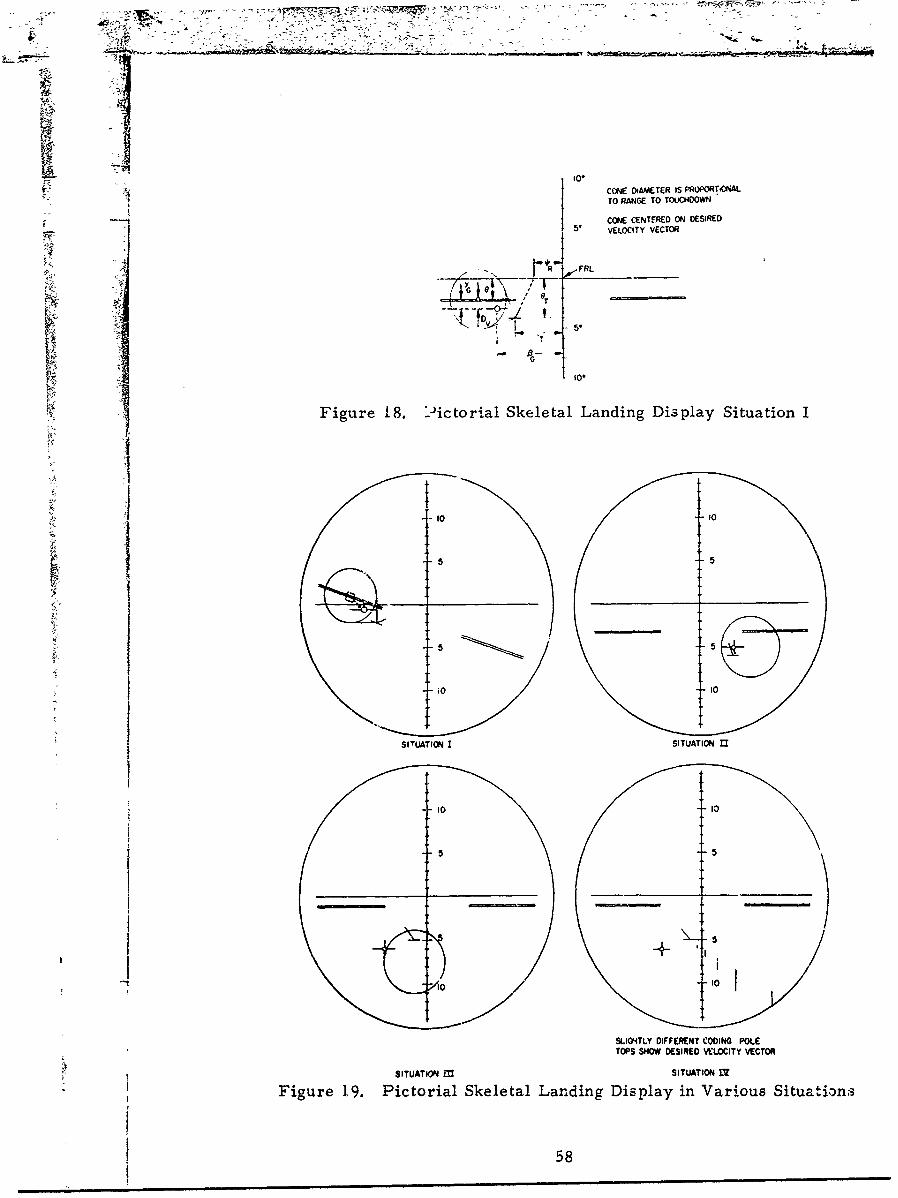
go.CONE OtAMETER IS PROPORT.NALTO RANGE TO TOUCHDOWN
CONE CENTERED ON DESIRED
5' VELOCITY VECTOR
+R FRL __ _
5o.
Figur 18. ictorial Skeletal Landing Display Situation I
SI'rUATION I SITUATION Ir
~10
SLIG'4TLY DIFFERENT COOING POLE
TOPS SHOW DESIRED VELOCITY VECTOR
SITUATION M~ SITUATION
Figure 19. Pictorial Skeletal Landing Display in Various Situations
58

SKELETAL VSITAKE-OFF CLIMB-OUT CRUISE
VIEW DISTANCE = 28 in. MANUAL
SIZE = 8 in. PITCH TRIM
COVERAGE =a±15°MAGNIFIC = 0.5
FIELD RATE =60 cps
PARAMETERS DISPLAYED * HEADING NUMBERS ALONG HORIZON (OPTIONAL)
PITCH e PITCH NUMBERS?
ROLL FOR CLIMBVELOCITY VECTOR * ALTITUDE ERROR OUT AND
COMMAND VELOCITY VECTOR AIRSPEED ERROR CRUISE
PITCH RATE MACH ERROR ON AUXILIARY
TURN RATE LINDICATORS
Figure 20. Flight Control Display for Fixed Wing Aircraft
59

PANEL MOUNTEDSKELETAL VSI APPROACH AND LANDING
VIEW DISTANCE 28 in. MANUAL
SIZE -8 in. PITCH TRIM
COVERAGE : 15"' HEADING DESIRED
MAGNIFIC ---0.5
FIELD RATE 60 cps
PARAMETERS DISPLAY El,PITCH
ROLL
HEADING ERROR
BEARING TOUCHDOWN POINT
FLEVATION TOUCHDOWN POINT
VELOCITY VECTOR
'VERTICAL ANGLE OFF GLIDE SLOPE
HORIZONTAL ANGLE OFF CENTERLINE
RANGE TO TOUCHDOWN
ANGLE OF ATTACK (AUXILIARY)
PITCH RATE
TURN RATE
Figure 21. Flight Control Display for F•ixed Wing Aircraft
60

ALTITUDE SCALE
HEADING INDEX 2
HORIZON LINE,•%
DEVIATION IMAG E~ AIMFLGTPV CPOINTRUNWAY IMAGE 4 j~\
AIRSPEED,._INDEX
0
FLIGHT PATH DIRECTORMARKER IMAGE
Figure Z2. Windshield Display Configuration for Final Approach
and these had several types of flight control malfunctionsintroduced at different stages during the approach. Perform-ance criteria were selected specifically to measure thepilot's assessment and backup manual control capability incritical all-weather landing situations. The results indicatethat pilots exhibit superior performance in both assessmentand control tasks when using the windshield display as com-pared with panel instruments. They can descend tosignificantly lower altitudes with steady localizer and glide-slope standoffs and recover safely from these conditions.Significantly fewer go-arounds are initiated with the wind-shield display subsequent to abrupt autopilot malfunctionsat low altitudes than with panel instruments. "
Whether the superiority of this display is because it is winuCshield
mounted or because it is pictorial cannot be determined by reading the
article. Because the study was conducted by simulation we suspect that a
simulated external environment was never presented to the subject pilots
and the superiority of the display arises not so much from the simultaneous
apprehension of external and display events nor from the fact that the two
are in registry but simply from the fact that the display was pictorial - the
presentation of many dimensions in a common frame of reference. That
this is likely the case is supported by the authors own statements.
61

"The results of the postexperiment interviews with thesubject pilots indicated unanimous favor for the windshielddisplays. The source of this preference is the real-worldform of the pictorial representation, in a three-dimensionalformat, which the windshield display presents, One pilotsuccinctly summarized this feature by saying that the dis-play "gives you a real-world picture in terms that you'reused to seeing. " In operational terms, the display gavethe pilot a quick, clear picture of the situation as a whole.This facilitated the assessment task that is so critical forall-weather landing irrespective of the mode of control(automatic or manual). As one subject put it, the display"does not require cross checking other instruments as onthe panel to verify the situation. All pertinent informationis presented together. " The enhanced assessment informa-tion facilitated the decision whether to land or go-aroundand the execution of these maneuvers. "
In short the display provides the pilot with hierarchical information
encoded pictorially.
From the point of view of human factors, other symbols or informa-
tion may easily be added without increasing confusion in the display in any
of the vertical situation displays. Numbered heading tic marks could be
added to the skeletal or contact analog display. Additions may be made
provided the frame of reference remains consistent. Altitude and airspeed,
for example, cannot meaningfully be portrayed in azimuth elevation
coordinates and it would therefore be preferable to place them on the
periphery of the display rather than attempt integration by sheer contiguity.
CONTROL OF VELOCITY VECTOR
Thie skeletal and contact analog flight displays as illustrated here
evidence a feature that has considerable merit over and above the simple
fact that a great many hierarchical variables are presented in a common
frame of reference. The velocity vector is represented on these displays
by an aircraft symbol with the intention that this symbol will be perceived
as the element to be controlled in the display. It is expected that the
pilot will directly control the velocity vector rather than attitude and that
except for extreme maneuvers, pitch will be considered only as secondary
information, and roll will be used only to make control of the velocity
62

vector or heading easier. Because changes in the direction of the velocity
vector follows changes in attitude with appreciable lags, stable manual
control will result only if the displayed velocity vector indication is suitably
quickened. (For certain aircraft a sudden increase in pitch - and consequently
angle of attack - actually results in a rapid drag increase accompanied by
a transient loss of altitude, and since this effect results in a momentary
change in the velocity vector in the direction opposite to thdt expected by
the pilot, it must be compensated for to avoid instability of control).
The correct null display position for the velocity vector symbol
will depend on the particular mission segment being flown. In the case
of landing, the symbol will be "flown" to the runway, carrier threshold,
or to the symbol representing the centerline-glideslope. In either case a
pursuit task is involved with all of its concomitant advantages. In addition,
symbols representing the prediction of the rate at which the az-el is
changing are provided in order to improve "tracking" performance and
allow a smooth asymptotic approach to the desired null position.
HEAD-UP DISPLAYS
Flight Displays
Pictorial displays for head-up (HUD) application have been proposed
that vary in function from the display of flight information to the display of
raw sensor information. The presurmed advantage of the HUD is that it
allows the pilot to keep his head out of the cockpit during maneuvers close
to the ground - low level flight and landing - thus facilitating the problem
of transition from instrument to contact flight. This presumed advantage
follows from two observed facts.
1) HUD displays are collimated, and thus the pilot does not have
to change eye accommodation when shifting his gaze from the
display to the outside world.
2) HUD displays are in the normal line of sight the pilot uses
during contact flight, thus reducing scan time.
63

Suppose however that one were simply to take information as it is
presented on standard instrumentation and project it on a HUD display? The
advantages of reduced scan time and reduced accomodation time would stillrema•,n wirh sU,,i-'.h n -n.•nf"ri7=nHnn hut it is extremel.v doubtful that this would
represent a marked improvement in aircraft instrumentation.
Understandably enough, however, pictorial methods of encoding
information have evolved concommitantly with the development of HUD dis -
plays. Suggested pictorial HUD displays are similar in choice of coordinate
system and symbology with what we have called skeletal pictori.F1 displays.
The real reason for the advantage of the HUD, if it turns out that there is one,
may be not that the display is mounted in a see-through position over the
panel but that the displayed information is encoded pictorially in an easily
assimilated fashion.
Because pictorial HUD's replicate in the abstract certain features of
the seen physical world it is desirable that the symbols representing those
features and the referent objects be in registry. If this requirement is met
then the HUD has the marked advantage of permitting the pilot to check the
performance of the display system by matching display elements-against
their counterparta in the external world.
The brightness and form of the symbols on a HUD must be chosen
with considerable care for if the symbols are too bright they constitute a
veiling illuminance that would tend to obscure ground objects, and if they are
similar in configuration to ground patterns - e. g. , runway lights - they may
cause confusion. Confusion can be prevented by intelligent choice of sym-
bology and veiling can be avoided by manual or automatic control of display
brightness.
A more scrious problem arises from the necessity of placing the HUD
over the instrument panel of the aircraft coupled with the limited field of
view of most HUD devices. In a collimated HUD display where the presenta-
tion is to be in registry with the external environment, the cockpit geometry
may not allow the pilot to see what he wants to see, for example, the outside
64

runway, precisely at the time when the reason for using the HUD in the first
place occurs. When the display magnification is unity and the angle of attack
is large, in many aircraft all pertinent informatiorn disappears off the bottom
of the display because of the limited field of view of the display. If the image
is compressed (magnification < unity) thtn the symbols in the HUD will be
markedly out of registry with objects in the real va,-,rld a,'-,d will make a dif-
ferent movement "gain". The effects of this are not completely known, but
one hesitates to suggest a departure from unit magnification without empiricai
evidence.
The effects -of small registry errors in colli, iated displays are
deemed minor because i, atter-.ipting a transition the display symbos will be
used by the pilot to tell him where to look. 1' he is not attempting a transi-
tion and is flying the HUD, misregistration will not matter. If the image Is
x.ot collimated then serious misregistration problems would ensue, and It
would be necessary to pick off signals from the pilot's head position ta
cor'rect the display image. This is not envisioned as a serious issue since
collimation appears to be an adequate yet simple solution.
Obstacle Warning Displays
The advent of sophisticated sensors like the laser allow us to enter-
tain the possibility of presenting to the pilot information that he needs but
does not now have. In addition to the head..up displays already discussed
which deal with familiar categories of information, the complete utilization
of helicopters and or;her vertical rising aircraft requires display of informa-
tion about the presence of wires and similar obstacles - particularly during
landing and take-off.
Operationally a "wire" should be considered as any long, slender
object, whether metallic or non-me'tallic, that is suspended in such a
manner as to be spatially detached from its surrounding visible background.
A wire lying on the ground or strung along the side of a building does not
constitute a hazard to an aircraft in the present context.
65

Under ary flight condition, a critical problem ass.ociated with low
flight altitudes is the dangerously high probability of striking wires. The
problem is most critical under daylight, clear weather conditions. This is
true because: 1) the majority of flights are made under such conditions and
2) lower flight altitudes are maintained ur-ler these conditions than at night
or in bad weather. Thus the highest priority is assigned to the solution of
the problem of detecting, discriminating, and localizing wires under daylight,
clear weather conditions. A highn but s-:condary priority is assigned to the
night, clear weather case.
The problem 4s difficult because, even under the best conditions of
visibility, wires may not be readily detectable by the human eye due to sun
angle or the visual background against which they must be discriminated.
Under such circumstances the background discrimination prcblem is clearly
the central issue. Under other circumstances wires may be clearly visible
to the pilot yet may go unnoticed because his attention is directed elsewhere
as required in the performance of other duties.
Thus it is evident that the solution to the problem implies, first, the
provision of an alerting function to notify the crew of the presence of wires
along the flight path of the aircraft, and second0 Ohe provision of a localizing
function to allow a determination by the crew of the proper evasive act'on.
It should be noted that the first item just listed is an absolute require-
ment if a wire avoidance system is to work at all. The second item, while
required if an optimum flight path is to be selected, would not be an absolute
require.nent if certain operational compromises could be tolera.•ed, ]Y or
example, if a system simply alerted the crew to the presence of a wire along
the projected flight path, then a standard flight procedure could be adopted to
avoid collieion with the wire, namely: climb until the presence of a wire is
no longer indicated. While such a procedure would always avoid collision
with wires strung laterally, it would not necessarily avoid a wire suspended
vertically, in which case a turn rather than a climb would be appropriate.
In any case, a system requiring a sandard evasive flight maneuver would be
most unattractive operetionaV1-,. Consequently, the location as well as the
presence of a wire must be considered a critical item of information.
66

When operating under flight conditions in which wire strikes are
probable, the visual atterntion of the crew number flying the aircraft is
typically concentrated on the outside world rather than the cockpit instru-ment panel. Consequently, the indication of the presence of a wire should beone that is virtually certain to attract his attention under this typical condition.
Either a highly distinctive and compelling auditory signal or a flashing light
presented in the forward external visual field would serve this purpose, and
possibly a combination of both is warranted.
The presentation of a suitable indication of the location of the wire
causing the alarm is more difficult. For an all-weather system this inforrna-
tion would necessarily have to be presented 1y some type of synthetic display
showing at least the range, bearing, and elevation of the wire relative to
some meaningful reference, ideally the aircraft's flight path and the surround-ing terrain. However, for a system optimized for clear weather, daylightoperation the indication ideally should be one that directs the pilot's attention
to the location of the real wire in the outside world. T2his would maximize
his chances of selecting the optimum evasive flight path relative to the sur-
rounding terrain and would normally give him an excellent chance of actually
seeing the wire, thereby confirming the validity ui the alarm. There is of
course the possibility that he might not see the wire and conclude that the
system gave a false alarm when in fact it did not. (In all cases an evasive
action should be taken even though the alarm cannot be confirmed visually,
assuming that the system's natural false alarm rate is acceptably low.)
Since the primary objective is to provide a system for clear weather,
daylight operation, an extremely simple means of directing the observer's
attention to the location of the real wire in the outside world is suggested.
Hopefully, this presentation would prove reasonably effective on a clear
night, although its effectiveness would surely be extremely limited under
conditions of poor outside visibility.
67

The suggested display is a collimated windscreen 0- combining-glass
Spresentation showing two symbols: 1) a circle whose diarneter and position
define the outside field of view being scanned by the sensor, and 2) a second,
smaller circle whose position indicates the angular bearing and elevation of
the detected wire within the scanned field of view and whose variable diameter
is inversely proportional to the range of the detected wire. The large refer-
ence circle is presented at all times; the wire-locating circle only when a
wire has been detected by the system (see Figure 23).
By means of this presentation the observer's visual attention will be
directed toward the detected wire, and the variable diameter of the circle
will provide a semi-pictorial, analog indication of how far ahead to look for
the wire, a small circle indicating that the wire is at a relatively great dis-
tance. The increasing diameter of the circle will represent the reduction in
range as the aircraft approaches the wire.
S.. ..I l-
Figure 23. Artist's conception of wire-locating display. Two circles areoptically projected onto a combining glass and collimated to
appear against the outside background. The larger circledefines the laser beam's scan cone. The samller circle showsthe position of the nearest wire, and its diameter is inverselyproportional to range.
68

This concept, of course, remains completely unevaluated and an
empirical evaluation must preceed acceptance. There is no reason why this
kind of information cannot be incorporated as an integral part of any pictorial
VSD for the coordinate system is compatibl.e and only the question ofr suitable symnbol coding needls to be resolved.
69
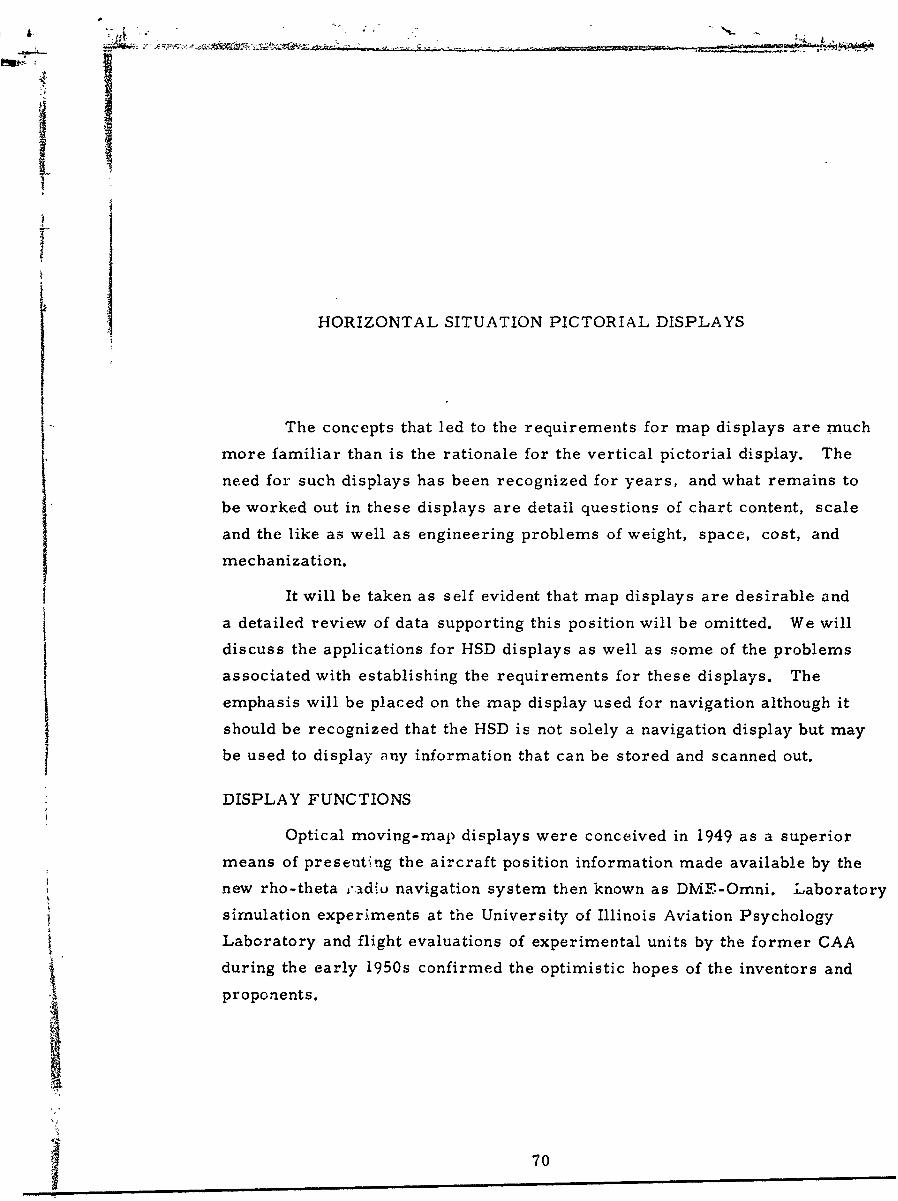
HORIZONTAL SITUATION PICTORIAL DISPLAYS
The concepts that led to the requirements for map displays are much
more familiar than is the rationale for the vertical pictorial display. The
need for such displays has been recognized for years, and what remains to
be worked out in these displays are detail questions of chart content, scale
and the like as well as engineering problems of weight, space, cost, and
mechanization.
It will be taken as self evident that map displays are desirable and
a detailed review of data supporting this position will be omitted. We will
discuss the applications for HSD displays as well as some of the problems
associated with establishing the requirements for these displays. The
emphasis will be placed on the map display used for navigation although it
should be recognized that the HSD is not solely a navigation display but maybe used to display any information that can be stored and scanned out.
DISPLAY FUNCTIONS
Optical moving-map displays were conceived in 1949 as a superior
means of presenting the aircraft position information made available by the
new rho-theta -adilu navigation system then known as DMF-Omni. Laboratory
simulation experiments at the University of Illinois Aviation Psychology
Laboratory and flight evaluations of experimental units by the former CAA
during the early 1950s confirmed the optimistic hopes of the inventors and
proponents.
70
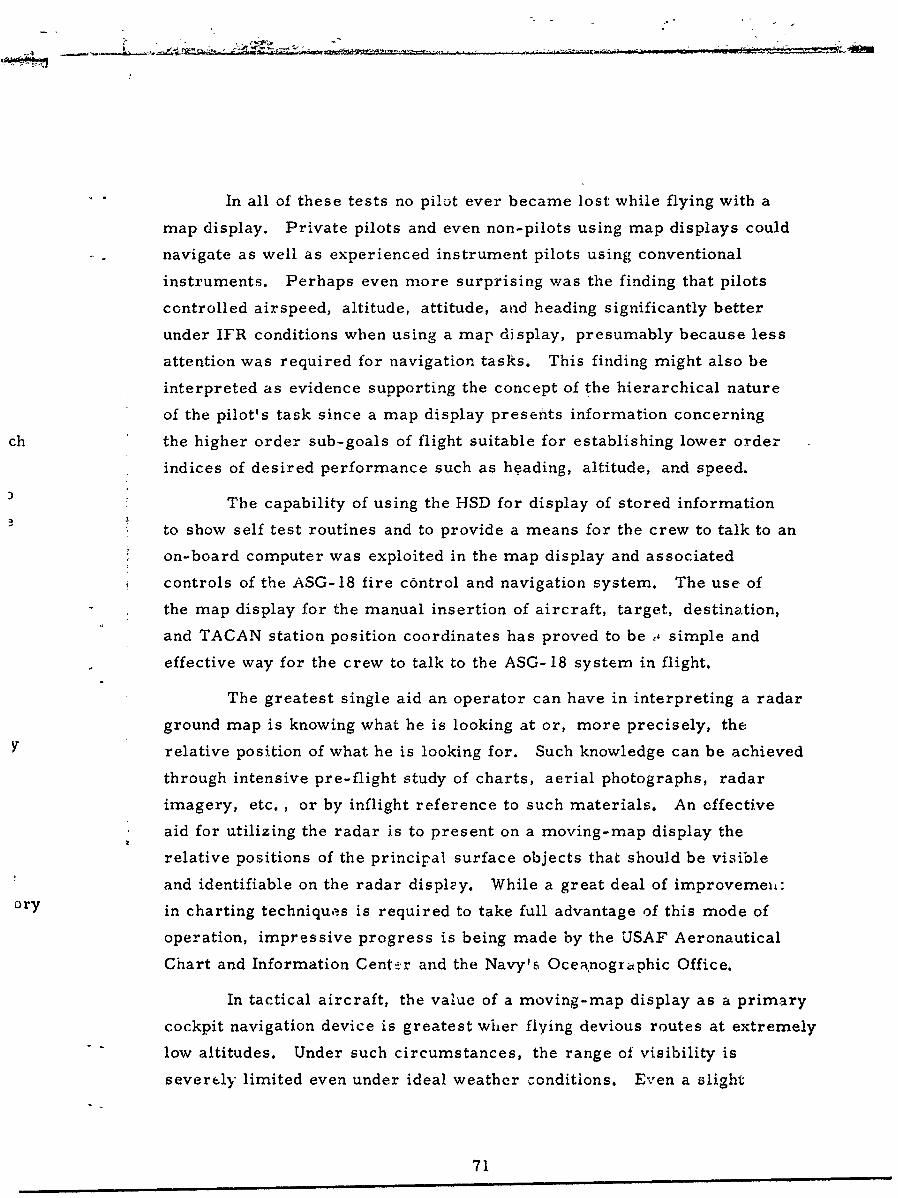
In all of these tests no pilot ever became lost while flying with a
map display. Private pilots and even non-pilots using map displays could
navigate as well as experienced instrument pilots using conventional
instruments. Perhaps even more surprising was the finding that pilots
controlled airspeed, altitude, attitude, and heading significantly better
under IFR conditions when using a map display, presumably because less
attention was required for navigation tasks. This finding might also be
interpreted as evidence supporting the concept of the hierarchical nature
of the pilot's task since a map display presents information concerning
ch the higher order sub-goals of flight suitable for establishing lower order
indices of desired performance such as heading, altitude, and speed.
The capability of using the HSD for display of stored information
to show self test routines and to provide a means for the crew to talk to an
on-board computer was exploited in the map display and associated
controls of the ASG-18 fire control and navigation system. The use of
the map display for the manual insertion of aircraft, target, destination,
and TACAN station position coordinates has proved to be s simple and
effective way for the crew to talk to the ASG- 18 system in flight.
The greatest single aid an operator can have in interpreting a radar
ground map is knowing what he is looking at or, more precisely, the
relative position of what he is looking for. Such knowledge can be achieved
through intensive pre-flight study of charts, aerial photographs, radar
imagery, etc. , or by inflight reference to such materials. An effective
aid for utilizing the radar is to present on a moving-map display the
relative positions of the principal surface objects that should be visible
and identifiable on the radar displey. While a great deal of improvemei±;ory in charting techniques is required to take full advantage of this mode of
operation, impressive progress is being made by the USAF Aeronautical
Chart and Information Centz.r and the Navy's Oceanographic Office.
In tactical aircraft, the value of a moving-map display as a primary
cockpit navigation device is greatest wher flying devious routes at extremely
low altitudes. Under such circumstances, the range of visibility is
severely limited even under ideal weather conditions. Even a slight
71

departure from a pre-planned flight path can result in a missed checkpoint
and possibly a disoriented crew. With the highJy accurate self-contained
navigation sensors now available, pre-planned point-to-point navigation is
effective with standard flight instruments, but far greater tactical flexi-
bility is afforded if the outputs of such sensors are presented directly to
the crew in terms of continuous, instantanoous position on a moving-map
display.
Thus, the display of€ stored information, used in conjunction with
appropriate cockpit controls, appears to be a most effective device
developed to date to assist an aircrew in performing the following functions:
1) Low-altitude tactical navigation, particularly at night or in
poor weather and when departures from pre-planned routes
are advantageous or required.
2) Interpretation of surface-mapping radar or other high-resolution,
real-time, imagery-producing sensors.
3) Updating self-contaiiied navigation systems by reference either
to visual or radar position fixing.
4) Initiating and interpreting in-flight system self-test routines
or performing the same tests on the ground.
In addition to these four principal functions a number of incidental
functions may be provided at little cost. Among these are the display of
check lists and other procedural instructions, maintenance information,
and terminal area traffic procedure diagrams.
The types of data that must be presented represent two distinct
classes. The first class consists of relatively unchanging iong-lead-time
materials such as map presentations of theater areas, terminal areas, and
aircraft and test procedures. The second class consists of tactical
data which requires a quick reaction-time capability if it is to serve as a
truly useful mission aid. Items such as current data on defensive deploy-
merits in tactical areas and readily available display of alternate attack
and departure corridors offer a potential for invaluable assistance 'c the
72

",'ombat crew. This means a requirement for a storage .capacity sufficient
to hold the unchanging items and a technique that permits daily changes
in the stored material.
If the map display is to be most effective as a flight instrument or
as an instrument for assisting the operator in the interpretation of high-
resolution imaoery f'rom real-time surface-mapping sensors used in
locating targets and navigation checkpoints, then the map presentation
must be oriented relative to the aircraft's flight path or heading. When the
momentary function of the display is to present alphanumeric information
such as radio frequencies, runway headings, place names, or terrain
elevations, then it is equally important that the printing be right side up
to minimize operator reading errors. These combined requirements
call for a dual mode of presentation providing either course-up or north-up
map orientation.
For similar reasons, both automatic and manual chart selection
and positioning are required as are many other operating features
contributing to the general goal of extreme flexibility.
MAP DISPLAYS
If the display is used primarily as a map, the main issues involve:
1) what shall be represented - the information required - and 2) the
method of encoding it. The derivation of these requirements is highly
mission dependent as the great variety of maps evolved over the past
several centuries will attest, and the cartography must be tailored to
satisfy the decisions required of the user,
The optimum characteristics for electronically generated or
optically projected charts differ greatly from those for charts printed on
paper. These differences warrant the prepe ration of special charts.
Optimum charts for optical projection in the cockpit environment and for
use in tactical operations differ from conventional flight charts in content,
symbology, scale, print size, contrast, and color.
73

To be most effective the charts should be relatively uncluttered,
boldin their lettering and other symbology, and of high resolution and
contrast. Charts of at least two different scales should be provided: one
to a relatively gross scale for enroute navigation and the other to a scale
approximately four or five times as fine for local area operations such as
position fixing, weapon delivery, traffic control, and landing. Each type
should contain only information related specifically to its intended
operational use, to avoid cluttering the chart and allow the use of a bold
format. A single master chart to 2 third scale encompassing the entire
operational area and showing the location and identity of all charts available
in the display is also highly desirable. Examples of charts meeting these
requirements are shown in Figures 24 through 26.
Map displays create the greatest single source of light generated
within the cockpit at night, even when dimmed to the same level as other
displays. The total luminous flux emitted by the display can be reduced at
least an order of magnitude by t.e use of negative black and white charts
(white figures on a black background). This type of presentation can also
be used with particular advantage in conjunction with color coded dynamic
symbols.
There are some classic problems in map dispiays. Should the map
move or should the symbol representing ownship move ? The answers to
such questions are much discussed rather than resolved in the literature,
and the conflicting points of view will not be belabored here. Suffice to
say that the heading-up, north-up issue is best resolved by considering
whether the pilot is using the display for planning, and consults it only
infrequently, or is using it as a corollary flight instrument, in which
case the display dynamics are important. It should also be mentioned that
the HSD cannot be considered in isolation -, particularly with respect to
its motion - but must be designed to sensibly fit in with the other cockpit
displays.
74

-' .. �
\�, --V .,.%
.� -'
� �-
' U
" '
/ �-.
- *%L.)* . 2
� A
C- .- - - .9'-
. **..1' o.I�4244;. -
L�.c'-�-* I
- -
01'I I- 9--.-,--
*1*�� 44 *0'
," f/ - --
9*..*G *' *�*t* S... -r -� -�£..--' � t�.
*.:::>-�jI �
I .-..- '.. -- I'* *.,*. ** *.* *.* � *�.*. 9' II
- I.-* 'I.
� I S
*1 1.90
A �-
-I �
-�--a
**** .U�.. --- W - �*s. ��0
�,'2�Th *� *�- � .�
Figure 24. Cartography, Planning 4(Not to True Scale)
754

-\ -
-1 ~ . 4 'I
Il 9 I
I- - L z'
Figur 25. artgahNvgto(Ntt reSae
-~ I .~76

P r- - ~ ,. _ _ _ _ _ _ _ _ _ _ _ _ _ _ _ _ _ _ _ _ _ _ _ _ ~ ~-SZ =
Figue 26 Carogra;-ýy Terina(Notto Tue Sale77L.i

The updating requirements for a map-.type display will also vary
•with the use to which the dibplay is put. If the area displayed is large arnd
the map is used primarily for en route point-to-point navigation, the informa-
tion need. only be updated infrequently. If conversely, the area displayed is
small, for example, a few hundred yards showing the location of several
helicopter landing pads during a helicopter landing maneuver, then the
map display is really a corollary flight instrument, as was mentioned
earlier, and the information needs to be updated at a frequency related to
the frequency with which events are changing or, as a minimum, at a rate
approximating the pilot's response rate. A series of sketv:hes illustrating
some desirable characteristics of map displays for fixed wing and
helicopter aircraft is shown in Figures 27 through 31.
The object of the map displays illustrated in the sketches is to
provide the operator with a representation of the geographic relationship
of significant objects in relation to his own ship in order to permit the
pilot to maintain continuous geographic orientation. Coverage, scale
factor, and display size were evolved from a joint consideration of vehicle
speed, vehicle kinematics, area useful for planning, cockpit size, and
display resolution. Chart content density is not specified but will be a
compromise between the need for a great deal of cartographic information
and the fact that clutter will obscure it. Representative chart contents
for high speed aircraft were shown in Figures 24, ZL, 26. Accuracy
and scale factor requirements were derived from estimates of the opera-
tional requirements for positioning along with the necessity that the
transition from one scale to the other in the landing condition be carr*nd
out without fuss. Representative values for these variables are shown in
the sketches. The "hover lines" shown in Figure 31 arn taken from
Lukso and Fellinger (1965).
The displays illustrated are intended for use in navigation, and the
design principles used derived from considerations of guidance and control
as well as from a consideration of the pilot's hierarchical tasks.
78

HIGH SPEED AIRCRAFTHSI -MAP
N 'AVIGATION
Nl
"FUEL RANGE 2 i
"SCIRCLE +
TO ,, N ATDESTINATION T-! AE2AP.O
CCONTENTS)
DISPLAY SIZE 7-.8 in.
VIEWING DISTANqCE "1 28 in.
SCALE FACTOR 30 N MIiTU
DISPLAY COVERAGE 1 AM240 N MI
MOTION RELATIONSHIP 2EOPTIONAL
SYMBOLS
1. OWNSHIP POSITION 3. OWNSHIP TRACKTOI-O 6 ANMI ATI3I 4. DESTINATION POSITION
2. OWNSHIP HEADING 5. FUEL-RANGE LOCUS
CHART CONTENTS
HIGH ALTITUDE LOW ALTITUDF
1. LAND AND WATER MASt_ 1. LAND AND WATER MASS
2. LCCATION AND IDENTIFICATION OF NAV AIDS 2. ELEVATION AND3. LOCATION AND IDENTIFICATION OF AIRDROMES TERRAIN FEATURES4. LOCATION AND ELEVATION OF PEAK ALTITUDES 3. DEFENSE INSTALLATIONSS. LOCATION AND IDENTIFICATION OF RESERVED AIRSPACE 4. TARGETS AND CHECKPOINTS
6. AIR• DEFENSE ZONES 5. LANDMARKS7. LATITUDE AND LONGITUDE LINES 6. POLITICAL BOUNDARIES8. INTERNATIONAL BOUNDARIES 7. LATITUDE AND LONGITUDE
9. ISOGONIC LINES
Figure 27. Map Display, Navigation
79

HIGH SPEED AIRCRAFTHSI-MAP
TERMINAL
-w AE( CONTENTS)
DISPLAY SIZE 8 in.
SCALE FACTOR 3 N MI /iý.
DISPLAY COVERAGE 24 N MI
MOTION RELATIONSHIP = OPTIONAL
1. AIRDROME, CARRIEri, OR RUNWAY INFORMATION
2. NAV AIDS
CHART CONTENTS 3. APPROACH PATTSRNS AND DATA
4. OBSTACLES5. LAND AND WA' ER MASSES
1. OWNSHIP FOSITION TO 0.25 AT 3
2. OWNSHIr HEADINGSYMBOLS 3. DESTI;4ATION POSITION
4. RUI<WAY OR CARRIER HEADING
Figure 28. Map Dispiay, Fixed Wing, Terminal
80

HELICOPTER"ISI-MAP
POINT TO POINT NAVIGATION
AMAP(CONTENTS)I
DISPLAY SIZE =8 in.
VIEW DISTANCE =28 in.DISPLAY COVERAGE Z 48 N MI
SCALE FACTOR = 6 N MI/in.MOTION RELATIONSHIP = OPTIONAL
1. LATITUDE AND LONGITUDE
2. AIRDROMES OR LANDING FACILITIES
3. LOCATION AND ELEVATION OF HIGH POINTS
4. LOCATION AND IDENTIFICATION OF ELECTRONIC AIDS,CHART CONTENTS 5. LOCATION AND IDENTIFICATION OF DEFENDED POINTS
6. LOCATION AND IDENTIFICATION OF RESTRICTED ZONES7. INTERNATIONAL BOUNDARIES
8. UNIQUE TOPOGRAPHIC FEATURES
1. POSITION OF OWNSHIP TO %Yz N MI AT 3oT2. HEADING OF OWNSHIP
SYMBOLS 3. POSITION OF DESTINATION TO M,1SN MIAT 3 T
4. FUEL RANGE LOCUS
5. OWNSHIP TRACK
Figure 29. Map Display, Navigation
81
ummm. mm m m mmmaI

HELICOPTER"HSI-MAP
TERMINAL
AA73
AA 8192 HLX-101.43 LA
81 33
A A A62 ELEV1 f
EMER RADIO
110.3
S
DISPLAY SIZE 8 in.
VIEW DISTANCE 28 in.
DISPLAY COVERAGE 40,000 ft
SCALE FACTOR - 5000 ft/in.MOTION RELATIONSHIP -- MOVING MAF
1. LOCATION AND IDENTIFICATION OF TERMINAL FACILITY
2. LOCATION AND ELEVATION OF OBSTRUCTIONS
CHART CONTENTS 3. LOCATION AND IDENTIFICATION OF ELECTRONIC NAV AID4. FIEL D FLEVATION
5. RADIO r'REQUENCIES
6. UNIQUE TOPOGRAPHIC FEATURES
I. POSITION OF OWNSHIP TO 500 ft AT 303
SYMBOLS 2. HEADING OF OWNSHIP
3. OWNSHIP TRACK
Figure 30. Map Display, Terminal
82
lie In • mn~m~mmiu Illlii I__If I_-I___-__"____-_
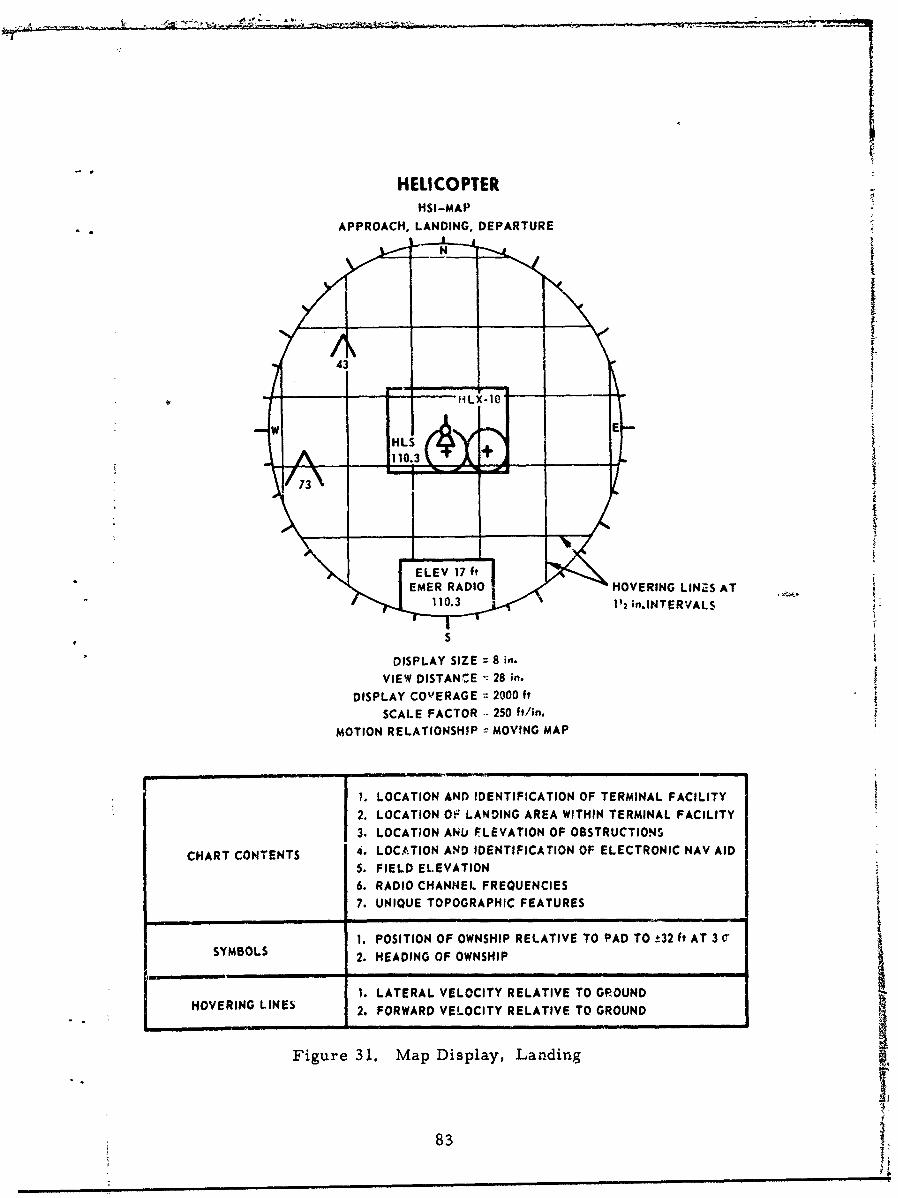
HELICOPTERHSI-MAP
APPROACH, LANDING, DEPARTURE
N
43
4 - HLX-70
A 11 3
I
"jEMER RADIO| HOVERING LIN2S AT-• 110.3 •2 in.INTERVALS
, S
"DISPLAY SIZE 8 in.
VIEW DISTANCE -" 28 in.DISPLAY COVERAGE 2000 ft
SCALE FACTOR .- 250 ft/in.
MOTION RELATIONSHIP MOVING MAP
. LOCATION AND IDENTIFICATION OF TERMINAL FACILITY
2. LOCATION OF LANDING AREA WITHIN TERMINAL FACILITY
3. LOCATION ANU FLEVATION OF OBSTRUCTIONS
CHART CONTENTS 4. LOCATION AND IDENTIFICATION OF ELECTRONIC NAV AID
5. FIELD ELEVATION6. RADIO CHANNEL FREQUENCIES
7. UNIQUE TOPOGRAPHIC FEATURES
1. POSITION OF OWNSHIP RELATIVE TO PAD TO -32 ft AT 3 cSYMBOLS 2. HEADING OF OWNSHIP
1. LATERAL VELOCITY RELATIVE TO GROUND
HOVERING LINES 2. FORWARD VELOCITY RELATIVE TO GROUND
Figure 31. Map Display, Landing
83mmlm• m lmmllll • • m~mllm mm. 1. m m ram lmmm 1. mm •mlllllll I

-two_-
SENSOR DISPLAYS
Operational Applications
There is a class of pictorial displays that does not fall under the
rubric of the map or flight control displays as illustrated in the prior
sections of this report. These are the literal -pictorial displays that are
the direct output of sensors and are not so easy to illustrate with simple
sketches. The primary application for such displays, in the mission
segments under study, is in navigation and related tasks, although the
same displays may also be used for such tasks as target acquisition and
weapon delivery.
If the terminal or waypoint goal is stated as a geographic location,
it is evident that means must be provided for the pilot to realize his
position with respect to it. This is the central problem in navigation: to
determine where one is with respect to where one wants to go. In a map
display the pilot could accept as true the output of a navigation system
as it is reflected in the display only at the peril of error as large as the ,
accumulated navigation error.
In inertial systems it is customary to update position periodically
in order to prevent the accumulation of large errors. One technique for
updating is to identify a landmark whose position is known, measure ownship
position with respect to the landmark, and insert this information in the
navigation computer. The identification process may be carried out by an
operator using a literal pictorial display of information gathered by a
pattern sensor such as radar, TV, or IR. Such pictorial displays need
not have all the properties required in the hierarchical displays for they
are not used to direct the vehicle toward a goal but )rly to identify a "target."
The requirements for these displays, then, w;'I 1-iA necessarily
be based on the principle of replicating the pilot's goal hierarchy, but
will be couched in terms meaningful for the human recognition process
when the task is solely recognition or a type of "matching. " If the task is
truly a matching task then means must be provided for the operator to
84

correlate stored with raw data. There are several ways to do this. One
is to store prepared imagery in the HSD magazine, call it up when the
navigation system thinks the time has arriv,,d (or on demand), and compare
the stored imagery with imagery originating with a live sensor in order to
identify checkpoints or objects whose coordinates are known. Another
technique might be to assign a symbol to each class of landmark, store
the coordinates of each item in each class, then superpose the symbols
on the raw data display in accordance with navigation system prediction.
If such a display is monitored rather continuously, then the operator's
task is historical, and errors can be detected as they g-ow rather than in
discrete steps when each object must be identified in a non-historical context.
In addition to using a literal sensor display to update the navigation
system by searching for and recognizing predetermined checkpoints, a
high resolution radar system, for example, may be used to select a heli-
copter landing spot. Deferring for the moment questions of weight, size,
and cost, it seems clear from an examination of the output of radars with
a high resolution that such devices could, in favorable circumstances, be
used to select a clearing in the jungle or to aid in flying the nap of the
earth in helicopter operations. These radars, operated optimally, allow
one to pick out cleared from woocied areas and even to discriminate
individual trees. Such capability is a comparatively recent development
and certainly increases the potential of such radars for this application.
In helicopter operations the procedure might be to pop up, take a
radar snapshot, descend and examine the radar output. If the image were
stored, rectified, and scaled, it could be used directly in place of the map
display on the HSD. Or, as at least the center position of the image is
known, it could be used simply to update position in the computer or to
mark a coordinate position in the computer and thus on the display. In
either case, the radar allows one to tie the system to the reai world of
things and obstacles rather than the abstract wor"d of inertial space.
The operational utility of all sucn sensor displays depends on the
observer's ability to recognize targets or checkpoints. This is such a
critical problem that an examination of what is entailed is warranted.
8

Target and Chbeckpoint Recognition
Because most tactical aircraft of the future will have on board
elaborate avionics systems that will include pattern sensors like radar, IR,
and TV, one must consider the conditions under which targets or objects
can be recognized through the medium of these sensor systems.
This discussion is intended to provide information helpful to the
design of such sensor systems with particular reference to pictorial displays
that provide the basis for target or landmark recognition by the crew. In
addition, a few of the operational variables not subject to design maneuver
but critical for the operation of the system will be discussed.
A complete review of all the purportedly relevant data on target
recognition would be too voluminous for this report. For the most part
the target recognition literature is a compound of unrelated studies dealing
with theoretical rather than practical issues and using abstract rather
than realistic imagery. Rather than attempt a generalization based on these
academic studies we have elected to lean heavily on both our own experience
and the data reported fromn a few select studies that have utilized realistic
imagery in an effort to capture the complexity of an operational situation.
The classification of objects seen in a display is a process of infer-
ence based on the target signatures evidenced in the display coupled with
the knowledge and skill the operator brings to the situation. The target
signatures are many and varied, and the operator's ability to use them is
affected by the design characteristics of the system, the operational environ-
ment, and his own a priori information. It is in the design characteristics
of the system that we are interested and the effects that design characteristics
have on performance. Unfortunately, a rigorous quantitative description
of the interaction between design characteristics and performance has not
been elucidated.
For the sake of clarity and convenience each of the more important
characteristics will be discussed separately, but it should always be
remembered that the interactions among these variables have a marked
but not completely known effect on performance. For example it is likely
86
that the type briefing and reference material employed should be considered
in choosing the optimum resolution or optimum scale. The operational
task in a tactical situation is to locate the target or landmark rather than
conduct a long involved interpretation of the target imagery. Therefore, the
location task may succeed by the crew using either contextual information
or by recognition of the target on the grounds of its shape signature.
The appropriate tactic will depend on both the location accuracy
required and the a priori information available. If the target position
is known exactly and if the reference material indicates that the target
can be located by its position with respect to a unique configuration of
conspicuous landmarks --- rivers, roads, etc. --- then it is expected
that the scale which affords a large context would be relatively more
important than resolution. If, on the other hand, the position of the target
is not known precisely and the target must be located and identified on
the grounds of its shape signature, then resolution would assume great
importance, and the appropriate scale would be that scale which, when
coupled with the required resolution, allows .he shape signature to be
seen with comparative ease. In short, the choice of optimum scale and
resolution will depend directly on the kind of a priori information available
to the operator.
Resolution
Resolution is perhaps the variable most often mentioned as being
critical for improved performance in target recognition. It seems self
evident that the finer the resolution the easier it will be to identify a
visual object. Attempts to determine the system resolution required for
any particular recognition task have occupied investigators for many years
and several studies report data that explicity or implicity show the effects
of resolution on the probability of recognition. (Bennett, Winterstein,
Taylor and Kent, 1963; Jennings, Meeker, Prayer, and Cook, 1963;
MacDonald and Watson, 1956; Steedman and Baker, 1960).
87

Evidence wihich allows some quarnttative relations to be extracted
is reported in the Jennings study conducted at Minneapolis-Honeywell. In
this study, the investigators were interested primarily in the effects that
ground re.,ýc.-ution and contrast have on the observer's ability to identify a
variety of military targets using realistic photographic imagery. In the
study there was no formal briefing, and there was no attempt to take con-
textual information out of the imagery so the observers had more than just
the shape signature of the target. The observers were shown the imagery
and asked to classify the objects they saw by checking items on a list
provided. Of particular interest is that they were asked to respond at
the level of description that would most completely describe the target.
The completeness of their description, (the level of response) depended,
of course, on the resolution of the imagery. For example, if the target
was in fact a C-54 aircraft, at the lowest level of description the observers
might respond by classifying it only as an object, at finer resolution by
naming it an aircraft, at a still finer resolution by identifying it as a
transport aircraft, and at the finest resolution by calling it a C-54.
Three reporting levels of description were used in the study, and
the data are analyzed in terms of description level. A chart taken from
the Jennings report which summarizes the data is reproduced in Table VII.
The reporting level is indicated in the chart by noting how the target was
classified as a function of resolution. For example, a road grader is
classified simply as a vehicle with ground resolution of 16-32 feet, as
heavy equipment with resolution of 8-16 feet, and as a road grader when
the resolution is better than 8 feet. We are interested in generalizing
from this data in order to arrive at an estimate of resolution requirements
for any target --- not only those listed in the chart. In order to synthesize
a principle from this welter of particulars, the first step was to invoke the
notion of "definition" which would allow us to make generalized inferences
that are divorced from the particular resolutions coupled with the particular
targets that were used in the study. "Definition" is defined as the number
of resolution elements placed along the major axis of a compact target. A
sensor system with a ground resolution of 2 feet looking at a tank 30 feet
long exhibits a definition of 15.
88

toi w30 4
o if I~~II
~2-j YJ 4 -SK 1a, x a.) 4
-oil if aw
49 1.- - . 0 w1 .
.. 5 Z 1 ,~~ O4f ifL I Wf f
.- a2i K4 44 0 L, -0-if
u wx t Q a ~ z -i a I.- W. AL a a a2 o - . i
of 2
1.-f -1w aIL U0 2- .4
u- if w U 3. i
I.-2-II. ft i
00 Wz 10,Sw S.O~ I 0
0j ~ U~ X mw0a I.. wi . L
0 if Ozf4 0 I54 ~ ) 4 o xk. if9 4-0 oof a C
..i .4 W
if 'g- U = Z l-
2-** if xi =j i af
iJ i0 M1 0
:I. u L ~ --
Hc a Ow 4
A .4 4i
. a - II Lz ;V 2 2 LIL
N, -,' ww ", a 5L !"gufi A U.aS0 a a t n ai 6
at zf w z> It
2L a 9x I- - Ja
PQ .2 ;: I Um,1ac I. & i 2 2
2i . . 22. 3 1 . 2
89

The definition requirec to identify the targets used in the Jennings
study may be calculated by making reasonable estimates of target size along
each target major axis. This was done, and Figures 32 through 34 are
plots of definition versus probability -f recognition for three levels of
description for a select grcup of targets. * The definition values were Ihen
averaged across Cargets, plotted, and the resulting curves are shown in
Figure 35.
Although even this averaged data is "noisyy" there appears to be a
discontinuity in the level II and level III curves; the level III curve breaks at
a percent of 30 and the level Ii at 70. It is cvident that so.r~e factor other
than ground resolution is operating to limit performance to those percent
correct values under those conditions. The most probable cause is that
at these values the definition as displayed equals the visual acuity limit ofthe observer so that even though the T-hybical definition improves the
observer can resolve no more and at a fixe,' :,ýcz-le cannot improve his
performance. It may be supposed then that th e break in the curves is an
artifact and if increased definition could be utilized by the observer --- by,
for example, changing scale --- the curves would continue in a straight
line. It should also be noted .1hat the data used to generate the level I curves
are compressed against the 100(99) percent scale on the percent correct axis
with the consequence that the averages are markedly skewed. For this and
other rational reasons it is felt that this particular average is an anomaly.
*A target was included in this select group if there were differential data at
all three levels of description as well as data for at least three resolution
values. Thus, if a target, for example a bridge, were recognized as a
bridge 1 percent or 100 percent of the time at all resolution values, it was notincluded because the data provided no differential information. This policy
is, of course, susceptible to the argument that we have conveniently rejected
all those targets that are not differentially classified at different resolution
hw,.vels. We recognize the logic of the argument and pass on.
90

ADAPTED FROM MINKCAPOLIS-HONEYWELL STuWY I LEVEL I IINOVEMBER 1963suo,' I, " .......
SUBJECT'S GROUND llCLASSIFICATION TRUTH
70 LEVEL I DESCRIPTION) a__AIRCRAFT FIG4TER(T-334OR F-!OI) IAIRCRAFT C-54 I______ ____1
£AIRCRAFT HELICOPTER (SMALL) ______- ___60 SHICLE SEMI AND ENCLOSEDa ',EHICLE TANK TRUCKz 5 V_:'EHICLE BOXCAR OR LOCO
2 0 VEW;CLE TANK (MEDIUM)!
$ WEAPON TOWED WEAPONz VEHICLE RCA.D GRADER
20 -- -
001 01 2 20 50 30 6 99 999
PERCENT CORRECT LEVEL I DESCRIPTIONS
Figure 32. Correct Responses VS Definition for Level I Description
90 ~j I a r r - -- i
* 1
ADAPTED FROM MINNEAPOLIS-HONEYWELL STUDY LEVEL fTNOVEMBER 1963 _
SUBJECT'S GROUND
CLASSIFICATION TRUTHI, LEVEL U DESCRIPT!ON)
70 FIHE T-33--OR F-10160 - UTILITY AIRCRAFT C-54 I•FIGHTER T-33 OR F-WIO
" HELICOPTER SMALL HELICOPTER0 HEAVY EQUIPMENT ROAD GRADER -
* LARGE OR SMALL TRUCK SEMI AND ENCLOSED [z LARGE TRUCK TANK TRUCK I2 ) RR VEHICLE BOX CAR OR LOCO- TANK MEDIUM TANK= 0 TOWED WEAPON TOWED WEAPONw 40 - - I-
30
20 --- _ _ _
10 -
o
001 01 2 20 50 80 98 999 9999
PERCENT CORRECT LEVEL H1 DESCRIPTIONS
Figure 33. Correct Responses VS Definition for Level II Description
91

90
SLEVEL M ADAPTED FRO MIN~iAP0L!S-W)NEYWELL STUGY
I NOVEMBER 1963"--~~~ ~~ -- ...L: DPE(LEVEL M1O DESCRIPTIONS)
70 T-33 OR F-IOI
& SMALL HELICOPTER
_ _0 ROAD GRADERSI t, SEMI AND ENCLOSED
& TANK TRUCK50--z--- BOX CAR OR LOCO2--- 50 MEDIUM TANKE a TOWED WEAPON -NO ENTRY--- _ E-U-TN
30 _
00l 01 2 20 50 80 98 999 9999
PERCENT CORRECT LEVEL I. OESCRIPTIONS
Figure 34. Correct Responses VS Definition for Level MI Description
too I I I k I I I _Ta• 0 o x i
0 o
ADAPTED FROM 0 xMINNEAPOLIS- HONEYWELLSTUDY A 0 xNOVEMBER 1963 I i
0 x MEAN ALL TARGETSLEVEL I
O x 0 MEAN ALL TARGETSz LEVELU0 LEE MEAN ALL TARGETS10- I- LEVEL Z
I ' - i l I ! 1 I ! ! I -
001 01 2 20 50 g0 98 9999999PERCENT CORRECT
Figure 35. Correct Responses VS Definition Means for Each of Three Levels
92

Mm
The analysis was carried out to this length in order that the carve
expressing the relationship between probability of recognition (Pr) and defini-
tion couild be synthesized. Using these data and compounding them with the
old rule of thumb that to go from one level of description to the next requires
an increase in resolution by a factor of five, (Space Handbook, 1959, p. 173)
one may then construct the graph shown in Figure 36 which purports to show
the regions where different levels of description may obtain. It will be
noted that the boundaries between the levels at Pr equals 50 percent are
separated by factors of approximately 5 in definition thus satisfying the rule
of thumb. The reader will of course recognize the tenuous nature of the
arguments that produced these curves and will treat them only as practical
working hypothesis or as useful guidelines of a design.
100 " /
REGION OF REGION OF
LEVEL / LEVEL I
MODIFED IDF-MTIFICATIONIDNTIFICATION A-
eq. TRANSPORTC-54 AIRCRAFT
10 REGION OFr ELEVEL I
RECOGNITIONaeg AIRCRAFT -REGION OF
L ~ LEVEL 0[ DETECTION
I eqOBJECT PRESENT
PROABIIT OFRECGNTIO -PHarOGRAPHIC 1MAGERY
Figure 36. Definition VS Probability of Recognition
93

These data were derived from studies using photographic imagery.
In an airplane the radar case is of more interest, and the validity of
generalizing from data using photographic imagery to predict performance
using radar imagery is, of course, subject to doubt. We believe however
that those doubts can be allayed if the process that the observer uses in
each case is considered. In both cases the observer is looking for a
pattern formed by visual contrast and in both cases shape is presumed to
be the primary cue used for target recognition. One would expect, then, that
definition--the number of resolution cells placed on the target--would
similarly affect the utility of both the radar and photographic imagery, for
in both instances increasing definition has the effect of crispening the shape
of visual objects. Because the observer bases his classification on his
ability to resolve shape, it seems rational to assume that the form of the
functional relationship between definition (resolution) and pr-obability of
recognition would be similar for both radar and photographic imagery. For
photographs this relationship can be represented by the hypothetical curves
shown in Figure 36.
Using the curves in Figure 36 as a paradigm, one would expect
that the curves for radar would have similar slopes but be displaced silghtly
to the left by an unknown amount. That is, with equal resolution, recognition
performance using photographic imagery will be slightly superior to that
using radar imagery. This bias is likely because film is roughly sensitive
to the same energies as the eye with the consequence that a photograph
looks familiar and little transformation is required for recognition. This
is less true of radar imagery--things that look bright to a radar do not
necessarily appear visually bright and some experience is necessary to
interpret, radar imagery quickly. This, coupled with small geometric
differences between the two types of imagery, suggest a slight bias in favor
of photographic imagery.
94

In the study by Bennett et al (1963), conducted at IBM, the investi-
gators were interested in the effects that contrast, "grain, " and resolution
had on recognition performance. Using photographic imagery processed
to yield the required contrast, grain, and resolution, a trained subject was
asked to tag the target with crosshairs, categorize it by use of a keyboard,
and indicate the level of confidence of the classification. A variety of
military targets were used. Two; fighter aircraft and trucks, were similar
to those used in the Jennings study which allows a comparison between
these two sets of data. The fit~hter mean size was 50 feet and the truck
mean size ZO feet, The use of these dimensions coupled with sensor
resolution estimates allows us to calculate the definition. Assuming that
the composite score "recognition effectiveness" as used in the Bennett
study is approximately the same as Pr' then P as a function of definitionr r
may be plotted as shown in Figure 37. These data are in good agreement
X - FIGHTER
O-TRUCKS I
t o _ x AS
0
RECOGNITION AS AFUNCTION OF DEFINITIONFOR TWO COMPARABLETARGETS DERIVED
FROM IBM DATA
2 20 50 so 98 999 9999RECOGNITION EFFECTIVENESS
(PROBABILITY OF RECOGNITION)
"Figure 37. Definition V$' Recognition Effectiveness for Two Targets
95

with the Jennings data although the Bennett curves show that the observer'swere somewhat less capable of recognizing a target at a given definition.
Considering the differences in technique, imagery, etc., the agreement
between these two sets of data can be considered remarkable in this field.
Although we have freely used the IBM data, with their kind permission, it
should be pointed out that Bennett et al do not share our optimism with
respect to the validity of expressing resolution requirements in terms of
target size.
The reader should be cautioned that such conclusions as have been
drawn above should not be used indiscriminately and should not be used to
lull the designer into a sense of security. This formulation was conceived
to provide approximate guidelines for physical design and should be
construed in that light.
Scale
The best empirica1 . information on scale may be found in the Bennett
rqeort cited previously. For each of the three scales they used in their
experiments, performance data were plotted against estimated resolution.
Figure 38 shows these results with what they call "rationalized curves"
fitted. These curves show that a given scale is useful up to the point
where, with that scale, the displayed resolution elements become much
larger than the acuity limits of the eye. When the eye can reqolve to the limit
of the rest of the system it does no good to make the image larger by expand-
ing scale. These curves also show that if the display scale is too small,
sensor resolution is wasted because the eye cannot resolve to a comparable
value. The desirable scale according to the IBM investigators is about 750
times the resolutiorn for displays viewed from about 12-18 inches with the
unaided eye. The data quoted from the Bennett study are in good agreement
with similar data gathered by Williams, Simon, Haugen, and Roscoe (1960).
96

10 I 11 I i I I I I I 111 I 11 1 1 I I I I i I I | I
DESIRABLE SCALE, -K -ICO0(RESOLUTION.FT)
8 -0)
ztAJW
6
S25'-SAME S656- 015 IN.-240"A
z
1:2000 \.1000o0
0 1 1 10 100 1000
ESTIMATED RESOLUTION,FT
Figure 38. Effectiveness as a Function of Resolution, by Scale
A table from the Williams study is reproduced in Table VIII. If the rule
is adopted that the best scale is 750 times the resolution then for the data
shown in Table VIII the best scale for 55-foot resolution is 1:41250; for
26-foot resolution, 1:19500; and for 13-foot resolution, 1:9750. It can
be seen that this rule accounts very well for the trends observed.
The rule also agrees with what one would rationally calculate if
the limit resolution of the eye were assumed to be 3 minutes of visual arc
in the operating environments of these experiments. Three minutes at 18
inches viewing distance subtends . 016 inches. If we let thip equal a
97

TABLE VIII. TYPES OF TARGETS IDENTIFIED AT VARIOUSSCALE FACTORS AND RESOLUTIONS
SCALE FACTOR
Resolution(Ground) 1:40, 000 1:27,000 1:12,000
Scale or pattern: Same types of Same types of1. Terrain features targets as at targets as at 1:27, 000,2. Activity areas 1:40, 000, but but with great loss of3. Airstrips with some accuracy, especially
55 feet loss of in identifying func-Relationships, context: accuracy. tional areas of a city.
1. Functional areasof city
(SCALE ENLARGEMENT IS DETRIMENTAL)
Shape or pattern: Same types of Shape or pattern:1. Marshaling yards targets as at 1. Outdoor theaters2. Irregularly 1:40, 000. 2. Cemeteries
shaped bldgs 3. Oil tanks26 feet (300x250 feet) 4. Railroad round
houseRelationships, context:
1. Aircraft
(SCALE ENLARGEMENT IS ONLY SLIGHTLY BENEFICIALFROM 1:27, 000 TO 1:12, 000)
Shape or pattern: Same types of Relationships, context:1. Aircraft targets as at 1. Warehouses
(100 feet) 1:40, 000, but 2. Factories2. Outdoor theaters with greater (stocked
13 feet 3. Golf courses accuracy. materials)4. Storage sheds for 3. Oil processing
produce plants(150x20 feet) 4. Gravel pits
(machinery)5. Institutions
(SCALE ENLARGEMENT IS BENEFICIAL)
98

resolution element and assume, for example, a system with a resolution
of one foot. then the field of view of a 12 inch display will be 12 divided by
.016 or 750, i. e., a scale of 1:750.
In summary there is one best scale for target location when the I
target must be recognized by its shape signature. Enlarging the scale
and the image beyond the critical point adds no information that can be
utilized by the operator. Reducing the scale means that information gathered
by the sensors is lost because it cannot be resolved by the eye. If the
display size is limited to 10- 12 inches, a sensor capacity of 700 to 1000
resolvable elements along one axis is about the limit that the observer can I-use with unaided vision.
Another consideration which may affect the choice of scale is the
required field of view. If a display is used for navigation updating, the
required field of view will be determined, in part, by the total position
errors accumulated between updating periods. The field of view should be
something more than twice the size of the likely error--the requirement
is that a checkpoint be included in the field of view at some level of
certainty. Such considerations, when coupled with limitations on display
size, may dictate a scale other than the optimum.
If optimum scale is the sole criterion, the desirable size of the
display for these applications can be calculated when the system resolution,
operator viewing distance and capacity of the sensor are known. The
results of such calculations using a more optimistic value for limit eye
resolution are shown in Figure 39. If, because of space limitations the
display must be kept within a certain small size, then the designer should
be aware that this may seriously compromise the expected performance
of the system.
4
• .-.•.. '• • • •.+J PiiW]mmm ilL I I irn i •, •..=,,•=-,=.mr ,4

BAS•E23 ON ASSME VISUALR0SO TION LIMIT OF 2 MINUTES OF ARC
(RASTER LINE PITCH EQUALS 2 MINUTES!
VIEWING DISTANCE, INCHES 36/24 1B 12
10
IO IO IOOOI o I oo1O 100 1000 10.000
NUMBER OF RESOLUTION ELEMENTS. p
TO ESTIMATE NUMBER OF TV LINES (q) REOUIREOFOR A GIVEN DISPLAY SIZE MULTIPLY P BY TWO
Figure 39. Required Display Size (See PP-fffor Conversion to TV, q, Resolution)
Briefing and Reference Materials
The importance of a priori information was discussed briefly in
previovs paragraphs. That the form of the reference material is critical is
shown by the great effort that SAC has put into generating radar prediction
charts. In general, it has been found that even the slightest briefing will
improve the operator's ability to recognize landmarks or checkpoints.
There is, however, a remarkable scarcity of data in the open literature
on precisely what the relationship should be between the reference material
and the real time display, This is a critical problem even for unaided
vision when the display is the natural full-colored three-dimension world,
for McGrath, Osterhoff and Borden (1964), have shown that the coding of .,
map contents has a marked effect on the ability of a pilot to identify visual
checkpoints during low level flight. It should also be mentioned that a priori
100

briefing acts as a suggestion and may form in the observer a "set" or
expectancy to see a certain kind of target with the consequence that the
false alarm rate may increase.
A study was conducted at Hughes Aircraft Company, Culver City,
in connection with the CONDOR Program in which the real time display was
a TV monitor and the operator's task was to identify a specific target on
which he had been briefed. Vertical photographs at several scales and
geodetic survey maps at a scale of 1:24, 000 were used as briefing materials.
The results can be summarized by noting that the closer the briefing
material resembled the real time image at the time the subject first saw
it, the better was the performance. Photographs at any scale tested were
better than maps, photographs at a scale corresponding to the initial real
time image scale were better than those that differed.
In an earlier study at Hughes, conducted as part of the Advanced
Tactical Strike System contract, it wzs found that adequate briefing was of
overriding importance. Unfortunately not too rmany rigorously supported
conclusions can be drawn about the specific nature of desirable briefing
materials, but in one case such an inference is possible. The subject was
required to designate a specific target as quickly as possible on radar
imagery derived from an APQ-55 system. Some were briefed using maps
and charts and others using high resolution aerial photography, The
results are as follows:
MAPS AND AERIALCHARTS PHOTOGRAPHS
AVERAGE TIME 36 sec 17 secTO DESIGNATE
FALSE ALARMS 22% 0
In spite of the fact that the utility of appropriate reference materials
is universally recognized, little is known about the precise nature that such
reference material should take. Very little systematic work has been done
101
low"

on this problem and the design of such materials represents one of the most
pressing problems to be solved before the raw sensor displays may be fully
exploited. Because it is not an autonomous sensing and data processing
issue the requirements for such materials will not be discussed in later
sections of this report. It should not be inferred, however, that this
omission implies unimportance but only that it should be handled under a
rubric other than sensing and data processing requirements.
102

PICTURE QUALITY REQUIREMENTS
The utility of pictorial raster scan displays depends not only on the
information contained in the display and the method of encoding it but on the
quality of the displayed image. One might have conceived the best of all
possible symbols and images to no end because the display medium is
inadequate and nothing can be seen, or what can be is of poor quality. This
is not a minor problem for the visibility of raster scan displays in daylight
is notoriously poor. It is worth spending some time stating the general
requirements that will enable the picture to be seen without undue visual
fatigue. The critical problem is to get a flicker free display bright enough,
contrasty enough, and sharp enough to see in bright daylight. For this
reason very little time will be spent on viewing requirements at low light
levels for a dim display can be achieved with a variable filter. The major
variables of interest are field rate, frame rate, data rate, highlight
brightness, contrast, dynamic range, and resolution. The use of filters and
coatings is also of interest.
The effects on visibility and image quality of color, adaptation time,
target shape, viewing time, drugs, and operator idiosyncrasies will not be
considered.
BRIGHTNESS AND GREY SCALE
It is convenient to specify the brightness required in terms of the
integrated brightness even though the raster scan is physically intermittent.
At a 60 cps frame rate the apparent brightness will be that of the equivalent
103

I
amount of luminous energy spread over a reasonabie integrating interval-
say one or two seconds. The peak brightness required to reach the needed
integrated brightness level will depend primarily on system duty cycle and
phosphor decay characteristics.
1 00 FtL -
This: 50 FtL -
0 FtL -
100 FtL -Looks asBright 50 FtL-as This:
0 FtL -
Data is available to assist in establishing the display brightness and
contrast requirvments. These laboratory data enable us to estimate;
I) the values required to reach a 50% threshold of visibility
2) the values required to reach a greater than 50% threshold
3) the values required to reach an operationally useful image
4) the values required to compensate foi ei, adaptation mismatch
5) the values required for achieving clearly discriminable
grey shades.
By judicious use of these sets of data, estimates of required brightness and
contrast may be reached. The use of these data will be illustrated in the
following examples.
The basic data to provide the starting point for all estimations may be
generated from Blackwell's study (Blackwell, 1946) of the contrast thresholds
of the human eye. The curves in Figure 40 are plotted from data gathered
in that study, and they show the 50% threshold as a function of background
brightness, contrast, and target size. The 50% threshold is the level at
104

I I
PARAMETER: BACKGROUND BRIGHTtNESS Ft L
EARTH THE HUMAN EYEON CLEAR I SNOW IN BLACKWELL. HRDAY (1000) STARL!GHT JOSA VOL 36 NO I I NOV 1946
SO I
0 0CIS
z
'Ii
0 1
oo0i 001 01 1 to 1oo 1000 IQPOooCOTATBRIGHTNESuS FIGURE -BRIGHTNESS GROUND•CONTRSTt BRIGHTNESS GROUND
Figure 40. Contrast Thresholds of the Eye (Adapted From Blackwell)
105
u 4mm lm mlm 'l+ i t ~ i m
which the target was detected 50% of the time. Figure 41 (adapted from
Blackwell) is a conversion curve that may be used to estimate thresholds
other than the 50",o.
The background brightness in a skeletal display is the brightness of
the tube face where there is no image. The level of this background bright-
ness may be markedly different from the surround brightness - for example,
the sky. As long as the ratio of the surround brightness to the background
brightness stays below 10, there is no marked effect on the contrast
threshold. If the surround is brighter than the background by more than a
ratio of 10, then the surround will start to affect the contrast required in
varying degree due to an adaptation mismatch. Figure 42 shows these effects.
The solid curve is based on data from a study conducted at General Electric
Co. , Ithaca, (Purdy, 1959) and shows the correction factofr t6use when the
surround (the sky) is mai-kedly brighter than the background.
Figure 43 adapted from Chapanis (1949) shows how acuity is affected
by contrast and background brightness. In the skeletal display the require-
ment is not only that a thin line element be visible but that readout accuracy
be maintained by requiring that the separation between two elements be
visually resolved when the separation is equal to a line width. For this
reason the curves in Figure 40 and the curves in Figure 43 should in each such
case be compared, and in calculating the brightness requirements the most
demanding value should be used.
Image motion will not effect thresholds unless the velocity of images
at the eye exceeds 300 per second. This will normally occur only on the
T;' and contact analog VSD displays when the aircraft flies at high speed at
"low altitude. The V/h ratios that will produce blur is shown in Figure 44
as a function of depression angle.
106

0.99.
0.90
>- 0.80- _
m0.600
0.50.40 O0.30
0.201
0.10
0.01 --0 0.4 0.8 1.2 1.6 2.0 2.4
RELATIVE CONTRAST
Figure 41 . Curve to Convert 50% Threshold to Other Probabilities
107

100 ___--10000
PURDY, W.
CORRECTION CURVE, "OUTDOOR TV"
READ AGAINST PERSONAL COMMUNICATION
- LEFT ORDINATE
10 1- 1000
/ DATA - READ AGAINSTS / RIGHT ORDINATE
iB -B,20 FtL LlTARGET; 6 M'IUTES DIA.
S/ CIRCLE 0/,50 % THRESHOLD z
00
(fl I€ 0~
I - 100
I IJZIA'= - !
O.CO . .. S (O- I
- i-
0.10 -- 108
- I
0.01 ¶ - I
0.04 0.06 0.08 0.10 0.12 0.14 0.16 0.18
/ .. .. .......... •........ 'CONTHAST (DASHED CURVE)
L. 1I I
I 1.3 l.eb 2.0 2.3
CORRECTION FACTOR FOR SURROUND (SOLID CURVE)
Figure 4Z. Effects of 3urround on Contrast Threshold
108

100
T FROM CHAANIS, A. HOW WE SEE, P31.PARAETE ISPERCNT ONTASTHUMAN FACTORS IN UNDERSEA
WARFARE. NATL RE3 COUNCILWASHINGTON. D C 049
,o ý 50 30 20 ,o 5I 2
I0U)_w0-.. " :-• • '""•- """- '"" - --
........ ...... ." .. ......
=THESE CURVES ARE A SYNTHESIS - .',-OF THE DATA SHOWN IN CHAPANIS . -,
"PLOTTED IN TERMS USEFUL TOTHIS PROGRAM
0.001 0.01 0.1 I 10 t00 1000 10000
BACKGROUND BRMGHTNESS, ýt LVISUAL AG.UITY AS A FUNCTiC,'J OF CONTRAST
Figure 43. Visual Acuity as a Function of Contrast
The information contained in these figures may be used to estimate
the minimum required brightness and contrast of the skeletal displays. The
best way to show how this information may be used is by using a series of
representative examples. Suppose the following:
We wish to paint the symbols shown in the skeletal panel
mounted landing display illustrated in Figure 19 with lines
one mil in width. (One mil is abozt 3. 4 minutes of arc. )
The display is hooded and panel mounted so that the tube
109
40
o30
Zo 30*/•S20L-
1 T T I 1 T 2 T
ALTITUDE IN FEET, hSPEED IN FEET PER SECONDV RATIO
STRAIGHT AND LEVEL FLIGHT UNIT MAGNIFICATION
Figure 44. Blur Threshold as a Function of V/h Ratio andDepression Angle
background brightness is assumed to be 20 FtL and thesurround brigohtlness (the sky) is about 2, 000 Ftl.4 FromFigure 40 we find that the required contrast for the 50%threshold is about. 03. Although our image is only one
mil wide it is in essence a long line, and from corollarydata -it is known that such lines are somewhat easier todetect than simple patches.
110
oi

However, the line was made one mil wide in order to
retain precise readout accuracy, and we should therefore
like to be able to resolve two lines separated by one mil.
Figure 43 shows that the contrast required for that order
of acuity is closer to .05. This more stringent value will
therefore be used.
To raise the probability of detection to .9999; Figure 41
is consulted, and it is found that .05 must be multiplied by
a factor of 3 which yields .15. Even at this level of
contrast the image is ghostly. Muller (1956) has shown
that this latter value (.15) must be again multiplied by a
factor of at least five (Muller's constant) before the image
is bright enough to be viewed comfortably. When multiplied
by five the required contrast is .75.
However, because of the large brightness difference
between surround and background, the curves illustrated
in Figure 42 must be consulted. It is found that we must
multiply by about 1.2 to correct for the adaptation mismatch.
The required contrast is now .9. Using the equation
Bf - BB
g
it is found that the minimum integrated brightness for the
lines under these conditions is approximately 38 FtL.
At this point it will be useful to utilize a constant, K,
that will consist of the value necessary to raise a 50%
threshold to 99% (a factor of three) and "Muller's constant,"
(a factor of five) to raise the image from a ghost to a more
substantial picture. The value of this constant, K, to be
used in subsequent analyeis will be 15.
111

The same procedure can be used to estimate the brightness required
for an unhooded display where the tube background brightness will be caused
chiefly by light reflected from the sky as will be the case in daylight con-
ditions. With no filters and conventional TV phosphors the tube face will
reflect about 70% of the incident light. Representative ambient light lovels
during daytime are as follows.
overcast day: 100 Ft Cdls
clear day (not direct sunlight): 1000-2000 Ft Cdls
direct sunlight: 10, 000 Ft Cdls
Assume a clear day not in direct sunlight. Using the lower value of
ambient the tube background brightness then will be about 700 FtL. From
Figure 40 the contrast required for a one mil line is about .02. This value
multiplied by K of 15 yields .30. The increment of brightness required then
is about 210 FtL.
Consider next a head-up display (HUD) requiring only line imager
with a line width of one mil and a background brightness of 2000 FtL (the
sky). The contrast threshold is .018. Multiplying by K yields a contrast
of .27. With a neutral combining glass, the total light loss through the
optical train to the eye may be 80%. Therefore the brightneýs of the line
pattern on the tube face needs to be on the order of 2700 FtL.
The same one-mil patterin on a HUD against a background brightness
of 10, 000 FtL will require a brightness of about 13,500 FtL.
It should be emphasized that all of the above values are minimal
values where the image will appear somewhat "ghostly".
Let us now consider a more complex display like a contact analog
that uses patches of black and white to paint the necessary surfaces. In an
achromatic contact analog, brightness will be used to code elemeiits ,,L the
display so such elements will need to be visually discriminablt in brightness.
For example, the flight path should be brighter than the ground, and other
symbols may be brighter than the flight path. Several brightness levels are
required rather than the two values used in the examples cited previously.
112
)ram~ lxr-wmmm mmm •Nl m r• m mm m• •• m aI u

jJ
The needed grey scale may be calculated in the same way as the other
examples although at the slight additional hazard of an extrapolation. Assume
again for the hooded case a background brightness of 20 FtL, a surround
brightness of 2,000 FtL, and that the smallest patch we want to see subtends
one mil on a side. From the previous example, the patch brightness was
estimated to be 38 FtJL The ground plane, then, would be formed of patches
of 20 FtL and 38 FtL. Once again it should be remembered that such
contrasts as these, whilst clearly visible, are not what could be called good
quality. However, let us use 20 and 38 for the ground. If the sky is not
patterned it may be 20 FtL. If patterned, 20 and 38 FtL may be used if
pattern rather than brightness can be used tc discriminate ground from sky.
Elements comprising the flight path should be still brighter. They
must be seen against a background of at least 40 Ftl-. The required contrast
for one-mil patches is still about 0.9 so the path brightness needs to be
about 76 FtL.
Still other symbols need to be seen against the brightest parts of the
flight path. Calculating as before it is found that these should be minimally
111 FtLj.
The contrast requirements calculated from these data are in good
agreement with some observations we 'have made in our own laboratories
where we have been informally investigating the contrast requirements for
useful shades of grey in cathode ray tubes. In general, it has been found
that a 2:1 contrast ratio is needed for pleasing and easily discriminable grey
shades when the display is viewed under medium to high ambient (50-3,000
FtL). This corresponds to
Bf - B .
g
If, therefore, one wants five shades of grey, a dynarric range of 16:1 is
required; if eight shades, a range of 128:1, etc.
'A
113

If we assume that the background brightness is 0.7 of the ambient
because of the tube reflectance, then a table can be constructed to show the
brighttoess required for a given ambient and the desired number of grey
shades Lor an unhooded display with no filters. See Table IX.
Table IX. BRIGHTNESS REQUIREMENTS FOR DISPLAY
Dynamic Ranges I IShnades Rne 2:1 4:1 8:1 16:1 32:1 64.118:
Shades of Grey 2 3 4j 5 6 17 l28
Brightness Range Required, FtL-Reflectance Plus Signal(Unhooded, 70% Reflectance, No Filter)
1 FtL .7-1.4 .7-2.8 .7-5.6 .7-11.2 .7-22.4 .744.8 .7-89.610 FtL 7-14 7-28 7-56 7-112 7-224 7-448 7-896
"E 100 FtL 70- 70- 70- 70- 70- 70- 70-140 280 560 1120 2240 4480 8960
' i000 FtL 700- 700- 700- 700- 700- 700- 700--4 1400 2800 5600 11200 22400 44800 89600
10,000 FtL 7000- 7000- 7000- 7000- 7000- 7000- 7000-114,000 28,000 56,000 112,000 224,000 448,000 896,000
70% Reflectance, 10% FilterTube Brightness Required, FtL
4 10 0.7-2 0.7-4 0.7-8 0.7-16 0.7-32 0.7-64 0.7-128)•! 100 7-20 7-40 7-80 7-160 7-320 7-640 7-12801 I000 70- 70- 70- 70- 70- 70- 70-
200 400 800 1600 3200 6400 1280010,000 700- 700- 700- 700- 700- 700- 700-
2000 4000 I 8000 16000 32000 64000 128000
It can be seen that to get a display with five clearly distinguishable
shades of grey that will be useful, in an ambient of 1,000 FtL requires a
tube with a highlight brightness of 11,200 FtL which would indeed require a
very bright tube. The values in this table deal only with requirements and
should be used only to indicate the approximate, and somewhat stringent
values required to meet the criter 'a suggested in this discussion. As will
be shown later, such display devices seem not out of the question. Assume,
however, a display with a filter that transmits 10%0. In a 1, 000 FtL ambient
the background brightness will now be Leven FtL for only 10% of the incident
light is transmitted both before and after it is reflected from the tube face.
114

Five shades of grey can now be achieved with a highlight brightness on the
tube face of approximately 1, 600 FtL (160 to the eye, 1, 600 on the tube).
It has also been found, however, that even a 2:1 contrast is insufficient
if the brightness of the adjacent grey steps is markediy different from the
ambient. Due to an adaptation mismatch the dimmer greys will wash out.
The conditions under which this occur are difficult to estimate from existing
data, but a re;+rc~nahle value would be when the low end of the display bright-
ness approaches 1 - 10% of the ambient. A 10% criterion will yield a higher
quality display than a 1%. This means that the brightness at the eye of the
dimmest shade of grey should never be less than 1 - 10% of the ambient.
For example, if the display is to be viewed in a 1,000 FtL ambient, and a
high quality five shades of grey image is required, then at the eye the dimmest
grey should be 100 FtL and the brightest 1, 600 FtL. If a lower quality dis-
play can be countenanced the dimmest grey could be 10 FtL and the brightest
160 FtL.
In short, this discussion says that given an ambient and the require-
ment for a given number of grey shades, the dynamic range and brightness
requirements may reasonably be estimated.
FIELD RATE
The required field rate is derived solely from the characteristics of
the eye. A flicker free image is required. Figure 45 shows a characteristic
curve oi critical flicker frequency, CFF, for a range of illumination bright-
nesses. These data were gathered in the laboratory where the typical exper-
imental conditions were whole field square wave brightness fluctuations.
However, the raster scan picture is not of this type but is created by a beam
that results in an extremely high brightness scanning spot that decays
according to the characteristics of the phosphor. The conditions under which
such a display will flicker are best determined by direct observation of
kinescope displays.
Schade (1948) has carried out such observations and the results are
shown in Figures 46 and 47. Figure 46 shows that the flicker threshold
depends on the viewing ratio, p, (the ratio, of the viewing distance to screen
115
,1 1 1 I' I

6 050 _A0A_ _F _ A
NIGHT DAVISION VISIO j
40
DARD
W -30--2 22_
20A=097 OF CYCLE DARK8:0990 OF CYCLE DARKC=050 OF CYCLE DARKD:Q0,9 OF CYCLE DARK
10/T .42LIGHT-
RATIO
-6-4 -2 0 2 4 I 2 3 4
LOG MILLILAMBERTS (m L x 0.929: Ft L) L.OG INTENSITY INCANDLES PER SQUARE FOOT
(CDLS/FT 2 x 3.142- $7t L)
(a) Field Brightness (Duty Cycle Unknown) (b) Illumination Source
Figure 45. Critical Flicker Frequency
116

ini•_ 0 I II I ! I i I J
EQUIVALENTEXCITATION A LUMINOSITY WAVE FORM
SO. FACTOR 3.2 8/B _
1.6 - - -,5%
s80 11/' T: 0.05 __
40 2 ' . __
0 00
50 I -
oo iiI4
22
50 -
L. 50 406 S 0 , 2 -0 000 0 4 6 I,0
FIEL BRGTNS (c) FOOT A0E.T
w 607
350
I...
117 1/0
-0j-
20- HEH40DST
20 2
10 L
to
tO 2 4 68 10 2 4 68 100 2 4 6 1000 2 4 610,000
RETINAL ILLUMINATION (Er) -TROLANOS
0.01 2 4 6801 2 4 681.0 2 4 6810 2 4 68100o
FIELD BRIGHTNESS (Er) FOOT-LAMBERTS
Figure 46. Threshold Flicker Values for Intermittent Illuminationj(after Schade)
117

ANODE VOLTS * 17 KV
p: 4 TO 5 -.GP-
SCANNING AREA 4.5 " X 6" (EYES FOCUSED ON CENTER) T
RASTER FIXED, NOT INTERLACED (DARKENED ROOM% T: I / CFF
DECAY EXPONENTIAL, TO 5% IN t (NILLISEC.)
o RCA SUJLFIDE -SILICATE SCREEN (BLUISH-WHITE)
* PA*TERiSON ALL SULFIDE SCREEN (WMITE) MEASURED WITH ILLUMINOMETER
X PAtTTRSON ALL- SULFIDE SCREEN (WHITE)~ MEASURED WITH WESTON
RCA AL'.-SULFIDE SCREEN (WHITE) EECRETDCL
3 70 - jo0-1
ILL5U.
w o
Ixt&01IU-oo
l
0.1 2 4 6 01 2
00 2 4 801 2 4 6 61.0 2 4 e6e10 2 4 6 11100ICRITICAL SCREEN BRIGHTNESS (BC )FOOT-LAMBERTS
Figure '.7. Critical Screen Brightness of Kinescope Fields (WhiteLight) as a Function of Field Frequency (after Schade)
118

diameter) the field rate, and the phosphor decay characteristics. The
viewing ratio affects the CFF because peripheral vision is more sensitive
to flicker than is foveal. Figure 47 illustrates much the same information
with the addition of sorne empirical data specific to four different phosphors.
All these data were gathered for unmodulated light.
Schade has this to say about the normal picture with modulated light:
"It has been observed on normal television pictures that the average bright-
ness level of the image can be raised to a value equaling, roughly, that of
the critical flicker brightness, Bc for unmodulated light without obtaining
objectionable flicker of the image. The average screen brightness
B = B = 10 to 30 FtL for present phosphors and for a field frequency ofc
60 cycles per second can, therefore, be considered as a satisfactory valueA
which permits a high-light brightness (B) in the order of 50 to 150 foot-
lamberts 1n normal television images. "
Presumably to establish the field rate requirements on the basis ofA
average brightness, B, rather than peak brightness, B, holds only if the
peak brightness is used only for highlights and the total area of such highlight
brightnesses does not occupy a large portion of the viewing screen.
Although the curves from Schade imply that the CFF keeps increasing
with increase in brightness, other data normally show the CFF dropping off
or reaching an asymtote in the vicinity of 60 cps. This issue remains
unresolved, but it is of more than passing interest because the displays of
interest require high brightness levels. If, for example, the average display
brightness at the eye were 100 FtL, and p = 4 to 5, then according to Schade
the CFF would vary between 48 to 85 depending on phosphor decay time.
With a fast decay phosphor, t = 0. 05 msec, the CFF is 85 cps which estab-
lishes higher than usual field rate requirements.
119

DATA RATE
Data rate as used in this context will mean the updating rote of a
variable. Data rate will affect the utility of the display in two ways- it will
affect continuous control performance on the one hand and influence the
appearance of the display on the other.
Variables Important for Performance
The primary determinant of required data rate is the natural frequency
of the displayed variable. In general the update rate should be at least ' ouble
the natural frequenct, of the displayed variable or double the response rate
of the pilot - whichever is lower. If the response rate of the pilot is taken
to be four cps, then the update rate for rapidly changing variables should be
about eight cps. For slowly changing variables the speed with which events
are changing would be the controlling factor.
The larger the anticipation interval - the further ahead in time that
the pilot can see - the slower may be the update rate. The exact nature of
the relationship is unknown. It seems intuitively obvious that a low data rate
with a larger anticipation interval will yield performance that is highly
smoothed.
Variables displayed linearly as opposed to nonlinearly permit glower
data rates. This is because, paradoxically, they provide less information,
prediction is easier, and the required data rate may be slower.
For the vertical situation displays the estimated performance update
minimums are:
1) All display elements respond to aircraft rotation at 6-8 cps.
2) The update requirements for display elements that provide trans-
lation information are uncertain at this time, but they will
probably vary from 1/Z to 8 cps depending on the considerations
discussed above. The data rate requirements for the HSD are so
slow that it is not a problem. The one exception is when the HSD
may be used as a flight instrument in the helicopter final approach;
then the same arguments that hold for the VSD apply to the HSD.
120

Variables Important for Appearance
The primary consideration is to prevent jumpiness in the display.
This is a visual problem and has nothing to do with the control bandwidth of
the pilot. Although no hard evidence exists, observations and experience
dictate the iollowing:
1) All display elements respond to aircraft rotation at 60 cps.
Z) The update requirements for display elements that provide trans-
lation information are uncertain at this time but from observation
are presumed to vary from 1-30 cps. The region from 5-15 cps
may prove particularly annoying however.
If a vertical situation display is to be used all the way to touchdown,
the recommended data rate for response of all display elements to trans-
lation is 30 cps.
For other cases the updating rate will depend on the visual range -
particularly the updating rate for rcal world referents like the runway. The
obtained visual range will depend on the display-computer resolution if the
runway is painted in perspective in its true size. For these cases the
further ahead the pilot can see the slower the data rate required. If he has
very little anticipatory information, 30 cps is completely safe, eight cps
will show only a few percent performance degradation, two to three cps
perhaps ten percent degradation, and rates slower than that cannot be
recommended unless anticipation is provided.
MEASURES OF RESOLUTION
Until now we have used the term resolution as though there were a
universal understanding of its precise meaning. Such is not the case, and
it is worth spending some time illustrating the relationships between some
common measures of resolution.
Classically resolution meant the ability of astronomers to resolve
the separation between adjacent stars. This is still the most common mean-ing albeit changed slightly to mean the ability of a system fo discriminate
alternate black and white stripes or some other closely placed high contrast
test pattern.
121

Unfortunately a number of definitions of sensor resolution are in
common use,. They are ger !Pa~ly tailored to specific sensors, their appli-
cations, measuring techniqudes, or simply mathematical expedients. Some
definitions are -vague or not explicitly stated; others are very restrictive.
In most cases it is difficult to deduce significance of sensor resolution on
system performznnce and to make comparisons across sensors. It is hoped
that the following discussion will shed some light on this problem.
The generzlized concept of image formation is fundamental to under-
standing of various measures of resolution and their relationships to one
another. Image formation is conceptualized as the process of reproducing
the signal intensity pattern of object space, to scale, in the image plane.
Ideally the intensity at each image point is proportional to that of the
corresponding object point, arnd there is no interaction among adjacent image
elements. No -known sensor is capable of producing such an ideal image.
In reality the signal corresponding to each object point experiences a spread
through the sensor so that its image is not a point but a blur which is most
intense at the geometrical image point and extends over the entire image
plane. The normalized intensity distribution of the point image blur is
defined as the point spread function or the impulse response of the sensor.
'The shape of the point spread function depends on the physical parameters
of the sensor. Typical profiles are shown in Figure 48. To a first approxi-
mation the point spread function of a sensor is not necessarily rotationally
symmetrical and invariant across the image plane. When a sensor contains
a number of elements which operate serially on the signal, the aggregate
point spread function tends to approach the Gaussian distribution (Figure 49).
The point spread function is an index of the image quality, including
resolution, that can be obtained by a given sensor. In essense it describes
the degree of signal interaction (or spillover) that takes place through the
sensor. Clearly each object point contributes to the signal intensity at each
image point. The relative contribution depends on the signal strength
at the object point, the point spread function and the separation of the object
and image points. Mathematically this is expressed as follows:
i (u) = k f (u) 1o (1)
where
f (u) is the point spread function,
122

DO. ttN 13... 4-I\-r_
2 It I f(X)s(
0.4 -- -I0h.2-10 -8 -6 -4 -2 0 2 4 6 8 10 -10 -8 -6 -4 -2 0 2 4 6 8 10
0 RADAR. APPROXIMATION OF (b). X b LENS MONOCHROMATIC. X
0 .4 • . .
SI a 71 ",~ -W
-5 -4 -3 -2 -I 0 I 2 3 4 5 -5 -4 -3 -2 -I 0 I 2 3 4 5
C. APPROXIMATION FOR (o0)b) ANU GAUSSIAN, X d.FILM GRAIN. 4
Figure 48. Representation Point Spread Functions
1.0 06 S
0.8 '
I Id 0-707 (-3db 1/2 POWER,",, • RADAR)
.PH- T)ECTRSHO)LD)
0 r =0.5 (50% AMPLITUDE, TV
0.4 -- _-
0-4. -3 -2q - 0 a2o 3w 4a
SPREAD, x
Figure 41, Normal Spread Function
123

ojc is the object point intensity, p dau is the separation of the object point and image point., and
k is an intensity scale factor,o•
The total intensity at an image point is the sum of the contributions of all
object points; in the limit this reduces to the convolution integral:IFI (xT, y'I -t K I (x, y) f (x' -x, y' -y) dx dy
-K I (x' -x, y -y) f(x,y) dx dy ()
whe re:
f(x, y) is the two dimensional point spread function,
I (x, y) is the object function, i. e. signal distribution over object
space,
K is an intensity scaie factor,
x1, yI are the coordinates of any image point, and
integration over all object (or image) space is indicated.
In theory, substitution of the function describing a test pattern
and a sensur point spread function into equation 2 results in a complete
description of the image. The intensity distribution in the image obviously
depends on the shape of the point spread function as well as the test pattern.
Thus the appearance of the test pattern images varies across sensors. This
fact is pointed out to indicate one of the limitation3 of the expressions deri-ved
below. Equation 2 i>-icates Lhat the signal interaction is strongest when the
point separation is smallest. When the spacing betwveen two equally intense
object points is infinitesimally small their images are indistinguishable. As
dhe points separate (assuming an otherwise uniform background) there appears
a dip in intensity between their geometric images (neglecting apparent
resolution effects) as indicated in Figure 50 . One definition of resolution
is the minimur-. point spacing at which the dip becomec consistently noticeable.
SThis definitian includes operator judgment which was pointed out to be unde-
sirable in an objective measu;re of sensor resolution. Therefore it has
become custorra.y to defin, resolution as tl1e point separation at which the
124

)-
I ILRELATIVE p
SIGNAL N - 1/2 W -L_RESULTANT INTENSITY
e 2
N + 1/ b
2b2
e 22.
RELATIVE MODULATION -M-I_ 2e
S• I+e 2
Figure 50. Formation of Point Images
contrast between the dip and the image peaks is equal to an arbitrary value.
The dip contrast is popularly referred to as "modulation. " Three criterion
values of modulation are frequently used: 50 percent for television, 26. 5
percent which corresponds to the Rayleigh criterion of optical resolution,
and the photometric chreshold of the human eye which is variou,3ly taken as
a number between 3 percent and 20 percent depending on the application.
Realization of system resoi,•aion at the lower values, in practice, is very
doubtful because the photometric threshold is generally mea!3ured by
comparing intensities of adjacent areas which are separated by sharp
boundaries; the images of testpatterns (after they have passied through sensors)
are generally characterized by "soft" edges which blend gradually. This makes
contrast detection much more difficult. The Rayleigh criterion is known to
be somewhat liberal, particularly for point patterns where shape factors are
available as clues to image separation. The 50 percent criterion is a con-
venient standard for comparison and measurement purposes. It lacks the
threshold qualities of a true measure of resolution.
125
S• r•m mm~nm • Um inm• •mmnu• nn• nin

Modulation varies as a function of object separation, the point spread
function, and tc:st pattern characteristics. The Gaussian distribution is a
good first approximation for the shapes of the point spread functions of a
number of sensor systems. T'nErefore it is used as the basis for the deriva-
tion of the relationships among various measures of resolution. It should
be borne in mind that the results are only as good as this approximatioi.
The modulation curves for a point (or line) patterr (also referred to
as delta. functions or impulses), paraliel bars and sine waves, convolved
with a Gaussian spread function (standard deviation is 0 ), are shown in
Figures 51, 52, and 53. The image formation processes for points and extended
objects are indicated in Figures 50 and 55. The basic curves shown in Fig-
ures 51, 52 and 53 are frequently plotted in terms of frequency units. Spatial
frequency is merely the reciprocal of the line separation. The above curves
may be more familiar in their "folded" form as shown in Figure 54. In this
form they are sometimes referred to as "response characteristics. " The
modulation curves for sinusoids have a number of very useful and interesting
properties. They have been given the special nxame "Modulation Transfer
Function" (MTF, normally plotted against spatial frequency or lines per unit
length). Without going into detail it is pointed out that, for serial components
the combined MTF is found by multiplication of the individual MTF's. This
property is convenient for graphical prediction of system performance
where the spread functions of individual components cannot be approximated
by the Gaussian distribution.
If the shape of the point spread function is known then the modulation
function for any test pattern is uniquely determined if a single parameter,
defining the width of the distribution, is given. Therefore resolving power
is frequently defined as the width of the impulse response at a given amplitude
or power level (without specifying the shape of the impulse response - the
Gaussian approximation is implied).
126

1 -
08 ____ -- - -- -1
06 -____ _______
4 - -
(2W) V MEASUREMENT
S• 0404 (2q) TV LINE
$ •(S) EQUIVALENT OPTICAL RESOLUTION
02 _ _ _ _ -- _ _ _ _ _ _RASTER
TWO LINES,/ OR POINTS-/APPARENTRESOLUTION
-02 LL.0 20 3v 4v 5v 60 7. 8.
LINE SEPARATION (b)
Figure 51. Impulse Modulation (Gaussian Spread Function)
1.0-
0.6
2 0.4
w
__ -OPTICAL RESOLUTIONSw p MEASUREMENT
! -/I0.2
APPARENTRESOLUTION
0 r 3w 4w 5w 6w 7.S.U
LINE SEPARATION
Figure 52. Bar Pattern Modulation (Gaussian Spread Function) 'I
127

I
10 I "I0 ?oSINE.WA
1- 06 '-_
w04>-Io
w
02_________
0 " 20, 3m 4w 5o, 7a 8so
LINE SEPARATION (PERIOD)
Figure 53. Side Wave Modulation (Gaussian Spread Function)
04%
S04
"Oft TWO POINTS
06
-02 -
0 0) 02 03 04 06 2! 21
SPATIAL FREOUENC'?°, CYCLES (OR LINES) PER UNIT DISTANCE
Figure 54. Relative Modulation Curves for Lines,Bars and Sine Wave Patterns.
1Z8

10p. 10I I II I I - -
0.8
0.0 I"0.4 f0,2 /
0_ _ _ _I II l
-6cr -5o -4oa -3a. -2a oa 0 a' 2o 3 o 4cr 5cr 6ca
SPREAD FUNCTION, ,j.
10 -. I
0.8 I0.6 -
0.4 10.2 --. _
-6ar -5a -4ar -3cr -2o. a" 0 a' 2cr 3cr 4cr 5cr 6ar
OBJECT FUNCTION, X
10 I I I
0.8
0.6
0.4
0.
6ca 5a" 4a" 30 2 r a 0 a' 2.a 3cr 4cr 5ar 6a"
IMAGE FUNCTION, X
figure 55. Formation of X Bar Pattern Image
129
= :p

UwVarious criteria and measures of resolution and resolving power are
indicated in Figures 49, 51, 52 and 53. They are related as follows:
.221(3d = 1.67a= .59s = 54p= l.llq = .71r = W = .83u -3db (3)
where
l)o d is the conventional radar resolution, also referred to as the
-3db impulse response or the width of the 70 percent contour of
the impulse response (Figure 49).
2) a is the standard deviation of the point spread function (which is
assumed to be Gaussian in this report), (Figure 49).
3) s is the equivalent optical spot size, also known as the 1 spot
size (line pair), (Figure 49).
4) p is the optical line pair resolution according to the Rayleigh
criterion (Figure 52).
5) q is the standard TV element size (half cycle width), (Figure 51).
6) r is the raster line width, defined as the 50 percent amplitude
contour of the impulse response, (Figure 5l).
7) w is the TV element size (half cycle) defined by the 50 percent
modulation level of the impulse pattern (Figure 51).
8) u is the 60 percent contour width; the MTF at this separation
apprc, imates the lowest photometric threshold of the eye; it is
sometimes referred to as the 2aspot wielth, (Figure 49) or
shrinking raster spot size, and
9) Finally, f-3db is the spatial frequency at which the sine wave
response (MTF) is down -3db (.707), (Figure 53).
130

)
The relationships among these resolution measures and their point
(or line), bar, and sinusoidal modulation values are listed in Table X.
Table X. RELATIONSHIPS AMONG VARIOUS MEASURES OF RESOLUTION
Modulation at
Element or Amplitude Line Pair SeparationResolution Line Pair at the Lines or
Measure Symbol Width Element Width Points Bars Sinusoid.• Radar Resolution d 1.67o .707 0.11*'• -. l1-; 0
Equivalent Opti-
cal Resolution S 2.83a .368 .27 .17 .09
Rayleigh Resolu-tion (Optical) p 3.08o .33 .39 .Z7 .13
Standard TVElement Width q 1.5a .33 .37 .23 .11
TV Raster Line
Width r 2.36a .500 .07 0 .03
TV50 ElementWidth w 1.67a .24 .50 .35 .17
60 percent Spot- Size (Shrinking
Raster) u 2a .605 -. 06,* -. 09 9 .007
Spatial Frequencyat -3db MTF level f 7.5a .001 .99 .94 .707
*a = standard deviation, Gaussian point spread function is assumed.
"**Negative nuniber implies apparent or fkIse resolution when object separation
equals one line pair.
The term resolution as used in the previous section on target recogni-
tion was defined as ground resolution which is related to photographic
resolution, p, by the equation:
SFR g (304.8) (R )
where:
R is ground resolution,gSF is icale factor,
R is photographic resolution (p).p
an(! ,704. 8 is the number of millimeters per foot.
131
I

When defining the resolution of the display medium (the tube) the standard
TV element size, q, is used.
A discussion of resolution would be incomplete without mention of
techniques for determining the resolution (or more properly resolving
power) of a chain of elements from the individual components. If the MTF's
of the elements are known then point by point multiplication results in the
aggregate MTF. Resolution is determined by reading off the spatial frequency
(or line separation) at which the modulation criterion is satisfied, e. g., the
equivalent of optical line pair resolution is obtained where the MTF falls to
13 percent of its low frequency value (see Table X ). When the individual
point spread functions can be approximated by the Gaussian distribution
the combined resolution can be found by taking the square root of the sum
of the squares of the component resolutions, i. e.
Id2 + 2ZId d........ d (4)
The resolution values used in equation (4) must all be defined at the same
amplitude level of the point spread functions. Sometimes conversions are
necessary. The proof of equation (4) proceeds as follows:
Let2
x
2.f. (M - e 2T.
1
be the point spread function of the i th system component (scaled by a factorof 1 ). The input sinusoid is convolved in turn with the spread
function of each element. The Fourier transform of a corvolution integral
is the product of the Fourier transforms of the individual elements:
F t(u) F1(p) F (p) . . . F n(*)
132

the transform of f.(x) is
2
SFi(LU ) f ) e dx = ef"therefore
2S( + u2 + 3 + n)F( )-"• 1 2 3**....
the inverse transform o, Zt(•) ist
-1 1 F( ) ux .SftX W F- .u) = -- dp _fT(f
substitution of Ft(P) results in
2x
2 2 22
ft(X)1 e 2(o0 + 2 +:)3+. . +0n
NtZx r'..o2 2 +73 +..
Comparison of f with f. shows that the two functions have the same shapetI
and that the equivalent standard deviation of i is the squae root of the sumt
of the squares of the individual deviations. Since the resolution element size
is defined at a constant level it can be equated to a a within a multiplicative
constant. Hence Equation (4) follows immediately from the last expression
above.
It has been pointed out repeatedly that the relationships contained in
Table X and Equations (3) and (4) are only valid when the Gaussian approxi-
mation of the impulse response is valid. It has been estimated that the
relationships are correct within ± 10 percent for all common sensors. Other
limitations include: (1) the point spread functions must be approximately
constant across the image plane and they must be very nearly rotationally
133

symmetrical, (2) linear sensor operation is assumed; highly non-linear
operation (e. g. , limiting or saturation) renders the results invalid (over
the image regions where they occur). Thus the relationships presented in
this report can only be used as first approximations. When accurate data is
desired, detailed analysis or laboratory measurements is necessary.
The use of the expressions derived above is illustrated by means
of examples:
Example 1: Suppose radar resolution is quoted as d = 15 ft. (- 3db)
impulse response. The equivalent optical resolution from Equation (3):
dp = -4-- 28. 8 ft.
Example 2: For the radar resolution of Example 1 the minimum
object separation is desired. Assuming that the Rayleigh criterion applies
and the objects can be approximated by a bar pattern then the minimum
resolvable object separation is 28. 8 ft. If the photometric threshold is
taken to be 5 percent then, from Figure 52 this minimum resolvable bar
separation, x, is about 2. 5-j. From Equation (3)
d= 1.67j = 15 ft (from above);
therefore,
2.5 dx= 2. 5a= ;-7 =2 22.5 ft.
at the 1 percent modulation level x = 2. 38a = 21. 4 ft.
Example 3: The modulation correspondiag to the equivalent optical
line separation is 27 percent. At the same separation, bar and sine wave.
modulation are 17 percent and 9 percen•t respectively. If the former is
barely visible the latter will probably not be resolved.
134

Example 4: The TV50 element width correspondLig to 15 ft. radar
resolution is 15 ft. (from Equation 3, w = d). Therefore, (neglecti.,g the
Kell factor) the equivalent TV resolution is 15 ft. Sirnilariy, if optical rresolution is p= 15 ft. then to achieve equivalence the nominal TV
resolution is w. 5 4 p (from Equation 3) = 8. 1 ft.
Example 5: Suppose the MTF is down -3 db at f = 3-- line/ ft. from
Figure 53 the line separation corresponding to -3 db is 7.5a 5-f-.' a = 4 ft.
and the equivalent optical resolution (from Table X) is
p = 3. 08U - 12.3 ft.
and radar resolution
d= 1.67 "7.7 ft.
(alternatively Equation 3 could be used without first determining a).
Example 6: ft is desired to determine equivalent visibility conditions,
for lines, bars, and sinusoidal test patterns. At high spatia) frequencies
(small separation) the shapes of the images of the three test patterns
approach each other. Therefore, equal visibility is implied by equal modula-
tion. Read across Figure 55 to obtain the spatial frequencies corresponding
to a given modulation.
Example 7: It is required to determine the frequency response
required to transmit a 1 x 1 n. mi. radar frame with 15 ft. resolution in
-sec. Irom Example 4 the equivalent TV0 resolution is 15 ft. Assuming
that a scanning technique is used then a factor of . 7 must be introduced to
account for the raster structure. This is the familiar Kell factor. The
frequency required is
f 6080 6080 1 1 6 c
R xF 15Tx x = 7 x 10⁷ cps 7 mc
135 Io

If optical resolution is quoted as 15 ft., then from Example 4 the equivalent
TV 5 0 resolution is 8. 1 and the frequency requ red for transmission of a
1 x I mi. area in To sec. is
6080 6080 1 1x x .7x -= 24.2mc
30
DISPLAY SIZE
Ignoring for the moment constraints imposed by aircraft structure
and space limitations, the ideal display size may be estimated by any of
several methods. For the VSDpanel mounted displays the size will be
determined by the required field of view, the magnification, and the observer
viewing distance. For the map displays, consideration must be given to
scale and chart coverage. For the sensor displays the ideal size may be
calculated by considering the sensor capacity, the display resolution, and
the limit resolution of the eye. In order to clarify these statements sample
cases for the VSI and sensor displays will be worked out.
Let us examine the case for a panel mountec contact analog. For
operational reasons the field of view should be on the order of * 30* in
azimuth and + 15" to -20* in -levation. To preserveý sensitivity in the dis-
play and prevent too severe a distortion, the magnificatiomn range is limited
to 0. 33 to 2. 0. At 24 inches viewing distance the above field of view at a
magnification of 0. 5 results in a display whose linear dimensions are approx-
imately 14 x 8 inches. (The 1-near size required for various fields of view
and viewing distances is shown in Table XI. ) At this same viewing di.-tance
and size a display with 560 resolution• elements (TV resolution, q, equals
about 1100 lines) will provide a resolut,.on that is not display limited. (See
Figure 39. ) For this particular display as well as the TV display when used
for flight control, it is desirable to have more resolution in the elevation
than in the azimuth dimension by a ratio of about 2:1. Therefore, if a trade-
off must be made, azimuth -eolution should be sacrificed in favor of
elevation resolution.)
136

Table XI. DISPLAY SIZE VS F'ELD OF VIEWViewing Distance, Inches
12 Irches 18 Inches 24 Inches 30 Inches
Field of View 50 1. 05 inches 1. 57 inches 2. 10 inches 2. 63 inches
100 2. 10 incies 3. 15 inches 4.20 inches 5.26 inches
150 3. 16 inches 5. 74 inches 6.32 inches 7. 90 inches
20° 4. 23 inches 6. 34 inches 8.46 inches 10. 58 inches
250 5.32 inches 7.98 inches 10.64 inches 13.30 inches
30 6.43 inches 9.64 inches 12.86 inches 16.08 inches__________________ I
Required Display Size for VSD(Unit Magnification)
For a :,,nsor display it is desirable 1hat sen.-sed information not bethrown away. Therefore the resolution capacity of the display should be
about double that of the scnsor if both resolutions are measured identically.If they are not measured identically conversicnis are provided in the sectionon "resolution". If, then, the display resolution is set equal to the limit eye
resolution then the display size can be calculated for any given viewing dis-tance. Somne displays serve sensors that accumulate information relativelyslowly. The modulation along a line as well as required field of view dictate
size in this instance.
Each of the displays is susceptible to this form of analysis, and achart illustrating the consequences of such calculations is shown in Table
XII. Some other display requirements have been added to the chart in orderthat all the information appears at one place. Examination of this chart shows
a tremendous conflict in reqnirements depending on the intended use of thedisplay. To design a single display device that would satisfy all these require
ments seems a Herculean task. The range of brightnesses, the extreme
resolution requirements, the range of writing speeds and storage times
places severe demands on any combination of displays, .-nuch less a singledevice.
137

Ar : ---a .- H
c NN
00
(i2L .1~~ z
4" . . . -
u4pi
01
0 00
138

Not considered here, of course, are practical questions of size,
weight, cockpit space, and the state of the art. What must be done in a real
operational system is to make compromises and trade-offs that will result in
designs that can be physically incorporated in actual avionics systems. For
thbee practical reasons the display sizes in almost all the displays previously
pictured have been compromised to meet the practical objection that the ideal
display would not fit in the cockpit. One must simply accept the consequence
that performance using such compromised displays will be less than ideal.
The ideal resolution requirements must also be altered to fit reality, and a
display resolution, q, of 1000 lines has been chosen as a reasonable com-
promise between what is currently available and what is really needed. The
contrast, brightness, and field rate requirements are less amenable to man-
ipulation, for if the image can't be seen or flickers objectionably, the display
is useless. Departures from the ideal in these instances is much more
hazardous.
This chart, then, stands as an estimate of ideal requirements and
one can, when designing real systems, note how far design choices depart
from the ideal. The difficulty is that the performance decrement associated
with exceptions to the ideal are impossible to calculate except in the instances
already noted. Nevertheless, this information should further the cause ofputting the selection if display characteristics on more rational grounds than
is often the case.
139

DISPLAY DEVICES
POSSIBLE APPROACHES
In order to satisfy the specific display quality requirements derived
in previous sections of this report, many approaches to the physical design
of displays must be entertained. Although it is clearly beyond the scope of
this discussion to examine each of these approaches in detail, our analysis
to follow will of necessity involve trade-offs that can only be made on the
basis of considerable knowledge of the capabilities of each approach. We
must therefore examine the more important features of each of the candidate
approaches. If in the interests of brevity sufficient detail cannot be pre-
sented, every elfort will be made to provide references to original work so
that the interested reader may pursue the subject further.
Turning to the task in hand, the factors of prime importance will be
brightness, resolution, bandwidd' or data rate, and gray scale or dynamic
range. We would like to provide an 8-inch diameter TV-type display of such
quality that little or no performance decrement would result from using it at
normal close viewing distances. For the sake of discussion let us arbitrarily
assurme this would require 1000 lines resolution and a capability of five or
more half-tone steps with highlight brightnesses in the region of oxe thousand
or more foot larnberti and/or radical contrast improvement in order that it
may be viewed in high ambients. And finally, it must be capable of TV band-
widths and frame rates. Let us now look into the possible ways of meeting
these objectives.
140

High Brightness Direct View CRT's
The high brightness direct view CRT has been the generally pre-
ferred approach throughout the years. Although some of the newer approaches
are making rapid advances, from the discussion that follows it will be evident
that the high brightness direct view CRT is still the most promising display
device for many applications. Since we will be treating this device in con-
siderable detail later, let us simply summarize its properties for the
moment. It i.ss well itdapted to raster scan. (Zworykin and Morton, 1954,
p. 290-291. ) Its thi,.oretical li,,iitations are well known (Langmuir, 1937;
Jacob, 1939; Ramberg and Morton, 1939; Pierce, 1939). We understand the
interrelationship of the ma-'iy factors governing the performance of electron
guns ;n CRT's (Law, 194Z) so that we can readily scale from one design to
another. We have detailed knowledge of the factors influencing contrast in
devices of this kind (Law, 1939). This enables us to predict the gray scale
capability and dynamic range that we may expect to achieve with a given
design under prescribed conditions. We know enough about the properties
of phosphors to design successful devices (Leverinig, 1950; Levi, 1963;
Pfahnl, 1961; Studer and Cusane, i955). And finally, we have broad experi-
ence in the design of high-beam-current high-resolution devices (Law, 1937;
Schlesinger, 1961; Schlesinger, 1962).
As will be brought out in considerable detail in a later section,
Specific Design, on the basis of this background and certain recent develop-
ments, there is every reason to believe that a properly designed 8-inch
diameter direct view CRT operating at 30 KV can be made to give an excel-
lent 1000 line resolution picture with highlight brightnesses in the 20, 000
foot lamberts range.
Storage Tubes
Direct view storage tubes offer many advantages in some display
applications. Since the incoming signal is deposit.-d as an electron image
on a separate storage surface that serves to control a continuous flood
electron beam it is relatively easy to achi-.ve high light output. The ITT
141

Farnsworth, commercially available AA08P20- 3 4-inch diameter Iatron is
AASrated at a brightness of 15, 000 foot !amberts. Unfortunately its resolution
is only a few hundred lines. Efforts to improve the resolution of this device
as required for the single-seat A7A (VAL) carrier-based attack plane and
for helicopters to enable pilots to view radar data in a high-ambient-light
environment under Navy contract NObsr 87264 have resulted in some
improvement in resolution but at the expense of brightness. The com-
promise elected here is 1000 foot lamberts highlight brightness at 65 to 100
lines per inch. Another disadvantage is that the high brightness storage tube
is not well adapted to prese,.tation of rapidly changing data.
For rapidly changing data the Hughes 10-inch H-1059BP20 Multi-Mode
Tonotron (Lehrer, 1961) offers many advantages. In this storage tube the
writing Lieam serves to write. to erase, or to present non-stored informa-
tion according to the energy with which it st:ikes the storage surface. This
comes about because secondary emission charges the storage surface posi-
tively, whereas bombardment-induced conductivity charges it toward the
backing plate potential. Since secondary emission predominates at lower
energies, the target is written on in the one case. Since bombardment-
induced conductivity predominates at higher energies, the target is erased
in the other case. Furthermore there is an intermediate energy where the
two effects just balance, and nor. stored information may be displayed. Thus
any desired effect may be selected at will. The resolution and brightness of
the proposed 12-inch (10-inch diameter -iewing Ecreen) Multi-Mode Tonotron
are in the range of 1100 lines resolution and 300 foot lamberts highlight
4 brightness. Unfortunately the erasure speed may still not be adequate for
TV-type displays and non-stored TV operation reduces brightness.
Light Valves
This type of device is attractive because the light intensity is not
directly limited by the power capability of the scanning electron beam. A
variety of light valves have been proposed over the years. Some of the
earlier systems such as the supersonic light valve Scophony system
"142

(Lee, 1938) which involves rapiuly rotating mechanical parts or the Suspen-
sion Light-Valve (Donal, 1943) system uoing graphite flakes suspended in a
liquid melium to control the passage of light are hardly appropriate to this
(liscussion, but the more recent systems such as the deformable surface
light valve, the electro-optic media light valve, and the magnetic reflective
effects light valve which ar.- presently under continuing development, deserve
consideration.
The principle of the deform-zable surface light valve as exemplified by
the Eidophor system (Thiemar- -949) used for large screen television pro-
jection is potentially applicable to our purposes. However major engineering
problems require solution for airborne application. Although the military
systems developed by General Electric are ponderous, involving racks of
equipment and requiring continuous vacuum pumping, a more recent con-
tractual effo-t supported by the Navy under contract NObsr-39400 for a
sealed-off light valve could lead to a practical device. In the large size
military unit the projector gives an output of 1800 lumens in monochrome
and 350 lumnens in field sequential color. Depending upon the diffuser
employed to control the viewing angle, the brightness would be somewhat
reduced. In the case of a perfect transmission, perfe'ýt diffusion viewing
screen, brightness would be reduced by a factor Tr to give approximately
600 foot lamberts highlight brightness in the monochrome picture. The
observed resolution in these devices is of the order of 500 lines. It is not
known whether greater resolution can be easily achieved.
Electro-Optic light valves have also been widely used over the years
(Zworykin, 1954). A crystal plate of ammonium dihydrogen phosphate
(NH 4 H 2 PO 4 or ADP) is employed as a light valve. The scanning electron
beam develops an electrical potential across the corresponding plate which
changes the velocity of propagation of the ordinary and extraordinary light
rays causing modulation of the polarized .ight. This system is currently
being re-examined by the Air Force at Autonetics; under Air Force contract
AF 30(60Z)-3263-RADC. Experimental tubes have been delivered. Images
have been observed, but this does not seem to be a serious contender for the
present system.
143

Light Reflection approaches of several kinds are currently being
investigated. Under Navy contract NObsr-91199 the Laboratory for
Electronico is investigating the changes in reflectivity of thin magnetic films
containing fine pnrticles in colloidal suspension as controlled by magnetic
field effects. Another approach has been the chemical electro-deposition
of a reflective film as exemplified by work at Aeronutronics under Air Force
contract AF 30(602)-3010-RADC. Although theec variable re-f.ection devices
have potential future interest, their present capability is to barely produce
an image and they are certainly not contenders for the present systeyn.
Photochromic Dyes may also be used as a light valve. They ire
transparent themselves until they undergo a color change upon activation by
ultraviolet light. The light activator can be derived from a CRT with a flying-
spot scan, a laser, or a mechanically deflected beam from a lamp. When
the activation light is removed the induced color can be made to fade at a
rate which is controllable and the reversible color change can be repeated
many times. The colored portion appears as a dark area on a display screen.
The optical density, the color, the rate of fade or persistence, depends on th;e
intensity and spectral distribution of the activation light on the tempe rature
of the layer and on the characteristics of the material. A considerable range
of persistence and colors are presently available but this approach is hardly
a contender for the present system.
Lasers
There is no doubt that lasers will play an important role in future
display devices. Because their light output is highly collimated it may be
conveniently directed in a single direction. The problem is to deflect the
light beam over the raster. Deflection by acoustic means (Giarola and
Bilieter, 1963, p. 1150-1151) was suggested soon after the laser became
available. Tests on systems of this kind were soon thereafter reported by
Bell Telephone Laboratory workers (Cohen and Gordon, 1964). Electro-
optic means have also beer, used to deflect laser beams. The variation of
Pockels electro-optic effects in crystals such as KHI2PO 4 gives rise to
144

useful deflection when high electrical potentials are applied (Fowler, Buhrer
and Bloom, 19.4, p. 193-194). Unfortuna~ely the acoustic and electro-
optical deflection means are all limited to relatively small deflection angles
and correspondingly few element diameters. At best these systems appear
to be capable of resolutions of only a few hundred lines.
The only promising laser deflection system so far developed has been
the psuedo-mechanical system developed by Texas Instruments ft t- RADC
undcr Air Force contract AF 30(602)-3271. In this system a 100 milliwatt
cw laser is modulated by a KDP modulator. The modulation beam is hori-
zontally scanned by a spherical mirror which focuses it onto a piezoelectric-
driven fiber-optic scan converter. The beam is next directed to the mirror
of a galvonometer-vertical scanner and then through a projection lens to a
screen. With a FZ 5. 5-inch focal length projection lens, a 5-foot lambert
highlight brightness picture is obtained on a one meter square viewing screen.
The resolution is approximately 525 x 525 lines. Translated to a picture size
of 6 inches x 6 inches, this corresponds to a highlight brightness of 250 foot
lamberts. Since CW lasers giving power outputs up to 5 watts, either are or
soon will be available, this means that highlight brightnesses of the order of
10, 000 foot lamberts may become feasible.
Other Possible Approaches
For the sake of completeness, consideration must also be given to
electroiumines cent devices. Electrolumines cent panels may ultimately have
a number of advantages but are probably not important in this survey because
of their relatively low brightness and the necessity of matrix switching. At
beF their brightness is limited to a few hundred foot lamberts and switching
requires relatively high voltages. The low brightness stems from the lack
of persistence. To be successful, such devices will require the additional
feature of a storage element. Much work is going on in this a- Ca and
panel-type display devices will undoubtedly become important in the future.
Injection electroluminescence, or semiconductor luminescence is
similar to that of i, jection lasers except that coherent light is not required.
Photons are produced in semiconductor.3 through electrical injection of
145

minority carriers and their decay by radiati , recombinations. It is
achievable by forward biasing of p-ui junctions. Injection electroluminescence
will undoubtedly become important in the future for it has a number of advan-
tages. It uses low voltages, in the order of 2-10 volts, which is readily
obtainable from semiconductor matrix switching devices. Very high light
intensity, up to thousands oi foot lamberts, are technically possible at
relatively high efficiency. Selection of colors should soon be available.
"Uowever, the technology is in an earlier stage of development and it will be
several years before any useable devices are ready for experimental evalua-
tion much less ready for system applications. Also there is the problem that
the discrete'elements must be excited by a matrix arrangement rather than
by e. raster scan. This effectively remGv:s it from consideration in the
present 4nstance.
PREFERRED APPROACH
On the basis of the foregoing survey of possible approaches it is
clear that the high brightness direct-view CRT is still the most promising
display device for the present application. To emphasize this point the
table below shows the relative performance of the several possible approaches
as related to highlight brightness and resolution. Also included are other
rejevent remarks for each device.
POTEN TIAL CAPABILITIES
HighlightApproach Brightness Resolution Remarks
Direct View CRT 20, 000ft.L. 1000 lines Conventional approach
Laser 2,000 1000 Psuedo-MechanicalEarly state of'14evelopment
Light Valve 1,000 500 Complex
Storage Tube 300 1000 May be difficult toerase
146

L
It should be emphasized that considerable judgement is required in
relating highlight brightness, and resolution in each of -he systems, particu-
iarly in the case of the laser system. The projected vah-es are optimisitc
and presume that the system will not fail by overheating and that ibe present
525 x 525 line system can be sca]ed into a 1000 line resoiution system.
Similar arguments apply to the tabulated data for storage tubes. Storage
tubes with brightnesses of 10, 000 foot lamberts are available but the resolu-
tion is inadequate and they cannot be erased. Only the Multi-Mode Tonotron fcapability for rapid erasure can be considered in this instance and projected
tubes of the future have a highlight brightness in the range of 300 foot lamberts
at TV speeds and a resolution in the range of 1000 lines.
With a 20, 000 foot lambert highlight brightness direct-view CRT we
should be able to do quite well even under the most unfavorable ambient of
* direct sunlight. If we assume that direct sunlight illumination is 10K footcandies and that the CRT reflectance is 0.5 without a filter covering the GRT, Ithe best we could do would be highlights 20K foot lamberts and lowlights 5K
foot lamberts for a contrast ratio of '. However, with a 0.2 transmittance
filter over thn CRT we could have highlights of 4K foot lamberts and lowlights
of 200 foot lamberts for a contrast ratio 20. The relationship of contrast
ratio to filter transmittance is clearly indicated in the following table:
Apparerv Apparent IFilter Highlight Lowlight
Transmittance Contrast Brightness Brightness
per cent Ratio ft. lamberts ft. lamberts
100 4 20, 000 5,000
30 13 6,000 450
20 20 4,000 2C0
10 40 2,000 50
147

SPECIFIC DESIGN
Langmuir (1937) has shown from the basic laws of 4.lectron optics that
the ultimate ratio of current density at the screen to that at the cathode in an
electron beamn forming device is
5 (1)is (I E; e 2Ij-' - -KT--) s in T
Where:
3s = current density at the screen
jo = current densicy at the cathode
E = beam voltage
e = electronic charge
K = Boltzmann's constant
T = absolute temperature of the cathode
0 = beam angle
Pierce (1949, pp 116-144) has shown that this ultimate cannot be realized but
that a compromise must be made betwee:n intensity efficiency and current
efficiency. More specifically, two-thireks of the above density-gain can be
realized if 40 percent of the total current emitted is sacrificed. With these
factors, equation (1) transforms into
2 e 2_Ib = 0.6 d j EoE•- sin0 (2
Where:
Ib = beam current
d = spot diameter
To achieve the greatest possible cathode current density we would
use a dispenser type cathode ana operate with an emission density in theof 20 am/m -bw olrange of 2.0 amp/cm. 13 achieve the largest possible sin we would
employ magnetic final focusing with a specially shaped lens (Law 1937).
Although final focusing may be accomplished by either magnetic or retarding
type electrostatic lenses, Law (1937) found experimentally that larger
148

aberration-free apertures could be obtained wit! magnetic lenses than with
conventional concentric cylinder electrostatic lenses. The reason for this
is simple. Although the aberration-free aperture of conventional concentric
cVlinder Lenses may be increased by enlarging the lens this is only accom-
plished by a sacrifice in magnetic deflection sensitivity which depends upon
the bulb-neck diameter. Magnetic lenses located outside the tube envelope
are not restricted by bulb-neck diameter and may therefore be made suffi-
ciently large to give abberation-free apertures several times greater than
conventional concentric cylinder electrostatic lenses. 'With the magnetic
final focusing lens and electron gun illustrated in Figures 56 and 57 below
taken from that reference, it was possible to compress a 2. 0 ma beam
through a 0. 004 inch diameter aperture at 10 kv with an emergent beam
angle of approximately 6° and then image this beam onto a viewing screen
ZZ0 mrm away into a spot 0. 010 inches in diameter.
MAGNETIC SECOND ANODESDEF -ECTION YOETERMINALFIRST CROSS -OVER -FORMING
DELCTO YOK /TRIASYSTEM
t
OF THIS STRUCTURE\
FINA FO UINGUR MAGNDET AICL ES MAGNETIC SHEL
OF S E I L E I N T GIVEA T O M SE O D A OD
,
[;...•-:a~ Xl X X X xX xX V V V -
.LOW
SPHERICAL ABERRATION
BEWTEL BENDFLCTING WFLUORESCENT
1120 AMPERE TURNS REQUIRED
AND ESCREEN
FOR A
AO,000-VOLT
BEAM
Figure 56. General Assembly of a Developmental Projection Kinescope
149

TUNGSTEN W:RE CONTACT TOAQUADAG ON BULB WALL
ELECTRODE NO.
COATED AREA O ELECTRODE0.05 DIAMETER_
INDIRECTLY oHEATED CATHODE
ELECTRODE NO. APERTURE SZE ELECTRODE VOLTS
0 0.152" 0I O.C36" 1002 0.061'' 2003 0.052" 20004 0.004" 1000O
Figure 57. Details of the Electron Gun
The viewing screen in this tube was 4 inches in diameter. In the
present instance we require an 8-inch diameter viewing screen and a spot
diameter of 0. 008 inches, If we redesign the structure as shown in Figure 58
below leaving the object distance unchanged but change the image distance
from 160 mm to 280 mm and make allowance for the fact that the voltage has
been increased 3-fold and the current density has been increased 20-fold the
numerical values to be inserted in equation (2) will now be
d = limiting aperture diameter 7 0. 0017 in. = 4. 3 x 10⁻³ cm
jo = current density at the cathode = 2. 0 amp/cm2
E = 30, 000 volts
e = 11.6KT
sin ) = sin (30) = 2.7 x1
150

FINAL FOCUSING MAGNETIC LENSOF SPECIAL DESIGN TO GIVELOW SPHERICAL ABERRATION
1120 AMPERE TURNS REQUIREDFOR A 10,O00-VOLT BEAM
MAGNETICDEFLECTION YOKE -
._INNER WALL -- 280MM
AIC FLUORESCENT
FIRST CROSS-OVER-FORMING MAGNETIC SH!ELDEYSTEM WITH 0.0017 INCH BETWEEN DEFLECTINGDIAMETER LIMITING APERATURE AND FOCUSING FIELDS
Figure 58. Redesigned Kinescope
This indicates that a beam current of2
Ib = 0.6(4.3x10- 3 ) (2. O)(ll.6)(3xlO4 )(Z. 7xlO- 3) 2Z1ma
should be possible.
The proposed deflection angle
tan-I1 (4) (25.4) 200280
exceeds that employed in the original instance, but the state-of-the-art in
wide angle deflection systems has improved greatly since then. By adding
dynamic focus and dynamic correction of astigmatism (Schlesinger Wagner,
1965, pp. 478-484) it should be entirely practical to work at this deflection
angle.
With a beam current of 21 ma at a voltage of 30 kv we would have a
phosphor power input of 630 watts. This may exceed the power handling
capability of the phosphor. Theater projection CRT's such as the 7NP4
151
r:; , = '' +• i'T -- -"" - ' . . l l I !P1r1 11 I . . .. .,",. .cu -+ l" r

(Zworykin, 1954, pp. 437-440) operate at beam currents of 4 ma with anode
voltages of 75 kv. This corresponds to peak power inputs of 375 watts. The
problem is obviously more difficult at high resolution but the practical
operating level will no doubt be in the range of 500 watts. It is interesting
to observe that the phosphor efficiency can be relatively low under these
conditions. If we assume 600 lumens/watt and only 6 percent effici.ent
phosphor we obtair a brightness of
Brightness - (0. 05) (500) (600) (144) = 22, 000 foot lambercs(5.7) Zr
In the 7NP4 theater projection CRT highlight brightnesses of 20, 000 foot
lamberts are obtained at efficiencies up to 7 percent so this would seem to
be a reasonable design.
AREAS REQUIRING ]IUTURE WORK
The immediately important thing to do is to build a feasibility model
of the proposed design high brightness direct view CRT. During the actual
construction many engineering compromises will be required. Preliminary
experiments must be made to optimize the various factors because there is
no existing data to indicate the behavior of many of the materials here in-
volved in the power ranges here contemplated. For example, studies should
be made of the permissible phosphor loading. Studies should be made of the
permissible loading at the beam defining aperture. Tests should be made of
the possible advantages of semi- transparent phosphors. Although transparent
phosphors have lower relative efficiencies, theydohave greater power handling
capability.
In the process of fabricating this feasibility device many new problems
will doubtless arise. Operational procedures must be developed so that the
beam can be aligned in the aperture before full beam voltage or power is
applied to avoid damaging the aperture. The solution of problems like these
is well within the state-of-the-art for experts in the field. It. would be highly
desirable to engage a contractor with broad experience in the several critical
areas of high current density cathodes, high current density CRT's and high
power dissipat on capability phosphors.
152
V _00- _________

For the long term picture materials research is desirable on improved
phosphors particularly in -he, area of semi-transparent phosphors since they
have the capability of better resolution and greater power handling capability.
In the still longer term picture we must closelywatchthe progress being made
by other devices, particularly lasers. Although the techniques for laser
deflection are as yet rudimentary, it seems highly probable that the lasers
will one day be the preferred means of generating high brightness displays.
153

i.
SENSING AND DATA PROCESSING
OVERVIEW
With the view of determining the criti,-al sensing and data processing
problems that accompany the use of the candidate pictorial displays, an
examination of the allowable error allotment for each of the pictorial displays
was conducted where applicable.
The VSD skeletal and contact analog displays are, compared to con-
ventional instrumentation, extremely high gain displays that will not inher-
ently damp signals generated by the sensors. It makes no sense, however, to
have such high gain and fast response in the display unless the sensor system
can provide accurate, relatively noise freýe, short time constant intelligence.
Based on our knowledge of the threshold read-out capabilities of the pilot
when using such displays it is possible to estimate the requirements for some
of the more important accuracy and tempora) characteristics for each dis-
played dimension based solely on perceptual. rather than operational consider-
ations. The results of such an excercise are provided in Table XIII for the
representative case of a display with unit magnification, a symbol. line width
of 3 mils, and tube with a vertical dimension of 8 inches and a resolution (q)
of 1000 lines viewed from 24", The bias error values were based on our
knowledge of thresholds for each displayed dimension. The variability figures
were based on best guesses. The dead time and time constant. were based on
t0-esholds for the perception of casual relations.
The requirements for the HSD map displays were shown in the sketches
illustrating those displays. The requirements for the zaw sensor displays do
not I-ad themselves to this form of description and therefore have been omitted.
154

444
0~~ 0~*
H cc c c c . - i.
7.-. 7 4- - -
4: 4:*4~U u *.4 .- 4 44 4- 4- 44 44 4- 4- z 7-1Ž
-c a r 4.
0 D 0I 0 0D 0 0o
"cc rs
o: o * o a a o o Z Z
- A~
0 'o0-o - o INo
::))
0 0
o~- .2r
u. 2. r. o _h w G its t .C. ooc (m o44 th 4
4o 0 u ulo
co i 1- .q.4"o 0" 30 ua~c0 -:I vZ0 o 0 0 00Zo ~4,
H: t0)- >~ x 1.< u < u z zo to
155

The values shown in this chart are indicative of the sensor require-
ments for each display parameter. Although the accuracies required are, in
some instances, more stringent than obtained in current operational aircraft,
they are by no means beyond the state of the art. Those that, in our judge-
ment, are clearly within the state of the art have been considered non-critical
items and little time was spent in further examination of them. The necessary
policy has been to narrow down the range of issues studied in order to concen-
trate the. effort on those items that are not currently sensed or those functions
that are critical for the system to achieve the required accuracy or response
rate. The critical problems have been summarized in Table XIV.
The table shows, for each aircraft type, display type, and mission
segment, the parameters or functions that are critical or novel. The cell
entries in the chart are necessarily terse so in order to clarify the meaning
of each of the cell entries a description of the problem suggested by each cell
entry will be made. Cells will be identified by column number and row letter.
Some of the critical problems that have been isolated will be discussed in full
in a later section of the report.
A-1: Take-off, Fixed Wing, Skeletal VSD.
With few exceptions all of the parameters displayed on the skeletal
flight display as illustrated in Figure 20 may be sensed quite adequately by
state of the art equipment. Two important exceptions are the aircraft velocity
vector and the desired or command velocity vector. It is not difficult to con-
ceiv-e methods for deriving the velocity vector in any system that has an
inertial or Doppler navigator already on board. Provided adequate symbol
quickening is employed to obviate the misleading transients that occur (as
discussed previously), the problem of sensing and displaying the velocAty
vector does not seem acute. It is mentioned here only because display Cf
this parameter is both novel and important.
The phrase "paramet-e prediction, " occuring in cell A-1 and subse-
quently, refers in the ideal case ýo the display of the predicted velocity vec-
tor. Prediction of the aircraft velocity vector would take considerable data
processing equipment, and it is believed that a reasonable approximation can
be achieved by employing turn rate and pitch rate. The "prediction" must be
over some reasonable time interval, and the precise nature of the prediction
remains to be worked out.
156

Table XIV. CRITICAL FUNCTIONS WITH IMPLICATIONSFOR SENSING AND DATA PROCESSING
FIXED 'ING STEEP GRADIENT
VERTICAL MISSION SEGMENT MISSION SEGMENT
SITUATIONODSPLAY TAKE*OFF POINT TO APPROACH TAKE*OFF POINT TO ArPROACH
AND POINT AND AND POINT AND
CLIMB NAVIGATION LANDING CLIMB NAVIGATION LANDINGi2 3 4
I VELOCITY
I. VtLOCITY VECTOR I VELOCITY
I VELOCITY VECTOR 2 PARAMETER VECTOR SAME AS 2A 1AME AS 3AVFCTr- 2 PARAMETER PREDICTION 2 PARAMETER PLUS Of.'YACLE PLUS. OBSTACL E
SKELETAL 2 PRAMETER PREDICTION 3 VELOCITY PREDICTION AND WINE AND WIRE
PEfItCTION 3 VELOCITY VECTOR 3 OBSTACLE AVOIDANCE AVOIDANCEVECTOR COMMAND AND WIRE
COMMAND 4 LANDING AVOIDANCESPOT
A LOCATION
I VELOCITYVECTOR SAME AS AA
A PARAMETER SAME AS &AANALOG PREDICTION SAME AS 2A SAME AS 3A PLUS VECT OCITY SAME AS SA SARE AS A
I VELOCITY VECTORVECTOR COMMANDCOMMAND
SAME AS 2C
FRAME TIME. PLUSDYNAMIC CHARACTER. LASER VSG
LITERAL N A IANGEAND iSTICS OF FOR WIRE SAME AS 2C. .JC SAME AS 3CRESOLUTION NON.AUTONOMOUS AVOIDANCEOF SYSTEMS
IR & LLTV (**M;CRO.VISION'*)
C
MISSION SEGMENT MISSION SEGMENT
HURIZONTAL I¢,ITUATION •'AKE.OFF POINT TO APPROACH TAKE-OFF POINT TO APPROACH
DISFLAY AND POINT AND AND POINT AND
CLIMB NAVIGATION LANGINE CLIMB NAVIGATION LANDING1 2 3 4 S 6
SKELETAL x N.A. NA N A NA N.A N.A.
I POSITION 1. POSITION
1 POSITION UPDATE I POSITION UPDATEMAPS, UPDATE UDT
CHARTS 2. FUEL-RANGIE 2 LANDING UPDATE 2. LANDING
I INITIAL mEASUREMENT SPOT I. INITIAL 2. FUIL.RANGE SPOTINIIA SPOCTIO MEASUREMENT LOCATIONAND POSITION & COMPUTATION OATIN G POSITION & COMPUTATION & WINDREFERENCE 3. VE[LOCITY HA|O&CMUAIN •WN
MATERIALS VELCTOR 3 VELOCITY 3 VELOCITY 3. VELOCITYCVECTOR VECTOR VECTOR
COMMAND COMMAND COMMAND
Y
THE USE OF
PATTERN IADAR, IR, &
SENSOR N.A L.ASER DEVICES SAME AS 2Z N A SAME AS 2Z SAME AS 2Z
DISPLAYS POR OBJECTRECOGNITION
z 1 1
DISrLAY FUNCTIONS OR PARAM7TERS THAT ARE CRITICAL OR NOVEL
IN TERMS OF SENSOR AND DATA PROCESjING REQUIREMENTS FOR TWO
VEHICLE TYFES AND THREE MISSION SEGMENTS
157

The representation of the command velocity vector can probably be
omitted from the display during take-off. It has been assumed throughout the
study that fixed wing aircraft are carrier launched and that in such launching,
the initial phases of clirabout may he achieved satisfactorily by pitch rotation.
A-Z: Navigation, Fixed Wing, Skeletal VSD.
Here again the parameters displayed are not unusual and are similar
To those discussed in the previous paragraphs. Added to the display is a
command symbol representing the optimum velocity vector. As At is intended
that the pilot control the velocity vector, an index of desired as well as cur-
rent performance is desirable. When an end goal is in sight on the display
(the landing strip) a command velocity vector may not be required. When
the end goal is not in sight or when for other reasons the aircraft should fly
within certain constraints, then it is required that the display present not
only the end goal but the path to the goal, i. e., the command velocity vector.
In the vertical plane the achieve-ient of this desired vector constitutes a
longitudinal control program for the aircraft, and the primary considerations
Sin the phases of flight we are considering are time, fuel consumption, and
kinematic limits. If the symbol representing the command is to move in both
az and el, the calculation of the optimum and the conversion of this to an az-
el steering signal for the pilot nm:utst be carried out. The optimization of the
trajectory in the vertical plare is the prerequisite for defining the command
velocity vector in that plane.
Generation of the optimum velocity vector in the horizontal plane is
nothing more than the familiar navigation problem of calculating the appro-
priate track, taking due regard for weather, terrain, enemy defenses, and
the like, and it is difficult to conceive of analytic ways of determining the
optimum horizontal velocity vector. Course programs established during
briefing can be stored visibly on the map and, if necessary, converted to a
steering command for the pilot. If, while the aircraft is on an individual
sortie, changes in the planned course are to be made after take-off on the
grounds of information derived from autonomous sensors, then such changes
most likely will be carried out by extensive use of the HSD display which
would be used to display the newly assimilated data.
158

In conjunction with other equipment, the HSD couid be used as a basis
for generating lateral steering commands for the pilot. In addition to the
fact that the solution to this problem does not lend itself to formal analysis,
the issue is basically not one of sensing or data processing but one of working
out logical procedures for the aircrew to use in exploiting the HSD, an on-
board computer, autonomous sensors, and other associated equipment. As
exploitative procedures roust be worked out individually for each unique sys-
tem, it was decided that attempts to derive an optimum lateral velocity
vector should be dropped and that the emphasis should be placed on the more
generic problem of optimizing the velocity vector in the vertical plane.
A-3: Landing, Fixed Wing, Skeletal VSD.
The additional information required on the display for the landing
phase is the location and heading of the carrier. How to sense this in gen-
eral terms is not difficult to conceive, but how to achieve the required
accuracy and reliability if one assumes the necessity of landing without the
pilot ever establishing visual contact is not readily apparent. There are
also secondary display problems that have to do with drawing the carrier
with the correct perspective and in a scale suitable to the resolution limits
of the display tube. The problem of locating the landing spot is generic,
being required for all landing displays, and is therefore one that is
considered critical.
A-4: Take-off, Steep Gradient, Skeletal VSD.
The takeoff display requirements for steep gradient vehicles are
similar to those of other aircraft with the exception that because of their
flight characteristics and their normal operational milieu, obstacles such
as trees and wires assume greater importance. To avoid such lethal objects
the pilot must be informed of both their presence and position. Logical
places to present such information are on the windscreen during contact
flight or on the VSD during instrument flight. Because the space in which
the vehicle operates is described in feet rather than miles, the sensor
problem for helicopters is compounded by the requirement for measurement
at extremely short ranges.
159

A
A-5: Navig;,tion, Steep Gradient, Skeletal VSL).
No unique problenms.
A-6. Landing, Steep Gradient, Skeletal VSD.
The problems of approach and land:ng for steep gradient vehicles a:-e
similar to those already discussed with the exception that the landing spot
must be located with extremt- accuracy, and this spot -ray be a simple clear-
ing rather than the carrier. How to do tLis with both autonomous and non-
autonomous sensors are major issues.
B-I through B-6: All Phases, All Aircraft, Contact Analog.
With the exception of North, East, and vertical velocities the analog
display for these mission segments requires no more sensed infcrmation
than the skeletal; the only difference is the form of encoding the data. The
change that represents the rnost marked departure from the skeletal display
is to encode the command velocity vector as the so-c.allect "flight path". It
takes ten dimensions to specify the plane of the rib;.)( ai for each straight
segment, zand if the ribbon is to be painted correctly as a so-called "highway-
in-the-sky" then this data must be supplied for each such segment. If a
curved ribbon is desired the problem is even more complex. TILe generation
of the optimum velocity vector as a command ribbon is not so ruuch a
problem of sensing as of data processing.
C-I: Take-off, Fixed Wing, Literal VSD.
Not applicable.
C-Z: Navigation, Fixed Wing, Literal VSD.
The major issue in the use of az-el literal displays on the VSD during
navigation has to do with the frame time, dynamic range, and resolution of
possible sensors: LLTV and IR. It is envisioned that either of these tech-
niques could conceivably be used at night in order to identify checkpoints and
thereby aid in establishing a fix. For high-speed fixed-wing aircraft, this
application has a promising potential.
160

C-3: Landing, Fixed Wing, LTtcyal VSD.
"The use of literal sensors for landing was discussed in previous
sections, and it was pointed out that such use depended or the attainment of
certain characteristics of the sensor display system. It should also be men-
tioned that raw data sensed by LLTV or IR could be mixed on the display with
symbolic information, for example, by mixing the skeletal display in registry
with the LL'1V output.
C-4 through C-6: All Phases, Steep Gradient, Literal VSD.
Nothing unique.
X-1 through X-6:
Not applicable. Skeletal Horizontal Situation Displays are already Ideveloped and in operational use as standard instruments.
Y-1 through Y-6: All Phases, All Aircraft, Analog HSD. (Maps and
Reference Materials)
Inthe map displays the basic sensing and data processing problem is
to position own~hip and otber symbols correctly. A second problem is accu-
rate positioning of the fuel-range circle which depends on fuel measurement
as well as standard navigational computations.
Z-I through Z-6: All Phases, All Aircraft, Literal HSD. (Sensor Displays)
With inertial or doppler sensors, integration errors result in
accumulated position errors that would lead to serious consequences in those
instances where the aircraft operates close to the ground. Such errors may
be corrected by position updating the navigation system using identifiable
checkpoints whose positions are known. This would normally be done in
conjunction with the display of raw data. As the primary use of the raw
display is to allow the operator to identify the checkpoint, the major problem
is to be able to stipulate the conditions under which the operator could recog-
nize the target where the term target is used in the broad sense to mean any
physical object.
1
161

The operator's ability to classify and name targets is directly related
to the characteristics of the pattern sensor. As was suggested previously,
once such a recognition is made, the way is open to use the imagery directly
as in the example of landing the helicopter in the clearing or indirectly to
update the navigation system. The information gleaned from these pattern
sensors or other sensors may also be used to supplement information appear-
ing on the map display by superposing raw with stored da:a and thus allow the
display of current information important in a rapidly charging tactical
situation.
Summary
From this discussion a list of crucial sensing and data processing
problems that have been analyzed may be drawn up. This list is not exhaus-
tive but contains only those critical items that will be discussed in following
sections of this report.
1) Sensors that permit the recognition of significant objects through
the media of displays are required for some mission begments.
The output of such sensors would be used by the crew to:
a) update the navigation system
b) add current data to map display for tactical use.
2) Sensors that detect obstacles during helicoptei or VTOL takeoff,
landing, and low altitude navigation.
3) The problem of sensing or calculating the velocity vector. This
is a requirement for all the flight displays.
4) The calculation or derivation of the command velocity vector in
both the vertical and horizontal plane as well as means for con-
ýerting the information to a signal appropriate for moving the
display symbol. Calculation in tle vertical plane is a require-
ment for all flight displays. The horizontal optimum will be
largely dependent on locally sensed threats and therefore may be
determined by the aircrew.
Each of these problems will be discussed, in turn, in the following
section.
162

NAVIGATION UPDATING
One of the major uses of the HSD display is to employ it for the
presentation of pattern sensor information in order that the. crew may acquire
and designate targets, checkpoints, and landmarks. The general conditions
that would enable the crew to identify "targets" were discussed in an earlier
section of this report. In this -.ection the particular case of utilizing pattern
sensors to update the navigation or fire control system will be further analyzed
with the view of determining sensor requirements.
When the informatiorn from such sensors is displayed, the display may
be used for updating by having the crew designate checkpoints whose geograph-
ic coordinates are known. This implies that the possible checkpoint position
error is considerably smaller than the accumulated navigation error. Even
if the desired checkpoint is part of a larger complex there are many regions
of the earth where the natural geography or the political development is such
that there is a dearth of large unique objects or patterns that would form such
a useful complex. This means that small checkpoints must be used - these
may be small lakes, clusters of buildings, terrain features, or other identifi-
able features. If these features are small with respect to sensor resolution,
then they would not be usable as checkpoints. However, with relatively high
resolution sensors such as coherent on ;eceive doppler systems (CORDS) and
high resolution forward looking infrared sensors (FLIR), some of these
features become identifiable and hence usable as checkpoints.
System Requirements
In order to determine the sensor requirements for position updating
using small checkpoints, we are proceeding with an assumption of navigation
subsystem accuracy derived from manufacturers' specifications. With this
parameter set, required fields of view, resolution, contrast, resolving
capabilities and rough costs of various advanced sensors - low light level
television, forward looking infrared, and high resolution radar -must be
traded-off to determine subsystem requirements. Such a trade-off study is
included here. Table XV defines the symbols used.
163

Table XV
Symbol Description Units
S Azimuth Feet
R Range Feet
"N Navigation System FeetAccuracy (I sigma)at the time of fix taking
KI, K?, K3 Constants 0 C radians sec /2(K )
h Altitude Feet
Temperature Sensitivity 0,-n
8 Angular resolution Radians
Tls Scan efficiency
n Numlber of detectors
Solid angle field of view Steradians
Azimuth field of view Radians
0 Elevation field of view Radians
t Scan time Seconds
1. S ZR sin-2
2. R= Klh
From previous experience 10<K <20
2a. R 15h
combining 1 and Za3. 30h sinI= S
For a 95 percent chance (2 a-) of having a checkpoint within the field
of view
164

"4. S=4oN
Combining 3 and 4
5. 7.5h sin aN From IR sensor considerations!X~n 2 (nNt/
6.2 1/26. AT S (-n nt) K
~1/22
7.
8. q=K 3 0
For reasonable coverage in the along track path
8a. q30Combining 6 and 8a
f AT 6Z(flnnt)l/2n n9. =K,8
Using state of the art parameters, i. e. , AT n 0. 5 C, = 1 mrad,
Ts = 0.8, n = 36, t = 2.5 sec, and 8 30, K2 can be found.
-61G. k 2 = 14 x 10
Using this value and combining 5 and 9
11. 7. 5h sin 0. 62 x 10 ATns2 (r snt)/ 2
For AT61 On ry n, and t fixed at 0. 50 C, . n±r, 0.8, 36, and 2.5 sec,
respectively. Figure 59 shows one sigma navigation accuracy required (ON)
as a function of altitude h.
For h, 6, T s, n, and t fixed at 500, 1 mr, 0. 8, 36, and 2. 5 sec, respectively,
Figure 60 shows o"N as a function of ,fTn*
For h, ATn, n ,sI n, and t fixed at 500, 0. 50 C, 0.8, 36, an- 2. 5 sec,
respectively, Figure 61 shows 0N as a function of &
165

1200 20 1 1AT71 0.5 -C h 500 FEET
t =25 SEC 19 t=25 $E1-- -S--
8 = I MILLIRADIAN w S-IMILLIRADIAN
"" 18
u IISoo 16 -~ ' I7 7 7 7*,1[ U
_ I 5 - -- 1-
-z -15
600 2 14> L
0• I 2--------z_-- 13K400 12
_________0__ _L___________ _' 2 9
0 200 400 600 800 04 05 06 0.7 08 os, i0 i I 12
ALTITUDE h FEET TEMPERATURE SENSITIVIT{ -': Tr/C
Figure 59 Figure 60
=,- 36 -___ __ '___ ___ ___
w h:500 FEETI ,I I
I 324 -IT--5o r--- -- •------~ •-
4z
S20 ---
12o LK~ I0
2 -16 - fi + --Az 20
Z 0 - -I
zw 04 ------0
0 605 0 15 20
RESOLUTION h MILLE RDIATS
Figure 61
Navi~ation Accuracy As A Yunction of Three Variables
166

When the best checkpoints are also the most heavily defended, it is
desirable not to overfly the checkpoint for updating purposes. This desired
offset technique could be implemented with a laser used in conjunction with
IR or TV and appropriate coordinate transformation in a navigation computer.
This is known as offset navigation updating.
Offset navigation updating can be most important as a compromise
technique enabling both navigation accuracy and enhanced survival probabili-
ties. If the checkpoint is well defended it may be absolutely mandatory to
employ this technique.
Many problems are raised by the consideration of this technique.
Firstly, it becomes desirable to have real time checkpoint recognition.
1however, for reasonable offsets and realistic checkpoints this is often
impossible. A solution to this is available by taking a radar "'snapshot" of
the area in which the checkpoint is expected to be and examining the resulting
display later.
The snapshot technique requires a number of equipments to solve
problems which arise from its use. For instance, a means of keeping track
of time and aircraft velocity since the time of taking the snapshot is needed.
In addition, a method of extracting radar range to the checkpoint after many
seconds or even minutes have elapsed because of display search and
recognition time, is also. needed.
An operational sequence which would be employed is indicated here by
steps.
1) Point sensor in accordance with the expected location of the
checkpoint.
2) Pop up.
3) Generate a "snapshot" of the area with the expected coordinates
:f the checkpoint as the'center.
4) Return to a safe altitude.
5:, Study the "snapshot" - identify the checkpoint.
6) Place cursors over the identified checkpoint.
7) Enter the updated position in the navigation computer.
167

IThe specific equipments needed to implement this technique are:
1) A high resolution sensor2) A navigation system
3) Servo drives on the sensors
4) An accurate clock
5) A means of ranging
6) A velocity sensor
7) A computer
Various parameters associated with the required equipments must be set so
that the checkpoints can be recognized and updating accomplished accurately.
These parameters are:
1) Sensor resolution
2) Sensor field of view
3) Sensor positioning accuracy
4) Navigation system position accuracy
5) Velocity sensor accuracy
6) Ranging accuracy
7) Clock accuracy
8) Computer accuracy
9) Display dimensions
10) Display resolution
Recognizing small checkpoints can be a difficult task. A formula
based on work done by H. H. Bailey of the RAND Corporation expressing the
quality of visual imagery needed for recognition has been used (Bailey. 1960).
A change in one term should allow its use with radar imagery.
PR 0.1-e •[5 5 - .-- 7.51
- I OTrA
DK
168

c = contrast
N = number of resolution elements subtended by the checkpoint
B = 4 Zubtended by checkpoint on the display
AT = target area
AD = area field of view on display
T = search time of display area
K = fraction of display area that is of interest
By assuming a display size and permitting a long search time, AT
may be computed if an overall value of the last bracket is set. For an over-
all value of PR = 0. 95 the last bracket should equal about 0. 98. Thus, for
an eight-inch diameter tube and a search time of 60 seconds- 10x 6 0AT
0.98 = 1 - e l64
4
2AT = 0. 327 in satisfies this condition
This means that a checkpoint linear dimension of about 0. 57 inches
should bt, displayed. If the entire display represents a linear ground dimen-
sion of two nautical miles, then the checkpoint ground dimensions must be
about 850 feet by 850 feet. This is a pessimistic value since the value of K
was assumed to be unity. Actually the availability of charts, maps, radar
imagery, photographs or other aids should permit localization of the display
search to an octant. This in turn will decrease the required area of the
checkpoint by a factor of eight and thus a 300-foot by 300-foot checkpoint will
suffice.
The above value scaled to the display dimensions and an assumed
viewing distance permits evaluation of the penultimate term. Thus
( - e 7.- ) 0. 991 for a viewing distance of 18 inches and a 0. 2 inch
checkpoint display dimension. The value for a 0. 327 inch display dimension
is essentially unity.
169
If - .

The display and sensor resolution determine the value of the second
term; a 500-line display and a sensor resolution of 25 feet places 12 linear
resolution elements-on a 300-foot checkpoint dimension. This leads to a
value of 0. 91 for the second term. Overall probability of detection versus
sensor resolution is shown in Figure 62.
The first term contains a contrast factor which is applicable to visual
situations. In the radar case it should be replaced by a signal to clutter
ratio term. We can assume that the characteristics of the checkpoint and the
radar design leads to a value of unity for this term. The overall probability
of recognition then becomes (for a 300-foot by 300-foot checkpoint).
PR = I x0.91x0.99x 0.98 = 0.884
For a 600-foot by 600-foot checkpoint the recognition probability goes to 99
percent. Figure 63 shows a plot of probability of detection versus checkpoint
dimensions. It will be noted that if the curve shown in this Figure is con-
verted to definiition vs. PR' then the curve falls in the region called Level I
recognition illustrated on Figure 36. There is excellent agreement between
the requirements based on Bailey's equation and those derived from empirical
data.
04ECK PCtNT DIMENSIONS 1.0
09 _300 FT z 300 FT 009 SEARCH TIME 60 SEC 0.9
0DISPLAY DIAMETER 8N I: :N_
2 2
z 0.6 z 0.6
:!• £,i -. ,- .5•- I .. ." 0 C- 0.2
S0 . ... ...
m< 0.4 0.4 - --. .
CDc
a . 0 .20 2
SEARCH TIMS 60 SEC
00. SENSOR RESOLUTION 25 FT
DIPAY DIAMETER 8 INI I I _
0 100 200 300 0 100 2CO0 300 400 500 600
SENSOR RESOLUTION (S) FEET CHECK POINT DIMENSION-FEET
Figure 62. Detection versus Figure 63. Detection versusSensor Resolution Checkpoint Dimensions
170

System Ac.:uracy
We can now consider the accuracy of the updating procedure. An -
analysis yields the results shown in Table XVI.
Table XVI. NAVIGATION UPDATING ERRORS iISource Factor Errors I
x Y
Display nonlinearities 1%o of distance from center 30 ft 30 ft
Registration 1/32 in. 47 ft 47 ft i
Map Accuracy 1/30-in. X scale 139 ft 139 ft
Inaccurate timing VAt = 1000 x 0. 04 40 ft 0 ft
Inaccurate velocity TAV = 60 x 3 180 ft 180 ft
Computer round off Computer complexity -0 ft -0 ftversus error
1Heading Error VTAH '-' 1000 x 60 x 1 0 ft 35 ft
Sensor Inaccuracies AR 100, ft
AO = mrad 112 ft 4 ft
= 1 mrad
Altitude error coupled Ah = 2 ft 5 ft 0 ftwith checkpoint offcenter on display
Total 269 ft 236 ft
This corresponds to a CEP of about 307 feet.
An explanation of each of the error contributing terms is given below.
Display Nonlinearities
If we assume that the video circuits are used to generate the cursors
which are used to pinpohiL the location of the checkpoints, the nonlinear error
can be confined to the transfer between cursor positioning knobs and the input
voltages to the video circuits. If this error source is trimmed to be zero at
the display center, then zero error will result when the checkpoint is
i7

precisely centered on the display. However, for a one sigma error of 1/2
nautical mile at updating, a display of two naut. mi. diameter of ground area
and a one percent nonlinear error, the updating error is 30 feet in each axis.
Regis tration
This error stems from human inability to locate centers or other
critical points of areas and position cursors over such centers or critical
points. Human factors studies have indicated that a value of 1/32 inch is
representative of the error resulting from a comnbination of these effects.
This represents a value of 47 feet in each axis for the displayed area.
Map Accuracy
For maps drawn to 1:50, 000 scale the accuracy of a point is 1/30
inch X scale.
i Inaccurate Timing
Keeping track of the time between information gathering and check-
point registration is subject to an error which could be as small as 50
microseconds. However, due to priorities within the computer, the error is
more likely to be about 0. 04 seconds. Thus, the along-track error is the
velocity times the time error or 40 feet for a 1000 ft/sec velocity.
Inaccurate Velocity
The time required to detect, recognize, and identify the checkpoint
multiplies the velocity errors in each channel and thus contributes to the
position ei'ror. It is important to note that since updating does not affect the
internal navigation loop the velocity error remains undiminished after a
position correction. To insure a high probability of identification we have
chosen a search time of 60 seconds. This value times a per channel velocity
error of 3 feet/second results in an error of 180 feet per channel.
172

Computer Round Off
This is a cost-accuracy trade-off problem. If, for other purposes, the
computer has la.-ge storage capacity which can be used for a navigation up-
dating f-inction every 20-30 minutes the error can be negligibly small.
Heading Error
This error actually exists at all times. When considered as part of
the overall updating error, it contributes a cross track error equal to the
range covered multiplied by the heading error. The range covered between
the taking of the "snapshot" and the checkpoint identification is the aircraft
velocity (V) multiplied by time (T). Thus, this error is VTAH where AH is
the heading error. Using values of V = 1000 ft/sec, T = 60 seconds, and
AH = 2 minutes - a manufacturer's specification, the error is 35 feet.
Sensor Inaccuracies
There are two inaccuracies associated with the sensor which contribute
to the fix taking error. Referring to Figure 64 it is seen that!
hR
x
Figure 64. Error Analysis Geometry
X = R cose
h = R sine
ax= cosOaR
a = -R sineah
ah = sineaR
ah = R cosOae
173
11 W, 7

For no change in altitude at the moment of fixing:
ah -ah
Substituting the above expressions and using
ax ax
one obtains
RAOx sine
The cross track error is simply
E R cos OA4y
Using values of
R 5000 feet
0 = 5. 74 degrees
ý :45 degrees
AO = AI = 1 milliradian
AR = 100 feet
one obtains
E = 112 feetx
E = 4 feety
Altitude Error Coupled with Noncentered Checkpoint on the Display
This error exists because an altitude error creates a picture whose
dimensions are other than those expected. Reference to Figure 65 shows:
sin(-) (insin
R XJ
174

h
Figure 65. Geometry for Error Due to Alt. Error
For small
__ 2
sine -±cosO sin 0-!~cos b sin ,
When the checkpoint falls half way between the center and the edge
of the display (a one-sigma case) the checkpoint to display center dimensionXi
is". Evaluating the above expression ate = 40 -= 1, and using
the _& ':-ilue one finds the error is 2. 34Ah. For a fine radar altimeter
zAh = 2 teet and the error becomes 4. 7 feet. The cross track error isne gligiltic...
Equipment Penalties
equipment needed to perform offset fixing is listed in Table XVII,
along with esIimated weights, volumes, power drains, and costs. This,
data should permit tradeoff analyses to be conducted when the military value
of enhanced mission success can be meaningfully inserted.
175
V - mw um m w m • • nm w~u• mm mnm mw mm • • r ~• -L Po.mmm nuqw~w nm n n ~ ulmnlm~~m" .

Table XVII. EQUIPMENT PENALTIES
PowerEquipme-it Weight Volume Req. Cost Remarks
Side looking 280 lbs 4. 0 ft3 1. 8 KW 130 K Possibly neededor side for targetingsquintedradar
Servo Drives 15 lbs 0. 4 ft3 200 watts 20 K Needed on radar
Inertial 50 lbs 1. 5 ft3 150 watts 75 K Some rnavigationalPlatform sensor needed
always
Computer 12 lbs 0. 2 ft 50 watts 25 K Some smallercapacitycomputerneeded always
Display ? Needed for otherS~functions
Alternate Sensors
There are other pattern sensing techniques employing pictorial
displays which can be used for position updating. Among them are:
IR Fixing
TV Fixing
The following paragraphs describe operational techniques which can be
employed to update the navigation system using either of the methods
mentioned above.
IR Fixing
This mode is different than the radar snapshot mode. The main
reason for this is the low frame rate of the IR sensor. This, together
with the necessity of scanning to achieve good resolution creates a problem.
The scanning pattern coupled with the aircraft motion gene rates a distorted
image, This can be corrected somewhat but only at iae expense of field of
view or resolution.
176
3-
" h a l • mm m~mlsmmlm mm~mmPImmmmm mmommm~wm mm ( m mu mmmmmmm m.m-mm m- m u m m • m
This small field of view greatly limits any J.R snapshot mode. How-
ever, there is another possibility -using the IR with a slow frame rate and
tracking the area to inini.xiize picture distortion. Even with this precaution,
however, changing aspect angles make recognition quite difficult. The
primary use of this sensor is real time small target dete'tion and can be
considered as a navigation updating aid only because it may be present for
its primary purpose.
TV Fi:'-ing
A low light television sensor can be used in two ways to enhance
checkpoint recognition. Both real time and snapshot modes can be
accommodated. In the former case, the senso- is fixed with respect to the
airframe and the coverage is generated by the aircraft's motion. The ground
coverage is a function of thc sensor field of view, elevation angle, and slant
range. For the elevation field of view equal to the elevation angle, the
ground coverage is about 4/3 times the slant range. For a slant range of
10, 000 feet and a vehicle velocity of 1000 ft/sec, this leaves about 13 seconds
for recognition. This requires large or otherwise prominent checkpoints.
When a checkpoint is detected, the sensor can be made to track the check-
point to allow more time for recognition and identification.
In the snapshot TV mode, the sensor is pointed at the checkpoint area
with the center at the expected position of the checkpoint. The scene is
displayed and "firozcn" for as long as required. The operation is then very
similar to the radar fixing case.
In both the IR and TV cases the range to the checkpoint is not known.
For accura'e updating a laser range finder can 'oe used to determine aircraft
to checkpoint range in those cases where rec3gn-tion takes place in real
time. In the nonreal time case, the range to the center of the scene at the
time of the sensor generation of the display can be measured. When the
checkpoint is subsequently found, a correction can be made to account for
an off-center image.
177

OBSTACLE AND WIRE DETECTION
Because helicopters are relatively slow and vulnerable, flight at
extre.rnely low altitudes or use cf nap-of-the-earch tactics become necessary
to ensure survival. At these low altitudes obstacles such as trees, towers,
bridges, and suspended wires or ropes become significant flight hazards.
As was stated in previous sections many obstacles, particuilarly wires and
cables, are difficult to detect even under the best visual conditicns. Thus,
sensors capable of detecting these obstacles are required for ultimate dis-
play of "wire" obstacle information. The small size of wire obstacles
requires accurat e high resolution sensors. Consideration is therefore
limited to lasers.
Operational Considerations
"Many studies have been conducted to determine optimum terrain
clearance techniques and equipment mechanizations. Most notable of these
studies is the work conducted by Cornell Aeronautical Laboratories (CAL)
on Advance Concepts for Terrain Avoidance (ADCON). These studies have
been concerned with analyses of methods for enabling a penetrating aircraft
to fly sufficiently low so that exposure to enemy air defenses is minimized.
Emphasis has been placed on techniques suitable for flying at a minimum
altitude while following the vertical contour of the terrain. Some effort has
been given to a study of azimuth coverage necessary for turning flight to
avoid obstacles. The aircraft velocities considered have generally been in
the region of Mach 0. 5 to 0. 9. Relatively little work has been done to study
terrain and obstacle avoidance requirements for helicopters.
The characteristics of the helicopter that makc it very vulnerable
to enemy fire of all types are its slow speed (220 knots maximum for future
helicopters), large vulnerable area, and relatively low degree of protection
provided for crew and installed equipment. In order to improve survivability
and achieve surprise for attack, the helicopter crew performs nap-of-the-
earth or contour flying whenever the possibility of enemy observation or fire
exists. Nap-of-the-earth is defined as any route that affords cover for the
helicopter. Such flight generally occurs at very low altitudes (0 to 30 feet)
178

and can include flight up valleys and among or behind trees. Because flights
are frequently at extremely low altitudes, many man-made structures such
as bridges, towers, and power lines are threats to safe flight. A more im-
portant category of safety threat is obstacles that an enemy can deliberately
place in the path of aircraft to deny low -level flight along a specific route.
TheEe obstacles will probably consist mainly of horizontal wires or ropes
strung between hills or trees but may also include vertical members sus-
pended, for example, from balloons. In addition to the deliberate placement
of such "wire" obstacles by a hostile force, there is the very real problem
of casual wires that are a serious hazard in a completely friendly environment.
The unique performance characteristics of helicopters allow sensed
obstacle data to be utilized in a different manner from that for fixed-wing
aircraft. Helicopter speeds in the 1975 era may range from 0 to 220 knots,
with most flying being done in the range of 100 to 140 knots. Allowable
bank angles up to 60 degrees will provide very high turning rates. The
combination of high allowable turning rates, and the desire to use nap-of-the-
earth tactics may require considerable azimuth scan coverage.
The conditions unrler which the helicopter -s used will range from
daytime visual to night/all-weather. For daytime use it is unlikely that
equipment can be designed to provide closer terrain clearance than is
possible by manual flight. However, detection equipment will be required
even under the best visual conditions to detect wire or cable type obstacles.
These appear to pose the most serious threat to the low flying helicopter.
For night or all-weather use, the helicopter will be able to fly safely
at slightly higher altitudes and the problem of terrain clearance more closely
resembles that studied for the conventional tactical fighter. In this case,
the studies, experime~its, and simulations which have been conducted by
Cornell Aeronautical Laboratories are directly applicable.
System Requirements
System requirements arise primarily from consideration of the types
of obstacles encountered and the tactics employed to avoid them. On
detection of an obstacle along the aircraft flight path, two choices of action
179

are available: the aircraft may fly over or around the obstacle. fhe main
factors affecting the choice are:
"* Vertical and lateral aircraft or crew acceleration
"* Aerodynamic and operator limits lags
"• Critical dimension of obstacle
"* Navigation/turn avoidance conflicts
"* Enemy defenses/turn avoidance conflicts
The selected sensor must be capable of obtaining critical dimension data
for the obstacle in sufficient time to enable a decision and safe nminimum
clearance avoidance action. The system requirements imposed by the above
considerations remain to be determined.
Consider an aircraft performing a horizontal obstacle avoidance
maneuver. The assumptions inherent in this example are:
"* The obstacle is detected in -4ufficient time to make a maneuver
decision and to perform the maneuver.
"* The obstacle avoidance system can determine the target
dimension.
"* The aircraft makes two coordinated turns at 30-degree bank
angle during the avoidance maneuver so that the resultant heading
change is zero.
Based on these assumptions the required minimum slant range to the obstacle
is approximately
aL V8 Ve aveRmin =4 2e aL + , tD)
where,
R = slant. range to obstacle
a L - aircraft lateral acceleration (0. 5 g)
V = aircraft velocity (220 knots)
0 = width of obstacle
tD = decision and reaction time (5, 5 sec)
180

Example minimum range results, plotted as a function of aircraft
velocity, are shown in Figure 66.
The obstacle clearance error IAC) is determined, in part, by the
measurement errors in range and angle. The permissible range error,
(AR) for a fixed acceptable obstacle clearance error, may be determined
from the following equation:
AC 2 R cosý+. aL R 2 sin j
AR:
[sin -1I aL
where 'b is the direction of the obstacle relative to the aircraft velocity
vector andAý is the error in this measurement. Results are shown in
Figure 67 as a plot of range error versus aircraft velocity for the conditions:
'P= 5 degrees
A4'= 4 milliradians
AC = 25 feet
G) 5
40
U 23
06
I I I0 100 200 300 400
Aircraft Velocity, Knots
Figure66. Allowable Range Error for25-Foot Obstacle Clearance
181 .
-- :. . . . . .. . . . . mm m

The above results are illustrative only; it is necessary that future
analyses of this general type be conducted to define the required sensor
operating range and allowable measurement errors. Subsequent sensor
studies and tests can then be compared with these requirenrrnis. These
studies should include consideration of both vertical and horizontal
avoidance techniques against various types of obstacles.
The beam coverage envisioned for the takeoff and landing phases is
different than that for cruise. For these relatively short-,range and low-
speed phases the search angle should be about 30 degrees and the maximum
cutoff range need only be about 400 feet. The scan pattern should provide
high probability of detecting any 5-foot vertical rod within 50 feet of the
intended touch down spot. Wires 5 feet or more above the terrain
background should be detectable at near maximum range.
During the cruise phase the minimum warning range should allow two
seconds for pilot reaction plus an additional three seconds for the helicopter
to clear a 10U-foot obstacle, or otherwise avoid it. The laser beam mustsweep out a 100-foot diameter safe passagewvay at this minimum warning
range. There should also be a maximum cutoff range and a range at which
an isolated wire can be detected against a difficult background. The laser
device should be able to detect reliably any wire-like obstacle which is 10
percent closer than the background (or 10 feet closer, whichever is greater).
SI0 "120
S1000
W 800)Z 60
tv 4: O
20~ 0
0 I• 0 I .. .
0 100 200 300 400Aircraft Velocity - Knots
Figure 67. Allowable Range Error for 25-foot Obstacle Clearance Error
182

Lascr Cbstacle Detection Considerations
Although laser frequencies will not provide all-weather obstacle
detection, the high frequ3ncy does offer potential .7or detection of small tar-
gets under visual conditions. Furthermore, since lasers will be included on
many helicopters in the future, their inherent obstacle detection capabilities
should be investigated.
The system constraints on laser design can be most easily under-
stood by referring to the fundamental range equation for the case where only
a portion of the transmitted beam intercepts the obstacle. This would be the
case for obstacles narrow in one dimension such as a wire. The range
equation may be written as
N s =E I-v " R TKAT T2lt Qr
ft R
where
N = number of signal photoelectrons required for detectionS
E = laser pulse energy, joules
Bq = detector quantum efficiency
h = Planck's constant
v = laser frequency
K = effective target reflectance
AT = area of target illuminated
A = area of receiver aperturer
T = atmospheric transmission
TIt = transmitter optical efficiency
71 = receiver optical efficiency
0 t = transmitter beam solid angle, steradians
R =- range
183

When rearranged as shown below, the left side of this equation repre-
sents .hose parameterc specified by the system designer while those on the
right represent parameters to be optimized in equipment design.
ý'Zt R4 = Ej *rI 71t Tqr
K AT A AT h v NsTr
The optimum system for a given set of conditions must be found by
appropriate tradeoffs. Thus the beam width should be sufficiently wide to
ensure interception of the obstacle but must be traded off against required
detection range, as well as other parameters, so that the state of the art
(represented by the terms on right side) is not exceeded.
The beam shapc and method of scanning niust be optimized with
reference to obstacle detection and comprehension of features as required
to determine appropriate evasive maneuvers. Target reflectivity and con-
figuration are fundamental to this study.
The aperture diameter is constrained by aircraft installation considera-
tUons. Since the receiver aperture is closely related to the required laser
energy, a tradeoff must be conducted.
Atmospheric transmission is a function of range as indicated by the
equation
Te (a+P) R
where c and P are the atmospheric absorption and scattering coefficients,
respectively. Because these are both a function of wavelength, atmospheric
conditions will enter into the selection of laser operating frequency.
System weight does not appear explicitly in the range equation. How-
ever, it is a function of laser energy a ld receiver aperture and thus should
be traded off against other variables.
184
Tradeoffs within the equipment design area must include the selection
of a laser as a function of operating wavelength with reference to atmospheric
transmission, efficiency of optics, and particularly to detector efficiencies.
Photomultiplier detectors have low quantum efficiencies but compensate for
this by providing noise-free gain at the input. Solid-state detectors, con-
versely, have high quantum efficiencies, but in general provide no gain. The
choice of detector, then, depends not .,nly on frequency but on the source and
level of the limiting noise.
Laser Signal Detection
Although separated by more than three orders of magnitude in the
spectrum, the basic process for detection of obstacles remains the same at
laser wavelengths as for millimeter wavelengths. There are, however,
differences in the detection mechanization.
The mechanism for generating electromagnetic radiation at visible
and infrared frequencies, for example, is based on atcmic and molecular
energy levels, involving bound rather than free electrons and is at present
almost two ord.-rs of magnitude less efficient than millimeter-wave genera-
tion. Thus, while in principle the shorter wavelengths may permit a more
compact transmitter, the higher energy density may prevent realization of
this advantage. i
At wavelengths of a micron or less, a transmitting aperture 1. cm
in diameter is adequate to define the beam, in the diffraction limit, to about
0. 1 milliradian. On the other hand, the requirement that the receiving
aperture be as large as practical for maximal collection of returned energy
remains unchanged.
Atmospheric t.-ransmission generally is reduced at laser wavelengths,
since scattering increases as wavelength approaches molecular or particle
dimensions, and may be highly dependent on wavelength due to absorption
lines. Target refl.ectance, whether diffuse or specular, and effective target
cross section are more sensitive to surface conditions than at longer
wavelengths. These effects, which ran be assessed qualitatively from our
185

own visual experience of objects under illumination by headlights or spot-
lights, have been the subject of only preliminary studies to date and require
much further investigation in order to obtain quantitative data needed for
valid systems analyses.
Photon detectors are by their nature square law detectors inasmuch
as output current is proportional to input power. For this reason, incoherent
signal detection in the presence of noise is a function of peak power (for a
given signal energy) and leads to the conclusion that an appropriate system
might utilize a giant-pulse laser operating at as high a peak power and as
low a repetition rate as allowed by available power and required data rate.
An optical pulse compression technique might be used to enhance further the
effective peak power. Another approach, however, makes use of signal
coherence; optical heterodyning provides a mechanism for raising a signal
out of a noise background so that detection approaches dependence on signal
statistics alone. Under these conditions, detection depends just on signal
energy received, thus permitting the effective use of CW lasers for detection.
"The various approaches to improved signal detection require further study
so that valid tradeoffs can be made.
Eye Damage Considerations
It seems evident that to take advantage of the laser's easily achieved
narrow beam widths and short pulses to perform a 3-dimensional discrimina-
tion in range and angular direction between wires and (say) ground, a scanning
technique must be used. If this discrimination is to be fine grained enough
to be of operatiohal utility, a very high repetition rate, ultra short pulse
laser source of sufficient power is required. Further, the wavelength should
be one where very sensitive detectors are available to minimize required
transmitted power and in this way to minimize the eye damage potential of
the system. This has not been possible with conventional Q-switched solid
state lasers. It is only recently that advances in the laser state of art has
given promise of a source which will meet these requirements.
186

The argon ion laser operates in the blue-green region of the spectrum
where detector sensitivity is substantially greater than at ruby wavelengths
and several orders of magnitude greater than at the neodymium ion wave-
length (in a glass, calcium tungstate, or YAG host). This laser can be
operated in a pulsed manner by modulating the input. Our aralysis indicates
that the laser requirements of the system at the argon ion emission wave-
lengths (in the blue-green) are: 10 nanosecond pulses of 100 watts power at
a PRF of 10, 000 per second. This corresponds to a microjoule per pulse
or only 10 milliwatts average output power. In addition, reasonable dimen-
sions are necessary and an efficiency of 5 x 10 - or better is required to
stay within readily available power capacity.
The state of the art in argon ion lasers approx-rmately a year ago was
characterized by pulsed operation of the required pulse length and peak-5 .
power, but with an efficiency of the order of 1 or 2 x l0 in a rather over-
sized tube. Steady, swift progress in use of new electrode techniques and
magnetic confinement have resulted in compact argon ion CW units with-3
efficiencies of the order of 10 and with average output power approxi-
mately 2 orders of magnitude higher than required. We believe that with
sufficient effort these advances in CW operation can be transposed to short
pulse operation. Another candidate, though less attractive from the view-
point of detector efficiency, is the pulsed Neon laser. This, too, should be
examined. Future advances in the detector state of art could possibly make
semiconductor injection lasers of interest.
A previous analysis (see Figure 66) shows a detection range of 1000
feet is suitable for a slowly moving (about 80 knots) helicopter. If we use
this detection range with a 10 milliwatt average power laser having 1Z cm
optics the resulting energy density is approximately equal to 10-8 joules/cm2
for no beam spread. This amount is equivalent to that to which we estimate
some of our laboratory personnel are exposed. These people have shown no
evidence of retinal damage after several years of periodic examinations by
medical experts from UCLA. In the case of a dark adapted eye, this energy
per pulse is slightly greater than the 10- joule at the iris recommended as
187
I

safe by the office of the Surgeon General. However, in the case of a day-
light adapted eye, the energy even meets this more stringent safety
requirement.
Experimental measurements indicate that for damage to rabbit
retinas the threshold energy density is both a function of time and retinal
area as shown in Figure 68. The correspondence for rabbit and human
retinas under conditions of high intensity levels such as occur with laser
energy sources has been substantiated by Weale (1964). Of particular inter-
est to the system suggested here are measurements reported at the Washing-
ton Laser Conference on Biological Effects (sponsored by the Army Surgeon
General's Office) by William Ham, who reported a threshold at the retina of
0. 07 joule/cm2 for a 0-switched ruby laser pulse of about 25 nanoseconds
duration. The diameter of the spot in his experiments was of the order of
1 millimeter; since the threshold is found to be an inverse function of the
spot size, it will be conservative to use this value for smaller spot sizes
107
106 1N
105 NNIS
l 04 N.
SlO3
102
101 I I I I I10-8 10-7 10-6 10-5 10_.4 10_3 10_2 10_i 10_0
Exposure Time in Seconds 2Figure 68. Log-log plot of power density in watts/cm versus exposure
time in seconds for the production of very mild lesions in therabbit retina. The straight line represents data for reth.al imagediameters of 0. 8 mm. Some data pul.ats for image diametersof 1. 0 mm (circles) and 0. 54 (crosses) are plotted for the longerexposure times. The data point at the extrapolated end oi thecurve represents a Q-switched pulse.
188

such as wiUl normally occur due to the focussing action of the eye. Based on
his value, the damage threshold will be reached at a level of 2 x 10-.72
joule/cm at the entrance pupil of the normal, light-adapted human eye,
where it is assumed that the light is focussed down to the diffraction limit at
the retina. For a dark adapted eye more light will be admitted by the d'la-
tion of the pupil with the possibility of its being concentrated in an even
smaller spot. (The spot size is unlikely to reduce by much in practice, how-
ever, due to the reduced depth of focus. ) Since the threshold increases with
reduced spot size, and since the maximum dilation of the pupil represents one
order of magnitude in area, we can expect that an energy density of 10-8
joule/cm 2 will be below the damage threshold under both day and night
conditions.
VELOCITY VECTOR SENSING
General
In the VSI displays the incorporation of a velocity vector symbol was
suggested in order to inform the pilot oW the velocity vector with respect to
the ground. The information to drive the symbol does not exist in appro-
priate form in current systems and a requirement therefore exists to
determine how this information may be ser sed or derived through processing.
The determination of the velocity vector in space involves sensing
three quantities. There is some choice in selecting quantities that make up
the velocity vector. One choice is the combination of the magnitude of the
vector plus two angles which define the spatial rotation of the speed scalar.
Another choice is the combination of three orthogonal components of velocity.
Various equipments exist for sensing the above quantities. An iner-
tial platform senses three orthogonal accelerations and when each output is
integrated once yields three orthogonal velo.ities. A doppler navigation
radar yields either three velocity components or horizontal velocity vertical
velocity, and drift angle.
189

I: The ranges of each type of equipment makes either or both suited to
both Itypes of aircraft being considered. However, the need for rather pre-
cise alignment techniques makes an inertial platform impractical for a
helicopter operating in a primitive environment.
Accuracy
It is necessary to examine the accuracy obtainable with this equip-
ment. For the inertial platform we will consider a simplified velocity error
propogation. This is done by differentiating position error equations which
is not an absolutely rigorously correct procedure but does include all first-
order effects, This main source of error and the corresponding velocity
error expressions are given in Table XVIII.
Table X VIII.L:
E r r or Source Velocity Error
Accelometer Bias (B) B sin w tto00
Platform tilt (0y(0)) Ro 0 (0) sinw ty 00y 0
"Accelerometer Scale Factor K AV cos w ty 0
Error (K) AV = change in velocityy
Gyro Drift (e R E (Cos %t )y o y0
Initial Velocity error -A' (0) cos 0 t(At (0))
Initial Azimuth Error 0z(0) R x (cos o t-l)
(9(0))
190
J

Using the error source values below, the overall rms velocity error
is just under 1 ft/sec (0. 96 ft/sec)
B = 5 x 10-
= 1/800 rad.0
0 y(O) = 5 secs KK = 10-
E = 0. 001 0 /hr
R = Z. 09 x 107 ft
x (0)= 0. 5 ft/sec
ip (0) = 100 secz
V = w = 1000 ft/secx 0 x
AV = 100 ft/secX
Similar values exist in each of three orthogonal channels and thus the
angular accuracies can be calculated for any given set of velocities and the
associated errors.
To a first approximation for small vertical velocity and small drift
angles
AVAS-•Vz+Vzx
andAV
Vx
For
V 1000 ft/secx
191

and .
AV = AV -1 ft/secy z
V = 50 ft/secy
AG = 10-3 ra= 0 rad
&6ý= 0-3rad
For
V = 200 ft/secx
AO= 5 x 10⁻³ rad
The error in the magnitude of the velocity vector is:
V= + A2 2 + \[3= ft/sec
for I ft/sec errors in each channel.
Thus, the angular errors are a function of velocity while the magnitude error
is not.
The errors obtained with a typical doppler navigation system are:
AV =± 0. 2% V x 0.2 knots
AV = 0.2% V .0.2 knotsy y
AV =0.5% V z 0.25 knotsz Z
For
V = 1000 ft/secx
20= x 10-3 radians
A5 = 2 x 10"3 radians
19J
192

For
V = 200 ft/sec
Ae r 2.25 x 10"3 radians
A-= 2.5 x 10⁻³ radianf
The error in the magnitude of the velocity is
AV=0.35 0. Z%V 0. 2%V +0.5%Vx y z l
In this case the angular errors are practically constant with varying
velocity but the magnitude ei ror depends on velocity. The display of the
velocity vector is confined to positioning a symbol in azim,:.th and elevation.
The elevation and azimuth angles are found from the following expressions:
V+V-1 z0tan +0 ,V Z + V 2o : "
V x y
p V
6 =tan 1 y +6V 0
x
Future Investigations
An area for further investigation remains. There exists a tradeoff
between lag and signal smoothing in both the doppler and inertial equipments.
In the case of the doppler equipment a one-half to one second
smoothing time constant is purposely incorporated. This results in an
unacceptable lag for displaying a landing dot which is to be flown.
Theoretically an inertial system should have a fast response (one or
two milliseconds). However, it has been found that due to non-rigid mount-
ing this is not the case. It is not known whether a more rigid mounting
might result in unacceptable noise levels to plague the system.
1993

It becomes important to gather data to resolve the above.
An additional avenue of investigation presents itself when the idea
of using this information (the velccity vector) to aid in .\nding aircraft on
carriers is considered. The basic accuracy of the information and the
possibility of incorporating the complex carrier deck motions into a com-
mand vector appropriately displayed should be investigated. This coupled
with radar could provide an all-weather landing capability.
4
194
DETERMINATION OF COMMAND VELOCITY VECTOR
On the VSD skeletal display a symbol repreJenting the command
• velocity vector was suggested. Similarly, the flight path in the contact
analog display, if used as a command flight path, requires the calculation of
the command velocity vector to provide inputs to the flight path display gen-
"erator. As was stated in earlier sections of this report the calculation of
• the command velocity rector for the mission phases considered can be conve-
iently analyzed only in the vertical plane. The derivation of optimum
turning maneuvers escapes formal analysis and in a real system the plan
position and heading of the flight path will be crew selected except in those
cases where the information is derived from an external source. Optimum
profiles in the vertical plane, however, are susceptible to analysis and the
following paragraphs suggest a method whereby this may be done.
As an integral part of the MA-1 Fire Control System for the F-106,
flight paths were developed by ground-based computation, stored in the
memory of the airborne computer and flown by the aircraft. In this manner,
optimized speed-altitude scheduling was incorporated within the climb,
cruise and descent phases of flight. The techniques employed in generating
4 the initial profiles have been modified and extended for application to a wider
band of vehicles. Efforts in relation to the F-106, F-108 and two versions of
NASA supersonic transport configurations have resulted in successively up-
dating the computei program which simulates the flight and produces the
required optimum flight path. As a result, a tool has evolved which is
applicable for performance analysis and optimization determinatiGn for a
variety of aircraft. Speed-altitude schedules which optimize aircraft per-
formance with respect to several parameters are obtainable using the
computer program, operational on the IBM 7094 Data Processor. Therefore,it is possible to minimize fuel or time and to maximize specific range by
4 using the simulation.
The computer flight simulation program is applicable to any aircraft
for which the aerodynamic variables are defined. The inforraation required
to simulate a particular aircraft's mission is a complete definition of the
4
195

aircraft's lift and drag characteristics, as well as the aicraft's powerplant-
performance parameters, such as inlet drag and recovery, thrust and fuel
flow. The only possible restriction or limitation to the simulation program
in its present form is that climbs must be performed with a constant throttle
setting and descents must be performed at idle thrust. Also, the simulated
missions of the program are in the Mach-altv'ude-range plane. Lateral A
turning effects on aircraft performance are considered during holding and
loiter patterns, but the flight path track during these maneuvers is imaginary,
i. e., the aircraft change in azimuth is not recorded.
Several factors were found to influence the selection of the optimum
flight path in climb and descent for supersonic transport aircraft, which need
to be considered in computing an optimum flight path for other aircraft types.
Two are aircraft weight and atmospheric conditions. At one particular air-
craft weight and one atmospheric condition, a certain optimum profile exists
(either minimum time, minimum fuel or maximum specific range) in the
Mach-altitude range plane. A change in either aircraft weight or atmospheric
condition will cause a change in the predicted optimum profile. The extent of
this change in profile is dependent upon the type of aircraft (i. e., the possible
percent weight deviation) and the magnitude and the position relative to the
optimum profile of the atmospheric change.
Method
In order to present to the pilot of an aircraft a display which commandsA
a particular flight profile, certain inputs are necessary to drive the display
system. For the contact analog type of display system the command inputs
required (provided motion in only the Mach-altitude-range plane is considered)
are:
1) pitch angle
2) flight path angle
3) altitude
4) horizontal velocity
5) vertical velocity
196

6) aircraft airspeed
7) errors that exist between the above command parameters
and the actual aircraft values.
The above inputs must be supplied to tht. display system for a particular
flight path if that flight path is to be commanded. inputs I through 6 are jmeasured parameters that define the actual position of the aircraft (in the
Mach-altitude-range plane) and input 7 gives the error between the actual
aircraft position and the desired position as obtained from pre-stored profile
information. When the aircraft is on the desired profile, the display system
must indicate to the pilot what flight path changes are necessary in thei'immediate future in order for the desired profile to be maintained. Should
the aircraft be off the desired profile the system must sense this and corn-
mand a display which will indicate the return path to the desired profile.
The simulation program considers the aircraft as a dynamic body. F
The equations used in developing the optimum profiles are equations of
dynamic motion obtained by the free body technique with certain restraints
necessary for the dynamic programming method of solution. Figure 69 shows
the free body diagram and the dynamic equations. As can be seen by the
simulation equations, the parameters pertinent to a command display system
exist and they can be provided by the program output. For any particular
flight profile these parameters can be generated by the ground-based com-
puter simulation. It then becomes necessary to store these parameters on
board the aircraft as a part of the airborne profile control law program.
t• This airborne program would then not only command a Mach-altitude profile,
as in the F--106 MA-1 system, but would also provide the pilot with a visual
command of the desired profile.
For any particular aircraft, implementation of this command profile
display system requires study in four areas:
1) Determination of optimum profiles.
2) Effect of weight, configuration and atmosphere on optimum
profiles.
197

trajectory
V LOCITY
THRUST 1LIFT/
Y
T LG'horizontal
V1WEIGHT
Solving for E Forces Vertical and Horizontal
T Dg sin y
L T
O= O L + T-- sin 9t - cos ymV mV V
where:
V = velocity
T = thrust
L = lift
D = drag
m = Weight/gravity constant - W/g
a = angle of attack
V = flight path angle
y = 0 because no accelerating maneuvers are considered
8 = pitch angle O= + y
Figure 69. Free Body Diagram and Equations
198

3) Simplification of optimum profiles for mir.imum computer
storage space.
4) Development of the control laws wh;.ch dictate how the aircraft
shall reach the optimum profile from a nen-optirnum condition.
In the second area of study listed above, the purpose is to determine
how much deviation from a standard optimum profile is possible and whether
an interpolation scheme is feasible for between-profile-conditions. A -mini-
mum number of profiles to be stored is desirable in order to keep program
storage low.
The third area of study is for the purpose of simplifying the form in
which a profile is stored. It is possible that the- various command param-
eters can be stored as mathematical functions, rather than in tabular form.
The fourth area of study would be to determine what is the best
manner with which to bring the aircraft to an optimum profile from a posi-
tion which is not on the desired optimum profile. Included in this study
would be the command display functions necessary to indicate to the pilot
how to reach the optimum.
For a "skeletal" version of the VSD display, that is, the display of
the velocity vector of the aircraft end the command vector rather than the
command flight path, the output and computing requirements of the display
system are reduced. The system does not have to construct the command
"pathway" but, instead, displays the command velocity vector on a real time
basis.
A schematic of the command display system is shown in Figure 70.
The pilot control panel shown may be a keyboard type whereby the pilot can
input the aircraft configuration, weight and atmospheric data (if necessary).
Also, if climbing or descending, the end point Mach and altitude can be input
or a cruise control mode may be selected. Once the desired maneuver has
been selected by the pilot, the airborne program will determine the profile
to be followed (by interpolation of the stored profiles if necessary) and dis-
play this profile as a visual command to the pilot. If it is sensed that the
1
199

PILOT CONTROL PANEL
WEIGHT it
CONFIGURATION"ATMOSPHERE
CLIMBCRUI SE MACH, ALTITUDEDESCENT
AIRBORNE COMPUTER-- - --------- ....
I _
PROFILE YES COMPUTE PREDICTED
SSTORAGE PROFILE
II
ARA-NO COMMAND PROPER
"AND AIRSPEED
AIRCRAFT PILOT
Figure 70. Program Schematic
200

aircraft is nc.t on the desired profile, the program will select the control
law necessary to return to the profile and display this projected maneuver
to the pilot.
It was noted earlier that certain command inputs are required to drive
a contact analog type of display. One input is the error that exists between
the actual aircraft position and the desired profile (input number 7). This
type of input implies that there are means of determining by measurement
onboard the aircraft the inputs of numbers 1 through 6. If it can be assumed
that an inertial naVigation system is onboard the aircraft, these inputs are
readily available. The accuracy of these parameters from an inertial navi-
gation system are probably adequate for the command display system, but
verification of this fact should be made. Without an inertial navigation
system some method of physically measuring pitch angle and angle of attack
must exist in order to determine the flight path angle (Figure 1). However,
inaccuracies associated with angle of attack and pitch angle measurement
may preclude this method of approach. Also, without an inertial navigationsystem, the aircraft ground speed cannot be determined, and this factor may
be an important consideration when displaying the horizontal ground motion
to the pilot due to the fact that the difference between airspeed and ground
speed becomes more significant at lower altitudes (i. e., during landing).
However, aircraft ground speed may be available from some other source
such as a doppler system.
A flight path command display system may also be utilize'1 as a
predicted flight path display system. Assuming that the necessary inputs
have been measured (inputs 1 through 6 and their derivatives), the flight
path can be projected ahead for some finite time period and displayed to the
pilot. This is accomplished by integrating the dynamic parameters and
their derivatives in the Mach-altitude-range plane over a given time period.The time period in which the flight path can be projected would have to be
determined through a sensitivity study of the associated inputs. Possibly a
simulation could be performed to evaluate the flight path prediction system
201.

by simulating a particular established profile and comparing the predicted
flight path to the command path for that profile.
ConclusionsSExisting ground-based computer flight simulation progranis can be
utilized to generate the input parameters required for a contact analog com-
mand display system. Additional study is required to determine how this
generated information can be stored and utilized onboard a particular air-
craft, The amount of information to be stored and the form with which it
can be stored will depend in part upon the type of aircraft. The measurement
of the pertinent parameters in order to determine the aircraft's position
relative to the command profile is dependent upon the systems which are
either already onboard the aircraft or can be provided. The relative
accuracy of the measuring systems and its affect on the display system
should be important criteria in considering where to obtain a measurement.
Once the pertinent measurements have been obtained it becomes a
dynamic problem to project the flight path of the aircraft ahead for a given
finite period of time.
202•

REFERENCES
Bailey, H. H., "Appropriate Roles and Some Limitations of Man as a
Guidance Component,' P-20L/, Rand Corp., Santa Monica, Calif., June 1960
Bennett, C. A., Winterstein, S. H. , Taylor, J. D. , Kent, R. E. , "A Study of
Image Qualities and Speeded Intrinsic Target Recognition," IBM No. 63-535-1,
IBM, Federal Systems Division, Oswego, N. Y., Feb. 5, 1963
Blackwell, H. R. , "Contrast Thresholds of the Human Eye, " J. Opt. Soc.Amer., V. 36 No. 14, Nov. 1946
Campbell, C. J. , McEachern, L. J. , Marg, E. , "Flight by Periscope,"
WADC Tech. Report SS-142, Aero Medical Laboratory, WADC, WPAFB,
Ohio, March 1955
Carel, W. L. , "Human Factors on ANIP, " NONR 1076(00), General Electric
Co., Ithaca, N.Y., June 1960
Carel, W. L. , "Visual Factors in the Contact Analog," NONR 1076(00),
General Electric Co., Ithaca, N.Y. Aug. 1961
Chapanis, A., "How We See," Human Factors in Undersea Warfare, Nat'l.
Res. Council, WashingtonL, D. C., 1949
Cohen, M. G. and Gordon, E. i. , "Light Deflection and Modulation Using
Electro-optic Gratings," 22nd Cony. on Electron Devices Research, Cornell
University, 1964
203 LI

Donal, J. S., "Cathode Ray Control of Television Light Values, " Proc. IRE,
VoL 31, pp. 195-208, May 1943
Dougherty, Dora J., Emery, J. H., Curtin, J. G., Comparison of Perceptual
Work Load in Flying Standard Instrumentation and the Contact Analog Vertical
Display, NONR 1670(00), Tech Report D 228-421-019, Bell Helicopter
Company, Fort Worth, Texas, Dec. 1964
Elam, C. B., "Television as an Aid to Helicopter Flight, " NONR 1670(00),
Tech. Report D228-421-018, Bell Helicopter Co., Fort Worth, Texas,
March 1964
Emery, J. H. and Dougherty, D. J., "Contact Analog Simulator Evaluations:
Climbout, Low Cruise and Descent Maneuvers, " NONR 1670(00), Tech.
Report D228-421-017. Bell Helicopter Co., Fort Worth, Texas, May 1964
Fink, D. G., Television Engineering Handbook, Mc-Graw sill Book Company,
Inc., New York, 1957
Fowler, V. J., Buhrer, C. F. and Bloom, L. R., "Electro-Optic Light Beam
Deflector," Proc. !EEE, pp. 193-194, February 1964
Gainer, C. A., Obermayer, R. W., "Pilot Eye Fixations While Flying
Selected Maneuvers Using Two Instrument Panels, " Human Factors, Vol. 6,
No. 5, October 1964
Giarola, A. 5. and Billeter, T. R. , "Electroacoustic Deflection of a
Coherent Light Beam," Proc. IEEE, pp . 1150-1151, August 1963
Gold, T., Workman, J. D., "Research in the Application of Windshield
Projection Displays to the All-Weather Landing Task," J. Aircraft, Vol. 2,
No. 4, July-Aug. 1965
Jacob, L., "Electron Distribution in Electron-Optically-Focused Electron
Beams," Phi-l. Mag., Vol, 28 pp. 81-98, July 1939
204

"Jennings, L. B., Meeker, F. B., Prayer, G. A., Cook, R. N., "Ground
Resolution Study Final Report, " Contract AF30(602)-2653, RADC-TDR-63-224,
Minneapolis-Honeywell Regulator Co., West Covina, Calif., 29 Nov. 1963
Kibort, B. R., Drinkwater, F. J., "A Flight Study of Manual Blind Landing
Performance Using Closed Circuit Television Display!," NASA TN D-2252
Ames Research Center, Moffett Field, Calif., May 1964
Langmuir, D. B., "Theoretical Limitations of Cathode-Ray Tubes," Proc.
IRE, Vol. 25, pp. 977-991, August 1937
Law, R. R., "High Current Electron Gun for Projection Kinescopes," Proc.
IRE, Vol 25, pp. 954-976, August 1937
Law, R. R., "Contrast in Kinescopes," RCA publ. No. ST-119, August 1939
Law, R. R., "Factors Governing Performance of Electron Guns in Television .
SCathode Ray Tubes," RCA publ. No. ST-255, February 1942
Lee, H. W., "The Scophony Television Receiver, " Nature, Vol 42, pp. 59-62,
July 9, 1938
Lehrer, N. H., "Selective Erasure and Nonstorage Writing in Direct-View
Halftone Storage Tubes," Proc-IRE, Vol. 49, pp. 567-573, March 1961
Levering, H. W. , "An Introduction to the Luminescence of Solids, " J. Wiley
and Sons, 1950
Levi, L., "Cathode-Ray-Tube Saturation Effects," Proc. IRE, Vol. 51,
pp. 1054-1055, July 1963
Lukso, R., Fellinger, J. G. , "Electrolurc-nescent Hover Display Development,"
Fifth National Symposium on Information Display, Santa Monica, Calif. , Feb.
1965
I
205

MacDonald, D. E., Watson, J. T., "Detection and Recognition of Photographic
Detail," Optical Laboratory Tech. Note No. 127, Boston Univ. 19*6
McGrath, J. J., Osterhoff, W. E., Borden, G. J., "Geographic Orientation in
Aircraft Pilots: Experimental Studies of Two Cartographic Variaoles,"
NONR 4218(00), Tech. Report 751-3, Human Factors Research, Santa
Barbara, Calif., Nov. 1964
Moss. H., "On the Limit Theory of Circular Electron Beams," Proceedings
Fourth Symposium on Electron Beam Technology, pp. 9-34, Boston, 1962
Muller, P., "An Investigation of Reticle Display, Parameters, " TIS R56
EL C54, General Electric Co., Ithaca, N.Y. 15 July 1956
Pfa•nl, A., "Aging of Electron Phosphors in Cathode Ray Tubes, " Advances
in Electron Tube Technology, Proc. 5th Natl. Conf. Permagon Press,
pp. 204-208, 1961
Pierce, J. R., "Limiting Current Densities in Electron Beam,, " Jour. Appl.
Phys., Vol. 10, pp. 715-724, October 1939
Pierce, J. R., "Theory and Design of Electron Beams," Ch. 8, D. Van
Nostrand, 1st Edition, pp. 116-144, 1949
Purdy, W., Personal Communication, Circa 1959
Ramberg, E.G. and Morton, G. A. , "Electron Optics, " Jour. Appl. :"hys.,
Vol. 10, pp. 465-478, July 1939
Roscoe, S. N., Hasler, S. G., Dougherty, D. J., "Flight by Periscope:
Making Take-offs and Landings," SDC 71-16-9, Univ. of lllinois, 1952
Schade, 0. H., "Electro-Optical Characteristics of Television Systems,
Part I," RCA Review, March 1948 a
Schade, 0. H. ,"Electro-Optical Characteristics of Television Systems, Part II,"
RCA Review, June 1948 b
206
umm~lm m • nmn • imunnn u~mmmmu ~ nm muul • J~u numm~w n44

'Schlesinger, K., "Focus Reflex Modulation of Electron Guns," IRE Trans.
on Electron Devices, Vol. ED-8, pp. 224-230, May 1961
Schlesinger, K., "A Microspot Tube with Very High Resolution," IRE Trans.
on Electron Devices, Vol. ED-.9, pp. 281-288, May 1962
Schlesinger, K. and Wagner, R. A. , "Correction of Deflection-Aberrations by
Analog Computer, " IEEE, Trans. on Elec. Devices, Vol. ED-12, pp. 478-484,
August 1965
Space Handbook: Astronautics and its Applications, Staff Report of the VSelect Committee on Astronautics and Space Exploration, U. S. Govt.
Printing Office, Washington, D.C., 1959
Steedman, W. C., Baker, C. A. , "Target Size and Visual Recognition,"
Human Factors, Vol 2, No. 3, August 1960
Studer, F. J. and Cusano, D. A., "Transparent Phosphor Coatings," JDSA,
Vol. 45, No. 7, pp. 493-497, July 1955
Thieman, H., "Large-S~reen Television Projection by the Eidophor Process,"
Bull. Assoc. Suisse Electr., Vol 40, pp. 585-595, 1949
Weale, R., Comparison of Reactions of Human and Rabbit Fundi to Photic
Exposure, J. Opt. Soc. Amer., 54, 120, Jan. 1964
Williams, A. "Evaluation and Development of Aircraft Instruments,"
Progress Report No. 2, ONR N6 ORI-71, University of Illinois, Ma,'ch-April
1947
'Williams, A.C., Simon, C.W., Haugen, Ruth, Roscoe, S.N., "Operator
Performance in Strike Reconnaissance, " AF 18(600)-1798, WADC Tech. Rep.
No. 60-521, Hughes Aircraft Co. , Culver City, Calif. , Aug. 1960
Zworykin, V. K. and Morton, G. A., "Television," 2nd Edit i on, J. Wiley
and Sons, London, 1954 j0
: Z207

UNCIASSIFIEDSecwity Ciussification
DOCUMENT CONTROL DATA . R&D(Security clessificaitio of glde, body of abstracs wad ingd annoeg/o. mst be entered •men the overeli report is claasifaie)
I. ORIGINATINO ACTIVITV (CO,,0k 4u1400) ... R2PORT SRCURITY CLASSIFICATION
Thzghes Aircraft Company UNCLASSIFU)Culver City,0 Califoraiit RIKSPO
I. WEPORT TITLn
Pictorial Displays for Flight
& .OSCRmgpT0VII NOTKS Tye ofap wVadischwin da")
Final Peport 1965SL AUTNOq'S) (1u m48 ftrstnie. 1Ue, MMWI)
Carel., Walter L
Nowr116 (00) 2T32.01/1.0-. PROJECT NO.
e.TANI (bSAny w.eN AAerea Amay be
10. AVAILAWILITY/LIMITATION NOTICES
Distribution of this document Is unlimited
t1. SUPPLEMENTARY NOTES It. SPONSORING MILITARY ACTIVITY
Office of Naval ResearchWashington, D. C.
IS, AIIITRACTi . .
1 h2 repor contains a rationale for the use of Pictozial Displays.
Suiar evaluations of cument or j•oposed Pictorial Flight Displaysare Included* The aumphasis in on Master' Scan Display Medla and
such media are discussed. Sensor and datepr'ocessing requirementsare anaysed. Flight displays* navigation displays, and targetr3ogni;tion displays are discussed.
Iii
DD ,o". 1473
DDI JAN 614
UNCLASSIFISecwity aassilfcation
Copyright © 2022 FDOKUMEN