Best Available Copy - Defense Technical Information Center
249
~Dn r, OF C aeoradue~d by NATIONAL TECHNICAL INFORMATION SERVICE S."fedYA ?2151 UNITED STATE AIR'FORCE AIR UNIVERSITY :AIR FORCE INSTITUTE OF TECHNOLOGY Wright-Patterson Air Force S'as*,Ohio Best Available Copy *dw oublic w
-
Upload
khangminh22 -
Category
Documents
-
view
3 -
download
0
Transcript of Best Available Copy - Defense Technical Information Center

~Dn r,
OF C
aeoradue~d by
NATIONAL TECHNICALINFORMATION SERVICE
S."fedYA ?2151UNITED STATE AIR'FORCE
AIR UNIVERSITY:AIR FORCE INSTITUTE OF TECHNOLOGY
Wright-Patterson Air Force S'as*,Ohio
Best Available Copy*dw oublic w

AD-753 780
A SIMULATION ANALYSIS OF THE ECONOMICCONSEQUENCES OF ESTABLISHING MULTI-MODALTRANSPORTATION COMPANIES
Robert S. Tripp
Air Force In-stitute of TechnologyF4Wright- Patterson Air Force Base, Ohio
December 1972
DISTRIBUTED BY:
National Technical Information ServiceU. S. DEPARTMENT OF COMMERCE.5285 Port Royal Road, Springfield Va. 22151

A SIMULATION ANALYSIS OFTHE ECONOM'IC CONISEQUENCIS
OF ESTABLISHrING 'i-ULTI -I-ODALTRANSPORTATIO'1 COMPANIES
Robert S. Trilpp, Captain, USAF
Technical Report - AFIT IR 72-6
December 1972
Approved for puhlic relea-s';
*it ikto Uniiytd

-- . -n m n I I I I
• ~POTfE.'TtAL WIDE..IN4TESEST REP'ORT -3" :-- -
N~A.RNING TO EVA'LUATORS IRl',Ol INPUT-
DO IN WILL REPRODUCE PORL
S DECISION BY EVA'LUATOR S:
.4..
3.Return t~o ,;ourceW . ,-uktur'c
- . v!
IIiiO - i l i~INT' L "' Wl TL ST II ' T
.... A
DOCUMENT CONTROL DATA. R & D 71(See ... A lasorl¢ation of #lu., ?, f" Of ab~ crn ard ind.'xne atrnOtlon mnu'f he entered u'hen the overall ,!;%o Is clashified)
I. ORiGINA TING ACTIVITY((op.,e.autho) 20. REPORT SECURITY CLASSIFICATION
Air Force Institute of Technology (AFIT/ENS) UnclassifiedWright-Patterson AFB, Ohio 454332. oVP
3- REPORT TITLE
A Simulation Analysis of the Economic Consequences of EstablishingMulti-Modal Transportation Companies
4. OCSCRIPTIVE NOTES fT/pe O trport and inclusive dotes)
AFIT Technical ReportS. AU THORISO (First namne, Middle Initial, last namej
Robert S. TrippCapt USAF
0. REPORT DATE 70. TOTAL NO. OF PAGES 7b. No. OF REFS
December 1972 243 57On. CONTRACT OR GRANT NO. 90. ORIGINATOR*S REPORT NUMSER4SI
6. POJECT NO. AFIT TR 72-6
C. II. OTHER REPORI NO(S) (Any ther nuftbeti thit may be aea|inmlithit eport)
d.10. OISTRIBUTION STATEMENT
Approved for public release; distribution unlimited.
hI." qS - lf dI(b.Xi release; 1AV AFR f?9i-I ' ORING
Y Hix, "Captain, USAF ,or of Information
1.ABS TAAC T
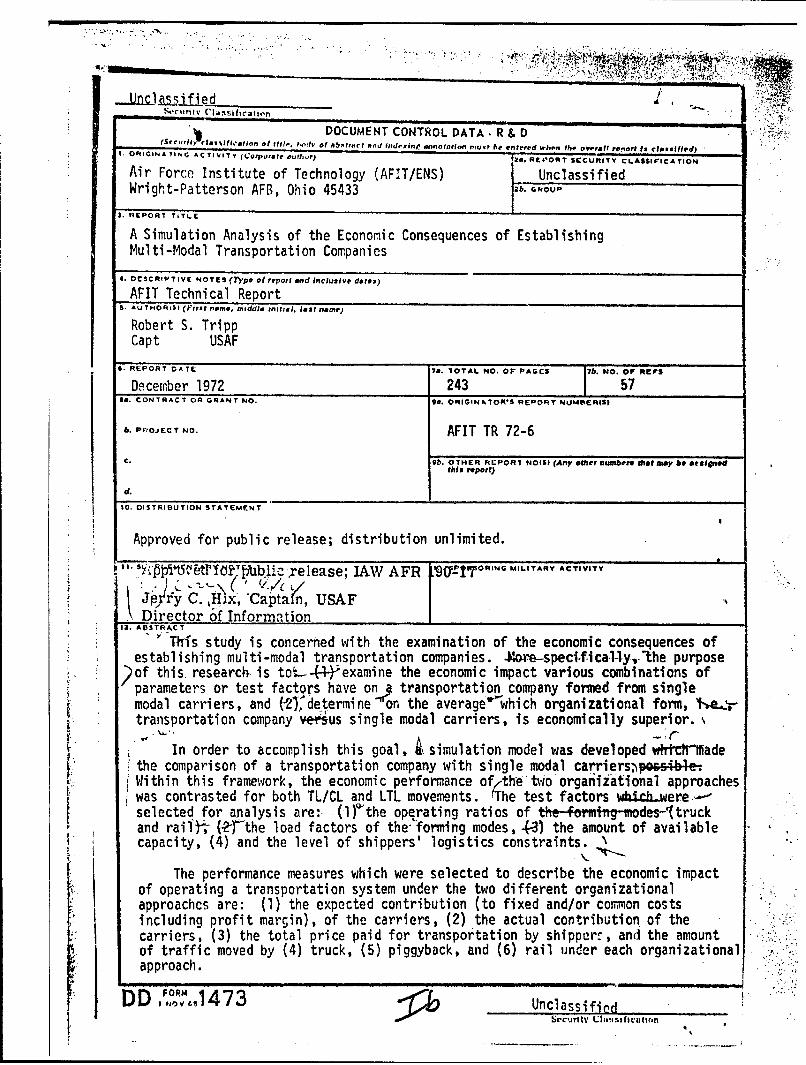
Thi's study is concerned with the examination of the economic consequences ofestablishing multi-modal transportation companies. .More-speci-f-ical-ly,.-he purpose
) of this. research- is to ,---;examine the economic impact various combinations ofparameters or test factors have on transportation company formed from singlemodal carriers, and (-2 determine on the average'lwhich organizational form, h .'rtransportation company versus single modal carriers, is economically superior. s
In order to accomplish this goal, 4. simulation model was developed wh-ctrtifadethe comparison of a transportation company with single modal carriers.P""bleWithin this framework, the economic performance of/thLtwoorgaiZational approacheswas contrasted for both TL/CL and LTL movements. (The test factors wh.i.d.-weres---selected for analysis are: (1)rthe opqrating ratios of the-frmig-modes-l(truckand rail)-, ('rthe load factors of the forming modes, -3) the amount of availablecapacity, (4) and the level of shippers' logistics constraints.
The performance measures which were selected to describe the economic impactof operating a transportation system under the two different organizationalapproachcs are: (1) the expected contribution (to fixed and/or common costsincluding profit margin), of the carriers, (2) the actual contribution of thecarriers, (3) the total price paid for transportation by shipperz, and the amountof traffic moved by (4) truck, (5) piggyback, and (6) rail under each organizationalapproach.
DD IR, ,,,1473 UnclassifiedSi~eirtlv IIINSf~cl tcn
STrnspotaon
Multj -Xodal Tranlortation Ccw'~pani I4
Trans Porta t Ion Compan ies
CO!mOr1 Ownership
Economilc Analy-.1%
I I.

A SIMULATION A.NALYSIS OF
THE ECONOMIC CONSEQUENCES
OF ESTABLISHING MULTI-MODAL
U. TRANSPORTATION COMPANIES
F S
Robert S. Trlpp
Captain, USAr jInstructor in Management Science
Technical R .ort - AFIT IR 72-6Dece ber 1972
Apprmcd for public release;aitrlution unlimitod,
I
School of j In$9cwvlvn
Air lnor' l ir tlt , ol T,0lh10fljyAWr'lcjt I'atte.'.ui Alr" .,tt l'v., Ohio j

ACINOWLEDCX TS
The successful completion of this thesis was made possible
by the splendid cooperation given me by the members of my disser-
tation reading committee--Profsaoors Norman L. Chervany, Chairu=n,
Frederick J. Baler, and Victor L. Arnold. Their encouragement
and comm~ents have contributed substantially to this research. I
especially wish to express my sincere thanks to Proiessor
Chervany for his sujrestions and Lonstructivu rrIticlows, I also
wish to thnnk Profteors Gary M. Andrew ar.d Nicholau A. ClAtkowsk/, Jr.
for the help thoy g ve me in the initL t s whin I wan dutInIng
the objectivew of this project.
I also wish to jpreis may rat1Ludo to Alan J, tcrger and
C. Randall lyera, fallow studonLz of U-1110, for taking the time to
llsten and common on my Ideoi. I am also Cr-,tcf'..l to Mius Vla :
berube wht, expertly typed t013 dioxtr..ticn.
Acknuwlodt Lt Is made to the Univertity nf M1nn utn Coiput.,r
Ceontr for providig WoIputnur facilitico tud time witksu.u which
thin thesis could not hive been accvmplfl ad.
I WICIh LO CX .rovn m.y iratlltidu LO My paruitu (or h"Avng divo; I) 3d
my Isite rvit. Jn ticasdt;.,I~ Ac i j uld v.,:n t 'Iu ui wd , Hf ry, wii Un~t.rlI-
buted morv thon words i :eu ,xprv. o, I w 1 h -. i -rov r 1dvbtd ,
i SI
.!-

This research was supported by the United States Air Force
through the Air Force Institute of Technology, dfld reproduction
in whole or in part is permitted for any purpose of the United
States Government.

?ABLE OF CONTENTS
Page
ACKNOWLED17MNTS . . . . . . . . . . . . . . . . . . . . i
LIST OF TABLES. . . . .. . . . .. . . . . . . . . . .. vii
LIST OF FIGURES . . . . . . . . . . . . .. . . . . . . .
ABSTRACT. xi
CHAPTER
I. INTRODUCTION. . . . . . . . . . . . . . . . . .
A. Definitions
B. The Economic Is3ues
C. Purpose of the Disertition
D. Organization of the Dirsertation
II. DEVELOPMeNIT OF TIIE MOD .. . . . . . . ... .. 18
A. Scope of the Research
B. Ausumptions
C. Identificationi of the Important Variables
D. The Doclsion Enviro;ment
E. The SiMulatiol Model
II!

A
Page
III. SPECIFICATION OF THE MODEL . . . . . . . . . . . 48
A. Classification of the Test Factors
B. Other Specifics of the Model
C. Recapitulation of the Test Factors jD. Generation of the Data
E. The T:ansportation System
IV. EXPERIMENTAL DlSIG' .. 82
A. The Problem of Realism in Simulation
B. The Output of the Simulation
C. Analytical and Statistical Methodology a
V. THE RESULTS OF THE SI .JLATION ANALYSIS ..... 105!
A. Nature of the Analysis
B. Explanation of the Average Performance
Measures
C. Analysis of the Test Faztors
D. Summary
E. Economles of Scale
F. The Significance of Interaction Effects
vii- "
.IVi
. i

?a~a
VI. OTHER ASPECTS OF COMON OWNERSHIP . . . . . . . 167
A. Obstacles to Integration
B. Relationship of this Study to the
Obstacles
VII. CONCLUSIONS AND I11'LICPZ1OS OF THE STUDY .184. 18
A. Suiaary of the Research
B. Further Research Required
C. Implicatlons of the Study
BIBLTOGRAPHY. . . . . . . . . . . . . . . . . . . . . . . 193
APPENDIX 1.
A. The t Test Involving PairedObservations of Two PopulationMeans .. .. .. ... .. .. ...... 199
B. The Analysis of Variance of theMain and First-Order InteractionEffects .. .. . . ... . . .. . .... 200
APPENDIX 2.
A. Flowchart of the Simulation Mo'del . . . 204
B. The Simulation Computer Program . . . 204
V1

7M
LIST 07 TOELLS
Table P&SO4
I K461 VariAtiOns,..N............ 64
II Othof Model Specifies ....... . 65
III FoVcontagu Irtakdown of Rail and Truck CoatA
Structurb. * ****e****... 70
IV Trucking Avwvro~o Cost% per Cwt, ..... .. . 72
V T!, Average Costh per Cwt. .... ....... 73
V!, yTrCefLigs breikdomi, of TL Costs . . . . 74
V11 LTL AverA&6 Cd*sa per Cwt, 75
Vill Not) Avore~p Coft# p'r Cwt. * .... .. 76
ix .liol(41 F.Ottor'sL Factorial Da2L. 8 a . 100
X& AvarAge IDttfaren~o ot the 3'arforzance Measures
lotwpvn thc 'k'anaortstfon Compimy and thelingle Modal Carrier%............ 110
Xb Avutago i'?ffaru:ncv as a Percentage increase()I~o * iecrtafic( of the Combiid Gingl's Modal
XI Toot YNcL, tur L sy .. .. .. .. 115
X114 IEffoclo t of is wi In Truck OperatingC RUtIU on
X1l1, I.II(tt U[ Cj1Oli4( Ni 'Iruck Upur.. Lln h-LOUU1
Illt 111 l'tio mavcu12
V11

Table Page
XlII Effects of a Change in Rail Operating Ratio on
the TL, CL Performance Measures ........ 124
XhIub Effects of a Change in Rail Operating RaLi; on
the L'L Performance Measures. . . 4 a . . 125
XIVS Effects of a Clange in Truck Load Factor on
the TL, CL Perfo-mance Measures ........ 131
XIVb Effects of a Change in Truck Load Factor on
the LTL Performance Measures . . . ...... 132
XVa Effects of a Change in Rail Load Factor on
the TL, CL Performance Measures ........ 139
XVb Eftects of A Change In RA1L Load Factor on
the LTL Performance Measures . .. .. .. . 140 IXVIi Effects of a Change in the Capacity of the
System on the TL, CL Performance Measures . . . 149
XVIb Effects of a Chanae in the Capacity of thA
System on the LTL Perform.ance Measures, .... 150
XVIIa Effects of a Change In the Level of Shippers'
Logistics Constraints on the TL, CL
Performance easurcs . ........ . , 153
XVIlb Effects of a Chance in tile Level of Silppers'
Logistic6 Constraints un tie LTL 'erformance
Heasuroes.... . . . . . . . . . .
XVIII Sumriary of the MI, Cff,.CL L on t Q Pcrfor-enceI
M asurvs . . . . . . . . . . . . . . . . . . .. 160
vLI
I t + ,;. , , . . . . . ... ..

Table Page
XIX Summary of the Interaction Effects on the i
Performance Measures ............ 161
IxI
4
.1
I
I
O2
Aix
-i
LIST OF FIGURES
Fi.ure Page
1 Structure of Equipment Allocation Decisions . . 38
Ristrictions on Carrier Pricing Decisions . . . . 43
tx
r'
ABSTRACT
Common ownership has been a subject of debate in transpor-
tation circles for years. Unfortunately, while discussion and
speculation on the subject have abounded, there has been very
little research directed at determining what the potential
of a multi-modal transportation cccpany is.
This study is concerned with the examination of the
economic consequences of establishing multi-modal transpor-
tation companies. More specifically, the purpose of th!s
dissertation is to: (1) examine the economic impact various
combinations of parameters or test factors have on a transpor-
tation co.pany iorred fron sinle mcdal carriers, and (2)
determine "on the average" which organizational form, i.e.,
transportation company versus single modal carriers, is
economically superior.
In order to accomplish thi s goal, a simulatiou model was
developed whLch made the conparlson of a transportation
company with single too,.l' carr.ors possible. Within this frame-
work, the economic pcrformanccu of the two organ zaLlorial sippronchca
was contrasted for bo~h TL/CI. and LTL mov:aonts. The te.t
factors whic'i were selectod for analynit; n-c: (1) the operating
ration of Lh formi1,,i; mode:. (truck and raJ ), (2) the load
xi
t_

T II TIT - 1 I I 111 II I I I i
factor@ of the £azming modes, (3) the amount of available
capacity, (4) and the level of shippers' logistics constraints.
The performance measureb which were selected to desrlbe the
economic impact of operating a transportation syston under
the two diffarent organizational approaches are: (1) the
expected contribution (to fixed and/or common costs including
profit margin), of the carriers, (2) the actual contribution
of the carriers, (3) the total price paid for tranoportation
by shippers, and the amounL of traffic moved by (4) truck, (5)
piggyback, and (6) rail under each organizational approach.
A fractional factorial experimental design aus utilized
to analyze the output of the sJilutlout 4udal. Appropriate
statistical costs qeru uti-iu to: (1) indicate which of the
test factors or tort factor combination* produced statistically
significant behavior in the perfornancc measures, and (2)
determine If the performance measures were significantly
different for the two orgr.nizatlonal Approaches.
It was found Lhat moot of the avvraga differencen of tha
performance measures between the traivillurtatioa company and
the aliiglu modal carriurs wero siUniffic,ir't. Xore fpecflca1ly,
for TI./CI. movuiLnta It wai,' fomd that Lha oxpccted and uctual
contribution of the tran,ljorLtAt1IC1 cCrpMP ln w.ro u1infffcar,tly
greatet thian Lh !iurn tuf hu , rum C +; r ,i for Lht ,! I O t',l - modal
)A ]I

carriers. lit the LTL category of mov"rnentol the xpected and
actual contribution of the transportation company was a&ain
mignificantly larger than the combined contributions of the
single modal carriers. The transportation company also had the
effect of significantly reduciq t&e price paid by shippern for
LTL transpor:ation services.
The prin consideration tf the resoarch was the Identifi-
cation and explanation of the manner in which the levels of thea
toot factors affect tti average perfomAnce measurs. '.ho
analysis of the offects produced by th. test fActorn reveals under
What operating .ondtions (Lest factor lovol) the tra-portation
corapany was "economically 6upirlor" tW- th; I% lo z-dal cctpsAr.e!:
and vice vorita.
The economic anpects of the common ownership controversy
are, however, but one facet of a multidimun.Junf l p1ub. m,
As such, the research hau idenLltfid the other aspects of th
controvcrsy and discucaed thOir relstlonotl- co the results
obtaLn,,d in this study. Although there re . in a lot of
unansworod questionn which must be raseirchod concernin. the
Comon ow.te.rihip qucatJon, chi tudy li a ntep in tho., d Jg':tion
Of ObU"i ni .; LhOUL, n" Iwo'i.
XI I!

OUJTER I
INTRODUCTION1
For Lu-t $out time now~ there has been a continuing contro-
versy in traraportation circles about theo desirability of establish-
Ing multi-modal transportati~on Comn~anlas In the United Status.
The arguments for and againat the owiierthIp of rr- mad of transipor-
tation by a competing mode h~ve been r~tat*J and restated, Tito
nature of thtse argumeznts Is Illuxt-rated In the following quotations
The Issues in Lhs o O-i.cehpconitroveray tirebasically Aimpl. ~Hijor or-Pror~ts in favor uf cotvioii vvner-ship arc, thAt (1) It Vuis.ltit bwt~vr sirvicu to Litc custow-r.Through the AValla.bilil-y of cooedinitid Lrtindportatiofl sorvykaunder Lt.d Coc~roll. of ; Alo~ t-C'.5-"2Y,each shi pnont can 'ja rmovud by .to:ud*o co,,-,11natfo Oimodes which oit f1lta Lite r~quiror.critj if tho cu~tone~r.Comon owncrship would not reduCo *f4ClVie CopLltlOhbecausa thura would 1istl be many sopirate mode carriersand severel "d4rtv.&nrt ores o~f Lrnnisportation" genaralcarrlert. (2) Thore are ecunols in optratlon In havitt,One s41CA force &ad tino upurotLin- oduroit 0616 eocIWhandling thoi trLinsparL'aLion oarvico. (3) Tho cuatoA.Jrconvenience would be Increstovd ,I..utia there would ba onlyone toot of arron,pnits roq(uircd, And a single carrior wouldbe responslble for any loso or dsiaage
T*he 1nwporLsint si:U1o.L ;a~IosL c~fu;iof owiio.rilp I io lude:(1) It would stifle cot-pLLloI attd r :.ult in poorer ormore expetu ~iver :cr to the shippcar 19 Lho loat run. Th4railroads would lookLtO thruir pr;:-.ry 1icill rvrcand div(vrt aill possihlu traffic to thult r~il optirationWhile O.liing the LrucV ourvic'j to dri v-2 induipt-dellLL4'.o~t of 1 u nne~i . ,!) Xaii I cjuJ or C.LIIL: r nun tru(cl I r ::,'menrts coul d not dv 311 VI it Joh ol rtinnititi- L tuCklr ;'.
hc'caunt, Lhv' d". nut h "v h l'.i : ~ .n
?Iutor-.ru rr I r tiivrv icou WUUl L o bu dtivu Juptd m4O rap idly

PI
-2-
or as yell by coon-oimterahip coapentes so It would beby nanagatents which had no othar interest, 1
The above listing of pros And tons is not exhaustive,
but should give the reader an appreciation for the types of
arguments being caot back and forth. $htl% tsuch discussion
exists, Lhre ham not beer any effective ruseerch accomplished
on the subjoct of multi-modal :rAnonorttion companioes.
The controversy has boun unresolved for sevral roAons,
such si *ntrenclied carrier .anaijorionts or it least parochial
attitudes of csrriro conct.roln their ow aud., Furthrmorei
shippers tcnd to have a short-r o perspoctiva toward the
transportisti.n plant, trying to obtoin the ximum baneJts
from thW CxLiL'4'1& i.odas. ,rmother reason V-7 there hit been no
systematic reavarch on the subject is that the present laws
which deal with Elio tranportailon company qu.tione or
In.erpr to.lono of thoo la-WO by the Intartot Cororce
Coum!psin (IC.C) have bt.en very restricttve. 7 Th6 lack of
eiiectivo r uoafrch on the topic hau reeuli.Ld n the fact that
today there eKist no Suitable dec4lon criteria for dotcuili ng
l (h yto . ,, IC ., .": , ,l i JA. Jr,, ",
Hill Book Co(., Ific,, ;sj , Jp ', *j ,
2lnfrno, Ch,4!)LvC Y1, , ,

it the formation of transportation companius would be In the
public Intertat, 50 the conitovoray continue.
An indicated in tile above orcuserits the question of whether
or not transportation compapin should be ostAblished Is a wilti-
facatnd or multi-dimonstonal problem, That is, the formatlon
of transportation companins involvas *conorAtc, leal, and social
Issuas which muit be reeearched to dotarmiic the tipact such
companie would have on the transportation system of the United
States, Theme companie would (most probably) have difLering
effects on tle various groum Iinvolvod In tho movcent of gocds.
The shippers, carriers, And reultatorv hava differing
Lobjectivos concerning the tronoportation systci which affect
their respective attitude, on tho trAnsportotion conpany isuae.
Shippers danire a low cost, efticient transportatlion systea
capAble of rateting their neoed. Carriers ,iLsh to makc n good
profit in provldls tranGportation mervica. The regulators
sit in the mtddlv buttwon thouu groups trylng to Intsura that
It might bi- pOInLed out Lhal thcre a:o oeo:a trtinsportatfloacompanies in the C'nitedr !1, .ta , rAi oxr,,pl,, would bu the routhloernPae f tIc Coi:pnjiiy, which opor;tL ut i c .'6,0W) L. ruckti rout c m ls
14,000 mile of rail lIon, and 2,300 pipellno rAl (IYr.-ilCnUip)1NrV]I. "Oil OILu lgt. TClA;: , I1rjrrvo;.n, X.VIii, ;Lotbvr 2"1,1968, 1. 9). clouthrn 1'ifci fir. ulud Il LruI'L-t o;,ur tLhatL w':rit 1) guii prior to ) u.',hr hw ' " d,".t. r uWlI2 F11 S t I:i I "d L . t n .,Ltl.LC '-.:. r'o AO' LNec'LtI un I J it iutit l-rt .1 Lit.h t -,i j•cj.l ) lt u r.i J'o, d:, ':W 1it In Lru, t nt . u-/'lal tu lit;r r.i I ro,,d:i o..i ; i,. di .,ry tru;'', :,gc IOmlpall|O , on , ' iv or,!I fo!'.f, of opi, L i ttllf,, Llw!:0 !1%;',, t,l!' ,t r , t;art,
avvu ril ,, y t' i - IdL:::: j/ I)-i' t d II:.". C 'rI f r.,;; l Cpub litc. ' I t :,L.. ;I , ':.i j ;'. . ill bc '..I II.,,:. 'l . r
At3

the needs of both groups are met simultaneously.
This paper will undertake to examine the scanomic cones-
quence of aotablinhing intarmodal transportation conpanies.
The research wll be mainly concerncd with an analysis as to
how the crearion )f such a company affects the economic well-
being of the fout:4ig carriers.
efinitiong
IB Iefore proceeding to doescriba the nature and intent of
the research, and to Insure no misunderstaudinZ In created,
the following definitions &ra presented and will be used in
the remainder of this disaueiaLion.
Integr tion of trsnspartaticn f'r.:v ivolvcs the purchafe
or acquisition of t. cransportaLion firm of one mode by a arans-
portation firm in another mode. A railroad acquiring a truck
line would be an example.
A transport4tion n im a singla !irm which owns and
operates entiticis in more than one mode of transp,rtation.
Hence, the integration of transportation firms into a
transportation co.pany involv,: ia;ue, of -hc. common crner-
!.h.ip or more Lhat ote modU of LraneporUL IaL, IN the
transiporLotti. I :tcaturc 0he terno _.o'r o:erph i a:nd
Lrnnporcrtl,, cpir y.- ar, teed ftiturchnt.:;b,Ihy and Ohlin
practice wil). be followed in thit; project.
.. .: ! ....
Coordinated transportation is defined as "a point-to-point
throuih mover ent by means of two or more modes of transportation
on the basis of regularly scheduled operations."4 Thus coordi-
nated transportation refers to a particula: type of transportation
service or product" which is independent ;f the ownership of
the mode.,. For example, a regularly scheduled piggyback move-
ment, a .r..ck trailer move; on a rail flatcar, is a coordinated
transportathon movement if the railroad ons the truck trailer
or If a trucking firm owns the trailer.
The Economic Issue
As mentioned abovu, this dissertation will undertake to
exemIne tlc cconc, c consequences of estab:ishing transportatlcn
companies. The formation of a transportation company, resulting
from combining two or mo-e carriers of dif.crent modes, could
In-olve economies from two sources. Common ownership could
leas to economies of scale and potential economies involving
the pssible reallocation of traffic from high to low cost
modes.
Economies of Scle
As alluded to In the argu:Aents for and against establish-
ing transportation compa:tics, most, If not all economic arguncnts
4Nichols A. Clislc'sky, Jr. , :n Anal"j:s and__al,_:J.on of.hc _P¢ '1 l ' . , . ,~ "' -,.., 2- • , , . .
d fI ..s~L; ic, ~4u . .itc '~J~0i ,~L,-L,;i' L rsi .y, i960), p. 10.i oduced f,orn
Lbei available copy.
- - ... .... . ... . - - - -

-6- A
on the common ownership question, are centered on the question -4
of the extent to which economies of scale can be obtained by Ithe merger of two modes (rail and truck). Co~ents such as the
following are typically made by transportation economists.-
The economies which may be realized from common ownershipare dubious, to say the least, as is evident from theearlier aaalysis of economies of scale in the variousmodes of transport ... in addition ... the competitivenature of motor ... transport would make it impossiblefor then to abscru any significant amount of the rail-road burden.
5
From the positive side,
In summnry, ... integration can lead to economies in theuse of administrative personnel, maintenance, perionnel,labor of all kinds, equipment, aad capital facilities.Many of these lead to better service thrcugh speciali-
zation of labor or capital and,,at the same time, leadto greater profit for the firm.3
As can be seen, the disagreement centers on the question
of how similar are the operating functions of the combining
4modes and is there enough similarity to aliow the transpor-
tation company to centralize functions ano eliminate duplicative jfunctions, and so forth. These kinds of questions will be
addressed in Chapter VI. As will be pointed out in Chapter VI,there really has not been enough research done in this area of
the transportation company concept to answer the question of
!5
Dudley F. Pegrum, Tra:asartaticn Econ.c-.ics and PublicPolicy, Ruvised Eidition (icz. ooc, jilinois: i'ichard D.Irwin, Inc., 1968), p. :, 63.-II. .. ,:e -nd ''irtin r. Farris, Dcm,-tc "ranc:.r-
: r~~~~~atio.. r,: .l ..r. . .. i.c , ( ::ci, .s : iuul:,9,, 326.
I
-7-
whether or not there are substantial economies of scale to be
obtained from combining different modes. Therefore economies
of scale will not be rtly considered in this study. The
effects of not directly considering economies of scale on the
analysis of the results of this project will be explained in
detail in Chapter V.
Economies Resulting from the Reallocation of Traffic
The major focus of this research project will be on the
analysis of the potential economies of common ownership
involving the possible reallocations of traffic from high to
low cost modes. An explanation of why it may be possible for
a transportation company to obtain economies frcm reallocating
traffic from high to low cost modes deserves some attention.
Currently, carriers have the leeway to price services
be.ween out-cf-pocket and fully distributed costs 7 under
8current regulatory policy. Assuming firms are profit
7/
7Out-of-pocket costs is a term used in transportationreferring to the added costs incurred in performing anadditional service. Fully distri'uted cos:s are the total ofvariable costs and a prorated portic;n of applicable fixedcosts including a profit allcw'ance for a transportation move-ment.
8The Passage of the Transportsion Act of 1958 added para-graph 3 to the Rule of Latc ..a.i"-, (Section 15a) o' the Inter-state Co:m:jercc Act. In partic u.lr, the Congrcss declared that."rates of a carrier shall not be held up to a particul:fr 'ACal _
to protect the traffic of .- othr node of tr.nspor:ticn,giving due cnnsidrL'.io: 0 tI ccC'ivs ' the 'iLo.al0
transportICai polic,. lccharL i:' th's act.' n Lfcct, this

gt.We@v@ off th eet #are "d $two thave is axess capacity,
is tkh toil4roa thAt oinga modal carriers will carry trof tic
of 1"S is it cftrfl~uto# .o..'thinu to mrgin. Iscauss eachad. %a" d1Eferet toot characteristics (differing amounts of
ftiadl aftd vorl1Iiio costs) and :Oiven that ctarters are profit
(Notmsior., there omutopo in~ t;vanspowt~tibnt today a situation
imW ~t1& to e tho1.0A. dirocted the Intorotata commYrc Con-4411t (14e.C.) tG bam rates f -r ivorvicto providod by carrikirmI 01~ 4~.V qf V(M~A of Oto sittitiont.
ortior tou 11ie , .cc diLe0 01.1L rAL.Lc hould b6rlowit Ih.Mi tv Wor~cd Lhio cari.'rN * fair o4por-Ii IIt t6~ i oUt*-t. in i f taWoro juat :A d
tho Otfcii a nv# ~i w~til Iive or -;o wtS("o 04~ fvaic;kri Of 0'QV to th~of eLIr c;%rricru,
lib. V turi ' fo~vr t 90Rl of Wtt.0u wHoi- a to10LAul fi.. 0,Mrui. NOW~ YOV' U01 HAW A11.4 Harford~ R,.Co.,4~
eiI~eI~l~ ~IW4ik4' WIA 00vJc1w tho WA:?. (t ) thr Suri Co-.rL
dv ile Imi d o irunvIais A-U'tv4o (;UuL ac~tiwa ful ij ditri-
diaMiuiiiij Ac.H~ Ai i~tic ;n,"r fi 10 ilfi .aOfid litLifl :.tz~tt
IOUP ~ ~ ~ ~ ~ 9~a9 Iii GYFug.4igt ro %I)V- ii .. L o tlit 0Cv~4'lC
forllq -I "4 14i ,--& 0 yr wila Y he(2) 11141 C 41
911 ttif bifi 1R rtg i 4ttV.l#'~ ~ LU rt" 141r l41141buiA eletN pij."61dtli-fiaAre no ok,. to ullydii~vi

i"i
-9-
where carrieus of one mca are compstinS for traffic which can
be moved mor profitably at the sam or competitive rates by
carriers of snother mode (with dLf!aront coot characteristics).
This point is substantiated by past chsirmin of the I.C.C.
Howard Freas when he pointed out in 1958'
However, when competitive traffic is hauled at a minimsm 4of profit by carriers whose costs are relatively high, theAlow cost carrier who at the same or lowor rates couldprovide the service at a revonable profit is deprived ofthe business, By having the hi h cost carrier perform theservice, the overall charges to the public are not reducedas other trafflc must bear a disproportionate share of thetotal trAnsp. rtaion burden. Thus, t'he public is preve.tedfrom receiving the benefit of the mor economical se.rvice.. 0
Thus it in evideut that thar. exists the potontial for a transpor-
tation company to ach.eve economies by realIocating traffic from
high to low cost modes. Whether this is p~ssible or not deperd Ion many factors which must be analyzed.
To date there h n been no quartitativw microcconotic analybip
of the transportation company concept. Peter S. Douglas has
supported this findint and states in a recent article, "No pro- Iponent of 'c.cwnon ownership', however, han yet undertaken pubi.icly
to identify the economic forces that tight make coordination of Isoparate mod es luss Coitly wider a single : eagL-mcnt than undcr
separate mL3LIgmnton."I
US. C'ofl:vjHu * Th itu ,ce[a.tti on Cc-.'.erce,, " -ic'n lTrn~nn ort.- I .~' I ':' ' (Tha Uoyic ',ort), S. )Pt. 445, t671'
Conn.rutm, Jat u;.IU r,, 19,I, p. 217.
'€ Lcr ,S. Dou'L11g, "[he Lc .nuc r I c I rrul a: 'C .O of:Ownvt,1 ,I{ " [,(C,C i'. l:i.,. ! J u :.l .?' J . -, ..:1'') . ''' .-

-10-
Purpose of the Dissertation .
In the .'tght of the previous disoussion on the economic
issues of thb common ownership controversy, the purpose of this
dissertation may be stated. The purpose o this research project
is to examine the economic impact various cocbinations of paraeters
or test factors have on a .:ansportation company formed from single
modal carriers. In the accomplishment of ;his goal, the research
project will attempt to provide Information on the cauie and
effect nature the parameters have on the -,:onomicC performance
of the transportation company as cotparod to Lhe economic per-
formance of the single modal carriero of which the transportation
company Is comprised. A secondar!, but ir.portant, goal of the
research is to provide a basis for future research efforts.
The Research Approach ,
The reeearch approach used in this project will be to identify
the exogencous controllable and uncontrollable variables, the
ondogeneous variables, the constraints, and the relatlionships
rbetween them. Taking these factors into consideration, a
mathematical simulationi model will be constructe:d. Once the
Mathematilca odel ha'a been devulopd, a hypothetical tra:nspor- j
tatLion systuc° will be analyzed In w'h'ch tl,. parametera and con-
atraints will be allowed to syst-c:I.a1.cally vary to dctermi.e1u
F what effect .ach has on the solution of the trodel.
It Hhou!.d 1e polt tJ cit that hIS Ly,)u o all apprach tc
the probl.,,i rg niw-casrv ior the fol.o-,J, rL,, s; : (1) h : ,'!1
kI
. *. . ' : - - .; " 'l z : . : : - ' -- - '-- .. . . . - - " ' - ~ - - - ~ - - - - .
it I not necessarily easy to abstract the real world into s)mbolic
models, it Ii the only practical way in which the operations of an
integrated transportation company can be compared with the operations
of competitive single modal carriers made up of its corposite com-panies.
There is no data on which one can draw which compare the operations of
a truly integrated transportation company with competitive single
modal companies. That is, while there are some transportatior.
companies in the United States, they do not compete directly with
single modal carriers with exactly the same route structures, loadiI
factors, management skills, and so forth. (2) As one might guess,
the carriers, shippers, und regulatory authorities as a group are
not willing, for their own parochial reasons, to experiment with one
segment of our transportatlon system to see If the concept really
"holds water". Furthermore, even If one experiment did work, this fact
would offer no proof that the concept would be valid under all ccn-
ditions. Thus, one of the benefits of utilizing mathematical simu-
lotion model]; is that It is possible to manipulate the pe.rameters
Involved which make two situations differe.t to deterirdne the outcote
on the solution at a rr'asonablc e:xpense. (3) The formulation and use
of a simulator to analyze this probl, area has never been attcpLed
before and hopCfully this approach will be u.,,d as a building block tc
extend quantitative ,.2thod.i to aid carrier n anagezients.
The data used In thils tu y 1: ll be hypothietical. y(t Will
reflect aCLtuOI diff!rcrice, In L opera.l:g cli %rlct.cri.tc- between
I.4
~ ~ Ii 7 - ____ ____ _'_

= - .. ...... ..... - . ... .. .. "---- . - . .... .. -
nodes. Realistic hypothetical data serve :h,, purpose of this Idissertation as well as real data, because they will be used as
Scomaon denominator for comparinS the same transportation modes
opetating under different organizational structures.
With respect to simulation Perse, it has becn definedas follcws:
A simulation of a system or an organism is the operationof a model or simulator w:hich is a ropresentation of thesystem or organism. The model is amenable to manipu-lations which would be impossible, too expeisive orimpractical to perforn on the entity it portrays. Theoperation of the model can he studied and, from it,
properties concerning the behavior of the actual systemor subsystem can be inferred. -
In essence, simulation can be viewed as an experimentalmeans fcr generating an artificial history of a system forpurposes of analysis,
12
Thus one of the distin uishin; characteristics of simulation
studies is their reliance on the model-buildLng approach to examine
problems. H1illier and Lieberman have put forth this proposition
as follows:
...simulation typically is nothing more or less than thetechnique of performl-n;; saz-plin& experiments On the modelor system. The experimen-.s are done ou rhe model rethirthan on the real system itself only bLcaAi the letterwculd be too in'onvcnient, e:pnsive, and time consuming.Otherwise, sim-ulated e:pcrJ.rtents should be vewed asvirtual.y indIiFLinuisihbi c from ordi.-ary StOList.icalexperlmnts..
12 Nori:r, L, Chervany, A S.::. 1 .at.:o; .. l'._ of C ..sh Flc.P tt L :!r n. ,.! :.' .I L[ : : ... 1;-,- Ar. .. .. " " .' i:', . D., ; A .
1968), p. 10, quot!; , fr; Mj n SuLf,., -i.;ulation of the li'"Aim-ric :, C ; i:9 )bir .9$D), p. 5C9,
1 F}ri,. d r i,- 3 '.; ' u L : C-.-..J I -- .<: c~ .,. n, I' 'r. !- : .t o.p'r o ...... " ( *., Y..nc co, CA i :n' a: I:cl.: 1-;;.:,
_____,1; ,7 I .,,'}

• ?i- : - i ._ -- - 7 ;/ / ]- --- = . . .......... ... ........
-13-
It must be recognized, however, that while there are certain
advantages In utilizing this model-buildir.g approach to analyze
a problem area, there are corresponding disadvantages. As Hillier
and Lieberman put it:
Hathematical models have many advantages over a verbaldescription of the problem. One obvious advantage Is thata mathematical model describes a problem much more concisely.This tends to make the over-all structure of the problem torecomprehanaible, and it helps to reveal Important cause-and-effect relationships. It also facilitates dealing with theproblem In its entirety and considoring all of its inter-
relationships simultaneously ....On the other hand, therb are pitfalls to be avrided whe:i
using mithematical models. Such a model is necessarily anabstract Idealization of the problem, and apprc,:-iationsand simplifying asuumptions generally are requlred if themodel ia to be tractable. Therefore, carp must be taken toinjure that the model remains a valid representation ofthe p1ol m.14
With th,.se advantages and disadvantates In mind this model-
building approach will be utilized to achieve the objectives of
this dfssertatlon. The study will be undartaken in three distinct
phases. Fir.L, the model used to analyze the economic consequencesA
of estnblishlng transportation companies wIll be presented.
Secondly. the test factors and porfonnancc mesures utilized In
the st.id,; will be presented. In this phase of the study, the
relationship of tie rode! to the real world will be critically
diucussed. Thirdly, the evaluaLloua of the results of LhL sIzu-
latiors will be presOiied as well as the irplicatlons the study haf
on the rc-.]J world and future re:arch.
14Ibid., p, 15.

-14-
Contribution of the Dissertation
Speculation and intuitive belief hav. guided the Arguments
concerning the establishment o lormation of transportat!cn compa-
niem. Investigation, not speculation, Is required if objective
decision criteria are to be established, as to when or under what
circumstances transportation companies would be in the public
interest. As indicated above, developing criteria for this purpose
is A multi-dfmCIisIonl undertaking. This dissertation is con-
cerned with one part of the economic feasibility of common ownership.
The dissertation will answer such questions as under what operating
conditions, :raffic conditions, and cost conditions will the transpor-
tatlon compa-y result In lowar costs for transportaition users and/or
greater profits 15 for the industry than by kceplng the individuil
modes separate.
The resilts and methodology of thiE study could hopefully be
incorporated in a rIgorous u-;temS analysis of til coiacept which
should be performed by the I.C.C. or Department of Transportation.
I
The major thrust of the research could then be thought of as a
necessary part of a vsysteta analysis on thc co u omiership contro-
versy which identifies sone, of the economic irpicts on the carriers
involved in forring transpor~atiOn companies, The Infornation-_I
1 5Prof I tability w:il be rcJ9urcd In Lerm!i of the Lotal contri-bution W,:Iu to 'in ;d/or cc-:.'Al cc1 LS tclud t;prof it a.,:r, -For v deta lcd uxl);1-t1I ,1 of vity hilh r.c.i,;urLcn, LWaS u-cd .ce
Infra., ch.'ptr v, p'. ;,0-l62 II
___ A
I ' -;15-1
generated and mnttodology used i t this dissertation could be
incorporated as part of the analysis nucesiary to determine if such
companies would be in the public interest. The I.C.C., if it were
to attempt such an analysis, would also have to consider not only
the economic aspects of the problem, but also such factors as to how
such companias would affect shipper convenience and service, effect
on carrier enployeas, legality, desired leels of cozpetition,
regulatory problems, and whether or noL such companies could ba
effectively organized and mananed. Only after all these questions
have been reziearched can appropriate decision criteria be for.ulatc.
as to when the formation of a transportation company would be sucially
desirable. IThe major focus of this research will hopefully provide a
now pearpective and a foundation for research on the question of
the transportation company concept. The research should, however,
provide guidelines as to under what circuwr.stances a transportation
company will be more profitable than single modal competing carreris.
The methodology utilized in this study could also be used, is a
foundation, to develop a ratioral basis for determinin when carriers I
should provide coordinated or sIncle modal tranrpoitatlon sur'Icu.I
Finally it is hoped that thiu disertat~on wi .1 be used i. a
building block to ctvnd the applications of quentiL1LJW( IOetl,1
in carrier n.igU ,(:it. -
A
VAOrganization of the Dissertation
The rem.Inder of this diusortatlou consists of six chapters.
Chapter 11 Involves the formulation of the model. The chapter
deals with the definition of the relevant decision variables,
explanation of the form of the objective functions, and statement
of the set of constraints within vhtI:h the simulation will operate,
The chapter alsm presents a diacuision of the scope of the reisa.rch
as well as a description of the pertinent assumptions.
The first part of Chapter III identifies the parateters as
well as the random components of the model which will be varied
in the analycic of the model to determinc what effect each haR on
the solution of the model. The re alrdar of the third chanter
explanu hou the cost data will be genrat.d. The CoSLirL ci ori.es
for the modem are established and an explanation of the manner in
which the tent factors effect costs is given. Following this
explanation, the Li,.sportaticn systae which was modeled is presorLed.
Chapter IV focuses attention on the nature of the experl-
mental deeign atid the analytical und statistical methodolog7, used
in the dissertation. The chapter discusses the problez of realism
in the simulatlon and prcscnts the pcrfor:ance reaeurLli or sudmary
statistics which are used to describc thc resulLs or the nlnu-
latioi. Thu chapter also discu'ojcu the nature of the particular
exp'rirontal def;1 i utilized In the study,
The fifLth chapt,-r .L and ana)yzc,; ijh rcrult.s of thu
a I m' at I en". T ! . . " 's ICaLe-:'A which tcst faCr.ors ni r 'fIl fI-
A.,

-17- "
cantly afiect the economic impact of a transportation company
via-S-via single modal carriers.
Chapter V1 Identifies the other aspects of the comzon owner-
ship controversy that were not considered in this project and Ni
discusses their relationship to the resear:h accomplished in thir,
study.
Chapter VII discusses the results and Implications of the
study in the broadur frarawork of the controversy.
B1
I
I
I
.i
III
A

-18
CHAPTER 11
LI DEVELOPMENT OF THE MODEL
Very broadly stated, the purpose of this chapter is to:
(1) develop the foundation for the simulation model utilized in
this project; and (2) present and discuss the simulation model.
The chapter begins by identifyi g the scope of this research
effort. Next the important assumptions which are made during
the conduct of the research ate discussed. Following this
discussion, the key variables of the simulation mudel ar. ;re-
sented with the purpose of introducing the model in an overview
fashion.
The chapter will then present a description, in mathematical
and verbal terms, of the nature of the decision environment
within which the shippers and carriers operate. Attention will
be given to the interactive nature of the process by which carriers
mak , quipmerit allocation decisions and shippers choose t.ethols of
trat,portation for movvments. The nature of the manner in which
carriers determine rates is then presented. The simulation tiodel
which will be used for analysis in the project is then presented
and described.
I Sc_po of the l'c5carch
The American transpurLation systtn, which Is coancened w;ith
the movement of f r o lfght, is s;o pervaiwv that it i: a1r.o. t b(:'Y'nd
Ii

-19-
imagination. .the system is composed of thousands of origins
and destinations connected by millious of miles of roads,
railroad tracks, canals, rivers, ppelines, and air routes.
There are fivC modes of transportation concerned with the
movement of freight. Thesc modes involve tiotor, rail, water,
pipeline, and air transportation. These modes literally move
billions of c-n-miles of freight each year.
To simplify the analy.is and to limit the scope of the
research tz, a mdnageable size, th3 research will restrict the
tumber of origins and destinations, the nui.ber of foundlng modes,
and the number of conodicies considered.
Because there are many possible cczbinations of modes whi:h
could be furned into a transportation comp.ny, the research w%-Ll
consider the two modA corbinarion which would most probably
have the most significant economic. i=pact on both the shippers
and carriers coicerned. Air carriers and freight forwai'ders are
involved with a relatively minor a-.ount of the total freight
movements. Domestic water carriers are limited to their geo-
graphically controlled route structures. ?ipelines carry n very
limited product line. The analysis will therefore limit the
system considern-4 to the two modal case involving a railroad
and a trucking cornpany, a.nd a traisrortation company which operates
Ii....filiiilq-ii+Ti'iiNMI",1 e

both the rail tAn highway modes. These two nodes are by far
the most important modes involved in the movement of,,freight.
1
In simplifying the analysis by considering only two modes,
the results which will bu obtained are restricted to the modes
considered. This is so because each mode has different economic
or cost characteristics which must be considered in the research. -
The extension of the analysis to transportation companies con-
sisting of more than two modes is conceptually straight forward,
although not necessarily easy to accomplish. To consider other
two modal transpurtation companies composed of different modes
should be a simple process once the methodology is established.
This study will address itself to only: a portion of the
total rail-truck market. The study will focus attention on
ccmmon carrier truck and rail movements including Plan I and
2Plan II piggyback mnovenents. Other forms of piggyback move-
ments will not be considered.2 Furthermore, the analysis wjll -i
also consider only one product. This product may be considered to
be the class of cormuditics which are subj. ,ct to intermodal
competitioi for movement.
I1n 1969 the total estimated revenue of all regulated ire 4 6rntcarriers was approxiCrately 26.4 billion dollars. Of this " alregulated railroads and .ator carri. r. ace unted for 92."V, cfthis total ci 24.3 billion dollars.. "America. Tric!king Trcnds 1970-71", Departments of Pecarch and Tra:nspor Ecao:crjcs and Pub -i. .Relations, Ar.crican Truc*i .. socia.tins, Inc. ('-.azhingto., D.C.), p. 16.
2Plan I piggyback rovements uti2i;e co.-.n carrier truck
trailers on rail o,-d f!'Lcars. Plan I pM;2.ac, .ne-.e.-ts 'involve rail o r:',! il r:iler. and flatc r.. 'hor, are other cr.sof pigg:'bazk ;:o.'.- -. iii )";o!'. shKi:.r -:::d truck tr . r ,and stii2. ot t .-rs "..'hicli c,, r Lo f, 'i;;h or.'a rr.
.I

-21-
Restricting the analysis to one product with average commodity
characteristics does present some difficulcLies. The commodity
charactaristics of goods does affect the cost of movement. Once
a system is solved for the average commodity, it may prove worth-
while to adjust the costs in the analysis by the amount these
characteristics cause the costs to deviate from the average. If
this is done, the transportatior firms would have exact commodity
break points for the modes over a cartain segment.
The size of the transportation market which is subject to the
intermodal conpetition is an important factor ior determining if a
transportation company has a greater profi: potential than two single
modal carriers. If all traffic were subJe.:t to intermodai competitlon,
there couid exist many possibilities where a transportation company
could generate a greater profit contribution than the competitive
single modal carrier by allowing each node Lo be used in its most
profitable market segments. If there were no traffic subject tc inter-
modal competition, there would be no increased profit potential for
a transportation company by allocating each mode to its proper
economic rcle,. There may however still be some economies of scale
involved in this situation.
To the extent that service differs between the modes, the
effective size of the amount of traffic which is subject to inter-
modal competi tion is reduced. For ivstainc, if speed between
nodes were substantia.ly d'fcre;t bct*.:en two pointE cn" this
was an irpcrLant dccision v,.rlable for a s'.iip&r, this facitr
• A

6ftU redia &Me amout of traffic subject to Intermodol com-
1*01ioo. Visa offoct this would have would 'be to redu(.e theI
Afta IN Alt *ft64ttva savinigs are likely to result by the
1*elitomfl of traffic to the most profitsble nodes, This
tyf# &f oituttio mild result also 1k a shipper'a logistics
*yatea vie tat up only for on. made of transportation, regard-
I##of wtioti,or or not it is ths low cost aarrier by which the
IrenOPenrition tconpeny would liku to m~ove 'ie s hipmtunts. To the
usoit tib typ of vituaLton prtvontA the movomont of goces
Ily OF IW C cuil carrier, 010 lads will be thle economic Impact
csitod Uy moiingt eaiportation companioi. Theme types of
Oitififo~ 665 10 ir6crpcrAtsd lNO the antldi. by conbtratrning
the *A'.ner iii wich1 movieetnto con br nedo Voitwt-an oigins and I
kstesifing the flut-6g of origin and Jestinaion pairs to
thai which Its mi~n o~I doos not really affect the generality
of tile reauha., For insitakne once (lic broeA points where modal
aIlji olv"B'I 'j"'cIt arc- Novid on~ a partictilar 11CLWork sag-nnt,
oil Iic. e#IIn and d-astinmiown paid bnuweori those pointis should
U*sivoed 10-1, ho ae' i.xdum %r miJt1 oda~l .L6U.-
011d i~~. (OL I, JIMI L1101 WI .1h I peced o!i the anelys1:j
r,fil1 Ili OIb fl~ncta "Li1u. Thew HIIL10bif Will be. a short-
li IndL, 0;4! 911iltioil tkuU14 wlllcJ will
1I II ;- Wi~j~ l lt 11U :.(h L 4h, Wci. a c ',ptirl~ g th10 oco nl J C
,______ . ,--.- , -..- . t I I I i
It fl - - -. .- .
-23- 1performance of a transportation company wich a single modal rail-
road and trucking company for a single timg period. This time
period may be thought of as being one day. The analysis will
not suffer due to this limitation because, as will be shown in
a later section of this chapter, the decision processes which
are being simulated remain the same from time period to time
period.
Asumptions
Now that the scope of the research has been described, this
section will identify the pertinent assumptions which will be
utilized in the formulation of the simulation model.
The study will assume that the appropriate regulatory azency,
the Interstatc Commerce Cor.'.ission, will continue to safeguard
the public interest. In other words, it will be assumed that
the activities of a transportation company, as well as the single
modal carriers, will not be allowed to run contrary to the public
Interest by &uch actions as charging exhociritant rates or dis-
regulatory supervision allows the author to assumc that the rates
charged by the singi. modal c.rriers and the transportation
company will be deter,,Ined by a con sstenL policy which will be
cxplaled in a later section. Further.tore, it will be asisuned
that the I.C.C. through it.; YaLe Ma!'1n? policy will contrcl the
average opcrating ratios of thc modc . The I.C.C. w:ill thuS
indirectly c ,, trol the /!-,,Lr.a:c rrIC of r t r for ! r. h i. ;
I

• -
-24-
Since the time frame necessary for'tha analysis is a short-
run analysis, one can assume that the physical plant-of the
companies is fixed. ThiL is, the number of: tractors, trailers,
flatcars, locomotives, terminals, line miles of track, road milt.s, I
and so forth, will be considered as constaats in the analys's.
Furthermore, the technological state will be litited to the
current state of the art.
For certain movements, the physical characteristics of
products restrict certain modes from carrling them. For Instance,
the shock resistance, or size or weight of some co=modities could
limit them from being moved by any one mode. This factur reduces
the number of combinations of coordinated .ovezents to those
Involving the xodes which are physically capable of carrying
the goods. The moda.l developed below will consider the co~odity
to be capable of being transported in a standard railroad box:ar
and/or a standard truck trailer. Piggyback movements will be
limited to the standard configuration of one or two standard
truck trailers on a flatcar.
In addition the assumption will be mado that when the
service characterlstics of the modes are equal, shippers have
no real preference bcLwceu the modos If they are physicall:
capable of dealing with cach r.
It will also be ass%:cd that shipnents subje't to logistlcs
constraints will be movN'.1 before the ca'rior s ::l,., cerzt itrvc Itratiic. 1hi . ri:,t.alc. eca rc. arr I ,s ti ht be e:.:jcL.d
JII

-,: - --- - - - --
-25-
-* to satisfy a guaranteed market before they would enter into
the competitive market place.
Furthernore it will be assumed that the transportation
:; company faces the same demand pattern av the two single modal
companies of which it Is composed.
The final assumption which will be made in this project is
that the transportation company can be effectively organized in
such a manner as to achieve its objectives. The objective
function: of the transportation company and the single modal
carriers will be presented in this chipter.
The assumptions utilized in this study will be critically
analyzed thruughaut this thesis to detarmine the impact they liave
on rcleting the results of this study to the real world. In
addition, Chapter VI devotes special attention to the discusslon
of these dssumptions and their relationship to the real world.
Identification of the Ircortnt Variables
Now that the pertinent assumptions which will be utilized
in the formulation of the model have been stated, this section
will identify the important variables -With which the nodel -All
be concerned. Vic purposu ouf this secLoae is to acquaint the
reader. on i. very general bi s,vIt, th1( "input and output"
varlables used in the jJr.ulaL1v:t analy:ls., This rater.al J5
presented at this time to facilitate tl- dcr2..din, of "he
matliematical ,"of t.:c .... fsJo.i t.
.,....u . o ie 1t; o .,v r ':t t l t

-26-
simulation model which will be presented In the next two
sections of this chapter.
There are two classes of variables which the models, to be
developed in the next section, manipulate to arrive at a solution.
These variables are exogenous and endogenous variables. "Exogenous
variables are the independent or input variables of the model
and are assumed to have been predetermined and given independently
of the systen modeled."3 Exogenous variables may be subdivided
into controllable and uncontrollable variables. "Endogenous
variables are the dependent or output variables of the system
and are generated from the interaction of the systers (model's)
operating characteristics." 4 Endogenous verlbles are synonomous
with the decision variables in this study. The parameters in
the moL9s formulated below may be thought of as specific values
of the exogenous variables. In other words, the models will be
solved with different parametric values. These parametric values
may be thought of as "snapshots" or a specific value of an
exogenous variable.
3Thomas It. Naylor, Joseph L. Ballntfy, Donald S. Burdick,Kong Chu, .no.!!t__rSimulationhchni uo,, (New York: John Wiley& Sons, Inc., 1967), p. 10.
4Ibid., p. 11.
I

-27-
Exogenous Variables .
Attention will be focused first, on th. exogenous variables
and In particular on the uncontrollable exogenous variables.
The cost of movement between any two given points may be cou-
sidered an exogenous uncontrollable variable which is a
function of uany other uncontrollable variables.
There are many variables which affect the cost of movement.
These variables may be divided into two categorits--those which
are concerned with the characteristics of the commodity being
moved and those which are concerned with the route over uhich
the movement will take place. The following cormodity charac-
teristics all have an effect on the cost a3SoCiatOd with the
movement of c particular commodity: loading characteristics,
susceptibility to loss and damage, volume of traffic, regularity
of traff~c, Lnd the nature of equipment required. The folloving
route characteristics also directly affect the cost of move-
ment: distance, operating conditions such as geographical and
weather factors, and traffic density.
Another exogenous, uncontrollable variable Is the demand
for transportation between points. While it may be true that
Individual carriers can affect the demand for their services over
See for instancc, Cernane, Glagkowsky and llcskett, Oyc_.,Chapter 4.
I
I • ! i I - i • ml• n i 'a III • ' i~ -m I I m 'l l g i,..= ......- ... .....

-28-
time, the short-run nature of the study has the effect of fixing
the demand for the carriers invclved. The same is true for the
amount of traffic which must be allocated to one mode or the
other due to shippers' logistics constraints.
It sh..uld be pointed jut that the nature of this analysis,
being a (very) short-run economic analysis, has the effect of
adding certain variables to the list of uncontrollable exogenous
variables which over a longer time period ,Mould be controllable
variables. The short-run analysis also ha3 the effect of more
or less "fixing" these variables at the values they have assuced
at the "moment" of observation.
The controllable exogenous variable ia the anal:ysis is
the schedule of carrier operations. This variable is a function
of both cost and demand. For instance, rail management may
institute a policy of moving freight only when the train reached
100 cars (approximately). This may have the effect of limiting
service for a certain comunity to once-per-day service. In
essence the scheduling activities of the carriers create the
amount of capacity which Is availabla at each point for move-
ments, although total capacity is fixed.
Endoge',ous '. rlahies
17he model3 for the single mcdal co.pa{c',tz and the transpcr-
tation co:.pany which will be prvcsentcd ir the next tecticn, prcduce
a number of cndo:c..:, or d,';ic, virl I!,:, Th -
arc IV :;!. -it 'A Iuc...,.d ,.' .'h C .) '.,J.L will .! :v.c d bc(t'cc
-29-
origins and destinations by truck, rail, or piggyback, and the
amount of capacity the carriers will allocate to the various
origins. The rate at which carriers price their services to
shippers is also an mndogenous variable, although the levels
rates can assume are bounded by reguiatory restrictions as will
be explained in the next section.
The rate shippers are charged is dependent upon the cost
functions of the carriers. The rate between two pointc is
dependent not only upon the co..odity and route characteristics
of the movement but is also dependent upon the competitive nature
of the movement. As will be discussed below, carrl.-q have n
certain amount of leeway in pricing their jer-Aces when con-
fronted with competition.
The amount of Cwt. moved between origins and destinations
by each of the methods of movetant is dependent upon: (1) the
demand for transportation; (2) the amount of traffic which is
constrained to move by each mode due to shippers' loIstics
constraints; (3) the amount of capacity carriers allocate to each
origin; (4) and the manner in which shippers select the rn.des
for traffic which is not constrained, i.e., competitive traffic.
The equipment allocation dccisions of the carricrs is dcpe:-dent
upon the amount of contrlbutlion to fixed wd/or cov::on costs
including profit allowance each novcI.eCt makes. That is the
carriers will. allocate thuli' equIpr-nt in uucih a..:u~cr as tcc
maaximix( the'.r cxpt:t Cd co t l i L h i : tt COt.Lr"l Ut .. I
4

( -30--:
U2
is dependent upon: (1) the forecasted demand between origin and
destination pairs; (2) the cost characteristics of the move- A
mnto; (3) the aount of traffic constrained for each mode by
shippers' logistics systems; and (4) the competitive nature of the
movements
The Decision Environment
From the discussion in the preceding section it is apparent
that the decision process of the carriers and shippers are inter-
active to a large degree, The nature of this decision environ-
ment will be explained in detail in this section.
The decAgion environnent within which the shippers and
carriers operate can be viewed as a constrained minimization
problem which interacts with a constrained maximization problem.
In other words, shippers will choose the least cost, as measured
by rate, method of movement between two points given that this
method does not violate the shippers' logistics constraints.
Operating within this decision fra.ework, the carriers will
attempt to mtximize their contribution to fixed and/or common
costs including irifit margin by allocating their equirnent to
the most "profitable" route segments. The an.ount of capacity
available tU shippers at oach oriin then is dpend,'nt upon the
equipnnt allocation decisiuns of the carriers.I.

-31- jIdentification of the Symbolic Terminology
The nature of these interactive decision processes will
be examined in detail following the identification of the neces-
sary symbolic terminology.
Let X be the number of hundred weight (Cwt.) moved fromij k
point j to point k by mode i. The designator i equals 1 when
the movement is by common :arrier truck, 2 when the movement Is
by Plan I piggyback, 3 when the movement is by Plan II piggyback,
and 4 when the movement is by rail. The designator j represents
origins; k destinations. Thus the variable X would indicate
the number ot rfwt. P-ved from A to B by truck. In other words,
the X arc the decision variables which in the sclution wllijk
indicate how much product will be moved by what modes between
given points to satisfy demand.
Let rijk be the rate per Cwt. charged by a carrier for
moving the product between j and k by mode i. Similarly, let
c 6Cik be the out-of-pocket cost to the carrier for moving the
product between j and k by mode i. The i's, J's, and k's are
defined as above.
Let represent the demand in Cwt. for Lransportation
service bet'een the two points j and k.
Y ijp. is the C3paciLy in cwt. allocated by mode i for move-
ments between j and k. Yljk and Y is the a.ount of single
6 Supra, rhapter I, p. 7.
p

-32-
modal truckirg capacity available for over-the-road and Plan I
piggyback mo~ements, respectively. Y3Jk im the amount of rail
Eowned trucking capacity available for Plan II plggyback move-
merts. is the amount of rail capacity allocated for
movements between j and k. F is the imount of flatcar capacityR
which the railroad has available for both types of piggyback
movements. FT the amount available for Plan I moves is equal
to P - LEY That is, the railroad does not have to provide7,, 3jk
flatcars for Plan I moves. The railroad will only do so if it
is not using all flatcar capacity for Plan II. FR and F willR I
also be expressed in Cwt. capacity available by multiplying che
number of flatcars available by the capacity of two standard
truck trailers.
Wik will be the amount of traffic which must be loaded
ito truck trailers, eitler rail or truck company trailers, at
- movement to k. This is the quantity of product for which
shippers' lcgistics systems are set up for trucking operations
only. In other words, some shippers only have terminal facilities
for truck trailers. Similarly U is the amount of Cwt. -hich
must be shiped by rail due to Gore shippers' logistics constraints,
between j and k,
Z is the amount of product which must be moved betWeen ijk
points j and k by the truck over-the-road. This quanLity .ay
be thought, c as tie az.cunt of traffic ,hih .t bc "aovcd froter
than what, Lh... r.. or pi - oi,.s can offer. ,.aiu this is
a logtiL[c.al cor;tr.aint of the 9tnIp :rF, h-h -1',t be satif[.A.
J

-33-
The Shippers' Dilenuna
The nature of the problem which shipp.,rs face, that of
choosing a method of movement, is a constrained minimization
problem which fits within the framework of linear programming.
In other words, after the carriers have male their equipment
allocation decisions, the shippers must choose how to move their
products. The linear programming formulation for the shippers'
selection amcng alternative modes when faced with a system
of single modal carriers is presented belo,,.
Shippers' Modal SelecLiuii ModelWhen Faced With Single Modal Carriers
Mmn Z "krlJk ljk + r2JkX2 jk +r3jk'3jk+ r 4jkX4 jkljk
Subject to.
Demand satisfaction
(1) Xlj k + X2j k + X3j k + X4j k - d Jk for all J and k
Capacity constraints
(2) X ljk +X 2 jk Y2k for all j and k
(3) rx S FR3jk R
(4) kX^. sF - TEXj2jk R jk3jkjk jk
(5) X 3jk -Y 3Jk for i J and k
(6) X Y for all J and k4jk -4Jk
,*1
..34-
Logistics systems constraints
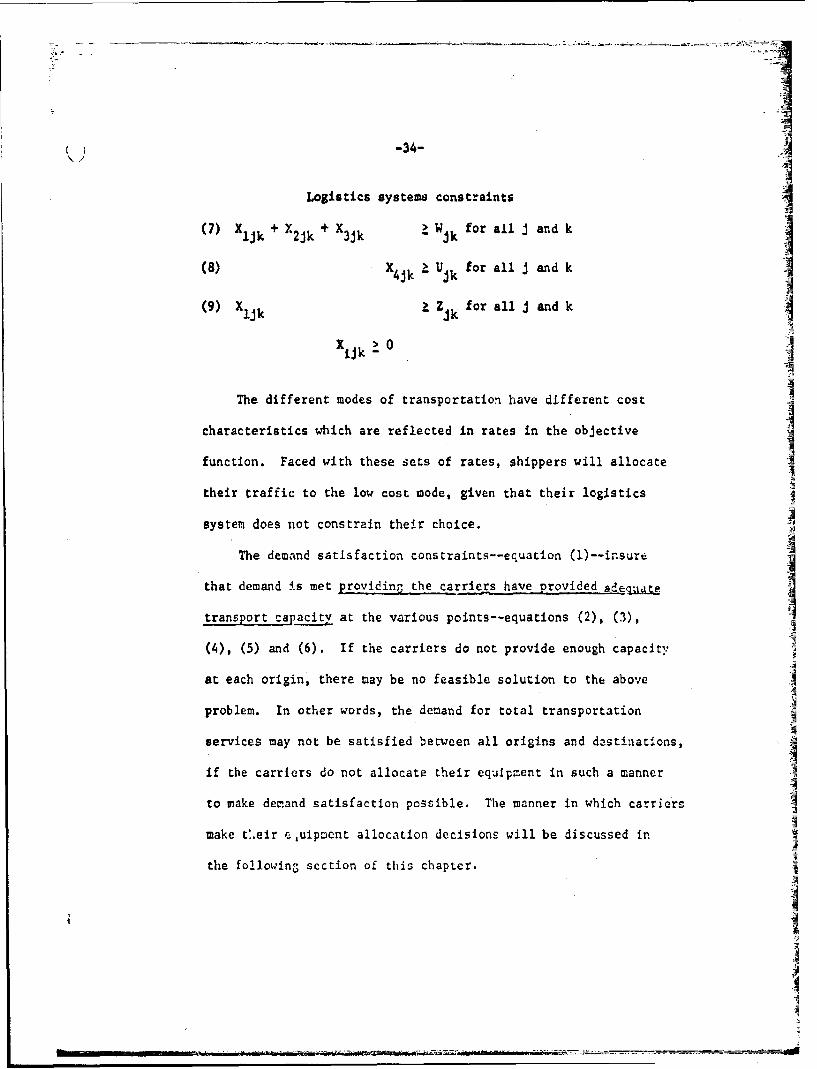
(7) xljk + X2jk + X3jk Wjk for ail J and k
(8) X4jk I Ujk for all J and k
(9) Xlj k z zJk for all j and k
Xijk > 0
The different modes of transportation have different cost
characteristics which are reflected in rates in the objective
function. Faced with these sets of rates, shippers will allocate
their traffic to the low cost mode, given that their logistics
system does not constrain their choice.
The demand satisfaction constraints--equation (1)--insure
that demand is met providing the carriers have provided adeq%, fe
transport capacitv at the various points--equations (2), (3),
(4), (5) and (6). If the carriers do not provide enough capacity'
at each origin, there may be no feasible solution to the above S
problem. In other words, the demand for total transportation
services may not be satisfied between all origins and dastinations, 4
if the carriers do not allocate their equipment in such a manner
to make demand satisfaction possible. The manner in which carriers
make t:eir c,uipmcnt allocation decisions will be discussed in
the follotwing section of this chapter.
*1.i
I

[ - . - - - ... . ... .. " ~ 4C.s.$&~. - .~......*. .......... ..-...- -- -
-35-
Equations (7), (8) and (9) constrain the solution to be
compatible with logistics systems of the shippers. Equation
(7) indicates that certain shippers have logiptics systems which
are capable of handling only truck trailers, although a decision
must be made as to how to move the goods--by truck, Plan I or
Plan II piggyback. Equation (9) indicates some shippers must
have their product moved by truck -or speed of delivery. Equation
(8) indicates some product must be moved in rail boxcars again
because of shipper logistics systems demands.
Similarly, the linear programning fornulation for the
shippers' selcction among alternative modes when faced with a
transportation company consisting of the same two modes is
presented below.Shippers' Modal Selection Model When
Faced With Transportation Company
Min Z UirX + rr + j + r 4X kjk rljk 3J k 4JI
Subject to.
Demand satisfaction
(1) Xljk + X3J + X d for all J and kljk 3jk+ 4jk Jk
Capacity constraints
(2) X +X -Y +Y for all J and kljk 3jk - uk 3Jk
(3) ZEZX jjk
(4) X4jk Y for all J and k
Fk= a

(6 4J j for all J and k
41 ~ j j for allii and kj
Ijjk "0
This torstiibaloI% to very airtilor to tOat of the two zo(.a1
#oVbtIIMY~s Poal On*C uiajot difference, howelitr, is thict the
#41of 4oftoiatt variablims X *;.4 Y are absent In the model.2jk 2jkI This arie iiwcuow Oie vraii~yortatioi coupany owne both modes
50thjt I'etiL I rpg"yt'#A 16 fdtontica to Pl.an 11 piggyback.
Whapio it tiw oowiorn c'uil Lin developed 'or this type of pig-y-
j beck wvpIent, but to kvv~y the intarpretau'on of symbols as easy
as 0oaeblo X~kwill bo ubud to IndicAto 4 pigeyback movement
Ily Ohe t r~biaopr teti ll c'Tpaly.
V~jatins 8.(2). (3) anid (4) survo the sAme purpose o
In the ktinle uodal mumpeotivio model, that is to inoure that
doo,4 to satisfied It therv ik adoquet(A capacity available.
j4li ii (5) , (6) taid ( 7) con!3 tra~ins 010 3olutiOzn to be cumn- 4
PAttblv Wi tit 5111Pp.firl' JrjI w~titn dUAandfl,
Tha1_ giv pr, 1 tornn buciut' o.' 1.heP - tructure have trivial
801o)t w *lhe, '11if 110L11il tU te prugr..1 will alwayn Invo1,C.
0hf PP"'" ' C11604~ Il- OR 10hu I/Cori L Inode Of trA11mpOrt fit ton given1

I\-37-
this is not ine-cmpat-ble with their respective logistics systems
aind providing that earriara' allocate their equipment in such a
tanner that t.is is possible. This fact will simplif; the for M.-
lation of the simulation model.
The Carriers' Equipment Allocation Dilemma
The above discussion of the shippers' dilemma is but one
part of the total riicLion environment in which the carriers and
shippers operate. This section will -ocus attention on the nature
of the problez the ci riers face.
If a transportation company is to create any economic benefits,
it must be able to offer transportation services at the same or
lower rate to chippers while maintaining or Improving upon the
profitability which single modal firms could obtain. As
mentioned previously, this would be possible if the transpor-
ta.ton company could achieve economics of scale and/or if the
allocation of equipment by the transportation company results
in greater total profits than the manner in which the single
modal companies allocate, their equipment.
If the allocation of equip-(cnt to origins Is different
between the two organizatiunal forma, i.e., single modal carriers
vis--Is a transportotion com ,any, his w.ll have an effect on
the profiLia'i.iLy of the two forr.s as u-cll as; on the price paid
for tranoipo tation servlccs by usterJ. It the single modal
Fiftuat oi: Lhc I .r, c.. r m'.U the , iL!.r.:.,d tvLi .:,Lc ic:cp..dent
l._!_t. , , . h
equ ]l,..', cuA

U -38- -trucking capacity to allocate each origin .qr truckinfmove-,
ments and PLn I piggyback movement.s. Similarly, the railroad
independently decides the amount of boxcar, rail owned truck
trailers, and flatcar capacity to allocate to each oeigin. The
transportation company, on the other hand, makes capacity allocations .1
as a single "profit center" which may result in different capacity
allocations to the origins than those that the single modal Larriers
make. This situation is displayed graphically in Figure 1.
Figure 1. Structure of Equipment Allocation Decisions
A ...... : Truckers
ru a
A *~ Rail
carrier'sshipper choice allocationof service of equipment
Single Modal Case
- IratspcrLa-tonA --- )Company
Ashippcr choP-c carrier's .*1location
of servJcc of equip.unt
Trd!nvport2Lion Ceonp,.nny

CA -39- "
The allocation of equipment to specifte origins by the
carriers det.rmines the amount of capacity available to shippers
at each origin. In other words, the solution of the above problem
places the capacity constraints, Yijk' FT and FR In the cost
minimization linear program of the shippers. Operating within
the framework where shippers are trying to minimize their transpor-
tation costs, the carriers wish Cn maximize their expected contri-
butions to fixed and/or comon costs and profit margin by the
determination of price and the allocation of equipment.
Mathematically, the trucker wishes to maximize
r ClJk)Y Jk + (r~Jk CZjk)Y2jkl
wher Y ' r And C are definetd above. The Plan IIljk' Y2jk' ljk9 ljk
piggyback movements are coordinated movements which r.ecessitates
the sharing or splitting of the contributions to zixed and/or
common costs and :.,rofit margin between the two firms. This
contribution we-ild have to be split between the firms on the
basis of the cost contribution made by :ach firm.
(r' - C ]k)Y2jk represents the truckers share of the expected2jk
conribution.
Similarly, the railroad wishes to maximize
11r2, - C2Jik)y2jk + (r 3 jk - 3jk)Y Jjk + :r 4 jk -c4jk~yq'jkl'jk J
r - C2jK"2jk Is the railroad share of expected contribution
2' C2 dy~j
ZZq

-40- A
resulting from Plan I piggyback movements. (r3jk - C3jk)Y3jk
and (r4jk - C4jk)y4jk are the rail expected contributions from
Plan II piggyback and boxcar movements.
Operating withip the framework of the second linear program,
the transportation company also wishes to naximize the contri-
bution to fixed and/or common costs and profit margin. Mathe-
matically, the transportation ccrpany wishes to maximize
EE(r'jk Cijk)Yijk
ijk
To accomplish these objectives the carriers must deternine
where to allocate their equipment. The carriers are constrained
by the total amount of equipment (capacity:, they ow-n and by the
logistics cor.straint3 of the shippers. ConcomLitant with their
resource allocation decisions the carriers must also determine
what rate they should charge shippers to u,e their services.
The ,arriers' Pricing Dilce.a
This section will outline the nature of the carrier pricing
dilemma and indicate what leeway carriers have in pric'r.g their
services.
In general, becau.qe the tw:o modes have different cost charac-
teristics, i.e., before differing anounts of fixed and variable costs, *he
out-of-pockct costs and fully distributcd :osts for the modes7
will differ for a given origin and destilnaon pai:. Because
A full c::planitlcn of the ( ffcrcrc-- f r. t!,e cos'L charactcr-i~t CS (.; ,e tr l:- ....! rai ,; ! , ".'Ii hi :,L
III (ti ,; , 1. 63 ). Tih 'c .:i : o':i 2' a d ,:c i t ,,f
the pf;.t:t which afY' . Lh-Li cost 0, , "'..",.
S-~ --... ~.....
-41-
the costs of the modes will, in general, be different for the
movement of the average product between tvo points, one needs a
pricing or rate making scheme to determine the price of transpor-
tation services between vario, s points. To be consistent wtth
8current transportation policy in this matter, the following
price setting mechanism will be utilized.
When the out-of-pocket costs of the high cost carrier are
less than the full costs of the low cost carrier, the full costs
of the low cost carrier will be the allowable floor for the rate..
This statement is illustrated in Figure 2(a). In other words,
the high cost carrier maZ, if he wishes, price his service at
the full costs of the low cost carrier but no lowL.r.
The high cost carrier may also price his services at hic
full costs. It may appear that there is no choice for the high
cost carrier but to price his services at the level of the full
costs of the low cost carrier. This is not the case however.
Between any two given points the high cost carrier ray have sold
his services to some shippers on the basis of lower toLal
logistics costs for the shippers even though their transportation
costs may be htthc.r than need be the case. ifn other words,
transportat 4 on co.:ts are but one of the costs involved in
accoMplishing; the 1oi:tic fuHction. Soze shippcrs -ay elect
for intaurc to trole-off hiIxr LransortaLl(. costs for I.e-c r
itwventory conts, and -o fort. In tI .Cdcis JWvulc,."' in Ge
. 9 .r.i, ch-tkr ', p. 7.

-42-
previous section, these situations were incorporated in the
logistics cot,straints which force a cert3in amount of traffic to
move by some modes regardless of which is :he low cost mode.
In light of this, the high cost carrier will price his
services at either his full costs or at th. low cost carriers'
full costs depending upon which price cont:Ibutes the Lost to
profit. If services are priced at the same level the traffic
botween those points will be arbitrarily split equally between
the modes. The high cost carrier will thei examina how much
traffic the logistics constraint requires be moved by his mode
and the amount he estimates he could obtain by pricing at the
low cost carrier's full costs. The high cost carrier vill then
determine under which price his contribution to profit and fixed
costs will be largest and will accordingly price his services at
that rate.
When the out-of-pocket costs of the hfgh cost carrier between
two points, is greater than the full costs of the low cost carrier,
as depicted In Figure 2(b) the full costs of the respective modes
will serve as their rates between two points. This is so because
it has been assumed thaL the I.C.C. will allow a specific rate of
return on each movement between all points.9 The I.C.C. would
9 In practice, the I.C.C. duc.; not atL:pt to control the rateof return on each c.o-.0dity bctw,. .n every - ri;)fn and .' , ;tInain.The ".C.C. dJ:es atLc1-.'L Lo co'tiz"ol Itnc raLv-c - r..u,.n ,,:r cirrierSin the aggro3.,te, co..hkrig all. .o.vnt of aai ccr.:.,o. ,: L.

-43- I
Figure 2. Restrictions on Carrier Pri:ing Decisions
(a) Allowable Floor for Ratzs
full costs
'wable floor for -- full coltsrates
out-of-pocket costs
out-of-pocketcosts
high cost low cos: carriercarrier
(b) Allowable Ceiling for Rites
full cost including profitallowance
out-.of-pozkct cost
full costsincluding profit
allov'ance
cut-of-pocketcos :u I
high cost low cost carriercarrier
control the rate of return by spc-cifylng o: controlling the avera;c
operating ratios of the wcdcs.
I2; h

- - ---.-.. .- . . . - . - .... . . ..-
U' -44-
A
The Simulation Model
The ecornic evaluation of a transportation company versus
sin independent trucker and railroad which i1 be ur, derraken in
this study is based upon the simulation of the interactive -J
decision environment just described. In the preceding sections
of this chapter, all of the components needed to "construct"
the simulation model have been presented. This section will bring
the component parts of the simulator together and explain how
the simulatior was undertaken.
The simulator cz the single modal carriers and the transpor-
tation company wlich was developed indicates how the firms should
price their service and how they should alLocate their equipment
based on the. criterion that each f~r- wisht:s to maximize its
contribut.on to fixed and/or common costs including a profit
margin. Solutions of the simulation model were generated for
differing levels of the parameters which will be described In
Chapter III. The solutions to the simulator may be thought of
as a sensitivity analysis on the cost coef.icients In the
objective functions of the carriers, the level of logistics
constraints, and on carrier capacity. More detail on Uhe type
of analysis that was performed is also presur.ed in Chapter III.
This approach rcquireq that the carriers kno;w the full costs
(rate) of the .ow cost n.cdL and their c-'n rvIporcLiVe Costs. his
is reasortable , that L.c rate of the luw cos. carrie: "'" be
publish d A:l ,,,.I.C.C. rrc dar- .. ,.

-45-
also requires that each mode know's how much Lraffic is committed
to each mode for movement due to shippers' logistics constraints
and alternatively how much traffic in each route segment is subject
to intermodal competition. This is not unreasonable providing
the carriers have alert marketing research departments.
The same simulator can be utilized to determine the equip-
ment allocation and pricing decisions of both the single modal
carriers and the transportation company. The manner in which
the algorithm is applied varies slightly for the two organi-
zatlonal approaches, however as will be explained. To determine
equipment allocation and pricing decisions of the single modal
carriers, the algorithm is first solved for a given set of
parameters for the rail mode then proceeds to the trucking mcde.
The simulator will now be explained int detail. The Inde-
pendent railroad first determines the full costs of making rail
boxcar, Plan 1, and Plan II piggyback movcnents for each route
segment in the transportation system. The rail carrier then
examines each route se;neut to determine i., one of the methods
of movement he controls (rail, Plan I or II) Is the low cost
method on each scgment. For tho.e route se 'ents where he does
not control thc lo,. cost rvthod, he iternis if he can price
the services of one of hi mtWods at the full cost of the
trucker,
Once the rndlroa.J ,L r:.nc: whcr.,c he can c:'pcte for uncon-
straiIcdJ or c,-.M:. L itic tL.:f C' T.1 I Ch Of IIit
. . . he .~l .'t.. Uj .u h f l~

A
-46-
market he cart expect to obtain. Using theue predictions, he
determines which methcd of movement makes the greatest contri-
bution for each route segment. In other words, on the segments
where he has the low cost mode, say boxcar, he would compare the
estimated contribution of his other methods priced at the boxcar
rate and determine whicl. method made the greatest contribution.
Once the estimated contributions for each route segment have
been completed, the railroad ranks the expected contributions.
This ranking determines the most profizable manner of pricing and
equipment allocation for the carrier. The carrier will illocateI
his equipment beginning with the most profitable expected contri-
bution and proceed to allocate his equipment down the rank until
his capacity is exhausted. It should be remembered at this plint
that it has been assumed that shipments subject to logistics
constraints will be satisfied first.
Since the algorithm uas accomplished for the :ail carrier
first, the routine will now Le run for the trucker, for a coratible
set of parameters. Before the trucking routine is accomplished,
however, the amount of flatcar capacity the railroad will offer to
the trucker n.ust be determined. If the rail carrier has used all
its flatcar capacity, the trucker will be pre-empte'd from particl-
pating in Plan I moves, If the rail carritr has some flatcar
capacity left, this amount vilt be made available for the trucker
in case he should find it dr rable to use Plan I piggyback inve-
ments. The ,'i:.ulalin Of the trucl.-Lr dc;2Isiunn are arLILIou,
to these of the ra rd; Lhcrcforz n,.d not le repeated.
0 -47-
The algcrithm for the transportation company differs slightly
from the one presented for the single modal carriers. First,
the transportation company would not have to estimate how much of
the competitive market it could obtain for each method of movement.
The company vould only have to estimate the total size of the
market, as do the single modal carriers, but would then determini
how to most "profitably" move that traffic since it controls all
methods of movement. Also the additional bookkeeping of determining
how much flatcar capacity is available for Plan I piggyback mov:
is eliminated.
This section does not complete the discussion on the simulatior
' model. In fr.ct this section has presented just the skeletal
framework of the simulator upon which the following two chapters
will expand. Chapter III presents a detailed discussion which
focuses on the test factors which will be analyzed and describes
how the cost data was generated. Chapter IV describes the per-
formance measures used to evaluate the output of the simulati-
and discusses the nature )f the experimental design utilized in
the study. It is only after these chapters have been read that
the reader w-ll have a full understanding of the nature of the
simulator utilized in Lhis project.
I" I

-48- I
CHAPTER III
SPECIFICATION OF THE MODEL
The preceding chapter presented and described the nature of
the simulation model which will be utilized to determine the effects
selected test factors have on the economic perforance of a transpor-
tation company in contrast with that of two single modal carriers.
The description of the simulation model was very general in nature,
however. The parameters which the model manipulates to arrive at a
solution were identified but only in an overview fashion.
The purpose of this chapter is fourfold. First, the chapter
will fC:Us attention upon the specification of the test factor
sel *ite to- analysis and will explain how these factors effect the
parameL.c values in the simulator. The discussion of this pcrtlon
of the chapter will include the reasoning behind the selection of the
test factors as well as the Identification of the specific values of
the factors. The second objective of this chapter is to identify the
other cpecifics of the model. In this section of the charter the
random components of the model will be specified and the values of
these raadom variables will, be Identified. This section wIll also
describe the shipcru' modal selection policy that wIll be uscd by
Athe shippers fn the rodel. Thirdly, rhe manner in which the carinZ
data will be generated for use in the simujation model will be idntified.
The te;t factors which affect the cost of movenont 'J l also be
idcntlficd, and the --stuve of Lh functionial relatin;hi bCL-twen

WI~Ii2
cost of movement and test factor values wll be explained. Finally,
the trarnsport.tion system which was modeled will be presented.
Classification of the Test Factors
The parameters which affect a carrier':; economic posture may
be classified as environmental, commodity, and route factors. There
are many environmental factors which could affect the economic well
being of a carrier. For the purpose of diseussion, the environ-
mental factors may be divided into two groups--managerial and
geographical factors.
Ianagerial factors, such as the competnce of personnel, organi-
zational effectiveness, and management-labor relations, are concerned
with the managerial effectiveness of a carrier. These environmental Ifactors will not be directly considered in the inalysis because the
transportation company and the single modal carriers which will be
compared have been assumed to be able to achieve their objectives
of maximizing their respective contributionq to fixed and/or cornion
costs including profit margin. Thus the competence of personnel,
organizational effectiveness, and so forth ol both organizational
forms, i.e., a transportation company vis-5-vis single modl carriers,
have been implicitly assuzed to be of equal effectiveness. ':he
validity of this assumption will be discus . :d at length in Chapter VI.
Geographical factcrs such as weather or climate conditions anr.d
the geographi.-al terrain over which a carrier upcrates are cor,cerncd,
as the na:c Implies, wjth the gcc;;raphfcal environ-cnt of a carrier's
route strucLu:-L. Since the ra.lIrcad amd . llf:i cc: :.. My Pnd tho
!g
-750-
transportatlon company trill operate over the same route system these
factors will iot be directly considered in the ceparison between
these organ55ttiott alternatives. That is, the operations of thea
two single modl firms w1l1 be compared with the operations of a
transportation company which I-As the same route structure and hence
would face tho same climatic and geographical conditions. These
enwronmental factors will be considered In]irectly, however, as such
factors would affert the cost of movement over the route syster of
the cArriers,
Commodity factors are characteristics of the goods, which c-~-te
differences in the custs of movement, For instance, one clasb
goodc tAy have loading characteristics which would require special
hxndlin. Jinquos which would roquire additiorkal labor nr capital
outlays by the carrier thus affecting the cost of movement. As mentioned
in Chapter 1I. commodity factors will not be addressed in the study.
This is because the rail and truck modes have literally thousands of
comaodities many which have characterlstics which affect the cost
of movement. If one were to consider a number of commodities, the
number of decisio, variables developed in the previous chapter would
have to be mu Ilplied by the number of comoities considered. Thus
ftr the sake of simplicity the study will c ncentratce on the "average
commodity su:)ject to Intermodal conpeLiton for movenent." While
thin nirtliIJ(:atiL.. zay effect the Zcuerality of the results of
the study to scome eXtent, the object of the study is to obtain a broad Ipicture Of the effecL!; of the factorg consJdL-r- ra.ther than to cc,.-
cttU111l' tE, ol !;;Ic( c . .. ,"':,nts of cr 1-c L;j in I ct : .1,.,0 .'.., ,q " ...

,-51-j
Furthermore this simplification may no: be as serious as it first
appear . For Instance it is not likely tha: the commodity charac-
teristics of a shipment of canned corn differs substantially from a
shipment of canned motor oil. Nor is it likely that the characteristics
of stoves differ substantially from those o! washing machines. InN1
other words, there are classes of goods for which the commodity
characteristics are substantially the same. In fact, the classi-
fication of goods into a relatively small number of groups is the
starting point for the carriers rate determination process.
That is, each of the hundreds of thousands ofshippable commodities, ranging from aardvarksto zymometers, is placed (classed or classified)
In some one of a relatively small number of "classes".Then instead of shipping a co=odity, In effectone ships a certain quantity of a certain "class".
This fact would enable the solution of the model for "the average
commodity subject to internodal competition" to remain valid for
a number of comnodities. A solution for each specific class of goods
could be obtained by using the average costs applicable to that class.
While this ende:avor should be of interest tD the firms which may be
inteLested in forming a transportation company, this is not necessary
to obtain a broad picture of the effects specific factors have on
the operating characteristics of a transportation company, which is
the object of this dissertation.
Route facLrs may be conveniently classified Into two groups
for purposes of discussion. Internal route factors arc those factors
]Sampson and Farris, 9pE.ft., p. 162.
I

--. . . .
. -52-
which the carriers can contol'to someexten:. Examples of internal
route factors are carrier operating ratios, load factors, and carrier
capacity. External route factors are those factors over which the
carriers can exct little or no influence. One: external route factor
would be the level of shippers' logistics constraints. Thus,
examination of the route factors lies at the heart of the purpose
of this project. That is the effect each of these factors has on
the operations of a transportation company compared with the operations
of the single modal carriers should indicate whether it. is possible
for a transportation company to achieve economies from the reallocation
of traffic from high to low cost mo4es. These route factors are
the test factors which will be analyzed in the study to determine
the effect they have on the economic performance of the transportation
company and the single modal carriers.
Internal Route Factors
The intertial route factors which will be studied in this thesis
are: (1) the operating ratios of the composite single modal companies;
(2) alternate levels of load factors of these companies; (3) the
capacity of the carriers; and (4) the size of shipments.
The levels of the factors may be considered to be an upper
bound a:d a 1~wer bound of the factots, Ii other words, the valuc
of a particular factor for most companies should lie bet:4een
these bounds. Thus the CvaluatJ ,: of the changes In The level of
these factors should prouvdu ni -Ihti as to how the!;, factors would

___ ___ __"__ __ . ......... .......
affect the economic consequences of a tranwportation company formed i
by carriers vith factors which lie between these bounds.
Carrier Operating Ratios
As stated in Chapter 1, one of the potential sources of
economies resulting from the formation of a transportation company
is the possible reallocation of traffic from the high cost mode to
the low cost mode on a particular route segment. Examination of
carrier operating ratios, both truck and rail, should give insights
as to whether or not this is possible. Thn operating .atio is the
ratio of operating expenses t; operating r.tvenues. Thus the operating
ratio of a carrier directly affects the contribution to fixed and/or
common costs including profit margin which may influence the manner
in which the carriers make equipment allocation decisions. One would
be interested in determining if a change in the level of the rail
and truck operating ratios causes the equipment allocations of the
transportation company to be significantly different o am the manner
in which the singlc modal carriers allocate their eq, ment. Another
question of interest is whether a change in the operating ratios
causes the contribution of the organizational alternatives to be
significantly different. As will be explained in the next clapter,
variour pcrfiranc measures will bc calcu'ated from the smu] tlln
runs which will be helpful In ans,,,erir.g the2se questions.
The specific opera3lng ratios which will be considered are 99.'; 'I
and 91% for the truckln firm r.prcenhLn a below avec'3g- or :nef-
ficient cirrir a;d a I raa carri, r, re:.pecti vc. T, opcrav,",n

7
U -54-
ratios for the rail mode will be 85% and 63% representing an inef-
ficiently anu an efficiently uanaged carrier. Within these spectrums
one would find the average carrier.
Carrier Load Factor
The load factor of a carrier shall be defined to be the average
payload transported over the carrier's route system. In other words,
the load factor is the average weight of shipments transported between
origins and destinations. The load factor of a carrier directly
affects the cost of movement, as will be explained In detail in a
later section of this chapter. Thus, this factor should have a direct
bearing on the manner in which carriers allocate their equipment and
on the profitability of the firm. Also of interest would be the Imanner in which operating ratios and load factors interact to affect
carrier allocations and resulting profits and cost to users.
The specific load factors which will be analyzed for the trucker are
100 Cwt. and 300 Cw.;t. representing a low load factor and a high load
factor, respectively. The load factors for the railroad will be 400 Cw-.
and 800 Cw,. representing a low load factor and a high load factor. 3
The average operaLing ratio for Class I and II motor carrlerswas 96.2% in 1970, ("Amerjc,.n Trucking frctnds 1970-71", op.cit., p. 19).The approximate avurage cperaVn;, raL'u' of Class I railroads was 79. I. 3-1969. ("Ycarbook of Railroad !'act3 , ]97L Edlitio., Econcrlcs & r:'ranc -
Departm 'n t, Assci ation of A-'crican Railroads (Chicago, Illinols: April19 70), p. 9.)
3 TDe avera),o, load factor 'or Class I :totor carriera of cneralfrelght was 264 't in !L9.9, (' rc ruc in; ir.n.. 19Y ,-7l,
oP.cIt., p. 34.) "ihe averaOge w,- ;;t of a carloaid cf ra 1 frojgdhtwas Lppro.Iiauc ' 28 C',t. - i ]"69, ("Ycar-ao of .::Licad .- 'ts' ,
r Pi.,Jt., P. ~5o.)
-55-
91I
Size of Shipments
The stuay will segregate movements into two categories truckload
(TL)/carload (CL) movements and less-than-truckload (LTI,) movements.
This distincAon 4s necessary because the'cost characteristics in
the TL/CL movements are different from those of LTL movements. The
reasons for these differences as well as the nature of these differ-
ences will be explained in a later section of this chaper.
TL and CL quantities shall be defined to be shipments which are
capable of beinig moved in either a truck trailer or a boxcar. In
other words, the TL/CL shipments received from the shippers are large
enough to be transported by a number of truck trailers or a (different)
number of boxcars. Thus, TL/CL shipmcnts .:an be moved by truck,
piggyback, or by rail, subject to shippers' logistics constraints.
LTL shipments are those which are not large enough to fill a
truck trailer. Since the railroads have phased cut there less-than-
carload (LCL) business, these types of shipments are subject to move-
ment by truck or piggyback only.
Capacity of the Carricrs
The capacity of the carriers should also affect the manner in
which the carriers make their capacity allocations and thus affect
the pr.ofALaility of fir.hs. This factor tay also affect the price uselr
pay for tra.-;porLation survice. Like the other factors disci:',sed, the
capacity of the system will also assumc two levels. 'I,,Z:t is, the
system wide ca pacity of the carriers will bo ;tu icd for .ffc.'Cs at

-56-
F two levels. The lower level of the system will be defined to be that
combination of carrier capacities which is capable of meeting all the
expected demand requirements for movement within the system. Whether
or not the carriers allocate their equipment in such a manner as to
meet that demand Is subject to analysis. The upper level 0i -vstem
capacity shall be defined to be that amount of capacity owned by each
mode such that no one would add additional capacity. In an operational
sense, the upper level of system capacity will be that amount of
capacity such that each carrier is capable of meeting at least all
the expected demand rcquirements within the system.
The capacities of the carriers have been segregated into two
groups--a certain amount of capacity has been reserved for TL/CL
movements and a certain amount has been reserved for LTL movements.
In the real world it is very unlikely that a carrier would segregate
its equipment into such groups. This artificiality was introduced
so that the two classes of novements--TL/CL versus LTL--could be
studied separately to determine if the different organizational approaches
(transportation company versus single modal carriers) have significanti)
different economic consequences in so far as the two market segments
are concerned. Although the sJr.ulation could have dealt with the
total market seZP;'nt by using average cozts of movement including
both CL/TL and LTL in the sa:.:z cost figure, this would have lost the
information as to ho% the or;;aniztiont1l for&.s perform under the FI ze
of shipment para.'tcr.

,________ , M_1 ---- - I
-57-
The amount of capacity set aside for each type of movement by
the modes is also somewhat arbitrary. For instance, the specific
percentage of capacity reserved for TL movements by the trucker may
be relatively large as compared to what one may find in the real
world. That is the trucking mode In the simulation has reserved an
amount of capacity equal to that which the railroad has reserved
for CL movements. This may indeed not be the usual case in the real
world. It must be stressed, however, that although this capacity
split is arbit:ary, for comparison purposes it is consistent. The
performance of a transportation company will be compared with the
performance of single modal carriers operating with exactly the same
set of parametric and random values. As will be discussed in great
detail in Chapter V, the analysis will focus attention on whether or
not there are significant differences in the performance between the
two organizational approaches. llcnce it is of greater importance
in this study that the parametric and random components be internally
consistent between the approaches than is the absolute values of the
parameters. More will be said about this matter of internal consistency
in the next .;hapter.
Before proceeding further, it should be pointed out that in practic.e
the rail mode would alsc not allocate a certain aMount of capacity
for plggybaLk LTL move:3u;ts as this :;tudy has doac. Agaiin this 'vas
done to dotcr-.ine if the two tra'tsportatlcn approaches vwould resuIt
in a diffcrent equip ent allocation p..,trern and icn goucIv rcsult in
signIfica'itlv diffo:rcr t cfL (2 Onic ccn;('urnc,..q
WO¥=-WWTI
~-58-
External Route Factors
The external route factor which will oe studied in this thesis
Is the level of the shippers' logistics constraints. The size
of the shippers' logistics constraints will also assume two alternate
levels.
Shippers' Logistics Constraints
Since shippers' logistics constraints directly affect the manner
in which carriers allocate their equipment, this factor will definitely
affect the economic situation of carriers. It has been assumed that
the logistics constraints of the shippers must be satisfied. This is
not an unreasonable assumption given that certain shippers' logisticsI<
systems dictate the movement of goods must be allocated to specific
modes. The carriers should also be expected to satisfy a guaranteed
market before they would enter the competitive traffic market.
As was mentioned earlier, the size of these lfgistics constraints
determine the size of the market which is subject to movement by more
than one mode. The second leval corresponds to the situation where the
logistics systems of shippers doces not constrain the allocation of
equipment by the carriers to a large extent. In other words, the
second level of this factor provides for most of the market being
subjec. to i.tercodal con-petition. The first level of this factot
constrains te solution alo:q.g no--al lines to a ri'ach greater e:tent.
Eximination of this factor should provide guidelines as to under
what compe titive circur5:5Lrcc, If cny, a tranvpo-tat-cn ccmpany
would out perform ci,,I, 2c'dal c---:'p:ies.i

Other Specifics of the Model
This section will identify the random components of the model
and will present the shipper's modal selection policy. There are
two random variables incorporated into the simulation model. These
are: (1) The forecast of the market share of competitive inter-
modal traffic the carriers predict they can obtain; and (2) The
demand for transportation services between specific points.
Carrier Market Share Predictions
The market share of the traffic subject to intermodal competition,
each carrier predicts he can obtain, will be treated as a rando.
variable in the study. This is in keeping with the difficult real
world problen of forecasting market shares. The market share a firm
obtains is determined by a number of factors and complex interactions.
For example, the market share a transportation firm obtains is dependent
upon, among other things, the general economic conditions, the service
reputation of the firm, the effectiveness of the firm's advertising/
sale3 progran, and the logistics systems of shippers. Thus the =arket
share a firm predicts it can obtain is likely not to be 100% accurate.
The firm may over estimate its market share or under estimate its
market share as well as possibly having an accurate prediction. It
Is because ' the large number of incractions and uncertaintiAes
involved in the csti:.,;tjon of market sh.arcs that he prcdict.c7! of
markete shares a carrier will obtain will be Lreated as a rand-.n
variable.
J3
t-60-
The values the variable may assume fo- the trucker and railroad
will be 40%, 50%, and 60% of the market subject to intermodal conpe-
tition. In other words, when these carrlers can compete for traffic, '
they will estimate they can obtain either 40%, 50%, or 60% of that
market for a particular route segment. The particular estimate for
each route segment will be determined by a table of random numbers.
Wien a carrier cannot compete on a given segment, the other carrier
will attempt to estimate the size of this market and if profitable
allocate equipment to it. The values in this case will be 80%, 90%,
100%, 110%, 120"% of the market. Thus for any given route segment,
the carriers may over estimate the market which would result in
excess capacity at some nodes or they may under estimate the market
resulting in unsatisfied demand between so'ne points or they may
exactly estimate the market which would satisfy all demand and leave
a minitaum of excess capacity.
The transportation company, likewise, is confronted with the
same market prediction problem. The values of the estimated market
share the transportation company expects to obtain will be 80%, 90%,
100%, 110%, and 120% of the market subject Lo intermodal competition.
The particular estiat1e for each route segment on a particular run
will be determined by suring Ithe si " mDal carrier's estimates
in order to Freserve internal consistency. In other words, if on a
particular run the trucker estiniates lie can obtain 60' of the inter-
modal compoeltiva n:irket cn one scg.cnt and the railroad estm=teOS it
can obtain 5Q:, the tran:sp:rtaticn cCMpa1ny ":oud es':iate the sze of
LA

-61-
the market at 110% of its true size. In essence, this allows one
to make a cross comparison between the performance of the single
modal companies vis-g-vis the transportation company in which notA
only are the parametric values the same but also in which the random
components are consistent across the organ. ations.
The Demand for Transportatlon Services
The demand for transportation services between any two points is
determined to a large extent by the demand for shippers' products.
If the product is manufactured at point A and there is demand for
the product at point B, the product must be transported between these
points. A more succinct way of stating this proposition is thate
transportation provides time and place utility J:, goods. Viewed
from the carriers perspective, the demand for transporation services
can be thought of as a random variable. The variability of the size
of the transport market is of course directly related to the problem
the carriers have in predicting their market share.
The size of the transportation market subject to intermodal
competition ,ill be allowed to assume three value.;, a high volunC of
traffic, an average volume of traffic, and a low volume of traffic
for each size of shipmient level. The specific level of denand butwoen
specif'c poi is will be dete .zined -y a L)le of random numbers.
Shippers' Sel-ta1 S.-n Policy !
In thu cc-..pet.iLtvc -ingle -oda2l c=.pany situation, the carric.rs
mus t dctir-n.inc ii the y can c-'.cu e in a markcL 5Cflnt Sub A = to
-62-
intermodal ccmpetition. If they can, they must allocate equipment
to that segmtent consistent with their forecast of the amount of
traffic they can obtain in that seSment. If the carriers allocate
more equipmert to a segment than there is demand and if this allocation
results in more than one method of movement being offered to shippers,
the shippers must chose the manner in which to move their goods.
These methods have no service differences (or these differences are
unimportant as perceived by the shippers), or else the shippers specific
needs would h.ave been included in the logistics systemr constraint.
If the carriers have collectively uader estimated the amount of
traffic subject to intermodal competition, the shippers have no
choice but to accept what is offered, up to 100% of the demand being
met. If the carriers over estimate this market, the shippers must
choose what methods of movement they will use. Under these circum-
stances, the follov!ng shippers' modal selection policy will be adopted:
The shippers will allocate their traffic equally between the carriers.
This is in keeping with the assumption that when the service of
competing carriers is equal the shippers have no real preferences
between the codes.
In the case of the transpprtatJon company, operating under the
assumption that it will face the same demand pattern as the sif.;le
modal cor.mpanies of which It is coprised, there may be no need for a
shippers' modal selection policy. This is so because the transpor-

-63-
tation company would most probably allocate only one method of
movement to any competitive market segment.
Recapitulation of the Test Factors
Due to the length of the preceding discussion, a recapitulation
of the test factors, shippers' modal selection policy, and the random
components of the model is in order. The test factors and their
appropriate levels are outlined in Table I. Table II displays the
random comporents of the model and describes the shippers' modal
selection policy.
Generation of the Data
As stated in Chapter I, the data which will be used In this study
will be hypothetical. This section will explain In detail how the
data will be generated for use in the simulation model. The discussion
will also focus on an explanation of which test factors affect the
cost of movement and the manner in which they effect these costs.
The costing figures used in this study will be on a per hundred
weight (Cwt.) basis. These costs will be ascertained by ailocating
the total costs between specific origins and destinations on the
basis of the amount of Cwt.'s transported between them. Once the
full costs of each :.ode have been detervined, the pricing t.echansm
explained in the last chapter will be utilized to dctcriine the
appropraLc rates be:,teen- t,:o points. A computer program has been
develo[c! to calculate the full costs of the modes. "The costs will
differ each time a parameter Is variud.
'- : i- .. .-..

-64-
14 P-4- 00
4)U C%.. 00 U .joo Vor 0 co C:00 -. Cs 0~) O-.0 wl 1 0 c-Q
CA -T 4- -
*4v 5*J -t:
U u I"C
I-4:
C . ; . 0 U -

..'. o
.. .. '"
"-
-.- -,_-.
-65-
TABLE II
OTHER MODEL SPECIFICS
RANDOM CO,.PON.,TS: VALUES OF RANDOM VARIABLESA. Carrier Market Share
Estimates
1. Truck,r 40%, 50%, 60%2. Railroad 40%, 50%, 60%3. Transportation Company 80%, 90%, 100%, 110%, 120%
B. Demand for TransportationSarvices on Each RouteSegment1. CL, TL Shipments 30,000 0.'t; 60,000 'WL;
90,O0C' 04t.2. LTL Shipments 15,000 C.':t; 30,000 (.Cwt;45,000 Cwt.
SHIPPERS' MODAL SELECILON POLICY:If the carriers have colloctivol, under astimiated tl~a amount (.ftraffic GubJc2t to Inter-odal co:,potitlon, the shipIcri have riochoice but to 8CCepL Whirt If- offor(d, up tu 100, of the cer;anIbeing met. If the carrior3 collectively over eL'mato thiimarket, the shippers will allocatc thuIr traffic. equally betw c nthe carrIers.
The CosLTnl C!oS7t4rThvraor, Pt'. iny cuvtttng C t,:vl,-.,i Oo~ (..4d liao for atwily""1ir,4
thti COAL of ruvillo tiod4, Trh foOibovjll ! C ttRLt IAdY b'..i1
chobtEI Iieo u-u thliy rev il Inf ttiiiL Aia oi t I ....' uff c t 0
IIIt u, - I" . I IuI I 1 f 14 ill ) It u l . ., ,-, I , 1i --1. I I i .
ati-l I t , 7 .-1., I,h, all-, t;I. Ur l . It ,: I I, . l I, II t ,- .I LI
I--. .. -- .. ..
-66-
or over-the-road coits,.pick up and delivery or car spotting costs,
terminal costs, and billing costs.
Line-haul costs are definid as the movement over theroad (or road bedi, either from one terminal to anotheror, in scme cases, fron a shipper's location to destination.Terminal costs are defin'ed as the handling and rewtorking offreight to maLch origins and destinatl.)ns of outgoing andIncoming freight. Pickup and de,'verv,, ccsts are defined
as the function of pickin& up and deli/ering freight withina specified terminal area. Billinp ... costs are thoserelated to paper work coLts for each shipment.
Each of the out-of-pocket costing categories is measuredin terms of its relevant service unit. A service unit isthe apprcpriate varial)lc assiSned to a specific costingcategory. This concept Is e.actly the same a-, that used ingeneral accuunting in cost allocatioi. The accountant alsomust find some method of allocating indirect costs such asront.
The service units for line-haul c).ta are vehicle hoursand vehicle mllefi, becauze bcme coats In the line-haulcategory vary with tfi" (oe., drivers' wages) and othersvary with diotancr (e.'., fuol)."
Line-haul cotts alo0 vAry with tho anount f product carried.
TWirs, an appropriaLt mnaaurc for line-hAul costw would bo the
5W4 of tho total Mi4eage coLt (dantan.,_) nd' total hourly costs
(wage-) 11vidod by thu tutal t utber of Cvt.-tlle_ ttnhportod
by the torrir II k gIven pyriud,
I1,
UYI1. 61 it of lltl lij l~t 1

-67-
would: simply multiply the line-haul costlCwt. -cile by the average
length of hat.!. For example, if the average line-haul cost/Cwt.-
m Iile was .35 cents/Cwt. mile and the avera~e length of haul was
300 miles; the average line-haul cost/Cwt. would be 105 cents. To -
convert the average line-haul cost/Cwt. to specific line-haul costs
between two points with a specific load factor, one would multiply
the average figure by the ratio of the actual length of haul/system
average length of haul and dIvid2 by the ratio of the actual load
factor/averaje load factor. For Instance, if the average line-
haul cost wall 105 cents/Cwt, bazed on an aveorage load factor of
300 CWt. And average lhiath of haul of 300 miles, the specific
lisie-hatil COAt for A rnc-,c,;acnt of 150 Ocut. .)vcr 900 miles w!ould be:
Aavaroaa ata dintinic actual. liad fatctor
cost a~~~ ~t~a aoqe~idf~~*actual lilsi-houl coot
( 105 900/300 1 50/300 )
F ~As OtI ivi iaul co~rtA, j'.ckuI A~id doliveryj ccomfi~
Ave dlLr';i':n L ii:U ~ u till, '.11,4 Pkiyu1u iuld
delJvLtY CUaL~b lj'/ LhU tAii (A, (ti4ndb.J ii II .t by>3tL'.
V'ol i u ral I J.1th UjjLLf Cull', i I AL I'll', tIurIr 0~ L~; F-. V j I;u dm
As L.a1 91 1 til ui I:I I lit Iu,' Utiii Ii t 11Cnj 11~ V )V"'tId Ii it. . I I i .~
#,H 111 l t ll l t h oil 1-, % .lj ... it , il, fil -I 11.1 1 1.I W 1 V. 1. L IP 1 -11 Illi r I I li

-68-
PUD cost/Cwt. for a movement with a specific load factor can be
obtained fron the system average figures by dividing by the ratio
of the specific load factor/system average load factor.
Terminal costs will be measured in the same manner as Pt'D
costs, i.e., on a per Cwt. basis. The discussion in the previous
paragraph of how to convert to specific average costs/Cwt. for
given load factors are applicable to this category of costs also,
Billing costs are the expenses associated with the paperwork
functLions per movement. The average billing cost/Cwt. is obtained
by dividing this somcvhat constant cost by the system average load
factor in Cwt. To convert thls average coat to a cost/Cwt, for
particular movements, one would divido by the ratio of the par-
ttculpr load factor/systen average load factor.
Thu above out-ot-pockut costing catagories are derived (ren
the recognix,:d I.C.C, standard Accouintig >,go:i for wiotor carrior.,
PaIl carriers have different costln& catogorlog ouch as iltching
and yard exim hne b4t iN ordhir t,-; have a tasi for coiiparfl.5ii the
ahoW CALuL'-i'ic will bo U§ed for both rnods1,
Aw alludiO to otd.ovoi th lfii 4 Il .!."o(k'. d fOl'
tIj- 1 l i d,-I i t I I h1 4 t 1 lit-.h V I t l , t 1-3 1I , 11 -
li"11i1 0 fit %ji-Y# Alid -1 !'l1 t~l l 1"11J 41 G3,il l la l l 6411 6'4 1..In i1: ( V 1.11i rutil <,h -,, h
firpi l IrA! , i : l i 1,1 , - I t i ., lt ! : l'l'lv 1,11 1 114 1 1--1 l.1. l , i -11

-69-
associated with yard operations such as car spotting, switching,
and classification of freight. Blllng costs are comparable as
they stand.
Once the out-of-pocket costs have been calculated, one must
allocate a portion of the total systems fLxed, and/or ccmmon costs
to a particular movement to determine tho fully distributed costs
for that movement. Fully distributed costs are found by adding
a percentage of each out-of-pocket cost category to cover co=..on
costs that do not vary with traffic. These would consist of
officer's salaries, depreciation, and the Mie. The Cost Finding
Section of tho Bureau of Accounts of the interstato Cormerce
Comni.lon hAv.w found commaon conts to be about 10% and 20% of
fully distributed costs fur rotor cartier, and railroads, respectively. 6
Thum, to fin4 th fully distrbutad cott fir a mov omnt for the notor
carritr and railroad, onl would tAke thu ovraV4a out-o -poikut co.ts
anJ dividn them by 90% ind 8U.: repactevol.,
Th@ fln-4J. adJu~ttvilt fur CoAL Ing 14 a prof It allovkumco, Int
thin atudly tho pr f IL al uwaocu wIll be .iadv thrugi tho upurat.11n
t o. 'romt, at iddrd ac uut lt g prutlu, thr opratitig ratio
S(14 1 tit-(l , ..l ....1 ..l..-.....! ' - ,, b.y1V- Ig W . .
; I. I A 4 I - I 1 I
h I f . 1-.

-70-
Average Industry Cost Data
As mentioned in the introduction to tils section, the research
will utilize approximate industry iata in the various costing
categories sc that the study may deal with carriers which reflect
the differences in operating characterlsti.:s between modes. Table
III presents the average cost structures for the rail and truck
8modes. The cost structure of the trucking mode Is an average
which includes both TL and LTL movements. The cost structure of
the rail mode is based on CL movements,
TABIE III
PFRCENTAGE B"REUAKDC U OF RAIL ANfD TRUCKCOST STRUC'UIU
Truck Rail
% varlable 90% 80%
Out-of-pocket co. ts
1,111e-h14ul MA:Pt 64% 67%
rUD (car spottL g) coAL 18% 107
Tortnhiai (6'aitching 6 ctie!lfi|cat|vi) cott 20%
hillilr. cooL %
rj L t ry fur them ui.-t;r t ,lv, lI tfir t11A)v d.,u':a u' ,btuIll d 1 j" t;iIV; !,. . * 'l I'll, I i l "
ia ~Lr * fu) I i : i tlIL' t II , Lti 2 i. ohil ,' ii I .il '
,l , i1 fi j i, f , i -MA
I - I -ltj I
1 I .i f ,
!
-71-
The study will segregate movements into two categories TL/CL
movements and LTL movements. This distinczion is necessary because
the cost characteristics of the TL/CL movements are different from
LTL movements.
Truck Cost Data
For TL movements, the cost structure for truckers given in
the preceding table is not appropriate. This Is due to the fact
that a substantia' portion of trucking business Is LTL and necessitates
larger expenditures on PUD and terminal costs than do TL moverents.
The average cost structure for truckload movements will be derived
in the following par-praphs.
The average revenue for truckers hauling general cor.odities
Is approxinately 7 cants/ton-mile; and the average lenglth of haul
9 iis about 300 tndles. !.ultiplyfiig the revanuo figure by the average
length haul yield. the average revunue per ton of $21.00 or $1.05/
CwL. Thoi nverage load factor of the truckor will. be takcn to
ba 200 Cwt./vohlclv novc .tit.
Am rxii|t,,od AhovU onu¢ co the parametvra thaL will be varied
J6 the1 11,,roi h!M I'dt b of tilu uIrriti l tO ,It Uhf 0l1 Wh1 t o rfOcth0( hn nit I trhc p ft tht I It' of th,' I rrit l - i , I ;. -,,wa io Aid ill
tlt! jq' (if *I tit I.,1, It.J l Iycf i I fL, t,.
l i. t .I i VI?
a I I t I
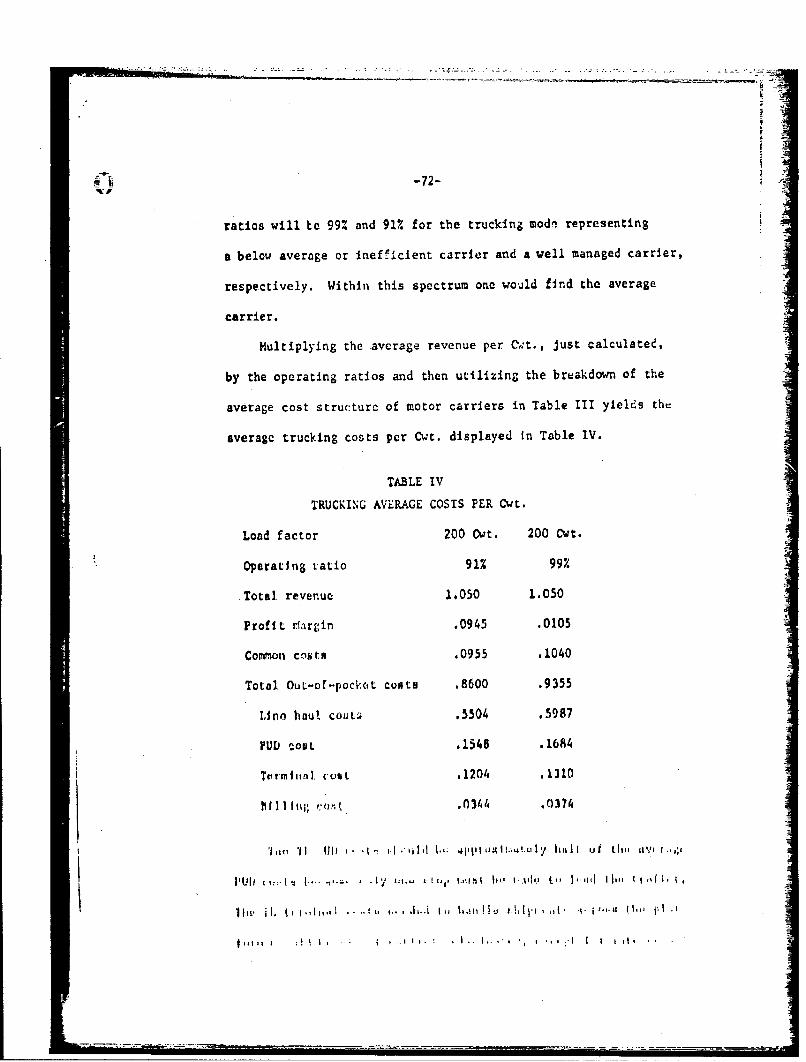
-72-
ratios will te 99% and 91% for the trucking modi~ representing
abelow average or Inefficient carrier and a well managed carrier,
respectively. Within this spectrum one would fInd the average
carrier.
Multiplying the average revenue per Cwt., just calculated,
by the operating ratios and then utilizing the breakdown of the
average cost structure of motor carriers in Table III yields the
average trucking costs per Cwt. displayed In Table IV.
TABLE IV
TRUCKING AVERA.GE COSTS PER Cwt.
Load factor 200 Cwt. 200 Cwt.
Operating ratio 91% 99%
Total revenue 1.050 1.050
Profit riargin .0945 .0105
comv'On C')Srta .0955 .1040
Total. OuL-of-pockot costs .8600 .9355
Unabot coats .5504 .5987
I'UD COOL .1548 .1684
Terrnflita. C-Out .1204 .1310
1111 hii; copt .0344 .0374
f it 'I 11-''l . i'- II~I ~1 Y u ii t th t df

--; :. E ... .- -: . . , ::_:.-. . .- .. :. . ... .. . .. . ._. -. J
-73-
when small shipments could be added to the TL at the terminal,
since the trailer could be moved direct from the customer's door
to destinaticn. Billing costs should drop also, perhaps as much 14as one-half, since there will usually be only one billing per
vehicle with TL moverzents. Deleting these costs fror out-of-
pocket costs and recomputing coizxon cost and profit margin by
dividing the out-of-pocket costs by the % variable then dividing
this figure by the operating ratio yields the TL average costs per
Cwt. displayed in Table V.
TABLE V
TL AVERAGE COSTS PER Cwt.
Operating ratio 91% 99%
Load factor 200 Cwt. 200 Cwt.
Total revenue .790 .790
ProfIt margln .071 .008
Common costs .072 ,0783
T utnl out-of-Vo'et co tfi .647 .704
Line-houl cot .551 .599
1'J1l) (.(j;I .077 ,08/
It ' :1I ), :n. t ,r)j9 I021
lit I / ,,,I21 1
i

-.74-
The percentage breakdown by costin~g category for TL move-
rents Is given in Table V1.
TAB LE VI
PERCENTAGE BREAKDOWlN OF TL COSTS4
% variable 10
Out-of-pocket costs -
Line-haul cost 86%
PUD cost 12%
Terminal cost A-A
B1lling cost 2%
Using the ovcrall average trucking costs per Cwt. and the
derived TL average costs pcr Cwt., one can determine the LTL
average costs per Cwt. in each costing category. This is so because
the overall average trucking costs per Cwt. are a weighted average
W 2(M Cost) w Average Cwt., where tile weitlits, W I and W 2 are tkle
percn~ge of Cwt, whiich are LTL and TL, r-!rpect1vel',.
The percentage of LTL traffic cartried by regulated &vrncr:.
cutwmiodfty cnrri.-jrs is apiproxhdnate1V '0'i# so tlic pereentage of 11,
10 LantI yoiir Cla)I I I n.otor c:ardir or. Ct mui.r.iI fri ~h
F. 3 1 l LIM ',~' If LI L. Il190 1'~ 0 1 . 1 U f I I'( IILII - 1 1. L'!- i
I lit___ --11-0 -, -1

-75-
traffic is approximately 50%. Using these weights and the data in
the other twc tables the LTL cost data was calculated and is
presented in Table VII.H4i -
TABLE VII
LTL AVERAGE COSTS PrR Cwt.
Load factor 200 Cwt. 200 Cwt. 2
Operating ratio 91% 99%
Total Revenue 1.310 1.310 :2
Profit margin .118 .013
Co=oon costs .119 .130
Total out-of-pocket costs 1.073 1.167
Ii Line-haul costs .551 .599
PUD costs .232 .252
Terminal costs .240 .262
Billing costs .050 .054
Rail Cost Data
The svora', revenue for rallroaJni In 1969 was approxiraoly
1.35 cents/toni-nile; and the avr,'a~ lonOih of haul was about
600 rilefl. The ,vurn,' rev.:uo N!;ure wi ll bo a-.U itrd up;'ard
to 4 evn I/(', I ~-HI v I)ctitiv Ci fon..u'r fi .,uto Q Iic Iu,, a lnrqc3
tiiiich'i elf 11111. ci t . fi IU1- I %iI iI 10 C jIlc c ,It I :It W itil I rioL
I l t. . i ' ' . ."iI ,, ' , , , ' .

-76-
co=odities sibject to competition for movements by rail and
truck would havo higher costs of handling and demand greater rates.
Multiplying tae ave.'lze length of haul and the average revenue
figure yields the average revenue figure of 120 cents/Cwt. Using
an average load factor of 600 Cwt. and the average cost structure
of railroads presented above, the cost data in the following
table were calculated. The operating ratios for the rail mode
will be 85% aid 65% representing an inefficiently and efficiently
managed carrier.
TABLE VIII
RAIL AVERAGE COSTS PER &dt.
Load factor 600 Cwt. 600 Cwt.
Opezating ratio 65% 85%
Total revenue 1.20 1.20
Profit: margin .42 .18
Co~mon costs .156 .234
Total out-Of-poCkot costs .624 .816
LIne-haul costs .418 .547
PUV coar': .062 .082
Terminal costv .125 .163
b l lg "oa~s t4nA19 .024

(..) -77-
Piggyback Cost Data
Once the average cost categories ha%? been developed for
the single modal carriers, these costs cn . uied in computing
the cost of piggyback transportation. A piggyback movement ntaals
using a highway tractor and trailer for pi kup and delivery opeiations
and transferring the trailer to a railroad flatcar for line-aaul
transportation between two points. Hence, piggyback covements are
coordinated rail-truck operations and as such, the cost of these
movements e.mbody selected cost charecceristics from each mode.
[A] ...simplification of the transportation process inpiggyback Is the by-passing of railway yard classificationat the origin and destinaticn. Piggyhack operations needas an initial classification yard no',ing mre than a trailerramp site with a parking Jt. Classification of cars bydestination usually can be ac!omplished in the process ofloading tlh trailer onto flatc.rs at -'he origin. Alrjclassificatio-n yards enroute can be by-passed to a largeextent. Switching enroute under most circu.stances nightbe done by diesel road-switcher locomotives simply droppingcars at t:all." ramps located outside major cities.
..................... . . . . . .
Like trucking costs, pigyback costs usefully aredivided into terminal and line-haul e:;Fenses. Terminalexpenses, in turn, can be scparitctd Into those con-ventionally asEociated ViLhi truck tra:sportaticn and thepeculiarly p gg;back c,sts of loading and unlcading thehighway tiallcr onto nd offi the rall':ay flatcar and thecost of rjaLkl up Li.,! p0 jgjy)ac: traln.
ligSybac" pcl.up and dltlvvur' coiLRt are cusrntiallytile Fnam . '1; tlc' , .coclc(,1 nIg tvL'- tia.rotd truckop( r tl-:'s. 1 2
I,.)i hp,L c:].,y, I I -I 11tu l r. 0:., 1 or 1 g1 ;.'rtl;" m ov.?-
m.nts wIil bu thuruo (i Lh rallto,id adJu twk for ditf a.'viiua Ill
' aq I l 1 I i i. "1 " ill

-78-
load factors. The piggyback PUD costs will be those associated
with two highway trailers plus a cost of S4-or $2 for =oving
each flatcar into loading andunloadin; position and building and
breaking the train,, for the railroads with operiting ratios of
85% and 65%, respectively. The piggyback ter=mnal costs vill be
those of the highway mode plus a $9 or $5 charge per trailer for
loading and unloading the trailers on and off a flatcar for -he
inefficient and efficient -ailroad respectively. 13 The piggyback
billing cost3 will be the sum of the costs for r'-o trailers and the
average rail billing cost.
The piggyback common costs will be obtained by dividing the
ral. and tru:k cost contrIbutions for this type of =ove.ent by
the corresponding percent variable--Q% and 90s, respectively.
The piggyback profit contribution will be determined by dividing
the full costs contributed by each mode by the appropriate operating
ratios. For instance, If the out-of-pocket trucking costs were
$27 and the o-it-of-pocket rail costs were $32, the out-of-pocket
plus comnon costs for thil movement would be $27/.9 + $32/.8
$30 + $40 = $70. The full cost of this covo would be
13tr. G. W. Tolfer, kan.,cr of TOC, Burllntcn :orth.rnRailroad lr,'icaLed that the pro:.:.c.tw c0 t of a n" a'dunlocAllng t,-i r olio lI ...... - ; "I . /tri ..r. LA Ler
also Sta;ted L;': th'e SWI cc, s;s. for '7 n l J at ars I:s-ol o a d I i i i n a d u --. c ' ' ' 1- , :: a s 7,1. . . -" : " ') r C n : C .
and Lhat a s'iLch!r o' v avcrae ccui h.und1e 2 ctrs/huur,Thu.i the sal I i~i'* and lo.iin,; cost:, u-e. in t.; stud>' are i, t.e
ranj,'V that I5 rL;rc-:::..,: v . : f thy r ! al'...rid,
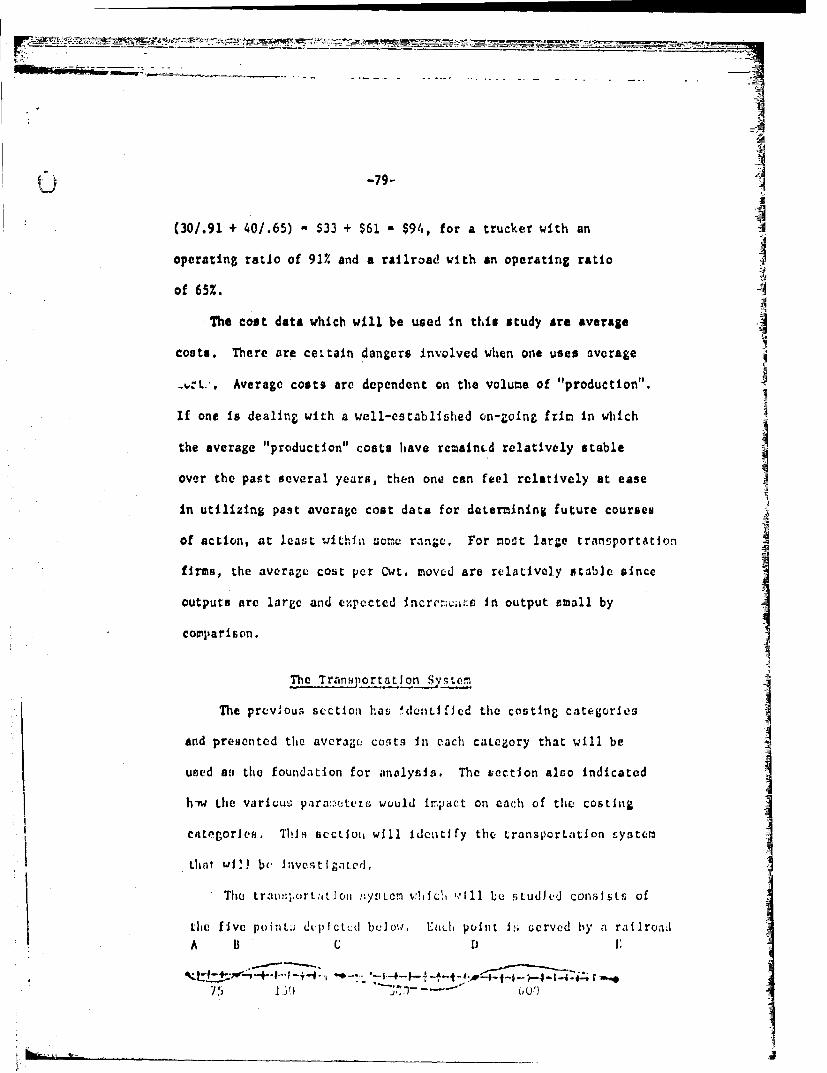
-79-
(30/.91 + 40/.65) $33 + $61 - $94, for a trucker with an,-
operating ratio of 91% and a railroad with an operating ratio
of 65Z.
The cost data which will be used in this study are average
costs, There are ceitain dangers involved when one uses average
.:L.. Average costs are dependent on the volume of "production".
If one is dealing with a well-eos tablshed on-Zoing £rti in which
the average "production" costs have rcmaincd relatively stable
over the past several years, then one can feel relatively at easeI
In utilizing past average cost data for determining future courses
of action, at lcast within so-e rangc. For mo-t large transportation
firms, the average cost per Cwt. moved are relatLively stable since
outputs are large and e:pected incr v.: ;r In output small by
comparison.
The TranH)ortatlon Syqtc.m,
The prev'ous secton has f the costing categories
and presented the average costs In each caLegory that will be
used a.; the foundation for analysis. The t'ection also indicated Ihiw the various para:uLvr wuuld impact on each of the costing
categori es . TVIJ Rectcioi will IdCitify the transportation systen
t1,1 l te '- be investigat.ed,
The tranniorL ',t :ti y!,cm v.iti cl ..'lll be .tudJL,,' conslsts of
the five poinU dL.p; Ict.:d bv]ow, Eiih1 point Is oerved by a railroadA B C DI;
75 13!) "- J . - -" Our)

-80-
and a motor carrier and a tr'ansportation company composed of the
two carriers. Point B is located 75 miles fro-. A, C is 150 miles
from B, D is 300 miles from C, and E is 600 miles from D.
The average costs presented in the previous section will
provide the basis for dc'.ermnng ,:hat the average costs are between
each origin and destination above. In other words, one would multiply
the average line-hnul costs by the ratio o.4 the actual distance/
system averate length of haul for the todes, then readjusE cornon
cot s and the profit allowance. For Inst nce, If the average line-
haul cost was 105 ccnts/C4t. based on an average load factor of
300 Cvt. and average length of haul of 300 t, lce, the specific
line-haul cost for a movement of 300 Cwt. for 900 miles would
be (105 .00) 315 cen.s/Cwt. This line--haul cost would be added300
to the other out-of-pocket costs, PUD, tor.itnal, and billing.
The out-of-pocket costs would be divided by the % var.able for the
partIculnr mode to obtain the co.Mon plus Out-of-pocket costs.
This figure would be dlv~dLd by the opertlng ratlo of the modt
to deterinine th0 fulll co'nL of thc LMVe:.MicL.
Cotsidoring MovMOnts both to and fro'i specific points in
the above tr.i:iqporLatio n syst m, ticir ere 20 dlff,-rent route
fegmtits, ' nhrv run;*.ruvc:;ncnLs, fro:n left to rlght, A to B
(detilgiviod A3). , AD, A, I:C, BD, l;, L:), C, and D.. Thle
corruspnidlin,; :;!ovc:; In th- uLhvr dl rt tion are ED, IC, l, I..A,
DC, DB, I)A, CB, CA, ani ,. v.::;Cntn in both 21 rutlnli rI hotld
bM S cON;l rL d .:. :,: in ,. l. :MeL r,:.-.-rt..' ,y,;t :
--------------

[: -81-
not have balanced traffic patterns or even the sie geographical
conditions in both directions which cause the costs of movement to
differ vith the direction of movemnt. This thesis will, hcweve:,
limit the route segments considered to those unidirectional move-
ments from left to riGht.
This simplification described in the previous paragraph will
reduce the computationnIl requirements by cr.oe half and will not
affect the integrity of the results. The reason why attention
need be focused only upon unidirecticnal movemonts In this th.siq
is that each factor which would n.akc the dirr-ctional moveents
have differing conts will be ox.m,-nud for effects at both levels
(in dIfferent runs) during thL SinUrlLicn. So in actuality, both
directional movements are being consldcred in different runs, even
though the lettcring of the rmove-ments is unidirectional.
i

A
-82-
41
CHAPTER IV
£XPERIU.N'AL DESIGN
This chapter will focus attention on the nature of the
experimentanl decuCn as well as the analytical and statistical
methodology used in the dissartation. Your opecific arcas of the
experimental design aspects of the disnecrtalon will be discussed.
First the problem of realis in suimulation will be addressed.
Second, attention will focus nt the nature of the output of the
aiMulu.lon. Next, tho perforrnn.ce ticaourea used to describe the
output of the simulation will be prosnted. Finally, the specific
experinc'ntal deigr which wat utilizcd will be discuQuod. -a
The Problem of Rciallsm In Simulation
One of the taout imporLantt prublu js ont. faces when uti11zI1n&
simulntion to inveutigate a now or proposed system is that of
insuring thit thu model is an accuritto repreo|nnLatlon of thu
syste being annalyzed. Chervany haq succinctly suirainrized Lho
problemn of using finul.ation todis to atai.yzo real world probleAn-
at follc:j
II llthe' d,_'Ivt, op.'1 ,.0'jjinI d a ly.i l of t," ' r:rdi.] Ithe, riojit vr i;I:;t .:t : I. L ,I.!.I coiic4,n rl it, rall :.:i of LCm"lel - 9'8 r lgap 'p -t'... A hvi .,:at .. , tud.l ILl LH A
pcrfecL oI u t.'.tty fur ''Ic Iitrv:.I', v., Ai .-. . hbvVnrilmI'i f.Ct(irn u:;dL'r c , , :.' , vri.d i;. ' (or ui.cv
0141 onc) (I. a t.117.0 '~ W!, lit - 1 W-LI :10 1LI l4 i v.,c"cowjt itl, . Thl ij ::l t ic~i •COI~j imt , 111:3 I~::~ yIL . : yi.,h Lifly, hu'-.'. ,r , I in I-.
A hi.vkd r ,i 0 L(,:L, i ' .,' t.'.LOA . I I.II..,p r :. t .:1 p r, , .':I of I.,ull t .l it ; h it l , : .
r--, I ' ttI . ,, I 1,,I : ., i I, . i'',ILn r'
____ ____ ___

* -83-
reollsm arises In all model-building attempts, it ICCei! tobe even more troub4eao:i'3 thtan iinual in siv~uliition studies.
Although this realim problum assurios many forms, Itseems that there iare two basic h~crarcial levels that gcnerallyappear. Vie first level concerns the structural form--rmodulsubsystemui and oubayctem' interrelatlonvihlps--of the modelbeing simulaited. The second level forumas upon the determl-nation (;f the spucif ic datnt I npotA that, are requl red LO mzkethe miodel Analytically operationa~l. 1
StLCurAl Realinn
The problem of structural reallt: focum on theseleiction of clomcntri to be Includnd In tho vtadel ind thomanner In which they aire connected. The following qunoutonetae typical of thorle Lil-1 MUSt 1)0 anWWrCd At thill lt!v0l: DOthec variablin inClut!d 11. Lite mudel ai':curaiti'y rid luct OldaImportant connstruct.- iound In ~vlt7Aro the vatrInblooomitted frou tho modul Aufficiliily ui~irpornitt that falluroto conni1dvr then will not bins the. ctmiclu14lon erawn irti n Elaysipof the ffodql?
Sinco thil firm (a) boini, modeled fin this project..,Larelhypothetical, thLe -AHly to teat thia modul for Structuralreallt J isomewhat lini toil .
oleo. C. P. *bonii hi mtj 1'Jg" Lvd ain ap-pronich to vAlidatlonIn skru) ntion of hyjpoi.lcti cal oz L~ini zaitt., , Concorohl his~model of dcl cion mtid Iift 1maii.Ion 11y!!1Wns wi111 Ahi u a Yput 01CIalfirm, he atatum:
The firstL quitsLon to bti aloked :ihout, ourmodel would prtipcrly bV, "L~j;ri the irode] cor-rcr-poiid to tho en1i wurld?'' In uthev wurd:110"DJo thv ilfur'.f I I~ i it: o'd J I oi lo yiltteVh;11 roIit il nhlIy* i!jJrCtI(At r IM wol.1 U i I i i CCjiII?"
WC Woulid nr) I v xp',. wI 't e*I, I t't iiod(
all 1'oil I. Oi .j ('~ t: *0i'vC
We do tl .', i'.V t h i t Li hu lii.''v
Jr. if t1I'i1pioil I A i~u iL J til of r- c i

behavior. We cannot, of course, completelyvalidato this beliof, but 'what wo can and willdo ii. to set forth the major Ingr:dcnts ofour decision rules for separate exanIKlation.We will attmpt to Justify thane rules by
relating them to existing theory In thescientific litersare,of economics, accounting, orthe behavioral sciences, or to the lit, ratureonl bu ;Itieas Vriict,'e, 2
The structural forn Of thiq model was devluped along the
lineu suggcsted by Biunifl. It shuud be strOesed at this point,
hwever, that the model is a simplificatioti of the real world. Tha
hypothetical flrf,,o modeled In Chapter It are auuined to ract txi all
5a tuAtlons to mnaxiti ize their profit CotLrlhutLoln. The model has
not considored anly tocial welfare rola that miaiy modern buoiness
concerns hav' odopted. To the. extont. that transportation firns do
not attempt to max1Lmize prc.'It. whother duo to the fact that they
are limited goal aatnfiv,' jr due to the faCt that they hava some
social wlfaru role to ul ill., tho rvoulLt of thit project are
limittd to Ljit degrv,.
Furtiertore, an mcntioned in the previous; chaptcr, the Maiilna-
ment: and oporationla p rsniinl an w:lt an the org'ni nt1A~iJ atructure
of these firi i are conaidard to b( capablu of roachtii thutir goal
of profit xiaexmlation itt, Joct to the uncertairitien of predicLing
the muarknt u:r, tnlu1c.ibl, The dJ vI!irLdxL vn ha i 1no fltiL
addr.'oi, d O t ] l '(J i li !:,.i of how10 .t. i-duj.l IN op"r;I J fll!" I:.i'';L ih!
. hid. , p 1 ) /,,.,7, 'Iu,) L 1 e.i, (;h r I'i 11 W MI ti , :. foitlI
11.,1 1 , JiL'*, ! 'Ji' 9t * ,' "

-Sz
-85-
accomplished to have the equipment needed at the right place at the
right time in order to maximize profits. !'hile these are definite
limItations of the analysis, all firms considered have the benefit
of these slmplifications. Thus the end result In that they will
hopefully cmncel each other out in the study.
What happcns when the results arc attempted to be applied in
the real world? To the extent that irporflect scheduling cporations,
Ft and 4iffora,t levels or quality of ptrsoitnel are found in the real
world, the object of profit ma'imization will suffer. The author
u would argue, however, th.a, Cven ith these quallfctationf the rkulsa
of the study should atill be a valid indicator of which combinnations
of facLoru or fli'w pruc. sauin ipocifIc level; of factori thould
lead to iIgnificait economle as a reoult of foriwtng Lranspor-
tation eompanies from two ulntlo modal carrlorr,. At least the
factors which aro found to be sajnffi c lnt in the atialy.1ss of th,1
results of this simulatlon should prc,:ide a bsIs for predictin
which cotnhlnotlons of factors should lend to signiflcaitn econo.-leq,
There is oien other nrea Wn whic c thu inodul differs from the
real world, Thii modu whilch hav bot-i devalopcid considori a
trcn portt lI, systeIn oe'Cr h I ci or, r;1k ,, o n Y o r a AIIron A Ic) p. f- '.
and erti, r tic'I rrv cu::p.i:ry :iiid ), :1'' Al tho pu. Ow ri'tItlg reaults of
thi n w.yn r i'Lbh the v t'cralt hfli w..t.1 ihlt Ar , .. ' obtalwL.d wArell
ii tr:lflm 1O t1*ntJui Coi p: , opi'r t , vc / T l! U l :,1 flyf '. 1, 1r S iiOL
Ilikely in Lh, rt-l wej Id LthtL n tr,, porr:'rtf.'ri, 1;v,'terl, or a cu. -
i t , It/I i ) p r t I -:I of n r, I , t i. 1, . ' . , :1, o . .' It I t. ,d

-86- 1
and one trucking company. It is far more likely that on a given
system, or segment of a system, that there will be more than one
firm in each mode competing for the available traffic. Thur. the
element of intramodal competition has not been considered in the
model.
What effuct will this simplification have on the interpretation
of the results of tne analysis? In essence, this simplification
of the real world aseumes that Ce individual railroad a:d trucking
company can maintain a relatively fixed portion of the trunspor-
tation market, when confronted with compctition from other rail-
roads and trucking firms. This ancumption may be reasonable if
the two comptiniev are wall stablinthod fivi s e i plificaLtcn
also assumes, however, thtat the trunfportation company, formed
from these two firms, faces the same relative denand patteni an
the two firms when they were operating sliuly. This may be a
tenuous s:;umption. There is, however, no mort-ts of tWsLInU its
validity short of actually for mt| the Lransportation company In the
real world, The reader IN left to his own co:icluAion on the validity
of this assuniplion. Th. effect of the non-validity of this
sbaumptluII wtul]d b to Inicaro. (or do.ro:a-e) the ec.no::.c I rpact
trniinporLati on coEipat:ic would hav dup,;,d ni ui,0i o it ' LI l- the
forma i O;i of Lithe c:qpIL:y Incret ncd (or dncrce;.;d) the r,:tr'.et Ah:,re'M
Of the crU:;,b li 1 firvm,.
;=I-
-87-
Data Realism
The specification of values for he various parametriccharacteristics, the second hierarchial level of realism, isalso a more difficult problem in simulatiors of hypotheticalcompanies. ... The currently suggested techniques for gener-sting input data are bared upon the assu.'ption that thevalues can be determincl from the analysis of real-worlddata.3
This has been the approach u.cd in thir study. Care was taken to
use approximate industry average date for the costing of move.n.-.,
As pointed out by Chervany, howisver, another criterion that should
be used tor data generation is that the numerical values use-d be
JnterilqnlSy consistent. "This means that the absolute level of the
nuaerIcal data, whiile Important, is not as important; as the inter-
relationships atrong the covponeuts of thIs numnrial data sot".
Thus care was takeii in this study to use data which was internally
consistent, that it the relatlonshipa of rail operating ratios,
load factors, and so forth, to truck operating ratios, load factors,
and so forth, are in the relative proportirIs that they would be
found in the real world,
The OutpIut of t'o .IMUlnttoR
The simulation noodal being n tudled -wno coutructed to doter.iine
the result.mt econoni C IMpact a tran.portaLion counp,,ny would havo
and if this .'1p7CL Would be au1,qtai 'Ja!ly Iffcrk.:1t than th M :o
iiiny, ,s n d, ] co:'j:'II : of -. ! ' ci IL 1:. c '..i' d, I ich run of th
I1bid., p. 14,).Ed .°J

-88-
simulation generates a number of statistics for each carrier--
the transportation company, the railroad, and the trucker--that
are a function of how each carrier prices his services and allocates
his equipment. Each run Indicates, for instance, the rate at which
each carrier decides to price his services consistent with the
rate makhiig schc.e outlined in Chapter for each route segment
a well as the specific capacity allocations each carrier makes
on each route segment. Although such detailed information may be
neccasary to explain why a certain factor has a significant bearing
on the results, it is much too detailed for any type of logical
prenentation. A numbcr of su .nary statistics have therefore been
developed to aid ii the presentation of tha results of the study.
The remaindar of this section shall present these surnary statistics
or performance measures.
There are probably an Infinite number of perfor-ance measurf.F
one could devs-1 o oeaoure such a nebulous a thing as the c,'! -.-
Iuiprct or cc,:nc ic co:.-equencc of operating a transportat1e,,, .-
under two diff.rnL organizaLioaal approaches. There are t.... .-.
dimensions t.o the probl.e, of measuring the economic iract........-
tation .c:ipaxy tr ie sInglu t:odal carriers create. Oe', sl-
azte'pt to n::.d rn.ca.urep which Indicatc hw the Opcrot i,:.V; o"
,-.i-palen iffct t1.cmj,.Lv, o iSt %%n!.. as ,.:c . .1, t !'. ,.. .(c2
their u.,crr . Vit this i t, nu the Ililo 'nd M1:- !. O:W , .. ,:..
mea sute i'll ,e tj'ta't tr a y . th e 7C!U !e t' uf tiI l v,, .. .. :l
ru't; ; (' r!.. ,,ad c 0',t L, b tL J:!; '. : " f c ' ori ", t . ,. .-.,; :
th: ".arr!. r+,. .,,t Lhe tot . pu 1J : paid !or L',.. tr , :.ij-r':.' '.: : .. -.....

-89-
Tha nature of the simulation provides a unique opportunity
to determine the effect the creation of a transportation company Iwould have on the manner in which movements would take place vis-
A-vis single modal carriers. Therefore three statistics have beenA
compiled to indicate whcther o. :CL a transportation company would
make movements which were significantly different than the manner
in which single modal zo-pa-.Jies ,cace movements in concert. These
three statistics are the number of Cwts. moved by truck, amount
o1 Cwts. oved by pfg',sck, and the ;iount of C..4ts. moved by rail
.joxcar. Thc..e ptre:.-t . ,ill b2 kept for the tra..srcz-
tatlon con:panv, '_.e rJT! oa .:z' 0-? trucking cowpry.
.a Ccntrib, ". ,
There i:. an additional elerent of cometltlon present when
t. o single modal companies atternpt to obtain a portion of the com-
petitIve traffic which a transportation company eliminates. The
sinle modal companies must not only cope uith the problem of
estimating the size of the market subject to competition but must
also estimate what prcportion of this market they car. obtain.
'nr. - LSstjmLates of the proportion of the market they can obtain
for h -articular segnent is directly related to the amount of
c.:pacl v the, will allocate to that rer.. This is so, because
-is will allocate their equipment Lc maXImize their
expet,: d contribution to fi/ed and/or common costs and profit
warg !ns. 71hus th2 sikqjlc 2:.Yal carricrs h.ive an additional t
:" u: .. L: niy to r,..j.- with th t tIrar,. po t. iun co-,1.p:i:'y Ic...: nut.
u: ui

77-
-90-
A transportation company must only estimate the size of the market,
then attemprt to allocate to that market tl.e most ?rofitable oethod
of movement. It therefore appears that the expected contribution
of the carriers shoul4 be examined for effects of the factors since
this has a direct bearing on the allocatiortL of equipnent and
correspondingly on the actual contribution of the carriers.
Actual Contribution
Actual contribution or total contribution of the carriers is
probably the most important perfoinance measure which reflects the
internal valu c the organizational form. This measure is of
extreme inpor c if one is trying to examiine the merit of
establishing transportation companies. Thus the effects the
factors have on actual contribution is at the heart of the study.
The actual contribution the s Ingle modal carriers enjoy Is affected
not only by shippers' logistics constraints, as is the transportation
company contribution, but; in addition is affected by the shippers'
modal selection policy. Since the competitive market could be
allocated equipment from both single modal companies, the sh1ppers'
must choose the modes to use which of cource affects carrier contri-
butions.
Price Pnid for S'....-rices bIy_ Users
The price paid for trinsportatio nervice 3 by users should
indicat' to 5s.c u:,I ::t, th. c ,omic coL oi the traz.1pertatfon
oc. ; t. c rrlyi r:-r o'ic r c. "J o : ippr; r ,.

-91-
This performance measure is probably the most important external
indicator of tie economic value a transportation company would have
for Its users. Thus the study hopes to Indicate which combination
of factors, if any, would significantly affect the price paid for
transportation services under each of the organizational patterns.
The total price paid for transportation services is a function
of the demand for transportation services and the rate charged
by carriers. More specifically, the total price paid for transpor-tation by shippers - r X r
ijkXJjk ijk'
where,
X - the amount of Cwt. moved by mode I between j and k
r -k = the rate/Cwt, for mode i between j and k.
It is Impor'tant to stress the relatlonship of the price paid
to both the amount of Cwt. moved and the rate/Cwt. In other words,
the total price paid may increase if one organizational form satisfies
more demand than the other. An increase in tot&. price paid could
also occur If the rate (price./unit) increases. Conversely, a
decrease in total price paid by one organlzatanial form, can
occur if less demand is satisfied or ii the rate (price/unit)
decreases more thin the other organizaLIonal approach. Thus one
cannot tell by inspectIAon whether an Icrcase in price paid resulted
from an increase on the rate or because ure dciand was satisfied
eiLhur by the transpor'iLon cQQipany or .,! singlc modal cc::panies,
The conversc !s true for a dccrcce i:, total price paid. tecaus-:
of this rc lati,: hip i;c.-.1 care t:j 11 be L kcn i r the di,; u;
-92- '
of the results to indic~te which of the two variables created
the Increase' (decredso) in the price paid ;erformance measue. -
Amount df Trucking Movenents
One of the arguments put forth against forming transportation
companies is that a transportation company would be dominated by
the rail mode with a tendency therefore to drive independent
truckers out of business. This study offers the opportunity to
observe how a transportation company would allocate movements to
its composite modes. The criterion for modal selection within
the company when not constrained by shippers' logistics systems
is profit (contributi6n) maximization. It will, therefore, be
very Interesting to determine if a transportation company moves
a significantly different amount of goods by truck than the
aingle modal trucker,
Amount o Pi $-hac: 'ovements1
This statistic is being tested for significance for the
same reason ad the las.t measure. In particular, It Is directed
at determining if the or;anizational approach has a significant
effect on the amount of goods moved by piggyback. It should also
be pointed out that this analysis carried to its logical con-
clusion should provide the ans,'ers to what Is the optimal equip-
ment mix for a trcispo-LUttun co;' pjny as %,ell as for single
modal carriers.
I:

, ,I-93-
Amount of Rail Boxcar Movements
The statistic is being tested for signi icance for the same
reasons as the last two measures. -
. An alytical and Statistical Methodology
In the preceding sections of this chapter, the problems of
utilizing a simulation experiment were discussed and the performance
measures to be used were presented. Chaptcr III discussed the
test factors which are to be analyzed in the study. This section will
Introduce the analytical procedure and the statistical tests which
will be employed to ascertain the effects the various test factors
have on the selected performance measures.
Hypotheses to be Evaluated
This section will present the hypotheses that will be exa.:ined
in this study, but before doing so a rec3pitulation of the experi-
mental design developed thus far will be given. The economic
performance of each single modal company r:'d the transportation
company will be described by six statistict--expected contribution,
actual contribution, price paid by users, tind the amount of Cwts.
moved by truck, pigyback, and by rail. The principle focus of
the rescarch will be placed on how the two orgainzatfcnal approaches
differ with respect to the performance noasures. That Is, the
analysi.,; of the ouLput Uf the simulatilon will be will be conce.::%O
with the diffcrc;.c. bct,,Con the transportaL lon company pcrfor:.-nce
rea,;urc! Stid th2, Su:LI of ti l)crforl.:anc, r. eisures of tLh sing,.Ie
I' ... -"- I[" is - r¢ i " ri , - ' i . .. ' - • . 7 ' i i ' - . . .... . .
S. .-:a

-94-
modal carrie:a. For each simulation run which inrorpo-
rates u difflrent combination of the inter.ial and external
route factors, these descriptive statistic3 will be calcu-
lated. The hypotheses which will be tested are concerned
with: (1) the, mean differences between the performance
measures of the tranhport~tlon company and the single
modal carriers, and (2) the effects the c€zabinattons
of the teat factors have on the economic performance
of the carriers.
The analysis of the test factors is concerned
with whether the test factors "cause" significant changces
in the values of the perforuaance meu-,urvu irom their
average value. It is also of interest to deter.ine
if the mean differences between the organizational
approaches are statistically significant. In other
words, one in interested in determining if the per-
formance measures of the transportation conpany are
signifi.:antly different, on the average, from the s=
of the measures of the single modal carricrs. The null
hypothcses are for each pt'friance - aIr Lhat the
mean of the tranup;ortation company and thC Mean OF the
sum of the single modal carrier pcrfor.i::ic-.. z,-,a:aurva
are the same. The altt.riam.Ive hypoticsF' .irv thaL the
mean:; are dlffernt. The nLurc uf the output, bolIn

that the rand"a componentr and parametric values were constant A
across the o-ganizational alternatives, inlicated that a t test
involving paired differences was appropriate.
Since the analysis of the result Is l rgely con,-rned with
the effects brought about by char-es in the levels of the test
factors, a much more detailed description of the statistical
procedure utilized for this purpose will be presented below,
The analysis will be mainly concerned with: (1) determining
if a change in the level of any single test factor has a signifi-
cant overall effect on the perforuance measures over all combi-
nations of the other test factors; (2) determining if any combi-
nations of any two tezt factors has a significant effect on the
performance measures. 6 The first type of affect Is called a main
effect, while the second is referred to as a firut-ordcr Inter-7
action effect.
They hypotheser which will be tested are concerned with the
nature of a11 of the a.-ifn effects and first-order InteractionI T h pedx1 a cuso nteapr ~acc~o
The nature of the t te.qt which was u.ed Is described in detal1itk Appendix 1. For a diccussion on the a'ppropriateness- of this par-
ticular tnot, the reader is referred Lo Gu-_.nlher, o,.,, p. 24.
61'he word coc..bltaLion ag u;td . bove, refers Lo the :umber of cxpcr-
mental co:nditi.ons or ni.is-..c nu:7,cr of arran:.:ientj of the leveir of Ith- tClit fattors that are possItI.e In Lhi th j.j,-ri twtta1 vULLi11G.
7Thr,er are also r; ccnJ-o-Jar, Lt!krd-.orJL'r, fourth-order, andfif I~-rdu Itt' rt: .: * ffcc~.*icI ar wLi LLie teoi t factr,
which will 1: 't I( . L!;- I .i' i'. , : c * natLIr(, O LheIspec fi1c c..:p r ,., ' . ;i ;'$ ut ., Ic t']il; ': dc . : not pro.'d!.for Lhu:1,.;A:, of v c L . "iik f-,tu:' av~d r,oic :; fur t.
&LeleCCU.,fl 'I Lhe e..ic :...::il d,:.;,;., u -.1 in "ii:; prujc" ci " be
Si ]L .
effects associated with six of the seven test factors selected
for analysis, The test factor which will tiot be tested for effects
is the size of shipments factor. Instead of testing thin factor
for effects, the entire expe-iment will be repeated for this
factor at each of Its two levels. This Is because, as explained
earlier, , the costs of moving CL/IT shipments differ from those
Involving LiT movements. Also the choice of how the movements
are to take place differ for the two sizes of shipments. In the
IT/CL shIiptucits, movements may take place by truck, both of the
piggyback miethods, or by rail, wheread LTL shlpments may take place
only by truck or by both piggyb~ack methods. In capsule form, the
test factors which will be analyzed at each level of the size of
ahipments factor are (cc& Table 1, Chapter III):
1. !tigtjivatrcun loiw truk0c rating rittion-An Analysis of
the effects of a 99% operating ratio vie-1-vis a 91%
operating ratio.
2. 111eh vervus L_j:Lrail pcra n ~aor--An analysis of
the effecte of an 85% opur~ting rntio V1S-A-V ' A 65%
operating ratio. -3. 1^ow versus hl.), truck lr~ad factor-An analysis of the
effects of mi nvc'raju truck load factor of 100 0C4t.I
vis-6-vi s an avkrage truck load factor of 300 Cati.A
4. Low versus hi ;i roi l.oaid faictor-An analysis. of the
~~1 ef (Uct; of an nvver-igr r.-i I load fnectur of 4e00 CwL.
vi --- vJq -:~:i .veur;u; r-. I Jc'd f.: tar of P3OO (

-97-
5, Hih versusw _sUstom capAt--An analysis of theF4
effects of excess system capacity Via-h-vis adequate
system capacity to met system w'ie demand.
6. HLh versus low lpvo of shin' loc.t!.s constraints--
An analy~tsaof the effects of a s)ste constrained to
a let$e e::int by shippers' loilstics systems demands
via-h-vis a system constratised very little by shippers'
logistlcs systems.
The null hypotheses which will be tested are that none of the
main effects or Interaction effects differ from vero, That IF, the
null hypotheses state that none of the tact factors (or combinations
of test factors being considered) produce significant differences
between the parformancc moeaures of the trr.tsportatioka company
And the single modal carriers, R(ejection of any of these null
hypotheses Indgcate that the specific te t factor (or €ombitation
of test factors) Lin. hAve important Cause ittd effect relationships
which affect the econoxic performance of tLe transportation corpany
vie-Ai-vis the mingle modal carro.ta Conw, tsely, non-|'oJection of -
any of the null hypotherea implies that thV Specl c tCet filc.Lor
(or combination of test factors) 'njy .to. hv:ve Important caus'u nnd
effect telaiionAilfia which affect the ecow:omIc perfor-:zttce of the
trannportatlicn corpany as compared to the :iitjlc tod~al carrlci~t.
In the precedin6 %Ltvm'-n L thu ord T r.iv has beou strer;ed.
[ ThIn Js because It. mlut i be (r,,hnslI d Lh13t Lh(, u tF.1Ls Which arc
obtalor-d prt.ll~ to Ow. t-OIill. of OW;~~t~r ;u 1A" .C,.
[.
That is, the results are obtalfod from the .aipulatfon of a
mathematical model which was formulated to resemble the real world
phenomenon. Before the results may be scatcd as truths research
and analysis In the real world is required. The results may stand,
however, as working hypotheses until vorifi.d or disproven by real
world research.
frsctional Factorial Iworimets
In light of the preceding dlc,;usuion, the experimental design
chosen for this projuct muot allow for the analysis of the main
effacto and first-order interuction ffecti. Factorial experi-
ments allow for such analyala. 8 "A foctorAal e,pcrIm=nt It one
in which all levels of a given factor are co'ibined with all levels
of evary other factor In the. experiment." 9
In thts project six toot factorp (oacli with tuo levels) have
been selected for analysis for cach lovel of the size ofr ohipent
10 6parameter. This may bo describud au tvo 2 factorial exporl-
mentm, ona for each Mihiumc:it Lil a. lluior -ino for ono corn-
plato replication of the experinc:It there are 128 possIble combi-
nations of factore fur each of Lhu tLhrcu ..irricrs that muill be
For an eXcIl]i:nit dli cuaslon u n tho a ivwutu(!. cn"d usefulnu.::i
of the facto'lal tu:: n for . i. 1nx; r!:Ie lt nOf eOW., 1ature 'A
thin pL,) l('L: , P'IV C1 1 'VW 1'.Y i. 'j P " . 5(1
9 Lh itr( I. 1hick<,:, Vudru:.t.'ni ( I n -c :' In L-: , Af
p. 78.
0 s v 1 ,_t .jr., c , ,cr , .

simulated if this complete factorial experiment was run. If
additional riplications were added to increase the reliability
of the results, the number of simulation runs required becomes
?von larger.
In order to reduce the n=ber of runs required and yet to
obtain as much information as poosible concerning the main and
first-order InteractLon effect*, a one-half frect:3nal ractorial
design was utilized in th1s utudy. A fractlo' . .t.rial desagn
uses, as the name Im plies, a fract . 'rIp>C*Le 0.. A rectorial
experiment. The one-half fract~onal faCtorIr -"h1dih jas
used In this proJect is identified In Table IX.
In this poartiulir djI|gn Lhit n lin eiecti 4.iid Lbt|, firit-
order Interaction offects aro confoundod with the hIgher order
interaction effccto, The hlrhct ordcr intcractlon effects with
which the min, and first-order Interaction offectn are confounded
are refrred t. an the allasos of the ncio a;&tI first-order interaction
effects.12 Thus, In etfect, if one of the null hypotheses is
'ffccLISa -u confoulld.d IL.'th One unoLhur .'hon thu camo €,ta
and enttIIaLor of tli' il','. ,,* ' u 0 'o ' rmilo those (both)effect". (Wil11 1 : ' 2denh, 1, T I.:n v': sd. I n of ,x er.:.t(Belmont, Czill foin Ia: Wao.,worLh Puo ,th: :i ' :'!, Inc., 1968), p. 3J.2,
In e 1 gn uSCed II this study oach naln effect and first-
order iILt: iLl :, t'fiecr: 1!1 colfOUrdJ(d WI'Lh oIC hi;'.;vr order I nter-action o ff,.ct., Th,, doffltii; coitl. L. " il:h I (ll,:iLo' Which LifF' :L
are confuJnJL.d, Cr L1I:' dI.:,lg In .. ,., lo dc (';ine tn till 41.)Ut anl (e ff . 0 2,c . : 'u11 :2, ] i Y J: :,:' t, I : '.'i C;> ,': . , L by' .I,.' 'L fi:tc.of tilli t it, (CMi : l8 t , ,-,L ,r ,. i "liil CIJ Lii .. i bu f of
ithe All iflucL 15, tic., ( .i ') '".i c CL.
III
'1iLi

g- .
-100-
TABUE IX
ONY'-IHALF FRACTIONIAL FACTORIAL DESIGN
S(I) ab ac bc !.
abe d cd bd M
beef acef abef of
ade bdef cdaf abcdef
abco ce be e
J6 abde acde bcde
af bf cf abef
Lcdf acdf abdf df
rejected one would not know which of the effeets (Lte alias or
the effect of interost) caused the rejection. In order to
circumvent this difficulty, the higher ordcr effecto will be
msrumod to be zero. If the render has some doubt about thcb validity
of thJs assumption, the results of this stuJy will have (for hint)
at least, narrowed thu causative factor to the proper alina group. 1
'3 T e appaarnco of a s-m.ll letter in the table moans a factoris prvsvoIL aL Lh, HUCOi, (ilt:or[ -,Lv) lvlT1, 1he absenco of n letter -moans A fActor I at tLi1 fNtSt (ILaudard' level. (1) siuifies-ill facturr ura at ti, £li':JL luVJL,
For a muci more dut. A11ud ']l;CU!;Jon of the c;.)nc!ptu dlncugE :,din thin sn c ttl, , thi r&-;dvr J:, r r d t.o Che rvn y , _J )p. 2,8-
257.

..:= . .- .. 7.. . . . .
Sttistical Analysi'
The 3ath2uatlicl model of the fr-ictlooal faLtorial design
ued in this study i precanted belowv Is
(1) XIjklmn + Ai + I +Ck + DI +Em + T +
ABJt+ AC + AD + i +A +
BC~ + BDjl + BEjM + BF + CDkl +
cc + Crk + DE + DFn +-
+ CIjkmn
where
X the observition of the parforrince
veasure for a 3iven run
U " the iean oboervation of th e perform~ance
measure from all runs
AI . ., t " effects of the factors
Al tJ , , F, Y n - firat-order ititrefction effects of
the test !4ctor-
tJjklm " unexplained variation of the obser-
vation of a particular run (error
teom) jI, J, k, 1, m, n - I If th obervatlon var. Ccerated
from a rujn .n which rho test factor
was at level I or 2 if the tCst factor
wa at ).ev.l 2.
FA
1 clku , 9p.: I., UP "2'"D.231.I*
. . ...

-102-
The major f~cus of this research project will deal with the
statistical tests (and c€rresponding explanation) of the null
hypotheses presented in a previous section of this chapter. The
tests will be conducted to determine if the difference between
the performance measures of the organizational approaches are
significantly different from zero. The analysis of variance
(ANOVA) technique will be employed to dete'-mine if the differences
in the measures are significant.
Since the test factors and their corresponding levels were
preselected by the author for analysis, the fixed-effects analysis
of variance model is the apprpriate stati;tical terKviique which
will be used to analyze the effects of Inturest.1 6 To utilize
this technique the £ollowing assumptions are necessary:
1. Ti n error terms, Cijklmn are Independently normally
distributed with a mean of zero and a e.onstant variance
217
2. The effects are additlve. 18 I
3. The aliases of the maln and first-order interactiou
effects are zero.
1 6Gucnther, op. ct., p. 37. There is another A:OVA modelwhich is appropriate when the facLors are "cIected at random. Itis referred to a t,,i random Cefect . mooel.
1 Ibid., p. 36.
1 8 Chcrvny, op.ct, p. 260.
( 19hisn assu;-'pLJon w, discurssd In the previcu5 section oftils C1 , I te'r.
I
-103-
What impact would the non-validity of these assumptions
have on the analysis? If the "true" raodel of the experiment is
not additive the size of the error variance will increase which
would lead to less significant results being reported than is~20
actually the case. The author has no reason to believe that
the "true" model would not be additive however.
The remaining discussion will focus on the assumptions con-
cerning the error terms.
...studies have indicated that inequality of variances do.'snot seriously affect the F-test [the test statistic utilizedin the analysis of variance] ... if the sapLe sizes arcequal (which is the case in this project].
A further assumption we made in discussing the analysisof variance techniques was normality of the observations.Although the test is derived under this assumption, investi-gation has shovn chat failure to satisfy this condition haslittle effect upon the F-test.
We should make every possible effort to obtain independentrandom samples. Nonrandomness can veryIeriouGly affect theconclusions we draw from an experiment.
Thus the most critical assumption in the analysis of variance tec -
nique centers on the independence of the samples (runs).
Because the sunary statistics used in the study are differences
between the erganizational forms, the same set random numbers were
used to compare the tra::sportation company with the single modal
compani-os In - given run. This should acf. to sharpen the contrast
between the two approaches. Yet, to insure the independence of
20Chervany, o ., p. 263.
21 Guenther, __. ciL,, p. 63.

-104-
observations betveen runs, a different sat of random numbers was
utilized for .,ach run to determine the random components of the
model. 2 2
(~~ a mure dr-tal Iodl di.sci!:ion on thev nto~ crfa .1 rUe'nted
In th9 !vi ct I n, Ow caL is rc fcti-ed LU Clicrva.y , till. p. 257-266.

-105-
CHAPTER V
RESULTS OF THE SIMULATION ANALYSIS
The nature and intent of this project has been described in
the previous four chapters. Chapter I presented the background
and described the nature of the research effort. The simulation
model was presented in Chapter II. The test factors and costing
data were described in Chapter III. The last chapter outlined
the experimental design which was used t; analy-e the results of
the simulaticn.
This chapter discusses the results of the simulation.
Attention wil; be focused on the effects upon the performance
measures produced by the various test factors. The analytis will
be concerned with describing the nature of the effects and dis- -
cussing the r!odel operatlons which caused them. The implications
of the results for the real world will be reserved for the final
chapter.
Nature of the Anaj.is
As previously stated, the purpose of Lhis dissertation Is
to deterrine the effects the selected test factors have on the
econon'c con-!quences resultfng from the .- rMItio1 of transpcr-
tation co.pnlvs vlb-A'i-v~s siniJe tioial carriers. Thereforc, the
principal focus of the, results o: the research will be placed on
how the two org.')ii~.tttonal ap.proach,,.: differ with respect to the
1:

)-106-
performance measures. That is, the analysis of variance that is
being used to statisticallyanalyze the output of the simulation
will be concerned with the difference between the transportation
company performance measures and the sum of the performance
measures of the single modal carriers. More specifically, thi I
sammary statisiics which will be analyzed are the performance
measures of'the transportation company rminus the performance
measures of each single modal company. An example should help to
clariiy this measurement approach. SuppOse that on a given simu-
lation run the actual contribution of the transportation company A
was $224,000.00 as compared to $163,000.00 for the railroad and
$52,000.00 for the trucker. The statistic which would be entered
into analysis of variance calculations would be $224,000.00 -
($163,000.00 + $52,000.00) - $9,000.00. I"., order to determine if these differences are statistically
significant, a standard of comparison is required. The analysis of I
variance technique, that is being utilized to analyze the results,
measures the effects of the test factors in terms of deviations
from the mean of the performance measure in question. In other
words, the standard of comparison 'scd in this study is the
average of the differe:;ces of the perforrance measures between
the traosportation co-pany and the single modal carriers. The
discu;:;ion of Lhe risults will dcscribC the iechalSnM which causc:d
the effects.
I

-107-
As mentioned in Chapter IV, 64 different simulation runs were
required to .easure the effects. The analysis concentrates upon
the differences, between the organ!zational approaches, of the
six performance measures: (1) expected contribution, (2) actual
contribution, (3) price paid, (4) amount of truck movements, (5)
mount of piggyback movements; and (6) the amount of rail move-
ments. For each of the simulation runs these statistics were
gathered.
It was also mentioned in the last chapter that the mean
difference between the perfor.ance measures of the transportation
company and the single modal carriers would be tested for signi-
ficance. In other words, the results of this type of a test
would indicate if there is an appreciable difference between
the performance measures "on the average". In order to obtain
the average difference In perforance measures beti:een the organi-
zational alternatives the above six measures were averaged over
th simulation runs. The average differences for each level of
the size of shipment parameter are presented In Table Xa.
* Explanation of the Acrac Performance Mcasurcs
Some explanation of how tu interpret the averaCe performance
tmeasurts Is ,-cesSary, but before bL .this discussion the
relationshi p. bct".Len the purfon,.ance r.easurcs will be recaI iLu-
lated. ThCe XpCcted ccntributlon of the carricrs is a projection
made by the carrier,: baied upn10 their forcca!;t of the total

F-r-108-
market for transportation for each route segment and their fore-
cast of their market share. The actual contribution of the
carriers is based upon how they allocate equipment to the various
segments, the accuracy of their forecasts, the shippers' modal
selection policy as well as carrier pricing decisions. The price
paid by shippers for transportation services is a function of the
shippers' modal selection policy, the demand for transportation,
the carriers pricing and equipment allocation decisions. The
amount of truck, piggyback, and rail movements are dependent upon
the pricing and equipment allocation decisions of the carriers
as well as the shippers' modal selection policy and market demand.
The first three performance measures--expected contribution,
actual contribution, and price paid--are directly concerned with
tha economic impact the two organizational alternatives have on
the carriers and users of transportation. The latter three
measures--amount of Cwt. moved by truck, piggyback, and rail--are
determinants of the first three measures. In other words, the
expected and actual amount of Cwts. moved by each method of move-
ment deternines the expected and actual contribution of the
carriers and the price paid for transportation by users. For
instance, t.;e actual ccntributlo, obtained by the carriers is
d -.adcr.t upon the aount of p!F.gybac., truck, and/or .; movements
that take place. Thesu intcrdepcndvnclc3 between 0c performance
measures :Illl aid in the cxp,, atLion of U.a cause and effect relation-
ships b, L c., : I ; t f;;clors a:. s i ni [1 ,c! prfcr:.:.;c: c !; ur .
-109-
As Indicated in the last chapter a t test was utilized to
determine If the mean differences in the prformance measures
between the organizational approaches were statistically signifi-
1cant. The results of the test are indicated by the use of
asterisks in Table Xa. One asterisk (*) indicates the hypothesis
is significant at the 10% level. That is, one asterisk means the
null hypothesis is not accepted (rejected) with the probability of
10% that the null hypothesis is in fact true (Type I statistical
error). Two asterisks (**) indicate slgnificance at the 5% level.
Three asterisks (***) indicate the results are significant at
the 1% level. 2
As can be seen in Table X, the differen.cs between the reans
of the transportation company's performance measures and those
of the combircd cingle modal carriers are in most cases signifl-
cant. Table Xb presents the relative differences In performance
measures betoieen the transportatlon company and the single modal
carriers. For instance In the TL/CI. market, the Lransportatlon
company made 44% fewer piggyback moventr than did the single
modal carriers.
1Supra, chapter iv, p. 98.2Tiere sgonlf ca:e lt,.Lcls a ;proi r c for a !;In.le
test, when ole cou.; Lc-;L , hc pr ,,: 1, t offal.Lly rcJc.-t;:g aLt !(:;J ;L u. true null. IS:ote: I. [1 - p(not r.jccting 'u all the Ltit.S)]. !;cO, for example,Menderhill1, cp..f, t., p. 175.

-110- A1
TABLE X
81a" AVERAGE DIFFERENCES OF THE PERFOR..NCEHFASURES BETWEEN4 THE TR.,ASPORTATION COMPANY
AND THE SINGLE MODAL CARRIERS
TL/CL Movements LTL Movements
Expected Contribution $24,221.53 $ 18,158.30
Actual Contribution $23,143.72*** $ 17,513.62" *Price Paid 7,662.38 - 92,475.94
Truck Movements - 7,481 Cwt. -101,650 Cwt.
Piggyback Movements -49,331 Cwt. 91,306 Cwt.
Rail Movemen.s 70,388 Cwt. ---
Significant at the 10% level a
Significant at the 5% level
*Svnlficait at the 1% level
4
.1- 1
I

TABLE X
b THIE VERAGE DIFFERENCES AS A PERCE;TACEINCREASE (+) OR DECREASE (-) OF THE COCMINED
SINGLE MODAL PLaOr,-WNCE MEASUlES
TL/CL Novements LTL Movements
Expected Contribution +112 +17%
Actual Contribution +11% +16%
Price Paid + 1% -12%
Truck Movements - 42 -35%
Piggyback Movements -44% ----
Rail Movements +24%
As indicated in Table X, one may conclude the expected contri-
bution and the actual contribution of the transportation company
is larger th.n the single modal carriers, although at different
levels of ailnificance. The price paid by shippers is significantly
less for LTL movements when transported by the transportation company.
The price paid for services was not significuntly different between
the two approclies for TL/CL mover..nts. In the LTL category, the
transportation company rmovcd lese goods by truck and more. by piggyback,
which contrluted both to the higher contrIbutlon and reduction In
3TC fJ 8urC, In this table ri.present thc ratio of the averagcdifferonce, -:i perforance mcasurLs abh Xa) to the avcrage
combined si,'ge modal i erfor.-ance t.r asures, 4-, ' 411%.
4Therc yore no ,j; 2 c. :udal 1 ggyback tovnnt in .'fLfreight . The 1ncred:;c in C:t , dL. by pif;yha-k in thy tran por-ta lien cc:npi;ty sL LL, 'n ;, ; 91.306 CWL.
ill ii
-112-
price paid by shippers. In the TL/CL cateSory of movement,
the transpor:ation company made more movemjnts by rail and fewer
by piggyback than did the single modal carriers. In general,
this occurred because the single modal trucker participated
in Plan I moves when he was not the low cost carrier. In a
large nimber of cases when this occurred, the rail mode was low
cost but Plan I was competitive. Hence the transportation company
shifted Plan I moves to rail in those cases, which of course,
effected contribution and price. Other factors played an important
role on the performance measurcs which will be explaired in great
- detail in the next section of this chaptor.
To reiterate, the figures in Table Xa represent the averAgC
dIffercncuts between the transportation co.pany performance measures
and those of the railroad and trucker. For instance, in the TL/CL
category of movements, the trancportation company had Uenerated
$23,143.72 on the average more contrIbutJCn than the railroad and
trucking companies. In the some manner, in the LTI, category of
movements, the transportation company moved 101,650 Cwt. of
product less by truck than did the single modal carriers (the trucker).
It should also bu p.Ji Lcd out that thc differences between
the a ount of truck movcmcnLs, In the LTI. caL. c;ory, if not co:.:-
pletely mad, tip by p1g6 yback ,o tnt;, In uther word.;, the
transporUt..ii corp:ilan:, r ov, J0.1 ,650 U t'. :;,; by truck than the
V; i;Inglo 1.Ol1 carriers, bur. ;Ilftfi only 91,306 Cwt. to plg,,ybacL.
moV-;(:nL!;, C* n th, oL!.i r d - " ./ C!,':t.g , , thu ft.wcr U

.-- " Ij -... .. _
(.) -113-
truck load ard piCgyback movements are mora than compensated for
by rail moverints.
Why is this so? In the TL/CL situatio. many factors may
contribute to this effect. For instance, there were situations
on some rout(* segments whore the trucker was not the low cost
carrier but could compete for traffic, If the trucker exhausted
his equip:3ent capacity on other route segments, in the single mudal
setting, dcmand for service was unmet on some route sccents.
The transportation company, on the other hand, If it had rail
capacity could substitute this scrvice if not constraInted. Thus,
the differences in the amount of novcwat by each mode need not
sum to zero. Similar conciderationu come into play In the LTL
category of movement.
The LTL category of movement, however, doos have a unique
situation which must be discussed. In the mudel, the single .odal
trucker really has no competition for LT1. movements. This ia the "
same as sayirg the model is considering only that LTL portion of
the market which mover by comNTon Larricr truck. At any taLe, the
trucker and the railroad do not have to participate in PlAn I
piggyback to,.'ov.ni.nts. If thcy do participate, they will split the
profit cootr!butloti on the basis of cost conLrlbuticns a!;
explained III Chvpter 1.1. S1imcO the tru kur has t,, real compne-
tition for LTL traffic, he ,:II act his LTL rate at his full coi;La,
consistent wiLi the pr'i c :; pollc; or;t; bli ;!,L d in Chnpt,.r i.,
Thur:, In' I.T . :,L; ti,, : i]t ;'.c;!,1 i'uT'.. I1!; :tOi o)..r o L
part i i,~n an I :- '-,,P

-114-
In the case of TL/CL movementn, the full cost of tne lw cost
mode will govern the action of the uingle Aotail trucker. If Plan
II piggyback or the rail mode In low cost, the trucker may wish to
participate In Plan I movements to obtain some share of the
Acompetitive narket.
Regardless, the transportation company will establish the rate
at the full cost of the low cost mode. In the case of LTL move-
montp either at the trucking full costs or the piggyback full costs
whichever is lq.et for a given route segment. Thus in the single
modal .TL markct se,;me:nt, the product will be moved at the full costs
of the trucker, while the transportatior. company will price its
services at the full cost of the low cost method. 5 In a large
number of canes, the full cost of piggyback movc".ents were lower
than the full costs of truck movements. This is what creates the
large difference in price paid for traasporuation services in the
LTL category between the transportatlon company and the single
modal carriers, as shown in Table X. Furthermore, the rail
flatcar capacity was the limiting resource of the traisportation
company. Because the transportatlon company was pricing services
at the full cost of the low cost mode, some trucking ,ove-ments
Ln pra.'tLcO it Play be r-nore likvly that the transport;,tion
company would price It!; ,;.irvJcc,; 1i, thu Li. 1 . r1 at the trucker 'n.full CO!:ts. "i o prii '.r1l po!Icy w'vu ' dopelti u.,oai icw thl, I.C.c.would react LO tle tri.orLa-caU ct;,ya preini, tL -urvicc(,; Inthe LTIL mark.-c, at It.,; fill coC t:L;. if t.he Lri.:p-ortation c c:.,.y;..'did price at !.;c! ti'ucc '- ; EulI cob:t , thc1 di tfrcec h.,t'.',,un the tEL.p0Ctvd ;'.:"i actull coli t ib . t[uw,,; of L1; i :i. u i i; Lu-wutlld 1, cCoM,: k've.i lair;;k,. tLh.!ll th ill 101) V X.I

~-115-
wegre not attractive even after all the flatcar capacity had been
exhausted. This accounts for the differencea: between the amount
of trucking zoveents not being fully compunsated for by piggyback
Umovents for LTL movements in Table X.
Analysis of the Test Vr ctor
Before proceedin& with the analyb!,i of the test factors, the
symbolic representations of the test factors will be recapitulated.
The symbolu which are associated with each test factor are displayed
6in Table XI,
TABLE XI
TEST FACTOR SY'MBOLS
A Truck Operating Ratio
B Rail Operating Ratio A
C Truck Load Factor
D Rail Load Factor
E SytteM Capacity
F Shippers' Logitics Consrraints
lhui sectlon prese:mts the analy!,; of the effects produced
by the six tLet factors, for .ach love! of the size of shiIp'.:ets
parameter, on iach o4 the perior a-;.ce mcasurcu. The analy';J ,r ill
be compoi,cd of two parts;. First the effucts which are found to be
statitftC all.y r:t; .1flcant . 1) ., !d.t .cd, St'ce:'d', a:1
6o detai cct r LiHhe v t ( t L,-; t £act o; n, the
rei ¢,r I, rvf -rL-d Lu j i,,bl. I , C,:, cr ]. I, W.m",, p. 1,',,

-116- -
explanation of what "caused" the factor to be significant in terns..
of the manner In which the model operated will be given. One cannot
be absolutely sure, hawever, that the explanations will be complete
or accurate. This is because of the complexity o! the interactions
of the sysre which required simulation to be used as a methodology
to study the transport;:-on company concept.
As indicated in the last chapter, the main effects and Inter- Iaction effects will be tested' ,or significance. The main effects
and interaction effects are numerical measures of each type of effect.
"In general, an effect is the average difference between observations
(of a particular performance measure) generated from simulation runs
where a test factor is at its alterilaLe lezel, and the observations OR
where a test factor is at its standard level". 7 The effects are
defined mathematically as follows:8
1. MAIN EFFECT:
ME _ -21 (r Q 1, 6)
where: il
:HE main effect of the jth test factor
Xij a Ith observed measure when the jth test factor is
at its altcrnate level,
XI a ith observed neasure when the jth test factor
is at Its standard level,
7Chcrvwny, pP_ _ *', p. 272.
8Lld., 1. 273.
--' - " : -'= - " .' --- .. .. . , -" .. ... - ...... ="I ... ..... -,,.: -, .

-117- -
the number of observations when the jth test
factor is at its alternatQ level, and
n n the number of observations when the jth test
factor is at Its standard level.
2. FIRST-ORDER INTERACTION EFFECTS:
nj X n n
1 2 11 j ~ I.-IIE~~~ 2 IX- 2)2
J n 1=
(j1 M 1, ... , 6)
02 = 1, 6)01 0 J2)
where:
IEI = first-urder interaction effect of the jlth
and j2th test factors,
X ith observed measure whcn the two test factors
1 21(1 and j2)are both at their alternate levels,
X ith observed reasure when test factor j is at _i.)I
its standard levcl and test factor j2 is at its
Ii alternate level,
1 ith observed measure when test factor is at its
alternate level and tast factor j2 Is at its
stanlard level,
XC ith owserved measure when both trst factors
(j 1 and j2) are at "heir standard lcvels,
[IL

I.-8
JlJ2 * the number of observations when the two
teat factors (j1 and J2 are both at their
alternate levels, .a - the number of observations when test factor
Jl is at Its standard level and test factor
J is at its alternate level,
n * the number of observations when test factnr
is at its alternate level and test factor
J2 is at its standard level, and
n * the number of obser%, atlons when both test
factors (j1 and j2) are at their standard
2evels.
An example should help to clarify how the measurement calcu-
latIono are made. From Table X the difference between the expected
contribution of the transportation company and the expected contri-
bution of the single modal carriers is $24,221.53 for TL/CL move-
monts. 1he average difference between the expecced contribution 4when the truck operaring ratio was at its alternative level, i.e.,
91 was 24,169.67, Similarly, when the truck operatitig rdtio was
at Itr, stnndard level., i.e., 99%, the avervge difference in . -
eKpected con.ributlon bctwccn th'2. organiza.l nal alte rnaives was I
?4 273.339. The dlffer nce bet'..ei t',ese a.'rages ($103.72) is the
main (ttect cf the low opnrating ratio (91;;) over the high operating
ratio (99").
I

.. .. __...... , -... . . ... .7 --- r- .: -- T - ..-- . n.. --
-73
The operational interpretation of the interaction effects
is much the Eame. For example, the interaction effect of truck
L operating ratio and system capacity (AE interaction, see Table
X11a) resulted in an increase in the difference between the i
expected contribution of the transportation company as compared
to the single modal carriers of $8883.32. This represents the
average of the expected contribution when both factors, A and
E, were at their standard levels plus the average when both
factors were at their alternate levels minus the averages when
one factor was high and the other factoc low,
Before proceeding with the analysis, the direction of the
change in the economic performance measures brought about by changes
in the levels of test factors deserves some discussion. An increase
in the expected and actual contribution indicates that the transpo:-
tation company is more "profitable" than the single modal carriers.
A decrease in thses performance measures indicates under what
circumstances (test factor levels) the single modal carriers may
econocically out perform the transportation company. Similarly,
an increase in price paid would mean tho single modal carriers
were more economical to users than a transportation company.
Cqnversely, a decrease in the price paid f)r transportation, Indi-
cates the transportation co:;mny ray bc more economical to users
than single xodal competitive carriers.

-1;-0----
The effects of the test factors are summarized in Tables XMIa
through XVIIb. The results of the analysis of varjance are identified
by the use of asterisks as described earlitr in this chapter.
Effects of a Change in Truck Operatini Ratio (99%-91,) on the
Performance Measures A
The effects of the change in truck operating ratios are pre-
sented in Tables XIa and XIMb. These results indicate that no
significant change in the performance measures occurred due to
changes in this factor. The lone exception to the lack of signifl-
cant effects took place in the amount of rail movement measure in
the TL/CL category of movements. The interaction of a decrease
in truck operating ratio with a reduction in system capacity caused
more movements to take place by rail boxcar. The reason for this
result is that 'the change in truck operating ratio did cause more
movements to take place by truck, although not a significant amount,
by shifting piggyback movements to the trucking mode. When the
trucking mode capacity was restricted, the transportation company
would in general, when not constrained, shift trucking moves to
rail moves, especially on the loingcr route segnents where the rail
mode even if not lot cost made a suhstantial contribution to profit
and fixed ar" 'or co-'no.n conts.
AI=I
-I

4'1
.- C £ %1(1 in P N'0.4 0n
.C " ~ I'% N
I. w f!W 0 6 t
a: 0
0~4 %n &M ?4. 0
I-C,
%0 a, e 0
9. L I -4 - %0
(i)C
r'rJ cc'.
*r4

4.4 " 0 r% .
.4f4
'I
OD co n0 0 i4 PV. r- 0 N
'4i
03 * P 000 ~
V 0N
~~V A~
w4 -4 0 I0. N IN 4
N~I %n N .
0: A
~-. 4~~ 31

-123-
Effect's ofa Change In Rail Operating Ratio 8.5%-65% on the
Performance M.asures
The effects of the change in rail operating ratios are pre-
sented in Table XIIIa and XIIIb. There are a number of statistically
significant results in all the performance measures except on the
mount of truck movements.4-
Exected Contribution--In both the TL/CL and LTL categories
of movement, the reduction in rail operating ratio caused a
significant Increase in the expected contribution of the transpor-
tation company as compared to the single modal companies. There
was also a significant interaction of a decrease in rail operating
ratio with an increase in rail load factor in the TL/CL movevent
category. This interaction (BD) had the effect of lowering the
expected contribution of the transportation company vis-a-vis the
single mo'lal co.pani es.
Actual Contribution--Again for both TL/CL and LTL movements,
the reduction cf rail operatiJng ratio caused a significant increase
in Lhe actual contribution of the transportation co.pany as com-
pared Lu the .jnile modal carriers. There was also a significant
int.raction of a decreat;u it, rPu opLralnL ratio with an Increse
in rail load factor (BD) In the TL/CL MoveC-,rnt catVCry. As one
Mig;ht CXpect, U;MS I ntcrac'. . had ti.c sar. cff,:ct on actual c||tr t-
bution ag IL d d on v-pvcu'.-d contrILut Icn; that I , It cauicd a
lu 'icbrJ . of Liu. actu.i co trLributlon (.f thi! rniprt:1,|un c,:.;..': v
vl'.-;4-vi; thc :,;igin . i.' . . r .
I
i:: | i '- , " ' . . . . . . ... .. . .- ...

l .
P4 WN
C~ 0% 0% OD 0ne 4-44
N0
II
u I., C
et :4 "3
cnI I
0A
t~' ., , . , - "
0
1. .7- l _ c
U 4 9"IC4 0 07 fn
Us-.~L Li r- nU 0 0 .
IP -I0 ~ V

A A
UJ0
-
V.
ho 1
'. 1 ~ 0) V0 LA
oft . -4 ~ ,~ fI '
-. 4. - .
1% .4 N ^q N1
,A p44 I I I p
9- jc 0
t-I
.4'13 ,,t, IF., .
4 , LA- co/) NC'4
i',~~a ""t0.%"' "" '
l
InI
." ~ 0 .* ' t
l k- -4~
-~ f~4 49 N

-126-
Price Paid--The change in rail operating ratios caused a
significant reduction In the price paid fir transportation services 7
for userx of the transportation company vis-h-vis the single modal
carri-er.- - .he TL/CL category of movement:. This factor had no
effect ou price paid for LTL movements. There was one signifi-
cant intera n with the truck load factor (BC) in this performance
measure for .'L movements. This interaction, a reduction in
rail operating : tio and an increase in truck 1wad factor had the
effect of loweri,: the price of service for the users of the
transportation tor. -,q as compared to the single modal carriers.
Amount of P.'','. Movements--The rcduction in rail operating 01
ra.io caused a sigr f .-h ly fewer amount of piggyback movements
to ta~ke place in the tre.:. .ortation company setting than in the
single nodal carrier e',lr.-.nt for TL/CL movements. There was
no significant different ,..ei the systemsq as far as LTL move-
ments are concerned. jAmount of R.il MLv.-.ntser piggyback movements were
compensated by a iar.r .. wount .: - ,ovemcnts in the TL/CL
category. There aie, of c..'ur.e, I " ovements being considered 1in the ITL category. "',c re o.. o' operaLlnl ratio con-
bined with an ineroazcn '.. rail I.-.311 :..,uced .' nig~iifl
cant irteracLion (b!) " had tie t ,, dluciig the nurber
of rail rnov-:rints.
" ' t'" ' ---' -" ±-71/ "- -, w 7- "' ' " 'Z ; -- .--i .u- , _ ... : ..:':I

-127-
Explanations--What interrelationships within the sim-.!:
system causel these changes in the performance measures? To !.: r
the discussion, it was pointed out that the transportation compsny
experienced larger expected and actual contributions in both
categories of movement than did the single modal companies with !
a reduction in the rail operating ratio. The reasons for thej
increased profit contribution of the transportation company over
the single modal cotipanies are the same in both cases. The
transportatioi company shifted traffic frcm truck and piggyback
to rail movements. It did this to the extent possible. That is,
the transportation company shifted as much traffic to the rail mode,which the single modal comnpancs were moving by rail and piggyback,
as it could a ithout violating shippers' lcgistics constraints and
capacity constraints.I
The significant interaction effects under expected contri-
bution and actual contribution, BD, indicates that the combination
of a low rail operating ratio and a high rail load factor signifi-
cantly reduced the expected and actual contribution of a transpor-
tation company as compared to Its single modal counterparts. It
must be remembered, houever, that these results must be interpreted Iin conjunctlon -'fth the re:nults displayed In Table X. It can be
seen that the BD interaction is ncgativc In each case. Thus, the
BD Int:raction effect is to lower the figure of the expected and
acLu-1 contrIut !on !n Table X. The reason the B! interaction Is
negat~v I.; "hat thl. cob wir. en is thle mrost favorable rail po;ition
-128-
for single zodal carriers. Thus the formation of a transportation _
company with these rail characteristics whi.le still improving
the profit situation of the transportation company over the single I-Ul
model carriers does not result in as large an increase as the
average presented in Table X.
The effect of a reduction in rall operating ratio was ti.
reduce the difference in total price paid for transportation by
users between the organizational approaches. The reduction in rail
operating ratio made the rail mode in both organizational settings
the most "profitable" method of movement o:. a large number of
route segments. Also, the reduction in ral opcrating ratio made
* the rail mode much more competitive with the independent trucker.
In other words, on some route se~ments when the rail mode had a
high operating ratio the only traffic it could obtain was that
reserved for the mode due to shippers' logistics constraints. On
other route segments the rail carrier would attempt to compete
with Plan I1 movements. Under these circumstances the single modal Itrucker, in a number of situations, would exhaust his capacity
before demand was satisfied. The transportation company, on the
other hand, because it controlled both modes made different allo-
cation dccisions (based upon total system wide contribution
("profit") ma:.iti zat ion) ,--hich resultid in more demand being
satLisfh !. Lecause :ore dc:mand was sa*&Isficd, the corrcsponJing
total price p;:id for servirce was greatcr for thCe transporLatlon
Ct
,:' o:'a%"tha ti: :i, lc e~l] ca rJrsvl~n t,. r fl ~d. ha] ai

-129-
bigh operating ratio. Thus the reductiot. in rail operating ratio,
since it enrbled the single modal rail ca:rier to be more com-
petitive, reduced the difference in the price paid between the
transportation company and the single modal carriers. In fact,
on a large number of runs, where the rail operating ratio was at
its low level, the differe..e in price paid between the two
alternative organizational approaches was zero. Thus, the overalli=
effect of a reduction in rail operating ratio was to increase the
contribution of the transportation company over that of the single
modal carricrs at substantially the same price to users as that
paid to the single modal companies.
The interaction of a reduction in rail operating ratio and
an increase in truck load factor (BC) had much the same effect as
that described in the last paragraph. The increase in cruck load
factor coupled with a reduction in rail operating ratio made piggy-
back movements, in general, the dominant method of movement in
both organizational settings. Hence, the difference in price paid
for transportation seivices betw'een the organIzational alternatives
was very much closer together than when the truck load factor
was at its low level. In other words, the difference in price
paid for services bet;w .en the organizatio;'al alternatives under
these circtt::.-tancvs (factor levels) vas zero or nearly zero in
all cases, as opposed, to s ,uations when those factors vcre at
their standard leve_.
4

-130-
Effects of a Change in Truck Load Factor (100 Cwt.-300 Cwt.)
on the Perfc.,nance Measures
The effects of the change in truck load factor from 100 Cwt.
to 300 Cwt. are presented in Table XIVa and XI11b. The change in
this factor produced several st:itistically significant results.
Expected Contribution--The increase in the trucl- load factor
significantly reduced the expected contribution of the transpor-
tation company vis-f-vis the single modal companies in the LTL
category of movements. This factor had no significant effect on
expected contributions for CL/TL movements. There were two signlf'-
cant interaction effects for this measure. The CD interaction I
effect, increased truck load factor with low system capacity,
was to significantly increace the expected contribution of the
transportation company vis-A-vis the single modal carriers. The
same kind of effect was caused by the CD interaction effect, high
truck load factor with high rail load factor.
Actual Contribution--The change in truck load factor produced
no significant main effects in this performance measure. There
were two significant InLeraction effects however. Again for the jTL/CL move-mcnts, the interaction effect with system capacity (CE)
was to Increase the actual contribution. This same kind of reaction
was produced by the iateraction effect with rail load factor (CD)
in LTL r.oveo.cnts.
.. .. ..... ..... .I

94C N ?It~t~r4 rs.%-4 N 4-
4j -4 4 .- 4
%4i. 0
0. u. ~
Ev IA
00 -4 - 'r'0 '% 0. N- 7 0o
i- -. 4 4~ n I
44
VL o
Ca,

Go N 0 611 00C.0 t'-s 0
2 m 04 0 N 4
449
LI P. N %D 1-4 N1? 0 on a, N .1
ci :1-4 LN C- N
wd 41C
F-I 04
-C. di 0% P- c' 0~~9U C,0) . @4 4 i-
v' r- , I1
1.41..

-133-
Price Paid--The main effects of a change in truck load factor
was significant in both categories of movm.ment. The effect in
both cases was to Increase the price of services of the transpor-
tation company compared the single modal carriers. Several
interaction effects were significant as veil. The Interactions of
truck load factor with (1) rail operating ratio (CB), (2) system
capacity (CL), and (3) system logistics constraints (CF) were all
significant in TL/CL movements. The last two interaction effects
acted to increase the price paid while the first acted to decrease
the price paid.
Amount of Truck overents--The change in truck load factor
had no significant effect on the amount of product moved by truck
in the TL/CL movement classification. This test factor change
did, however, cause a significcnt increase in the amount of truck
movements of the transportation company vIs-A-vis the single modal
carriers for the LTL movements. Therc were also two significant
interaction effects in the LTL classification. The interaction
with rail load factor served to decrease the nuwber of truck move-
ments significantly. On the other hand, the Interaction of truck
load factor with shippvrs' logistics constraints served to increase
the ar-ot ,! Oat. moved by truck.
"M--TI Of arnount of Cwt . rov'd by
piggyback wa. rslJinif lcaitly I crca::cd in TIL/CL, sovcments a:nd waq
stgnl fic-m:ity dLcc.:mD in l.'L';. b.:)w:.A2;t. Dy n tnrret:c in truck

-134-
load factor. There were three significant interacton effects.
For TL/CL mcvements the interaction with ,. low system capacity
(CE) significantly decreased the number of piggyback movements.
For LTL movements, the interaction of high truck load factor _1
with high rail load fa,'tor served to Increasethe amount of Cwt.
moved by piggyback. On the other hand, the ititeraction with .1
low shippers' logistics constraints acted to reduce the number of
piggyback movements, jExplenations--Because of the large number of significant
interactions associated with a chauge in the truck load factor,
dispussion of the effect of a change in this test factor will be
centered on the main effects. Interaction effects will be exa.ined
for trends rather than discussing each significant interaction
effect Individually.
In the LTI. movements, the increase in truck load factor caused
the expected contribution of the transportation company compared
with its single modal counterparts to decrease. This Is due to the
fact that with a high truck lo3d factor less craffic was allocated
to piggyback movements by the transportatlon Company. This is
because an increase in the load factor of the trucker reduces the
cost :,cr C'. , of moving goods. SinICe cos Is directly related
to the rate (the lu]] cost), the truckcr beca.,o more compctJtLvc
with pljggybark MoVemcnts. Hence the tran.portatLon cCr"M1- y 1ad
I.Itth, opportunity to fihtft tr:,fric f.ro'i truck Lu pigyhback L~rv,:.c:lts
wit ~Li I 'it -, i t r',..t(.r profiL corLrlbo,. ion. T ' ff, t of t

-135-
change in truck load factor did decrease the difference between
the two systems actual contributions but uas not quite statisti-
cally significant at the 10% level.
That the above reasoning is correct is borne. out by the
fact that the transportation coMpany moved significantly many
more Cwt. by truck than when the truck load factor was at its low
level in the LTL category. Correspondingly, the transportation
company moved much less traffic by piggyback than when rhe truck
load factor was at its low level.
A peculiarity in the main effects trought about by the change
in the truck load factor is that the price paid for LTL transpor-
tation by tratsportaLlon coSn-any users Is cignificantly hfghur
than whei the truck load factor was at itn low level. This is an
interpretation problem which again deals with the nature of the
perfor. ;nce measures being a difference between the two approaches
to trilisportation. The incrcace in truck load factor did signifi-
cantly raise the price paid from the average found in Table X.
Even :ith thi.r rise in price paid betwecn the two forns, the
transportation conpany wot'id still have negative effect on the
total price paid by users. That Is, if the deviation from the
average cavted ly an Increase In truclk load factor was added to
the average diffrcnc, thu figure t;ould still be negatlve by a
l.arge aioun t t hur indicati::. the tra.nsiportation coi:.pony still creates
Iecolol;J ed i for A; pk, r. *
:1=

-136-
Before considering the TL/CL movements, the effect of changing
the truck lead factor on the LTL interact;''on effects will be
examined, Four of the six significant interaction effects were
the interaction with a change in rail load factor (CD). The other
two significant interactions dealt with the interaction with a
change in shippers' logistics constraints (CF).
The CD interactions had the effect of significantly raising
expected and actual contributions and raising the amount of Cwt.
moved by rail while reducing the amount of truck movements. This
is as one would expect. The combination of high truck and rail
load factors made piggyback movements the least cost (rate) maximum
contribution method of movement. The piggyback movements had a
larger contribution associated with them than did the truck move-
nents. Hence the transportation company substituted piggyback
movements for truck movements subject to logistics and capacity
constraints. This had the effect of increasing expected and
actual contributions over the single modal trucker.
The significns CF interactions had the effect of raising
the price paid by users over the average and reducing the number
of piggyback movements below the average difference as expressed
in Table X. Again this is so because, in general, an increase
In the load factor of the trucking mode made this method of move-
amnt dominant. Most moves took place under these circumstances
by truck, which In general had a larger price tag than when coordi-
nated transportation was used under different factor combinations.

-137-
The change In truck load factor significantly Increased the
TL/CL price ?aid and the amount of Cwt. moved by piggyback. The
increase in truck load factor made piggyback movements an
attractive latermecdiate length of haul method of movement. In o
the singlc .. ,3dal sltuatie:i, however, the trucker tended to make
truck movements as much as possible because of the necessity of
splitting the contribution in Plan I moves. The t'anspartation
company utilized piggyback movements to a greater extent when
the total contribution was greater.
Thie effect of this factor on thu price pald by users is more
complicated Lo analyze. Ccrtilnly, tLhe Interaction with low system
capacity (CE) Is understandablc. The price pald Ognlffcantly
Increased wh-n the truckicn, capacity was exceeded. This is
because alternaLive more expensive mcthod- of movement must take
place to satisfy der.nnd. As far no the rain effect Is concerned,
the analysI.; of the printouts of the simulation Indicated that the
increase in truck load factor made trucking woves more attractive
to the trucker aR well as the transportation company. The sJmu-
lation printouts revcaled that In a large number of casr,, due
to chance, the 141ngle inocli. carrier would run out of capacity
before dunanJ was s;atJsfJcd. Thc trn, po~-tatJ(:, ccr;,a' whiltl
sti l ,l cra ti.8 u:ide r lc .. ! Lu:: cz,:'(:,tv had x, odd L I afrI 1 uuL0ft
of truckliq c.yaciLy aL 8 di ,'C:,J . Thi, extra capacJLy :a.
what Lhe ,':, 1',...J h idJ av J ial(' for l'Ii- If 1:0W- ;. Ihu; LhC
trw ~~'~'cr~iilw. t Ii' :i uf thu d;i ~~

-138-
as a result the price paid for services correspond ngly rose.
Effect of a Chan~e In Rail Load Factor (400 Cwt.-800 Cwt.) on
the Performance Measures
The effects of the change in rail locd factor from 400 Cwt.
to 800 Cwt. are presented in Table XVa and XVb. The change in
this test factor produced many significant results.
Expected Contribution--The increase in rail load factor had
the effect of significantly reducing the cxpccted profit contri-
bution for both TL/CL and LTL movements. The cbange in this
fcctor also produced three significant interaction effects in the
expected con:ribution perfor.ance measure. In TL/CL rovements
the interact.Lo, of increased rail load factor with (1) a teduction
in rail operating ratio (DB) and (2) a reduction In the size of
shippers' logistics constraints both servcd to significantly reduce
* t1-e expected contribution cf the transportation cocpany as com-
pared to the single modal companies. In the LTL category of
Smovements, the interaction effect of a change In rail load factor
with a change in truc- load factor (DC) significanLy IncreIsed-
the expected contribution .easure.
Actual Cm:,r1 ut1':--T:e nain cffects of I:creasln , the rail
load f'tor 'n both r,a'cj,-.. t Ca 'o"c'; 3 s to 'J,JA'icantly decrease
" the actual co:-:tributin C4 the t:ran:,;ortatb)n cc:c-.any as oppoicd
to tsr in.]: ;:Ow,.!:. carr t'r;. Ti,c s.:. r, terct c; ef :c that
were ; J: Li ;pra otecd Loio.rihut ion rii'.vU are : it-
cant for the otun': c,: ,.:2 I f ... -,)c ,';. , ";'.- .;t' .:

gn
,% m
to aL9p
V4 N
~~41Aj 49 4
Aj ~ ~ ' W4 'a ChW4PI-fl 0 .4 4 U
r% 4 q fn o
ioiP4
4l W4 .W4
.0 It V.,I VIOaa u~o
!016

4
u ~ Go0 0 0%
U4
4 4
tDi ? 14F 4
v.4 N N~ .2 .4 ft
0 4944 a'9 In a
%0 In %D n
1%T EW4 I I .
494
Ine I ~
rn 4n 9 cc en4 o % - C" 4
Ij a I

- . -141-
effects-DC for LTL movements and DB and DF for TL/CL movements--
produced the same kind of reaction uf the system In this measureme2nt
as they did for expected contribution.
Price Paid--The change in rail load factor had no signifl-
cant effect on the price paid for transportation in TL/CL move-
ment category. The change in this test factor did, however,
significantly reduce the price transportation conpany customers
paid for transportation services as compared to the single modal
counterparts in the LTIL category of moveme2nt. The interaction
with shippers' logistics cor"strai-ts (DF) also significantly reduced
the price paid for services in the LTL category.
Amount of Iruc. ovo.,e.ts--The increase in rail load factor
significantly reduced the number of Cwt. moved by truck in the
transportation compzny situation vis-S-vis the single modal carrier
in the LTL category of movements. Also in LTL movements, the
interactions with increased truck load factor (DC) and with reduced
shippers' ic-gistics constraints (DF) sig-nificantly reduced the
e.mount of truck movements.
Amouit of P1;': , ,.t-.h_ change in rail load factor
signif czi:-.t incr-:.tscd the nu:n.cr cf C- *. noved by piggyback fcl
1,.1 ov..:cntS. This iacLor c.a:;u ,had thC e:act Cpc JLe effcct
o the :1 c.t. of pj'g::hac',- :c:'nts in tie TL/CL movc:.cnt ca, itory,
ThcrL ,c ,c t:o -ii.t i:.t.. :' ;.: c . c ls lro. 1;1 the TL/CL
Catiory, LI-C ,iit a of
/ i
-142-
constraints (DF) also served to significantly reduce the amount
of Cwt. moved by piggyback methods. In tl~e LTL category, the
interaction with increased truck load factor (DC) served to
significantly increased the number of Cwt. moved by piggyback.
Amount of Rail Movements--The change in rail load factor
led to a significant Increase in the amount of rail boxcar move-
ments by the transportation company over what the single modal
companies moved by rail, as one might expect. The interaction
with a low rail operating ratio (DB; served to significantly
reduce the number of rail movements of the transportation company
as compared to the single modal companies.
Explanations--The ex q.anation of how a change in rail load
factor produced significant effects on the TL/CL performance
measures will be presented first, after whIch attention will be
given to the LTL performance measures. The Increase in rail load
factor significantly reduced the expected and actual contributions
of the transportation company as cozpared to its single modal
counterpar:s. This is due to the fact Liat the chan.e in this
factor made the single modal railroad, in most cascs, the do--
nant carrier. In other worcds this tst factor cha:;je, caused for
the tost part, most of the singe :.od,-.l traffic to Lcve by rail
except where constrained. Thus the for:;ation of a transpor-
tation co.:.:mv had li'tt2. effect on ;e .a:;,cr i ; ., ch -:, .2.ts
too- placu u;i2Lr thi, , ci u' cc , :.:Id hc-., e Cid ;not incrcase
profit contr!bution as In other siLur',iu::;.
.. _ .. . . ... .. .. . . .. ... ... . " -"= -- "'-' - ,Z .,- " '- --
.--- - T -" ... "- --.. ... ..L.-,-, Z- .. .. .-. -rs-Z "'t-- .. . ...- s rr,- . ... .r .,...
-143-
In most situations the singlr modal trucker would attempt
to compete with the single modal rail carrier in short hauls by
using Plan I moves. Thus the amount of Cwt. moved by the transpor-
tation company by piggyback was significantly reduced as compared
to the amount the single modal carriers mcved by this method.
This is because, under most circumstances, the rail mode was low
cost but piggyback Plan I was within the price range of competition.
Thus the transportation company shifted movements which the single
modal carriers moved by piggyback to rail. This correspondingly
explains why the change in rail load factcr led to a significant
increase in the amount of boxcar movements.
The significant interaction effects with rail operating' ratio
(DB) were explained for the various perfozmance measures earlier
in this chapter, when the change in rail cr.qating ratio was
examined for effects. The interaction with a lw level of shippers'
logistics constraints (DF) signif!,-intly reduced the expected
and actual contribuLion of the transportation cotpany as well as
the nuber of Cwt. moved by piggyback. The lower level of shippers'
logistics constraints allows the carriers more freedom in selecting
the methods of movement to salsfy shippers' demand than does a
high level of logistics ccnstraints. As such, the interaction of
high rail load factor with a lo, level of log1itLcs ccnstraints
produced the sane kind c ffect as the main effects of changing
rail load factor, only to a larger degree.

-144-
Attention will now be turned to examine how a change in rail
load factor affected the LTL performance teasures. The effects
of increasing the rail load factor was to significantly reduce
the expected and actual contribution as wFll as the price paid
by shippers and the amount of Cwt. moved by truck, of the
transportation company vis-S-vis .he single modal companies. The
reason for the significar.. decline in expected and actual contri-
bution and price paid is that the high rail load factor has the
effect of lowering the out-of-pocke: costs per Cwt. which is
directly related to the rate charge shippers (the fully distributed
cost), hence the price paid by shippers is less than in the single
modal situation. The full costs of the LTL piggyback movements iwere substantially less in most cases than the fully distributed '
truck costs. In the .single modal situation, the trucker would
set his rate at his fully distributed cost since he does not have
to participate in Plan I moves. This had the effect of raising
the profit contribution of trucker relative to the transportation
company because thL transportation company priced its services
at the full cost of the low cost mode. Even with this difference
in pricing between the systems, the transtortation zo.pacoy cut-
earn-d Cie sin~e mal CM-a- nC . The effect of increasing the
rail load factor war to decrease the amnount of expected and actual
profit contribution dif rtntial bet'1ccn the systcn-.s. Even so, if
one loohs at Table X, onc can -tc that even after subtracting the
effect!; oi this, factor fri'O Lit, aVeraVU. in the table the
... ... ] . ... . . ...... I1l7 i ' ". .. . . .. . .... .. . . ... , ,ig - .

' -145--
transportation company is still more "profitable" than the single A
modal companies.
It should be pointed out that the pricing actions of the trucker
differ substantially betwee!, the two classes of movement--LTL and
TL/CL. In both cases, the trucker does not have to participate in
Plan I moves if he does not wish to. The same is true for the
railroad. In the TL/CL market, the trucker has an incentive to
participate in Flan I moves that he does not in the LTL market.
In the TL/CL market, the railroad is competitive for traffic that
the trucker wants to carry and vice versa. Thus if the trucker
is not low cost he will want to participate in Plan I moves if
this is the only manner in which he car. obtain some contribution.
This is not the case in the LTL market. The railroad does not
actively compete .r LTL movements In the portion of the market
9considered In this study. Thus the trucker will price his LTL
services at his full costs ii all cases.
The result of increasing the rail load factor was to signifi-
cantly increase the nubher of piggyback movements and correspondingly
decrease the number of truck movecnts. This had the effect of s-gnifi-
cantly reducing the price paid by shippers which is due mainly to the
lower priced rail related pi&-yback substitution for truck move-ents.!9
9 1t must be rc:,mbcrcd that this study, In examining o;ly co_..ncarrier rail and tru:k :.ovc'aent.;, andi associated 1lan I aid Plan 1piggyback t:''c mrnts in both traffi' caLt. rics. To lend scmc crcc'(:to the above .tatcMr.&t t ' it railroads do r.ot actively see' L'fL ::C'e-ments in Pan i1 _O.C: "ic auLlbor Contacted L.e 3urlin 'I. a r :"C.rn-.Railroad to Jcter-':, . type of "raffic Lei;.- carried !n La' I!moves. Yr. Robert Dro;o~u in the "iCO-C ithparL:zc;t jt dcatcd ;'o::i-Ulatly 992. of Plen'. II :s arc IL lots. To do.,I'e chec C; i 7 y ',M rs. Ro,:::ary IIurJ 1- thi -rei zht r.AcntL S O' ; , ':as c ..n.. L. ., .1; S".0
plzic'd th:t' C!';t i::.:tC .f 95;; of t1e i ,lun 11 U ':rrnt ' ,c.re
Ii .W~' C~ Li,

The interaction effects with a change in truck load factor
(DC) which bad signific:ant effects on the performance measures were
discussed in the secion explaining the effects of a change in truck
load factor, There were two significant interaction effects of
an Increase in rail load factor with a reduced level of shippers'
logistics constraints (DY). The DF interactions served to
significantly reduce the price paid and the amount of truck move-
ments. This is due to the fact thaL reduced levels of logistics
conhtraints allow the transportatio:. company to substitute piggy-
back service for truck sorvice to a -,ter degree than a high level
of logistics constraints.
Efraetu or a Chsn in the ap of the ys tor on the
Pcrformance keamures
The effects which resulted from a change in the level of
the capaclty in the Pystem are displayed in Table XVia and XVIb.
The chonge in the level of this fu:;tor also produced several
aignifitai1t risults.
t. p(.tcd Cont.ribut tcn--Tlh rw:tucton in the level of system
Sca j'd,, Ly had 110 0iptc i;ih 1 fcct On. tht, e.xpced contribution
of Ow Lranv i, ortnai.ion cut .-;)nny ir. ci ; d to .hi ; n&'3 ( r~ndal
cohiptcn ln In elth r tih.' TI/Cl. or 111 cat.,dory of urjvvmol -. The
I it.. r it c wI t ! ,: w tL!v of tr .i. L, l i I fac:tor (iC) 1gn 1IfI it mt y
-1'titift t1V V4i-' II t'od con'.r but ii el L'th: t.rn.n , or tat. I :i copanmy
,i#i11,- v 1; Lt- ~ ~~l . ! l :r l !

* I I
.40
N. N 9* *W
;5 I~~ 0 00 to
4 ICU
4;e
~.'hI %
.0 p.4 w~ N% m N
N~~0 4.44P4. to P* e
~ .4

V% to% A m LONN N V% co 0N
t DMNN N 0%
* II
u m N ' ,
I I
90 r4 00('
S4 N N I Ico ' P % m t
.-0
& j 0 0 &I o
u4 0'
." , . .
'o H
S4I 0 0 V N
IN r%-4 o 40-
. q- * r4 1 - 94 c
t, 49 1 I .I , I
U I
,, xP...& .. 4 0 4
. , SI I
U- F4 5,41* I I I * * S l
0.1.4 ~ ''A ~ ..
KS~~~4 OA -A' 4 -
,.' .. 4 0 04 W . 9- . ,
,4~ 1% 9 Il4 u Ir .
U, IIII' , 41 r ' I .,
44 tn 44141
UsU
I U U
U L
I S
... . . . ... . . . .. . .. .. I .. . . . 4'" " I.-. . ../ .. .. .. . . . .. .. .. I ' " . .. .. . :' .. . .. . .. . . . . . . . .

-149-
Actual Contribution--As in the case with expected contri-
bution the change in the level of system capacity did not signifl-
cantly effect this performance measure in either category of movement.
The EC interaction significantly increased the TIfICL actual contri-
bution, the swe reaction it caused in the expected contribution
measure.
Price Paid--The change In this tert factor had no appreciable
effect on the price paid for LTL moveients. The reduction in
the level of system capacity did significantly raise the price
paid for transportation services for TL/CL movements. The
interaction with a change in truck load factor (EC) acted to
significantly increase the price paid by users in the TL/CL
category of movement.
Amount of Truck Mov-.ent.--The decrease in the level of system
capacity significantly incr led the number of LTL truck movements
the transportation company ade compared to its average usage of
truck movcmcnts. This test factor change had no effect on the
amount of truck moverents in the TL/CL raket.
Amount of Pi:,,;vlack :e.c..L--Thc change in the level of
capacity sniLiflcantly increased tht nunb, r of pJggyback move-
ments in the TL/CL ,arket. Lwhf].e it actcd to sig:1iftca'tly
decrea!we the amount of piggyback c3Vg(.I1Ls in the ILTL market.
The Intur-iCLI on with truck load factor" (!:C) acted to sLl lfc.atlv
2 I

-150-
decrease the amount of piggyback movements, while the interaction
with a change in the level of logistics cvnstraints (EF) acted
to increase the amount of pigg>lack movements in the TL/CL market.
Amount of Rail Movement,--The reduction in the level of system
capacity served to significantly reduce the number of rail boxcar
movements in the TL/CL market. The interaction with the reduction
in truck operating ratio (EA) significantly increased the amount
of rail movements. The interaction with a reduction in the level
of shippers' logistics constraints served to significantly reduce
the amount of rail movements the transportation company made with
respect to the average difference betueen the two systems or modes
of operation.
Explanations--The discussion of the causative effects of the
reduction in system capacity will begin with the TL/CL market.
The reduction in the amount of capacity significantly increased
the price paid for TL/CL movements, The reason for this is that
the restriction on capacity necessitated a greater dependence on
full cost pricing on the part of the single modal carriers. That
Is, in situation; ,-here the capacity was not great enough 'o
satisfy demand, as a result of poor market estimation and allocation,
the single r.odal. c-irriers could not nor did they vish to transfer
unMet tI'cmanc to the co.--cti tJv1c r-ode. The transpcrtation cc::.iony,
on t~h other hard, when it dd c:.ihaust the capacity of one rledo
wou Id ,;hJ f L th t L:;:' d :::'d to -o IAI.. r !:,(!thod of r-ow.ncn t..
ii

-151-
end result was that the transportation cotupany did not have as
much unsatisfied demand as the single modal carriers and that, as
such, the price paid for trunsportation was greater than that paid
to single modal carriers.
These findings are further supported by the fact that a change
In capacity resulted in a significant reduction In rail movem.ents
and a significant increase in piggyback movements. This resulted
from the fact that, in most situations, the rail mode was the
scarce resource. The transportation company would then shift the
unmet "boxcar de=and" to piggyback moves.
The significart TL/CL interaction effects with the change
in truck load factor (EC) on the various performance measures were
explained in an earlier section of this chapter. The interaction
with a low level of sh~ppers' logistics constraints (EF) sJgnJfi-
cantly increased the amount of pl;yback tiovcments and significantly
decreased the amount of rtl movements. This is the same reaction
as the main effect, the change in system c pacity created, except
to a lesser degree. This is as cie would expect. The change In
the level of logistics constraints ce.,trols the amount of traffic
which Is subject to JIntcr-;d, cc:- MCLjt1o:,. Thus th rcp;sulc cf
expandfi.g the co.petJij,;,. traffic :-.rkct aid reductng LW anu-unt
of capacity was to ca-,-c thc tranmpurLation ,:m~any to shift
competitive ,r,nd r.i:. scarce r',sourcc to a, availih]e next
most profi table z:uthc-? of LoLe!.L.

-152-
There were no significant interaction effects associated
with this te.;t factor in the LTL category of movement. 1he
reduction in system capacity significantly reduced the amount of
piggyback movement and correspondingly significantly increased
the amount of truck movements in the LTL matrket segment. This is
because the maximum contribution method, In general, was piggyback
movements in the LTL market. The scarce resource was also the
amount of flitcar capacity (See Table I, Chapter III). Thus reducing
the system capacity, in effect reduced the nurber of piggyback
movements the transportation company could make. The unmet "piggy-
back demand" was shifted to the trucking mode.
Effects of a Chnnre in the Level of Shipers' Ln,,-istics C:n.trai.ts
on the Performancu Measures
The effects which resulted from lowering the level of shippers'
lgZistics constraints are presented In Tables XVIIa and XVIIb.
The change in this test factor produced several significant results.
E.:pected Cu:r~ut~o:,,--In the 11./CL catcgory of moverenis,
the reducLion of the amount of traffic subject to shippers' logistics
constraints, sig:Jifcanrly increased thc CzpCcted contribution of
the transportatio:i compa:y over its SJng. e modal ,-ounterparts.
The interaction vith a .ha:ige In rail load factor (Fi) servud to
sign ifica;!'t1y 01CUCC /Cf. expecLod profiLt a.ure.
-Il

.4 VAg 4
IP
100
.93 w% V Vu. r . m
dig N
-of%pi P . I6 OvV4
1:2t
,.it'i 4
IM~ g9 g04 p4
.4 a4
M 40 r.* I
So 4
,,dai

%d in In 'M
00
as I.9" q 4 %a a
~ N 1 a1
054 *@
caS
uJk 0 'S n'
in r f % 94 Wm 1% %-1 .r VV4* 0% No m% 0 04
VA %n O0N
41 N 44 ''a 04 N '
, ,. , , , , , Lt. -, 4Zt l . I -. 4I I-I I I I
S-155- '
Actual Contribution--The change in the level of logistics
constraints had the same effects on this ;erformance measure
as it did on expected contribution.
Price Paid--The change in this test factor significantly reduced
the price paid for LTL trarsportation services. In the LTL Lategory
the interactions with truck load factor (FC) and rail load factor
(FD) served to sigaificantly increase and decrease the price paid
for LTL movements, respectively. In the TL/CL category of movement,
the interaction with truck load factor (FC) also served to signifi-
cantly increase the price paid for transportatipn.
Amount of Truck Move2nts--The change in the level of shippers'
logistics constraints had no appreciable cffect on the amount of
Cwt. novcd by truck for TL/CL uovements. In the LTL category of
movements, the reduction In the level of logistics constraints
significantly reduced the arzount of Cwt. the transportation company
moved by truck in relation to the single modal carriers. Also for
LTL movements, the interactions with truck load factor (FC) aid rail
load factor (FD) significantly increased and decreased the nutmber
of Cwt. moved by truck, respectively.
Anount if PJ' .'back..:"... ihe r. duced level (f loc'stic-,
constraints scrved to signilficantly increase the amount of LTL
6L. movcd by plggyback. The chan2c in this test factor hi; jurt
the OppofLic CffCLL GO Lhe 43 Qu;&L of 'i'/CI C',:t. ;o'.d by p,
r ,= :¢" "% %- ',," .-'-.. "c: := - -2. = -. 4 , .'- . .~- - s-..= - .*-.. - --...... .. ..

. ,
-156-
that is, It significantly reduced the piggyback movements of the
transportation company compared to the siL.gle modal carriers. In
the LTL market, the interaction with a change in truck load factor A
(FC) significantly de-reased the number of piggyback movements.
There were two significant interaction effects in the 'iL/CL market.
The Interaction effect with rail load factor (FD) acted to signifi- a
cantly decrease the nunber of piggyback movements. The interaction
effect of a reduction in logistics constratints with a reduction in
system capacity (FE) significantly increased the amount of ,wt.
moved by piggyback.
Amount of Rail!v-,nts--The reduction 1r the level of logistics
constraints served to significantly increase the amount of Cwt.
moved by rail boxcar in che TL/CL category of movement. The inter-
action with a low level of syntem capacity (FE) acted to significantly
decrease, the number of boxcar movements.
E.p]anations--,lI. of the significant interaction effects
caused by a change in the le1vel logistics constraints have been
discussed in previous sections of Ihis chapter. Therefore,
attention will now be placed o, the explaihaLiotts as to hDw the
change In this test LIcL r caused sjnJfJ(c:at nain effects in the
various performance i..ca.ures. she silificant a-in effects for
TL/CL movc...ints wil1 uc discussd fjr;t.
Wli the c.er i ,'c] of c gi :',cs co; *rzAAnts i. ',cd on LicO
S i.t|] .: ., t:, :;nda l-u ck r, ' . h :;It; 1.n0t tilc IC.: C -¢ S

~ / -157-
carrier, wculd try to compete for traffic whenever possible by
utilizing P'lan I movements or by pricing trucking movements at
the low cost method of movement. When the logistics constraint3
vere low, this meant cornsiderably rore traffic was moved by
piggyback In the single modal system than when the constraints
wete set at a high level (See Table 1, Chapter III). The
transportation compan7, when faced with low logistics constraints,
used the met*Aod of movct-,ent to satisfy unconstrained demand that
had the maxium, contribution. In a large number of situations
that maximum cnZ.1.t octhod of movcrnent turned cut to be the
rail mode. Fz-.r TL/Li. to-.': ents then, the change In logistics
conutralints ca--red the transportation compiny to use si-1ificantly
more rail m'ovements and less plZ ,ybiack movem.-c~ts than the singl~e
modal cairiers. This resulted in greater expected and actual
contributions for the transportatio-a con-janny than its sin~le. n odal1
counterparts because, I:a &eneral, the sinSIh rmodal cquipment
allocatiot, decisions di.. not result in the maxitgum systcm v;ide
contribution which the. trinportauion company did obtaln.
In thp LTL market sc,,-.cnt, the reducc~d level of logisticsAi
cons~traints found the tran'spo' .iLl CO-.;z'.iy shiftiig a significanti
amount of tunc'~nstrii:ie!d :.raffic, 0that tlc i 1 r.cz~ crrier.s
were moying, by truck, to p ba:oc:'t.Thetr~rain
company did tit,:s whe:, 6'; c3C;' nofp ;;hc1 :~oc~
greater than tha.t Of LTLC-. :OVc.- Altllcu .h thcu cp1-~. z.o~hc C!

-158-
in contribution as a result of a change in the level of logistics
constraints, it did decrease the price paid by users for transpor-
tation services. The reason for this is that, in most situatioas,
when the transportation company utilized piggyback movements this
method was the low cost (rate) method. Thus piggyback movements
significantly reduced the cost of transportation service for the
customers of the transportation company as compared to the cost
paid by users in the single modal system.
Sunmary
Because of the length of this Chapter, a brief summary of
the important results is appropriate. To begin with it was found
that most of the average differences of tle performance ieasures
between the transporttion company and the single modal carriers
were significant. More specifically, for TL/CL movements it .as
found that the expected and actual contribution of the transpor-
tation company were significantly greater than the sum of these
measures for the single nodal carriers. Furthermore, the transpor-
tation comppny made signiflcant~y loss pl;:gyback movements than
the singlc modal carriers. In the LTL catcory of t'over.ents, the
expected and actual coniriLution of the transportation company
was again s gnificantly larger than the c.,abined contributions o
the single rodal carriers. The transportaLiCn c ,mpany also had
the effect of significa!tly ruducing the price paid by zhlppers
for LTI. tra.--;,porratic:; !c:rvlcc-s. Ic tr;,n.portation co:,A; bl! *.ode -
• - --

-159-
significantly fewer truck movements and significantly more piggyback
movements thin did the single modal carriers.
The prime consideration of tblis chapter was the identification
and explanation of the manner in which the levels of the test
factors effe:t the average performance measures. The chapter
presented the analysis of the effects produced by the six test
factors, for each level of the size of ship7 ents parameter, on
each of the performance measures. The results of the simulation
are graphically displaycd in Tables XMla through XVIIb. The test
factors prod-aced several significant main and interaction effects
in the performance measures.
The following tables recapitulate the significant main and
first-order interaction effects. In the tables an arrow pointed
upward (f) Indicates the effect increased the difference between
the performance easures of the transportation company as comparedto the single modal carriers. An arrow pointed downward (+) indicates
the effect decreased the difference between the performance measures.
The absence of an arro-,, indicates the factor or factor combination
had no effect on the performince measures.

V.44
0 4404
ad
4 a
4.4

4 4
I4j
O'd 0
.Fri
'JR in

S ' 4I .I,
-162- '4 I I ;
9 Economies of eal,
One faqat of th possible economic advantages a transpor-5 I *
tation company might enjQy over its single upodal countirparts thdt
not directly considered in the preceding inalysis is the
possibility of achieving .economies of scile as a result of com-
bluing two different modes of transportation. As indicated in 5
Chapter I, there is wide disagreement on the part of transpor-
ration economists to whether or not a nulti-modal transportation.'lI 4 . l
company couldachieve signiticant economies of scale. The disagree-
iont centers on the question of how similar are the operating II
functions of the combining modes 'and is there enough sImilarity
to allow' the transportation company to centralize ftnctions and
elminate. duplicative functions, and so forth. Thete kinds ofI I
questions 4iiX be addresied in Chapter VI. As will bb pointed
out in Chapter VI, there really has not een enough research Jone
in this area of the transportation company concept tb answer the *
question of whether or not there are substantial economies of
icale to be bbtained from combining separate modes.,, ,*
'How does the fact that economies of scale were not directlyI II
eonsidered in the analysis affect the. results of the study? To"
understand what effect this has on the reaults of the study, oneI " I S
mt know exactly how tho simulation considered acooies of "
scale, The cost data, for a given sot of paramtors, which -the
Atramportatidn company utiltzod to make prfcfuig and equipment
allochtion decisions was *xa~ctly the saml'as the coat dataltho
I * II
I II I

-163-
single modal carriers utilized to make their decisions. As such
the fixed and/or common costs, which are the costs which economies
of scale would effect, for each method of movement were the same
across the two methods of operation, i.e., transportation company
vie-&-vis single modal carriers. In essence, this means that the
transportation company considered in this study was operating
with no realized economies of scale resulting from the combination
of two separate modes of transportation. This conservative approach
to the econonies of scale question means that the significant
effects described earlier in this chapter would still be valid
even if there were some economies of scale involved in forming
transportation companies.
Te reason why the results of this study would remain valid
even if there were substantial economies of scale involved in
operating transportation companies is because the nature of the
performance measures which deal directly with costs and rates
are based upon the total contribution to fixed and/or common costs
and profit margin. Thus, while economies of scale may significantly
effect the profitability of a transportation company, they have no
effect whatsoever on the contribution which was used as a measure.II
of economic impact in this study. One mv, however, think of the
total contribution as a measure of profitability. This is because
the same fixed and/or common costs would be subtracted from the
total contribution. Thus if It were finally determined that there
were no economics of scale to be obtained from the formation of, iA

-164-
transportation companies, the results of this study would be
directly applicable. If there are some economies of scale, the
sigrificant results would remain significant. If the economies
were substantial enough, they may have the effect of adding a
number of additional effects to the significant list. This is
because the economies of scale would reduce the fixed and/or
common costs as compared to the sum of the fixed costs of the
single modal carriers. Thus increasing the profitability gap
between the two organizational approaches.
As stated previously, further research must be directed at
determining the extent that functions may be combined or partially
eliminated In multi-modal transportation companies before reasonable
estimates of economies of scale may be made. Thus the performance
measures used in this study avoid this uneasy task and yet provide
valuable information as to the economic impact a transp'ortation
company would have.
The Significance of Interaction Effects
Because there was a number of significant interaction effects,
47 of 330, a discussion on how these interactions have been inter-
preted is warranted. It will be recalled that in the use of the
fract.onal •actoral design, the main effets and first order inter-
action effects are confounded with higher order interaction effects.
It has been assumed, as stated Chapter IV, throughout that the high
order Interaction affects are zero. That is, in the explanations
of hov a chitnge in the factor levels "caued" thc significant effects

-165-
it has been assumed that the aliases of the main and first order
interaction effects are zero. This autho believes this
assumption to be reasonable. The reader is left to his own con-
clusion about the validity of this assumption. At any rate, if
the reader is not inclined to adopt the assumption the investi-
gation has at least identified the groupings of possible inter-
actions which have caused the significant behavior.
Another matter concerning the rejection of the null
hypothesis, that an interaction effect is zero, deserves some
attention. If an interaction effect has been determined to be
significant, is the rejection of the null hypothesis concerning
the main effect of a component of that interaction effect
meaningful? That ii once an interaction effect has been found
to be significant can the main effect be considered and if so
Is it meaningful? Guenther states that if the interaction is found
to be significant, the main effect can still be tested but the
results of such tests are usually of no interest. Guenther goes
on to say, "when interactions are present, the best treatment
combinations, rather than the best levels of treatments, are
usually the prime concern".7 This may be true in most experi-
mental settiigs, but this is not the case In this particular
project. The reason for this is that the object of this
dissertation is to obtdin a broad picture of the effects specific
factors have on the operating characteristicn of a transportatiot
7 uentLer, . p. 103.
'0110 Al ii O " '

I
-166- -
company. The intent is to show over the spectrum of possible
test factor levels the effect these facto:s have in general on 3the operations of a transportation company as compared to the
operations of single modal companies. This kind of broad or general
information would be useful in focusing attention upon a possible
change in public policy as it pertains to multl-modal transpor-
tation companies. That is, policy makers would be interested in•I
the main effects of this study in so far as if there were a changeA
in policy It would likely be general. That is, the Congress orI
th-t I.C.C. would be interested in figures as to how the transpor-
tation company concept fairs over tho average level of the factors.
These are the main effects. The carriers or. the other hand would be
interesLed in how the specific levelo of the factors affect the
performance measuren. In oth-r words the carriers would want to
know how they would benefit from the creation of a transporLat Ion
company with the specific levclst of the factors the intcr !nted
carrier have. ThIs study provides both of these Inforatioual 4
requira:wwto. 'hum both the rlgni l cart 1ntcrsLction and main
effectpl of' tL Ii tud ll, ta - f J:'terc;'t.
1.i

) -167-
CHAPTER VI
OTHER ASPECTS OF COMON ONERSHIP
In the last chapter it was found that the formation of
transportation companies can result in economic benefits for both
the providers and users of transportation services. Before one
can really interpret the meaning of these reoults and outline the
implications they have for the transportation industry, the signifi-
cance of the economics of common ownership must be related to the
other aspects of the issue. As mentioned in Chapter I, the
question of whether or not transportation companies should be
established in a multidimensional issue. That is, the formation
of transportation companies involves economic, legal, and social
issues which must be resolved before such companies can be
established.
The purpose of this chapter is to identify the other aspects
of the transportation company concept and discuss their relation-
ship to the research accomplished in this study. This chapter
consists of two parts. The first identifies the obstacles which
currently bar the establishment of transportation companies in
the United States. The second section of the chapter relates
these obstacles to the research conducted in th15 ntudy. The
implications end Interpretation of the results of this disser-
tation in the light of the total aspects of the concept will
be reserved for the final chapter.
WW

/ -168-
Obstacles to Integration
Sampson and Farris have noted three types of obstacles which
stand in the way of integration in domestic transportation. These
are regulatory obstacles, inherent obstacles in integration, and
1environmental obstacles.
Regulatory Obstacles
In this section the National Transportation Policy, the laws
applicable to common ownership, the case by case development of
the I.C.C. criteria for determining when a railroad may own a
trucking company, and the role of the Department of Transpor-
tation will be analyzed.
The National Transportation Policy (NTP)--The National
Transportation Policy, as stated in the Interstate Commerce Act
is as follows:
It is hereby declared to be the national transpor-tation policy of the Congress to provide for fair andimpartial regulation of all modes of transportationsubject to this Act, so administered as to recognizeand preserve the inherent advantages of each; to promotesafe, adequate, economical, and efficient service andfoster sound economic conditions in transportation andamong the several carriers; to encourage the establish-ment and maintenance of reasonable charges for transpor-tation services, without unjust discriminations, unduepreferences or advantages, or unfair or destructivecompetitive practices; to cooperate with the severalstates and the duly authorized offic~als thereof; andto encourage fair wages and equitable working conditions;all to the end of developing, coordinating, and pre-serving a national transportation system by water,
ISampson and Farrio, gopcic., p. 332.

-169-
highway, and rail, as well as other means, adequateto meet the needs of the commerce of the UnitedStates, of the Postal Service, and oZ the nationaldefense. All of the provisions of this Act shallbe. administered and enforced with a view to carryingout the above declaration of policy.2
After a careful reading of the NTP, one can conclude that
there is nothing explicitly stated which forbids the creation of
a transportation company if 'the creation of such a company could
be proven to be "beneficial." However, in the phrase fosters
sound economic conditions in transportation and among the several
carriers, the term several carriers has not been interpreted
by the I.C.C. as a reference to the carrier industries or modes,
but rather to the protection of the business stability of indi-
vidual carriers (firms) of a mode.3 Also, to preserve the
inherent advantages of each mode implies a sacredness of division
or separation of each mode from one another. Although the term
inherent advantages has never been adequately defined, it is
usually taken to mean that each mode has some unique character-
istics that enable it to offer services for transportation users
which other modes cannot.4 This statement should not, however,
prevent two or more modes from combining services to create
2The Interstate Commerce Act, (Washington, D. C.: Govern-
tent Printing Office, 1968), p. 1.
3National Transportation Policy, oocit., p. 37.4Locklin states that the low cost carrier, on a fully distri-
buted coat basis, has the "inherent avantago". (D. Philip Locklin,Economicsof Traj.potat io ., sixth edition, (ilomowood, Ill.:Richard D. irwin, inc., 1966), p. 865.

-170-
some new inherent advantage, but the implicit language of the
NTP does not seem amenable to such a cons deration. To sum
up, as one scholarly and oft quoted source puts it, "this state-
ment of policy, at least as it has been interpreted, has not
gone beyond the frame of reference of promoting the stability
of each mode as a basic requirement for a healthy and satisfactory
national transportation policy".
Applicable Laws--There are four mutually exclusive ways
in which a railroad and a trucking company may form a transportation
company. First, the tricker may acquire an existing railroad or
secondly, he may seek new rail operating rights and,.if granted,
build a new railroad. Since trucking companies, even the largest
ones, are much smaller asset-wise than railroads, it is unlikely
that either of these possibilities would occur. The second method
would be even less likely since the rail mode already connects
all manufacturing sites of any size. More likely methods of
forming the transport company would be thirdly, for the railroad
company to acquire an existing trucking firm or fourthly, the
railroad company could apply for new trucking operating :.'ghts
and if granted, purchase the relatively inexpensive motor
equipment.
If either carrier attempts to merge with the other, they
must receive specific approval from the I.C.C. as outlined in
5National Transportation Pollcy, op.cit., p. 37.

-171-
in Section 5 of the Interstate Commerce Act (I.C.A.). If the
railroad requests new.motor carrier operating rights, it must
obtain a certificate of public convenience and necessity as
described in Section 206 of the Act. If the trucker wishes to
construct new rail lines it must be granted permission by the
I.C.C. under Section 1 (18) of the Act.
Since a trucking firm has never attempted to gain control
of a railroad, there are no precedents which have been set by
the I.C.C. and it is therefore uncertain as to the posture that
the Commission would take regarding such a matter. If the
Commission had developed a generally appropriate decision
criterion for determining when transportation companies were
desirable or "in the public interest", it would not matter which
mode requested the merger or new operating rights as long as
the proposal met the criterion.
There has been over the years, on the other hand, numerous
attempts by the railroads to acquire control of motor carriers.
As a result, the I.C.C. had developed a very explicit standard
(perhaps unacceptable) for determining when a railroad may acquire
a trucking firm by means of the two methods for doing such as
mentioned above. Section 5 (2) (b) of the I.C.A. contains a
special proviso relating to rail acquisition of motor carriers.
This proviso stipulates that the Commission must find, if the
applicant is a railroad, or owned by a railroad, "that the
transaction proposed will be concistent with the public .,itrest

-172-
a.d will enable such carrier to use service by motor vehicle to
public advartage in Its operations and wi.1 not unduly restrain
competition".6
To ensure that the above proviso is met, the Commission has
evolved certain standards based on case precedents to apply to
such proposals. Much of the following sunmary of the specific
precedents was obtained from a study by Byrron Nupp. Thefirst
case was the Barker Case (Pennsylvania Truck Lines, Incorporated,
Acquisition of Control of Barker Motor Freight, Inc., 1 X.C.C.
101 (1936) also 5 M.C.C. 9 (1937) and 5 M.C.C. 49 (1937)) in
which the Ccmission decided to restrict or confine rail
operated =otor service to that which is "auxiliary and supple-
mentary" to that performed by railro.,ds disallciw .: t.uck
servkle which would be stricty conzetitive with the rail operations.
The hansasCitySouthern Case (KansasCity Southern Tran,"port Co.,
Inc. Co.on Carrier Application, 10 1(.CX. 221 (1938)) ext.endcd
the Barker Ddcrrize to original certificntes of public convenience
and necessity noL covered Jn.Sccrion 5. This case further re-
strctel rail. o'.- d truc. -.ri.cc to poit., on the r: il lIne,
aid to ihlIa.(rL; c(' ved ot d,.livtvrd by rnI, anid disallwo':ud
trucI nurvicc btt:{cIn "4v poi:ntu" ou Use raiJ. line., SiiCr- thu
K|,sIIln;[ C1ity Foutho'i Atit! 1.,I'rtur Cxrt,:,, v lvv,rL1 Sup r :.;., CuurtL
I,
ih iL i ' ' .. . ., AT ,|s ** '. I . (. .. ( ! =' =
9 J lI * . 9 "' ! , ' 9 , 9 ,, '" ( . ;
~III,. J, , , . I i ,

473.
cases (U.S. at-al., v. Rock Island Hotor Transit Co. et.al.,
340 U.S. 419'(1951); United States v. the Texas and Pacific Motor
Transit Company, 3.40 U.S. 450 (1951)) havc upheld the Kansas City
Southern Doctrine.
The Commission applies the above standards in merger cases
and In cases where new operating authority is sought. A very
important point can be drawn from the above anz.1-sis. As Nupp
puts it, intermodal combinations have beent treated more restrictively
IIthan intramodal combinations because in addition to the usual4
4."public Interest" test, addition~al criter--.a have been established. 8
These restrictions were spelled out at a time when railroads held
considerable monopolv power aiud Later wheii tle truclgin; industry iwas a stru;Zlin- flledclin-. This is clearly not t1w~ situation
now. The recent deterioratin& econoric sItuation of a number ofj
merica's largest raihroads can bear tusti.=mo)ny to this fact.
The I.C.C. has then strictl~y Int. rprt~ted the law as stated
in Section 5 of the t.-C.A. and "tno Jntenvt appears to be more
I ~ nearly to in~sure thrit cach jznodek rema.ins In compe~tlticn with
the others rad to itroserve all rncdcs,- ratctr thun to Frovide
the me.anrs fur 4dzyLi-.j Oki: to placts fla i nctord vith their relativ:e
eC(,ncjr-JC c.q i;' l HiLI a:." . Aio I I,,:: soirce conrlc I'cs ,
l.thnLthe Ow, r!' or H.- pre'nent rr ~ulataryPol r...y I~ :; t- j*.: c'JVr L".1. fi. ( i f
)'.. , p~. 31

* 174- , .9,r- r -=-..~~
4
I - .. a general program of preserving the s.tatus quo .--
which is in direct o positiun to the overa]lobjectLive of a d:'nanic transportatioL system
which can best serve the eccno-y and defenseof the country. 1
0
The Role of the Denartment of Transzcrtaticn--One of the
functions of the Departm.ent of Transportation as.-stated in the
Declaration of Purpose of the Departmant of Transportation Act...
is to provide general leadcrship in the identificat!Qn and solution
of transportation problems. As such, research into the concept
of the transportation co;'pany falls under the jurisdiction of
this Department. A search of gove;I:meut docuzents.or literaturereveals •that as of yet the Departmen;t has not published any
-materizl related to rese..Irch on the transportation company concept.
To determine if any work was currently belng-done on the subject
the author-wrote a letter to the SccreLar' of. "ransporta'tion
rioquesting information on research wzhich the Department had done
or is currently doingoris plnnin* to do on th subj.ect. The
reply was ncgative.
Inhcront Obstacies
As alluded to In the pre'V;ou5 secticn of Lh i 'chapter the
formation of transportaticn cvpa:: '.:.uld rcfuire volun'ary
action on Li c part of the particip .,.t. x Sa=pson and Tarri.
put it:
110: c,:. Tr - ti' :'.,ri : ol; ,', or.,it., p. 38.
' ...I . . 2_
I11

-175-
* Agreement .ar.onp the firms boe.Z mercd or bcinz InIto&rated is aot al".iyas vcs Since :.an are ccrporations,=4n dn, cerors uith Idivoere noals anc, Objectives mustbe satisffied. This Iia':clvos bcrh it.bt and ceuitv ou-nrs.Manap,,mrizt itsali may. di sarue. it is not easy 'to mer~coneself OLIL of a job, and a .r-orjed f rm can have but onepresldeint and set of, administratiNvC cificers. As wehave soz~n, acjust inrt in tnhco~t pariod a reailmost incvitabie ulzc- unificatioa or irt.-gr.tiontakes placo....The tendeucy to avoid ajustmort andchange; Is 'gruat in cll usiness..,s, and in some of. theolder transPortation fir=S 01his inertia itselfr i. amajor obStaCle. 1horefore, rhere are! obstacs. in, thevery idea.,.of Inte-ation.11
This conclusioa is supported by Carmane, Glaskowsky ard Ileskett
whcn they f')Und:
There is a stronrg tendency for railrc-ad exccutives tothink vitLIC,:V ia . ;4 a Ira'r; fo. trc-n
* ccnIpany ex<ecutives to thiiak only in tannis oi tuching,etc'. For, exxmn.;iC, j,, was n~o asy thinz for some rail-road e:xccutive-E to >.-arn to thinlk in. terms~ of opra~icin
* a coordinated service in parrnerc*;n uith trucers, agroup long de scrlbed by some raIroalftrs as "hereditaryI eeiies, a~tn- o the devil", or even -StLronger term:.sof opprobrium. Cai the other sida-, varicus trucking
* . .. executires have b-ecn de-eo1v suspiciou~s of railroadcrsand their motives ini offtrigp:b.c servlee. Thcseunfavorable rnilr-aadUr and .tru:k:cr attitud.:, have ser".ed
*1 ~to Slow theDevClont of coordinato-d servicc.
* Eveti when~ thure is . .. no inhercnt ar.imcsity betureen theranagerient groups ceniccerind, ... there sti3.1 re,:ains the
.. prolpl:s of co:mnunicantions. 12
Whil G~r~a:.Claskousky, and 1!cskvLtL were takn specifJi..dly
about c cord inat.Ld survices, their dis--ussion sce;:m., equally
app31ic:,;;)3r ,o tho cormon c.vlLrship .cd' .
111

-176-
I Environno.ntal Obstacles
The very nature of our poli ti cal and economnic system may
pose another obstacle! to the formatio oftasotto c~ es.
Again Sampsoii and F'arris have succinctly stated this proposition
as fal1oo s:
... The economic e-nvircon-7;ent of tht; nation is quite.oriented totuard indi-idual fir.-.s a:-d connectticn.Unification caid in'I czra .ion in volv2 -'rO*1z ac tio0.non the p..rt of firis and oftea a dccac' in com-ptitici. This may pr .escnz an obrtacle.
From' another Doi-nt of view, the political. Climatemay be. a ve~ry real ob'netl .stace. Iranspor-tation sysrc::n.-s srve nr.. ton."'S,. COU*i..!i,, andstates. Fach is a political unit with it.s rcnre-scntartives cleczecd to promote the Iwefarc of eachparticular Sovernn1a±1 UniL... . epolicI C~I;A-Smuay .cr Dos a [inze~ration) not bec-use it iseconoically unso-und, bu"" beca'Use it is Politi4.1call,,expeiient Lo do sc. The political c31ate, thcn,may i~apose a very real obstacle tt6...inr:ration1.' 3
Relnticnshl;?, cf this Stucdv to the C'stz~cleS
From the above discussion it is zpparent that there are
formidablu obstacles which pr:esent barriers to the establish~.ent
of transpcxtation co-F.panic-s. This the!ris has .detionstrated for
tse f jrst tivne that thcre. are. eefinita cccnctnic advantaftes
rLSUILing; Ircn the forma'tioul of transj;ortati cn cot-panias !or
both1 the carricrs and Ltce wut:S. Is this kn~idcsuiicic"t to
r.ove the c o! :r..!jicnc 0SaCC;S LO c~~e~h
nndn a Yaris j.. 1. .. 1)- t
-177-
3efore this question can be addressed, the author must
acknowledge however that the research was undertaken in abstract,
that is, apart from the real world. Thus before the conclusions
Of the study can be translated to the rea. world, the critical
assumptions of the study must be analyzed for their impact. As
will be seen shortly the validity of the assumptions cannot really
be determined without further research in the appropriate areas.
The following discussion relates the results of this research
to the obstacles which bar the formation of transportation companies.
Attention will be focused on: (1) the need for further research
on the common ownership question and-how this needed research
is related to the-critical assumptions made in this study; and
(2) the impact the knowledge obtained in this study may be
expected to have on each of the obstacles to integration. The
discussion will begin with inherent obstacles after which regu-
latory and environmental obstacles will be addressed.
Relationship to Inherent Obstacles
The focus of this dissertationhas been on the determination
of the economic feasibility of establishing intermodal transpor-
tation companies. The hypothetical firms modeled in Chapter II
are assumed to be capable of effect:vcly .rganizing to obtain
their goals of maximizing their (profit) contributions. This
brings up a series of questior.s which are concerned with what
Q . may be called the mant.eri al feasibility of establishing

A1
transpcortat-au co;:ipacides. T!4-e managc.zIal fLsiL'ility of t ranspor-
tation compaiies raises r'Losticons of not only is it possible to]
organL-e And. oparate a multi-cuodal transportation cempany, but Iwhat is, the best method of ogniing a transport~ation ccon'*any
under a given set of .circumstances.- In tL~e follo-in ragapA
the author h-is posed a set of questions in the areas- or or~ari-
zation, operations, marketinZ, a,.d finarcc. tihat should be zst:erd
before atten~ts are mad a to CStablish mu1ti-moda1 transportation
companiez. .tt should be pointedi Out that the author does not
a oses t the lists of questicns, 'are complete .but shculd -ive the
read--. in ap?reciantion of the arzouat oi rc search re~maliing to
be accor.plislhed..
krt.nIzaionzil AI-terni :v-Tie qui.e;tlcns that must be
answered In Ois area are concerned with-the extent to u:hich h
company should bo prganized functionally as opposed to orgnizJ~n:
allong Qod1a1 lines. "lle Author Poses the .:ypothesi-, that, ifjthe transpor:ation com-saes are, or'~ned~ alonz-mod-1. ines and
each zode is operated as. a pro.fit center, .the tr~wrportatlon
or.-rpan-.- w;'J. not achieve the cecncmics. 7rcm posr.-!L: r~Uo'4.C-
of tr~affic f:L.m. high to 1-. co-;L ca"rcr 1t;.t are pessible
-Ithiourh afu:ict.ionll2 orga'e co CL.zn. jliiz seii'.; :zsj."e
because the ::Od-a1 profiL CC:1tt'rc would be. att ptin- to :2 e
profi J~ L:; 1:1 tir ovm areas wilthout -. Z rd Lo thce oblecrIve of
totlp(1 L:~ ri :!,%- I or I fi rr. Az; rc lt I. Lha

-179- :transporti~ii company or;;anized alon- m~oda~l lines would notj
result In snahfca:it econo:'ies, as was t.Le case in this study
where the objeccive wis totz4 firm-ulde profit maximization.
-Obvlously iztrsarc not this simple. Oae must determine to
vhat cxtent the organization may be functionally organized.
That is, in eOach N=tional -aroa, -It t.-uat be JcLLr-.ne3 the
extent 'to which the cipcratic.ns of the ::.des can be co.,bined with
the object Ii mitid 'of- mxiizin. the total profits or ccntri--
bution of the -firm as a whole.j
pcraEti6.S---Lhere -nre several quesciens Lhat come to rdiud
which. must be answered in this- aica. To What, CXLCet Ican or should
ruaiiLLCei~uct faiili ties be com.bined? V~ow will the ocperactnt, of
more than oc~e tode affect the schadul.nr, pro'ble.-s of transpor--
tation? Isliz~ will. be the effect on the ccmm"unicat-Jons system
of the firms? What are. thc izpaCtW of containerilzat'ion?
jrlein5--1-at Impa~ct will t -transportLatic-n company h,-:vc
on service 'offered, to cust6mers-T low: will thc fornatioa o1
transportati on coumpanies afctth(: fz-~ i y equan cy,
and speed of service? Sho:.3d' the ce:.-pa-gy prictice consu'1tative
markati-.n x~d If so ,o M:ii :zcn . at is Lho 1=portance 2c:~
on s2N;k ri. sarvicc 1:y s*;,Ip,,,Xr:;?
Tin~ci--Vi~r ni i:f~;t~ ~..l bt ., IlI such a co:-.x.,:y.
place on -,1(!zn f ~~c - itrol .uct -. ? iityc o'~e f i-fer-

;.-180-
Labor elatLions--ill the unions concerned violently oppose
the formati:n of these con..zanics? howw wi..l the top management
people be chosen in each futLctional area? 7
As indicated above, the list of questions is not a completer
list of all r;atterz that must be investigated, but should give
the reader an appreciation that a great dual of though nust be
given to the question of whether a transportation company is
managerially feasible. Assuming that these questions can be
resolved, hcw can the knou-ladcd galned from this study be
expected to affect the inherent obstacles?
The author would argue that the pote-ntial profitability of
transportation companies should act to reduce the inherent barriers.
Althouth the vested interests of single modal managerants may
not entirely disappear, the prospects of increased earnings for
stockholders of single nodal companies should act to encourage
the formaticn of transportation companies, given that the other' " "" : 14
obstacles can 1-e overcome.
ReXLt iv:,shi '. R egu.atory Obsacles
In the conduct of this investigation it has been assumed
that the I.C.C. would retain the role of protecting the public
interest a'.-r transpor'e,-lo o wre fon.i-d, This is
a4!iiis: prcpCuitiiur, S .'rteo, e some:.:tat, by C.r.:., .
" - " .. ?. 72).I _____ ] vIt:l:;p o .*: L:::e'~ £ t.
I . ",,___,

-181-
15
a completely reasonable assumptLion. Of more importance is hcw
will the Coz.:lission react to the information &tnerated by thiS
study?
The National Transportation Policy (.'.Tll) directs the
Co=Ission to prctote economical and efficient transporLt-cn
services while zaintai:.ing the In icrent 6dvantarCs of cach tmCk.
This study has shovn tr.at a transportarion company, with the
objective of "profit iaxi: zation", is economically superior
(at least for son:e test factor co:-binations) to its single .odal
counterparts. The tranrportati on company echieves econozies
by the allocation of the nodes to .-oVcemnts for which th y are
low cost and/oi the ma.'.u= contribution i-ethod of rnovc=.Cnt.
That is the tra.sportation company uses the modcs On the route
segmccnt in which they have the "inherent advantre".
It is the authrs ophion that if the I.C.C. were ccnf'onted.
with such qunnLitativo!y docu'ncrtcd infcrmation the Co-issio.1
would be hard prsse~d to deny thlar such a company would not be
"in the public intereSt".
lhe r.jor o;nvirc:iintal obs. tcles which n.ay pr.vc.n the
formtI:, o: tra'zpor:atioi c:p.:; J: .dii Co:nt eticn that
the ,;za.'A of L,¢:, cc .. ; :,ct to c'~duct: co::icrp::t'-'ticn
" , tl' Q v L--
.....................................

-182-..'
and correspoudintly result in the elimination of soze facilities .
and jobs in some locales, It is not clear that the formation of II
transportation companies woaid result in less conpetition in
the transpor*atlon industry. Whqat has been determined in this
study ils that a transportation company "ould use the modes in .
a d.ffercnt manner than they are being used currently by single
modal carrles. The dif..rent allocations may require some
relocation o' facilities but, until the extent of possible
econodes of scale can be datermined, -it Is not certain :hat the
formation of tran.portation ccrpanies .il result in the i
elliination of facilitiQs, duplicative jobs, and so forth.
It is unlikely tlat the creaticn.of a transportation company
would result in the eliminaLion of facilities, duplicative
functions, and so forth, .o the same 4ireo that occurs when
two carriers of the same mode are mrred. At any rate, the
I.C.C. is tha arbitrator of what is in the public interest
and as sucl nust hear the. testimony of those who. would oppose
the fori.ation of t ransport.ILon compai.'es. To the extent thaL
the creation of such companies would result in the .limniatcn
of facili.ie:, jcbs aud so forth, will dccer.inc th e .ppositicn
to . r.nspor ,i t ion c~ip. i*.. by- locale. ,,, poli ti ci aus., unions,
othcr cL-.")c-tn . F-I.n'lc modal carriers, and so forth. The end
result is ti!Lt, e tho!:O.h this stud:' ha., in:dicat:&c the
pOt.:,th: l econ .-. . ,vt...-.s' of , rt. on . ., -.- ,
fict I3i.l: 1 LtL. i::.p .• tOf 01C
]r :v.: . :'. '.::I.[L. .au:apaat .. S L.me lL'aS'+a€.]. Ol W.I

~-183-
I" environmentc. obstacles. Thus the Counssion will have to
balance the economic advantatgas for the t:nsportaton
companies against the economic sacrifices which some people and
locales may cuffer.
It must be pointcd out that further research Is required
to determine the extent to which economics of scale may be
obtained by forzi i' tratnportation ccmpanies. The greater the
economies of scale, the greater the uconomic benefit t. £ormiug
companies bvt correspondl- ly, the magnitude of the econc:ies
of scale i rc inversely proportional to tho economic sacrifice
some people and locales will be required to make. That is,
>1 I . the tore cccnonies of scale the compony achieves, the greater are
the reductions of facilities and jobs.
This chapter has placed emphasis on the fact that the
economic aspects of co±-,on ownerhip are but one facet of a
.ultidir:enslonal problcm. The cl.c pter:has not attempted tostate all areas of the concept w-hich need future Investiraticn
N' but has attcr.pted to list iicportaht, areas tha&* require further,
thought. The follorjuLg chapter uill interpret the result.;
of this study with respOcc to all Lhe issues of cor:.zor. c-':,er-
ship a:id Lt the Implications for tile* future Of the concept.
I.
I~.

-184-
ClIAP2ER VII
CONCLUSIOS ANL IMPLICATIO.S OF THE ST'UDY
The results of the simulation were discussed in Chapter V.
Attention was focused on the rf~ects upon the perfor;i.aace measures
produced by the test factors. Chapter V also described how the
average perfor.,.ance tca-urs differed. bet-cen the single modal
carriers and the tiansportation company. The analysis was .ainly
concerned with describing the i.atute of the effects and -dis-
cussing the model orerations wh"ich caused the.. -Chapter VI
identificd otlier aspects of the transportation conpany concept
and related them to the research accc:r.plithed in this study.
The obstacles %hich currently bar the establishment of transpor-
tation copanics in tha United States weore discussed. Chapter
VI also indicated that there was a need for further research
(other than economic analysis) on the concept and related the
need for this resezrch to sor.c of the critical assumptions
made in this project.
The purpose of this chapter is three fold., First 'the results
of the research will bt brou,1.t togccher in one convenient pl.ce.
Sccondly, the chapter will futur'. avenues tf researich
which sh1.ould bc Pursued. The "osted r prc%. od in
this chapter is c.rned w Lh c:W1 en0ionz of the simulaticn
modc-. This diffur. frc-a th,.. r.sezrch ,'cat, prcs ,;ted "n

.4
-1!85- ..
'1the last chapter wldchi were concerned with matters which were
external or not cotsidered In the simulatIon. Finally the
ImpiLications of thi-s research projecc for the real world con-
sideration of transportation ccmpanies will be presented.
Suma__% of t!-e Research
It was found that most of the averaie diffrence.s of the
perforimance reasurcs between the transportation ccrnpany and the
single modal carriers wer_ significant. More specifically,
for TL/CL mo:ements it was fQ!-end ti'at tha c-:e,:ted and actual
contribution of the transportation company was 11% greater
than the sum. of these mcasures for the sinle uma.il utricrs.
In the LTL c.itegory of movements, the expected an- actual
contribution of the rranspora:ion compan: was 17% larger thar.
the combined contributlons of the sir.le -..odal carriers. The
transportation company alzo had the effect of sini'Icantly
reducing the price paid by shippers for LTL transportation
services by 12".
The prim.e co-r d cration of the research was the identifi-
cation and c:;pJ~l .nai of zthe =nnr in w 1 c h the lvi-ls of' the
test f.ctors arf,-L a , ,.rf,.-.:.-xcc -- cnizurc-q. TLe
analysis of 11C cfrCeLU; producad by '.he ..'x t fct izLor., A""o
each l*v(:] 0! the I:,, of sh'':':.t p::r,,:c.tur, revoa:l.vd undcr
what operatin-.; co:dt'u (t,:t factor 1:ve1::) the t

company was "economicall y superior" to the single modal companies
and vice versa.
The major results of the analysis are presented in the
following statements:
1. The reduction of the truck operatin- ratio from 99%
-t 91% had no main' effect on the performance of the
transportation comi~any or the sin-le modal carriers.
2. The main cifHects of a reduction In rail operating ratio
from 85% to 65% was to increase the expected and actual
contrib, -i of the transportati.on company compared
to that of the single modal conanies for both TL./CL
and LTL traffic. For TL/CL traffic, this change also
had the elfct of reduciriF the total price paid by
transportation compny users thin when this factor
was at its high level.
3. The increase Jn truck load factor from 100 Ogt. to
300 Cwt. acted to increase thc price paid by users
of the trzasportaticn coq.4any for both TLI CL and LTL
movements. This thanc also decreased the ex~pected
contribution of toic tranfsportation company as ca-
pared to thc-. t irZlc modal companics in the LIL
market.
4. The Incre-i~e In rail load factor from 400 L%:t. to
800 Cvt. surv:d to tcc~:' he dtffurncc in
e~p 2tr~ioni ;~L c~1c~nrJ1%u, "oa ~e thez t,.o

-187-
, organizational approaches. This chan-e also had the
effect of reducing the price pa-d for transportation
company custo ers in the LTL market.
5. The reduction in the amount of capacity available in
the system acted to increase the price paid for
transportation company users as compared to when this
factor was at its high level.
6. The reduction in the -. ount of raffic constrained to
the modes by shippers' logistics constraints acted to
itncrease the expected and actual contribution of the
transportation cor.pany over that of the single modal
carriers for TL/CL movaezans. Hs chance served to
reduce the price paid for transportation by transpor-
tation company users for LTL shipments.
7. There were 47 (of 330) sitnificant interiaction effects.
The manner in 'hich,these Interaction effects affected
the performance measures is graphically displayed in
Tables XVITI and XIX in Chapter V.
It must be stressed that the results just described pertain
to the analys!s of the simulation mod l pr so.. That is, those
results were ob:ained from the =aniplmaticn of a =athemat:cal
nodel which wz-; forul.ated to rescr-bl. the real. world ph!ca;c.,'non.
Before thc;c rc:-'ultr r:ay be statcd as truth;s research and allalysis
in the roa:l wcrld is required. "it ',1ould also bc poinLC-d ouL
7

-188-
. . . . . . . ..
:--.---ti.at the hypothetical nature of the study may be justified by
the lack of information on what the econom'c impact of establishing
* transportation companies would be.
These results may be restated as a set of working hypotheses
that may stand until verified or disproven by real world rescarch.
The analysis of the research points to the £ollc'rng hypotheses:
MAJOR IHYPOTHESIS--A multinodal tran.eortation cja v composed
of a railroad and trucking company will
Senerate. reater contributicns to fixdd
and/or co.-zon costs including a profit
allowance than. its single mo.-? counter-
parts at the snm- or lct:er costs to shippers.
SUB-IIYPOTHESIS --(I) The operating ratio of the trucker has
no affect-, on 'the econc-nic perforu ance :
of the transportaticn company.,
(2) The operatiun ratio of the composite
railroad directly affects the economic
purf, rmance of the. transportation
company. The lower the.operating
ratio the hilhcr .ill be the total
contribution.
(3) A tran, portlon cUmpann: with high truck
and rail load! factor.; .i l have a lar-er
contributicr. than a tr,,,rta.io;
cc.p);y Ui6h I,.: Lruc-. razil Ic.d.U

-189-1
* Iactors, if the rate Is held
Con'stdft.
-. . (4) The riore traffic is const-aii&ed along-
modal lines by shippers' logistics
I.... constraints, the. less Will be the
economic b&enefits of creacinZ a -
transportatlon cc.-.any.
(5) A. transportation cc:-.Pa-r.y is especially]
likely to increase the contr-bto and
reduce the tctLl price ;aid for transpcr-
tation Ii th-e LTL =arkat as compoared
withsli-o-le operticrs inthiFurter arkct s6--cnt.
Fu~erRsarch T'vu 1r d *
Chapter VI presented the -=or ci;tazles WhIC11 bar Lhe formation
of transportation companics in the United States. These were
identified as; regulatory, e., ct, aa *envonzxcn-al obstaclecs. .These obstacles verv' thun rclartc.e to so-.-. of the assump-itions, nade
in the project. As arc:lofteeosacs :dh su:pcn
made In the study, it dX.'tr:Lmiied that further research was
requir-d to .Iterine the Vali -LvY ----.:iics --d to
deter-iine if L. C . couli 1, crc.....Iir- *r sevcral
suggestioea. s d fo;r £u~~vin CIw~ arc. of .n:;ra
f easi b i11 Ly

*1
-190-
- :-.--. In addition to these research efforts, the nature of the
simulation nodel also sugges ts other avenu2s of research. It
must be urdCr1tood that the simulation model itself was the first
attempt made in this area to attempt to ansu7er the types of 4
questions addressed in this dissertatic. As such, the simulation
model was necessarily of a simple construction. The simulation
analysis could be enriched by expanding the number and categories
of test factors. As explained in Chapter ii, envirormental and acommodity factors were not considered in the thesis. Certainly, _q
enriching the model to consider these factors would advance the
model to a nore real-world-like abstractio:.. The model could
also be made more corj,3ex to involve the real world scheduling
problems carriers have to trying to place thei equipmcnt at
the right tiie in the rjZht place. Furthermore, the significant
interaction effects could be axa:ined to deter-ine which of the
aliases caused the significance.
iiAnother subtle aad implicit factor which should be brought
to the reader's attention is the fact that the simulation was
undertaken for a transp-rttrion s'stcm in which the route structures
of the for:n.:,a com p;.ie were parallel. U1,at: would be the effect
of different, route .tru-tures on t.he pcrfcr.;anae Of t0ar.sportatioi.
eompauies? Ihe aul hor I-'se thc Lpothcsis Lhat if the route istructures o;. the for.ir, carriers are not a;pprc:.,ately parallel
or, ir the route 5L*: c-f o.:.! carrier dcc.; ncl: lie W 114 in
Llh.t of G .. c..t, tcar.. t -" a :..anc:• ''n . j.\I

-791 7'
- would not result In significant economics. Tlae reasoning behind
this is that if the siznplc. modal route struictures we'cre not parallel,
but say end to end, there would be no opportunity for the tranLS~or-
tatoncoman toalocae rafie to the low cost mode. Thus in
effect a transportation~ company withi this type of route structure
would be nothin- uiorct7han a. holding Fcipn for two'-distinct -
modal oeprations. This question deserves further investig-ation.
Also thi's projct~ has been a shert run economic analysis.
The inVeStigation was conducted or. the basis' of current operating
plant 2nd using the current stata-of-the-art technology in
transportation. In the past technolo.gical developments have
Iplayed key rules not only in the developm.W&n of each mode, but
Ialso in the nanner in which the modes hiave competed with each
other. What relationsh p will future technologvical develop-ents
have on the M~lti-2oda1 transporLt1tin ccraoany? Will future
Itechnological developments reduce the aeconomic benef its of
transportation companies? A -ain these'are but a few of the
unanswecred quecstions concerniig cor~on c-w.aership wh-ich must be
addresscd bodorc serious attem~pts are m~ade to for-m %transpor-
cta~tlon.c~pii

-192-
- -of scale. This would allow one -to directly ascertain what the -
effects of tie factors are upon ptofitabil-ty of the firms for
varying economies of sccle.
*IMLICATTVo\SO~F E STDY
AlthoughL there remn a lot of unatiswered questio-s which
-stbe resenrched' concerning the ccmmon ovnershaip question, this
study has been a step in the direction of obtainirZ answers to
those questions. It hasb*een pointed out that the.<-resulmsof
this study must be verified In the r 6a world. -As such the study
has served to develop a- set of working hypotheses which should
be tested in the real wVOrld. In cthacr vords, it Is the author'sa
opinion tbat LIM economic benefi ts of tran!,portation companies,
over their single modal counterparts, discovered inthis thesis
*should pr6v1C e iMPOLus for a set of cxpcrii~cnts involving
transportation companies 'in this country.
If the, reader. is r.cnviuccd that-the results of this
disscrtation warraint such a dev;*tion 'from* current pollcyi at
tevr ni:mtis digs , r Ltatibn should serge to eliva-te
the concept of transportation ..om-)ani s-from the spl e re. off
emtZ21al sc:7.nt:s illogical :rZumnn thAt have surroun~ded -
Such this; d::Lr;:.-;j~n Aloh-1d. ;-- !.)LU ftus r vxlre ~a ~u
di:1 ~':c 'h!~ --.-. r 1.U.. LI-C hj-~.I

6193-
BIBLIOGRAPHY
Books
Baumol, William J., Economic Theor an prtin nlsis,Second Edition,' (Englewood Cliffs, N.J.: Prentice-Hall, Inc.)3965.
Bonini, Charles P., Simulation of Information and DecisionSystems in the Firm., "The. Ford Foundation Doctoral DissertationSeries",p (Englewood .Cliffs, N.J.: Prentice-Hall, Inc.) 1963.
Boversox, Donald J., Smykay, Edward Wand LaLonde, Bernard J.,Physical Distribution Manase et, (New York: The' MackllanCompany) 1968.
Churchman, 'C. -West, Ackof f Russel L.,9 and Arnoff, p . Leonard,.Introduction to Operations Research, (New York: John Wiley andSons, Inc.) 1957.
Cochran, William G., and Cox, -Gertrude M6, Experimental Designs,(New York: John Wiley and Sons, Inc.) 1950.
Dixon,, Wilfrid.J., and Massey, Frank J., jr., Introduction toStatistical -Analysis., (New York: McGramt-Hill, Inc.) 1969.
Pel:'.math, Robert C., Thbe Interstate Commerce Omission: ThePublic Iute rest and the I.C.C. (TheRalph Nader Study Group Reporton the Interstate Commerce Commission and Transportation), (NewYork: Grossman Publishers): 19*70.
Gas, Saul I., Linear ProsgtaiminZ Methods and- Applications, ThirdEdition, .(New York, N.Y.: McGraw-Hill Book Company, Inc.) 1969.
Germane,,Gayton E., Glaskowsky,, Nicholas A., Jr.$ Heskett, J. L.9RivaX Transportation Management, (New York, N.Y.: McGraw-HillBookeCompany, Inc.) 1963.,.
Guenther, William C., Analysis ,of Variance, (Englewood Cliffs, N.J.:Prentice-110l, Inc.) 1964.
Guenther, William C., Concepts of Statistical Inference, (New York:McGraw-Hill Book Company, Inc.) 1965.

-194-
H iadley, G.., Nonline-r -md Dynamic Pronzrzmrinn,, (r~eading, Mass.:Addison-lwcsley Publishin, Co.', .-,c.) 1964~.
Ileskett, J. L., Ivie, Robert M., and Glas'Aowsky1, Nicholas A., Jr.,Business Loi.,stic.; o f Physicz! Stip~l and _Djstrib-;,ion,
Hicks, Charles R.., rund&:ntntal Cnnc -ts in the Desitgn of F.xterf-v tents, (NCW York: BILt, RinchnrL :snd ;instoai, Inc.) 1964.
*Hillier, FredericK S. an Lieberm~an, Gerald J., Introduction tof peration,; 11i:search, (Sa n csoCai. Hlden-Day., .Inc.)
1969. Facso ai.
11oci, Paul G., Introduction to ~aic:tclStc.istics, Third Edi*tion,(New York: John EWiley and Sons, inc.) 1962.
Hunter, Holland, Soviet Tr= :.ort 7.prience: its Lessons for
The Broo' inZiz iuStitU i.a) 1963..
Locklin, Di. Philip., j.con;e clc ofTrarsportcatlcn, Sixth Edid'on,
Mc~illan, Claude, Jr., M t--J ?rv:.rinS: An Inrrc'uctlonto the Desif 0' Lci-sicn aci2s(XNwYork: J ohn n Wiley and zilt, ..nc. 1970~.-I
Meier,. Robert C. , Naewell, 'Villiam T., and Pazer, Harold L.,v ~Sirnulatic- In~:~s : 'Econonmcs, (En~lewood Cliffs, N.J.:
.Peticte-~Iall, inc.) 19 6 1 .
Mendenhall, William,- Th Dcsimand Sa~q Of Eprients,A (Belm~ont, Calif.: VWas.rti li~a C.p.n -nC.) 1. 8.
Meyer, John R.,, reckl, ifrtn q., ~:oC. John, an.d. A!ickCharles, The Lznc:: c of Cor:', -.' -i flhn in *-..:r1r 4o7ndustri.:.;, :as, 199
Naylor, Thomans Hi., llalnLfy, Jco-vphi L., Burd.,c%, Donald S-, and
Chu, n, iw .i S., -. (nc Yo, .s UN.Y.:
Ciizrlc';- L. %.vvti I. , .,1*l.~
l'vgru-im, 1)D-.(Oy a: - .~:~ .! *',1jCIo i'j t CIo, L4.IW n :c ) i1.:(

-195-
Sampson, Roy A. and Parris, Martin T., Do-.e.tic Trcnsortatlon:
Practice Theory and pcll-v, Secoad Editicn, (Bfiston, X.!s.:HIoughton X!i:i1in Company) 1971.
Taff, Charles A., .Co:i:crcial Motor Transtcrt.tIcn, Fourth Edition,(lomewood, Ill.: Richard D. Irwin Inc.) 1969.
Trans.Iportatlcn Economics, A Conference of the Universities -National iU .u COZ.=iLLu for ECRc.'ic Recarch, National BureauOf Economic Research, (New York: Cclu:.ba 'nlversity Press) 1965.
Wagner, Harvey %.,, r~i' Ole ra "s Research, (EnglewoodCliffs, N.J. : Prent. ca-H!all, I-nc.) 1969. :
I
Articles and Reports
"'A Better Cl1s of Traffic' Is Needed for New Grovth", RailwayA,_, (May 31, 1971), pp. 27-28.
"American "rucking Tretds 1970-71", DIpart'"ents oi Research andTransport Economics and Public A.-ttir d,-.-..an TruckingAssociations, Inc., 1971.
Econometrica, Vol. 20' "o.4 .Bickerton, Richard L., "Self-lHc.ip ore faorc " .tansti " o4
.and Distribution *nsnaterient, (Ma 1971), .p. 29-32.Bickerton, "Tire to Plan". Trap fttior a air-ibuton Manar(-o.and lstrbuc~n ". .na-.o~~ent (:.a. n1) and Dist.
ment, (Deccrber 1970) pp.. 23-24. - 1'Campanella, Frank, "On the R!h t Track", a:rrcs, XLVIII (October 2,
1968), p. 9.
Dodge, Vil!.iam H., ".he Dile.m=in of IRr.1 iatu Coc.peAtion",15..C.C. Pj:tyrs.".', X."VI .(ju. Au;Usit 1969), PP. ISOI-
Dodge, W 111 o ii., "Tie Inhe rn L ,v.n tat . of C;rri.r . ds Cndorthe ;Natjo:':l 'irn 't P1o.c,", ' XtIV (:f:vc;:;rr1968), pp. 492-507.
II;]
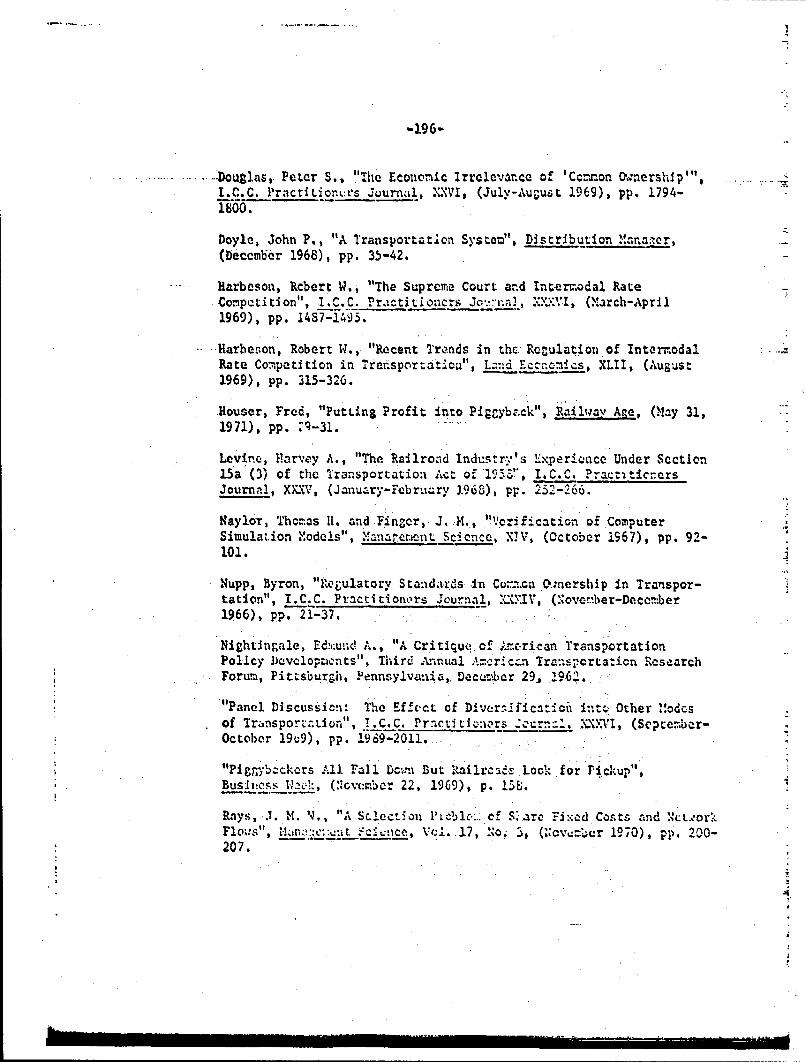
-196-
.Douias, Peter S., "he Economic Irrclevarce of 'Cc-.on Ownership",
I.C.C. PractlLionurs Juunail, XXVIp (July-August 1969), pp. 1794-1800.
Doyle, John P., "A Transportation System", Distribution M,.namcr,(December 1968), pp. 35-42.
Harbeson, Rcbert W., "The Supreme Court and Intermodal RateCompetition", I.C.C. PractitioncrsJon X.XXVI, (March-April1969), pp. 1487-1495.
Harbeson, Robert W., "Recent Trends in thc: Regulation. of Inte.odalRate Competition in Traisporatioan", dEccnoics, XLII, (August1969), pp. 315-326.
Houser, Fred, "Putting Profit Into Pig-ybr.ck", Railwar Age, (May 31,1971), pp. "q-31.
Levine, Harvey A., "The Railroad Industr's Exper -nce Under Section15a (3) of the Transportation AIkt of 195 Z, I.C.C. ?ractitc;:ersJournal, XX)XV, (January-February .963), pp. 252-266.
Naylor, Thoeas II. and Finzer, J. M.., "Verification of ComputerSimulation Models", Manatcriecnt. Scnca, X!V-, (October 1967), pp. 92-101.
Nupp, Byron, "Rweulatory Standards -in Cor.-..n .0:nership in Transpor-tation", I.C.C. Practitionors Journal, "CXIV, (.oveober-Dece.ber1966), pp. 21-37.
Nightingale, Edcund A., "A Critique of e.ri.can TransportationPolicy Develop, ents", Third onnual Amr-rcan Transpaorta:icn ResearchForum, Pit.sburgh, .Pennsylvania, Decenber 29, .9.62..
"Panel Discussicn: The Effec't of Diverrlficatici int; Other Mfodcsof Transportation", .C.C. Prnct tlunor -curn, XXXVI, (Sepre.bar-October 190), pp. 1969-2011..
"Piggib-ckers All Fall Dc-.n But 1ailrcaCZ Look, for Pickup",BusIc-s '.c-:, (.cov:r.er 22, 1969), p. 15b.
Rays, J. M. 'N., "A Sclection P1cblc.. of S .are Fixed Costs and Nt...orkFlo;vs", ..... v.c.nce, Vc-.. 17, No; 3, (:cv ..ur 1970), pp. 200-207.

Suelflo~, Jame.s E., It11113, sL.:Inky J., "The TIransportation Company:An Economic Af-U;M1L' fur 11Atr dutI 0.-ncrship", Laid Econmcs,(August 1970), pp. 275-2S6.
"The Astro..Plan for Progress", reatc and Distribution
'Transpdrtntlon racts and Trends", Trailspcrtation Association ofAmerica, Qishiaeton, D.C., Quarterly S upplceant, Janua±ry 19721.
Tucker, Willian It,, "Vantado. Tha Air - Truck - Rail - Water -Bu
-Comnpany ', Co1'iibid journal of Lovid Busincss, 11, (NoVeMbcr-Deccnb ar1967),, pp. 47!!54:0
I'Vore Asks Intermodal Carrier Experimecnt, Creedy Favc~rs Replacemc:at-Cost. Rate Base", Traf fic 1.1orld', (h1"ay 17, 19 71),p. 35-56.
'9i11iams, Ernest W.,. Jr., "'Traffic Compoition and Railroa. EarningPower", Tr~nisport-ti en Journil, Vol. 9, '1c. 1,(Fall 1.969), pp. 17-
*"Ycarboek of Railrond r.acts", 1970 tditic.., 'Ecnonic _--d FinarzcDepartLnei, ikl;OC~a~lbn of American 1Hailrcadls, April 1970.
Government Dcuments
"Explanation of the Deve).opnnt of 114tor Carrieor Costs with State-mant as to TerMi and SiEgnificancc", T.C.C. Statement '.o.4-59, Washing~on, D. C., 1959.
"Explanation of Rail Cost Fiiud- n Procedurcs and PrInciples Relit-ingto thc bse of Costs", I.C.C. Si tee.t No. 7-63, If.ashingLon,, D. C. ,1963.:
"Eighty-Thi rd Annual Recport on: Traasport Stat istics In the UnitedStates for the Yozr 'Ended December 31, 19 9", I.C.C., CPO,Washin&LC:1, D.C., 1970.
"flessajec o:i 1'rins-,oriaLlon", (i'residcul: K ci.y' d-j),~rConn*:, 2 .*.5 . Ei.c.us& '0! JZ OCUI.*nt No.
WashiiilZcn, D.C. , April 5,1'2
The int~ V:Itr- V> rxAt . S. Cove rwa-ettt Prin Cffice,
IS.

-...
-198-i
'U. S. Congress House of Representatives, Comdttee en ArmedServices, Ad cw : of r'-portatlon S vtrs it S-u-,ort of theNational D; i. se Eff-ort i n Event of " l zat; n"" H.,r:!s beforea SubcommitLee under authority oi il. Rcs. 19, 86th Coagress, 1st ...Session, 1959.
U. S. Congress Senate Covmittee on Interstate and Foreign Coimerce, 2Cby. .Rqrulamd Carrier- hqar.-s before the SurfaceTransportation SVabcc.ttc un S. 432, S. 1333, 1354, 1355, 2189,86th Congress,. 1st Session, 1961. .4
U. S. Congress Senate Committee on Comerce' v ato.al TrzmportationPolicy, S. Rept. 445, 87th Congress, ist Session, 1961.
Unpublished I-ateria!s .
Cherveny, Norran. Lee, A Si.ulatio: A..-vsis of.Cash Flcw P.atterns;Within a :.anufacturinr Or-i U.. tion, unpubiisiaed D.B.A. dissertaticn,Graduate School oi Business, Indiana .Un.vrsiry, 1968.
Glaskm,,sky, Nicholas A., Jr., AnAn s ._ and Evaluatlon cl theDevelep,.,ant of- CoordinartoA. ,iat.. ,r .. L... , ... Sneci alReferencq to ,orz!:ast: . c., uulS' P11.1).dissertation, Graduate S chool, , ."ani'd Uriversity, :1960.
Hay, G. A., .orlok, E. K., and Charnes, A., "Tcward Optimal Plan-ning of a T'o-.:od Urban Transportatizn System: A Linear Prcgra.min;Formulation," The Transpor:ation Ce::ctr at Ncrth%estern University,Evanston, Illinois, 1965 (rin aograp'a).
Morlok, E. K., Nihan, N. L., and Sulijvan, R. F.,"A Multiple-ModeTransportation :ctwork Desin ModelThc Transportation Center c.'eNorthweStern Lniv erity, E'anston, Illi:ols., 4 VoIu.s, 1969(mineogr:.phed).
I ,

-199-
APPENDIX 1
A. THE t TEST INVOLVING PAIRED OBSERVATIONSOF TWO POPULATION MANS
To determine if the mean differences between the performance
measures of the transportation company minus those of the single
modal carriers were statistically significant, a t test involving
paired observations was utilized. This test was used because the
observations (from each simulation run) of. the performance measures
for each organizational alternative are related to one another.
That is, the random components and parametric values were held
constant acrcss the organizational alternatives for one run and
varied between runs. Thus, the obser-atioas occurred in pairs.
The exact hypothesis which.was tested for each performance
measure was:
R0 d 0
H1 . Yd 0
whereA 4 isthe mean difference of the particulary
transportation company performance measure mi.as the
performance measures of the single modal companies.
The null hypothesis was rejected if
sd

-200-
--where t 1 is the t statistic with n -I degrees of
fredom associatced with a particilar level of significance a,
n
d~~ i - x+ Ri)
XM X.,X =one observation of a particular performancic
measure of the multi-modal transportation
company, single tmceal trucker, and r .1aroad,
respec tively,
2-
d n-1
u ~a numbor. of paired observatios which was 32 for b~th
the TL and LTL categor- Of. rovc-:42et.
3. : Thf ALYSIS OF '.n2 ,: 01 T:;E KAIIA,.1
nhe f~x-2d effects anaiLysi:; of variance (ANOVA) rodel was
USCd- in t'-,L %.issercta-1on tc. eatrmno if the: L-ain an~d 4f.rsL-cordet
interac.k-.1 LffeCLs 16er-C! btat ;stt'zIIy sit:ificanit. Th±e A:;O;A
t~ch:Ii'--- 1:.I3C 0:1 thL -.! C'. 0'Lh~ t( ta L:z 0f a r C.'
d i* iia tr :r'-7 tihe r;nc vao can b,: part i L -2d I :LO thC
a (r ore r: . ' d i o ti cT s t..

-201-
~smOf squars assoclaitcd with thc, main effects, Interaction
effects, and error.2
MatlaomaticallY the &MOVA model used in this project is
SST SSA + SSiB + SSC + SSI + $S,1 +I SSP
SS + SSAC +SSC J+ S Sa.+
SISAF + SSBC + SSBD + SSB*-: +
SSF' +t SSCD + SSCL + SSCF +
SSDL + SSDr 4. SSE- + SSE-
where SST =total sun~ of squarcs,
SSAS-..SB, SSC, SSD, SSE, SSF sum of squares associate~d
with eachi mai of f-Ct,
SSA~ SSC DSr.SE: SSBC, sun of square iac
SSBL', Sabc, ssiw, S$00, SSCE, sscF$' with the respective
~SSM, SSDF-, "ISIA interaction oeflects
SSE sum of squares as.-ocdatedi
with the error tan..
The test statistic utilized In tkie analysis of varicincc to
determine if the rull 1hypotheses concercr1v the main and first
order Intaractic~n effeects should be rejected Ais tha F ratio.
The F ri.tio is silily zie men stluarce of ;ho tratrment of
squaires arL2 .:i:.--,,y tlla t rf the s~uarcs ol cich tormn ld-ULifjt~d

{ ~-202- :.*1 .4
the F r.-Io is greater than the Fr(1 c&) statistic the n~ll
hypothesis that tu f.ator had no effect 13 rejectd. r and-r 21 2
are the degrees of f reedoz in the numerator and denctlinator of the
F ratio.
The AMOVA data obtained in this study for the 'L/CL expected
profit performance measure is presentcd in Table.XX for the Jrtrested ..
reader. The de;racs of froodc. are thle same for each of the other
.3.4perforr-ance 'ncasure.3
ionua fn .: r|.iofSur.;myb-
f r-' -6
. -
..4
A I
, . 1I '
3i
~1& c.:: L~:...1 zf,u!::. i.r t:...: .s:: of s~urt:'c: nay b.2iI} ~fou'n3 3 u (';~I4LhV, :[i c:,.,, u: :;,.:xjL:;:I~ul!.
r!1II
.n x a fl

-203-
TABLE XX
ANOVA F R L/CL LXECTZD PROTIT
Source of degrecs of Sum of F ...Variaticn f r e6cc Squares ratio
A 1 86,064 .00024
B 1 2,481,612,162 7.06678
C 1 77,484,194 .22012
S2,928,671,473 8.31974
E 1 7781271,971 2.21091
F 1 8,977,039,91.5 25.50187
AB 1 77,054,877 .21890
AC 1 491 .00000
AD 1 7,202$549 .02046
AE 1 631,307,171 1.79341
AF 1 l9,119,695 .02591
BC 1 790,168,790 2.24470
BD 1 2,62-,74S,2'2 7.45920
BE 1 214,529,719 .60943
BY 1 1,032, 1lI,683 2.93201
CD 1 17,847,9$2 .05070
CE 1 1,613,393,219 4.58331
CF 1 6,116,di5 .01738
DE 1 80,086,535 .22751
Dy 1 1,9A6,3.89,605 5.52871
EF 1 44,227,059 .1256-4
EPJ~Oi: 10 3,520,149,339
TOTAL 31
* . . ' - -..-..2
" I II I I Il I I II I 1

-204-A
APPENDIX 2
A. FLOWCiIART OF THE SMU!ULTION MODEL
A verbal describption of thL simulation model has been .
presented in the text of this study. Thlus, discussion of the
simulator . will not be included in the appodix. In the ...
discussion uf the si.ulation model, the flo.:chart. of. the model
was not included tc increase tho raadabiiit:: Of the project.
For the interested reader, the flowchart of the simulator is
presented in Figure 3.
B. THE S1",ULMU 'ON' C,,_±.'ROGIPO'l I
The co-=uter pr graz of the simulation model iS presented
in *'i6ura 4. The coding is ,rittcu in the (V:ITAB computer
language.
II1
I
'; . I .' " . . "
i~ur..,: ¢ ..~i ...= ";. ...: .,.: i /.[

-205-
Figure 3
9 Flowchart For Simulation Model
1 detrines the fullcosts of each modeon each segment
multiply thefull cost
-mode (t de contribution(2) low omp ~e, " O 0 by the amount
cost? (3) to (4i>, 'TZw h must- goby this =ode
YES YES and store -i" Y--qf ..... needed capacty
multiply .6 of multiply fullthis segment cost contributio-traffic subject b]to internodal (5) by that: which
must go by thiscompetition mode and storePlus t.at needed capacityreserved $or (A')this mode dueto logisticsconstraints bythe contr.butiona mult.py €ompet.-Iand store needed tive contributioncapacity . by utimates of
com-30titive(6) trafiic he will
obtain (.6) plus'
multiply the what must go bycontribution by this mode and -
amount of- traffic store needed(8) which must go by capacity
this mode and (B')store needed __________
capacity(10)
CE) (9YA>BG
YES S
.0 To

C -206-
re18) stop~ 3 throu9 for .t (method
H
(15)(16)
(19) ES 3 D YES r 0 0 E ( oB IB > D Store E G
NTO
Store' DToand R Q)
2(
YE tr Go(20) BI E D To(20) I' • Dand B1\ ,
(22) and A
(12)" Store. A\ N.+ O ".
and D iathod vwhi is
no low ost
YESrepeat routineuntil all segments (13) et steps 3 throughhave been exhausted (13) mepeet ohe 3thod
(3rank the contri-butions of theI methods
subtraci the capacities requiredfor movements fron total capacity,
(. ( beginning with mode and route' _kToI segmnt with laraest contribution,.ntil capIity IU :xhausted
, H ,|,

-207-
( Repoa.t routine -'Or truckcr
< j k **T R jk3i
repeatc rouitinefor truckerset =0
(27)
do i- .tis print the.ocatcd YZS 1. carriers capacity allocations
(26) -ariers.2. odes ected and actual
(26)f p by sipper<hi~p I 13. price paid by shippersdman ?
NO
lp. s -E- hos of¢,. .
. .he. tp:
c arriage, orc go1 riyte ...
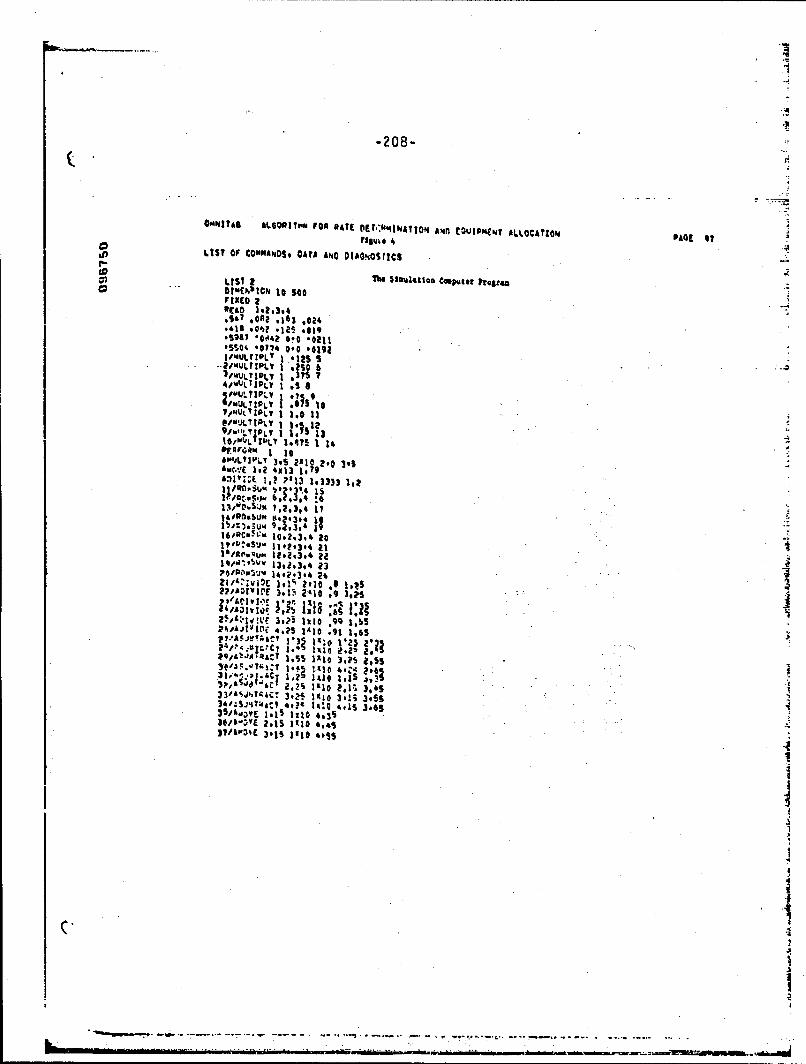
-208-
OMNITAS ALGQRI?,* FOR RATE DEt:'deINA11ON ANfl tOUIPu&4 y ALLOCATbO4 NotE 0?a ~flguto 4
U)1 LIST Cf CONMNDSe OATA ANO DIIONOSICS
LIST 2 TeIaaa~nCse rgao CiwEchblri 10 SooFrIEO aREAD 302o394
*Ste? 0e14? 0.0 .02110. 0. 0 74 0t 0 04192
411AUL T ,LY I S12 S
~jvUTiP IO .71591
* 'LY 39S 2110 too 19SA.'E1,2 4113 10~9
')11;E~ !,?21?13 1.333 1,2
l4P 90bN'243$4 t
l6n.tw12.2.3,4 20
V/4jAJVOIt~ ,2's O 10.1 ,4221DIVP .5 2410 2.2' 2
V 'Af.'t~vAle I.? a i c X
24/1 4alJr~ 4.? 3; : 1. 12 Z.
30,~~E .15 llO . 06371.-10 3.10- Z31 *S
ACT 12 lae I i .1
2.15 110 4,4

* -209- .
000"ItAl £LGOmll.'M tOA PATC DEWVMINATtON ANII E0UIPMNCt ALLOCATION P44C s
LIST Of COM"ANDS. DATA AND0 DIAGNOSTIC$
WIROVE lot 1110 504
4o/Awovc 3e 1110 ssA)/4"OVE 34s t'1 s.5s
461DIN07E S ?S 3 5tS 361 ? 37IS34 S1 T 0I 419 'o5 71 41 ? ) S b
17 5~735 if It ? T1 tdq ~ 7714 P Il 741 70 1103?44*710EPUTE? S 7065 78 66 766? 78S 6 69 78 ? 74 71 H0 ?Z TO ?3'u 14
SoVErko 1913.
mdove 1,35 6944 totalaDE5UC Itz3.&OPIS 3013 P1)3 *5) 31
DOfon 11 @
£A0VE 123413,9
£4uU ;eel) hI03 , 1,22£00 345 010 842S1.2
solvo 1' 113 116 1.2351%I
AIVIOE 1:111 ?al to3,
PgEMO is 4 .
£800 1.35 Otto lob5 ISM0&&Do I.&$ Otto loss 1231£aac lobs Si10 1%b5 1,321*100v 1#.9 81)01.6 lea 1A10 IE 3021il 1,29 3£500CI 1,10 ?Xl§ A,~ 1,51
1800C %*) 91 24 1.261 31AsCO 10Se 8110 3.2 101 33&A00 lo?) $110 1.21, 131
*400 1*271 $110 1,201 13SI4
1011A&*z We Alt 1*1 1 030

0iag AL00mM PC rATWE 0tERMINAIoIN AN4D IQgJ5pm('y ALL.OCATIONq ofG
LI1ST 0f COP'4&NOSO DATA AND 0 DIANOITICS&AOIa441011 01
401ATP&A41IOSE 16101 1116 lotSO/ I COEvTNI 49 0.20 010 014
$1,AIRANSOOSE 4,101 1310 1,6SSi#I'.C'I Sw? 3io1ooo .
RISC? haAX 10INjSERT 1 2 2 49INaSERT 49 73 3 49IE~ 49 1 4 4 491.41*? 4 it 2 a sot SEAT SO 11 3 3 50?ISERT So 3 4 450oINSERT 4 13 2 2 S1TmNSEDT St133 3 3 StI'NSE2. 51 1 4 4 StINER 2 1s 2 2 12PIc' 5SR 2 IS 3 3 St##,SEAT SZ 3 4 4 S2'SEAT 19 1? 2 1S3INSERT 20 1? 1 2 4lo;S!RT 19 IS 2 2.05INSERT 123 11 t 2 5?INSERT &0 S 1 2S
1NS4T 23 22 2 2 59
INSCAt 23 1? 2 2 60loScfIt 24 IT 2,2 021t4$EAt 14 11 2 2 04loiscat 23 i1 2 a 63
low$, at 20 21 2 2 06MotE~ 39 it 2 2 0?M'eat to 22 z 2 6S
Al"NEI 3? 3 21S3
'f Fo~m A1 02 4
W'~A. 01 6? 4*21I'NSENT S? 3? 3 St544II.C-eEENT *3 1 0 0 1
PCVro*m 03 44 it: FSTOOE 63 5T 37 425fRO~ 63 04 It
Amoy( ,9 3012 if102AMOVf 1,25 1014 3.100

OUIIL LS0P17"m FOR *ft OEIERMINAVION &NO EoUlpMIte? &L60CAIO'. PAGE( 140
6.35? OF Co"NO.SI Omt A-40 DIAGNOSTIC$
AMOVE t%4% 14 IOAFARASE 14?l *Ozpg4u'VE 1*9 toll 1.24&MOVE 1.101 10') 1.44
1,10) IO.I hlO 1,49
I Z 3 4 1 1 3 4 1 a3 341 a. 3 4 1 2 34 1 23 4123~I1e123SET 293st40 at
ski11 34
11#10 Woo 37810 900 7200 $0400 3700 9000 ?200 S0410 37RO0 9046 Ioftbiust36 000 4 9009 I'moO 25200 000 6040 30800 31400 90110 1200 10400
W1 0 0 M O 9600 0 0 14400 MOD0 0 0 P480 40 O0 00 43100 24600 0 0 '3200114400 0 0 '3200 20400 0 0 *3z00 mWoo 0 0 43?00 moh0 0 0l4*40 ?SOOI 0. a 432003 00. 0 10600 30444 06400 0 6000 400 32400 0 13200 42000 41000 0 16900 5"0040- 517 4%*00 0 14200 190*1000 0O 14200 S9404 '400 0 IvSot 43000 '6500. 0 1200 964boSit 33.as
31106 0 12000 4000 1000O 40 S~O 9400400 3600,100 23 11100 410000, 23 114A0 A04940. 13 1114ar, 1*40006, 23 11sAPO 140000. 23 117All) 300000. 13 114Ape 300000. 23 %isAmovE III)? 40164 1071
7SOiINlMUN 3? 61I.#AwOVE 1.20 04 1*32
U.'skayact 3p 3 *11gS 3'0e 840.
*1,~".11Lv1.44 101 2.'2 1,a,

01M ItAI ALGO~hbtt ON M WE OETERI"l'AT10N AND coutpp#ct? AILOCATION #P4t1h
V LIS? Of COMNNANOS. IT A140 AhDIACNOSTZCS
R PISUPIACItoi 11 1045 1044/ "MaOE JOGS II 4a.4
ft4i1CC~1'. 09l &0 010 94001W010041 3 36
2341 39
Sp.6ficMCEN7 92.5 JO.0 o 091/I4IlZPL 41 31 1
46/11,CREW!h7 9S 0.0 l.0 2.0prrp ? 94 10
A&IOYE ti6s 4011 1030ArSTOEE 76 lei 414' sl
1.20E fXM 72 77, PEpr ON 72 66
0QIvv( 333 's 1779.*31ICOEMEKY 99 Co* 010 6,0
PI'NFCAA 9? 99.3 10
Sa0 400 3 0 0 4 0 0 S 0 0 6, 9,0 7 0 6 0 0 9 0 a to0 0
03020 3 0 4 0 S 0 60 7 0 1 0 9 0 10
1 0.v4*&St :~g
1007/AOVIE 40 400 3*6? tot1 OI.5 ..jalACY 12 3 37
I 00o?/AMOCE )ill 301 1#23
300,9/sul7qACW S4 57 5?09MRC14 100 106.9
1 01A/ilI'EtDM S? 66 50 at 51 66 52 69 S3 7 0
10.11t 07 2.014nj/17/&Co 37 64 5? 99
ll'4po'cn 5? IV 0.0 ilog,5us "AcyTo7 72 733@q'Crusc 76hI uAmTC* 99 66 21 S6I)l3iNATC. 99 60 52 S3
93 610:1.S

0O4MITAS ALGORITHMf FOR R ATE OETERDAIN.ATION AND EQUIPMENT ALLOCATION AE o
4,4, LIST Of COM4MANOS, DAIAA.'4O OIAGNOSTICS
0 11?'2/"ACH S7 *66 S7 99112s3/14AICH S7 99 0.0 S711?.'I1FLE 71 0,011MA,'PLE 720.0112#6tSUBTRACI 70169 16lll0.SURTRACI 76 71 TI11208,PERFOR4 106 112113/IPHE 6? 40114/MAte" S7 66 ST 991lI/MA!C" 57 99 0.05?T116/lrtE 730It0116.1SURTR1CtTo7 69 7G116,?,54IBTRACT 76 73 731t?/PERFOP" 107 11211*/PERFORM 101 101.4116*11PERFRM~ 312,1 Ila's1191PEAtORK 113 117119*1/1LtE St 0.0MVFORN 110 19.1 30ERmASE 46G6 697075 76RMET 211l10.4AOI 1.65 2011 IM2
ftRFOM 119.4 119.5,1 ItRMMIUM 6S 66 56 67 59 68 60 69 61 70 98 96
1?024PNtE 67 lot120.3/0MATCi 96 9 6 65 9Ito ',MATCm 95 960. ItoG121/IfL-E 72 0.01221IPLE 76 0.0123/SUBTRACT 70"69 76125/SUOTmAV 76 72 72126/SUBTRACT 76 74 76
127/NAI it 99 212S/MAICk " 0 '1126.1/MATCq 59 68 0.0 65128.3/RESET 3012S.'/4"OVE 1,96 10o1 21.94l?6.7tmATtbI 97 96 21 S4
IP41/myc"97 96 52 53129!*41IME 67 1.01?9.9/MATCH 05 66 6S 9*129 4,6148TCH 65 990. co 5I130/lrtt 7404%0131l/SUBTRACT 70 69 T61331SWJaACT 16 74 74134/PERFORM 127 126.1

-214-
ONNITAS ALGOmlykAs 0 FDAt WECIEA.9z'dajOp 441 £rUPNtt LOCilp AO
.1) ~ ~ LST OF COaaas4OSta TA &N IAGN~OSTICS
0) 125/PEarpO 120 tlq.z1*PAON129.4 13% ..
'a &sun 02 123,"CAD p/. PAIL. V0OE5Of AD M/I a?UIE
*fA "I EST OP:?FI1'rAD 12
5.cuU EST oftNrAU SS.~uoiADJ RATE
MESAD 601 EST MARKET
WEAU W2 EST PROFITWWAD 3Z3/CV.rn EST PF?
14940 7PI'?5A9 r0 RsODE*4EA O/ 6, OUEHEAD ??/ EST MARKET84FAo I0/Ani E57 uM?
"EAO IP4.'CUP' EST Pr?ME& ND S hUih RATEp 0 PONT So S9 0 61 62 123 3
*R E ~5T 30P&RSuW S4 122PRINT 50 S1 S2 53 So 122 s5Of SC? 40iiERASE 66 6? to 69 -.0@7636iI O NL P N .17 1126 : 0.0
PAFORsa 131 13# 10IYO0VE lea? 401i 1071
13.,~v .e4 4011 1.24
zV1oSU473A~ ~l~1)9'"AIjnIm b4 6b ?? 67 76 68 79069 So 70
a9 13ffA C" 84 66 44 so
I 1AhiLE 72 0.0I.~I*l?OTACT 10 69 16
I"'/W4eTmAcT 76 73 7aI4/,.,e1oc? 10 72 72

14/NIC ?a6 004
tmAT~ 84 6215-9
LI 4O COIdOAT A i 0 99~lOTC
oTH 99 040 2 $699 0~900
/)69.3u3"dt ?70 96
390/PLEAC 73 0.0 7
10/pr~f 70 139 7*9
1067*/I7* A3 7M
KDs(/ItC Te 06.1 3POINT 771AC 7 T9 S 16$It 7*mSv 71. 9*16061REOPE 1 ke7 1,4'9l2 4I- /ESUO@ 7 13 ,8 ab 0
pPSj~?0%f 20 1* 49 1*4. 30/ 4'. fact 93 12' 2 x1I
99117?NV 70OS 79 OXI 1282143.5j'IdC12LC 16 144 1 .~1
petpar,0" ? q . t .o
I6 1.28 /U(4 3.32I ~ I2.329 118 19 150
I *VEPSC 95 1.3' 60# 4 1 S,13410SOT 2 5143124
1,2/0gar03. 1 1 9
t~gn " 3 01" 2I?9.l/vA20flN 300 10
I oa livy So 47 0 $1 70 123 74I~el/tl 20
'
t$W/A 'J 04 123

OMMMWWLZ.. 400
-216-
OUNNIT*S ALSORITIHN FOR RATE OCELoINATb0N ANO EOVIPNTs £LLFIC*11ON PAGE 181
40 LIST OF COOMANDO 0814 ArO CIAGRgOS11CS
146*3PRINjT SO S1 S2 53 S4 122 55
104faCAA$ ftb 40 8 6o0 I 16109faE0P(Iftm 13? 1314 to
1.b'AUD 17 '01 * 11
1~lI/P~f0E413".3 134.41 921PEWPO0CM 140 162.1 30
19~omI' T~?69,80 It 124 6241404( 111 4021 1.26&MOVE Is$ 4011 1.2?
A;0 E 1.100 IOXI 1,44VSI.8ACT 1.100 loll I.I,10 49
£S~dIRACT 19101 091llf 0ie49&MOVE 1.112 *01* 143lSET3036000 1200 4000 $2260 39400 10800 10800 4000 39190 10400 720u S0400 3960 10800Sri Is 3010000 boO3000 301000 IQOv 54000 3900 10800 l~beft SkOnO 3*06 9040 1200SET 28 3C50400 MOO3200 3000 00114CC 26400 7200 6000 34400 12600 3U09 2400 16BO0SFT 3)P0400 0 0 43100 2SA00 0 0 43200 Z1*00 0 0 43200 24614 'a n 432o0 RR06 0 a 43t00SC? 21 317400 0 0 43P00 26A00 0 0 *3200 900 0 ; 14400 1920C, 0 0 2*WOO 95.00 0 C 14408
40090 0 18200 S9400 $0*00 0 21008 6.800 *4640O 0 14000 61200 f-O00 0 ?.1613 46*00
S40 671416 64800 'J400 2160 o 0 4 0a 16200 59600 WOO0 0 600 21000
Sf7 33 as32400 0 13200 42000 1500v 0 S40i0 198007fwfLIup 372 193
AU4IOi~ ACt 1.10? l011 1.100 1#68.AtWaOaf 1. 01 tl 1'0 0614&MOVE tea9 6011 1.2?
AMOVE 1.1110 0X 10' ISE.3043200 36000 30000 660
0 33600 28000 26000 31200 1?004 900c 9100 Mon0 33600
Sf11Is3016300 Z600 36000 10400 14400 12000 1S600 12400 9000 900 1wo0 ?980 2efOOSri 27.3o0.. ,. .
19200 2000 I6009 1*600 12000 15000 20000 ?4000 2S04~ 366CC 360004800 36oSC? so 3048800Sri1311200 0 a 10880 4800 0 0 1204 2*00 00 3000 4900 0 0.7200 2400 *0 upi0240000aSET 2431

OM2A AL60*11eOMNFOR f LA E OCkEMNA11h AN* CQUIP'toofALLAIM #Ac 166
LIST AFE9b 4NSPDIAA4 OIAOOOSICS
o400 00 o20 i2oo c 0 @3000 40%00 q o vao20 0 100074200 0 7?000 82000 57600 0 $200 go o~ 21400 0 M~oo 22kq: 62600 0 S101) £49Q200 00 00 10Sir?I? 4S2OT13 05 1640300eboa14Pa 20 ?,0.. 4'00 000 21580. 0 2b'0 3008o .5700 0 S?Bo0 00000o ?2000 0 'o400 7500
OfFR4172 193
40k)1 CT19C 1.01L .0
aOvE 1614 40311 1 2;12.oo ?VE0 1.1 * 132c
S'30000330 9600 1 2~Q 60404300 12000 3900l4o1' 00130
SO7 31 1.44 00 0 0 7290 1200 0 0 l0000 2 soo 0 0 3100 2400 o a 3&00 *J'00 0 0 ?too, :~1?00 24,00 0 0 3000 2.00 0 0 300 2600 0 0 300 @. 0 300
SPO 500S20: 7920: 0 T2000 NZ000 21600: M 1 22 6 ::::1:: :,io P21104
SUMO 0 lb2doo 600$o*a*UCS202600140zA0241 70Sri 3385 O
2P.400 0 ?4000 70 60 Z40760PC~90om 27Z 293
&MOVE 1)52 409 124
&M£OVE 220 011 1.2?
306 oo !2(10 900 52200 12000 3000 2400 16-400 12000 2400 3000 14000,394 0 08ie)PR') oo00 2$200 0000 7200o 300cc1200 3000 2690 16400 ?4400 TZ0 MOO 34640.49,-19 301?000 2400 2600 1bd00 2524,0 000 *m00 3)60o 13200 3000 3400 16000'Sr? 31.,
* 28000 0 0 43200 0b00 0 0 l 4o00 0600 0 0 14400 Z010 0 c.13200 1?001 0?8P6SY21 3)00 00 a 4400 1102n 0 0 20goo 0600 o.0 14404) 11240 t * paO 060 ** 0 4
61;060 a 20200 594600 11000 0 5400 19600 15400 0 0043 P04PR $0400 0 ?1410j 041f005ff 1? as

-218-
0"I3?a&O hJ.6ORITNWP0 FR WE DCt~I'~N&TO Awn1 COULP4AP? ALLI2CAtION*t, 10?
IIsa CoOM*0sv CATA P.0 0tAGNU.T1CS
3p;0oo 0 13Z00 42000 1500O0 C 500 198qo 3?OoU 0 W3.OO 4O~OO 146flo 0 4400 19?00
36001oo~oo aoo 100 MO 100 oo 21600
-aM*)V9 1.10 1.0vI 1A.40 14&SUS'AAC 1 10611 1.110 1.46
aMdILV 1@1 011 1.2!..
lefrIVE 1.116 '4014 1.71
26400O 12.10 7204 36100 37dO 000 9000 ~ S2200 36600 ??q0 10800 S060 30000 1200JOAO 10000 040 720 4:0 33600 26000 4900 46oo 334-JO 12600 .000 2400:6O
SF1 21 31
30340004 000 366 0500 W 1200 46330 3 6000 001 20 S400 10$S 31 6
lQO 0 0800 '320o 0 0 4O 28800 43024A006?912004200
Sri~V 21C1 1.1
£V?PC 3.0e02 .05.
13 o40 mo ,'0 )2k0 16 000 20400 3" 0 100 20.iOD lO 32.00 13200 4OOset? 3' @6
6908" 16102 10400 o4o 30 80 6802801430C ~C 40 2059*ItTOC 27 1300 01 1.1O200 380 000.66ia~~ 4001 2
12000F Ise .000 .2
Sri@ 30
280 00eO 360 40 MO 1 8 600 1600 17200 1000 20A0 720 ne 72000 300. 24100Sri 24 333APO 2000 23800 $o 0##3200 3600 480 16O 14C '0 0 10 8 0 69 ro
SF0 21 30.1200C0 70280 9000 2800C' 10d00 300. 26040 40 1*tOr 18060 11000 C14CR0 1440005ff 33 30
sr., /
..............................-- 2..=0O a 0?Zoe 200 00 I.C.W. 200 .

-219-1
ONN 110 ALOWIII4 FOR NATE O)tL,"2IAIVIN AND [0011PENT AW4411(Wfl PACE 10
LIST of COOMANUSs DATA AMC DIAGNOSTI1CS
-HE?4 1,1300 313 1 .'
IsOV 1? 401 1.27
)0"0 3600 WO 2 000 ? 4000 10200 24000 36000 3baO0 14600 1240h IS400 S@0@Sri 14 34ROO *37,0 S%009 SO*01o 432ov ifilloo 3960 1440o 12000 14'00 )boot 30,04 ?RaceSri V 3020000 J9610 *J2qQ 36000 3fto10 4600 12000 4600 9600 13?oo 50400 43700 36000SE, 60 30,
7200 a a 10400 00 0 0 74ov 240 0 0 3600 7200 0 0 10000 7204 0 0 1060,0 2400 0Sri 23 31 .1 3.00 U00 0 0 1l0400 7200 0 0 10600 2400 6 0 3660 71go 0 0 10400
Sri .4 b .7?3d0 72t-00 746200 W400 0 000 $SZOQ p*000 0 *,o04 3900.0 93200 0 72600 47200
W1 3 65211f,00 '. tol00 22k000 4*4104 a T9.200 94000prUUnp- 17? IV]
AsVE 19102 3I113 1.4..Ide?2 lubi 1#10, 104
A J~A1,103 1611 1,111 1*9Av0VE lot %OKI1.2A..ovF l.12 b0~l 1.27
Sri 30MObO VOOCOg 00M03 3000 U40 '410 b2289 3'i~go 14400 9000 6220 1?400 2400
.Vf IA 3v3M0O lU00 M3CI) tP00 390 1 2 0 ?00 3000 3600 10040 39400 1000 1200 40400SET 29 30.12000 200 ?too 16"qi 3700 "0.0 WcOO S440C 20.00 7200 700 34000.sri 31TASOO a Q 43200 2104, q 0 43Zt0 ZtAno 0 0 43ZCC 9tCO 0 0 10400 1'400 0 0 2aFO0
90 0 0 14400 P6800 0 6 63200 9000 0 0 16660 t6040 0 0*3C00 19ZC0 0 0 2000A4f00 0 10.000 63200 65000 0 16400 %9400 484(-0 0 jV0 0 6360 Isw0 0 wo0 "0400
%T17 P%.0th 00" kip 13." 0ft3 19We 63000 J3600 0 14*00 4320
_____P0 1219

- 4
-220-
7V M
9whIlAs ALt.ORU1? FOR uAt DOCSIN~AI1N AND~ E(W'IPMEN4 LLKnATh1ON PAOC 109
LIST af CC1rn4APIDSo CAIL AND D1A'iNO3STIC
2 AwUfot .1.030 lul.44 4 0
S1.101 1491 1.106 1049
£MflVf 1411 *0XI .1
1P600 340 3000 1!40) 26400 7240 72o@ 36000 Atpoll 10400 10000 rloco 120.4f30 loSr? IS 3024eO lbftoo IMO 300) 3000 1?440 36050 7203 72001 5,4140 30..00 1oAcq 1"00 StOfto
206404 720 7200 3600) 3604n 7?v@ 1o00 54000 30000 7200 7700 60440"b SF? 31
0400 0 0 14400 39200 0 0 MO1000 0o 0 43200 '0640 ft 0 16400 401)0 8 0 14406
2440943200 2bdQ) 0 0 1#3200 19200 0 0 2kCD 2boeo 0 43 *3200 2'.0W 6 a 4370'3
15000 0 6000 20400 33600 0 1640 4320C 5040, 0 Z1000 6'441n IS400 a %60 1940tiSri 17 scIs000 0 t'0oo 20400 4JZ00 0 14%00 s7bao 50400 0 gl'~cp 0'k0o S0600 0 Z10 64600
01600 JOOO 120 0320 014403 97600
AMOV' 10 4014 .71
5'? 303'.e0O ?"'00 ?86*00 390(o '14400 12003 12000 Isbco 10'e00 140 4hoo 13200 24400
S!? 27 Jt'19POO eamcso ?4000 194noo 1929. 26.*01 '3200 )6000 ?bt-OA 3W)OQ 10000h 14400 144041
14004Sri 3140' 0030 . 30 ... .- ..- 01~0.i7200 0 0 I0m32 -~o -)a34o20 604 2070tp01*0niSri14311000J0 4.00 a0 7200 .600 Oco 0 iQ 2oc s 0 liCov 41906 0 0 ma0
6409 0 67%00 60403 46o) '0 2460 27600 2m6.00 0 ?4(14,1 M'V8 0' 0468000 C'6200
70201 0 72400 d20 d'Goo00 9 e 9000 4&I000, a #JUfla %04#)o 43200 0 3"ln 4S00SrT 33 Ili7,004 0 '-&0@ 7Moo $2600 0 S7600 64400
PrwfOS)4 M?2 193
#I~rsooolllI&
4.1%T111 ol11514
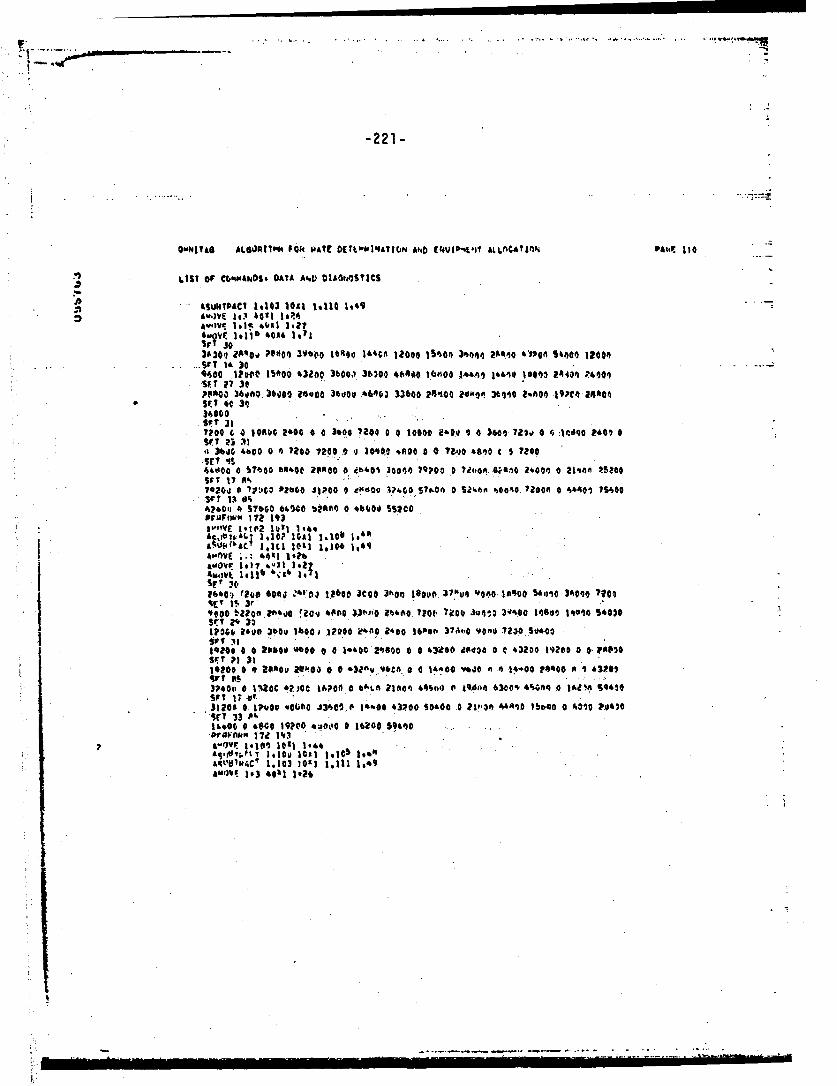
. ......
-221-
Os'NjtAS AL640111- 14 h AUE Offts-11I4A?1CJ(N ANDO (IUI11 £LI.flC4?Tfl 110~~)
6151 Of CO&WiANDSo DATA A'.U D0Ue'STICS
...NP~t 1410 tettil0103 1hc 1 tI~OPM203033)0.00IalO ~ J~ B~ 00 4
A .c 3OojO. 3b01§ lilt bou~03364 80 EM t02A0 9C
.Sr? 23 1*' 300 Me10 0 4 200 Uc. ) J 100P 464000 flHO 148'41 14t ?8004240)10
wt~oo mo 36')00 111( 000 j0u A6.40- 33o0 mo 2d ?m,& 00 Z~00'oo 3I9PC 24
Sri 31 A7204Q * u 24a04 4O a 00 0 ?2e04 30 Aofo jloo 0 U'ffo 7Zo.P a2f 019 ~44-1 TIO
Sri 2S 31-10' 36. 67600 700 7200 -6 - 16040 ROC0 Z 6)0t170SET 4cl. . 1.93
Sr 17 % z 32
?064 0 ?tot* 02oo A'J tPlO 9"60 3?00Ij. 4604 "'*00 IfiGo0 7200 0 400 Mtoo
Pruen" 10"@ 721 5.
A . o i Ji tel41649

-222-
0'ihlTl ALUIR.tflhlO R ATE Dft-huINATION Aafn I.;jvmloifN &LIACAIo' VAAL ItII
0 - LIST OF C('AMkUS. CAU A11 MA' 'tGNOSTICS,
am &MOuVE 101A. 40'1 1.27o3 &-'Ive lt1 4021b lilt
srT 1 3
400O 4j*'g'n?*00 !MC ?200 360&0o 1260n 30an 2'Usi 1..Af0 IZ490J 3001 2600 1.000"S'1 29 3-.IP0a~ 3000 3604 1000v W0?0 3040o Z01) 104n 210oo 000O 4150 13500srT 1I on' 0 ( 28000 lftOg 0 0 2040q 46ne0 a 1440. 19200 0 0 fab00 11200 0 0 24400i?21 31
45.0'f 0 16400 94041 (1.Q 14601; '6(0 0 0 14440 9640 1 0 140 1"e04 0 01 1446$
3itiv, 0 144ov '320 31200 0 MtOD 40400 lSAljft 0 0041 io4sAO 32.00o 0 132:0 4200
33A(. a 14400 43200 15000 0 b-0 19R00 150001) 44 1EO "4 0 0 9 6460 11000SPY 33 b%.
094f.10"' IT? 114)Alku010hL1 k*1G2 1011 1.109 1.4"At~t.Ijj.CT 1.1c.3 loll 1,110 1,.0
A.O(vt: loll? *014 1,71
vbo i-o vbt 13., %Oft 4%5so '3a62 40 4 14440 o 192*,n 2400s 360G S440
4Ui04 2..moo 3964C 36boo 140. 14400 11000D 366400 2d'~0ft 43!10 $6@0 164,00 14400
1,000o 15480 36C00 2Seep 2telCt. 39104t 24001 19200 12ona ?t,40 %(-"I 43POO ?SAOO
Sf1 4a S
%F7100
SIP7 31 0P40 0 63ft00 4500 0 0200 0 -.00 0 20 ?#o70 eZ01 6Cw
SOV 1.0 0' I.1 ILt.b?04L 2400 0 360 UA .0 ~0 10 AO0 70)70 0sr .1 4~333
oA'0'0w 12 193 .7
4-t -0 0114

-223-
(jd4 4 £LOOPP,.NM FORSAT 041 CL?"MATIO% £54') tUYIPMNT &LlfC&Tjn 0ae; lip
LM .List or coWNANdus, c&1b A%o oIwr.oIPcs
01 SET :oo l#4600" 14&00 4'04C 132..0 14400 Ro0ut 0 I" 170. i44co 144cf* 901 W3oo jAAfin 12401
Sri is 3e*0 Do0 !3oo 28*4fk 192oo tAm(oe 2#%son T4Doo 24ooo 31?oo 333oe 2e&66 lo~po
Set P,4 3co* ?*Ofl 43P00u 3bo@c adoton 3*ou 10*110 ll4too 1*0C *360ftn u'no 2&qo* 19p00 PA408
9r1 31V430 0 0, 31J00 2444 0 0 3&oQ Pub1 0 0 3600 2400 o 0 3(.00 4600 0 0 12qo wlo0 00Sit 24 317 100 4von 0 4 7200 ?tot 0 a 11hoO P400 0 0 3600 0400 0 0 1200L
PA40.1 .00 06444 _2400 . 0~ *o Zioo ic%200 ;6400 0 14300 17JI1 21100*0 ? 1O'0 30090it 1? 6%suc. 0 bteOC alovoo %240O0 f~O tioc O0 s 200 0 46011 ssp0 Um00 a %,btoq 754,0sri) 33 e
31?0I at -Ant& 32400 44000 0 03too swo0
*."iV ~.10 100?3Ob,14
Sri 30i2s100 241.0 3000o le l2boo 304,o 3-Ao lo0 l2*0.j 3000t 3'oo 1740C12c 266O~a0SFT is 3.)10.0 t*P.eo 37'i,A 90o.' ??a0 I04, 12040 24n 0 * bl 1sooo ?'00 tocoo *Noo6 33AfteSET 29 3v
ID-, 6OO 72C0 03J 20 24',9 )MI 17400 11*00 340 3^0O 1160
Sri 21 !9600 0 0 141) MOO0 0 0*240 IV00 o a 14400 90%Q'ga0 14*09 t9600 0 c jiw0
SFT ? 2) 79*0 0 C D t9*04, 15600 0 60u40 10401) 3000 *eo )f 34,. A koc o lu**n 9* 0 40Srt3 as
186005 0 S400 MOO0 15660 0 6004 11.0
AL~T 13s3 4.It) 1.4m
An s 3ls 0X a
"090 36800 36610 !20:* 10.04 "t~oo 39AD7 1000') 94J00 SPZ') )0goftf ilo .0 no Snag

-224-
u'ii11 A61,0 11 "Pe 040~ PAIL OClIAA1IMP4 A't. 101I00-ifty £LOCAIII% IIIJ
C- LIST sir COMUA)'.). fUAIA AIM 0Ih0O4CILS
oJ Cu I,C t0 U-21~ 1".!01 U~ 10000 Sf0 2e4UC M41 021 14000set 312Aoo c o opo .iio t~o e pum awn a o t epio to a n ibec.o ra.omA e 43poo
if121 31*. u i k0L 006 'Ifc 4 19io~ eo0i0 -'0 0o zoo-tw it4D 000 0oof I .fato o00
632Cr. 0 1404 P7000 JOapo 0 IC0o 3"A00 31200 9 .1 n 4to.q .oo 31~ 0 I?010 AAROO
t Uo 0 10OC- 61200 32e,00 0 13200 41000
*vrrci-1 172 193
PRO, 4 10.0 2910. 303voo I20i. 9600 12040 350 tl0oo 2014r 2400 36fo~ 324406St? t I t,91 )17 3s
9&00 Je~j 3'OC.o 19,d@ 26boo JbfCo Ao 1A OOo )40 Vp 1320n 11,800 144111 4610'.FT At )
IRV0Sri il41k0o 0 0 7200 a01U 0 0 3000 %Ava 6 0 ?for) 4600 a 6 7200 ?&a* e a 3604 %410 48 0Sri A' 3172M Z4,00 a 0 3600 4,140 0 0 U410 kt'00 0 4 -4010 k%00 a 0 3,500Sri -AsSh"*1 0 '%21O1 '10400 Z4,.iO 0 iljpo 25? 7 .oo S41 J) WC.1 6C00n S2'~f*' 0 %1M. SSP40
?Uh0A A 0 30coo 4.2A00 0 khvoo 55700 234.00 0 Ivg04 22AI10 %?"no8 0 6111111f ci%?afl0t1 43 10-P46006 0 P.flCI' MOO0 Z6400 6 r'too 27400Of)-8tP61 4 172 103A"6Cf 1-100) 1011 1*44
TALT Woo0 lol1 1.106 1466A1%%7AF1,101 1051 1.106 1.49
A-00, let .'."1 1.20%
42. 30two.i 25Ms 39to~ 1614o1 1'4tso. 124100 Ist00 33'Ai 2#0100 19740 26461UO 1f4lo0
1*40-1 1?iUCo ISP60,' S0oo 4320,, 34;tIo 460~4 43d0 30441 2f.'oo 3VA.gi 2401 19140
260,0,. .112,10 31ju0g 20048o 3600.1 00uQQ 12000 tt 0010 ig 1320*1 Mot3 P14,01 43"A

-225-
OWIN I A &LGOOII FCA PATE fl-IN~,1AVION Vat?) f.(OUIOML*.? ALCATIOnW P8 114
LIST Of COMPANUS, UAA &.to OIAokfISTJCS
?Poo 0 0 lose# t400 0 0 3010 -04O 0 1 7210 1401 0 0 3600 Me0o 'I IOAO 7240 0 ftSF A* 31 . ..-
)4to0) '40Oo 0 * 1200 ?100 a 0 POS'O 2.40 .) 0 .40(1 ?2501 0 1 50100
?Pool 4 b4.10 4 00 lp"00 0 'ob%@0 $0400 S26(00 Q 4'3j0 %%8040 It.0'b * P2I 3.00
a 1420J0 900 ?20 a .400 ?S$,04 44000 0 OiJM 1a~ft 12000 0 A440! IIACOaSri %3 ftm
)1e40 0 ~o PP 2200 70200 0 72.0Q 0200 4
AwnV.: 16142 lost 101
&£1;'otkAC?1 10,IJ 1X I.10 J.,09
as-.e. 1.11 *uI Jon
26'01 tn.4 6tfo 3%4104 13200 J690 2641 1644 oo 200 41 3A40 16004 3?0 O.00Sr.? *& 34sAM101 Uoio 30453 ?2J 7,!00 1%0-3 13100 3(43 p-j 4 0 1 0~ 4001 400 WO) 14410%FT Zv Jo-0P~o )'4,60 Me0 300:-i P6404) '200 l00') 361) E400 720 7?AO 30000 9-Sri 3114203 0 0 161100 "41 0 0 11"10 900 0 a 14.0Q 20,444 q 0 -1104 ?490 1 4320453? ' .111400 0 ii 4400 1900 0 0 944)li IV00 0 4 2010o 19SOo 0 0 ?nou 1.260 0. 0 2440osty Is
Ip. I3iou 4?.)00 11606 0 "040 18400 1143* 0 .031 P041% 4 d"Oe 4 14fl',0 fw33004? t 7 qv II
4320's 0 1140.) PlOO SO 4D 81 00i 2400~i 3o a 104-m 316 a 31k33 0 12)4o1 &A*00
3"40-- 0 13104) *'064 J£YOOO 0 14.00 43100 .
*3I43stq 17d 193IU~V~1.541I0 ~ 1.411
Ai 41s*A:t 10101 101 )11.1 1.6q
*)(V. lot1 401 121
3461 1.)00 10000 54 )Of. 1260) 3000 3500 11011' ?2213 4000 A061 1400.19 e )0'3400113? lb 3)1",0 16100 31401' vo.'0 *O0 $240 12,0 0200 540atal4 3F IOC 3630 r404) 1&0t30..
"T 9 303401 50.00o 10000 ujoa 12003 0400 J'.00 1100o 224, '00 6003 344005!? 4120800 0 0 4324000 oo 0 05*ij3 1,0260 a 0 Z-400 ,#6jQ d) a 14ava P4400 1 0 ',PO4

04Nia &I.C41i'-'4 F-a W~t Ew~f41~ *4 C'J-jIP4CN? ALLOCAI WE ts
Lis UOF C0044AMOS, CATA AND OIA'1'OSICS
101q400 a 0 16*90 4160 i, q 1440) Z8100 0 0 43po.) 900.a m 0 14404 11?00 o 0 P440'~
S54o0 0 1100 6440 1#,200 0 $620 2)000 31o t 12)0 #A~wf 1"0~0 ' 10 TWOSset 17 46444oo 0 IAOQQ WzOO 14#400 4 '04 *a9oo ISS130 0 0031 27,41i j 430 110 swoo
IA6E03 0 sooo 20102 31231 0 i1.000 40$00ero,'I. 11t 14) 14sc.h7 -AV I. z 1191 If'44 .4
£AIACV' 1,112 4014 lollSri 3341?at J3'30) 70,100 39ooA 3io 20oio 19e0) z6'oo 33004 MA(10 V-800 36*00 I2000
9t.00 2mo Isto0 14*30 12000 9^00 13ag03168#00 ?044~. 4320: sfo0- Paefit 24AOOSV? 21 Jo1Q200 ?"66lo 14400 U*joi 000 I32M 3%ooo 21000 36voo 4.in 36Coo 2(433o 24000Sr1 40 J030600set 31??to 4 0 1000 4300 30 7200 -'CO 0 '3 7200 2%,10 0 j 3600 Z443 0 0 MtU0720 0 0sty?24 31I"t40.3j0 0 0 ?70 Z60O0 a 0) 12)0 0 0 10400 124', 0 3 10400SI., 4s?PC0 0 0 ) IS60 Z0 *%130j S%!00 6400o 0 57,Oq i44',#1# 2%o00 0 ?169" vs200
?4ir 0 M140) M1000 Pozoc 0 ?zvoo oriloo 44000o 4o ) Swi 4n '001 a 1460 P200Sri 338 ab?P01 0 64900 t?54o00 o&0@ 0 b7605 60400
WOVE.~ 172 4113lt
&WAVE~:o~ 12000 15400 '3OE3,tf :::z
10It 20 slajo vpo11o ~o 3oi3,,a-I4jS OS11SFT 14-3
oec- 4304 o;* ZlaofjV201 C4QC3600 140. 1401 14toI'lo'.33670 4POSty It StPn~o 3-,0o t%4o Ioto 1404 1ZO 3300 M O t?(v 2ton 1460jj -Q ,%0
set so --
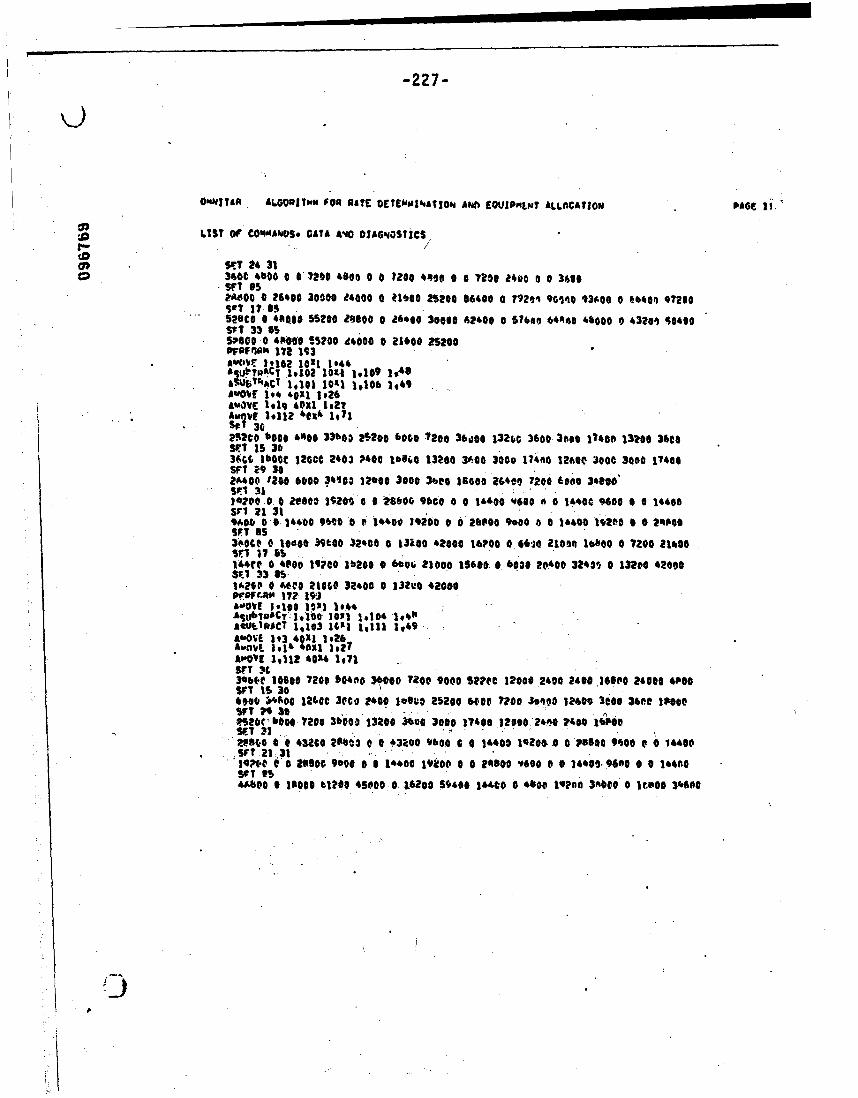
-227-
U
OMWITAA £LO0Iloo FOR RATE 0ETE0Al%ATtON AND CQUIPNLIJT ALLOCATION PAGE Ii.,
:0 LIST OF C0t4MAIJVSo CA14 A4O DIAGNSTiCS,
p Sr.T24 31340C0 00 0 0'7200 4800 0 0 1200 4419 00§ 7200 J40,o 0 0 390
P"00 aC 26410 30000 14000 0 41600 21200 06400 0 19291 96140 93ooo o 064 07200
520CO 0 48000 11200 MOO0 0 t26.00 30000 62400 0 $1600 64440 46000 0 43Mo 40400SVT 33 SISP4GQ 0 400101W200 d4000 0 21600 21200P7PFf)A" 1721113
£51 jbya~Cy 10102 101-1 14109 i~
AUOVF 104 40XI 1*26&£CIVE 1919 4051 le21
2152to boot 4400 33bo; Pf12o0 6000 7280 36goo 132(ot 3600, 3oo 17408 13700o 3690Srt I5 303646 1600 3200 2403 P400 10840 13200 360@ 3000 17400 12EI00 3000 3000 1140SF1 29 302A400 t2ib 6000 3440 12b00 3000 3.ies 16000 26400 7200 6000 MOO@0S" 3130200 100 Rose* 1920S 00 18800 960o0 00 14400 V600 a a 1440C 0600 a00 14406SF1 21 319#1, 09 14400 9"08 0 14400 10200 006 2000 9e00 4 4 14400 19200 0 0 239000SFT IS3AO8CO 0 1064 O 30 00 0 13100 42000 10200 0.61 26105 16600ac 0 1200 21600
144(0 0 4600 19200 16200 0 6006 21000 15600 0. 6000 20400 32431t 0 13200 429005'0 33 Is-14200 0 4000 21090 32400 0 132vo 42000
pe.s.1?? 193AWAQVI Igloo 1121 104*SI~b7Oa#CT: I,1ti 1011 1.104 21#11£.UIRtCT 1,193 j1.a3 1,111 1,69ANOVE Mt 421111.264manb 3934 ox1 o2APOVE 1,112 6014 1.71S9*T It13001-t 10900 7200 5041.1 36000 ?ROO 9000 S??oc 12000 2400 P2600 .3660 24000 4000WT I 130600o vfiOo 1264C 3VCj 2400 logito Met0 6000 7P0o SosoG 12609 eOOp 3400 19000WT " 30MO920 00 7200 36o13200 31. 00 3 74000 24'0 ?400 IWOf
SET 31.M669 0 0 43200 26#J03 0 0 *3200 96b04 .60 14400 1020$ 0 645600 9500 0 0 14400VT .21,3110200t 0'0 2801 900 $0 14400 19kO00 00 2A800 Y60O0 0 34401-9600 0 0 1449C
44000 0 13000 t1200 45090 0- 14,200 $9400 14400 0 -6800 19POO 34to 0 1WO0 3%600

-228-
C5 ,I.S1 fIF COMAhOSo OATA £'.O 0ACpuSTICS
02..r I1 ? bsO 15~~Ote C S*oo 30AbO )C*oo 6 aIM %?OO 16260 0 OW~i Ploto 3?'*.o 1 13?40 42600
It..'f.0 C 160C PN(.I: 1,406 C ,eov 3'ic",c-rurof-.. 172 19j
£A,9rulf 10102 IAI 1113
400VE 10? 411 1.26A-0. 1.4 *,hal 1.2?
MCI)q PtIGOO 1920(;- 26f*tI
5 0',C.o '3200 420(_ S4000 33601, 21 boO 24001 31poo 3440C 4
SPY 1 3024btou 437.10 5Su,r 120001 969&i 1440C 1000£ 1440p &14j~f 14&frl 114rCI 366.( 2;%406Sri 2? 3
4U3ro. b ~tO 11000 V6 100a t ' %c 140 Inca v2o , 0 1Gn~cP no@' 14o 94C'O 1!40f0
30'0' MO0 0 0 IWO0 Z400 0 C 300C 7400 0 C 3000 24Oo0 3P0
$1A t411fQQ b~pp0 0 170 3t00o 0%4C bt fOo 57t.0e o.5"'S o o"o ~o io
?'..0 740(o j!MrCo PIMC0 Q jb'(Q ]C000 74,?Cp 0 7efloo G~,0 ?'01 0 10t nI70,%r; t.3 rS
;'040 tMOP i 000 264CO 0 44O 276.00
OP.4
Sri40340
Z16)240 0C 30 p lo9CC 1 0 7200 ?24c.0 10o 0 432Q0 0 '2'4 tIC 2 *00 4 3p..,~f
Si 231200 0 c 360 00 1'.0 0 7200 0Z 1.1'0 .109 0 ,POC 30' ?at.( woA031074 p
471l- IZ7 * 0 0 fde7O e .; o 3611 *'.'o '0 0,74P 4 201 00
33200 0 V-%Or 37.00 1920.0 0 ?>Co .'2400 1464c 0 7'Pno ooCp ?igfi 6 Akof 754.9

-229-
fLf C0014.Ub, LAIA &.() 11461 CJSIICS *ZUe",' f. i2bUC 'C0 L 5!700
&*4ME 1.114 40#4 1.P7SC t Ic21444-AQO 10I% 41 33600 Pt'400 ?2I.t 6CC0 Men~ 3600c1PI 72A0 *0Q(73 3dc4qSri Is 30??esl b0440 12acC 30e.a 2%oo lb'"" 1i~ ?'00 24010 IbARO "40 400 ?2*1. 341)1%
Pi4(t- *IA3 1200~ 3 0C0) WOO0 IZC* ?Pta 5040t% .13206 16.0 3Ei-(' 1.t'a01 p4' (0 0 21a11L 11024a' 0 0 2.ro(t Zt..hfo 6 1. 4s200 ?a-gvo 0 f 432C.. IEsO.Or C f 144POSir1 11 31
94%', '. C fc( 0 t 0P1O 1'Wt.' C 0 *?"OhO ef-SP1 0 ( &32.1h.4&l0 'f 0 14441'Sq T '.S3121 t. 0 17000 Ofit*00 .J2440 0 POO1 62Mf 46ro.A 0 IWA ~ S0.ci IW4 te -98,0
SfT 13 $5
)&# MOOV 57b0 IAO 0 72ve 116000*-i J# C-' 1??1s -4
O
P41&cr '2CC fct 3.bcv 3J00 7240 Sacn 2 2i Mo iii io 0III."e ,1i? e' A.Sri is 3c4344c, 33#40o 37lo YCOj 0000 4~2o 36fu1 MfC 906A W2?10 gi'40 00 ; 3(-we@
7.~r 40r. 3C 19(tOJ 37000 Ver0 7?2,..fCo C1 S ' I VO3o .j 3 )3Sf1 31~i@* @c k*2tfo- it a*':.zo ac ott v r P100 *11A;. It c 0 ~~~.S"7 21 31pAPF&i f'C'73?.I 0 F@ 96C.0 0 0 V.400C e -Dlft Q ( 'j2A* I'3 ' .f
llp.oe0 20 *2*00 .5400 0 lobe0o3 $*'C3 '5000 0 .Ieei Ss4" 1off 2- 0 Cttt 1.4ti
Sfrc t7 I~PVPO *1200 -fPOP0 It-CG's.5t 0 3i)?40 l2to-itA t$~ep cc#) ?.wt
4if.4' it-POO S94cC IwoF 0 mo~ 21309vfW(.1.- p 19
'10OI joft2 ell j,14

-230-
We 011 1#27A.U1.4 10112 4614 loll
SfT 1& 30VIA4 r ),?Cc ?4,40 14000 1209.0 021'Cv tibe(' 4i200 30floA 3fPaR 0A Lmkf&.f'
14, ZO,)%Q(, 280o0 t'CtV lqeoo 20%ft 3.1000 jej"eo ?414% ia' 3 'eoo)tfjj ~0(.Ofr 31 35437ID1 $4000
Mu to 0 14401) 7200 j 0 1I 26000 0 a 300f ,o 0e 0 72c.C . o ' 3F'4 ?rc 0 0sF? pa 311i1447 C P , 6 10 W00 VAOC 0 E IhO &POO0 C 7200 7200 0 IVIIJA'
91w. 0 46400 S7eoc 1440c 4 50100 Af4o0 ?16&10 0 M~e, p;PF~c irt! f, As,44f. %S2440Art 17 64
ph fip , 000 fl1?00 0 ?2100 A?r00 ?"POO 0 ?been~ 3ce'.r4 41tA C £370' 9!00Sri 7) 14% *
S~j 4?nPCO OCLC.0 7%21.O0 7 2M0 MOOCarba.sh' 372 If,
1*100 161W1 t ela CI.511
SFI .It1*7M!200 11 C eti 1 9bC~ 0 06 @ . 700 0IO20.0 114~bo 63o *eFC ?.1 ?'
Poto 144"m 16cr 0 100 ?osto 2,0 C JO 00 C1fl C 6wJ 7700I t?.2C ;I~ 260C013
770CC V-404.0 12000 o0C 9500 0-o P4OC2000 wiioC 1020 ;?t: '~ 164W. C*ti 12c.' 49'
ear? ?I?778C a c )*og 21000 0 3C c k0 1oc*0 '0 F(406 0 424 '.'C 10f 0 0 M&T1 70C 0Sf 1 '4310
96,601k' 172 Is, ST011