Best Available Copy - DTIC
264
03 cy,= SSD 82-0165 GPS IIGS DESIGN ANALYSIS REPORT VOLUME I NOVEMBER 15, 1982 Contract F04701-76-C-0216 CDRL 008A4 Jack Radak Secondary Payloads Program Manager DTIC S ELECTED LAg B 9 Rockwell International Spme.opwasoftw/I fnbg adf Sammetil Ssystw" Ovtel DISTIBUTION STATEMENT A 82 12 02 029 A~wv" tot ubWk rdoxa;82 12 02 02 ,DtaDtufim Unlimited I Best Available Copy
-
Upload
khangminh22 -
Category
Documents
-
view
0 -
download
0
Transcript of Best Available Copy - DTIC
03cy,=
SSD 82-0165
GPS IIGS DESIGNANALYSIS REPORT
VOLUME I
NOVEMBER 15, 1982
Contract F04701-76-C-0216CDRL 008A4
Jack RadakSecondary Payloads
Program Manager DTICS ELECTED
LAg B
9 Rockwell International
Spme.opwasoftw/I fnbg adf
Sammetil Ssystw" Ovtel
DISTIBUTION STATEMENT A 82 12 02 029A~wv" tot ubWk rdoxa;82 12 02 02
,DtaDtufim Unlimited I
Best Available Copy
sp.o o•wsOns/In9t.~oi & l RockwellsIwits Syuisms O.ision 01% International
FOREWORD
The results of the GPS secondary payloads, Integrated Operational NuclearDeto..iatLon Detection System (IONDS) design analysis task, performed by RockwellInternational Space Operations/Integration and Satellite Systems Division forthe TTUL' Space and Missile Systems Organization under contract numberF04701-76-C-0216, are documented in this report. Much of the effort that ledto the results presented in this report originated with the IONDS legacy taskdefined in contract amendment P00072 to GPS contract F04701-74-C-0527. Thereport, published in two volumes (Volume I, GPS/IGS Design Analysis; andVolume II, GPS Spacecraft Impacts), has also been selarized in the 'GPSSecondary Payloads Executive Sumary Update," dated Feb. 20, 1978. TheGPS/IONDS interfaces developed through this effort are documented in:
* GPS Secondary Payloads RF Compatibility Test Report (SD 77-GP-0046)
s GPS Secondary Payloads IGS Component Integration Test Report(SD 78-GP-0010)
* GPS Secondary Payloads Integrated System Test Report (SD 78-GP-0012-1)
The IONDS subsystem described in this report is the basic design tested onthe Engineering Test Vehicle (ETV). This GPS/IGS Design Analysis Reportsumnarizes the design and validation testing performed on the IGS payload todemonstrate the projected capability of IGS and assure compatibility with GPS.It is the culmination of several previous editions as draft copies for internalprogram reviews and references. The report is intended to describe thedesign/validation phase of the IGS program and therefore reflects the status ofthe program as of September 1978. Subsequently, several changes have occurredin the program, including incorporation of some of the recomended changescontaine4 in this report. Rowever, these changes are not part of thedesign/validation phase of the program and were not described in this report.
The analysis and testing efforts for the above tasks were nanr•eed byR.r. D%'usilio and J.A. Canaday. Technical direction was provided byD.S. Hercadante. This report was compiled by E.J. Dryer and P.J. Berndsen,with major contributions from R. Feldt, T.H. Moore, W.D. Eden, R.A. Gronlund,A.C. Goo, F. Knovlden, and C.W. Huston. The radio astronomy analysis,contained in the appendix, was prepared by Dr. L.O. Krause.
U.S. Air Force personnel who coordinated the tests included Lt. Col.A.H. Hayden, Capts. U. iHatlelid. R. Leaaard, and B. Shelton, andLt. Marilyn Jovdy of SAM-SO.
0 AvailL-bi1111 7ne
:Avail t/i
-Spec - ..
'4
Space Op.ratio.s/ Intgration & l RockwellSateli st.. S oims"DiW oi International
CONTENTS
Section Page
1 INTRODUCTION AND SUMMARY . . . . . .... 11.1 Introduction . . . . .. .. 11.2 Program Sunmmary .. . . . . . . 9
2 NAVSTAR GLOBAL POSITIONING SYSTEM (GPS) ..... 172.1 GPS Objectives . . . . . . . . . 172.2 GPS System Description . . . . . . . 182.3 GPS/IGS Interfacing Subsystems ..... 19
3 IONDS GLOBAL SEGV1ENT (IGS) . . . . . . . . 273.1 IGS Objective . . . . . . . . . 273.2 IGS System Description . . . . . . . 273.3 IGS User Operations . . . . . . . . 35
3.4 GPS Time and Frequency Synthesis ..... 393.5 Code Characteristics . . . . .. . 393.6 Dovalink System Data. . . . . . . . 42
4 GPS/IGS SUBSYSTEM DESIGN . . . . . . . . . 594.1 Requirements and Constraints ..... 594.2 IGS Design . . . .. 594.3 IGS/GPS Design Integration ...... 92
RELIABILITY . . . . . . . . . . . 115.1 Reliability/Compatibility Analysis . . . . i15.2 Reliability Predictions and Failure Mode
Effects Analysis . . . . . .. . 1125.3 Critical Item List . . . . . . . 1175.4 Parts, Materials, and Processes . . . . 118
6 TEST PROCRAN . . . . . . . .. . 1196.1 Test Plan . . . . . .. .. . 1196.2 Component Tests . . . . . . . . 119
6.3 L3 Subsystem Tests . . . . . . . 1286.4 IGS Systes Tests . . . .. . . 1326.5 GPS Integration Tests . . . . . . . 1526.6 GPS/SPL Thermal Control Tests . . . . 204
7 CONCLUSIONS AND RECOMME•iDATIONS ....... 217
7.1 Conclusions . . . . . . . . 2177.2 tecommendations . . . . . . . . . 218
APPENDIXRADIO ASTRONOM(Y INT-,TEFERENCE STUDY . 219
t--
Spca. oOp.e.ons/Itnwgraton & RockwellSatellite SYStms omviow01% Intemational
ILLUSTRATIONS
Figure Page
I GPS-SPL Configuration . . . . . . . . . . 52 IGS Functional Block Diagram ......... 53 IGS/GPS Components . . . . . . . . . . . 74 IGS L3 Transmitter Chain ......... 85 L3 Encoder . . . . . . . . . .. . 86 L3 Encoder Circuit Board . . . . . . . . . 97 IGS Development Schedule . . . . . . . . . . 10
8 FSV 6 Schedule . . . . . . . . . 129 GPS Program Plan . . . . . . . . . . . 17
10 GPS Space Vehicle Subsystems ......... 2111 Navigation Subsystem . . . . . . . . . . . 2212 TT&C External Interface . . . . . . . . . . 2313 Functional Flow Diagram . . . . . . . . . . 2714 Installation of IGS Components on GPS Vehicle .... 2915 IONDS Data Coding . . . . . . . . . .. 3016 Baseband Interface Timing Relationship ...... 3017 IGS Data Format . . . . . . . . . .. . 3118 Encoder Timing Diagram . . . . . . . . . . 3219 IONDS/GPS Receiving Terminals ..... ... 3320 IONDS Receive Block Diagram ......... 3421 IONDS Receiving Terminal Processing Functions . 3422 Global Burst Detection Parameters ....... 3623 Relationship Between SV Times .. .... . 3624 P Code Generation . . . . .. . .. . 4125 L1 P Signal - Flux Density at Ground Versus Frequency . . 4426 L3 P Signal -Flux Density at Ground Versus Frequency . . 4527 Typical Transmitted Carrier Phase Noise Spectral Density
Versus Offset Frequency at 10.23 MHz .... . 4628 GPS Received Power Versus User Elevation Angle,
Ll and L2 . . . . . . . . . . . .* 729 Flow Chart for User Implementation of Parity Algorithm . 5730 IONDS/GPS Overall Block Diagram ........ 6031 GBD Block Diagram . . .. . . ... 6232 Baseband/Proceasor Functional Block Diagram ..... 6433 IONDS Modified Baseband . . . . . . .. 6534 Bastband Board 2 With SPL Components Added ..... 6735 L3 Encoder Block Diagram ......... 6836 Block Encoder/Sync Detector Block Diagram ..... 6837 Differential Encoder Block Diagram ..... 6938 C,.nvolutional Encoder Block Diagram .... ... 6939 L3 Transmitter an& Encoder Schematic . . . 7140 L3 Transmitter Characteristics (EDO) .... 7241 L3 Switch and Power Divider (ED)4) .. .. . 7242 L3 Encoder. . . . . . . . 73
vii
pAM g~iffowr mA
SpW.c oaeinons/Ini•e.aoon dI Rockwellsawft. Syswms WV" 01% Intemational
Figure Page
43 L3 Transmitter Assembly Block Diagram ...... 7344 L3 Synthesizer Mechanization ........ 7445 Loop Logic Schematic . . . . . . . . . . 7646 Loop Filter and VCO Schematic ... ... . 7647 X9 Frequency Multiplier Schematic ... .... 7848 AGC Amplifier Schematic . . . . . . . .. . 7849 BPSK/QPSK Modulator Diagram ......... 7950 Quadriphase Modulator Diagram ... ... . 7951 IPA/HPA Block Diagram . . . . . . . .. . 8152 IPA/UPA Schematic . . . . . . .. .. . 8153 Power Monitor Block Diagram ...... .. 8354 Power Monitor Schematic ....... ... 8355 Coaxial Switch Latching Drive Assembly ...... 8456 Power Supply Block Diagram ......... 8557 Dc/dc Converter Schematic . . . .. . .. . 8658 +20 Volt Series Regulator Schematic ....... 8759 Diplexer Schematic Diagram ...... ... 8860 Triplexer Schematic Diagram . ........ 8861 Triplexer Frequency Response Characteristics ..... 8962 Triplexer Block Diagram .. ... ... . 8963 IGS Diplexer/Triplexer Modification . . ... . 9064 GPS/SPL Antenna . . . . . . . . . .. . 9065 Principal Plane Radiation Pattern .* .. ... 9166 Timing Interface Box . . . 9267 Hagnitude Command Format ... .... .. 9568 Magnitude Command Data, Clock and Enable Signal Phase
Relationships . . . . . . . . . 9669 Discrete and SOM Telemetry Interface Schematic
(Reference) .. . . .. .... 98
70 Encoder Interface Timing Relationship . .. 0. . 1071 Sensor Processor/Load Control Unit Inter~ac.- Simplified
Schematic (Reference) . . . . . . .. . 10172 IGS Grounding Schematic . . . . . . .. . 10373 X-Sensor (BDZ) Field of View . . . . . .. . 10474 Integrated SV/PSE Configuration .. .... 10575 GBD Test Set Interface . .. . . . 10676 L3 Transmitter and Encoder Reliability Logic Diagrams . . 11377 Baseband Processor Reliability Logic Diagram ... . 11478 Triplexer Reliability Logic Diagram .1... . . 11579 Li, L2 . and L3 Reliability Logic Diagrams .. 11680 LI, L2 , and L3 Reliability Comparison ..... 11781 IGS Parts Selection Process ..... 11882 GPS Full-Up Antenna Configuration . . . . . 12083 LI Gain Impact . . . . . . . . . . . . 12084 Ll Ellipticity Impact . . . . . . . . . 12185 L2 Gain Impact . . . . . . .. .. . 12286 L2 E1lipticity Impact . . ... . 12287 Triplexer VSWR Plot, Port I to Port 4 .. 12488 Triplexer Loss Plot, Port 1 :o Port 4 ... . 12489 Triplexer VSUR Plot, Port 2 to Port 4 . . . . 125
viii
Uae opefotn/Ingrato n a Rockwellsaes SySms l Intemationsl
. Figure Page
90 Triplexer Loss Plot, Port 2 to Port 4 . . . . . . 12591 Triplexer VSWR Plot, Port 3 to Port 4 . . . . . . 12692 Triplexer Loss Plot, Port 3 to Port 4 . . . . . . 12693 Triplexer Loss Plot, Port 3 to Port 1 . . . . . . 12794 Triplexer Loss Plot, Port 3 to Port 2 . . . . . . 12795 L3 Transmitter and Encoder Development Procedure . . . 12996 L3 Transmitter and Encoder Engineering Model
Test Sumary . . . . . . . .. .. . 12997 Prototype Circuit Data . . . . . . . . . . 13398 Junction Temperature . . . . . . . . . . . 13499 L3 Transmitter Power Loss Distribution . . . . . . 134
100 1381-)Ez Filter Response . . . . . . . . . . 135101 Breadboard Tests - Encoder . . . . . .. . 136102 Breadbnard Tests - Squaring Amplifier . . . . . . 137103 Baseband Processor Readiness Test . . . . . . . 137
104 Encoder Readiness Test . . . . . . . . . 138105 BDP Readinest Test . . . . . . . . . . . 139106 Baseband/Encoder Readiness Test . . . . . .. . 141107 EDC Overall Test Configuration . . . . . . . . 143108 Block Diagram - Final ICI . . . . . . .. . 145109 ICI Overall Test Setup . . . . . . . .. . 145110 Final ICI ETV Configuration . . . . . . .. . 146111 GBD Test Set (CANOE) . . . . . . . . . . . 147112 Checkout Equipment for the ICI Test . . . .. 151113 IGS Covitrol and Monitor Test Set Equipment Layout . . 153114 ETV RF Compatibility Test Configuration . . . . . . 155115 Electrical Test Vehicle Installed in Anechoic Chamber 156116 Signal Compatibility Test System . . . . . .. . i56117 Ll User Impact . . .... 157118 L2 User Impact . . . . . . .. 158119 Intermod Test Equipment on ETV .... . 159120 IGS Telecom Test Set . . . .. . .. . . 160121 Data Acquisition, Control, and Processing Test Set . . 161122 DACP Peripheral Equipment . . . . . . . . . 161123 TT&C Intermodulation Noise Test Results .. . 162124 Cross-Strapping . . . . . . . . . . . 165125 IGS Test Configuration . . . . . . .185126 10.23 M1z Distribution . . . ... . 185127 Cross-Strapping Results . . . . . . . . . 186"128 IONDS Receiver Threshold Sensitivity Test Setup . .. . 189129 Delay Offset Correlation Loss . . . . . . . . 189130 DTV With Secondary Payload Hardvare on Forward Bulkbead . 192131 Alternative Sunshade Hountings . . . . .. 194132 IGS I-Sensor Random Vibration Qualification Levels (X-Axis) 195133 IGS X-Sensor Random Vibration Qualification Levels
(Y- and Z Axes) . . . . . . . . 196134 IGS Y-Sensor Random Vibration Qualification Levels (Y-Axis) 197135 IGS Y-Sensor Random Vibration Qualification Levels
(X- and Z-Axes) . . . . . . . . . . . 198
ix
>I
spne opPo en/In"Orua" a d h Rockwells~autu SyruiMs OWW" Intematlonal
Figure Page
136 BDP Y-Sensor Random Vibration Qualification Levels (X-,Y-, and Z-Axes) . . . . . . . . ..__ 199
137 L3 Transmitter and Encoder Random Vibration QualificationLevels (Y-Axis) . . ... . . . 200
138 L3 Transmitter and Encoder Random Vibration QualificationLevels (X- and Z-Axes) * .... . . 201
139 Triplexer Random Vibration Qualification Levels (X-, Y-,and Z-Axes) . . . . . . . .. .. . 202
140 SPL Doubler Requirements . . . . . . . . . . 207141 SPL Equipment Nodal Location - Forward Face,
Forward Bulkhead . . . . . . . . . . . 209142 SPL Equipment Nodal Location - +Y Shear Panel . .. . 210143 SPL Equipment Nodal Location - -Y Shear Panel . . . 210144 SPL Equipment Nodal Location - Forward Face,
Aft Bulkhead . . . . . . . .. .. . 211
145 Proposed SPL Radiator Addition . . . . . . . . 211
SW*ooa /aonelnssuoa I lk Rockwell
S8441s4 S"s ms DMIol International
TABLES
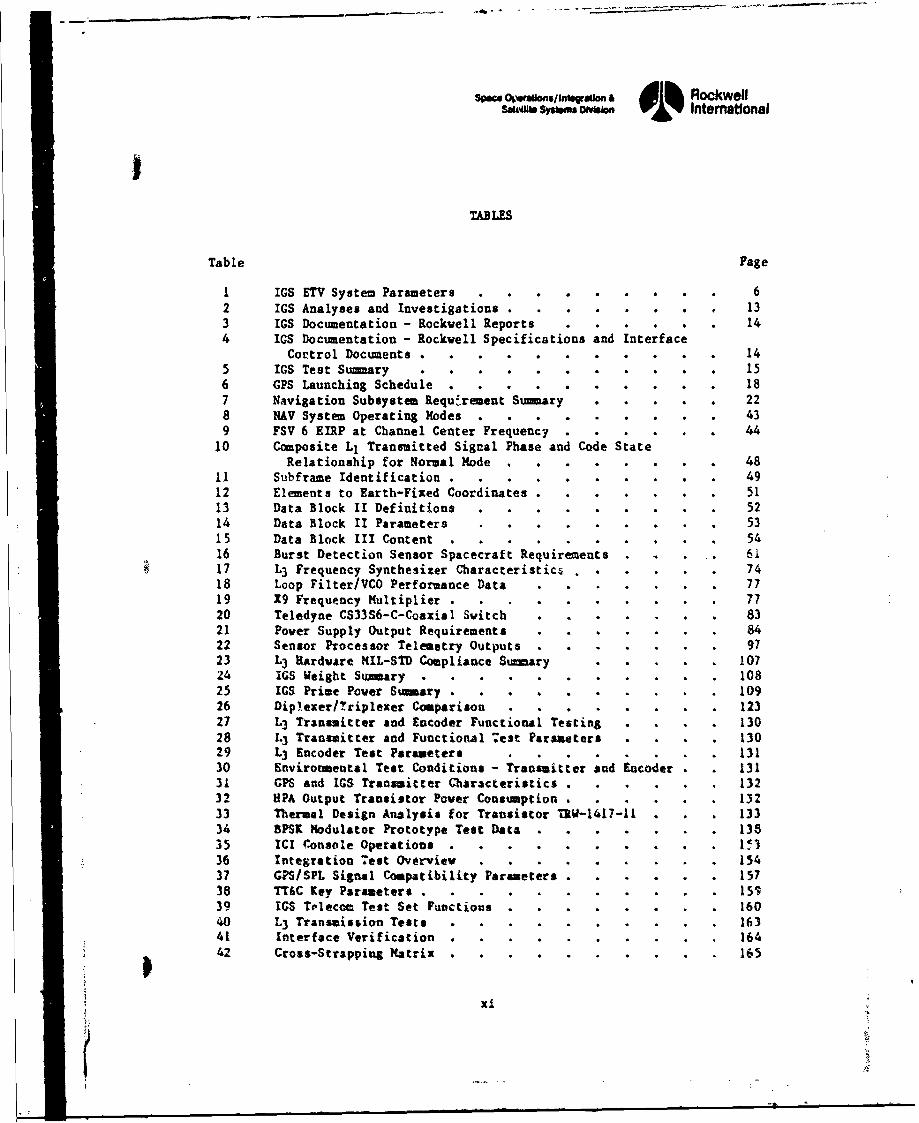
Table Page
1 IGS ETV System Parameters . . . . .. .. . 62 IGS Analyses and Investigations . . . . . . . . 133 IGS Documentation - Rockwell Reports . . . . . . 144 IGS Documentation - Rockvell Specifications and Interface
Cortrol Documents .. . . . . . . . . 145 IGS Test Summary . . . . . . . . . . 156 GPS Launching Schedule . .. . . . . . . 187 Navigation Subsystem Requ.rement Sumary . . . . . 228 NHAV System Operating Modes . . . . . . . .. 439 FSV 6 EIRP at Channel Center Frequency . .. . 44
10 Composite L1 Transmitted Signal Phase and Code StateRelationship for Normal Mode .... . 48
11 Subframe Identification . 4912 Elements to Earth-Fixed Coordinates .. . 5113 Data Block II Definitions . . . . . . . .. 5214 Data Block II Parameters . .. . ... 5315 Data Block III Content . . . . ... 5416 Burst Detection Sensor Spacecraft Requirements . . .. 6117 L3 Frequency Synthesizer Characteristics 7418 Loop Filter/VCO Performance Data . .. .. . 7719 X9 Frequency Multiplier . .. 7720 Teledyne CS33S6-C-Coaxial Switch . ... . 8321 Power Supply Output Requirements .. 8422 Sensor Processor Telemetry Outputs . . ... 9723 L3 Hardware MIL-STD Compliance Summary . 10724 IGS Weight Sumary ... . .. . .. 10825 IGS Prime Power Summary . . . .. 10926 Diplexer/Triplexer Comparison . . .. 12327 L3 Tranasitter and Encoder Functional Testing . * . 13028 L3 Transmitter and Functional -eat Parameters . . . 13029 L3 Encoder Test Parameters . .. .. . 13130 Envirormental Test Conditions - Transmitter and Encoder 1. 3131 GPS and IGS Transmitter Cbaracteristics . . . .13232 HPA Output Transistor Power Consumption & 13233 Thermal Design Analysis for Transistor LRW-1417-11 . . . 13334 8PSK Modulator Prototype Test Data 13835 ICI Console Operations .M.. . ... l.136 Integration *est Overview . . .. 15437 GS/SPL Signal Compatibility Parameters . . . . . 15738 TT6C Key Paraseters . .... 15939 IGS Telecoo Test Set Functions . .16040 L3 Transvission Tests . . .... 16341 Interface Verification v . . . .16442 Cross-Strapping Matrix . . .165
Xi'; X
Spa*e 0petaiOs/ Inbgraihch &~ RoCkweUlsw* Suftsomei Intemsntiona
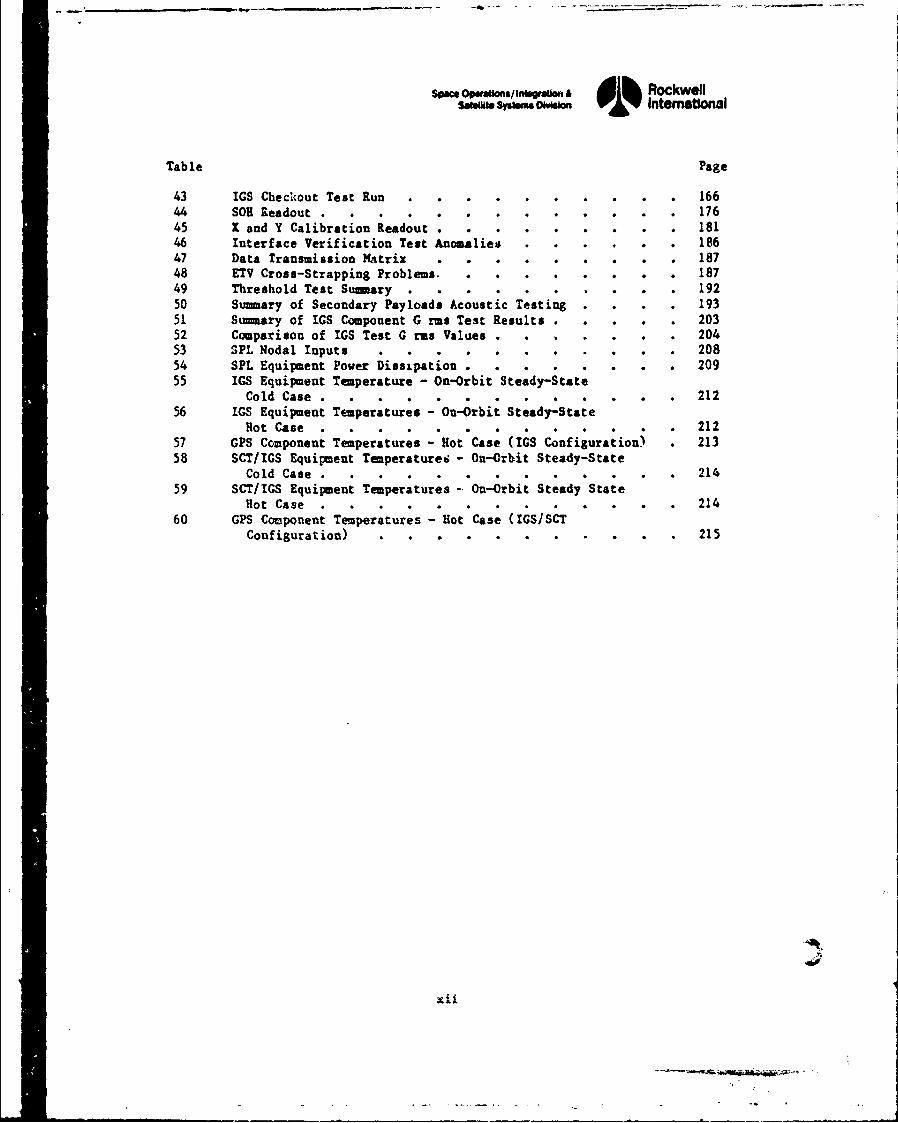
Table Page
43 IGS Checkout Test Run . . . . . . . . . . 16644 SOB Readout . . . . . . . . . . . . 17645 1 and Y Calibration Readout . . . . . . . . . 18146 Interface Verification Test Anomalies .... . 18647 Data Transmission Matrix . . . . . . . . . 18748 ETV Cross-Strapping Problems . . . . .. ... 18749 Threshold Test Su-ary . . . . . . . .. . 19250 Sumary of Secondary Payloads Acoustic Testing . . . . 19351 Sumary of IGS Component G rms Test Results . . . . . 20352 Comparison of IGS Test G rms Values . . ... . 20453 SPL Nodal Inputs . . . ... . . 20854 SPL Equipment Power Dissipatiou . . . . . . . . 20955 IGS Equipment Temperature - On-Orbit Steady-State
Cold Case . . . . . . .* * * * * 21256 IGS Equipment Temperatures - On-Orbit Steady-State
Hot Case . 0 21257 GPS Ccmponent Temperatures "Hot Cas; (IGS Configurationi 21358 SCT/IGS Equipment Temperaturei- On-Orbit Steady-State
Cold Case . . . . . .. .. o 21459 SCT/IGS Equipment Temperatures On-Orbit Steady State
Hot Case . . . . . . ... o 21460 GPS Cooponent Temperatures - Hot Case (IGS/SCT
Configuration) . . . . . . . .. . 215
Xii.
som opmu"sfr•/uuosig dn& RockwellSjsfI5,gm.n Oew IntematIl
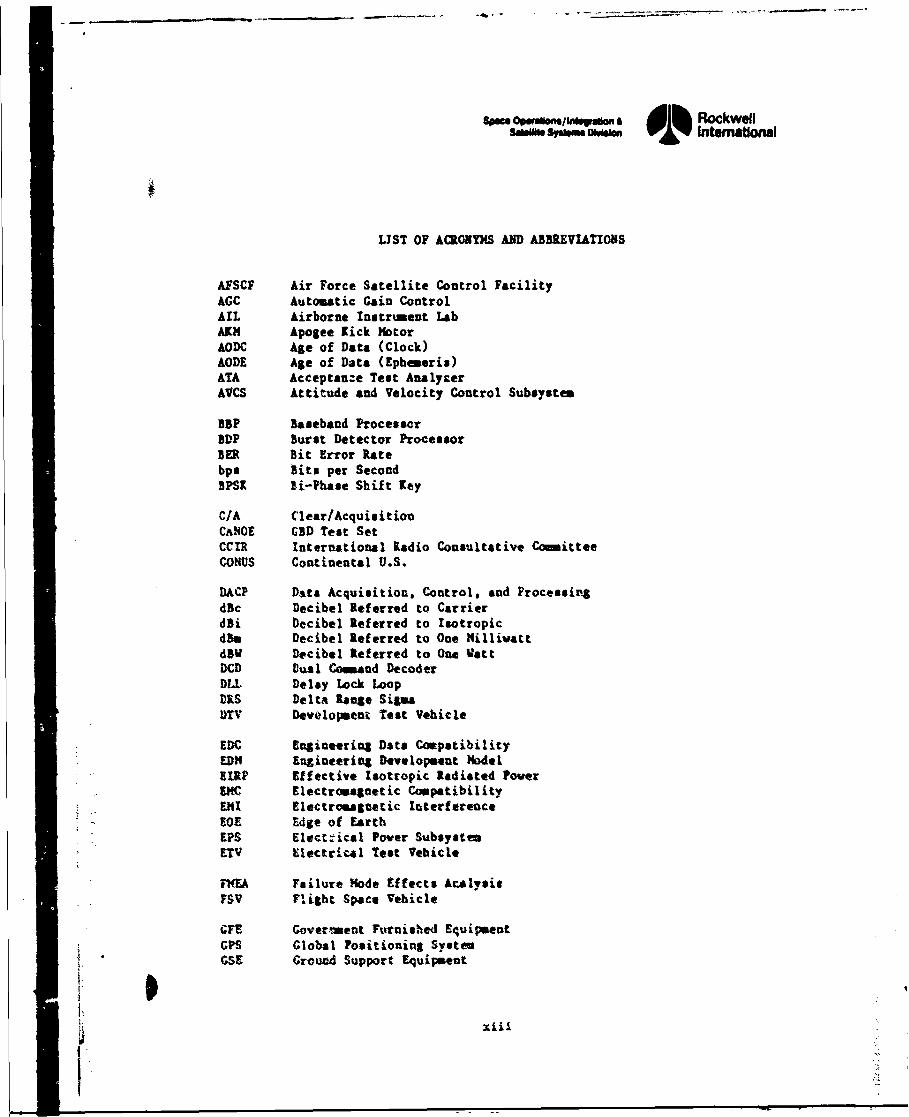
LIST OF ACRONYMS AND ABBREVIATIONS
AFSCF Air Force Satellite Control FacilityAGC Automatic Gain ControlALL Airborne Instrument LabAKM Apogee lick MotorAODC Age of Data (Clock)AODE Age of Data (Ephemeris)ATA Acceptanze Test AnalyzerAVCS Attitude and Velocity Control Subsystem
BBP Baseband ProcessorBDP Burst Detector ProcessorSER Bit Error Ratebps Bits per SecondBPSX li-Phase Sbift ley
C/A Clear/AcquisitionCKNOE GBD Test SetCCIR International Radio Consultative CommitteeCONWS Continental U.S.
DACP Dfita Acquisition, Control, and Processip4sdBc Decibel Referred to CarrierdBi Decibel Referred to Isotropic4Bm Decibel Referred to One NillivattdBW Decibel Referred to One VattDCD Dual Command DecoderDLL Delay Lock LoopDRS Delta Range SiWma)TV Developmens Test Vehicle
EDC Engineering Data CompatibilityEDM Engiaeering Development ModelEIRP Effective Isotropic Radiated PowerEKC Electromagnetic CompatibilityEMI Electromagnetic I&terfereaceWE Edge of EarthEPS Electrical Power SubsystemETV Eiectrical Test Vehicle
FWEA Failure Mode Effects AcAlysi¢FSV Flight Space Vehicle
GFE Gover.•ment Furnished EquipmentGPS Global Positioning SystemGSE Ground Support Equipment
lii
1'
Space op*,•fl.,m/a•oe a RockwellS"" &Is* ommm V Intemational
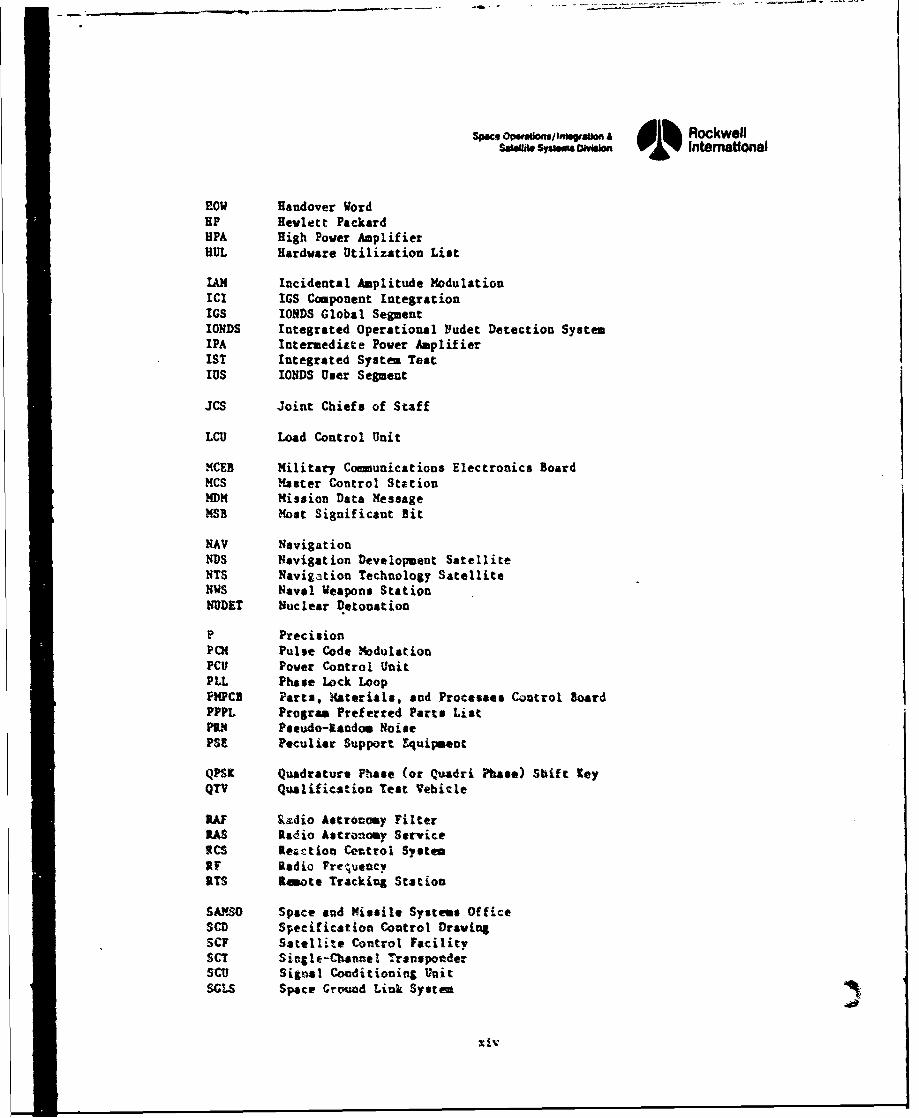
ROW Handover WordHP Hewlett PackardHPA High Pover AmplifierHUL Hardware Utilization List
IAN Incidental Amplitude ModulationICI IGS Component IntegrationIGS IONDS Global SegmentIONDS Integrated Operational Pudet Detection SystemIPA Intermediate Power AmplifierIST Integrated System TestIUS IONDS User Segment
JCS Joint Chiefs of Staff
LCU Load Control Unit
MCEB Military Comunications Electronics BoardMCS Master Control StationMDH Mission Data MessageMSB Most Significant Bit
NAV NavigationNDS Navigation Development SatelliteNTS Navigation Technology SatelliteNWS Naval Weapons StationNUDST Nuclear Detonation
P PrecisionPat Pulse Code 1odulationPCU Power Control UnitPLL Phase Lock LoopFMPCB Parts, Hateriala, and Processes Control BoardPPPL Program Preferred Parts ListP14 Pseudo-Rando* NoisePSI Peculiar Support Equipment
QPS[ Quadrature Phase (or Quadri Phase) Shift KeyQTV Qualifisation Test Vehitle
W &Adio Astrotomy FilterRA Radio Astronzoey ServiceICS Remtioa Control SystemIF Radio FrequencyITS Remote Trackiag Station
SAYISO Space and 'Missile Systems OfficeSCD Specification Control DravingSCF Satellite Control FacilitySCT Sinl•e-Chmnnel TrensponderSCU Signal Conditioning UnitSGLS Space Cround Link Systen
z iv
Spasc Operation/ integration A RockwellSatellite Systems ODvlsion Internatlonal
SHB Shaped Hemispherical BeamSOn State of HealthSPG Single Point GroundSPL Secondary PayloadSPS Samples per SecondSTC Satellite Test CenterSTI Stanford Telecommunications, Inc.
TCS Thermal Control SubsystemTDOA Time Difference of ArrivalTIE Timing Interface and EncoderTLM TelemetryTOA Time of ArrivalTT&C Telemetry, Tracking, and Command
ULS Upload Station
VCO Voltage Controlled Oscillator
WER Word Error Rate
I -
I .
I' -. x
i "
SWae Op..a.onsflinkgnOwo A RockwellSafoifs Sys*tms Divisio Intemational
1. INTRODUCTION AND SUMMARY
1.1 INTRODUCTION
1.1.1 Background
Recent and projected changes in the nuclear posture of the major countriesof the world have significantly increased the requirements for timely nucleardetonation (NUDET) surveillance. To fulfill these requirements the Departmentof Defense and the U.S. Air Force initiated studies that led to theestablishment of the Integrated Operational NUDET Detection System (IONDS).
These studie- .,u, ;,sted that many of these detection and locationrequirements ccutu 1e accomplished by inciuding a NUDET sensor on the Navstarsatellite since che successful development of the Navstar Global PositioningSystem (GPS) had provided advancements in the state-of-the-art precision timeand frequency standards. The precision navigation capability provided by thesetime and frequency standards through precise transit time measurements alsomakes the iirplementatiou of a precise NUDET location system feasible. This,plus the worldwide coverage afforded by the GPS satellites, makes the GPS anideal host for the NUDET surveillance mission.
Feasibility studies investigating the concept of implementing a globalburst detector (GBD) on the GPS satellite were performed by Rockwell andsubsequently verified by Ford Aerospace and Comunication Corporation, the IONDSsystem engineering contractnr. Following these studies, the development of theIONDS global segment (IGS) was initiated with Rockwell in mid-1916.Subcontracts were awarded to ITT to develop the modified baseband/procesoor audthe triplexer for the IGS, to Autonetics for the L3 transmitter aud L3 encoder,and to Stanford Teleconmunicationa for a compatible test receiver. At the sametime Sandia Laboratories and Lot Alaaos Scientific Laboratory starteddevelopment of the sensors and processor that are govermu t-furniohed equipwent(GFE) provided by the DepArtmeut of Energy (DOE).
The IONDS program was structured to provide an crderiy progression ofanalysis and tests to validate the projected capability of the IGS and itscompatibility with the CPS satellite. A series of tests r4nging from componentacceptance tests through intetrated syseim functional tests was porformedresulting in the evolution of an optimum hardware and system interface toward a-flight tonfigurstion.
The data derived from this series of tests demonstrated that the systemzechahitation and hardware satisfied the IOND3 mission requirement. Further,these tests demonstrated that these IONDS requirements can be achieved on theGPS host vehicle without itroducing any deleterious effects on the prize GPSnavigal.ion mission. As a result, the USAF has directed that the IONDS subsys-tembe incortoratt.d into and flovn on the Uavigation Development Satellite (NDS) 60CPS Mase I satellite..
$put opfstons/Ilation & 1 Rockwellsawf sySUMS Div"" ' W International
1.1.1.1 Objectives. The objectives of the program were as follows:
1. Develop IONDS hardware: Design, fabricate, and test each subsystem atthe box, subsystem, and integrated levels.
2. Develop GPS/IGS interfaces: Deign, fabricate, and test the box-levelinterfaces and perfom a working interface test between the modifiedGPO $'oxco enA the TGS hardware. This includes identifying andresolving any conditicn that could potentially impact GPS operation.
3. Develop an IGS maturity: Provide an overall emphasis in the IONDSprogram to develop maturity via detailed ground tests, part andcomponent selection, and design equivalent to that being achieved bythe SPS satellite in its Phase I program.
1.1.1.2 Crouud Rules. The following ground rules were established.
1. IONDS must be implemented without an impact on the navigation missionas determined by measurements of navigation performance parameters thatcan resolve system degradation within 1/4 dB.
2. IONDS implementation must result in minimum spacecraft modifications byusing a basic design approach that incorporates as much of theinterface design into the secondary payload (SPL) hardware as possible.
3. TONDS implementation must maintain the total satellite weight so thatit remains within the boost capability of the Atlas F.
1.1.2 Alternate Approaches
Various alternative concepts that tould accomplish the IONDS mission wereanalyzed early in the program. Several of the more significant considerationsare sumpr•zed below.
1.1.2.1 Selection of the L3 Frequency for IONDS. Two L-band downlinks (L1acd L2) have been implemented to provide -.asion data to GPF u4ers. These twoGPS data streams are diplexed together and transmitted frm a comnon L-bandantenna. To minimize the IONDS impact to the GPS system and to reduce the costand risk, a third i-band link (L3 ) was selected with its frequency located aboutmidway between the Ll and L½ frequencies. This frequency seltetion allows theexisting CPS L-baond antenna to b. used for IONDS data transmission. Further,the selection of the L3 link peraits the use of the proven GPS L-baud RF linkapproach and it* associated receiver technology for IONDS. The L3 frequencyselected was 1381.05 111. The choice was the result of a tradeoff analysis of(1) L-band antenna pattern, (2) intemodulatioo interference, (3) triplexerdesign. (4) ease of frequency synthesis, and (5) radio astronomy considerations.
The CPS spacecraft's L-band antenna %as designal to sat!fy equi:ementsimposed by the navigation mission on the Ll and Li dovnlinks. Terts haveverified that the &air and pattern coverage of this L-band antenna wererelatively constant between the designated Li and L2 frequencies. The selectionof the 1-3 frequency of 1381.05 Mz satisfied IONDS antenna performance
2
spae OpUon*/In%/*Uon 0 ii Rockwells"fte. SYus*M OMS• V01%' International
rnqu'rements and other requirements imposed by such elements as frequencysynthesiE and intermodulation interference.
1.1.2.2 Radio Astronomy Interference. Two of the assigned radio astronomyfrequency bands are in or near the GPS L-band spectrum (1400 to 1427 MHz and1664.4 to 1668.4 MHz). There is a potential for interference between the 1400-to 1427-NHz band and the IONDS L3 frequency assignment. A radio astronomy studywas performed to predict the energy in the radio astronomy band due to IGS L-band transmissions. This included a spectrum analysis that was verified bytesting at full power. This test indicated that some low-level energy from L3falls within the radio astronomy band. However, in the normal mode, the L3transmitter operates only when it detects an event, and then only long enough toget the data to the ground. Normally, this will require less than one minuta oftransmissi -. Random triggers from cosmic particles and very powerful lightningstriker can trigger the system but are expected to be quite infrequent. Therewill also be a test/c-librate mode that will be used approximately weekly whenthe system is ostabliahed. Considering all modes, there should be on theaverag( less that five minutet of transmisjion per day per satellite. Due to*the unusual energy and low-duty factor (the time L3 is transmitting divided bythe typical r dio astronomy integration time), there should be no interferencewith the Radio Astronomy Ser,,ice (RAS), This is to be demonstrated by NDS 6 ina test fully coordiuated with the UAS. An in-line L3 filter, which woulddecrease the L3 signal level in the 1400- to 1427-MHz band by approximately27 d', is being corsidered to elirinate potential L3 /RAS interference even withextended L3 transmission time.
The Radio Astronomy Technical R-porZ hb-s been included in this doctmaent asan appendix.
1.1.2.3 Existing CPS naca Link3. Using the existing CV L-band navigationand S-band telemnet•y data inks simultaneously was considered for IONDS datalinks, NoLe of the exi.sting CPS data links investi3aced for the IOND$ systemcould provide the dats rate or tte rtceiving terminal flexibility necessary tosatisfy IONDS user requireikents. The iisting Ll an' L2 data capacity wasinsufficient to meet IONDS requirements. Using the GPS L2 downlink frequ,,ncy ina qtadratuxe phase shift keyed (QPS9) -c.e was analyzed and found capable .f
providing the necessary data rate and user terminal flexibility requiree .;,r theIONDS mission. HoveveL, this sega ut of the L2 channel has been reserved forpotsible expansion of the CPS navigation mission. Fot that reason, furtherconsideration of the L2 link for IODS was teriinated. The GPS S-band doaulinkfor IONDS eas not feasible since it would iL.•olve the use of a lar-e, fixedground site.
1.1.2.4 Electromagnecic Compatibility (ENC). Tae electromagneticenvironment on The GPS spacecraft has been antlyzed to assure a minimu Impacttf- the rPS syoren and mission from addirS the IONDS hardvare. The EHC hardvaretest performed in late 1977 and eirlf 1978 verified that the IONDS system didnot impact or interfere with CPS operation or the GPS navigation mission. Theoperation of the IONDS L3 system was also verified during the radio frequencyiaterferEnce (RFI) testing using an L, transmitter operating into an L3 test"receiver.
3
Space Opertalon/tIn.gvrao & Il RockwellSa",t* Sysem OWvW V International
1.1.2.5 The IGS System. The IGS is made up of space and ground segments.It has been developed to the point that space-related hardware has beenintegrated with the GPS system and thoroughly evaluated by numerous tests whichdemonstrated that there was no GPS navigatlon mission impact and that the IGSsystem exceeded performance specifications over the full MIL-STD-1540 range.
The GPS/SPL configuration is shown in Figure 1. This secondary payloadconfiguration includes IGS and the AFSATCOM single-channel transponder (SOT).This SPL on-orbit external configuration is characterized by additions on theforward bulkhead. All of the telemetry, tracking, and command (TT&C),navigation (NAV), IGS, and SM devices on the bulkhead have fixed optical andelectrical axes aligned parallel to the spacecraft's local vertical. The SPLunits are the IGS optical (BDY) sensor and sunshade, the X-ray (BDX) sensor, andthe SCT UHF and SOF antennas. The IGS shares the GPS L-band mission antenna,eliminating the requirement for a 3eparate antenna that would have significantlycomplicated the earth-pointing forward bulkhead. The sunshade material andpaints are nonconductive, thus the sunshade is transparent at microwavefrequencies and does not create radiation pattern blockages.
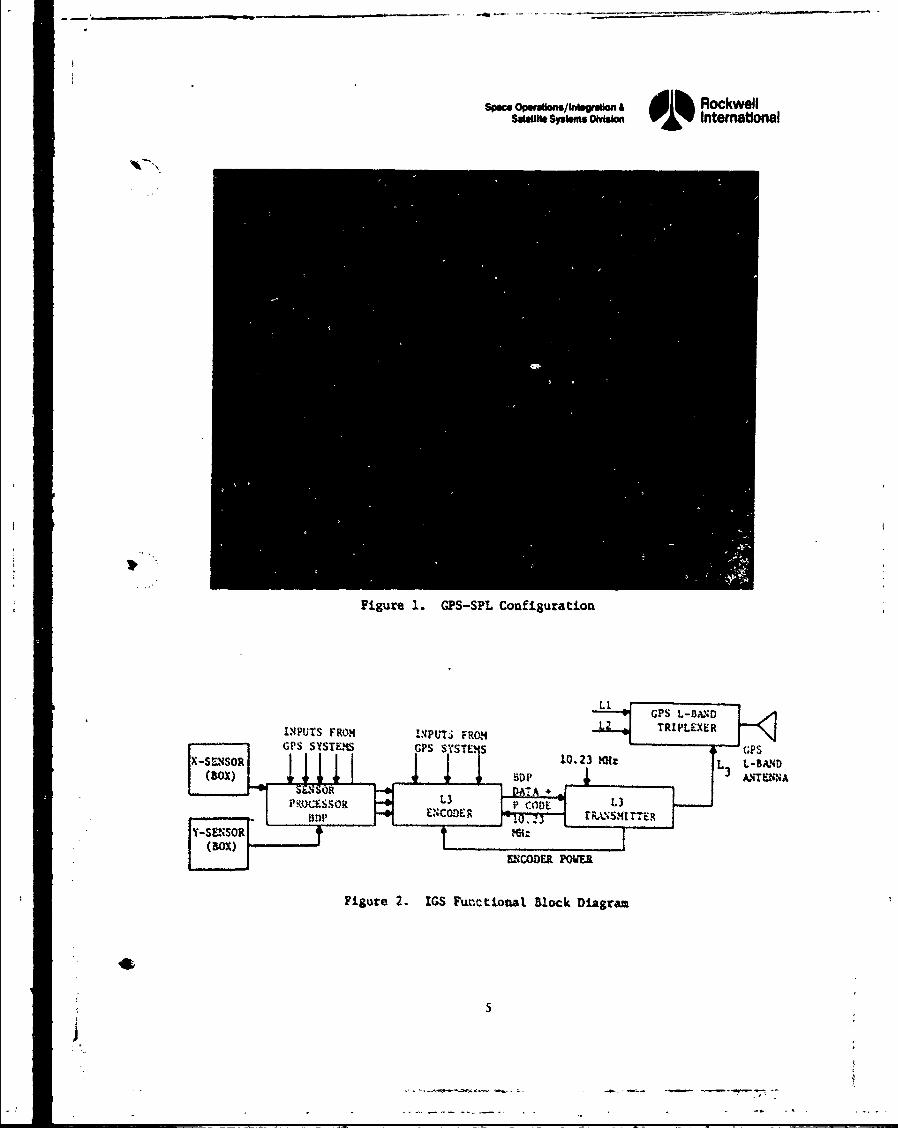
A functional block diagram of the IGS is showu in Figure 2.
The IGS system consists of BDX and BDY sensors located on the GPS forwardbulkhead, a sensor processor, an encoder, and a separate L-band transmitter allsupported by GPS subsystems. The system has been designed to accomplish itsmission objectives and function on a noninterfering basis with the GPS system.
Nuclear burst detection and location are determined from optical and X-raysignals received by the sensors. Sensor data are fed to the burst detectorprocessor (BDP) where they are processed and synchronized to the GPS clock. TheBDP enables the L3 encoder and provides event data for encoding. The L3 encoderuses the 1O.23-MIz reference frequency and the GPS P code to provide modulateddata to the L3 transmitter. The L3 transmitter uses a frequency midway betweenthe GPS LI and L2 channels for transmitting event data. These three L-bandchannels are combined in the GPS triplexer and fed to a common L-band antennafor transmission to the ground terminals.
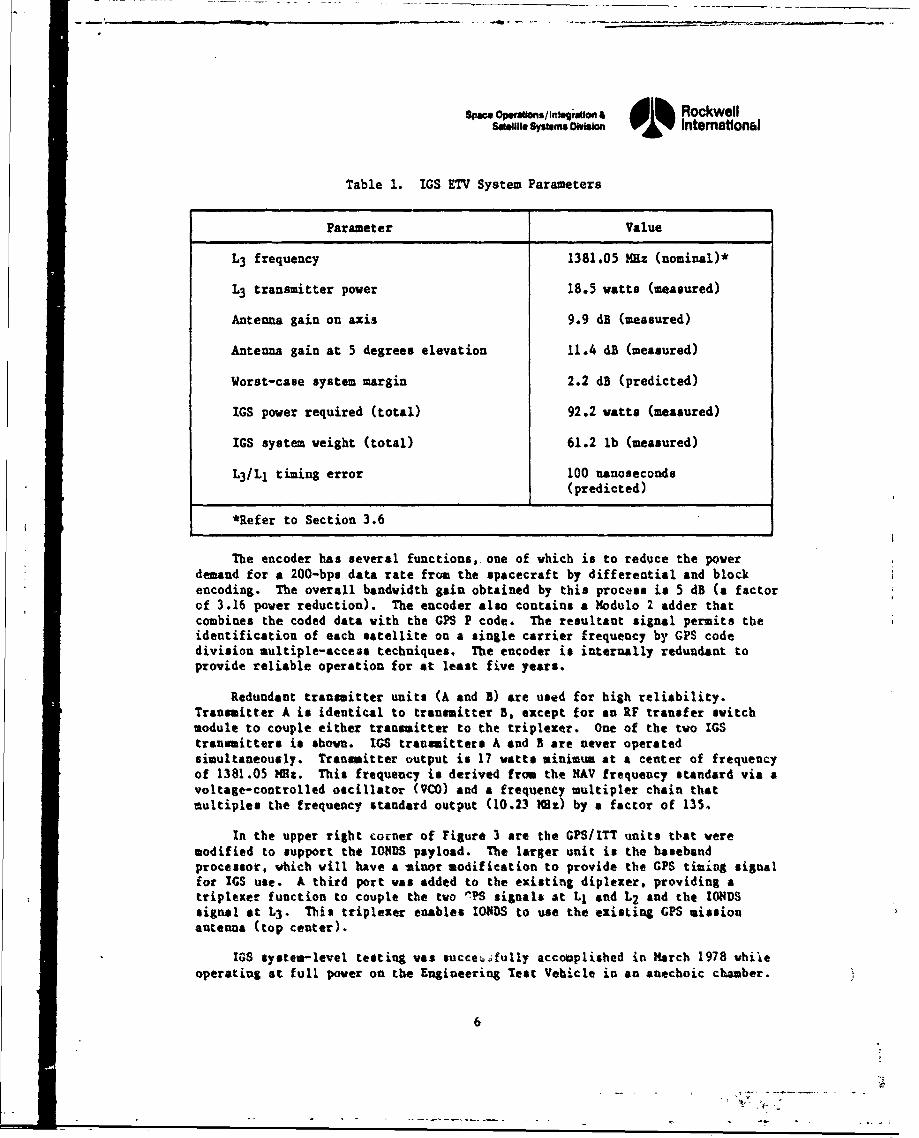
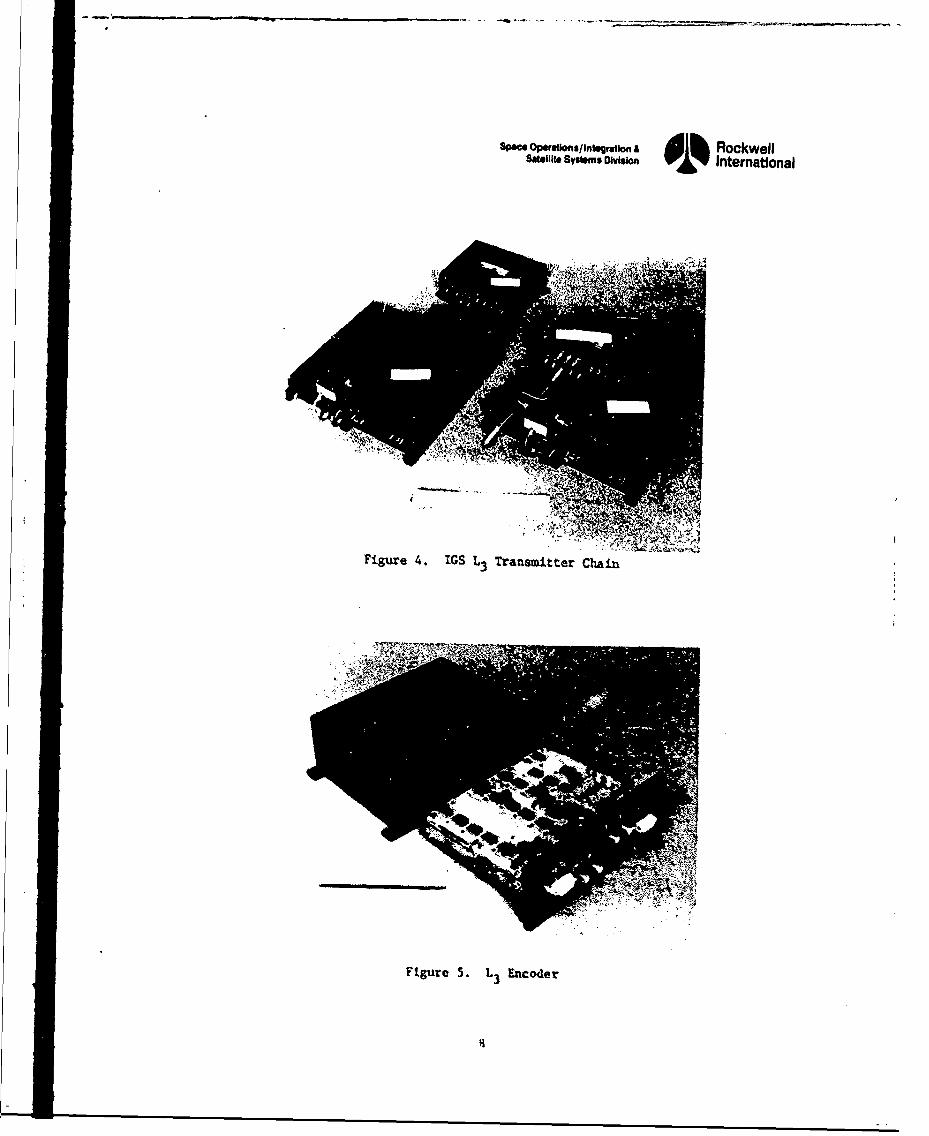
The IGS employs the GPS precision time capability to "easure the time ofarrival (TOA) of the nuclear burst signal. Using TOA data from several GPSsatellites, IONDS can accurately determine event locations. IGS systemparameters are saummrizei in Table 1. The L3 transmitter chain equipment isillustrated in Figures 3 through 6.
Figure 3 shove the five new units in the IGS subsystem and the two key GPSunits modified to accept tie secondary payload. In the upper left are theSandia X-ray (BDX) and optial (BDT) sensors. Data from theme units areprocessed in the Sandia data processor (BDP) shown in the lover left corner.All three Sandia units are irternally redundant for reliability.
Pictured in the tottam center and right corner of Figure 3 and inFigures 4. 5, and 6 are the encoder and transmitter built by Rockwell Autoneticsfor the IONDS dedicated dowulink.
spec op"erWa svn A 1i Rockwells"m01 spa. DvWS 01% Intemational
Figure 1. GPS-SPL Configuration
S.. "- C PS SYSTEMS •P i' S C PSX-WO 0.23 M•z L,. L 80
SP.•OSSOR UJ -
Bt~~t' •NENCOE• R~ ts• P0T.
Figure 2. IGS Functional Block Diagram
5
S!--- - ------- .1
S- - - -
SAceo,. 0 uisit/araQonW a RockwellSasWile Sysms ODWilioun V01 Intemational
Table 1. IGS ETV System Parameters
Parameter Value
L3 frequency 1381.05 MHz (nominal)*
L3 transmitter power 18.5 watts (measured)
Antenna gain on axis 9.9 dB (measured)
Antenna gain at 5 degrees elevation 11.4 dB (measured)
Worst-case system margin 2.2 dB (predicted)
IGS power required (total) 92.2 watts (measured)
IGS system weight (total) 61.2 lb (measured)
L3 /LI timing error 100 nanoseconds(predicted)
*Refer to Section 3.6
The encoder has several functions, one of which is to reduce the powerdemand for a 200-bps data rate from the spacecraft by differential and blockencoding. The overall bandwidth gain obtained by this process is 5 dB (a factorof 3.16 power reduction). The encoder also contains a Modulo 2 adder thatcombines the coded data with the GPS P code. The resultant signal permits theidentification of each satellite on a single carrier frequency by GPS codedivision multiple-access techniques. The encoder is internally redundant toprovide reliable operation for at least five years.
Redundant transmitter units (A and B) are used for high reliability.Transmitter A is identical to transmitter B, except for an RF transfer switchmodule to couple either transmitter to the triplexer. One of the two IGStransmitters is shown. IS transmitters A and B are never operatedsimultaneously. Tranmitter output is 17 watts minimum at a center of frequencyof 1381.05 Wt. This frequency is derived from the NAV frequency standard via avoltage-controlled oscillator (VCO) and a frequency multipler chain thatmultiples the frequency standard output (10.23 MR) by a factor of 135,
In the upper right corner of Figure 3 are the CPS/ITT units that weremodified to support the IONDS payload. The larger unit is the basebandprocessor, which will have a minor modification to provide the CPS timing signalfor IGS use. & third port was added to the existing diplexer, providing atriplexer function to couple the two 'ýPS signals at Ls and L2 and the IODSsignal at L3 . This triplexer enables ION(DS to use the existing GPS missionantenna (top center).
IGS system-level testing was succeJfully accouplished in March 1978 whileoperating at full power on the Engineering Test Vehicle in an anechoic chamber.
6
sweowonsinwsn & dbRockwellssit Vy~m who OW International
A;.a
V4
. . . . . . .. .
SPace Opffauons/In~~gr~o & l RockwellSate~i ~ oi~~ ,& Y V International
Figure 4. IGS L3 Transmitter Chain
Figure S. L3Encoder
_ _ _ _ _ _ I _ l__ _ _ - - - -- = = -- --I
Spwe Opersuons/In ao• a~ Rockwells&MIW sysum, W,• l ! Internetional
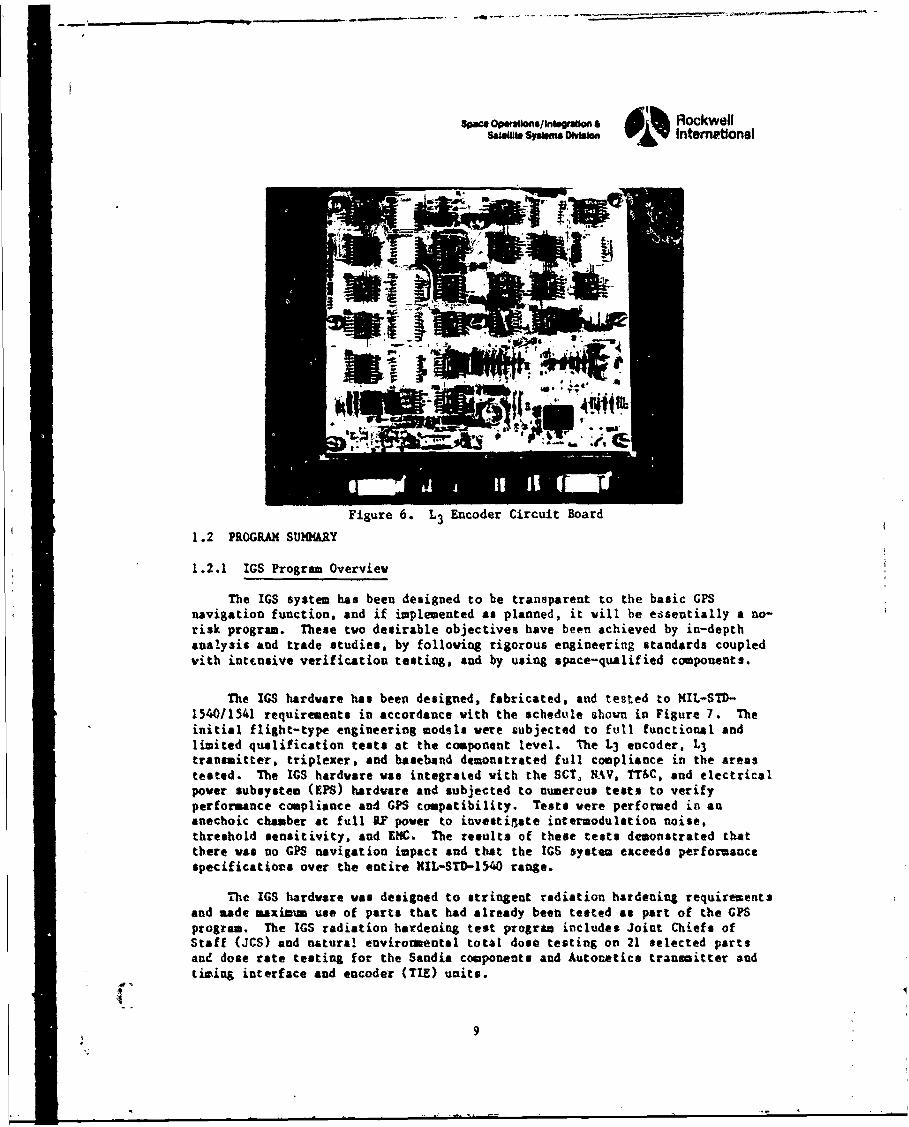
Figure 6. L3 Encoder Circuit Board1 .2 PROGRAM SU)OV, RY
1.2.1 IGS Program Overview
The IGS system has been designed to be transparent to the basic GPSnavigation function, and if implemented as planned, it will be essentially a no-risk program. These two desirable objectives have been achieved by in-depthanalyasi and trade studies, by following rigorous engineering standards coupledvith intcnsive verification testing, and by using space-qualified components.
The IGS hardware has been designed, fabricated, and tested to MIL-STD-1540/1541 requirements in accordance with the schedule shown in Figure 7. Theinitial flight-type engineering models were gubjected to full functional andlimited qualification tests at the component level. The L3 encoder, L3transmitter, triplexer, and baseband demonstrated full compliance in the areastested. The IGS hardware was integraLed with the SCT HAV, TT&C, and electricalpower subsystem (EPS) hardware and subjected to numerous tests to verifyperformance compliance and GPS compatibility. Tests vere performed in ananechoic chamber at full LF power to investigate intermodulation noise,threshold sensitivity, and ENC. The results of these tests demonstrated thatthere was no CPS navigation impact and that the 15 system exceeds performancespecifications over the entire MIL-STD-1540 range.
The IGS hardvare was designed to stringent radiation hardening requirementsand made maximum use of parts that had already been tested as part of the GPSprogram. The IGS radiation hardening test program includes Joint Chiefs ofStaff (JCS) and natural environoental total dose testing on 21 selected partsand dose rate testing for the Sandia components and Autonetics transmitter andtining interface and encoder (TIE) units.
9
S"110 SYM~ GoivWW Intemanonal
ýPS UCOOAftY PAYW.,5 t ,AStI R %PXIO AM ! "C .
AjI va qviOC AIcy, 01C JAfl [1 4 W" AMA AD4.A~ ~ I l Nk JII''C ,'rFW .VI l~I D~
1 'II i=-=I'• ~~
104 t1? tISI . ... . . .
1.13
r .....- ---- -i t , . .it r .4 t '4
figure 7..Deve t S
- . .. ., * ...... ,-,. * ,2 ,. .+ ; + ,.
exesv -ne t hv ice. T he a.... " wii, h a
theAtls FLauch ehile2 and*t~IA by th apoee kick moto (AU1 by upgr _ing th
.4J 04 -, . 0 04 -lt4.+..'+-- .. .. .. .. "+*
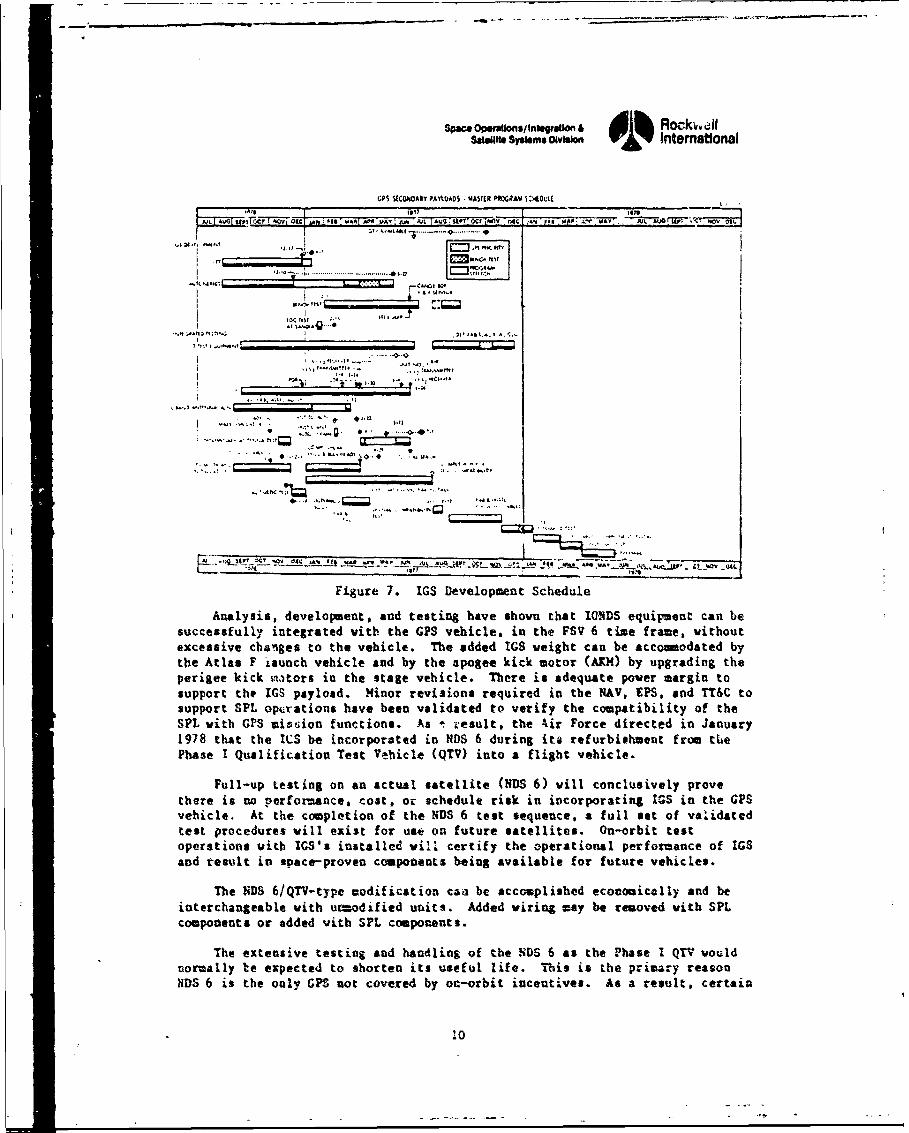
sp gure 7. IGS Development Schedule
Analysis, developmaent, and testind have showv that eIIDS equiblmeit can besuccessfully integrated vith the 'PS vehicle, in the FSV 6 teue frame, withoutexcessive chalges to the vehicle. The 'dded IGS aeight can be acco.modated bythe Atlas F p ounch vehicle and byo the apogee kick motor (A tn) by upgrding theperigee kick thntors in the stage vehicle. There is adequate poser margin tosupport the Irs payload. einor reviusons required in the NAY, EPS, and TT&C tosupport SPL oparations have been validated wo verify the cppatibility of theSFL with GPS miss~ion functions. As r •esult, the •ir Force directed in January
1978 that the IcS be incorporated in bDi 6 during ite refurbishment frem tiePhaTe I Qualification Test Vchicle (QTV) into a flisht vehicle.
Full-up testing on an actual satellite (dDS 6) wil b conclusively provethere is no performance, coat, or schedule risk in incorporating IGS in the GPSvehicle. At the cotpletion of the IDS 6 test sequence, full aset of validatedtest procedures vie c exist for use ou future satellites. On-orbit testoperations with ony'S installed vib certify the operational perfoelance of tiSand result in space--proven components being available for future vehicles.
The IKDS 6/QTV-type modification ca•i be accomplished economically and beinterchangeable with ur=odified units. Added wiring may be removed with SPLcomponents Or added with SPL components.
The extensive testing and handling of the ,NDS 6 as the Phase I QT'V wouldnormally '•e expected to shorten its useful life. This is tihe prim~ary' reasonliDS 6 is the only GPS not cowered by ot-orbit incentives. As a result. certain
speco opo.wnenogo & Rockwellsawe Y oWWM Intemational
key areas (i.e., earth sensor) require refurbishment to aseure long life. SinceNDS 6 is to have an operational IGS payload, these areas are being refurbishedto assure a useful life on the order of five years.
A mid-1980 launch data is the earliest feasible because of modificationsand refurbishment lead times. However, the modification and testing aresufficiently early to minimize the procurement risk for FSV 9 through 12.Similar "ow-risk refurbishment of any other available Phase I vehicle istechnically feasible and could provide additional IONDS capability in the 1980's.
1.2.2 Program Schedule
The NDS 6 program schedule shown in Figure 8 calls for launching of thesatellite in the sumer of 1980. This schedule identifies each IGS flighthar2,,are item and its relationship to the present qualification program andshows tt each item will be available for subsystem installation in time tosupport NDS 6 acceptance testing.
Following the initial IGS development phase, several functions wereincorporated into tL, TIE to minimize the modifications required in thp GPS NAVhardware to support IGS. The TIE assembly performs data encoding with the sameredundant encoder mechanizatiou ezployed during Lhe developAent phase. Thequalification TIE unit incorporates ;he added functions of 10.23 M5zdistribution amplifiers, timing interface circuits, and a low-voltage powersupply. These circuits are contained on four multilaver printed circuit boards(PCl's) with a master interconnect board. T1e TIE qualification program wasstructured to provide time to breadboard and test the added functions before thefabrication of the qualification hardware.
The transmitter assembly consists of redundant transmitters and an RFswitch. The transmitter includes a power supply, frequency synthesizer,modulator, and RF amplifiers. The paver supply is constructed with conventionaldiscrete romponents, while the RF portions use microwave integrated circuitry(MIC) and hybrid technology. The components include 3 printed circuit boards(one 2-sided board for the synthesizer and two 4 -layer printed circuit boardsfor the power supply), 15 1IC's, and 2 hybrid assemblies. The qualificationtransmitter to be tested is the A configuration, which includes an RF svittbdifferentiating it from the B configuration, and is virtually identical to thedevelopment model.
The ITT qualification program consists of completing the qualfi4-ziot ofthe IGS triplexer and modiflied baseband. The original engintring developmentmodel (EDN) units were new units built to the latest GPS flight design andmodified for IGS use. The triplexer qualification was completed by performingqualification-level tests on the EDM triplexer in the areas of vibration andpyrotechnic shock, which had not been done in the original test program. Vlequalification of the baseband includes the development of a modified baseband 2board and performance of a complete qualification test equivalent to theoriginal GPS qualification test.
The NDS 6 schedule shows the time spans required to refurbish to an IGSconfiguration plus subsystem i~stallation, acceptance testing, and launch
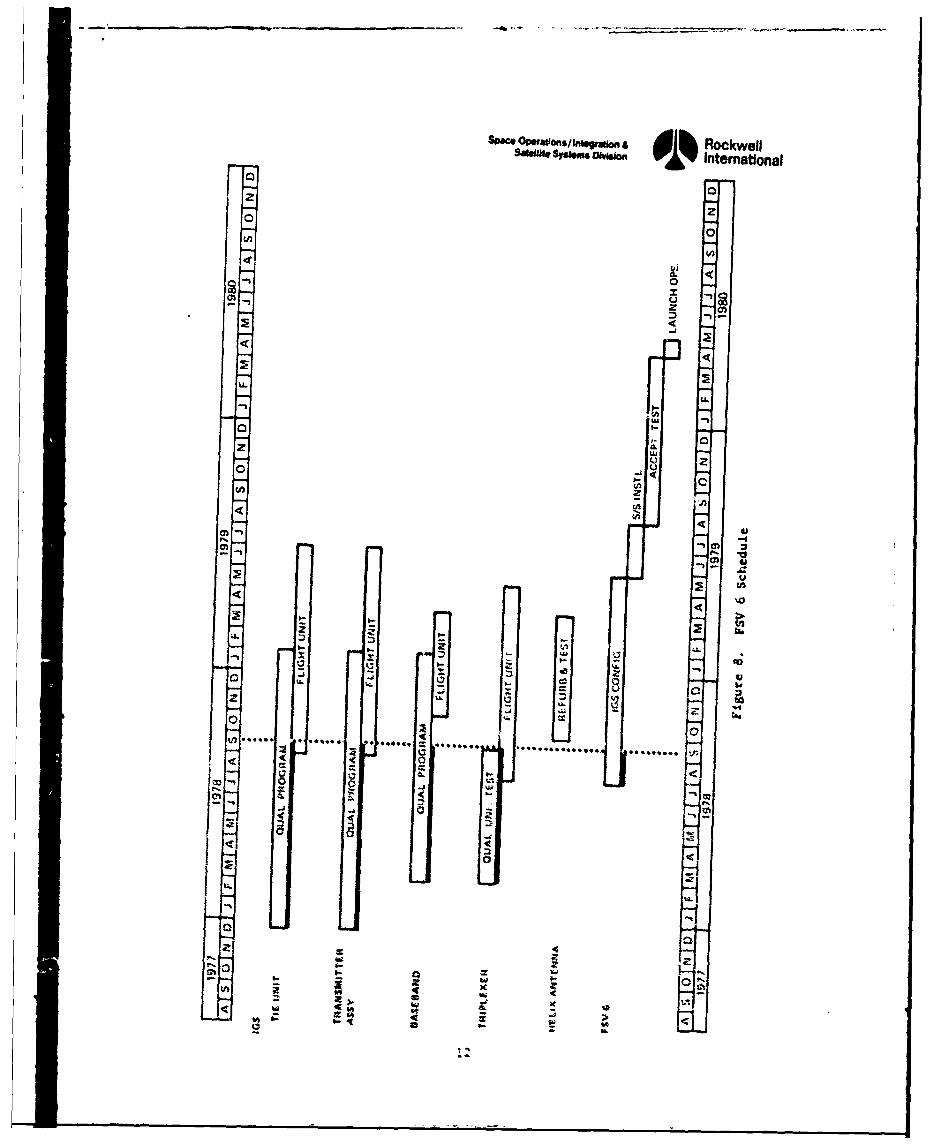
Spie OffWfl/Ing~aio~ aRockwells~.iw S~s... a~wi~International
z0
0
U2 U)
-j
0zc
0z O
4 41
%-A4
0'
SPWO OPWaUOm/UmnWeson A RockwellSaMs SVSms Dieson 01% Intemational
operations. Detailed refurbishment plans of hardvare items used in QTV testing
have been developed and stmmarized in the NDS 6 hardware utilization list (HIL).
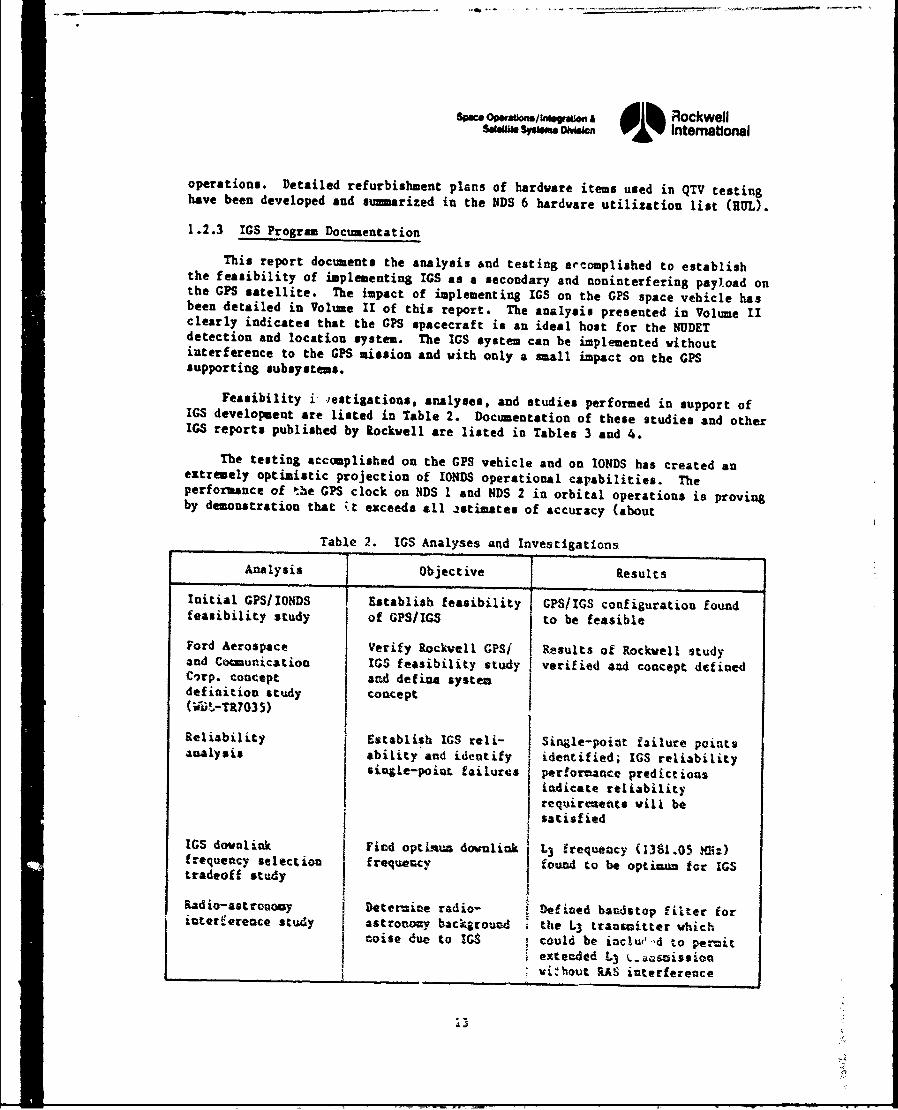
1.2.3 IGS Program Documentation
This report documents the analysis and testing accomplished to establishthe feasibility of implementing IGS as a secondary and noninterfering paylioad onthe GPS satellite. The impact of implementing IGS on the GPS space vehicle hasbeen detailed in Volume II of this report. The analysis presented in Volume IIclearly indicates that the GPS spacecraft is an ideal host for the NUDETdetection and location system. The IS system can be implemented withoutinterference to the GPS mission and vith only a mall impact on the GPSsupporting subsystems.
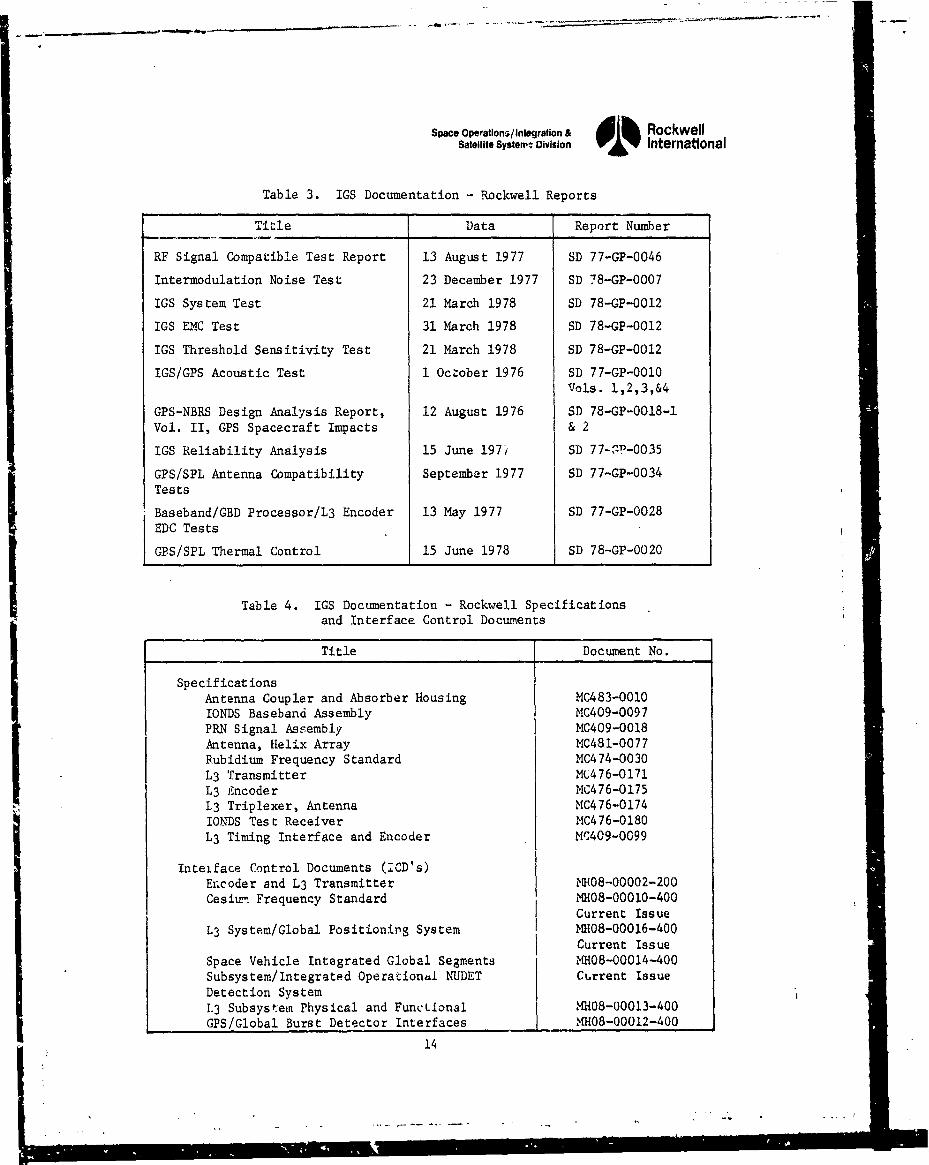
Feasibility i -estigations, analyses, and studies performed in support ofIGS development are listed in Table 2. Documentation of these studies and otherIGS reports published by Rockwell are listed in Tables 3 and 4.
The testing accomplished on the GPS vehicle and on IONDS has created anextremely optimistic projection of IONDS operational capabilities. Theperformance of the GPS clock on NDS I and NDS 2 in orbital operations is provingby demonstration that .t exceeds all astimates of accuracy (about
Table 2. IGS Analyses and Investigations
Analysis 1 Objective Results
Initial GPS/IONDS . Establish feasibility GPS/IGS configuration foundfeasibility study of GPS/IGS to be feasible
Ford Aerospace Verify Rockwell GPSf Results of Rockwell studyand Cocmunication IG feasibility study verified aud concept deinedCirp. concept and define systemdefinition study- concept(-.-TR703 5)
Reliability Establish IGS reli- Single-point failure pointsanalysis ability and identify identified; IGS reliability
siL4le-poiut failures perforance predictionsindicate reliabilityreqtjirtaents vili besatisfied
IG$ donlink Find optLmun dovulink L3 ftrequeacy (1381.05 "0i:)frequency selection frequency found to be optiwn= for IGStradeoff study
Radio-astronocy j Detetnime radio- Defined bandetop filter forinterference study astronony background the L3 transaitter whichCoise due to IGS could be inclu('.d to permit
exte.ded L3 _azasniss ionvi~hout MS interference
A5
Space Operations/Integration a RockwellSatellite Systemn Division 01% International
Table 3. IGS Documentation - Rockwell Reports
Title Data Report Number
RF Signal Compatible Test Report 13 August 1977 SD 77-GP-0046
Intermodulation Noise Test 23 December 1977 SD 78-GP-0007
IGS System Test 21 March 1978 SD 78-GP-0012
IGS EMC Test 31 March 1978 SD 78-GP-0012
IGS Threshold Sensitivity Test 21 March 1978 SD 78-GP-0012
IGS/GPS Acoustic Test 1 October 1976 SD 77-GP-0010Vols. 1,2,3,&4
GPS-NBRS Design Analysis Report, 12 August 1976 SD 78-GP-0018-1Vol. II, GPS Spacecraft Impacts & 2
IGS Reliability Analysis 15 June 197, SD 77-:!P-0035
GPS/SPL Antenna Compatibility September 1977 SD 77-GP-0034Tests
Baseband/GBD Processor/L3 Encoder 13 May 1977 SD 77-GP-0028EDC Tests
GPS/SPL Thermal Control 15 June 1978 SD 78-GP-0020
Table 4. IGS Documentation - Rockwell Specifications
and Interface Control Documents
Title Document No.
SpecificationsAntenna Coupler and Absorber Housing MC483-0010IONDS Baseband Assembly MC409-0097PRN Signal Assembly MC409-0018Antenna, Helix Array MC481-0077Rubidium Frequency Standard MC474-0030L3 Transmitter MC476-0171L3 Encoder MC476-017513 Triplexer, Antenna MC476-0174IONDS Test Receiver MC476-0180
L3 Timing Interface and Encoder MC409-0099
Inteiface Control Documents (CD's)Encoder and L3 Transmitter ?U408-00002-200Cesitn Frequency Standard MH08-00010-400
Current Issue
L3 System/Global Positioning System M1108-00016-400Current Issue
Space Vehicle Integrated Global Segments MH08-00014-400Subsystem/Integrated Operationaii NUDET Current Issue
Detection System1.3 Subsystem Physical and FuncLional MH08-00013-400
GPS/Global Burst Detector Interfaces . .H08-00012-400
14
SwAc Operatlons/hItegratin & 1 RockwellSatellite Systems Dlvihlon 01% Interr.itional
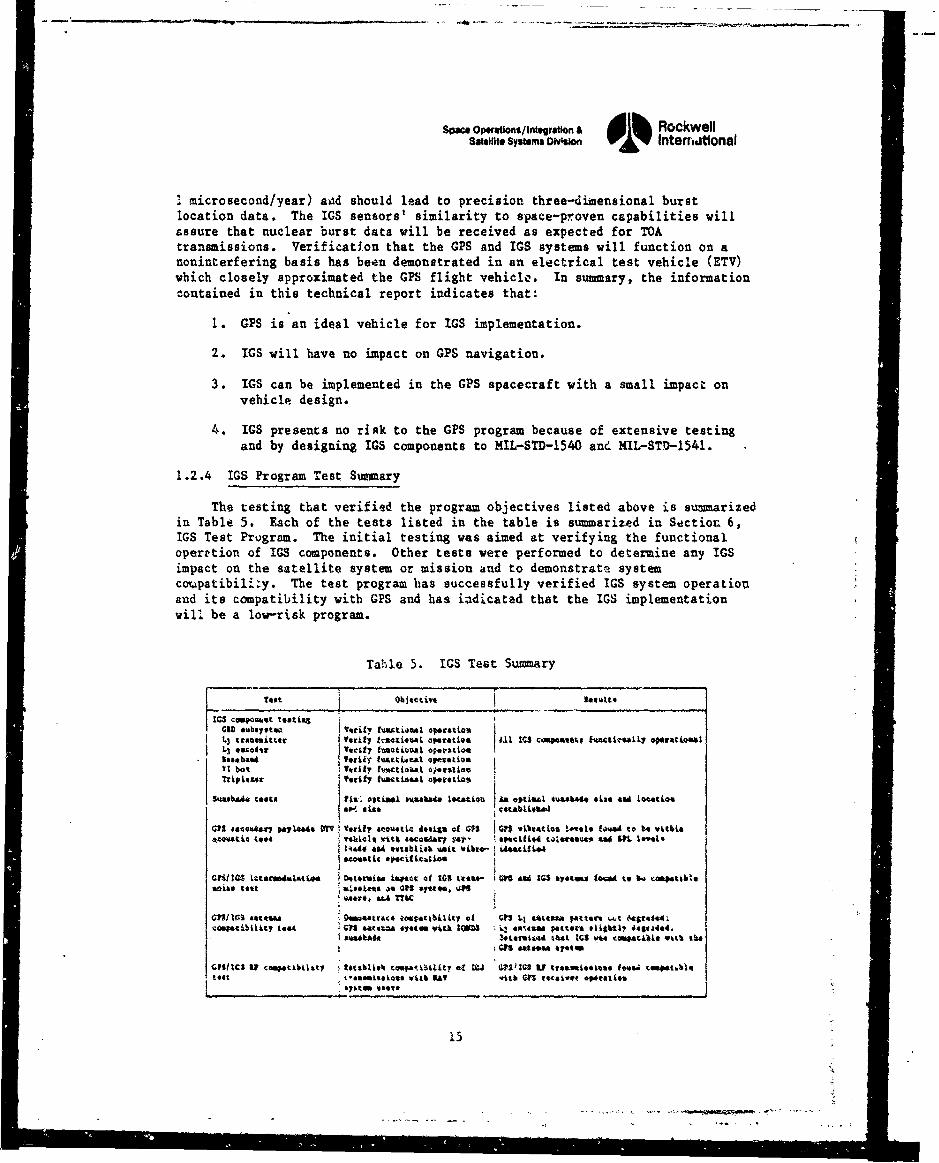
Imicro second/year) a~Ad should lead to precisiont three-dizmensional burstlocation data. The IGS sensors' similarity to space-proven capabi~li~ties willassure that nuclear burst data will be received as expected for TOAtransmissions. Verification that the GPS and IGS systems will function on anoninterfering basis has been demonstrated in an electrical test vehicle (ETV)which closely approximated the GPS flight vehicle. In sumary, the informationcontained in this technical report indicates that:
1. GPS is an ideal vehicle for IGS implementation.
2. IGS will have no impact on GPS navigation.
3. IGS can be implemented in the GPS spacecraft with a small impact onvehicle design.
4. IGS presents no riAk to the GPS program because of extensive testingand by designing IGS components to MIL-STD-1540 and~ MIL-STD-1541.
1 .2 .4 IGS Program TLest Summary
The testing that verified the program objectives listed above is summarizedin Table 5. Each of the tests listed in the table is summarized in Section 6,IGS Test Program. The initial testing was aimed at verifying the functionaloperetion of IGS components. Other tests were performed to determine any IGSimpact on the satellite, system or mission ~and to demonstrate systemcou.patibili~y. The test program has successfully verified IGS system operationland its compatibility with GPS and has iiadicatad that the IGS implementationwill be a low-risk program.
Table 5. IGS Test Summary
ICS cauPomsta taatima
CID saboystea I Ttril tw iaatioeu4 ~*"tatialIL3 tadoittoe Vertty ft*tci*O&I opost~ties A.UXI M OUt 1AM~tkaiT*1 OlKWuoast
L3 *uosa-r Tocity twactjgva opetatiol.
I,**b~e4 ToriET fuatciwma1 overatdoiIt bol Vertyf t tmc t 413aI ajorstios
TtiptYr rcill tu&a tiAsal op.oattiatm
Use4b~a costU fit, oiAM #%&Sa~b4 X4t.otou La optko&X tuasbh size sad 404acios
Cps #o44Q*" "714 Mtd Uri tely acoustic toligiu *t CIS .- s 'ibut.a~ !.,.I# 1d.W. to 5. vttbia'C~tcsi toot YSiclie vitb *oce"Aiy v4p? specified Lgt.gaocao ceg SIn 1eIti
eAac8i~c *pocjticatioa
GW~143 ItteoSAdai"tv 5t~tguL.s is t of t$ ttas,- tCIM ~4 MC *eysc to"A to W 5. teajee S4te WiseLt"i% Mg CII ~to. it
013110S avz.,.. 04WAa.t~rfa t06f4tkbJ1Lt7 of Cts LJ "top"a rpetlse ".t ftstssAC4"4ibility test ,4 c1".~ c4t*% 60on *4th to=D ..q w.ttma Facetu"*i. L4tX~ .pa
*%mot*SAt z.tarutqd tha.t XCS V&c. ewAti~L toWb tba
to.CII o~~kblt %afti::bL.' Wta1kb~iva SAT (it'Conre4.Meiec &tataMcoaeb,676t at..
15
Space Operations/lIntegration & I RockwellSatellite Systemsa Division 01 Intemational
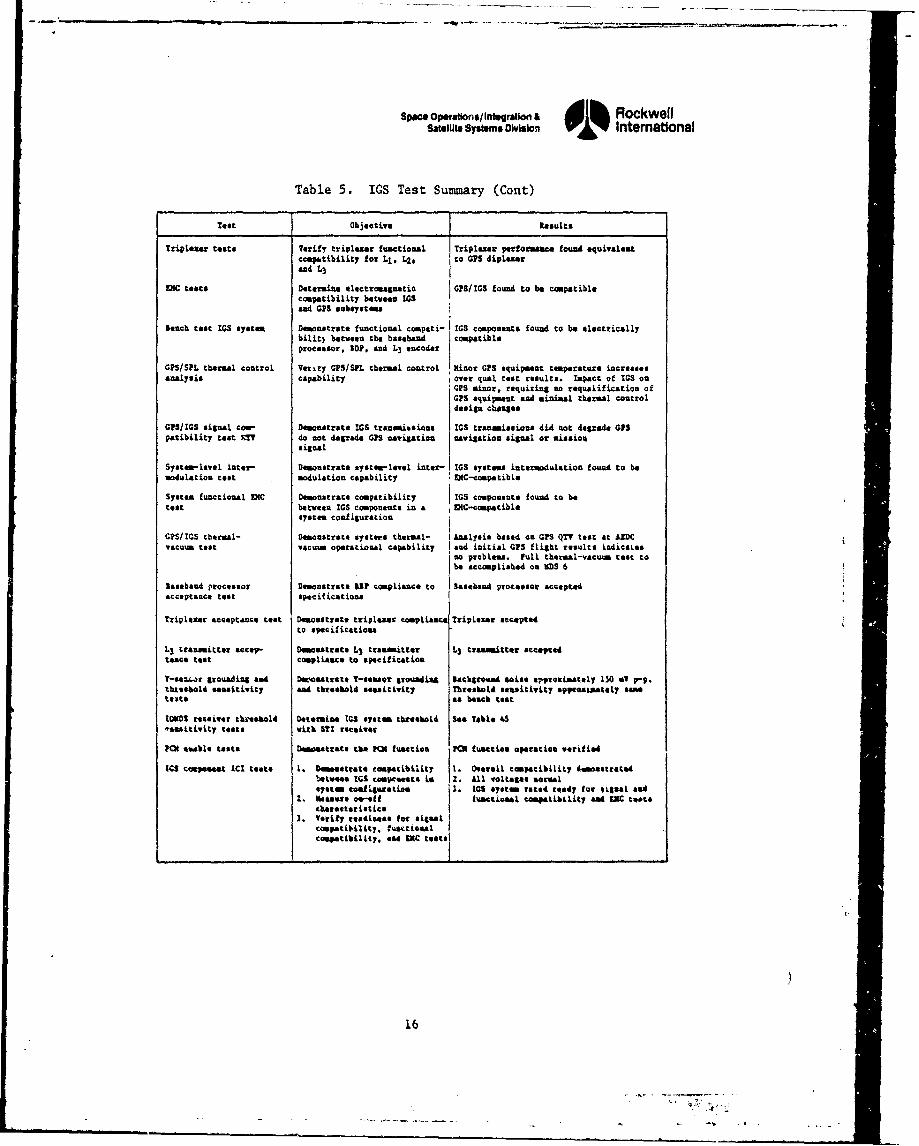
Table 5. IGS Test Summary (Cont)
Test Objective Rasults
lriplezez tests Verify triplezer functional Triplazar performance found equivalentcompatibility for LI. L2, ito 075 diplezertand L3 I
DIG toots Determine electromagnetic C181105 found to be compatiblecompatibility between 105&&4 CPS subsystems
Beach teat IC8 system Demnstrate functional coinpati- IG10 components found to be electricallybilit) between the baseband compatibleprocessor, 351, and L.3 ecder
GPS/SPL thermal control Vot-.ry 0151311. thermal co~ntrol minor CPS equipment temperature increasesanalysis capability i over qual tesar results. Impact of 103 on
CPS minor, requiring no requalification ofC15 equipment and minmaal thermal controldesign china..e
GPSlIGS signal Com- Demonstrate 108 transmissions 108 tranamissione did mot degrade GPSpatibility tesar TT do not degr&ad 0PS navigation navigation, signal or sission
signal
System-levol inter- Demonstrate system-level inter- IGGS systems interoodulation found to hemodulation test modulation capability IXC-ctmpatibl*
System functional DIG Demonstrate compatibility lOS components found to berear between ICS components in a DIGM-compatible
system configuration
GPS/IGS thermal- Deonostrate syotres thermal- I Analysis based on GIS Mr test at AZMCvacuum test vecum operational capability Iand initial CIS flight results indicaiss
no problems. full thermal-vacaus teat tohe accomplished on NDS 6
Ittaboud processor Demonstrate "? Compliance to gsteehan processoir acceptedacceptance test Specifications
Triplexar acceptance test Demonstrate triplezer comp~line Triplazar acceptedto specificteions
L3 transmitter accep- Domoutrate L3 tranmnitter Ls transmitter acceptedteace test complitace to specification.
Y-eenawr grounding and DOftestrato Y-eeaOr grounding Iackgtound sailse arproimaxely 150 ml -pthesholdol sensitivity and thre"aol seesitivity Threshold sensitivity Appyscaiately saamstests as beeclk test
15313 receiver tb.eehol4 Determine IQ$ Ssterm theshaold $ee Table 43"oeaitivity teets with $?I receiver
M~ enable tests Dowmstrate tbe "M function M~ tuactica *oteation veTitied
505 compoese" 101 tosts 1. Demontrate romperi~bility 1. Overall copatiblkity AsmaotrateAbetweec 103 tomptmaste isa 2. Al*1 'nteges mactuelsysem. ewatigisrariom 1. WOS system toted ready for signal &Ad
1. Nassents *aef I tuactineal compatibility ead at0 testsCURAtattriatico
3. Verity ceaiste&&* foraignaloospatlility. futetiesel
compatibility. aid Me0 tests.
i6
Spwe Opw.tio.s/Ir.ftraton & RockwellS8111toM SYS.ms DoWW". VlY Intemational
2. NAVSTAR GLOBAL POSITIONING SYSTEM (GPS)
2.1 GPS OBJECTIVES
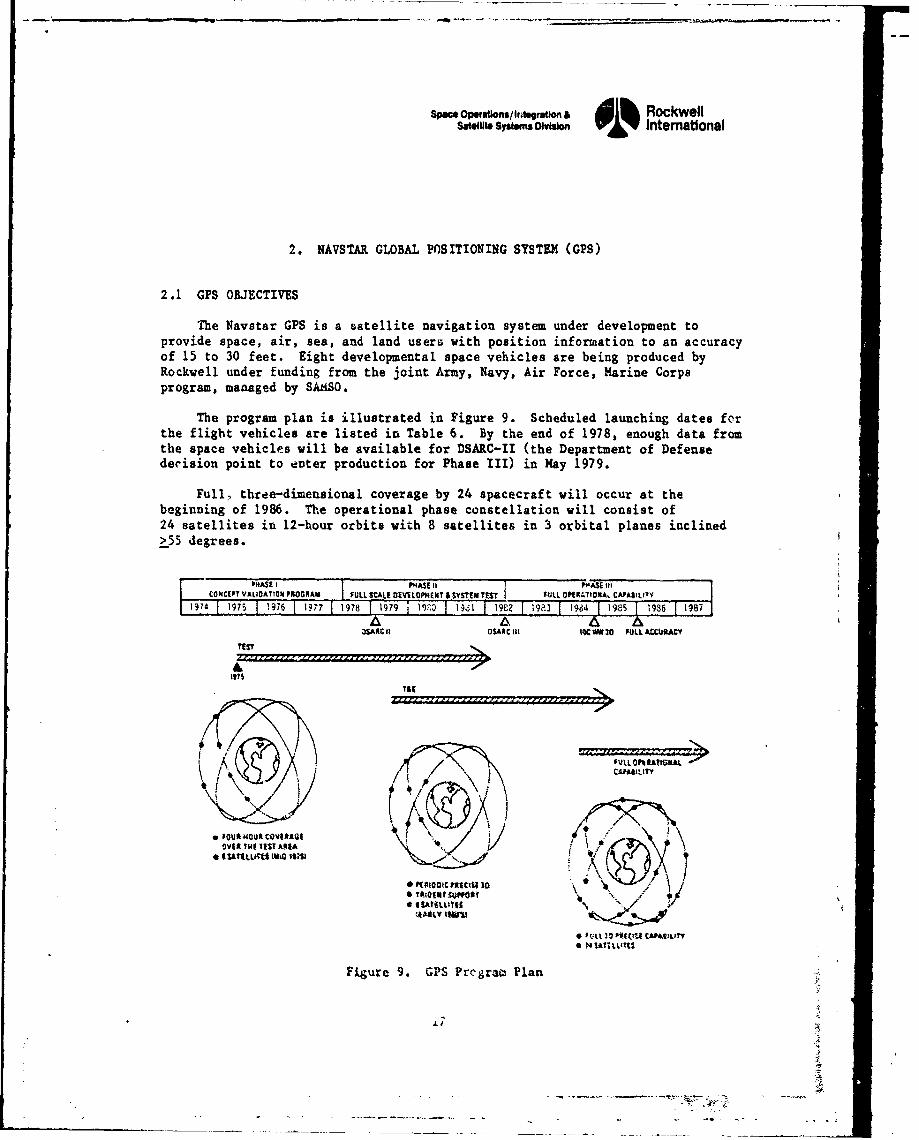
The Navstar GPS is a satellite navigation system under development toprovide space, air, sea, and land users with position information to an accuracyof 15 to 30 feet. Eight developmental space vehicles are being produced byRockwell under funding from the joint Army, Navy, Air Force, Marine Corpsprogram, managed by SA•S0.
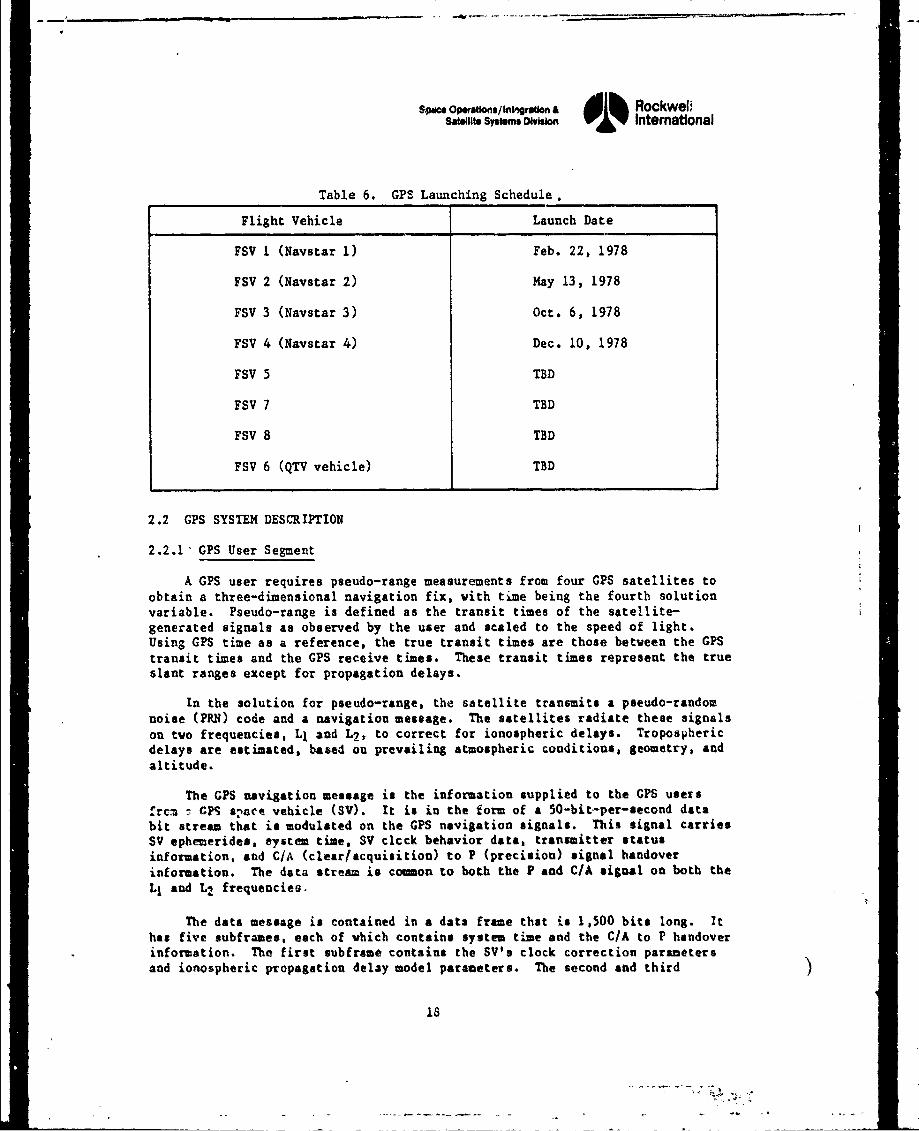
The program plan is illustrated in Figure 9. Scheduled launching dates forthe flight vehicles are listed in Table 6. By the end of 1978, enough data fromthe space vehicles will be available for DSARC-II (the Department of Defensedecision point to enter production for Phase III) in May 1979.
Full, three-dimensional coverage by 24 spacecraft will occur at thebeginning of 1986. The operational phase constellation will consist of24 satellites in 12-hour orbits with 8 satellites in 3 orbital planes inclined>--55 degrees.
IPWASE I PHASE 1 .. .. T I itCONCEPT VALIDATION PROGRAM FULL SCALE DEVVLOP94ENT &SYSTEM T, FULL OIRITtOXA. CAPAWLIrY
1974 1975 1976 1977 1978 11979 i19"v 19Q-1 I'19EZ M93 1964 198-5 1986 11987
;SARtC t OSAnC III IOCWW30 FULLACC.•IRAY
TESTE
4cLqItT&I
OVtx THI TEST APIA
* l lA.LkT, LUj
u 19 G.P 144 zJ u CAPlan T-
P1igure 9. GPS Progr~ao Plan
sA. oper.t•n/,In.W.bon & dih1RockweliSatelite Systems Ds0on 1%': Intemattonal
Table 6. GPS Launching Schedule.
Flight Vehicle Launch Date
FSV I (Navstar 1) Feb. 22, 1978
FSV 2 (Navstar 2) May 13, 1978
FSV 3 (Navstar 3) Oct. 6, 1978
FSV 4 (Navstar 4) Dec. 10, 1978
FSV 5 TBD
FSV 7 TBD
FSV 8 TBD
FSV 6 (QTV vehicle) TBD
2.2 GPS SYSTEM DESCRIPTION
2.2.1" GPS User Segment
A GPS user requires pseudo-range measurements from four GPS satellites toobtain a three-dimensional navigation fix, with time being the fourth solutionvariable. Pseudo-range is defined as the transit times of the satellite-generated signals as observed by the user and scaled to the speed of light.Using GPS time as a reference, the true transit times are those between the GPStransit times and the GPS receive times. These transit times represent the trueslant ranges except for propagation delays.
In the solution for pseudo-range, the satellite transmits a pseudo-randomnoise (PRN) code and a navigation message. The satellites radiate these signalson two frequencies, L1 and L2, to correct for ionospheric delays. Troposphericdelays are estimated, based on prevailing atmospheric conditions, geometry, andaltitude.
The GPS navigation message is the information supplied to the GPS usersrc a - GPS s ree vehicle (SV). It is in the form of a 50-bit-per-second data
bit stream that is modulated on the GPS navigation signals. This signal carriesSV ephemerides, system time, SV clcck behavior data, transmitter statusinformation, and CIA (clear/acquisition) to P (precision) signal handoverinformation. The data stre= is comon to both the P and C/A signal on both theLl and L2 frequencies.
The data message is contained in a data frame that is 1,500 bits long. Ithas five subframes, each of which contains system time and the C/A to P handoverinformation. The first subframe contains the SV's clock correction parametersand ionospheric propagation delay model parameters. The second and third
is
Space Ope.ra.one/In•rsuon & Rockwellsatale System OtWiui 01 Intemational
subframes contain the SV's ephemeris. The fourth subframe contains a message ofalphanumeric characters. The fifth subframe is a cycling of the almanacs of allSV's (one per frame), containing their ephemerides, clock correction parameters,and health. This almanac information is for user acquisition of yet-to-be-acquired SV's.
The user system segment includes the hardware and computer programsnecessary to receive and process navigation signals and output the results asthree-dimensional position and velocity. It is capable of displaying systemtime to users who require it. A user equipment set is the appropriatecombination of elements that are required to convert the available C/Anavigation signals into usable navigation data under the operating conditionsassociated with the host vehicle. The elements of a user equipment set includean antenna assembly, receiver, data processor, control/display unit, powersupply unit, and interface units.
When a user wants to establish his position, he must acquire at least foursatellites. Since all of the satellites transmit on the same frequency and theuser equipment receives energy from all satellites within view, the user'sreceiver employs correlation techniques to recover the desired data.
The receiver equipment selects four of the satellites within view andprovides instructions for acquisition and data recovery (i.e., codes andpredicted doppler). The acquisition sequence consists of a carrier acquisition,C/A code acquisition, and P code acquisition. Nonprotected receivers omit the Pcode acquisition and use the less accurate C/A code.
To select a satellite, the user receiver generates a predetermined C/A code(one of 32 codes selected before launch). This code is used as a reference andcompared with the received signal. A PN signal search is performed by shiftingthe reference PRN code until a correlation peak exceeds an acquisition threshold.This correlation peak occurs when the reference code and the received code aresynchronized in both frequency and time. After the C/A code has been acquired,data can be extracted. The extracted data contain SV ephemerides, system timeof day, SV clock data, system status messages, and C/A to P handover information.This handover information is then used to provide the v priori informationnecessary to code-lock the receiver to the higher chipping rate (10.23 MO),long-term P code.
A sophisticated user receiver will perfom this sequence simultaneously forfour satellites. The roceiving craft will use its ovn special clock, updatedregularly by one of the atomic clocks in orbit, and calculate, by computer, thetime required for trannission of the space vehicle signals and the range anddirection involved. From this information, the receiving equipment villcalculate the user's position within teas or feet in three dimensions in a fewseconds.
2.3 GPS/IGS INTERFACING SUBSYSTEMS
The navigation and WUDET surveillance missions are separate functions butuse some common elements that operate on a noninterferiiW baois. The IONDSsubsystem has been constrained to cause no GPS perforuanca detradation, even
÷.9
SpUc Operalions/Int- •gtion & Ajh RockwellsaweIII SY.Is Oim W"'Y o iiternatonal
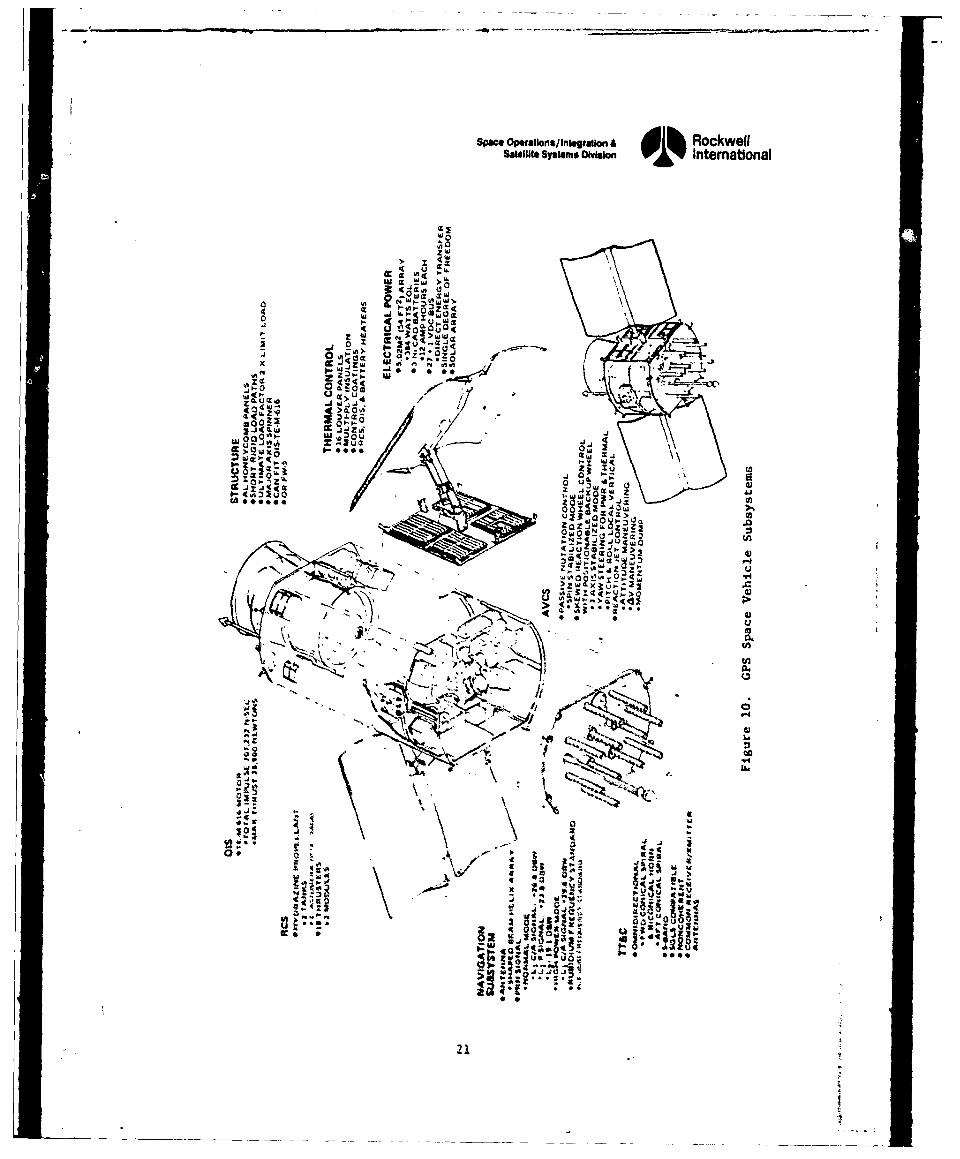
though its implementation is functionally dependent on the navigation, TT&C,EPS, and other GPS subsystems. Similarly, no unique NUDET data are included inthe navigation message although the IONDS system depends on the data containedin the L1 and L2 data message. The organization of these GPS subsystems isillustrated in Figure 10.
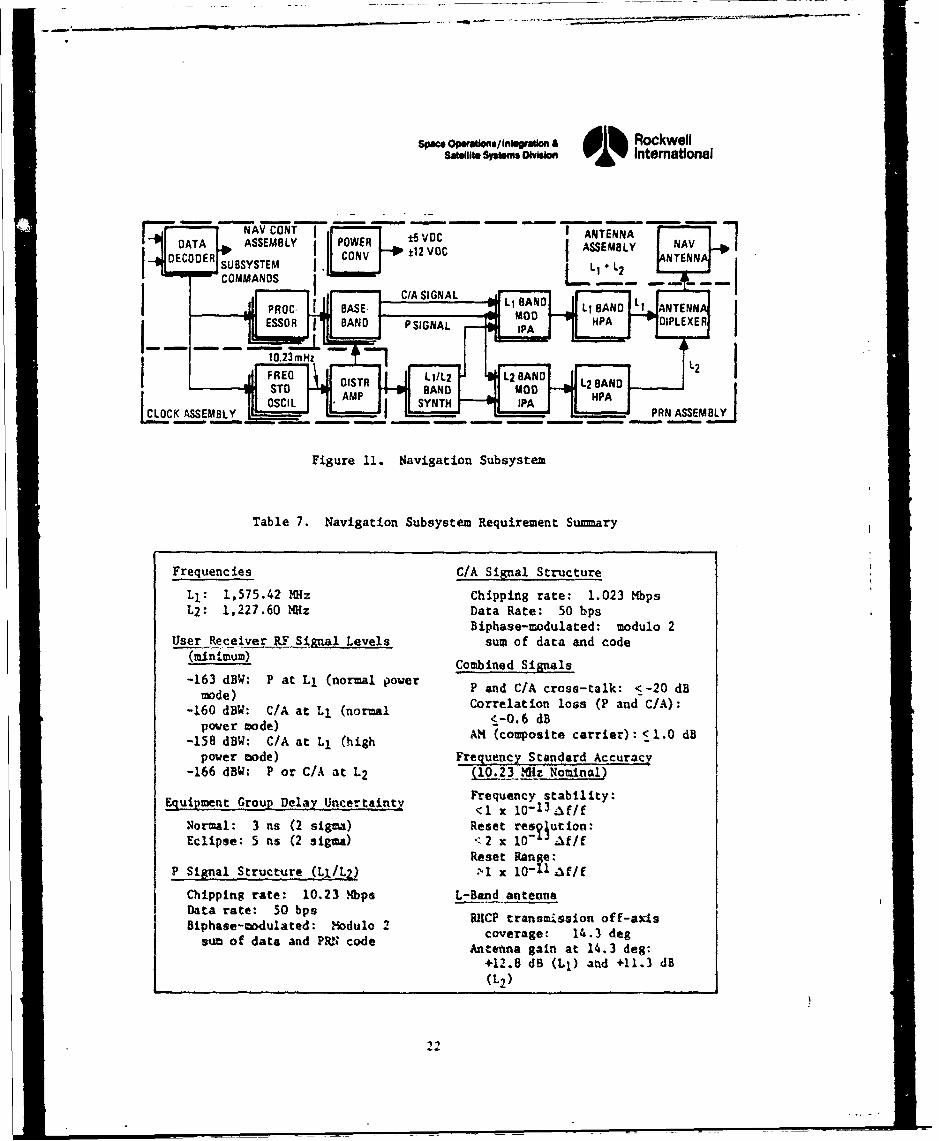
2.3.1 Navigation Subsystem
The GPS global segment navigation subsystem block diagram is shown inFigure 11. The subsystem provides for the simultaneous downlink generation oftwo L-band carriers: L1 at 1575.42 MHz and L2 at 1227.60 MHz. The Ll carrieris biphase-modulated with two codes: a 10.23-MHz PRN precision code and a1.023 MHz (C/A) PRN code for acquisition. The C/A signal is modulated inquadrature to the P signal.
The second carrier, L2 , is biphase-modulated with the 10.23 MHz PRN P codeonly. The C/A signal may be used by some users for limited precision rangingand is used by all users for acquisition. The P signal, which cannot be usedfor rapid direct acquisition, is used for precisi.on ranging. Table 7 summarizesthe navigation subsystem characteristics.
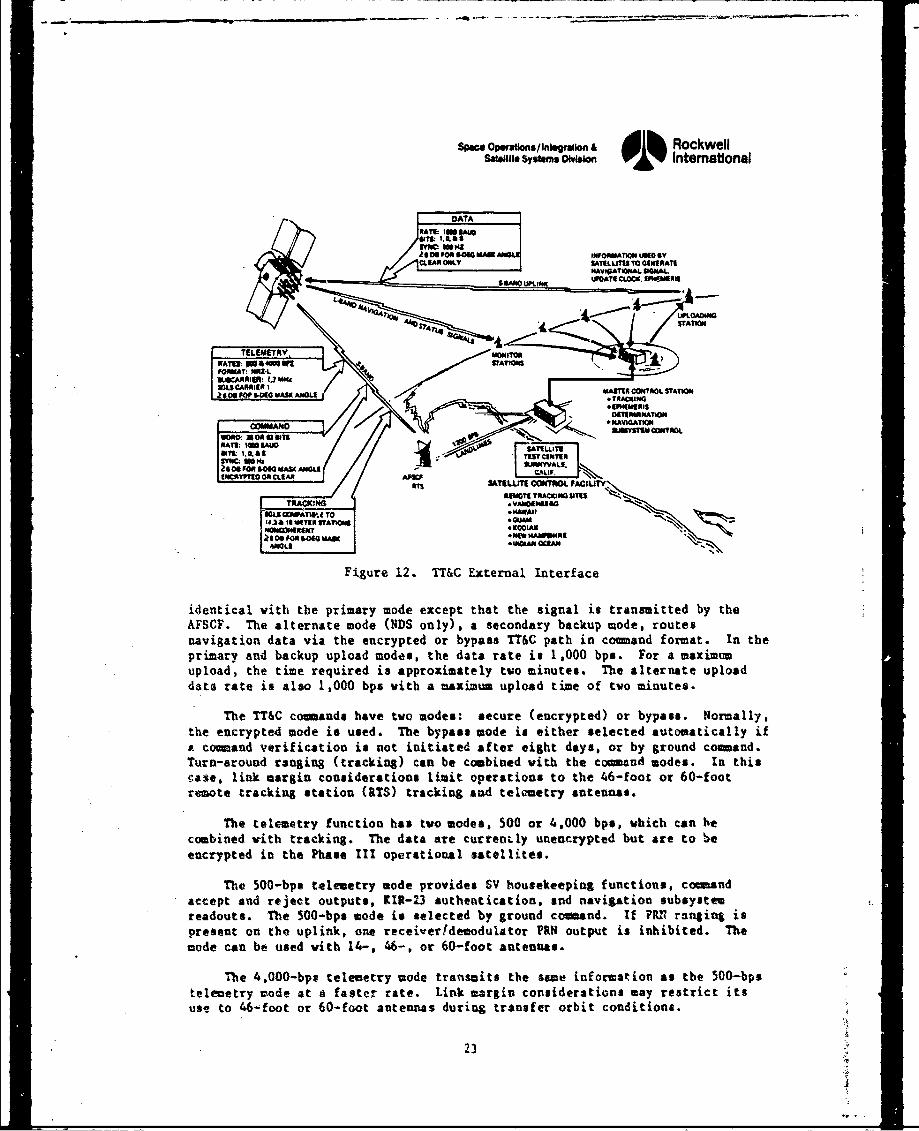
2.3.2 Telemetry, Tracking, and Command (TT&C) Subsystem
The TT&C subsystem provides telemetry, tracking, conmand, and navigationupload capabilities to support GPS space vehicle operations in conjunction withthe Air Force Satellite Control Facility (AVSCF) and the Master Control Station(HCS) (see Figure 12).
2.3.3 Subsystem Functions
The TT&C subsystem is designed to support the following functions:
1. Primary navigation upload from the upload station (ULS) and backup fromthe AFSCF
2. Alternate navigation encrypted or bypass upload from the &FSCF via thecommand decoder
3. TT&C coands from the AFSCF in either the bypass or the encryptedformat
4. Space ground link system (SCLS) telemetry to the AFSCF at either
4,000 or 500 bps
5. PMN turn-around ranging (tracking) from the AFSCF
The navigation upload has three modes, i.e., primary, backup, and alternate.In the primary sode, navigation data are routed from the MCS/ULS via the TT&Creceiver/dezodulators and signal conditioning unit (SCU) to the basebandprocessor. The IlLS does not have the capability to send discrete or magnitudecocmands in the TTUC encrypted or bypass modes. The primary mode appli- to theNOS and the Navigation Technology Satellite and to the ULS. The backup rode is
20
Space OwseioalnsfIniogfrauo & I RockwellSatellite Systems MisjwI 01% International
"Jo
141
Z.
In~~ w 0
z w I~w
0 03 iz
ON w J
0 0 40
0 00 P.
>2wI 0 , i
44
30C
21MQ
SPac opwo"Of/In"ron £ A b Rockwells "eMbe sb 0. o1%V• Intemational
- - - - - - - - - - - - - - -
DATA ASSEMBLY PO _WE 02 ±VOC ASMLDECODER SUBSYSTEMLi+2 TN
"- COMM -NOS --- SIGNA LA_, t- _.II
Figure 11. Navigation Subsystem
Table 7. Navigation Subsystem Requirement Sum~ary
Frequencies C/A Signal Structure
LI: 1,575.42 MHz Chipping rate: 1.023 MbpsL2: 1,227.60 MHz Data Rate: 50 bps
Eiphase-modulated: modulo 2User Receiver.RF Signal Levels sum of data and code
(minimum) Combined Signals
-163 dW: P at L1 (normal powerD
)Correlation loss (P and C/A):-160 dBW: C/A at Lj (normal ~O6dpower Eode) A" od
-158 dBW: C/A at L1 (highpaber 7.de) Fremuncy e mandard AccSu acy
-166 dEW: P or C/A at L2 (10.23 MIz Nominal)
Frequency sCability:Li: <1 M 10- 1 3 23f/f
Normal: 3 1 a (2 sigma) Reset reso0ution:
Eclipse: 5 ns (2 sigma) <2 x I0-LJ f/fReset Range :
P SignalStructure ,(Lu/2) >1 x i0-I Af/f
Chippin8 rate: 10.23 Nbps L-Band antennafData rate: S0 bps IP rn isono -asBiphase-modulated: modulo Csus of data and c coveraget 14.3 deg
Antenna gain at 14,3 deg:+12.8 dB CL1 ) aa(d +11.3 dB
(L,)
powe mod ) AM (com osi e ca rier : <1 0 d
Specs Op.wtions/InleIeg in & RockwellSaIteili SYStems O1sIo. International
"ham ISSA".
CLIAXOLY SAUILUTUSTOGA(M!RATHAV.GATOUEAL 94NAL.
1 WPOATII CUM. 0%00114t
Figur 12.TU EtenaInerac
identical~ ihtepiaymd xetta h inli rnmtAtedbyth
TELEME Th Y. alteInOR moI( nyascndr akpmdruenaiatio data11 vi h rpe rbpssTAT&Cpt ncoIn oma. I hprimaryT andackpula oes h aartei ,0 p. o aiupload the tierqie s prxmtl womnts h atraeulad St O CRAe is alo100 pAih aMumula tm fto mnuOLtes.C
The5 "'1C coA nd have tToe: scr ecytd RAbpas.IoNGlythe enrypte modeis use. Thebypas ode s eiter seectedautomaialyia c~nd vrifiatin isnot nitatedafte eiht dys, r b grond cand
Wun-RouD'rnig(rcig a ecmiedwt h oadwds tieSATF lI=k 1argncnieaioslmtoeatost 6-oto 0foremteL trck. staio (aS trcSn and celomey aIens
Th teOmtR fucto hasK two moeL0to .00 pwicnbcobie Olth tIracig Th daaaecrrnl nNcrpe u r o
enrytd nth haeI pertoa saelitsThe 00-bs tlemery mde Rovde SVTLLT COuNekepiL F unACoIITYmaaccept~~~~~~~~~~~~NT andKIN reetotusOT323atetiain n aIgaiSsuss
reaous.TheCIN 50-bsmoeisseete1y"rundGoad f~rnigi
ode an beused INth 14-, 46:Gr60f UtAntnMs
iethea 4,00-bp telermetry mode exetrasmtsa the signa is traonasmithed 500-bpsteleetr Tode alterfatn ate . Lie D nly) marinconsidyebatip odea rouestrc t
useto 4rao o 0fotatenilo100pihas daiurim trlanse orite onditomionuts.
Th T&Cco ans av to ods:seur (ncyped o bpas.No23ly
the ncrpte moe i usd. Te bpas moe i eiher eletedautmatcaly i
S Olwatkns/Inleron & Rockwells.w,•, sY.SUM CoWW 01% Intemational
2.3.4 Attitude and Velocity Control Subsystem (AVCS)
The AVCS provides the sensing, logic, and control torques necessary toperform velocity maneuvers and maintain desired space vehicle orientation. Thissystem must maintain spacecraft pointing to within + (TBD) degrees and not causespacecraft pointing movement greater than (TBD) degrees per second to precludeinterference with IONDS.
2.3.5 Reaction Control Subsystem (RCS)
The RCS is a simple blowdown, monopropellant system using two 22.2-N andsixteen 0.44-N catalytic thrusters.
2.3.6 Electrical Power Subsystem (EPS)
Thr; EPS consists of a 5.02 m2 solar array with single-degree-of-freedomdrives. The solar array, in conjunction with the batteries, forms a directenergy transfer system to supply 27 + I Vdc to all GPS space vehicle systems.The EPS operates autonomously, providing battery charge and discharge logic andoverload protection for every load.
2.3.7 Solar _rrays
The solar array consists of a series/parallel matrix of N-P silicon solarcells, which conver. incident solar energy into electrical power. These cellsare arranged on 2 wir.p,-each with 18 parallel-connected diode-isolated solarcell circuits. Each circuit is composed of 81 series-connected submodules of2 parallel 2-cm by 4 -cm calls.
2.3.8 Batteries
Three 16-cell, 12-amp-hour Ni-Ctd batteries perform the energy storagefunction. The battery nodule is a modification of the 10-cell lunar orbitermodule with 3 cells added to each row to obtain the required 16 cells. Thebattery capacity and number of batteties pr'vide high confidence that the five-year life can be achieved. The average in-erbit battery temperature will bemaintained between 0 and 200C.
2.3.9 Power Conditioning Unit (PCU))
The PCU supports a single bus system and detects the difference between busand nominal voltage levels. This difference error is amplified and used in thecentral power control to drive the system functions (i.e., supply regulatedpower, coalrol battery cnarging, boost battery discharge voltage, and dilpose ofexcess array power). Ac the nominal voltage sufficient power is generat'd froMthe solar array to support elI !•*4.a and provide power for battery charging..Vith a positive deviation from the nominal voltage, the central power controlunit within the PCU snnses the error voltage and amplifies it to drive the s.untdissipators sequentially on to dissipate excess solar array-generated power lineto reduce the voltage toward the nominal.
>I
- - n-,i -n -ai l mH mi a -~ l
Sows ouerasIufo w a Rockwell
s"Hu. Sysams Dmsion Intemational
2.3.10 Other GPS Subsystems
The orbit injection subsystem, str:Atural subsystem, and thermal controlsubsystem do not interact with IONDS to an extent that would require them t,) bedescribed in this voltme. Further information on these subsystems can beobtained from Volume II.
25m
Spice aPWNUoiS/gnhsgvson 6 l Rockwells.... Su.W"s W. 01%.Inte.at.onal
3. IOZIDS GLOBAL SEGMENT (IGS)
3.1 IGS OBJECTIVE
The functional objective of IGS is to provide global NUDET surveillancecoverage. The objectives of the IGS development program at Rockwell includedthe definition of a subsystem with maximumm political and military value andwhich, at the same time, has an insignificant impact on the basic CPS mission.
3.2 IGS SYSTEM DESCRIPTION
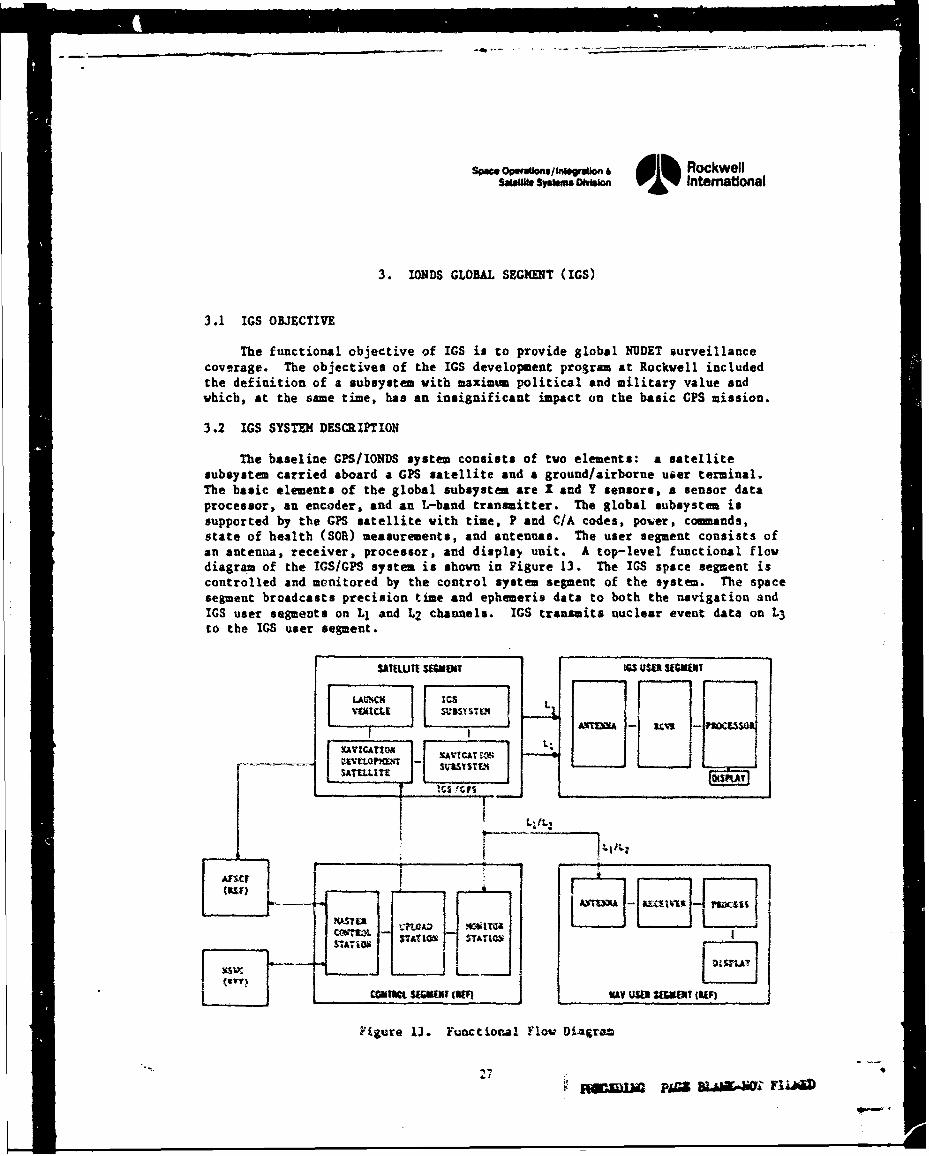
The baseline GPSfIONDS system consists of two elements: a satellitesubsystem carried aboard a GPS satellite and a ground/airborne user terminal.The basic elements of the global subsystem are I and Y sensors, a sensor dataprocessor, an encoder, and an L-band transmitter. The global subsystem issupported by the GPS satellite with time, P and C/A codes, power, commands,state of health (Sof) measurements, and antennas. The user segment consists ofan antenna, receiver, processor, and display unit. A top-level functional flowdiagram of the IGS/GPS system is shown in Figure 13. The IGS space segment iscontrolled and monitored by the control system segment of the system. The spacesegment broadcasts precision time and ephemeris data to both the navigation andIGS user segments on Ll and L2 channels. IGS transmits nuclear event data on L3to the IGS user segment.
SUTUTI SEtM!iT tS U$tR UEGQtUT
LAU"ICN
NAVIGATtOR ANAI-[U v a o"Mr• - - • .S M S T U. I. .SAT UII ATt I ...... .
CMIMU sz~tws $-. ArtoscOrsLU-Er (U _L____ mmm _________mm __m_-
Figure 13. Functional Flov Diagr=
1. ..,
Spcsop n/Ira&on & RockwellS•WeiW Sysitms Okan 01% Intemsatonal
3.2.1 IGS System Operation
The IGS system, when operational, will become a significant part of thetotal IONDS, and the data will be used in conjunction with data obtained fromother sources. NUDET information obtained from IGS will have some inherentadvantages over counterpart systems in that (1) complete global coverage will beaccomplished, (2) better location information will result from the precisiontime available from GPS, and (3) burst altitude can be accurately determined.In addition to the above advantages, the probability of successfully detectinglow yield devices will be enhanced since four or more GPS/IGS satellites will bein view of any global nuclear event simultaneously.
During nuclear event surveillance 6perations, the IGS X and Y sensors willbe operating continuously on each GPS vehicle. If a nuclear burst were tooccur, these optical (Y) and X-ray (M) sensors on-board at least four GPS/IGSsatellites would be in position to receive event data. The event yield andaltitude determine the characteristics of the burst's optical and 7-raysignatures. If these signals pass the selection criteria, the HUDET data villbe processed and a time tag assigned to each event.
The data from the sensors are digitized and stored in the BDP. The IGS L3transmitter is then activated by the BDP, and a prescribed data format istransmitted. After one transmission of the contents of the BDP memory, the L3transmitter is turned off. The IGS event memory has the capacity to store datafrom multiple nuclear events and the stored information vili be available fortransmission upon com~nnd from an appropriate ground station.
3.2.2 IGS Control Segment
The control and monitoring of the IMS operation is accomplished through theGPS TT6C subsystem. Figure 12 illustrates the interface between the GPS TT&Cand the Sate)lite Control Station Network. The GPS ccmAnd decoder producesboth momentary (discrete pulse) comands and a serial comand data streaz of14 bits.
The IGS subsystem is pi-ovided vith eight discrete pulse coemands and one14-bit serial coand with clock and enable signals. An 1ONDS user cancommunicate with one of the satellite control stations for specital IGS ceands.Normally, each IGS space vehicle tramaits sensor status once a day and niclearevent data in real or delayed time.
The tORDS SICH data are presented to the GPS telemetry (pulse code codulator[PC]) in digital torn, The SOH data are transwitted at a rate of 4.000 or500 bps. Tvo 8-bit parallel words are available for outputting• sensor SON tothe PQI mmory for transmission to the control station.
3.2.3 I0NDS Global Sepent
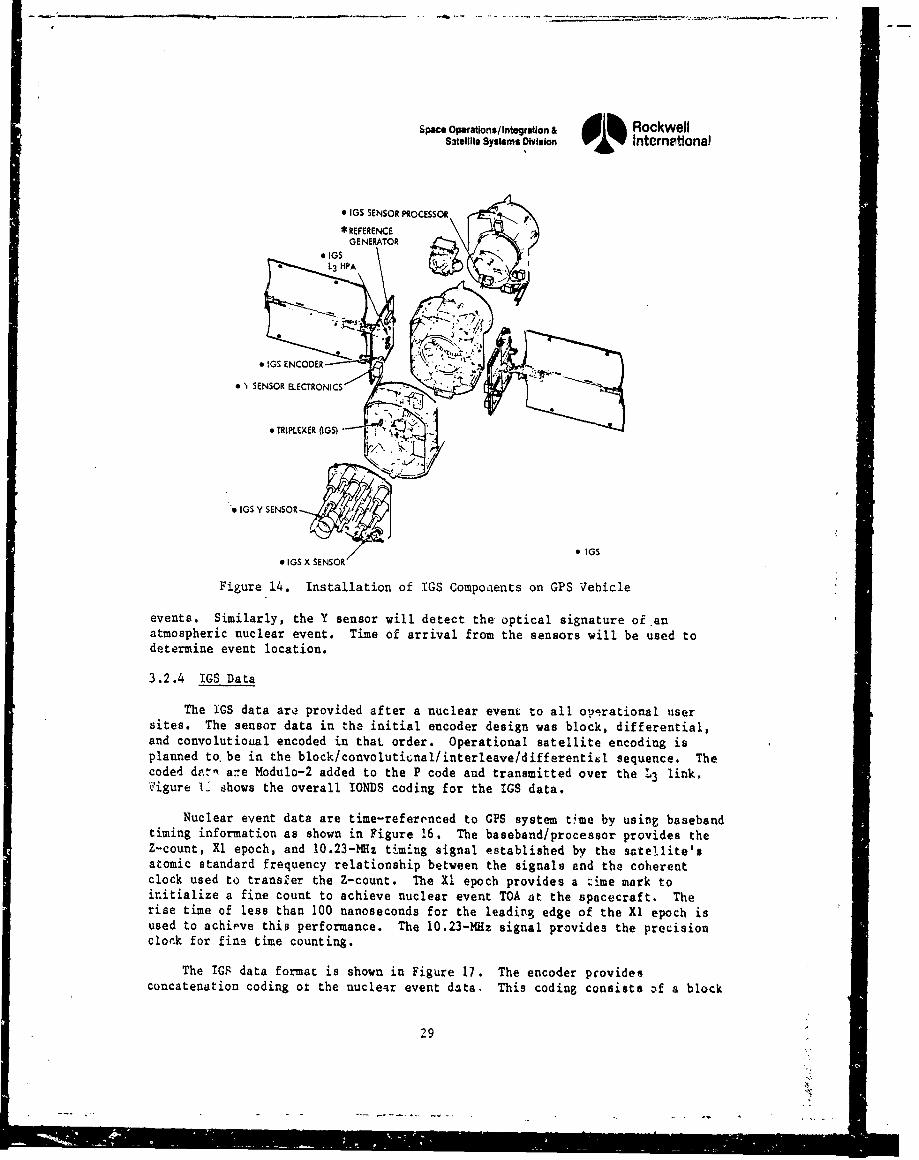
Figure 14 illustrates the location of IOiDS coopenents vith :he X-ray (W)sensor and the optical MT) sensor on the GPS vehicle. Te sunshade on theY sensor is cade of &F transparent material to prevent degradation of GPS L-bandantenna performance. The ! sensor will detect X-rays from exoatmosphezic nuclear
Space Operations/Integration & dlh RockwellS3tellite Systems Division v'• 6 v Intornetlonal
i IGS SENSOR PROCESSOR
* REFERENCEGENERATOR
IGSL3 HPA
*IGS ENCODER
Y SENSOR ELECTRONICS
TRIPLEXER OGS) I
I GS Y SENSOR
IGS* lS X SENSOR
Figure 14. Installation of IGS Compoaents on GPS Vehicle
events. Similarly, the Y sensor will detect the optical signature of anatmospheric nuclear event. Time of arrival from the sensors will be used todetermine event location.
3.2.4 IGS Data
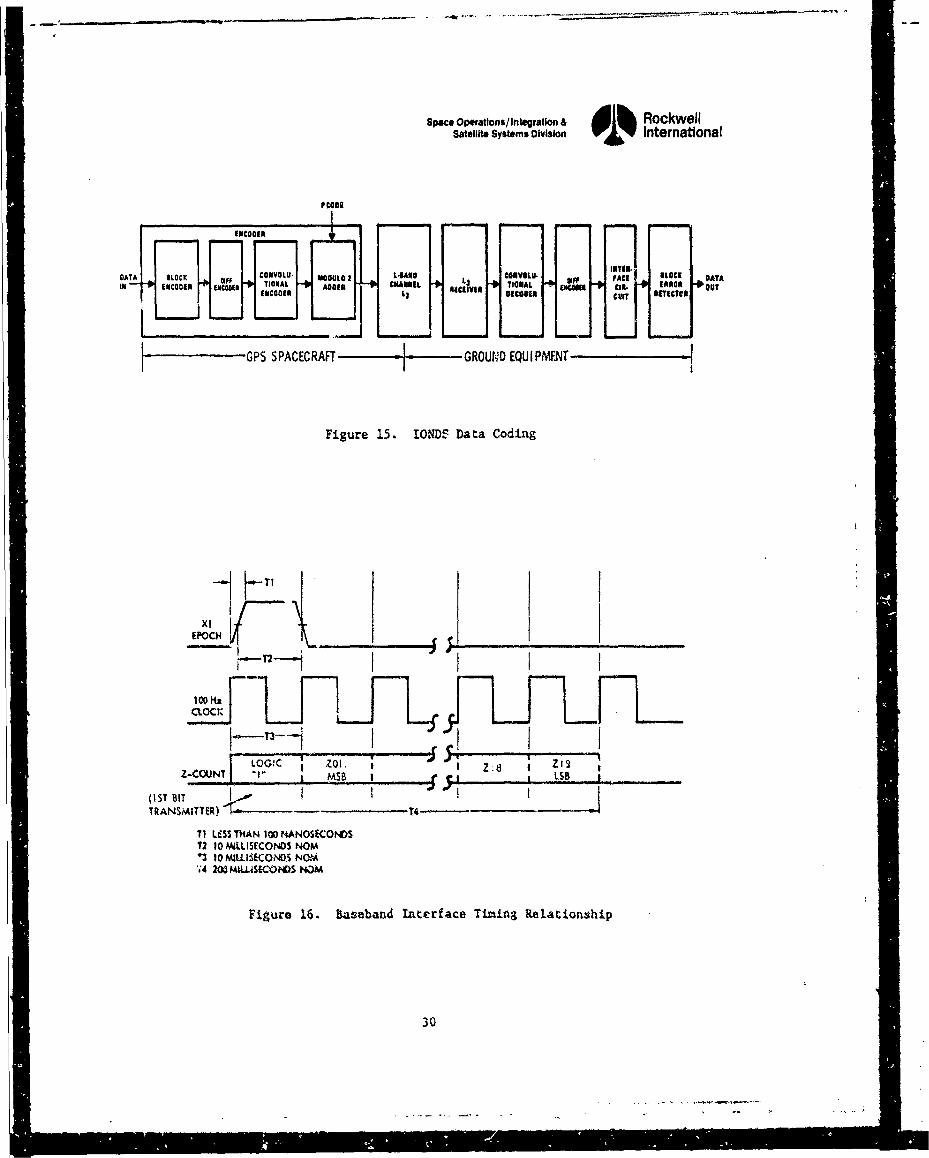
The IGS data are provided after a nuclear event to all op'erational usersites. The sensor data in the initial encoder design was block, differential,and convolutioual encoded in that order. Operational satellite encoding isplanned to. be in the block/convolutiunal/interleave/differentibl sequence. Thecoded dA.t are Modulo-2 added to the P code and transmitted over the L3 link.Vigure 1L dhows the overall IONDS coding for the IGS data.
Nuclear event data are time-referenced to GPS system time by using basebandtiming information as shown in Figure 16. The baseband/processor provides theZ-count, Xl epoch, and 10.23-NHz timing signal established by the satellite'satomic standard frequency relationship between the signals and the coherentclock used to transfer the Z-count. The Xl epoch provides a time mark toinitialize a fine count to achieve nuclear event TOA at the spacecraft. Therise time of less than 100 nanoseconds for the leading edge of the Xl epoch isused to achieve this performance. The 10.23-MHz signal provides the precisionclock for fins time counting.
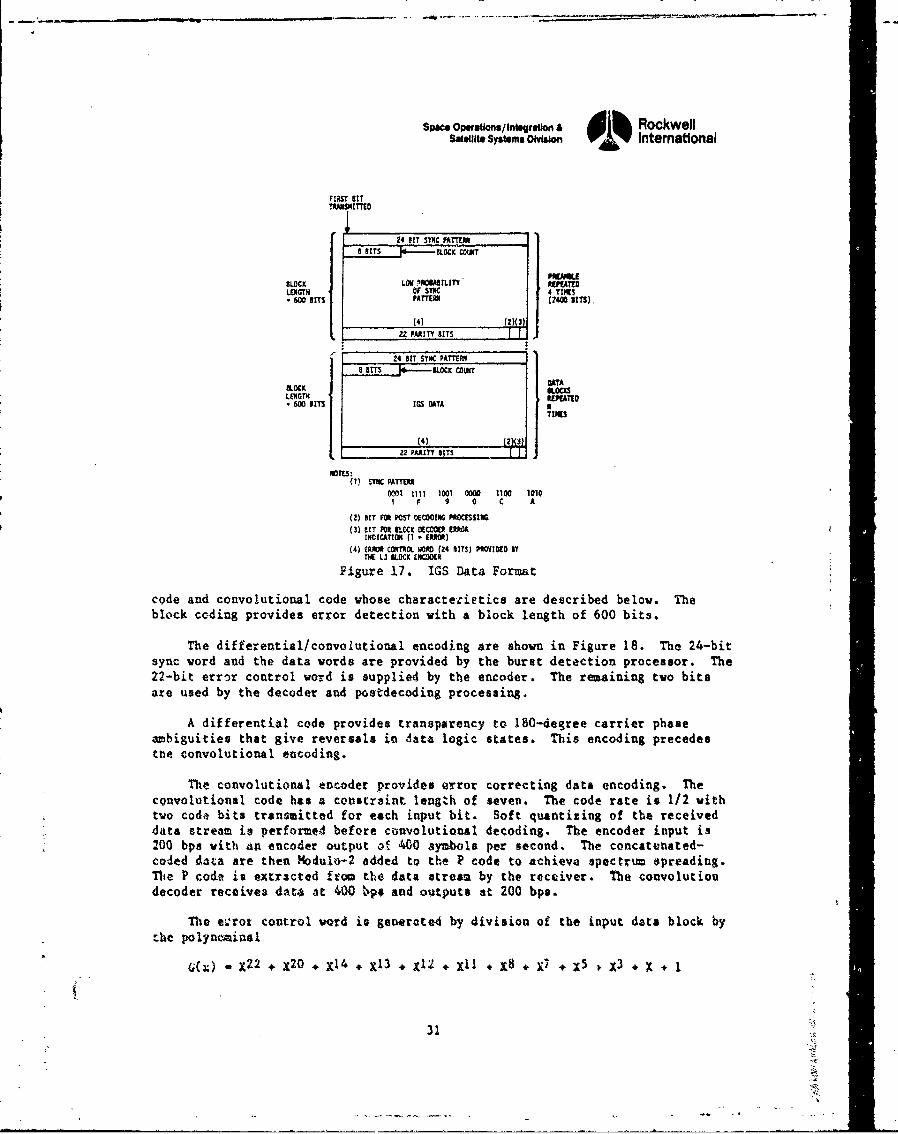
The IGS data format is shown in Figure 17. The encoder pcovidesconcatenation coding or the nuclear event data. This coding consists of a block
29
S"'U
Space Operations/Integration & dlh RockwellSatellite Systems Division International
DATA RLOCK nCONVOLU. NuLOLi. ,,,,M, tAC, lAoTiCO C A TIONAL " CNANuIL L - - OUT
, EN TIONAL " ci s A.IO OthOI 30CN CATr DITICIT94
SI if
GPS SPACECRAFT - GROUND0 EQU IPtt•T
Figure 15. IONDS Data Coding
j TIW_ ___
EPOCH
I WD Hz LD
CLC ... I F -i I
LOG'C ZOI. Zt2Z-COUNT "j L MS , L
(I ST BIT 4..."TRANSMITTER) , - -- T--
TI LESS THAtN 1o NANOS-CON0S12 10 MI.LISECONDS NOM13 IQ MILLISaCOS NOM'-'A 2W ,LLISLC'NOS KWi
Figure 16. baseband Interface Timing Relationship
30
I!I"! " 1"1r lpI''I I,,l I Ii l[1i•l I I rl ll i IlIll I 11
SW* eso•.ns/Inlgr~uon A , Ih RockwellSa01te. Systems Divisios International
FIAST BITTkAMS"ITTto
24 HIT SYNC PATTERN
6 SITS , BLOCK COT
LOCK LOW 'Pl•BABITY "M~tTLENGTH OF SYNC 4 TrMU
600 errs PATTEfi (M40 SITS).
(4) (2)(3)lt 2 PARITY SITS
24 8IT SYNC PATTEM
8 8115 h-- &OCK COLIC!
LOCsK QATA
LENGTH BAT10600 BITS IGS OhTA ITiles
(4) ()322 PARIY BITS
NOTES:(1) SYMC PATTERN
0001 111] 1001 0000 1100 1010I F 9 0 C A
(2) SIT FOR POST DECOO1I P*DMSIWA(3) VIT FOR BiLOCX OECOW( EP"C
INDICA•rIO (I - ERROR)(4) (RAOR COITUS W (Z4 SITS) PROVIDEO 1Y
T L IU MCK IOWNS
Figure 17. IGS Data Format
code and convolutional code whose charactezirtics are described below. Theblock coding provides error detection with a block length of 600 bits.
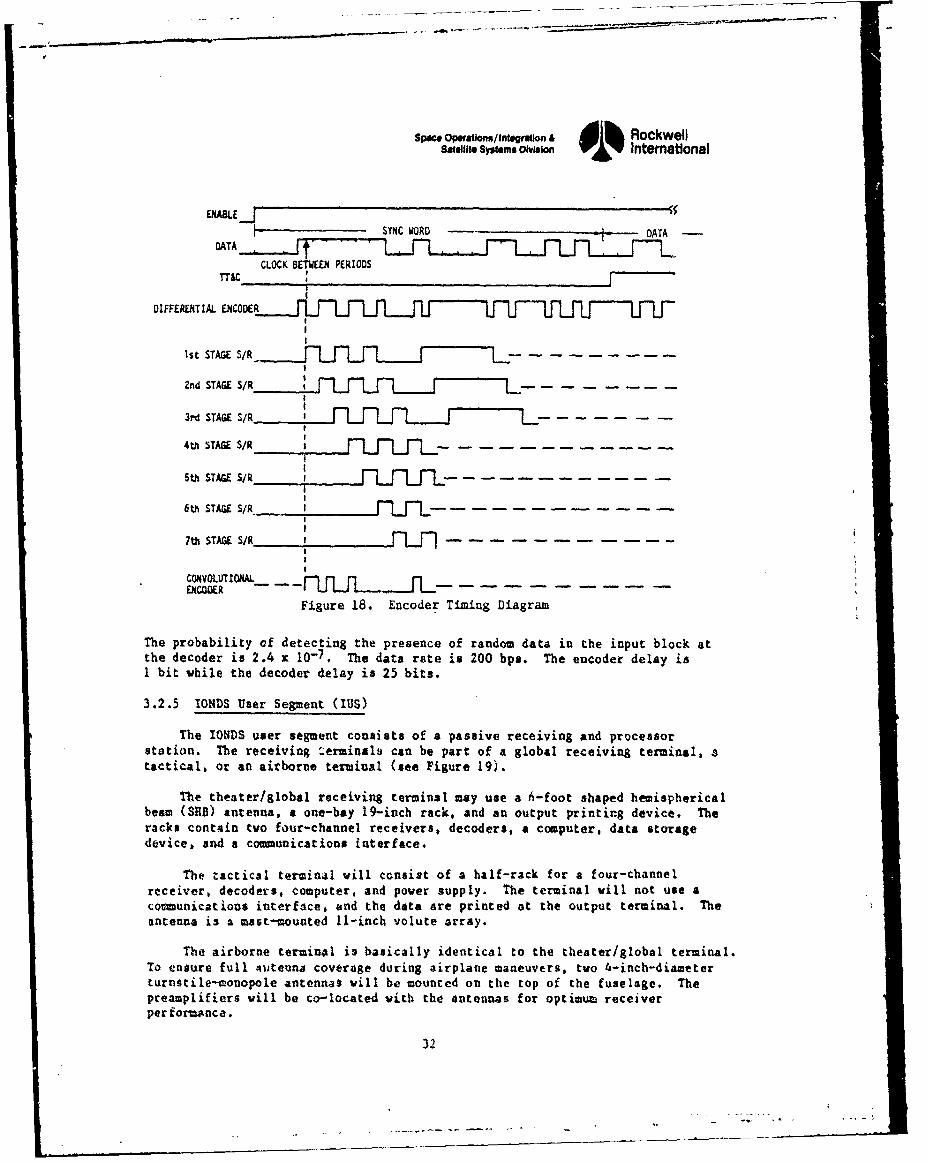
The differential/convolutional encoding are shown in Figure 18. The 24-bitsync word and the data words are provided by the buret detection processor. The22-bit errir control word is supplied by the encoder. The remaining two bitsare used by the decoder and postdecoding processing.
A differential code provides transparency to 180-degree carrier phaseambiguities that give reversals in data logic states. This encoding precedesthe convolutional encoding.
The convolutional encoder provides error correcting data encoding. Theconvolutional code has a cobstraint length of seven. The code rate is 1/2 withtwo code bits transmitted for each input bit. Soft quantizing of the receiveddata stream is performed before convolutional decoding. The encoder input is200 bps with an encoder output of 400 symbols per second. The concatenated-coded data are then Modulo-2 added to the P code to achieve spectrtu spreading.The P code is extracted from the data stream by the receiver. The convolutiondecoder receives data at 400 %ps and outputs at 200 bps.
The evrot control word is generate4 by division of the input data block by-he polynoiminal
(;(x) -X 2 2 + X20 + X14 X13 X l12 + Xll + X8 . X7 + X5 3 X 1
31
"S•
Spa*ce Opeations/Integruofio & RockwellS8t11eit0 Systems DMvi"ion Intemational
ENABLE-l= ~~~SYNC WORD - - DT
CLOCK BETWEEN PERIODs
DIFFERENTIAL ENCODER ...........
Ist STAGE S/R
2nd STAGES R J LJ L ---------
3rd STAGE SIR.........L.,LIL..J,
4th STAGE S/R J J1 f , ..... ......
5th STAGE SIR ........ J...Lf1..- - - - - - -
6th STAGE SIR_
7th STAGE S/R.......... ... jJ - - - - - - -
CONVOLUTIONAL� f J JJ 1ENCODER - '
Figure 18. Encoder Timing Diagram
The probability of detecting the presence of random data in the input block atthe decoder is 2.4 x 10⁻⁷. The data rate is 200 bps. The encoder delay isI bit while the decoder delay is 25 bits.
3.2.5 IONflS User Segment (IIJS)
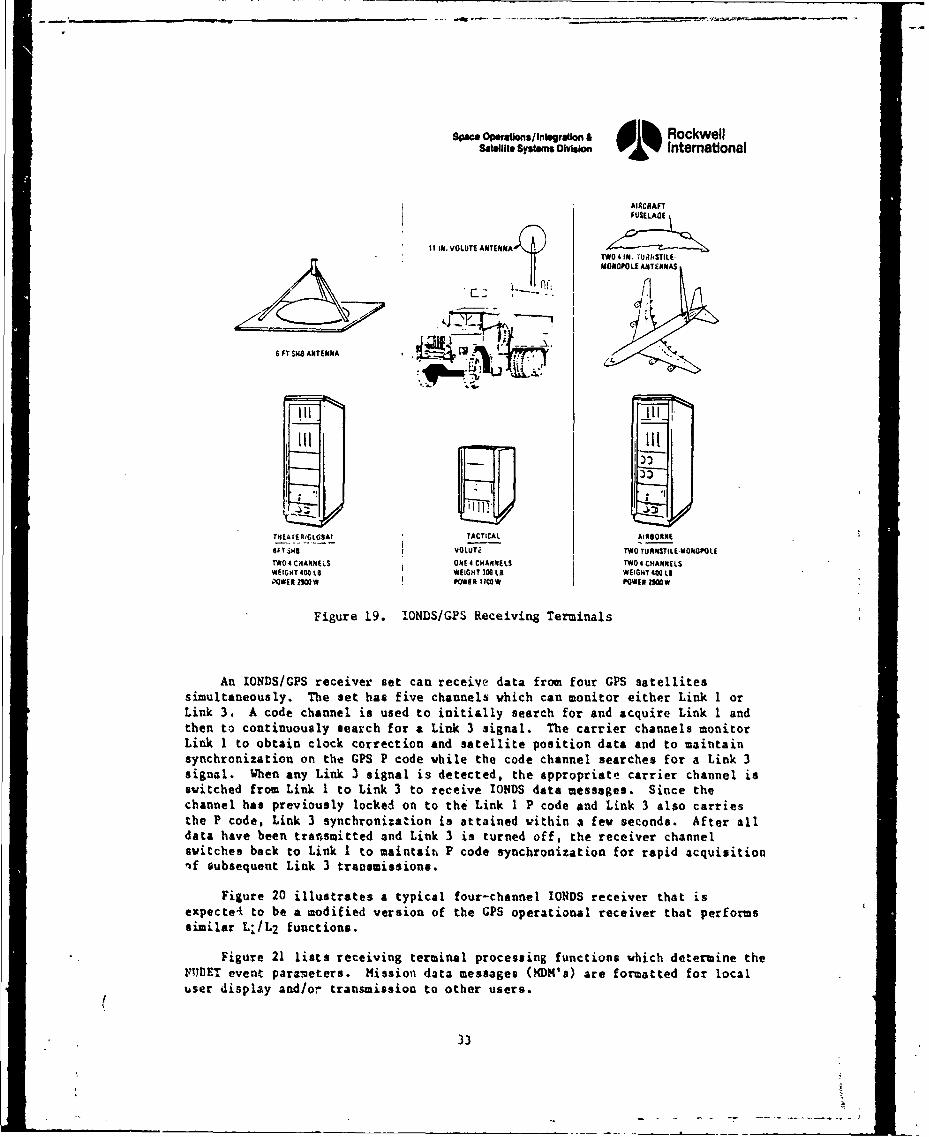
The IONDS user segment consists of a passive receiving and processorstation. The receiving Z-erinals can be part of a global receivin~g terminal. Satactical, or an airborne terminal (see Figure 19).
The theater/global receiving terminal may use a ti-foot shaped hemisphericalbeam (SlID) antenna, a one-bay 19-inch rack, and an output printing device. Theracks contain two four-channel receivers, decoders, a computer, data storagedevice. and a communications interface.
The tactical terminal will consist of a half-rack for a four-channelreceiver, decoder$. computer, and power supply. The terminal will not use acommunications interface, and the data are printed at the output terminal. Theantenna is a mast-counted 11-inch volute array.
The airborne terminal is basically identical to the theater/global terminal.To ensure full ;ttteana coverage during airplane maneuvers,' two 4-inch-diameterturnstile-nconopole antenna$ will be counted on the top of the fuselage. Thepreamplifiers will be co-located with the antennas for optimum receiverper f TormAtnce.
32
space Operawns/Inflgratin & d1 RockwellSatellite Systems Divion. 01% International
AIRCRAFTFUSELAGE
I I IN. VOLUTEANE A
0ANTENMA X TWO 4 IN. 'U.IISTILE-MONOPOLE ANTiNVAS
C- [
6 FT SWO ANTENNA
III ~~jI
TKEAr60IGLOSAI TACTICAL AIRSORNE
6FTSHS VOLUT 1TWO TURNSTILE.MONOPOLETWO 4 CHANNELS ONE 4 CHANNELS TWO 4 CHANNELS*EIGaHT 400 L8 WEIGHT 300 Li WEIGHT 400 LeNOWER M0W PONEIA 10OW POWER MIN*
Figure 19. IONDS/GPS Receiving Terminals
An IONDS/GPS receiver set can receive data from four GPS satellitessimultaneously. The set has five channels which can monitor either Link 1 orLink 3. A code channel is used to initially search for and acquire Link 1 andthen to continuously search for a Link 3 signal. The carrier channels monitorLink 1 to obtain clock correction and satellite position data and to maintainsynchronization on the GPS P code while the code channel searches for a Link 3signal. When any Link 3 signal is detected, the appropriate carrier channel isswitched from Link 1 to Link 3 to receive IONDS data messages. Since thechannel has previously locked on to the Link I P code and Link 3 also carriesthe P code, Link 3 synchronization is attained within a few seconds. After alldata have been transmitted and Link 3 is turned off, the receiver channelswitches back to Link I to maintaih P code synchronization for rapid acquisitionif subsequent Link 3 transmissions.
Figure 20 illustrates a typical four-channel IONDS receiver that isexpected to be a modified version of the GPS operational receiver that performssimilar Lj/L 2 functions.
Figure 21 lists receiving terminal processing functions which determine theFTUDET event parc-oeters. Mission data messages (XDM's) are formatted for localuser display and/or transmission to other users.
33
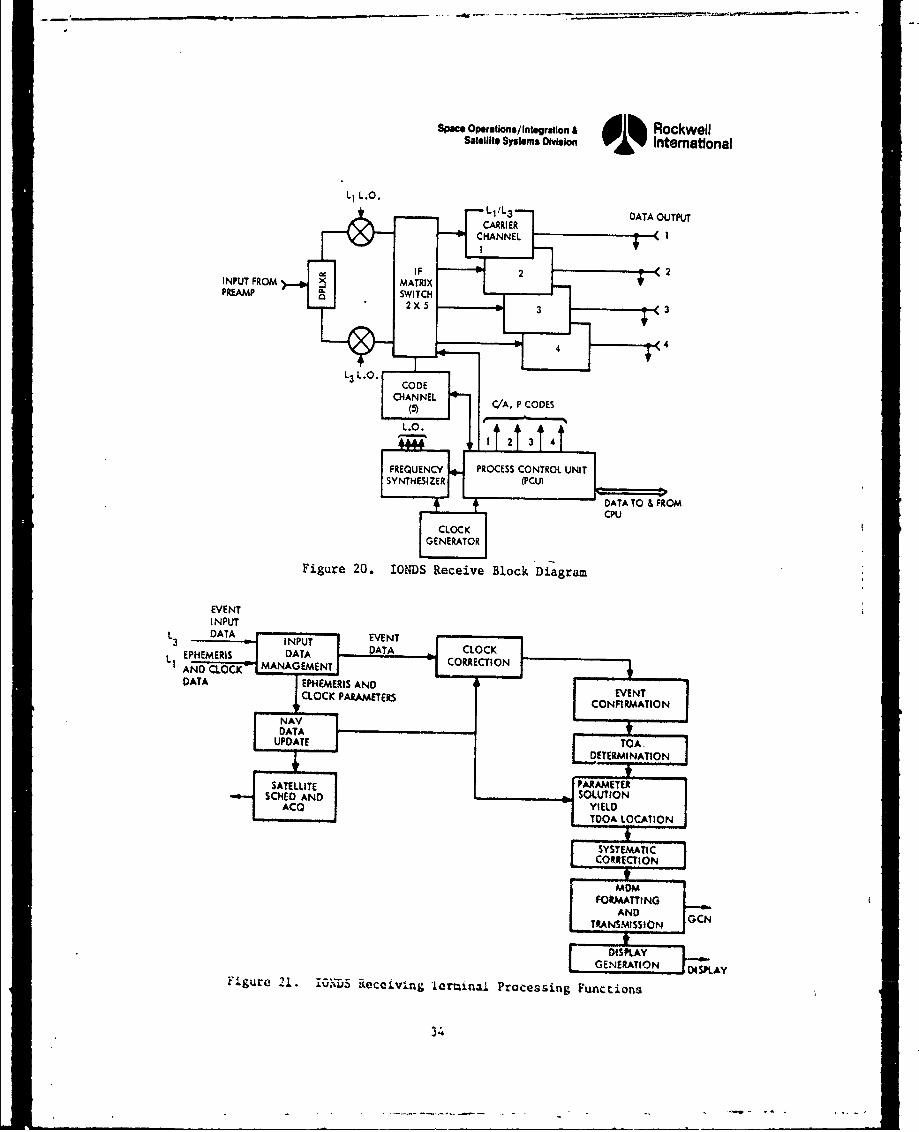
SPace OpeftauonS/Integration A RockwellSatellite Systems OlVISIon Internatfonal
Li L.O.
1-1/1-3DATA OUTPUJT
L LDATA TOIFO
INPUT
AND U FROM MANARIEN
PREAMARSWETEH
L3DO L.C.CODN
CHANNELSVSTEMATIDE
GEERTON DS)Ai~iguc 21.Ivw~~ecciing Or. niPoe~.n ucin
I3t3t4
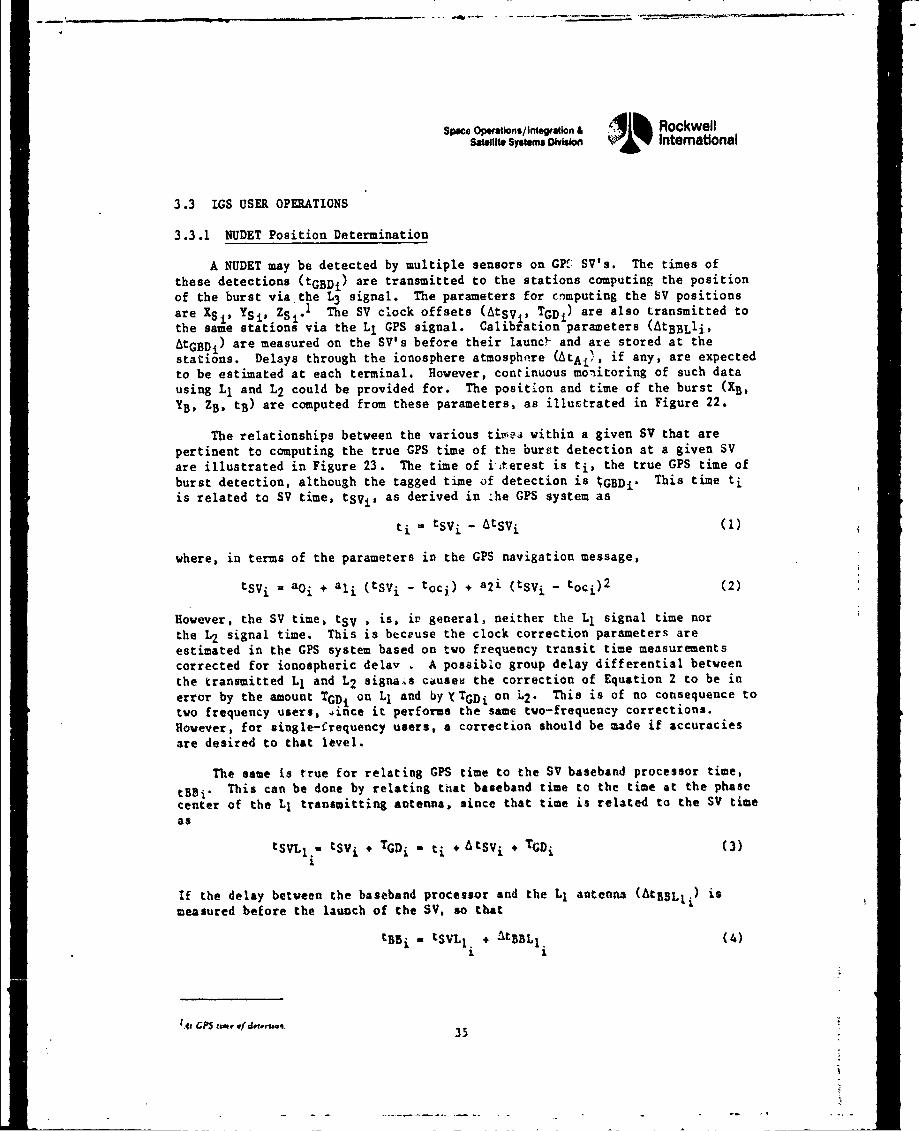
, .. •~~~- • - - -.• - - - - - -÷ • ••• .. .:• _=
Spawe Opefations/Irdegtation & 41k RockwellSatellite Systems Dlvivln neraioas,•• Smm o~k•, "TV Intematlonal
3.3 IGS USER OPERATIONS
3.3.1 NUDET Position Determination
A NUDET may be detected by multiple sensors on GPK: SV's. The times ofthese detections (tGBDi) are transmitted to the stations computing the positionof the burst via the L3 signal. The parameters for computing the SV positionsare XS, YSi, ZS 1.l The SV clock offsets (AtsVj, TGDj) are also transmitted tothe same stations via the Ll GPS signal. Calibration parameters (AtBBLli,AtGBDI) are measured on the SV's before their launc0 and are stored at thestations. Delays through the ionosphere atmosphere (AtAi), if any, are expectedto be estimated at each terminal. However, continuous monitoring of such datausing Ll and L2 could be provided for. The position and time of the burst (XB,
YB, ZB, tB) are computed from these parameters, as illustrated in Figure 22.
The relationships between the various tivej within a given SV that arepertinent to computing the true GPS time of the burst detection at a given SVare illustrated in Figure 23. The time of i-terest is ti, the true GPS time ofburst detection, although the tagged time of detection is ýGBDi. This time tiis related to SV time, tSvi, as derived in -he GPS system as
ti = tsvi - Atsvi (1)
where, in terms of the parameters in the GPS navigation message,
tsvi - a0 i + ali (tsvi - toci) + a2i (tSVi - toci)2 (2)
However, the SV time, tSV , is, ir general, neither the L1 signal time nor
the L2 signal time. This is beccuse the clock correction parameters are
estimated in the GPS system based on two frequency transit time measurements
corrected for ionospheric delay . A possible group delay differential betweenthe transmitted L1 and L2 signa.s causeu the correction of Equation 2 to be inerror by the amount TGDj on L1 and by yTGDj on L2. This is of no consequence to
two frequency users, 4ince it performs the same two-frequency corrections.
However, for single-frequency users, a correction should be made if accuraciesare desired to that level.
The same is true for relating GPS time to the SV baseband processor time,
tBBi" This can be done by relating that baseband time to the time at the phasecenter of the L1 transmitting antenna, since that time is related to the SV timeas
tSVL1 . tSVi + TGDi - ti +AtSVi + TGDi (3)
If the delay between the baseband processor and the Ll antenna (AtBBLtI) is
measured before the launch of the SV, so that
tBBi - tSVL1 , A+tBBL 1 . (4)
AtGS ~ i.t/dtr;% 35
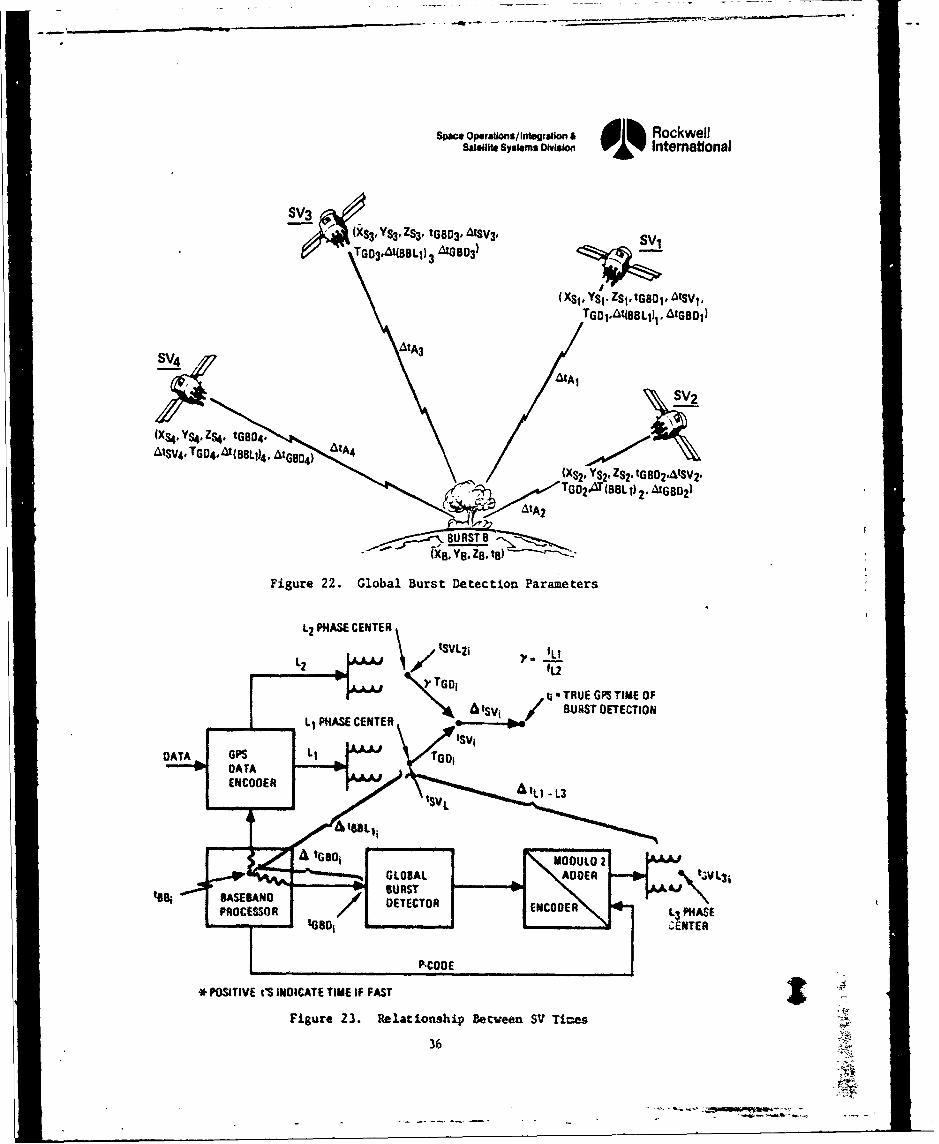
Space Operations/ Integration~ &1 RockwellSatellite Systems DIVisio International
SV (X3 , YS3, ZS3, tGBO3, tSV 3, vT G 03 ,, W( 3 B L ) 3 A tG 5 O 3 )
TGO144811 )1 I ltG8D1)
SV4 AtA3
AtSV4. TG0 4.'W(BsL 1)4 .4t S04) AtA4
(XS2, YS2 . ZS2- tG80 2.AtSV2-TG0 2AT (881 1) 2. AtG802)
-(X8. Yo. Z8. tfl) '--Z
Fi.gure 22. Global Burst Detection Parameters
12 PHASE CENTER
ti aTRUE GPS TIME OF
LI PASECENTR tv 1 BURAST DETECTION
&EDE
ENCODERPICOSE
* POSIIVE ~SIN~iCAE TIMEiFAS
A tG8Oi
.. gu....3. BRSlTinhpDtezSVT.eGLBLADE6 j
1
-a-)'
Spwo Op*w/1%n1 A d RockwellS•,It, sysutm.s OIvWo Intemational
this baseband time is related to GPS time ti as
tBBi - ti + Atsv1i+ TGDi + AtBBL. (5)1
(An epoch at the baseband occurs earlier than in GPS time by the amountAtsvi + TGDi + AtBBL li.)
Likewise, the delay between the baseband processor and the global burstdetector (AtGBDi) can be measured before the launch of the SV so that
tGBDi - tBBi - AtGBDi (6)
The relationship of that time to GPS time is found by combining Equations 5 and6 so that
tGBDi = ti + AtsVi + TGDi + AtBBL. - AtGBDi (7)1
or, ccuversely, the GPS time of a burst time tagged with tGBD is
tin tGBDi - Atsvi - TGDi - AtBBL1 i + AtGBDi (8)
It is conceivable that the delay between the burst detector and the L1 antennacould bt measured before launch so that
AtGBDLl. - tGBDi - tSVL1 . (9)1 1
Eliminating the baseband time and combining Equations 4 and 6 yield
AtGBDL 1 . " AtBBL1 , - tGBDi (10)
so that Equation 8 becomes
t; ' tGBDi - dtSV- - TGDi -tGBDLI. (11)
solving for the NVDET location and time.
The ranges from the burst to the four SV's are
i / (us - X) 2 (yS - yb) 2 + (Zs. ZB) 2 ; i - ... ,4 (12)I I l
which is related to the transit timts (AtTj) of the detected wave front by
tTi - ti - t, Rw... + LtAi; i - 1, ... , 4 (13)
37
SPac op.ations/Inl,sgraon & I Rockwellsgtat Sy0m"s oD#VWuon International
where C is the speed of light, so that
Ri - Cti - C AtA. - CtB; i - 1, ... , 4 (14)
where ti is already corrected by Equations 8 or 11. Thus, we have fourequations with four unknowns (XB, YB, ZB, and tB). The fact that theseequations are nonlinear only requires that they be solved in an iterativemanner. One approach is to guess a solution (tB should be about 60 millisecondsearlier than the ti) and to linearize about the guessed solution and solutionsof subsequent iterations. (This is called quasilinearization.) That is, solvefor a solution vector
Uk - (XBk, YBk, ZBk, tBk)T (15)
where ( )T means transpose, and the k represents the kth iteration(k a 1, 2, 3, ... ), from the equation
-1
Uk - Ak-l V (16)
where the ith row of the 4 x 4 matrix Ak is
Ak- X - Xs., - ZB - 2Z., 2C2 - C2 tB (ti - AtAi) (17)A I' k j k i k k
and the ith component of the 4 z I vector V is
Vi - C2 (ti - AtA )2 - X 2 - ys2 - Zs.2 (18)
The iterations should be continued until there are no significant changes in the
solution.
3.3.2 NUDET Time of Arrival (TOA) Error Sources
The one-sigma error in the computation of the GPS time of burst detectionis simply the KSS of the errors in the terms of Equation 8 (or II). This is,for Equation 8
at2 V tG * 02°6tSV. + o'TGD, * 0'AtBBLj' * 2I. tG (19)/tV
since they are probably, but not necessarily, independent of each other. Inthis equation otGBD is the one-sigma error in time tagging the event given
i
that the time tag was supplied perfectly to the G5D. CatSV" is the one-si&g&a
error of the SV clock correction, which for Phase I GPS is budgeted to be lessthan 9 nanoseconds for two hours after upload. GTGD is related to the error (or
38
space Operations/Insgration& Rockwell
drift) in the calibration of the L.2 group delay to 1.1 group delay in the SV andthe GPS control segments' ability to estimate it, which can occur only when theionospheric delay is thought to be negligible. This error should be as low as 2to 3 nanose~conds but could be as large as 22.5 nanoseconds (l/1-Y' A(Ll - L2)]before it is estimated. TheOyAtBBL1, andu AtGBD iare functions of the ability
1. i
to measure these delays and how they drift after launch.
3.3.3 Relativity Effects
The clock correction parameters received from an SV for computing 4ýtSVinclude the effects of general relativity on the SV clock as it is observed fri~mthe surface of the earth. A question has arisen concerning these effects on thedetermination of the burst position and time. The position and time solution isidentical to that of a CPS user on the surface of the earth except that thesignal paths are reversed from those in GPS. Since the time of the burst$ tB,is the time on the surface of the earth, the relativity corrections for the SVtimes, as related to that time, are identical to those of the GPS user.Therefore, no additional relativity corrections are required.
3.4 CPS TIME AND FREQUENCY SYNTHESIS
The apace vehicle navigation system provides continuous earth coverage fora navigational signal comprised of both a C/A signal and a P signal on oneL-band carrier, and a P or a C/A signal on 3 second L-band carrier. Thenavigation signal is composed of PRN ranging code signals. Superimposed dataprovide satellite system time for acquisition aiding, the space vehicleephemerides, and clock correction. The IONDS user will use the Li signal forP code tracking and for satellite timing and position data.
The PRN phase-omodulated signals are radiated in three bands, LI, L.2, and 1.3.The Ll carrier component is quadriphase shift key (QPSK) modulated by separatePRI* codes that contain the required navigation information. One carriercomponent is a-precision navigation signal and the other a clear/acquisitionsignal. The P and C/A csrrie~r components' relative RF power levels depend onwhich of two operating mitdes is used. Trhe L2 carrier signal is biphase-modulated by the same P or C/A signals used to modulate LI, selectable by groundcommand. The L.3 carr,.er signal is biphase-modulsted by the P signal used tomodulate LI, with ICS data added to the P code. The Ll. 1.2, and L.3 carriers andall modulation ratts are derived from one of the three 1O.23-IMHz frequencysources.
3.5 CODEF CHARACTERISTICS
Characteristics of P and C/A codes are as follows, with the frequency andtime tolerances being controlled by the SV frequency standard:
39
Space Operailo./•.•ngo £ Rockwellsawflhe sYStMs I.NV~ i'Y Intemational
Characteristics P C/A
Chipping rate (Mbps) 10.23 1.023
Code epoch 7 days I maData rate (bps) 50 50
Frame length (bits) 1,500 1,500
3.5.1 PRN P Code
The PRN P code is a ranging code, XPi(t), of 7 days in length at a chippingrate of 10.23 Mbps. The code generation technique has the capability ofgenerating a set of 37 sequences of 7 days' length. Each of the sequences willbe mutually exclusive. The space vehicle code generators are capable ofgenerating a set of 32 sequences of 7 days' length and are selectable beforelaunch. The remaining five sequences are reserved for other transmitters. The7-day sequence is the Modulo-2 sum of two subsequences called XI and X2. The Xlsequence is 15,345,000 chips (1.5 seconds) long. The X2 sequence is15,345,037 chips long.
The P digital stream is the Modulo-2 sum of the data bit stream clocked at50 Hz and two extended patterns clocked at 10.23 MHz (Xl and X2). XI isgenerated by the Modulo-2 sum of the output of two 12-stage registers (MA andXlB) short cycled to 4,092 and 4,093 chips, respectively. When the XIA shortcycles are counted to 3,750, the Xl epoch is generated. The Xl epoch occurseach 1.5 seconds, after 15,345,000 chips of the Xl pattern.
The polynomials for XIA and XIB, as referenced to the shift register input,are as follows:
XIA: I + X6 + X8 + X11 + XlZ
XIB: I + XI + X2 + X5 * X8 + X9 + xIO + XII * X12
Following the Xl epoch the first 12 chips of XIA contained in stages I and12 (left to right) are 000100100100. The last three chips, 001, of the 4,095sequence corresponding to this polyniinail are omitted in shortening thesequence. The first 12 chips of XIB contained in stages 1 and 42 (left toright) are 001010101010. The last two chips of the 4,095 sequence correspondingto this polynominal. 01. are oitted in shortening the sequence.
At the occurrence of each epoch, XIA and XIB begin at the first chip oftheir respective sequences. Shortly before XIA completes the 3,750th (last)cycle of each 1.5-second epoch interval, XIB completes its 3,749th cycle. ThenXIS is stopped at the final chip of its cycle until XIA completes its cycle,whereupon both begin a new epoch at the first chip of their respective sequences.
X2 is similarly generated by the ,Mdulo-2 sx= of the output of tye 12-stageregisters (XMA and X2B) short cycled to 4,092 and 4,093 chips respectively. Thepolynocinals for X2A and X2B are as referenced to the shift register input:
40
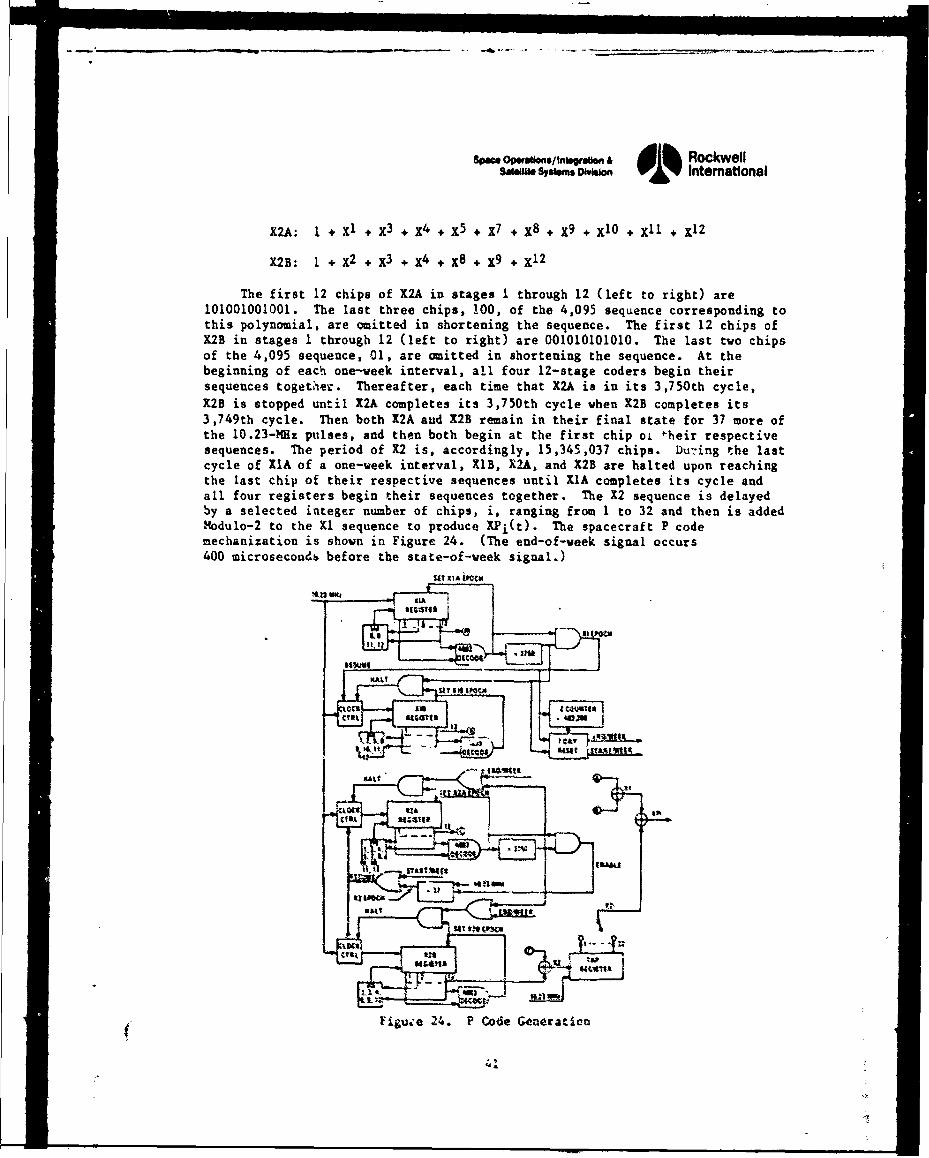
n. .....- ...
sPec op".u"Ol/n•e•ban £ RockwellsS.u S•SuIMa oiWWW 01% International
XZA: 1 + Xl + X3 + X4 + X5 + X7 + X8 + X9 + XIO + X'1 + X12
X2B: 1 + X2 + X3 + X4 + X8 + X9 + X12
The first 12 chips of X2A in stages 1 through 12 (left to right) are101001001001. The last three chips, 100, of the 4,095 sequence corresponding tothis polynomial, are omitted in shortening the sequence. The first 12 chips ofX2B in stages 1 through 12 (left to right) are 001010101010. The last two chipsof the 4,095 sequence, 01, are omitted in shortening the sequence. At thebeginning of each one-week interval, all four 12-stage coders begin theirsequences togetaer. Thereafter, each time that X2A is in its 3,750th cycle,X2B is stopped until X2A completes its 3,750th cycle when X2B completes its3,749th cycle. Then both 12A and X2B remain in their final state for 37 more ofthe 10.23-MHz pulses, and then both begin at the first chip oi -heir respectivesequences. The period of X2 is, accordingly, 15,345,037 chips. Du.•ing the lastcycle of XlA of a one-week interval, XlB, X2A, and X2B are halted upon reachingthe last chip of their respective sequences until XIA completes its cycle andall four registers begin their sequences together. The X2 sequence is delayedby a selected integer number of chips, i, ranging from 1 to 32 and then is addedModulo-2 to the Xl sequence to produce XPi(t). The spacecraft P codemechanization is shown in Figure 24. (The end-of-week signal occurs400 microsecon4d before the state-of-week signal.)
UT 11 A 60€M
S~Fj~u.'e 24. P Code Generation
Vd
Sw.a, Op• Jns/Ieroic diw Rockwellsaw,.m sswma ioW, Intemartonal
The Ll and L3 • codes and the Xl epochs are synchronous with the same10.23-liz clock. The Z-count is defined as the 19-bit binary number that is
equal to the number of Xl epochs that have occurred since the end of theprevious week. The range of the Z-count is from 0 to 403,199. The epochcoincident with the start of the present week is defined as the zero state of
the Z counter.
3.5.2 PRN C/A Code
The PRN C/A code shall be a ranging code, XCi (t), at a chipping rate of1.023 MHz, and it shall be made up of a 1,023-bit Gold code. The epochs of theGold code shall be synchronized with the Xl epochs. One of the 32 differentcodes shall be hardwired at the time of production of each NAV subsystem. Each
of the 32 codes shall have a low envelope cross-correlation with any other ofthe set. The polynomials and phases of the 32 codes shall be selected inaccordance with ICD-1008-00002. The C/A digital stream is a Modulo-2 sum of thedata bit stream of 50 Hz (D), and a 1,023-bit linear pattern of 1.023 MHz (G).Epochs of the G code and transitions of the D train are aligned with theX1 epochs of the P code. The G code is the Modulo-2 sum of two 1,023-bit linearpatterns generated by means of the following polynomials
Gl . X10 + X3 + 1
G2 - X10 * X9 + X8 + X6 + X3 + X2 + I
G2 phases are selectable to provide 36 derived codes. Each of the 36 codescontains 512 ones and 511 zeros. The polynomial exponents are referred to theinput end of the shift register.
3.6 DOWNLINK SYSTEM DATA
The transmitted system data D(t) carry space vehicle ephemerides, systemtime, space vehicle clock behavior data, Snd system status sesaiges. The datastream D(t) is conon to both the P and CIA signals on Ll and L2 . IGS data aretransmitted on L3. both user system segments use the navigation signal L1 foracquisition, for P code tracking, and for determining system time and sattIliteposition. The 10NDS user receives the IGS signal transmitted on Lj by the SV.
An antenna triplexer unit in the SV subsystem accepts three separate phase-modulated carrier signals (LI, 17. L3). provides spectrum filtering to cinitlteout-of-band emissiots, and combines these signals into a co=on port for
simultaneous tran6*issioU to the antenna. The SV auteona radiates the GPS and10tDS signals.
The RF-radi4ted navigation signals are provides by a MIN assembly on theNA7 *bsystea on board each SV. Navigation data required by the NAV user willbe updated by the HCS through the ULS. These data are stored in the %AV
eneory/processor codule of the baseband processor.
T11e NAV subsystem is capable of operating in the nine =*des shlom inTable S. The codes are differentiated by tZe specific combinations of P andCIA signals on LI and L2. Nodes 7 and 8 are for gtound checkout. The normal
S• • • • mm m m i m • ~ ss mqll m 1
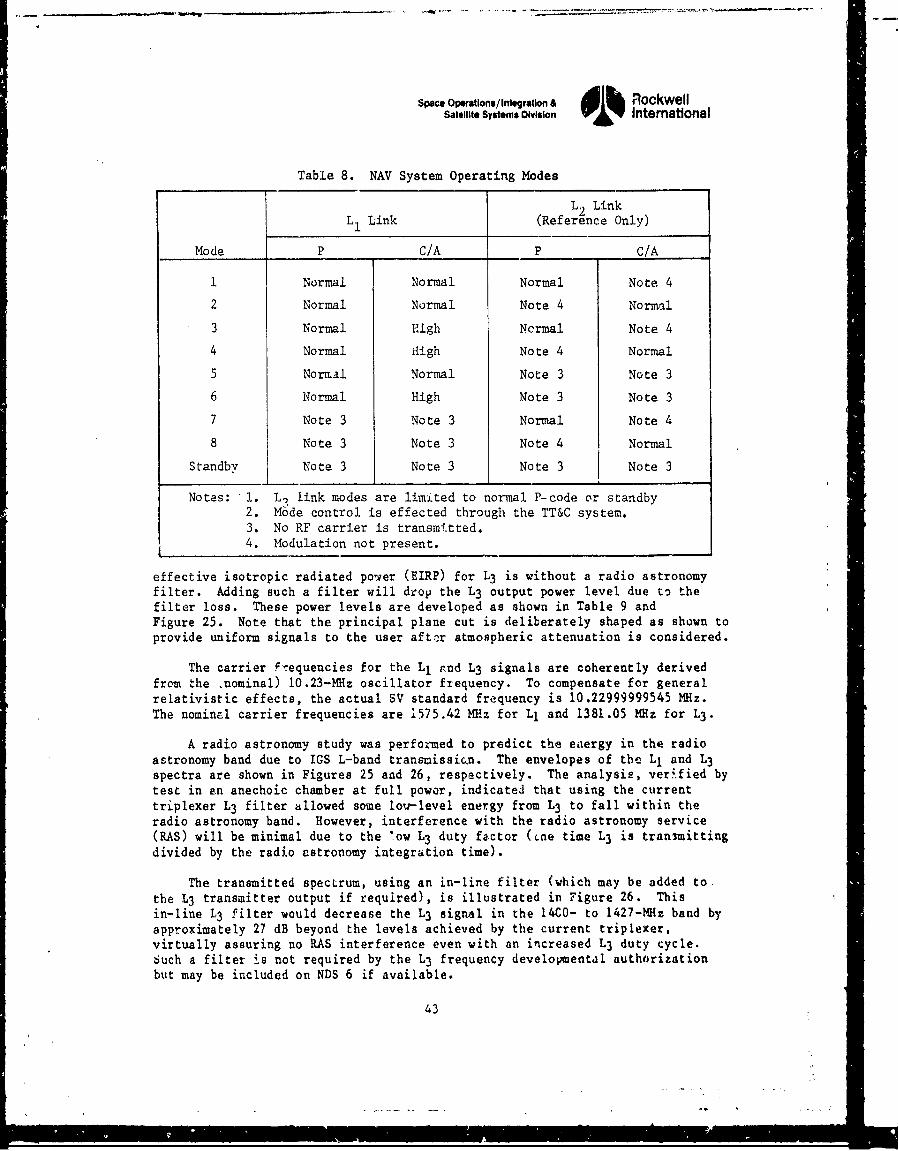
Space Opetatons/ Interation & •l RockwellSatellite Systems Division V 4 ' International
Table 8. NAV System Operating Modes
L. LinkL1 Link (Reference Only)
Mode P C/A P C/A
1 Normal Normal Normal Note 4
2 Normal Normal Note 4 Normal
3 Normal High Ncrmal Note 4
4 Normal High Note 4 Normal
5 Normal Normal Note 3 Note 3
6 Normal High Note 3 Note 3
7 Note 3 Note 3 Normal Note 4
8 Note 3 Note 3 Note 4 Normal
Standby Note 3 Note 3 Note 3 Note 3
Notes: I. L, link modes are limited to normal P-code or standby2. Mode control is effected through the TT&C system.3. No RF carrier is transmitted.4. Modulation not present.
effective isotropic radiated power (EIRP) for L3 is without a radio astronomyfilter. Adding such a filter will drop the L3 output power level due to thefilter loss. These power levels are developed as shown in Table 9 andFigure 25. Note that the principal plane cut is deliberately shaped as shown toprovide uniform signals to the user after atmospheric attenuation is considered.
The carrier frequencies for the L1 and L3 signals are coherently derivedfrom the *nominal) l0.23-MHz oscillator frequency. To compensate for generalrelativistic effects, the actual SV standard frequency is 10.22999999545 MHz.The nominal carrier frequencies are 1575.42 MHz for L1 and 1381.05 MHz for L3 .
A radio astronomy study was performed to predict the eaergy in the radioastronomy band due to IGS L-band transmissic~n. The envelopes of the Ll and L3spectra are shown in Figures 25 and 26, respectively. The analysis, verified bytest in an anechoic chamber at full power, indicated that using the currenttriplexer L3 filter allowed some lou-level energy from L3 to fall within theradio astronomy band. However, interference with the radio astronomy service(RAS) will be minimal due to the 'ow L3 duty factor (Lne time L3 is transmittingdivided by the radio astronomy integration time).
The transmitted spectrum, using an in-line filter (which may be added to.the L3 transmitter output if required), is illustrated in Figure 26. Thisin-line L3 filter would decrease the L3 signal in the 14C0- to 1427-MHz band byapproximately 27 dB beyond the levels achieved by the current triplexer,virtually assuring no RAS interference even with an increased L3 duty cycle.Such a filter is not required by the L3 frequency developmental authorizationbut may be included on NDS 6 if available.
43
m
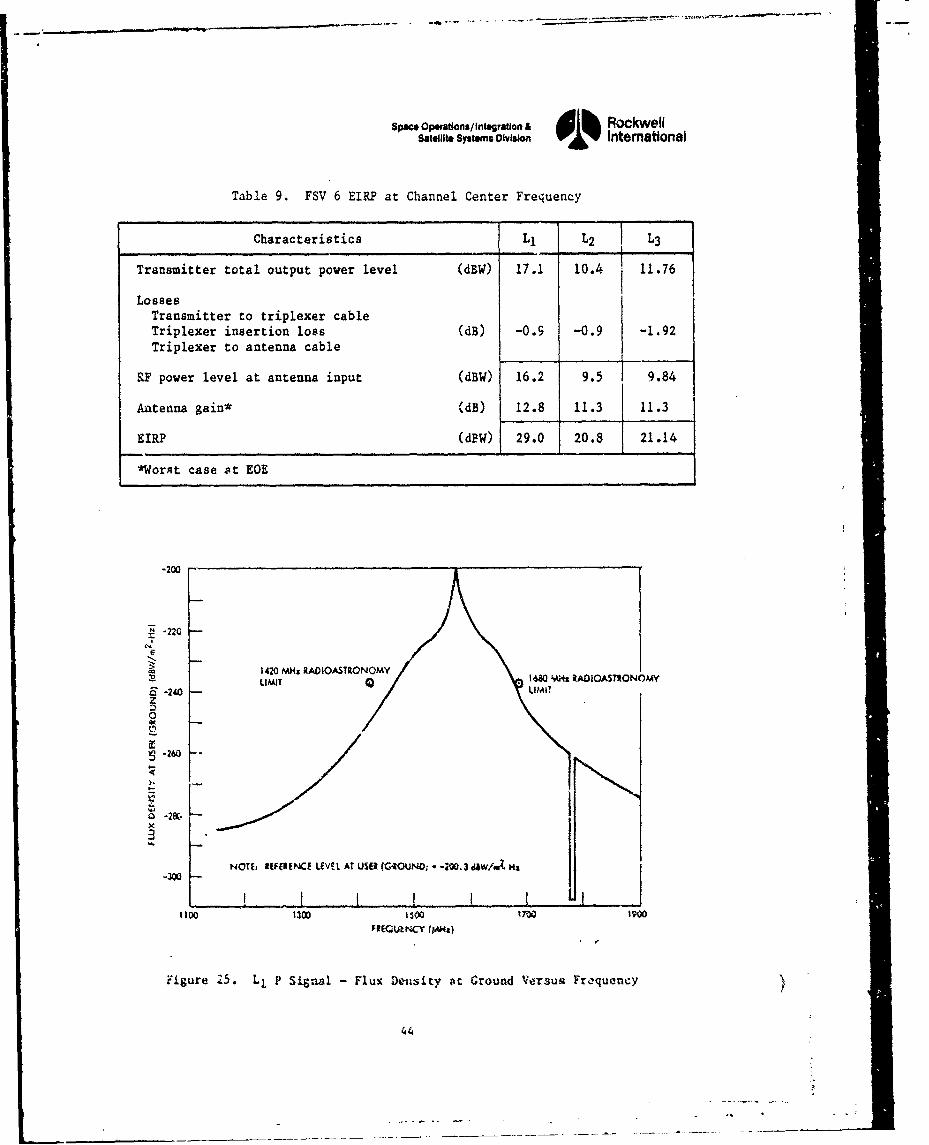
SPWAe Oloations/Intoorston & • b RockwellSatellite Systems Divisio i% International
Table 9. FSV 6 EIRP at Channel Center Frequency
Characteristics L1 L2 L3
Transmitter total output power level (dBW) 17.1 10.4 11.76
LossesTransmitter to triplexer cableTriplexer insertion loss (dB) -0.9 -0.9 -1.92Triplexer to antenna cable
RF power level at antenna input (dBW) 16.2 9.5 9.84
Antenna gain* 'dB) 12.8 11.3 11.3
EIRP (dPO ) 29.0 20.8 21.14
*Worst case at EOE
-200
.~-220
1420 MHx RADIOASTIONOMYLIMIT 160 YL WADIOASTRONOMY
-240 LIMITz0
o-260
-2KNOTft 1EFEIENCE LMvL At USER (GIQVUN0 1 - -200.3 daw/u.2 Ha
1100 1300 1'50700 190
Figure 25. Ll P Signal - Flux Deusity At Ground Versus Froquency
44
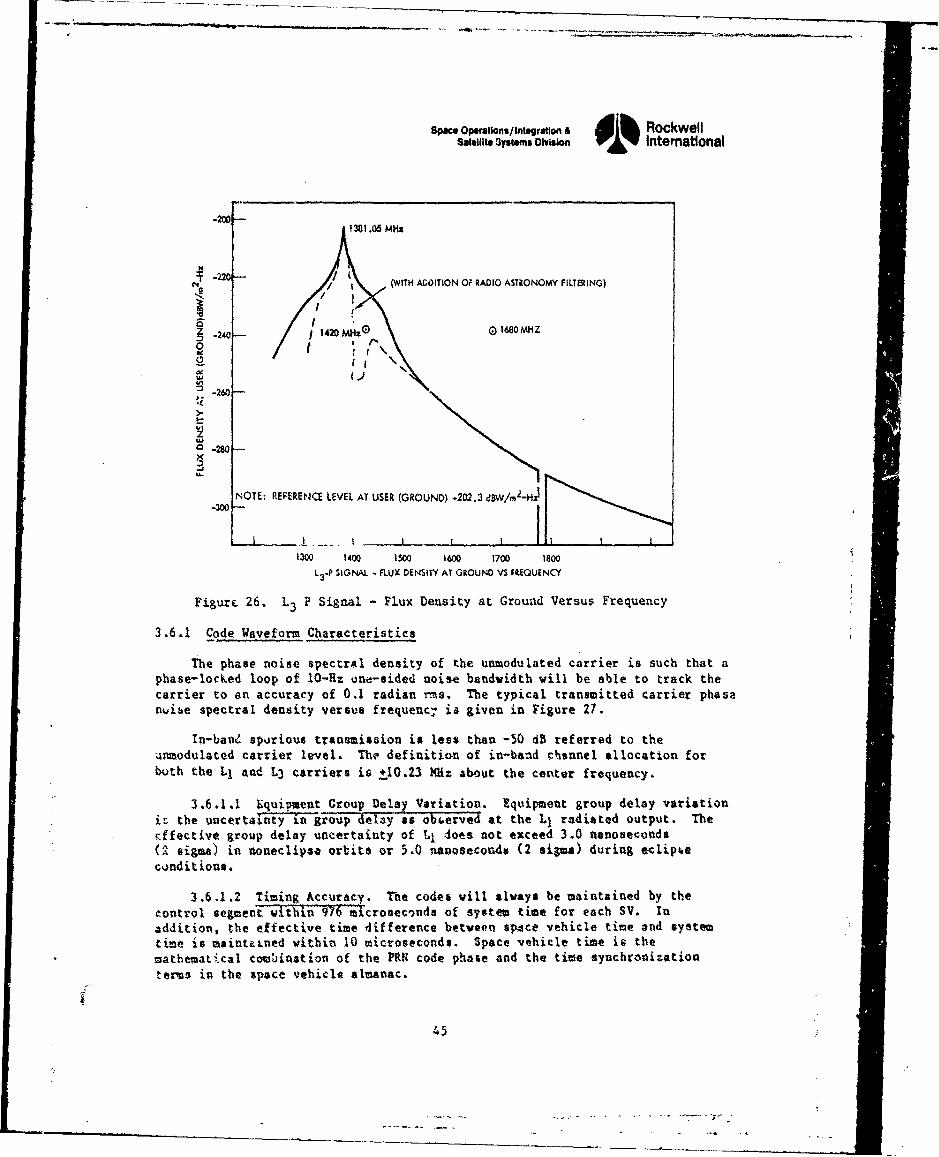
Spac* Oerations/IntegrStion A Rockwellslett sYMMS ovisim• o "% International
-2W 01301.05 MHz
( -4 / (WITH ADDITION OF RADIO ASTRONOMY FILTERING)
MHZ 0 G1680 MH Z
M -240- j 14210 MH. 0)N
0; tt
,-260-
o 280-
NOTE: REFERENCE LEVEL AT USER (GROUND) .202.3 dBW/mlZ-4-300-
1 .-. I ~ I I -I1300 1400 15 1600 1700 1800
L _P SIGNAL - FLUX DENSITY AT GROUND VS FREQUENCY
Figure 26. L3 P Signal - Flux Density at Ground Versus Frequency
3.6.1 Code Waveform Characteristics
The phase noise spectral density of the unmodulated carrier is such that aphase-loct.ed loop of 10-lz one-sided noise bandwidth will be able to track thecarrier to an accuracy of 0.1 radian rms. The typical transmitted carrier phasenvise spectral density versus frequenct ia given in Figure 27.
In-banZ sporious transmission is less than -50 dB referred to theunmodulated carrier level. The definition of in-baad channel allocation forboth the Li and L3 carriers is +10.23 MHz about the center frequency.
3.6.1.1 Equipment Group Delay Variation. Equipment group delay variationic the uncertatiityln group delay ats observed at the 1. radiated output. Therffective group delay uncertainty of Ll does not exceed 3.0 nanoseconds(2 sigma) in uoneclipsa orbits or 5.0 nanosecondwi (2 sigms) during ectlipuecond it ions.
3.6.1.2 Timing Accuracy. The code6 will always be maintained by thetontrol segment within 976 microseconds of system time for each SV. Inaddition, the effective time difference between spAce vehicle time and systemtime is maintained within 10 microseconds. Space vehicle time is themathenatical combination of the PRN code phase and the tiwe synchronizationtervo in the space vehicle almanac.
45
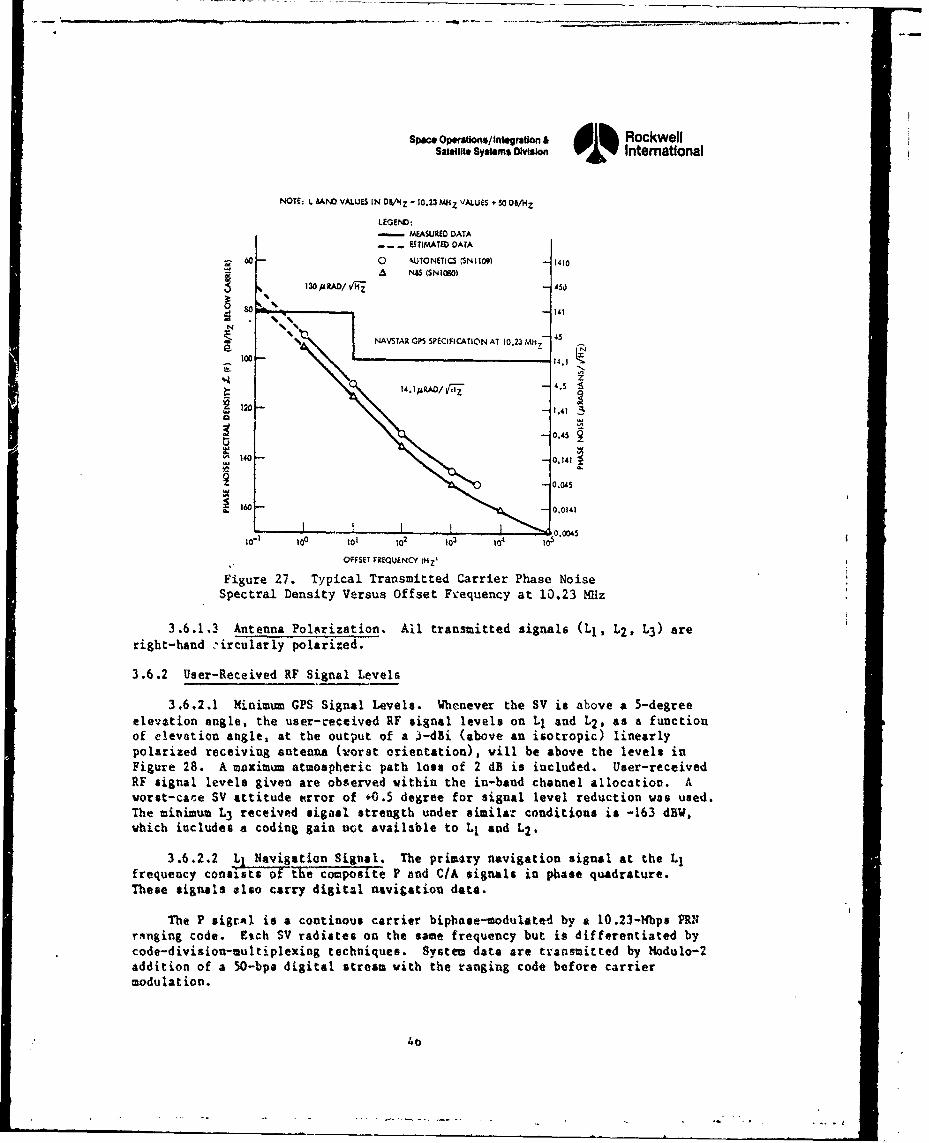
Space Opertions/Int"ration & lh RockwellSatellfit Systms Osiaon International
NOTE; LIANO VALUES IN DSA'Z = 10.23 MHz VALUES +OSo A/HZ
LEGENDi:SMEASURED DATA-- - ESSTIMATED DATA
1.0 A.UTONETICS (SN 1109) -1410S• N&S (SN 1(801
"so - 14
NAVSTAR GPS SPECIFICATION AT 10.23 ,4.5
1/ ,0 14.1
20 120- 102.410
14 - -014i- O°-16 -0.014
t o-, too to, ,o2 t03 l o' •°
OFFSET FiRQUENCY (Hz'
Figure 27. Typical Transmitted Carrier Phase NoiseSpectral Density Versus Offset Frequency at 10.23 MHz
3.6.1.3 Antenna Polarization. All transmitted signals (il, L2, L3) are
right-hand .ircularly polarized.
3.6.2 User-Received RF Signal Levels
3.6.2.1 Minimum GPS Signal Levels. Whenever the SV is above a 5-degreeelevation angle, the user-received RF signal levels on Ll and L2 , as a functionof elevation angle, at the output of a 3-dBi (above an isotropic) linearlypolarized receiving antenna (worst orientation), vill be above the levels inFigure 28. A maximum atmospheric path loss of 2 dE is included. User-receivedRF signal levels given are observed vithin the in-band channel allocation. Aworst-cace SV attitude error of 40.5 degree for signal level reduction was used.The minimum L3 received aigaal strength under similar conditions is -163 dBW,which includes a coding gain not available to L1 and L2 .
3.6.2.2 L1 Navigation Signal. The primary navigation signal at the Llfrequency consists of the coaposite P and C/A signals in phase quadrature.These signals also carry digital navigation data.
The P sigrAl is a continous carrier biphaoe-modutated by a 10.23-Mbps PRHrmnging code. Etch SV radiates on the same frequency but is differentiated bycode-division-cultiplexing techniques. System data are trannitted by Modulo-2addition of a 50-bpa digital stream with the ranging code before carriermodulation.
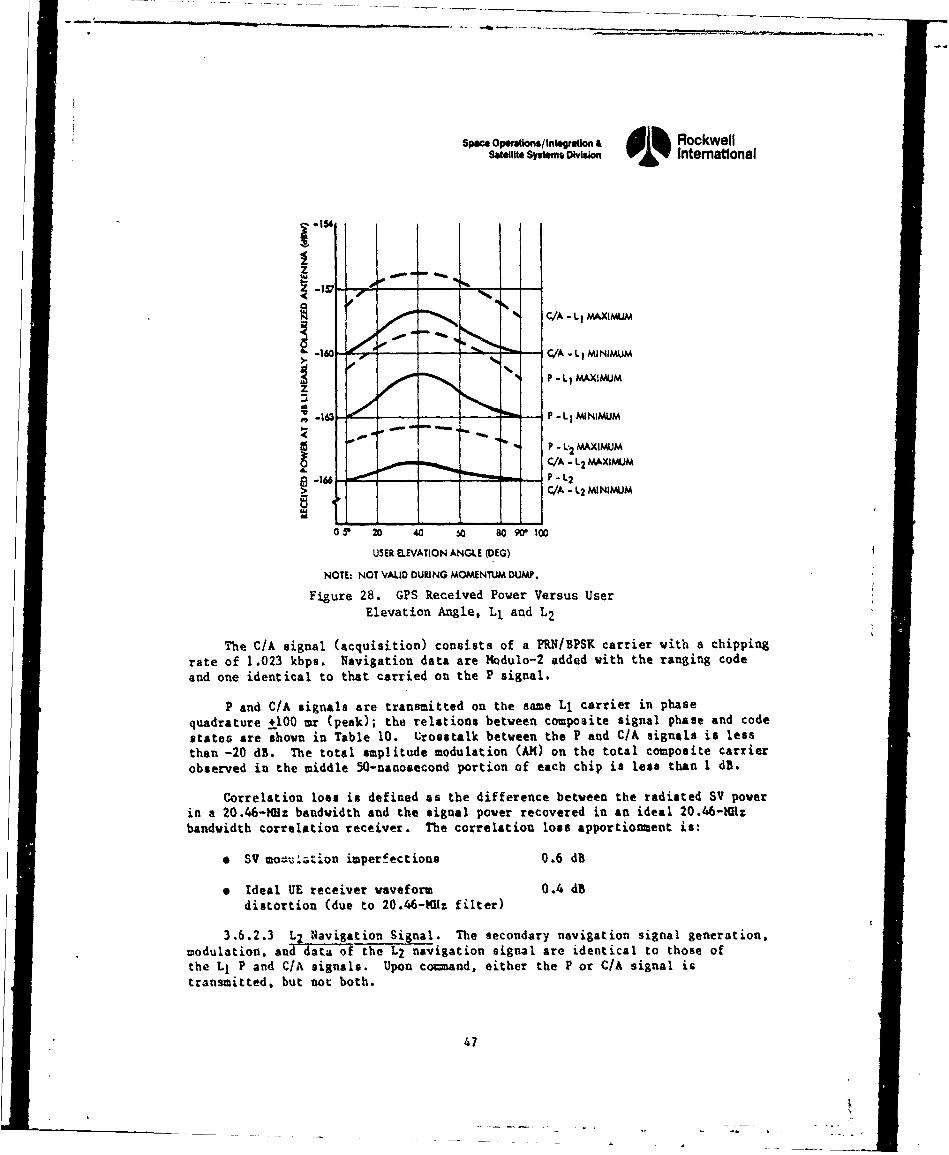
s"If sy,*..& •hWW. 01% International
-160-- •" C/A - L IMAXIMUM
-16 P0C/ - L MINIMUM
Sff I P - L." MAXIMUM
z
16 -!tu -P • • - L2 MINI~MU
P/ - L`2 MAXIMUM
P/ -L2 MAXIMUM
16P-L2
,>• k. C/A - L2 MINIMUM
0O5* 20 40 so 80 9* 100
USER ELEVATION ANGLE (DEG)
NOTE: NOT VAUD DURING MOMENTUM DUMP.
Figure 28. GPS Received Power Versus UserElevation Angle, L1 and L2
The CIA signal (acquisition) consists of a PRN/BPSK carrier with a chippingrate of 1.023 kbps. Navigation data are Modulo-2 added with the ranging codeand one identical to that carried on the P signal.
P and CIA signals are transmitted on the same Ll carrier in phasequadrature +100 mr (peak); the relations between composite signal phase and codestates are shown in Table 10. Crosstalk between the P and CIA signals is lessthan -20 dB. The total amplitude modulation (AM) on the total composite carrierobserved in the middle 50-nanosecond portion of each chip is less than 1 dB.
Correlation loss is defined as the difference between the radiated SV powerin a 20.46-MHz bandwidth and the signal power recovered in au ideal 20.46-101bandvidth correlation receiver. The correlation loss apportionent is:
"* SV moau.*ation imperfections 0.6 dB
"* Ideal UE receiver waveform 0.4 dBdistortion (due to 20.46-Mi1: filter)
3.6.2.3 L2 Navigation Signal. The secondary navigation signal generation,modulation, and data of the L2 navigation signal are identical to those ofthe Lk P and CIA signals. Upon co=and, either the P or CIA signal istransmitted, but not both.
47
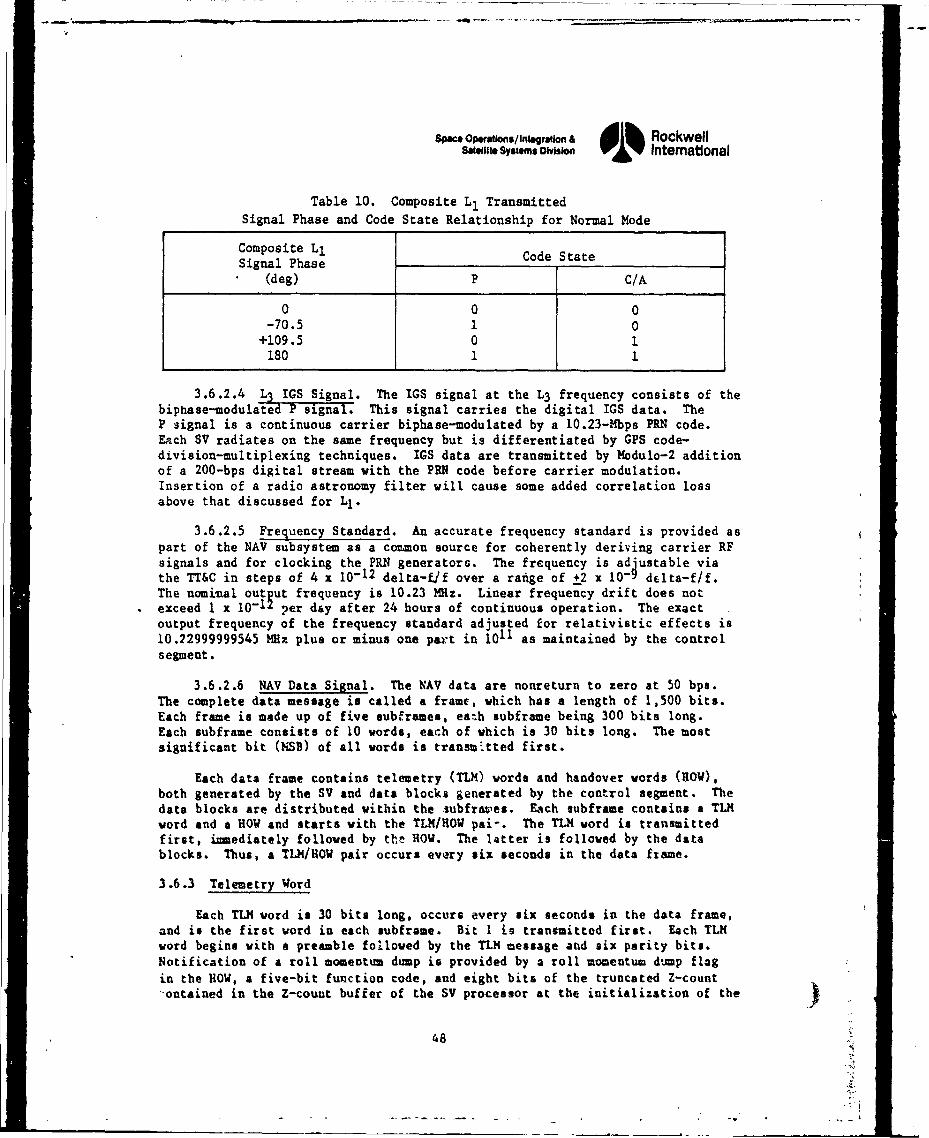
Space OPewations/fntegratlon & RockwellSaellit Syspes ODvision 0 International
Table 10. Composite LI TransmittedSignal Phase and Code State Relationship for Normal Mode
Composite L1 Code StateSignal Phase
(deg) P C/A
0 0 0-70.5 1 0
+109.5 0 1180 1 1
3.6.2.4 L3 IGS Signal. The IGS signal at the L3 frequency consists of thebiphase-modulated P signal. This signal carries the digital IGS data. TheP signal is a continuous carrier biphase-modulated by a 10.23-Mbps PRN code.Each SV radiates on the same frequency but is differentiated by GPS code-division-multiplexing techniques. IGS data are transmitted by Modulo-2 additionof a 200-bps digital stream with the PRN code before carrier modulation.Insertion of a radio astronomy filter will cause some added correlation lossabove that discussed for Ll.
3.6.2.5 Frequency Standard. An accurate frequency standard is provided aspart of the NAV subsystem as a common source for coherently deriving carrier RFsignals and for clocking the PRN generators. The frequency is adjustable viathe TT&C in steps of 4 x 10-12 delta-f/f over a range of +2 x 0-9 dElta-f/f.The nominal output frequency is 10.23 MHz. Linear frequency drift does notexceed I x 10-12 per day after 24 hours of continuous operation. The exactoutput frequency of the frequency standard adjusted for relativistic effects is10.22999999545 MHz plus or minus one part in 1011 as maintained by the controlsegment.
3.6.2.6 NAV Data Signal. The NAV data are nonreturn to zero at 50 bps.The complete data message is called a frame, which has a length of 1,500 bits.Each frame is made up of five subframen, eaýh subframe being 300 bits long.Each subframe consists of 10 words, each of which is 30 bits long. The mostsignificant bit (NSB) of all words is transm'tted first.
Each data frame contains telemetry (ThM) words and handover words (HOW),both generated by the SV and data blocks generated by the control segment. Thedata blocks are distributed within the subfraves. Ech subframe contains a TLMword and a HOW and starts with the TLM/ROW pal-. The TU4 word is transmittedfirst, inmediately followed by the ROW. The 1atter is followed by the datablocks. Thus, a TLM/H0W pair occurs every six seconds in the data frame.
3.6.3 Telemetry Word
Each TLM word is 30 bits long, occurs every six seconds in the data frame,and is the first word in each subframe. Bit I is transmitted first. Each TLMword begins with a preamble followed by the TLM message and six parity bits.Notification of a roll momentum dump is provided by a roll momentum dump flagin the HOW, a five-bit function code, and eight bits of the truncated Z-count-ontained in the Z-couut buffer of the SV processor at the initialization of the j
48
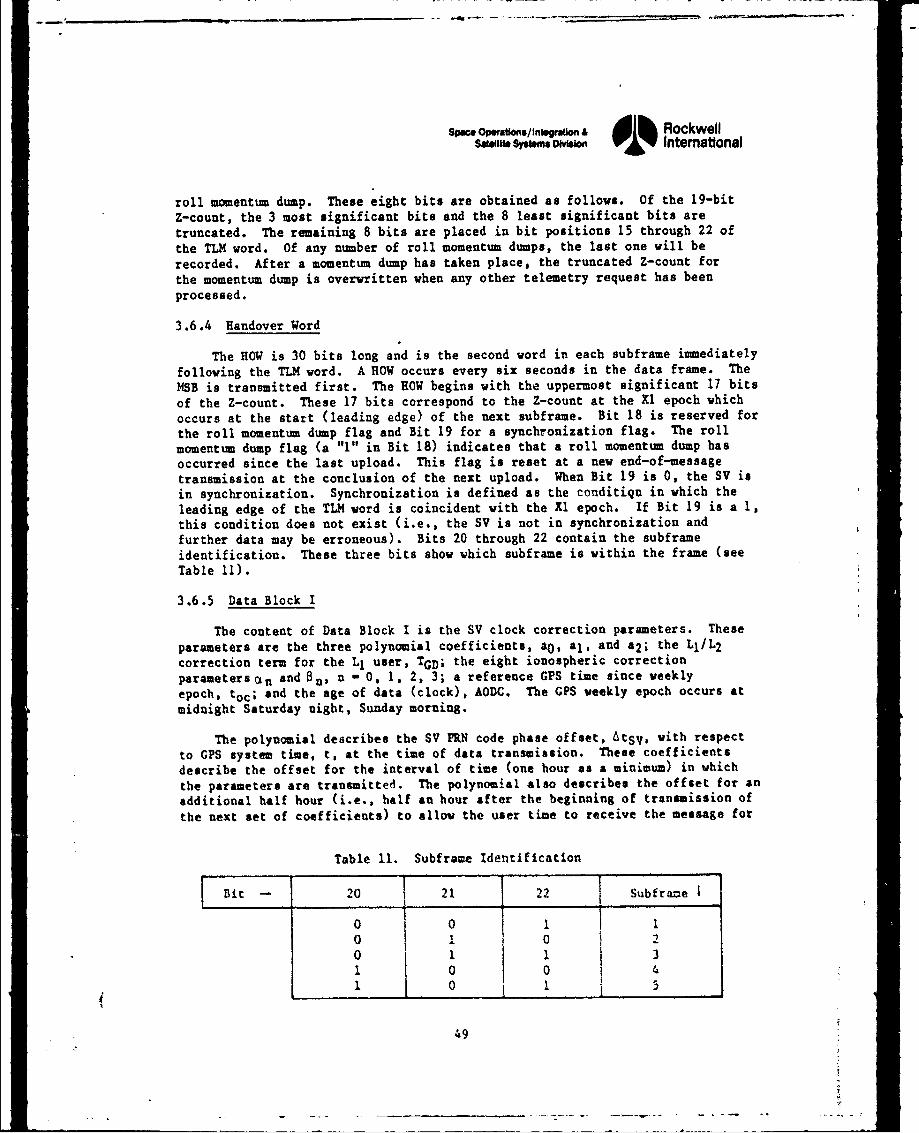
Sp•e opwafuns/Insgraon A Rockwellsaw ite SYmS DWWW 01% Intemattonal
roll momentum dump. These eight bits are obtained as follows. Of the 19-bitZ-count, the 3 most significant bits and the 8 least significant bits aretruncated. The remaining 8 bits are placed in bit positions 15 through 22 ofthe TLM word. Of any number of roll momentum dumps, the last one will berecorded. After a momentum dump has taken place, the truncated Z-count forthe momentum dump is overwritten when any other telemetry request has been
processed.
3.6.4 Handover Word
The HOW is 30 bits long and is the second word in each subframe immediately
following the TLM word. A HOW occurs every six seconds in the data frame. The
MSB is transmitted first. The HOW begins with the uppermost significant 17 bitsof the Z-count. These 17 bits correspond to the Z-count at the Xl epoch which
occurs at the start (leading edge) of the next subframe. Bit 18 is reserved for
the roll momentum dump flag and Bit 19 for a synchronization flag. The rollmomentum dump flag (a "1" in Bit 18) indicates that a roll momentum dump hasoccurred since the last upload. This flag is reset at a new end-of-messagetransmission at the conclusion of the next upload. When Bit 19 is 0, the SV isin synchronization. Synchronization is defined as the conditiqn in which theleading edge of the TlM word is coincident with the Xl epoch. If Bit 19 is a 1,this condition does not exist (i.e., the SV is not in synchronization andfurther data may be erroneous). Bits 20 through 22 contain the subframeidentification. These three bits show which subframe is within the frame (seeTable 11).
3.6.5 Data Block I
The content of Data Block I is the SV clock correction parameters. These
parameters are the three polynomial coefficients, a0 , a1, and a2; the LI/L 2
correction term for the L1 user, TGD; the eight ionospheric correction
parameters cn and Bn, n - 0, 1, 2, 3; a reference GPS time since weeklyepoch, toc; and the age of data (clock), AODC. The GPS weekly epoch occurs atmidnight Saturday night, Sunday morning.
The polynomial describes the SV PRN code phase offset, 6tSV, with respectto GPS system time, t, at the time of data transmission. These coefficientsdescribe the offset for the interval of time (one hour as a minimum) in which
the parameters are transmitted. The polynomial also describes the offset for anadditional half hour (i.e., half an hour after the beginning of transmission of
the next set of coefficients) to allow the user time to receive the message for
Table 11. Subframe Identification
Bit 20 21 22 Subfrane I
o 0 1 10 0 0 20 o 1 31 0 0 4
44
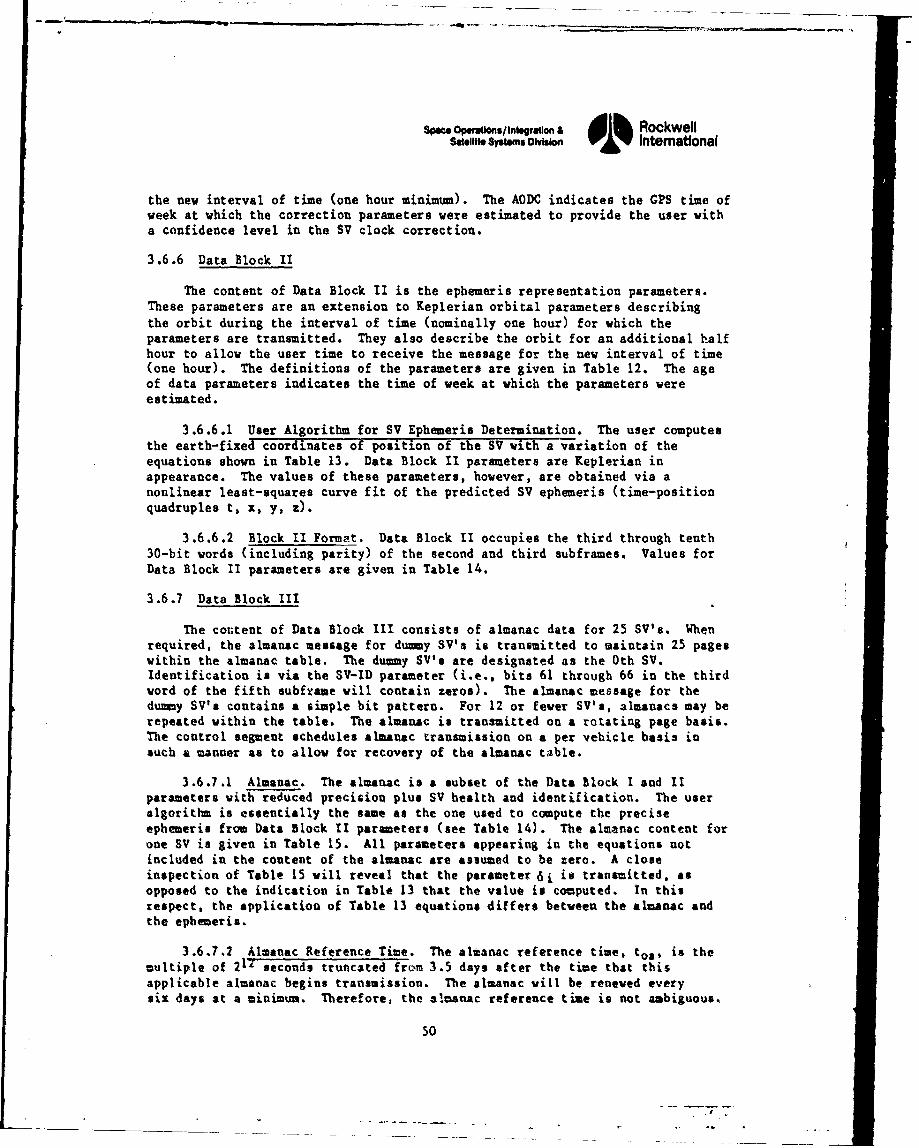
sac Owa.•ns/In.loa•on & d Ih RockwellSeelt Sysems D•,isw 0 '1 IntemaUonal
the new interval of time (one hour minimum). The AODC indicates the GPS time ofweek at which the correction parameters were estimated to provide the user witha confidence level in the SV clock correction.
3.6.6 Data Block II
The content of Data Block II is the ephemeris representation parameters.These parameters are an extension to Keplerian orbital parameters describingthe orbit during the interval of time (nominally one hour) for which theparameters are transmitted. They also describe the orbit for an additional halfhour to allow the user time to receive the message for the new interval of time(one hour). The definitions of the parameters are given in Table 12. The ageof data parameters indicates the time of week at which the parameters wereestimated.
3.6.6.1 User Algorithm for SV Ephemeris Determination. The user computesthe earth-fixed coordinates of position of the SV with a variation of theequations shown in Table 13. Data Block 1I parameters are Keplerian inappearance. The values of these parameters, however, are obtained via anonlinear least-squares curve fit of the predicted SV ephemeris (time-positionquadruples t, x, y, z).
3.6.6.2 Block II Format. Data Block II occupies the third through tenth30-bit words (including parity) of the second and third subframes. Values forData Block II parameters are given in Table 14.
3.6.7 Data Block III
The cotutent of Data Block III consists of almanac data for 25 SV's. Whenrequired, the almanac message for dummy SV's is transmitted to maintain 25 pageswithin the almanac table. The dummy SV's are designated as the 0th SV.Identification is via the SV-ID parameter (i.e., bits 61 through 66 in the thirdword of the fifth subframe will contain zeros). The almanac message for thedummy SV's contains a simple bit pattern. For 12 or fever SV's, almanacs may berepeated within the table. The almanac is transmitted on a rotating page basis.The control segment schedules almanac transmission on a per vehicle basis insuch a manner as to allow for recovery of the almanac table.
3.6.7.1 Almanac. The almanac is a subset of the Data Block I and IIparameters with reduced precision plus SV health and identification. The useralgorithm is essentially the same as the one used to compute the preciseephemeris from Data Block II parameters (see Table 14). The almanac content forone SV is given in Table 15. All parameters appearing in the equations notincluded in the content of the almanac are assumed to be zero. A closeinspection of Table 15 will reveal that the parameter 6i it transmitted, asopposed to the indication in Table 13 that the value is cooputed. In thisrespect, the application of Table 13 equations differs between the almanac andthe ephemeris.
3.6.7.2 Almanac Reference Time. The almanac reference time. toa, is themultiple of 2 17 seconds truncated from 3.5 days after the time that thisapplicable almanac begins transmission. The almanac will be renewed everysix days at a minimum. Therefore, the almanac reference time is not ambiguous.
50
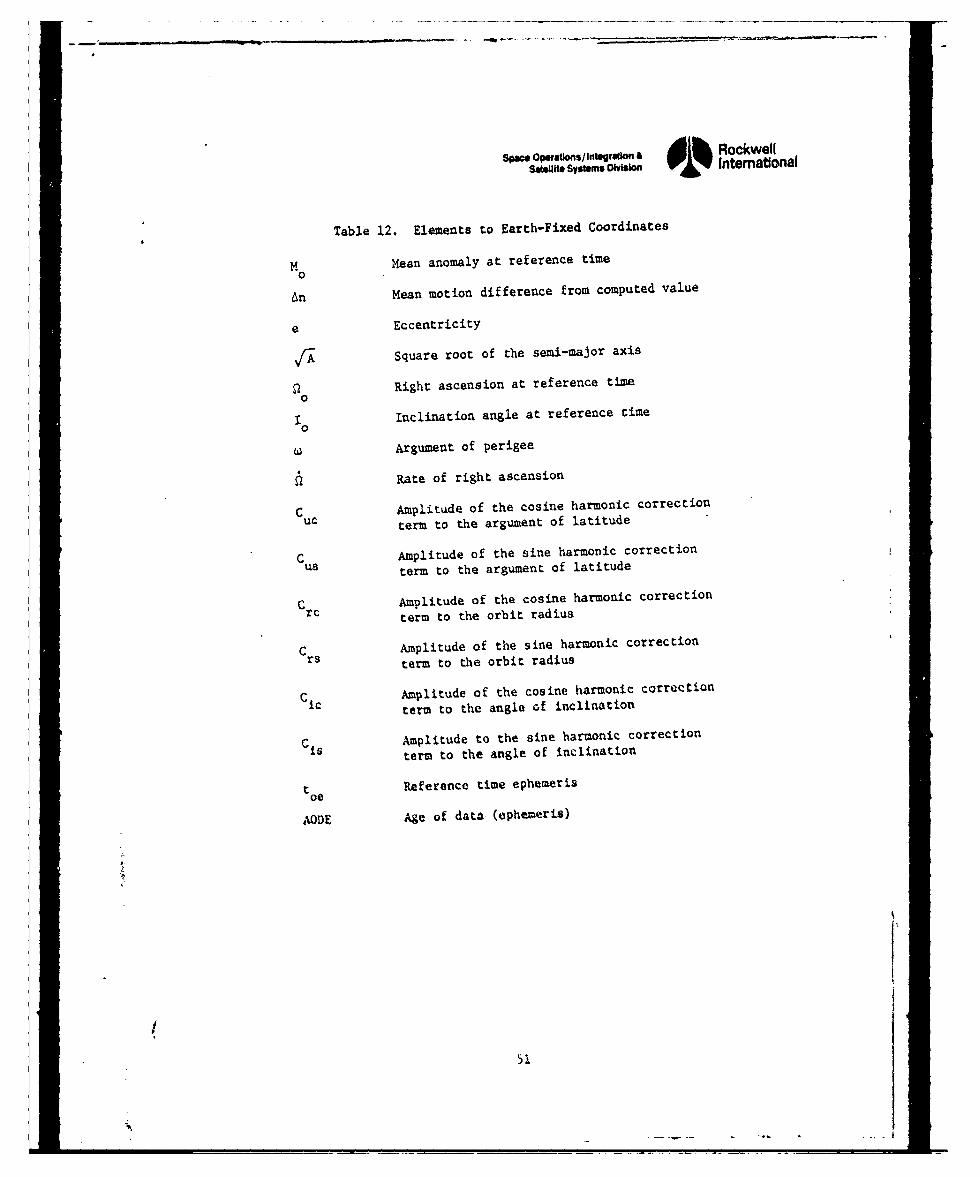
Spac aOrsuns/ Integraua ARockwellSM8oiu/ systems O-w 01% International
Table 12, Elements to Earth-Fixed Coordinates
M Mean anomaly at reference time
0
An Mean motion difference from computed value
e Eccentricity
r Square root of the semi-major axis
a Right ascension at reference time0
1 0inclination angle at reference time
w Argument of perigee
SKRate of right ascension
uc Amplitude of the cosine harmonic correction
term to the argument of latitude
Cus Amplitude of the sine harmonic correction
term to the argument of latitude
C Amplitude of the cosine harmonic correctionCrc term to the orbit radius
C rs Amplitude of the sine harmonic correction
term to the orbit radius
Amplitude of the cosine harmonic correction
iCi term to the angle of inclination
Amplitude to the sine harmonic correction
term to the angle of inclination
t oe Reference time ephemeris
AODE Age of data (ephemeris)
51
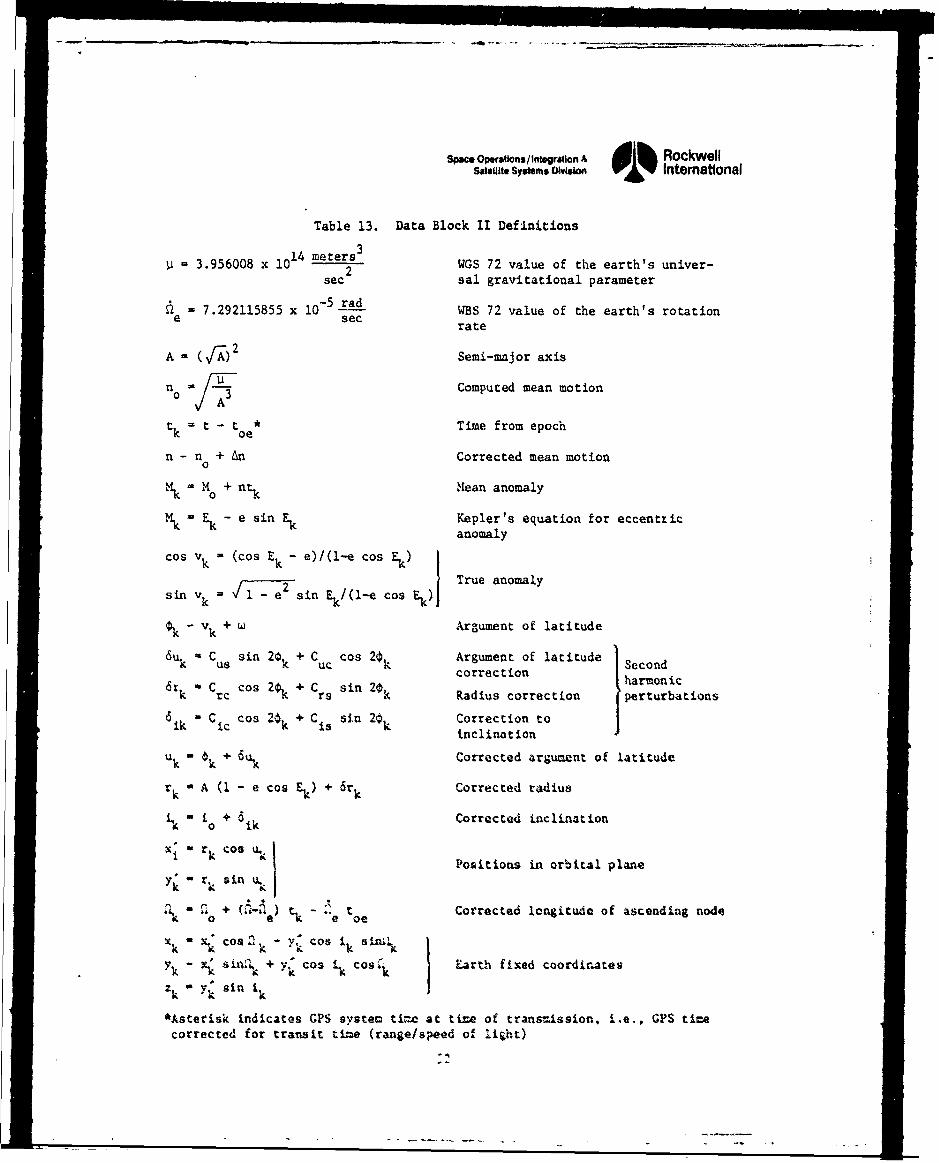
Space Operations/Integrstlon A 1 1 l RockwellSatellite Sys•em. OiiVsimon i¶4 Intemational
Table 13. Data Block II Definitions
3.956008 x 10¹⁴ meters WGS 72 value of the earth's univer-sec sal gravitational parameter
- 7.292115855 x 10⁻⁵ rad WBS 72 value of the earth's rotatione sec rate
A- (VA) 2 Semi-major axis
n U3 Computed mean motion0- A
tk t - toe Time from epoch
n - n + An Corrected mean motion
S= M + nt. Mean anomaly
Mk E-k - e sin Ek Kepler's equation for eccentricanomaly
cos vk - (cos Ek - e)/(1-e cos Ek)
ie sin /(l-e cos E)I True anomalysin vk /I- e' si
S-vk + W Argument of latitude
6uk o Cus sin 2 + C cos 20,. Argument of latitudeO+ uc r, oreto Second
6t * CCos sin 2 cretharmonicIk rc k- + Crs k Radius correction perturbations
a ik 0 Cic cos 2€k + Cis sin 2 k Correction toinclinationI
uk - k + 6uk Corrected argument of latitude
r - A (1 - e cos E.) + 6r Corrected radius
'k - 'o + "ik Corrected inclination
X, W r k Cos Positions in orbital plane
- rk sin Ilk
o + e) - "'to Corrected longitude of ascending node"k o + (") atoe•k "• cog " k y-v .cos•i su I
si- n". ,i• + V. cos 4 cos4 I Earth fixed coordinates
k "Yk sin i k
*Asterisk indicates GPS system tine at tine of transmission, i.e., GPS time
corrected for transit tine (range/speed ofl li&ht)
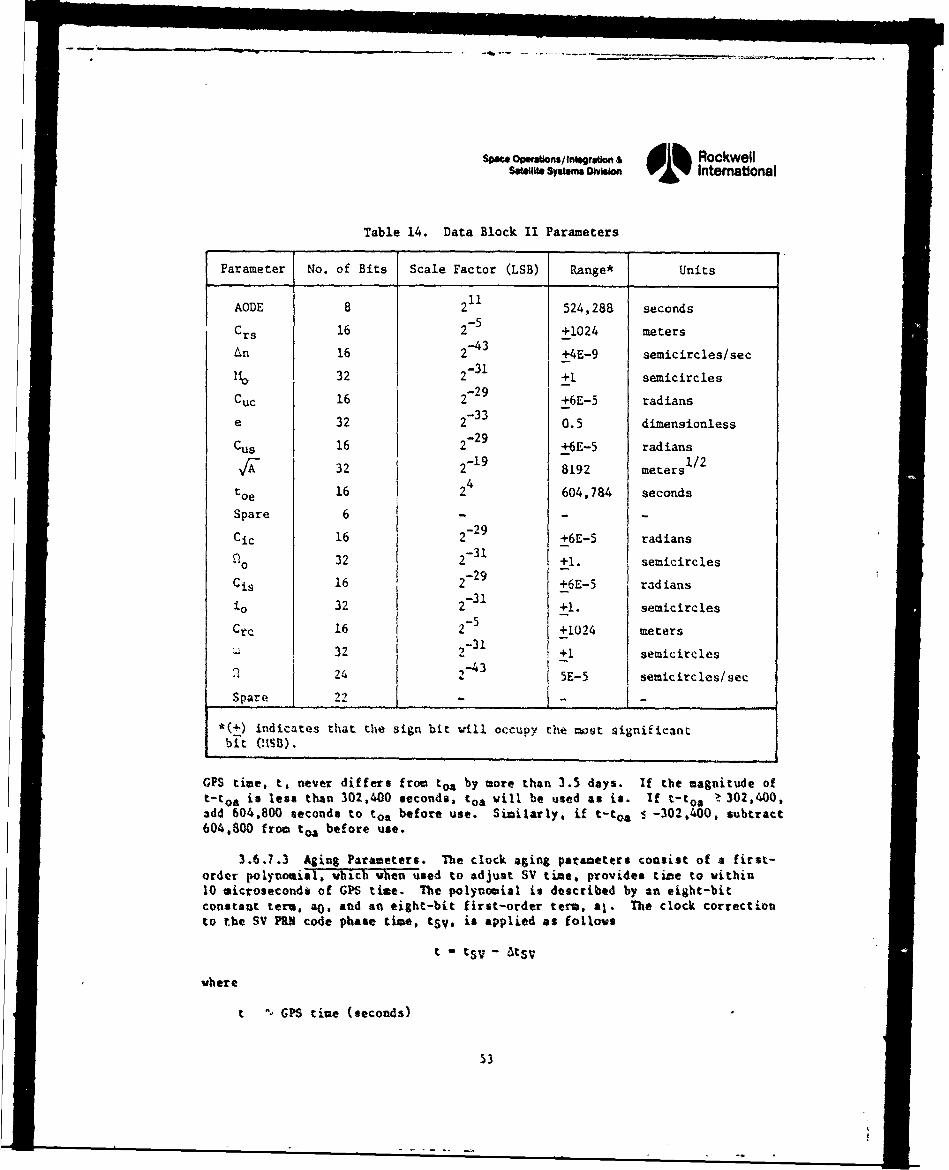
SPac Op.a.ns/I.f.gratlon A RockwellS.•WN, Sysms Ovision 0V1 International
Table 14. Data Block II Parameters
Parameter No. of Bits Scale Factor (LSB) Range* Units
AODE 8 211 524,288 seconds
Crs 16 2-5 +1024 meters
&n 16 2-43 +4E-9 semicircles/sec
1t0 32 2-31 +1 semicircles
Cuc 16 2-29 +6E-5 radians
e 32 2-33 0.5 dimensionless
Cus 16 2-29 +6E-5 radians
V 32 2"19 8192 meters 11 2
toe 16 24 604,784 seconds
Spare 6 - -
Cic 16 2-2 9 +6E-5 radians
0.0 32 2-31 +1. semicirclesCis 16 2-29 +6E-5 radians
io 32 2-31 +1. semicircles
Crc 16 2-5 +1024 meters
S32 - +1 semicircles
2 1-4 HE.O.24 2-35E-_5 semic ireles/sec
Spare 22 ei-
*(.) indicates that the sign bit vill occupy the most significant
bit 01SB),.
GPS time, t, never differs from toa by more than 3.5 days. If the magnitude oft-toa is less than 302,400 second&, to, will be used as is. If t-toa > 302,400,add 604,800 seconds to toa before use. Similarly, if t-toa -s -302,400, subtract604.800 from to, before use.
3.6.7.3 Aging Parameters. The clock aging parameters consist of a first-order polynomial, which when ued to adjust SV time, provides time to within10 microseconds of GPS time. The polynomial is described by an eight-bitconstant term, ao, and an eight-bit first-order term, al. The clock correctionto the SV M code phase time. tSV. is applied as follovs
t * tSV- -tS
where
t • •S time (seconds)
53
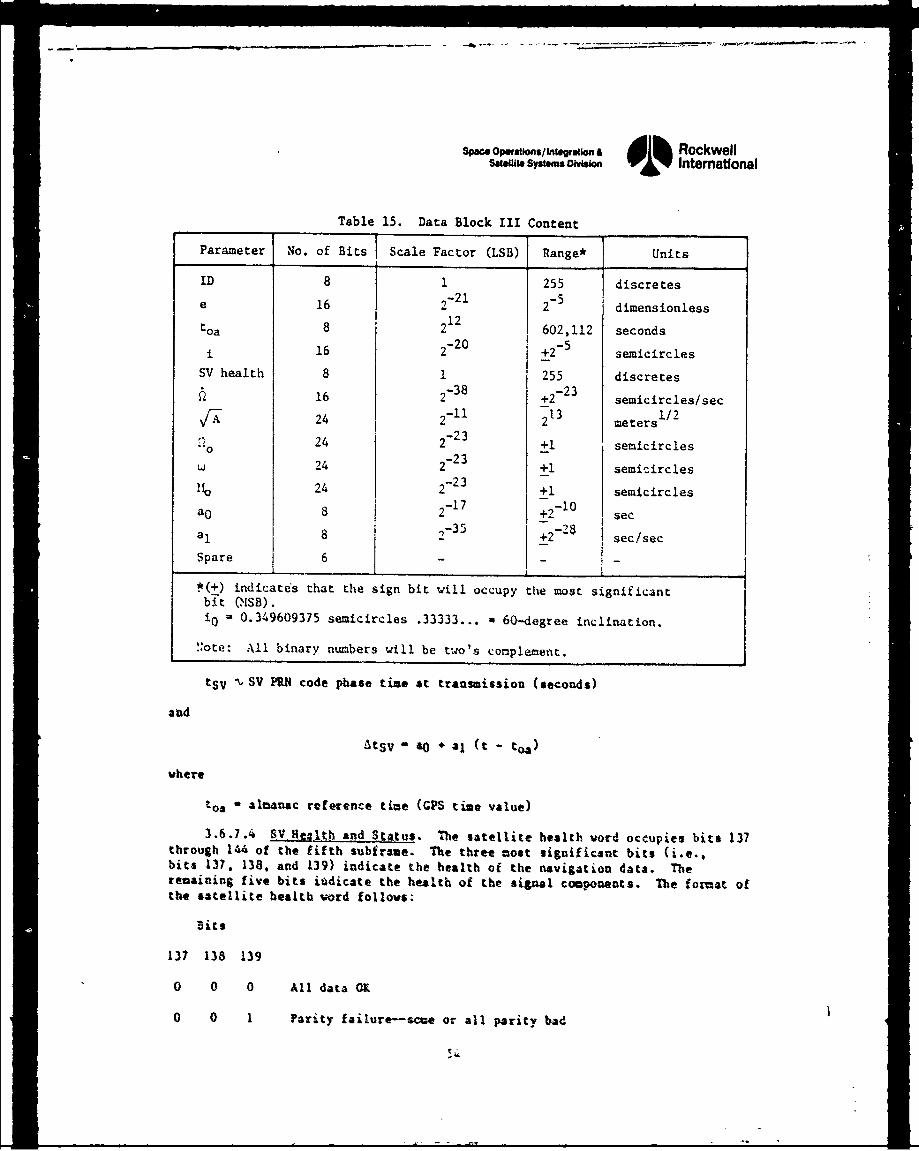
Sa Opwations/inWguon & E I RockwellSma.mu sysemns OIaon Intemational
Table 15. Data Block III Content
Parameter No. of Bits Scale Factor (LSB) Range* Units
ID 8 1 255 discretes16 2-21 2-5 dimensionless
toa 8 212 602,112 seconds
i 16 2-20 +2-5 semicirclesSV health 8 1 255 discretesp. 16 2-38 +2-23 semicircles/sec
11 131/224 2-11 213 meters
24 2-23 +1 semicircles
24 223 +1 semicircles
1to 24 2 +1 semicircles
a0 8 2-17 +2-10 sec-28
a, 8 -35 +2 sec/sec
Spare 6 _ _
*(+) indicates that the sign bit will occupy the most significantbit (.SB).i0 - 0.349609375 semicircles .33333... - 60-degree inclination.
L !ote: All binary numbers will be two's complement.
tSV %,SV PR code phase time at transmission (seconds)
and
atsv - 0 + aI (t - to&)
where
t0oa almanac reference time (GPS time value)
3.6.7.4 SV Heq1th and S -ttus. The satellite health word occupies bits 137through 144 of the fifth subframe. The three most significant bits (i.e..bits 137, 138, and 139) indicate the health of the navigation data. Theremaining five bits jedicate the health of the signal components. The format ofthe satellite health vord follows:
Bits
137 138 139
0 O 0 All data OX
0 0 1 Parity failure -- sce or all parity bad
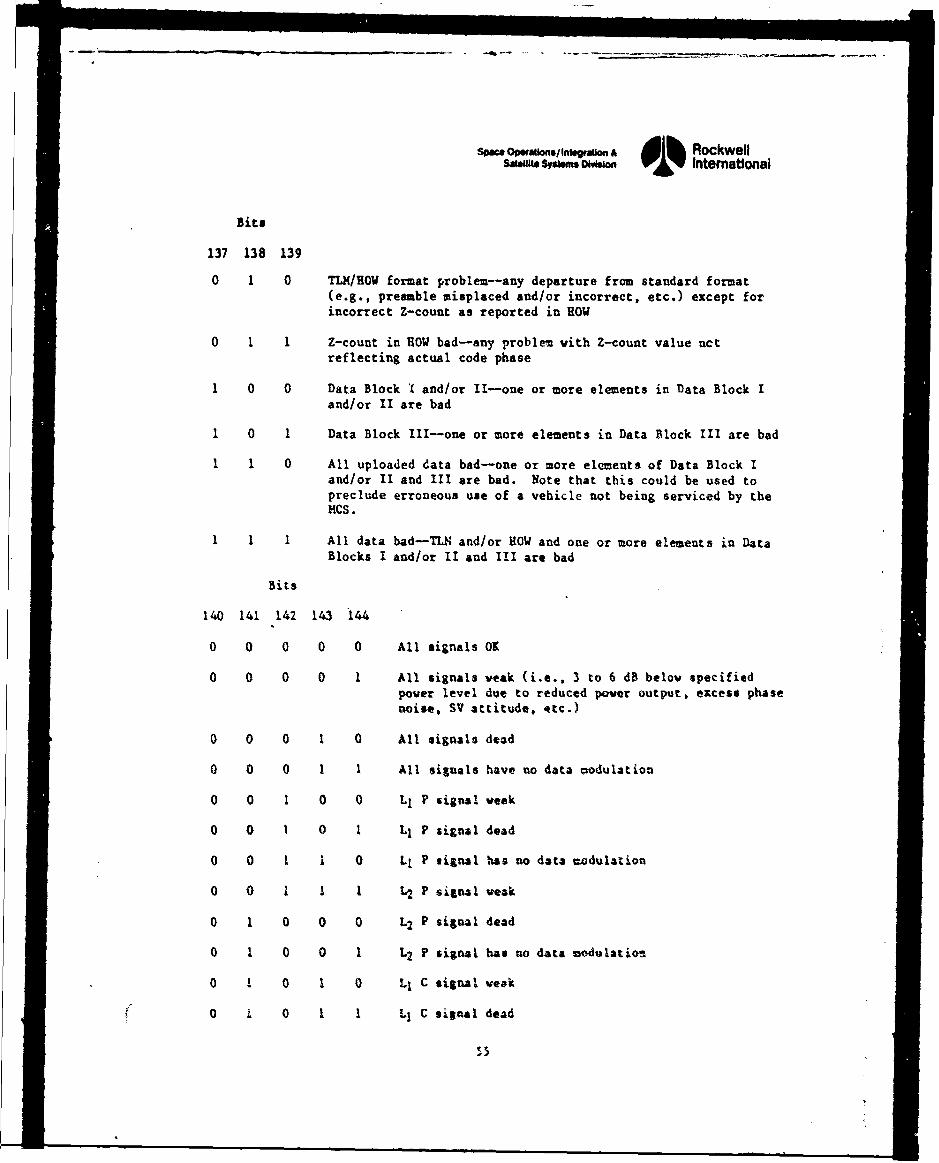
sows opeallms/In"lon A d Rockwellsamu"S syI oiwni V01% International
Bits
137 138 139
O 1 0 TLM/HOW format problem--any departure from standard format(e.g., preamble misplaced and/or incorrect, etc.) except forincorrect Z-count as reported in HOW
0 1 1 Z-count in HOW bad-any problem vith Z-count value netreflecting actual code phase
1 0 0 Data Block I and/or II-one or more elements in Data Block Iand/or II are bad
1 0 1 Data Block III-one or more elements in Data Block III are bad
1 1 0 All uploaded data bad-one or more elements of Data Block Iand/or II and III are bad. Note that this could be used topreclude erroneous use of a vehicle not being serviced by theMCS.
1 1 1 All data bad-TLN and/or HOW and one or more elements in DataBlocks I and/or II and III are bad
Bits
140 141 142 143 144
0 0 0 0 0 All signals OK
0 0 0 0 1 All signals veak (i.e.. 3 to 6 dB belov specifiedpover level due to reduced pover output, excess phasenoise. SV attitude, etc.)
0 0 0 1 0 All signals dead
0 0 0 1 1 All signals have no data modulation
0 0 1 0 0 L1 P signal veak
o 0 1 0 1 L1 P signal dead
0 0 1 1 0 L1 P signal has no data uodulation
0 0 1 1 1 L2 P signal veak
0 1 0 0 0 L2 P signal dead
0 1 0 0 1 L2 P s lgnaI has no data modulation
0 1 0 1 0 Ll C signal vesk
0 i 0 1 1 Ll C signal dead
= ,5
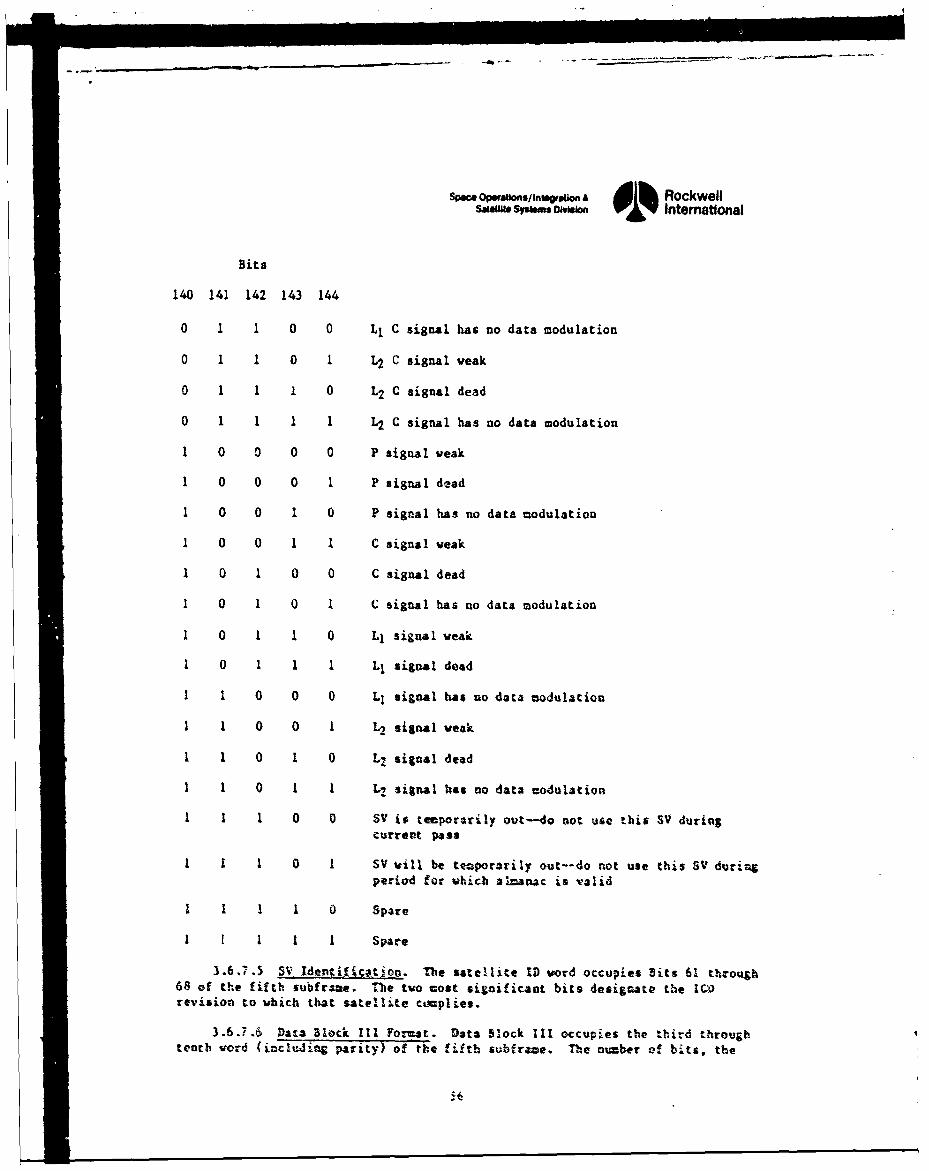
Space opu/afonsfIgaOi £ A RockwellSMa" Syiani Omsion 0 Intemational
Bits
140 141 142 143 144
0 i 1 0 0 LI C signal has no data modulation
0 1 1 0 1 L2 C signal weak
O 1 1 1 0 L2 C signal dead
0 i 1 1 1 L2 C signal has no data modulation
1 0 0 0 0 P signal weak
1 0 0 0 1 P signal dead
1 0 0 I 0 P signal has no data modulation
1 0 0 1 1 C signal veak
1 0 1 0 0 C signal dead
1 0 1 0 1 C signal has no data modulation
1 0 1 1 0 LI signal weak
1 0 1 1 1 Ll signal deed
I 1 0 0 0 Ll signal has no data modulation
I 1 0 0 1 L2 signal week
I I 0 1 0 L7 signal deed
I 1 0 1 1 L2 signal has no data codulation
1 1 1 0 0 SV is teepororily out-do not use this SV duringcurreot pass
I I 1 0 1 SV vill be tenporarily out--do not use this SV duringptriod for which alr-manc is valid
I I I 1 0 Spare
I I I I I Spare
3.6-7.5 SV Identification. The satellite ID word occupies Bits 61 through68 of the fifth subframe. The two most significant bits designate the ICWrevision to which that satellite complies.
3.6.77. Data Block IllI Format. Data Block III occupies the third throughtenth vord (including parity) of the fifth subframe. The ntzber of bits, the
5'
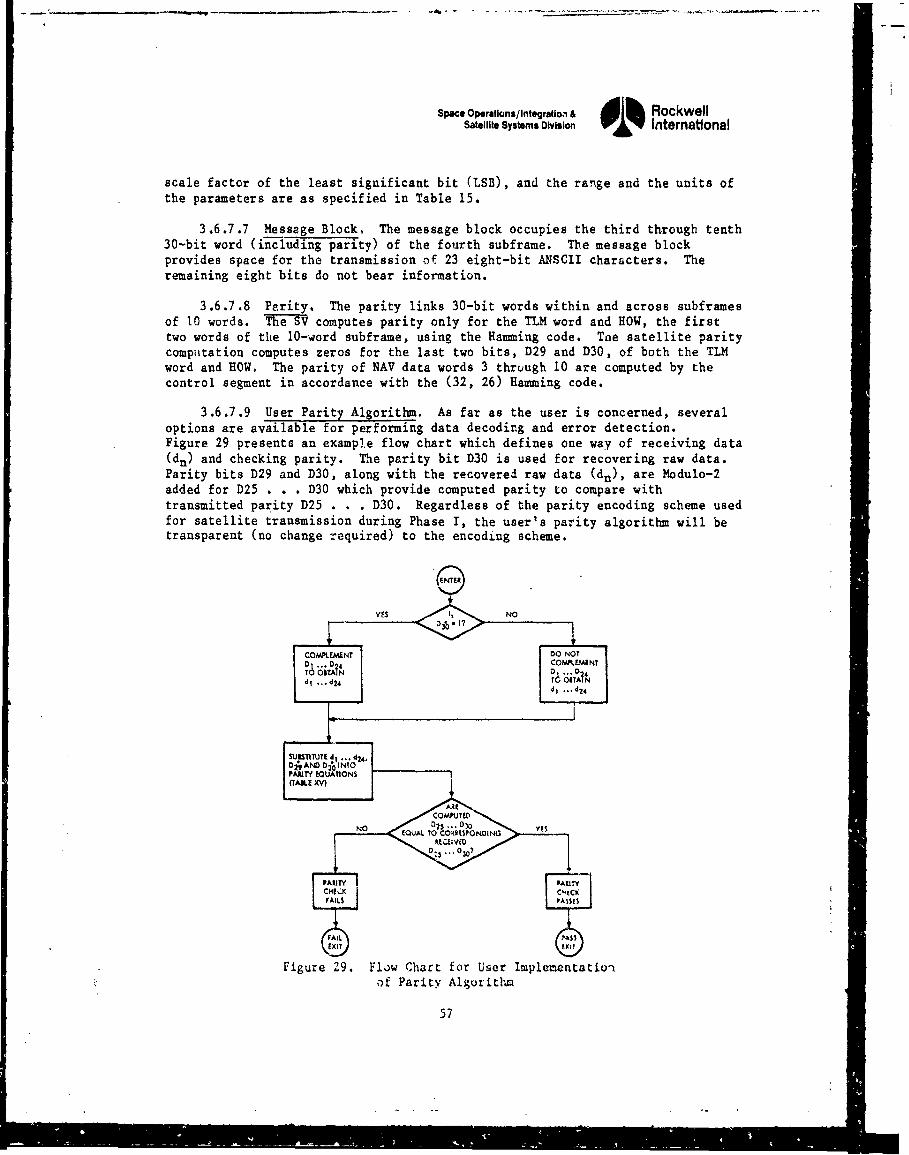
Space Operations/integratioI & dli RockwellSatellite Systems Division 01% International
scale factor of the least significant bit (LSB), and the range and the units ofthe parameters are as specified in Table 15.
3.6.7.7 Message Block, The message block occupies the third through tenth30-bit word (including parity) of the fourth subframe. The message blockprovides space for the transmission of 23 eight-bit ANSCII characters. Theremaining eight bits do not bear information.
3.6.7.8 Parity. The parity links 30-bit words within and across subframesof 10 words. The SV computes parity only for the TLM word and HOW, the firsttwo words of the 10-word subframe, using the Hamming code. Toe satellite paritycomputation computes zeros for the last two bits, D29 and D30, of both the TIMword and HOW., The parity of NAV data words 3 thruugh 10 are computed by thecontrol segment in accordance with the (32, 26) Hamming code.
3.6.7.9 User Parity Algorithm. As far as the user is concerned, severaloptions are available for performing data decoding and error detection.Figure 29 presents an example flow chart which defines one way of receiving data(dn) and checking parity. The parity bit D30 is used for recovering raw data.Parity bits D29 and D30, along with the recovered raw data (dn), are Modulo-2added for D25 . . . D30 which provide computed parity to compare withtransmitted parity D25 . . . D30. Regardless of the parity encoding scheme usedfor satellite transmission during Phase I, the user's parity algorithm will betransparent (no change required) to the encoding scheme.
YES NO
[i..D 4 CON~..N
TO O•AIN 1 ... D44•O 1TAIh
BIgUrE d9. 424FU llo,,DA AM, D3"o INTOPANTl IY E'QUATI ONS(TABL.E X'V)
NO 025.. 01 N YES
of Parity Algoritlu
57
-- ~~~~~1 0 "' - -llll! I !l IN3m
Milk RockwellSpalce Operalons/hineratlon& $ IRnkernt]oa
Satellite Systems Division intematonal
4. GPS/IGS SUBSYSTEM DESIGN
4.1 REQUIREMENTS AND CONSTRAINTS
The subsystem requirements include full exploitation of the design for allsubsystems to iuinimize cost, risk, and impact on schedule while maximizingperformance reliability an-i legacy. Placement of the IGS on the GPS satellitewas constrained by the capability of the GPS vehicle to support the addedhardware. Also, a functional constraint imposed on design efforts was that theIGS system in no way compromise the basic mission of zhe GPS satellite.
4.2 IGS DESIGN
The IGS!GPS overall block diagram is presented in Figure 30 as anintroduction to IGS operation. To accomplish accurate three-dimensionallocation of nuclear events, the IGS user requires burst detection time ofarrival information (TOA) from the GPS system. Th• TOA and signalcharacteristicr are supplied to the L3 transmitter channel for transmission tothe user. Operation of the system can be traced from the X and Y detectors.Analog visible light and X-ray signals are converted into digital information bythe sensor processor. The time of a detected arrival and signal characteristicsare determined by the BDP, converted to digital information, and passed alongvia a buffer memory with an enable gate to the L3 encoder. The L3 encoderperforms block differential, and convolutional encoding of the data from thesexsor processor. The resultant signal is reclocked at 10.23 MHz and providesmodulation for the transmitted L3 signal.
The L3 encoder and the sensor processor use 200- and 400-Hz inputs from thetiming interface assembly, which is locked to a 100-Hz signal from the basebandprocessor. The L3 transmitter unit multiplies the 10.23-MHz signal from thebaseband processor by a factor of 135 to achieve the 1381.05-mHz frequency. The1381.05-MHz carrier is modulated at 10.23 MHz and then amplfied to a worst-case
5I-watt RF power le,.el. The output RF (1381.05 MHz) is fed to the L-bandtriplexer, where it is combined with the Ll and L2 frequencies and applied tothe L-band antennas. The IGS system also uses the GPS TT&C subsystem to receivecocmands ard transmit state-of-health data.
The IGS components consist of the followng:
"* Burst detector processor (BDP) and senaors
"* Baseband/processor (BBP)
"* L3 encoder
"* L3 transmitter and switch box
"* Frequency synthesizer
59 ZU I~ lJ
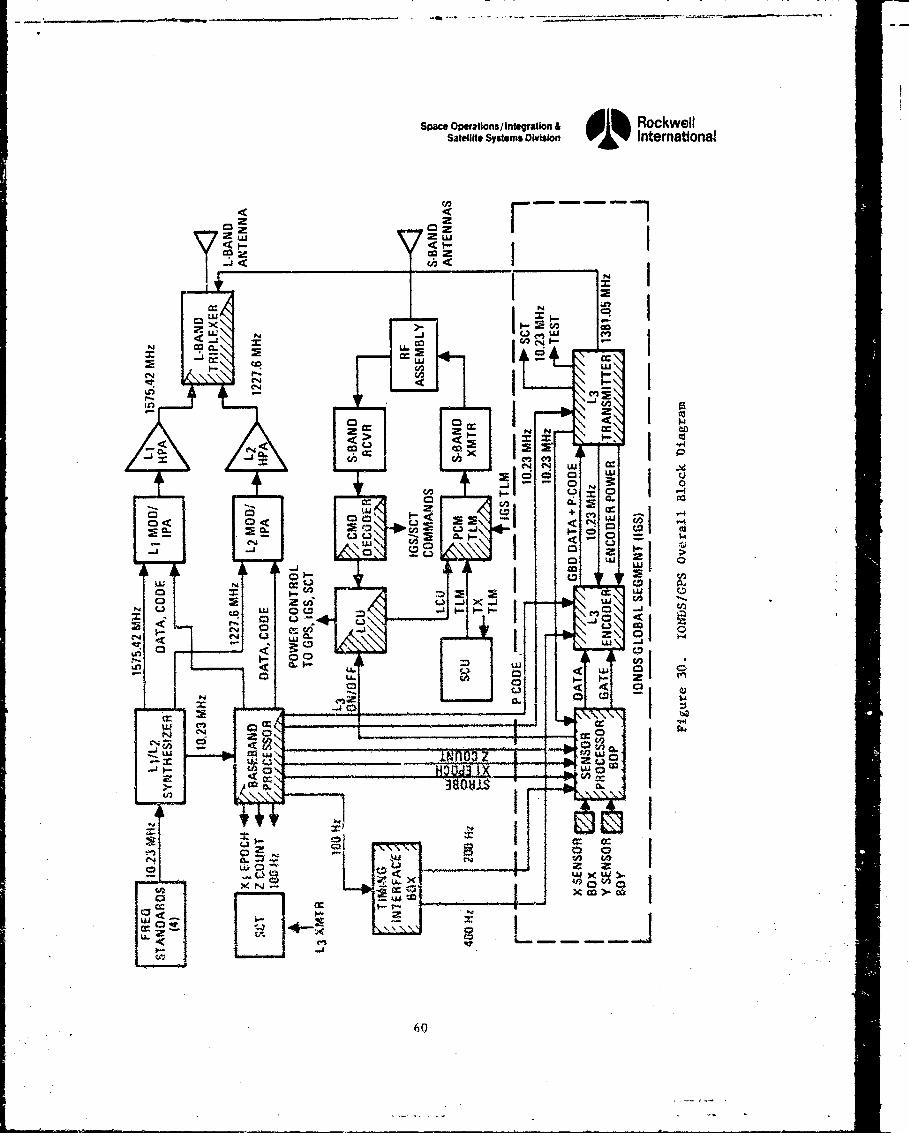
Space Operations/ Integration & RockwellSateflite Systems Division 01 nternational
zz ~~~
z zo? 2: cc
CO.
CL La. C
_ _ _ _ _ _ _ _ _ _ _ _ _ _
C-4_ _ _ _ _ _ _ _ _ w o L
X1. 0
606
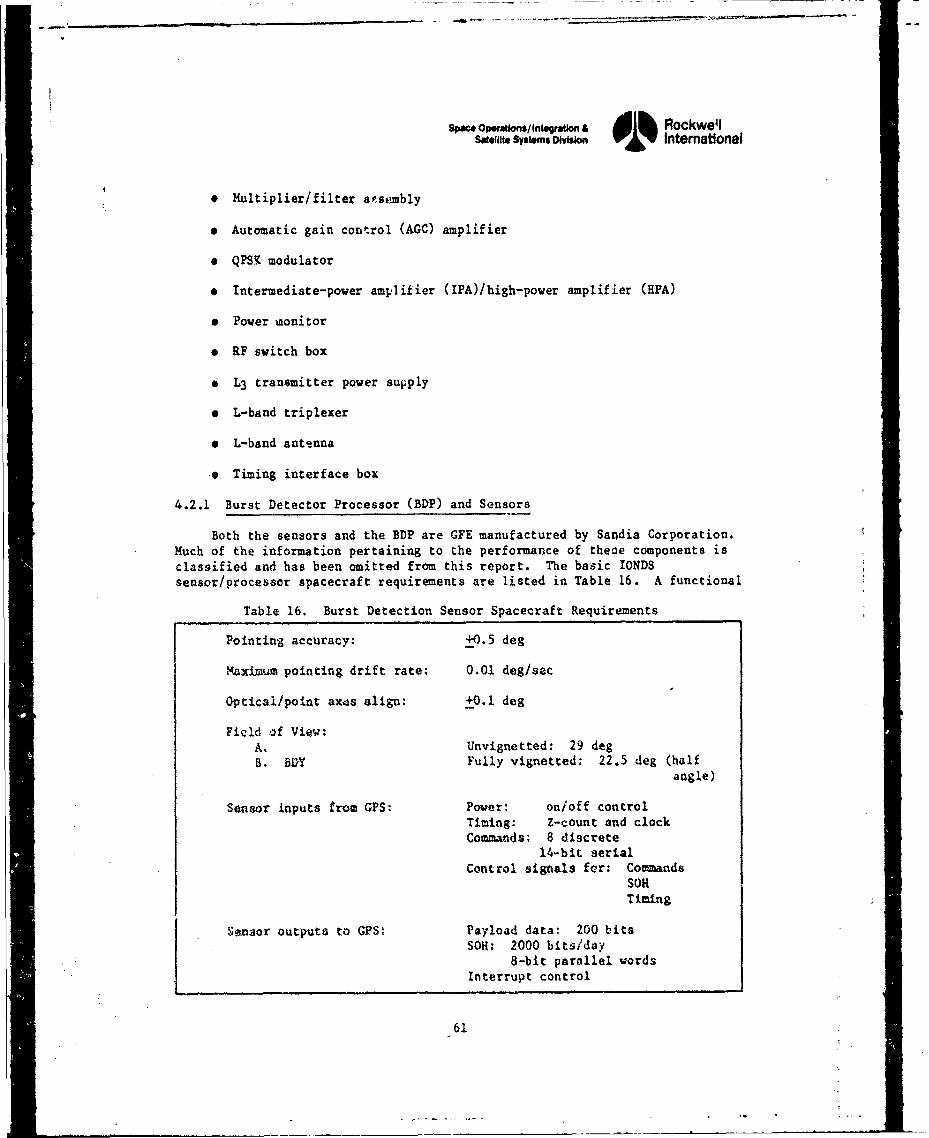
Spa" Opmations/ Integratio RockwellSWO* sytter on 01% Intematonal
"* Multiplier/filter a.sembly
"* Automatic gain control (AGC) amplifier
"* QPSK modulator
"* Intermediate-power amplifier (IPA)/high-power amplifier (HPA)
"* Power mnonitor
"* RF switch box
"" L3 transmitter power supply
"* L-band triplexer
"* L-band antenna
-* Timing interface box
4.2.1 Burst Detector Processor (BDP) and Sensors
Both the sensors and the BDP are GFE manufactured by Sandia Corporation.Much of the information pertaining to the performance of these components isclassified and has been omitted from this report. The basic IONDSsensor/processor spacecraft requirements are listed in Table 16. A functional
Table 16. Burst Detection Sensor Spacecraft Requirements
Pointing accuracy: +0.5 deg
,aximtm pointing drift rate: 0.01 deg/sec
Optical/point ax,s align: +0.1 deg
Ficid of View:A. Unvignetted: 29 degB. BUY Fully vignetted: 22.5 deg (half
angle)
Sensor inputs from GPS: Power: on/off controlTiming: Z-count and clockCommands: 8 discrete
14-bit serialControl signals for: Commands
SOHTiming
Sensor outputs to GPS: Payload data: 200 bitsSOH: 2000 bits/day
8-bit parallel vordsInterrupt control
61
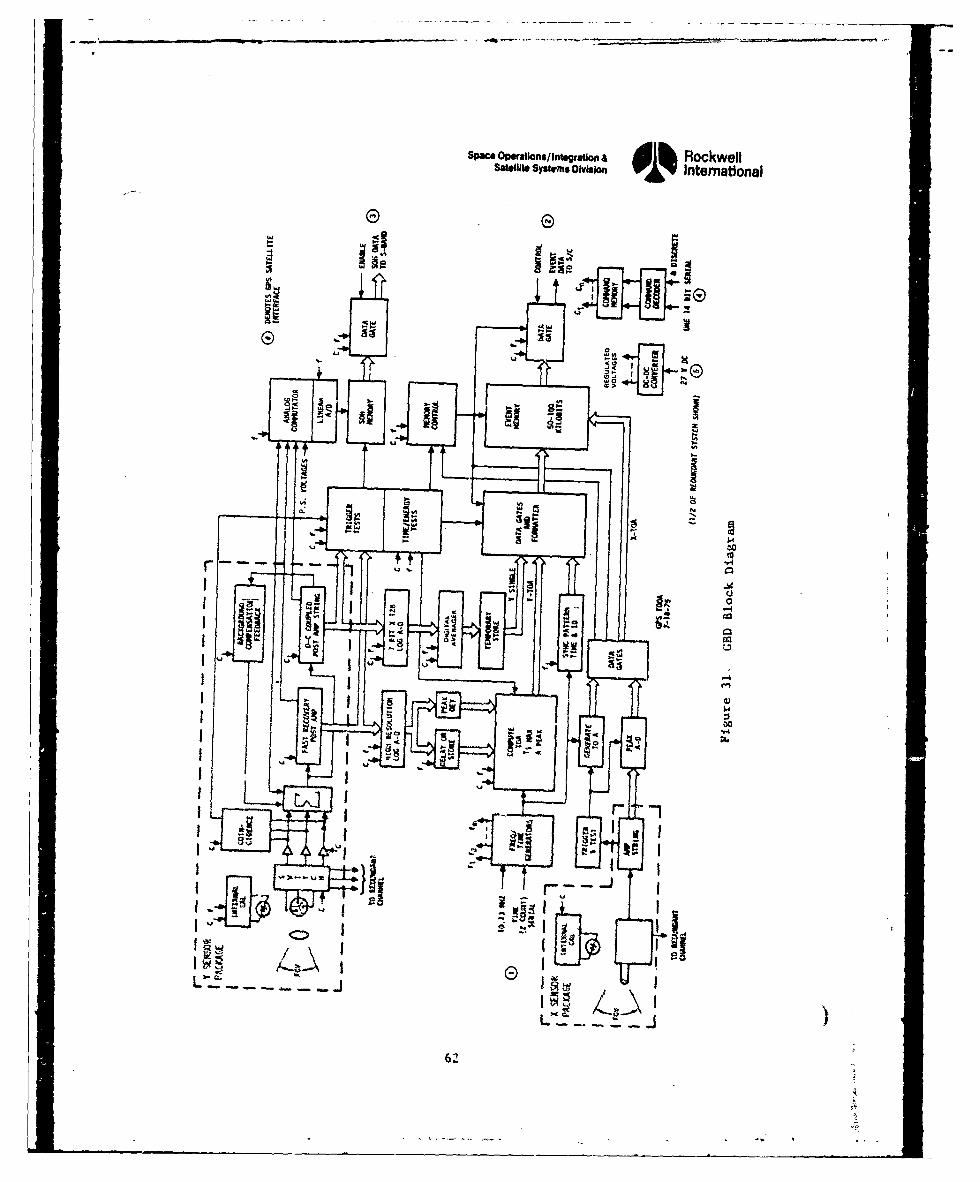
Spac Oprations/Integraiiofla RockwellSaaW11e1 Systems Diiio 4 International
5- 411'S.
ra
L'00
V / 1A
j.
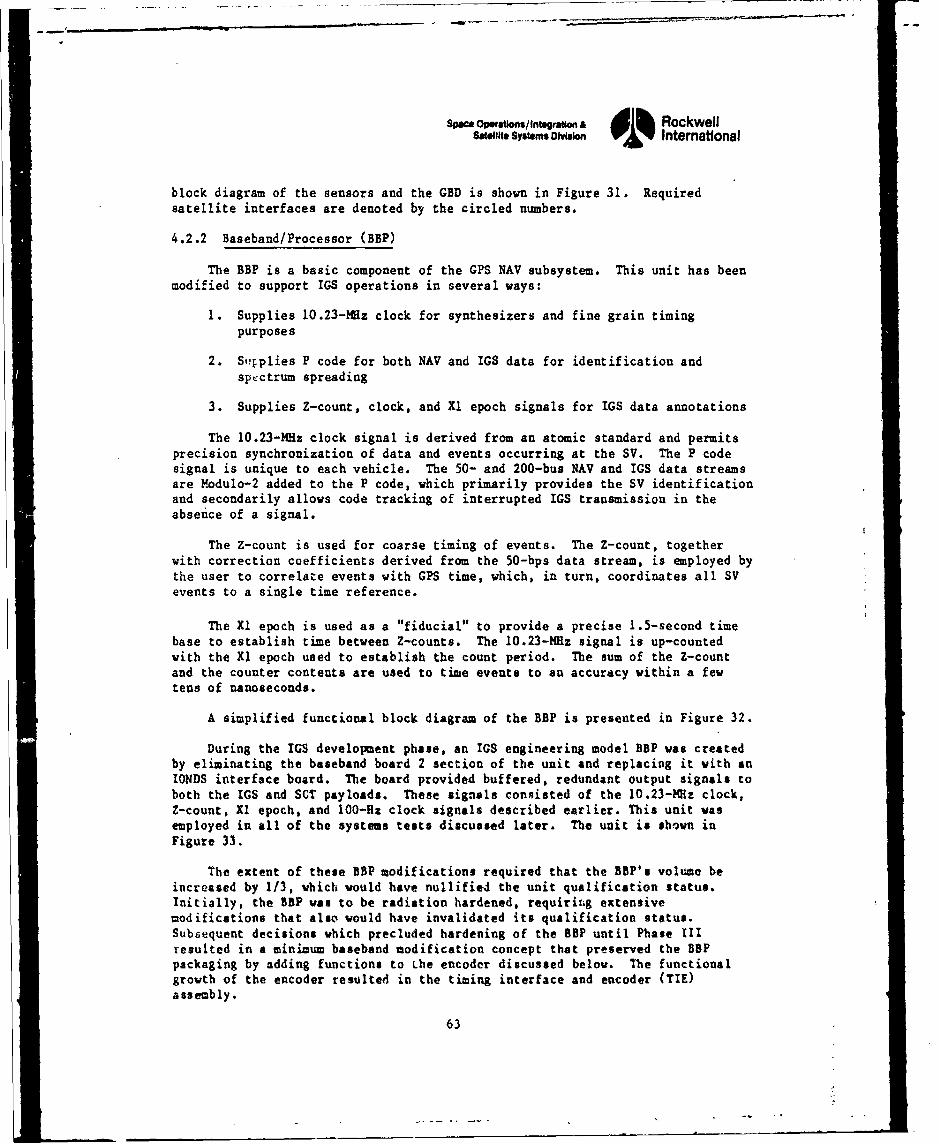
SPc OputlO/nInteration &A lb RockwellSate4lite Systems DhMlon W 'W International
block diagram of the sensors and the GBD is shown in Figure 31. Required
satellite interfaces are denoted by the circled numbers.
4.2.2 Baseband/Processor (BBP)
The BBP is a basic component of the GPS NAV subsystem. This unit has beenmodified to support IGS operations in several ways:
1. Supplies l0.2 3 -Mz clock for synthesizers and fine grain timingpurposes
2. Sopplies P code for both NAV and IGS data for identification andspectrum spreading
3. Supplies Z-count, clock, and Xl epoch signals for IGS data annotations
The 10.23-MHz clock signal is derived from an atomic standard and permitsprecision synchronization of data and events occurring at the SV. The P codesignal is unique to each vehicle. The 50- and 200-bus NAV and IGS data streamsare MYodulo-2 added to the P code, which primarily provides the SV identificationand secondarily allows code tracking of interrupted IGS transmission in theabsence of a signal.
The Z-count is used for coarse timing of events. The Z-count, togetherwith correction coefficients derived from the 50-bps data stream, is employed bythe user to correlate events with GPS time, which, in turn, coordinates all SVevents to a single time reference.
The XI epoch is used as a "fiducial" to provide a precise 1.5-second timebase to establish time between Z-counts. The 10.23-MHz signal is up-countedwith the Xl epoch used to establish the count period. The sum of the Z-countand the counter contents are used to time events to an accuracy within a fewtens of nanoseconds.
A simplified functional block diagram of the BBP is presented in Figure 32.
During the IGS development phase, an IGS engineering model BBP was createdby eliminating the baseband board 2 section of the unit and replacing it with anIONDS interface board. The board provided buffered, redundant output signals toboth the IGS and SCT payloads. These signals consisted of the 10.23-MHz clock,Z-count, Xl epoch, and 100-Hz clock signals described earlier. This unit wasemployed in all of the systems tests discussed later. The unit is shown inFigure 33.
The extent of these BBP modifications required that the BBP's volume beincreased by 1/3, which would have nullified the unit qualification status.Initially, the BBP was to be radiation hardened, requirir~g extensivemodifications that also would have invalidated its qualification status.Subsequent decisions which precluded hardening of the 8BP until Phase IIIresulted in a minimum baseband modification concept that preserved the BBPpackaging by adding functions to Lhe encoder discussed below. The functionalgrowth of the encoder resulted in the timing interface and encoder (TIE)assembly.
63
Space Opffations/ Integration A l RockwellSatellite Systems Divisloit i International
PNOCWUOR SUIASSIMILIES #AUSSANO SUSAZMUILI(S
ASSY -W - --- - INATNO EMRT S .
goII
.VII L* MOUlTON GEN RA OR N .
04CR!!!
Fiue3.lowrilrcso ucioa lc iga
TheIUOAC miiu aead oiiainc NSit o mdGifyingbaseand bardand ~ ~ -o Neorin t--ak--n-adteh-- s t onetr30. Ti htnprovides signOAlst h I seby o itiuinb IEt te usse310NVO (BPts)hsbe nr AseD fo 7t pn. Bad2hsbe
redesigned ~ ~ ~ INEAAC toC accuAoat foradtoa4nertdcrut I)t rvdisltio ddie oth I foRL Q.0.IiPcdZcunad20U lc"si Nas Th Nodifie bor isA Pbovn inGATR Figur 1
Th bar dsin asbensujete t teralaalsi ad s reenlbentedewoouaiiainadE~I etn oetbls t einb
similrityW tod exsinInis
The modification TincreTase ae ead06vt adicesdteviof the BBPa nodest 02 of a pond.Te ordad seml aetoalcoptbeadinecaaal vt h xsinXP adae The L G EMOakSenconete o h --- i----- RUDYcaio' cofg SrtOn o r T V N
SVIISCMDI T;I C1YIASS o6L
Space Opffations/Integratlon & ' RockwellSatellite Systems Divis 01% International
V.
00
65
SPac Opwations/Integraton a di RockwellSaWeIte sys•ms olvisin International
4.2.3 L3 Encoder
The purpose of the L3 encoder, shown in Figure 35, is to improve the bitrate (5 dB) by encoding data from the BDP. Logic circuits are basically low-power Schottky TTL and were initially designed to perform block differential,and convolutional encoding. The final operational version will probably use ablock/convolutional/interleave/differential sequence. A signal for use by theTT&C subsystem is also provided upon recognition of a 24-bit synchronizationword at the beginning of each data block. Finally, convolutionally encoded dataare Modulo-2 added with a 10.23-MHz PN sequence supplied by the basebandsubsystem. The resultant signal is reclocked at 10.23 )Hz and is the modulationsignal for the transmitter.
The block encoder section (see Figure 36) consists of a 22-bit shiftregister and an array of exclusive OR gates to perform division of the incomingmessage data, m(x), by the polynomial divisor p(x) where
p(x) u x2 2 + x20 + x14 + x1 3 + x12 + xll +x8 + y7 + x5 + x3 + x + 1
The first 24 bits of data at the beginning of each data block describe thesynchronization word. Therefore, two extra shift register stages are added atthe end of the 22-bit register to assist detection of the 24-bit sync word.Upon detection of the word (via a series of gates), a pulse is generated whichtoggles a flip-flop. The TT&C subsystem periodically samples the state of thisflip-flop.
The actual division process uses 22-shift register stages and begins whenthe enable signal from the BDP is true. Division continues until the enablesignal toggles false. Then, the current remainder, r(x), 22 bits in the shiftregister is immediately shifted out. The remainder (or parity tail) is gatedcontiguously following the input data stream that was sent directly to thedifferential encoder when the enable signal was true.
After the 22-bit parity tail is shifted on to the differential encoder, twomore zero (or false level) bits are added to complete the tail. The zero bitsare provided as error status bit locations.
The resultant signal (serial stream) sent to the differential encodersection then consists of the original message bits followed by the parity tailand 2 zero bits.
The differential encoder, shown in Figure 37, continuously stores eachoutput data bit in a delay flip-flop, whereupon the stored bit inverts thefollowing input data bit only if the stored bit is true (or 1). If the storedbit is false, the following input bit is transmitted unchanged and becomes thenext stored bit. This technique then encodes data ones and zeros into datatransitions and eliminates ambiguity when the data are later decoded since theRF carrier has a 180-degree phase ambiguity if it is tracked using only themodulated received signal. The penalty for differential encoding-decoding isapproximately 0.1 dB in perforcance.
The output of the differential encoder is sent to the convolutional encoder(, Figure 38). This logic consists of a 7-bit shift register and
66
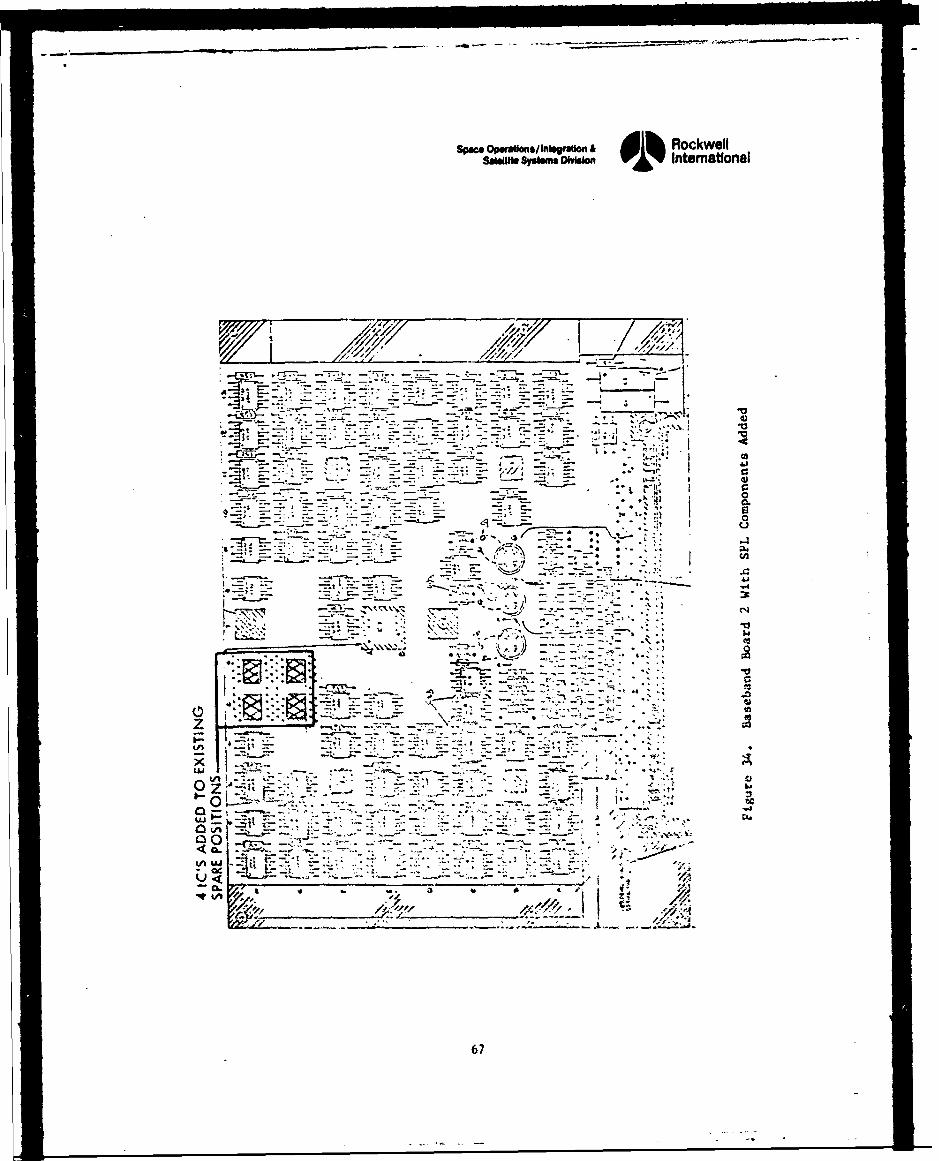
SpwAcopwqaUon9onsgron & il RockwellSaWIm.Syslmi DviionV" Intemational
-7-
-~*~ :
010
(30
7 Z.-
-lit hE
67 ZTi7i.
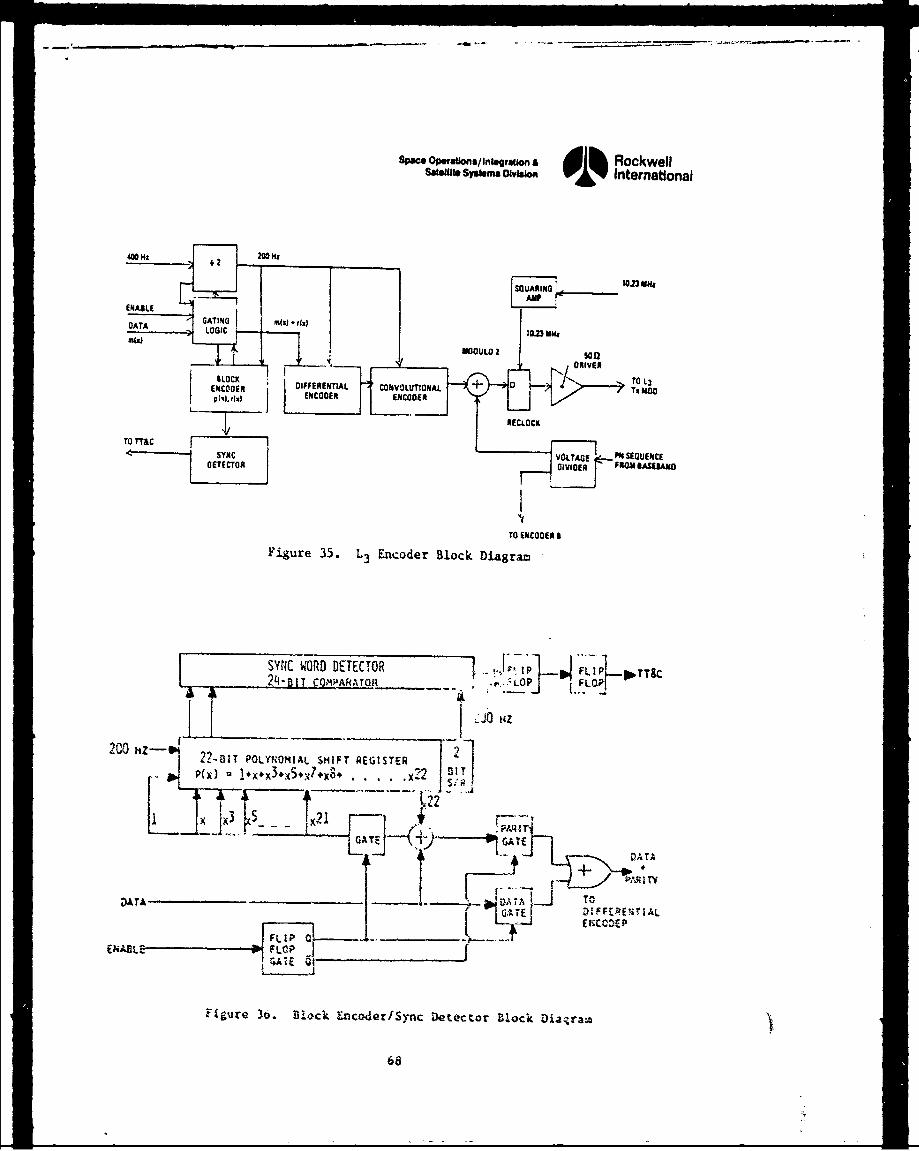
SpA op ,abons/Intoagauo, & RockwellsMaW* Sums OW, 0i1% International
DIVE URI"DAT GATI'NG I-,z
• " " /IIWOULD 2 sonQ
I tIOCX l ' '•r-. TO L3ENCODER DIFF1E"ETIAL CONVOLUTIONM +~
ro0 ENCODE ENCODER Ts WOIJN
C UD2D
RIV DER OMS
EA O
Figure 35. L3 Encoder Block Diagram
COMPARTORRE LOPK
SSYUC woRD DETECTOR ..... IP,. F•_I•lAP .,,YT8
___ __ __ __ __ _ __ i__ F L_
TOJ liZC
DATAEOAVLTG
E'igr 3i. gu 5 Lcod3riSync DetrcBol c lock Daar
SY1CWODDEECORIPj ý FLIP .T&
24-pTT| COPRAO
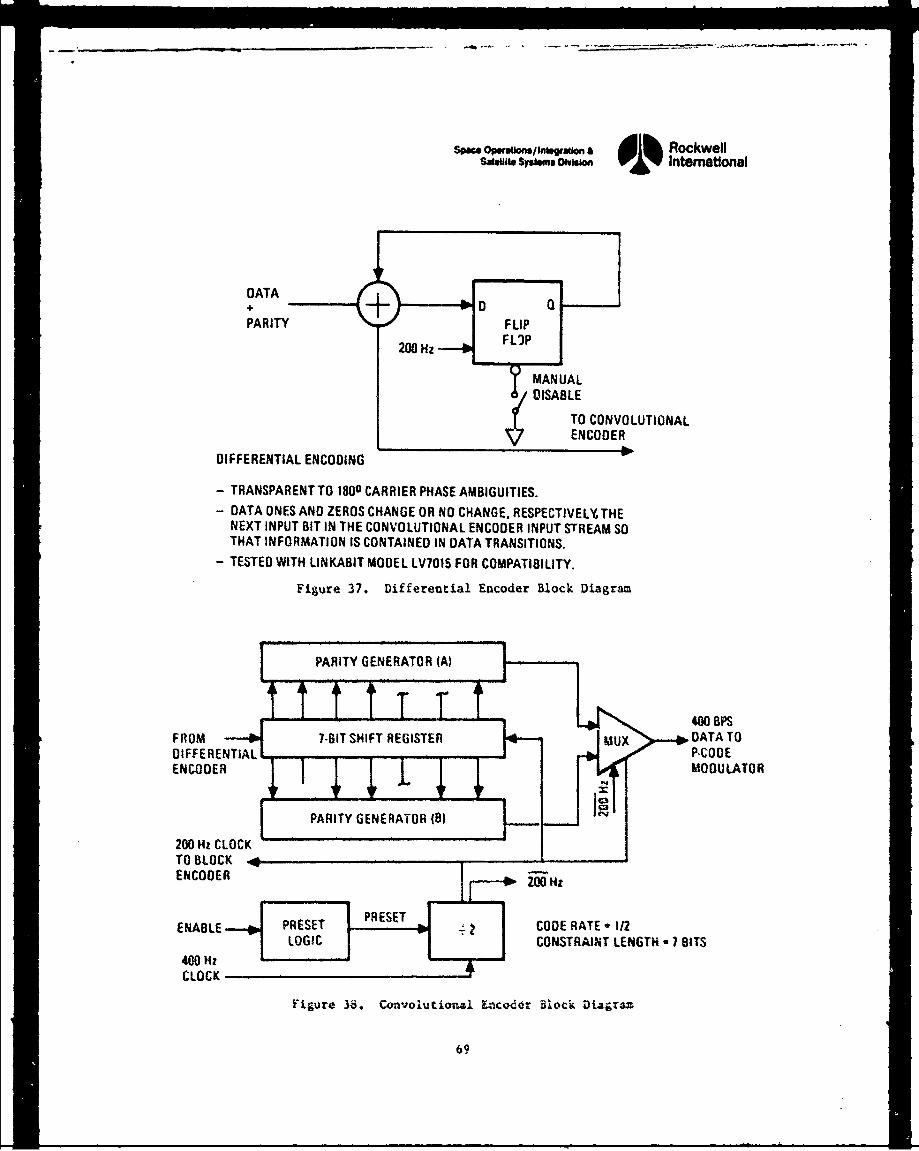
spa* opwau•os/,lninon a Rockwells ,. saues0 oi International
DATA+ 0 QPARITY FLIP
200 Hz FL)P
MANUALDISABLE
TO CONVOLUTIONALENCODER
DIFFERENTIAL ENCODING ,
- TRANSPARENT TO 1800 CARRIER PHASE AMBIGUITIES.- DATA ONES AND ZEROS CHANGE OR NO CHANGE, RESPECTIVELY, THE
NEXT INPUT BIT IN THE CONVOLUTIONAL ENCODER INPUT STREAM SOTHAT INFORMATION IS CONTAINED IN DATA TRANSITIONS.
- TESTED WITH LINKABIT MODEL LV7015 FOR COMPATIBILITY.
Figure 37. Differential Encoder Block Diagram
I PARITY GENERATOR (A)
FROM 7?BIT SHIFT REGISTER MIX DATA TODIFFERENTIAL M. P-CODEENCODER MODULATOR
0 HPARITY GENERATOR (8)200 Hz CLOCK. . ..-. ".,
TO BLOCKENCODER 00HzI
ENABLE-* PRESET PRESET CODE RATE *n 112
400Hi LOGIC CONSTRAINT LENGTH - 7 BITS
figure 3. Con'volutional E=odr Block fliar=ii
69l
SpO OPWMeiS/,,.g.inon a d RockwellswUu. sysms eC. 0 Intemational
"exclusive-OR" gates to generate parity values on the shift register contentscompatible with the Linkabit Model LV7015 convolutional encoder/decoderalgorithm. The outputs of the two parity arrays are selected alternately by aselect gate driven by both phases of the 200-Hz clock. The alternately selectedoutput is exclusive ORed with the PN sequence and reclocked at 10.23 MHz. Thereclocked signal drives the modulator via a transistor switch.
The clocking signal for the final synchronizing flip-flop is obtained byamplification and squaring of the incoming 10.23-NHz sine wave. The squaring isaccomplished by overdriving the amplified sine wave coupled with a Schmitttrigger-type circuit.
The 200-Hz timing clock derived from the 4 00 -Hz clock, is provided topreset the flip-flop in the state that will allow the positive going edge of the200-Hz clock to sample incoming data near the center of each bit duration. Theencoder is totally redundant and is controlled by switching oa the appropriate5-volt power supply. To achieve this design, 24 loy-power Schottky IC's,2 transistors, and an assortment of resistors and capacitors were used. Maximumpower dissipation is approximately 1.6 watts for any one unit.
4.2.4 L3 Transmitter and Switch Box
The IGS transmitter subsystem consists of two transmitters, A aad B, aswitch/power divider assembly, and a redundant encoder assembly, as shown in theoverall operational block diagram in Figure 39. The switch power divider ismounted on transmitter B and is considered a part of transmitter B. 1 Theencoders are independently mo,tnted to the GPS bulkhead and are wired to the datainput of transmitters A and B via shielded :oaxial cable. Figures 40, 41, and42 define the operational charactzristics of the L3 transmitter, the L3switch/power divider, and the L3 ent.zer aasemblies, respectively.
A block diagram of the transmitter assembly is shown in Figure 43. The1381.05-M0lz output frequency is derived from the GPS 10.23-HHz rubidium standardand is modulated and amplified as described below.
The transmitter assembly consists of five major elements: (1) thefrequency synthesizer, (2) the multiplier/filter assembly, (3) the AGCamplfier, (4) the SPSK/QPSK vadulator, and (5) the power amplifier 4ssembly.The EDM design details follow; minor chag*es h4ve been =-de for producibilityinto llig:at hardware.
4.2.5 Frequency Synthesizer
The synthesizer consists of * Colpitts VCO operating at 153.45 nit andphase-locked to the rubldiu= standard. (Synthesizer characteristics Arest~arized in Table 17.) The aechanization uses etitter-coupled logic toprovide the frequency division (divide by 30), which is phase-compared at5.115 At (rubidit= standard divided by 2), as illustrated in Figure 44. TheVO0 is buffered at the output to ensure vinict.s pulling and adequate drive tothe subsequent circuitry. The VCO and loop filter are packaged independent ofthe loop logic circuitry using hybrid technology. resulting in two =ultipin
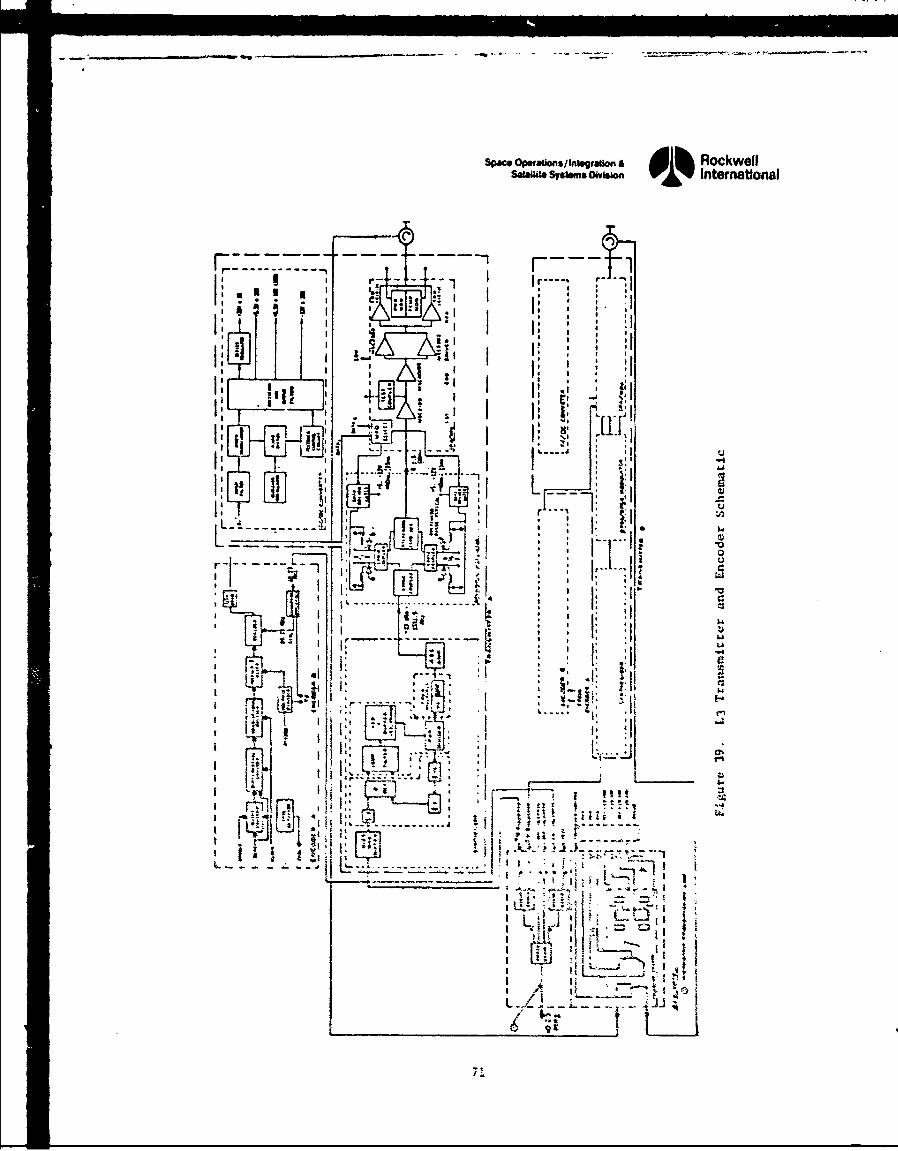
SpceOpffalhos/tlalgratlon # Rockwellsgw.Ssims oivwo, V International
- " ,c I .. I
I - '
I iii I L • I :1•I': Ili I*j i r Ii
,- • r l r f
I , I
I I I
i: I 3, ,•. -h r - , ...- •- •:I: ] - • I i -; '
U l l i t'
-' .• " "" "
- -, I -'.. . .. . . .... a
" "'• " -Z
* It:L•- :,ol r ll, . , 'I, T " i - • J • T !
2 *,• I - - - -• - - •
I I:
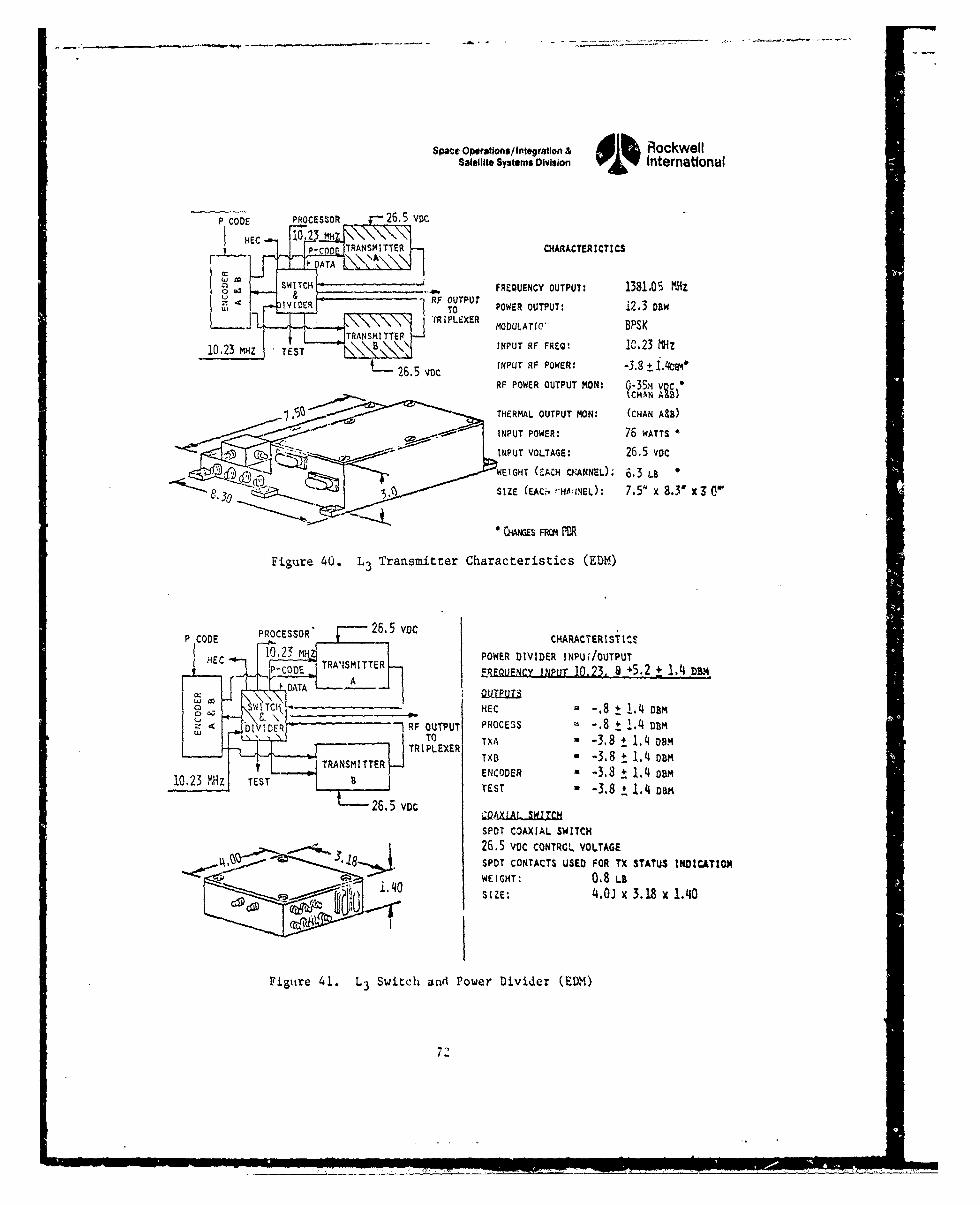
Space Opeiations/ Integration &Rockwell
Satellite Sy~temns Olvislon International
P CODE PROCESSOR f-265 voc
p-J P-OD. TRANSMITTER CHARACTERICTICS
SWTHFREOUENCY OUTPUT: 1381.05 MHzIVDE POWER OUTPUT: 12.3 yaw
TRANSMITTE MODULATIC" BPSK
4 STB INPUT RF FREQ,, lu.23 M1Iz102 MZ T &\\INPUT RF POWER, -3.3 + .4Mca
RF POWER OUTPUT MON: 0'-35,i voc~CHAN A &a)
THERMAL OUTPUT MON: (CHAN A&B)
SINPUT POWER: 76 WATTSINPUT VOLTAGE: 26.5 voc
ýWEIGHT (rCACH CHANNEL); 6.3 LB
5A SIZE (EAC,ý~i FHVN : 7.5" x 8.3ff x 3 Tr
Figure 40. L3Transmi~tter Characteristics (E014)
P CODE PROCESSOR' 25.5 vDc CHARACTERIStItS
10C 2-4 POWER DIVIDER INPUdOUTPUTP CODE T'AISMT FRFoI1Fcy iNPUT 10.23. a +5,2 + 1.4 DmN
I DATAT, A
____________WI_____ HEC -8±1.4 DBm
1QR' RF OUTPUT PROCESS -. 8 t1.4 DntmWTO TXA '-3.8 ±1.4 ogm
TR IPLEXERTRNMITTER 7B-3.8 ±1.4 D8m
BENCODER -3.8 1.4 oam,112-~z TSTBTEST -- 3.8 i 1.4 Dam
SPOT COAXIAL SWITCH
26.5 VOC CONTROL VOLTAGE3.28SPDT CONTACTS USED FOR TX STAT'US INDICATIOR
1,0WEIGHT: 0.8 LB£.40SIZE: 4t.OJ x 3.18 x 1.40
Figure 41. L3 Switch and Power Divider (EDM)
72
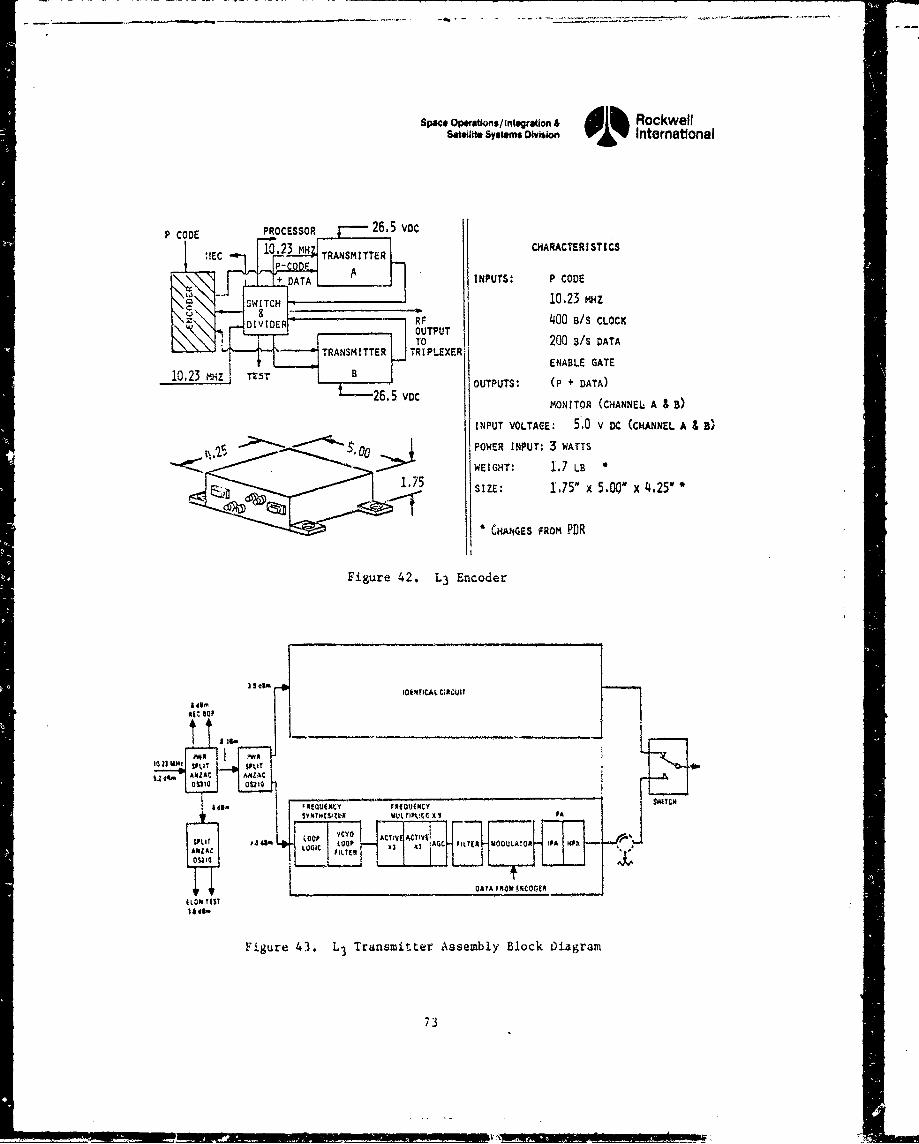
Space Opwation$/Integratlon & RockwellSateiite Systems Division International
P CODE PROCESSOR 26,5 vocMC 10.23 MH TRANSMITTER• CHARACTERISTICS
+ AAINPUTS: P CODE
"10.23 mz
DIVIDR RF400 B/S CL.OCK
TRNSITER OU0U 200 3/s DATATRANSITTER TRI PLEXER -.
10.23 MHZ BENABLE GATE10.23 MHZ T T B JOUTPUTS: (P + DATA)L--26.5 vDCMONITOR (CHANNEL A & B)
INPUT VOLTAGE: 5.0 V DC (CHANNEL A & B)
00 POWER INPUT: 3 WATTSWEIGHT: 1.7 LBSIZE: 1,75" x 5.00" x 4.25"
CRANGES fROM PDR
Figure 42. L3 Encoder
~ 84I-IORNeTCAL C;tCUJII
3E• OP J•w. -
t 1U I SPIT SLIANZAC
SPI LOOP-. _
)3 'Y X AG PMAWOUATA POW•OR
ANZAC LOO PL*a E
iLON t1$t
Figure 43. L3 TransmitLer Assembly Block Diagram
73
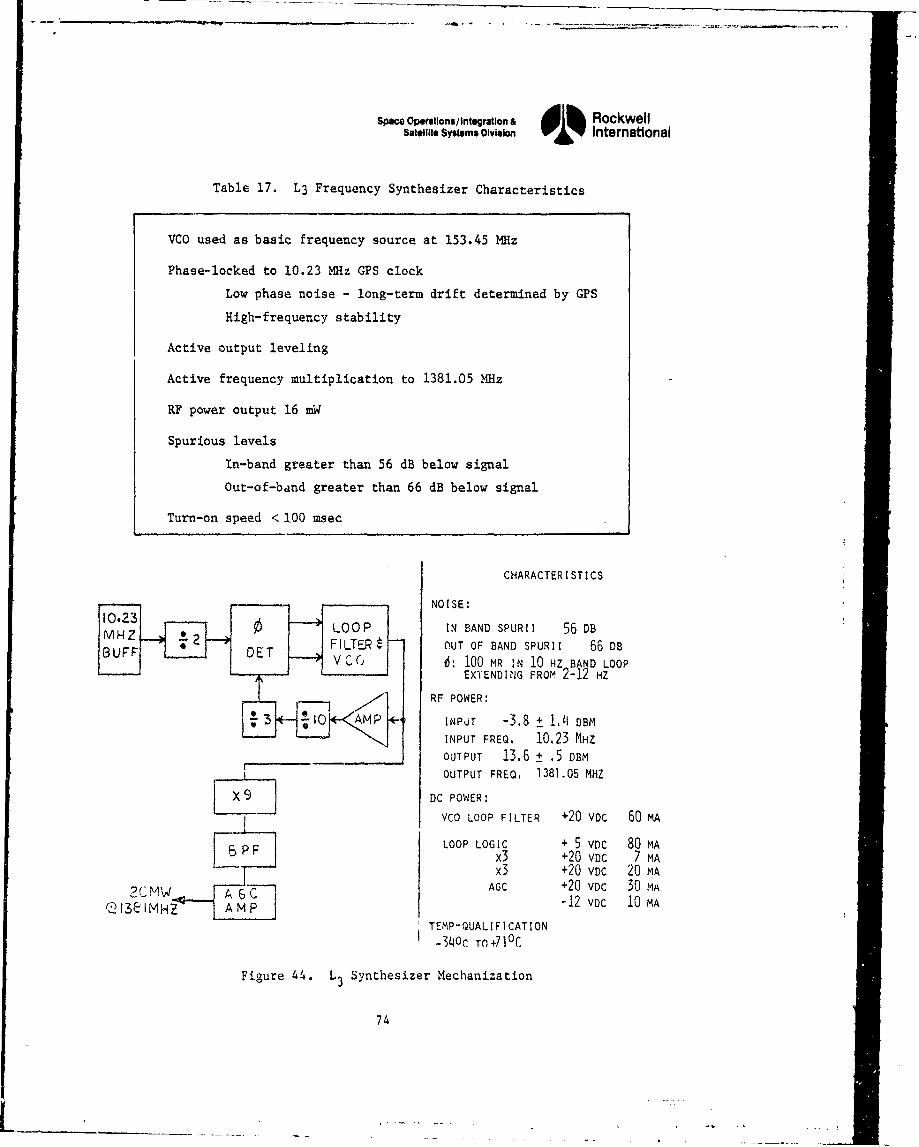
Space Opewations/integration & dI RockwellSatellite Systems Division 01% International
Table 17. L3 Frequency Synthesizer Characteristics
VCO used as basic frequency source at 153.45 MHz
Phase-locked to 10.23 MHz GPS clock
Low phase noise - long-term drift determined by GPS
High-frequency stability
Active output leveling
Active frequency multiplication to 1381.05 MHz
RF power output 16 mW
Spurious levels
In-band greater than 56 dB below signal
Out-of-band greater than 66 dB below signal
Turn-on speed < 100 msec
CHARACTERISTICS
NOISE:03 LOOP IN BAND SPURII 56 DB
T F I LTE$- OUT OF BAND SPURII 66 DBFFTV C 6: 100 MR IN 10 HZ BAND LOOP
EXTENDING FROM 2-12 HZ
RF POWER:
V 3 10 AMP 4 INPOT -3.8 + 1.4 DBM
INPUT FREQ, 10.23 MHZ
OUTPUT 13.6 + .5 DBMOUTPUT FREQ, 1381.05 MHZ
DC POWER:
VCO LOOP FILTER +20 VDC 60 MA
SLOOP LOGIC + 5 VoC 80 MAx3 +20 VDc 7 MA
x3 +20 VDC 20 MA" , AGC +20 VDC 30 MA
AC-12 VDC 10 MAQ 13L-I1MHZ A MP
TEMP-QUALIFICATION-340c TO+71 0 C
Figure 44. L3 Synthesizer Mechanization
74
Space Ope1ttionsi/Integration & Il RockwellSatellite Systemts OvISon 01% International
flat-pack hermetic enclosures connected by standard printed circuit boardtechniques. The loop logic and loop filter/VCO schematics are shown in Figures45 and 46. Loop filter/VCO performance data is listed in Table 18.
4.2.6 Multiplier/Filter Assembly
The times nine (X9) multiplier consists of 2 times three (X3) multipliersin series, followed by a four-pole, 0.l-dB ripple microstripline filter.Multipler characteristics are listed in Table 19. The X9 schematic is shown inFigure 47.
The first X3 multiplier uses a 2N2857 transistor whose input is matched at153.45 MHz and idled at the second harmonic to ensure high-efficiency triplingaction. The output is matched and padded slightly (3 dB) to minimize triplerinteraction due to temperature and aging effects. The multiplier design useslumped element and microstripline techniques on an alumina substrate.
The second tripler uses an HP21 transistor to provide adequate gain andpower output at 1361.05 MHz. This tripler also uses lumped and distributedelements to accomplish good input/output matching. Idling is again absorbedinto the input matching circuitry to optimize multiplier efficiency. Thiscircuit is also built on an alumina substrate.
The filter assembly eneures adequate out-of-band (+50 MHz) spuriousrejection resulting from the X9 multiplier. The filter is an edge-coupledmicrostripline type, built on 25-mil-thick alumina substrate. The filter isdesigned for 6-percent bandwidth and provides a Chebyshev response.
4.2.7 AGC Amplifier
After filtering, the output is amplitude-leveled by an AGC circuit. TheAGC amplifier is operated Class A and uses a circuit layout similar to theoutput stage of the frequency multiplier (see Figure 48). The output is sampledby a lQ-dB coupler and the amplitude detected by a diode detector. The filteredoutput drives the inverting input of the operational amplifier. Included in theoperational amplifier's feedback loop is a PIN diode. This PIN diode is locatedin the RF input path of the RF amplifier and effectively functions as a voltage-controlled attenuator. A stable voltage reference is provided for theoperational amplifier's noninverting input to compare the detected and filteredRF input signal.
4.2.8 QPSK Modulator
The quadriphase modulator (Figure 49) is designed for high data rate (10MHz) digital input. It can be used either in the BPSK or QPSK mode. For BPSKoperation, the input carrier is modulated by identical data inputs at themodulation input ports (data 1 and data 2) or by connecting the ports together.The output carrier phase, relative to the input carrier, is phase-shifted by 0or 180 degrees, depending on the data input.
For QPSK operation, the input carrier is modulated by two independent datachannels at data I and data 2 input ports. Each data channel consists of a two-
75
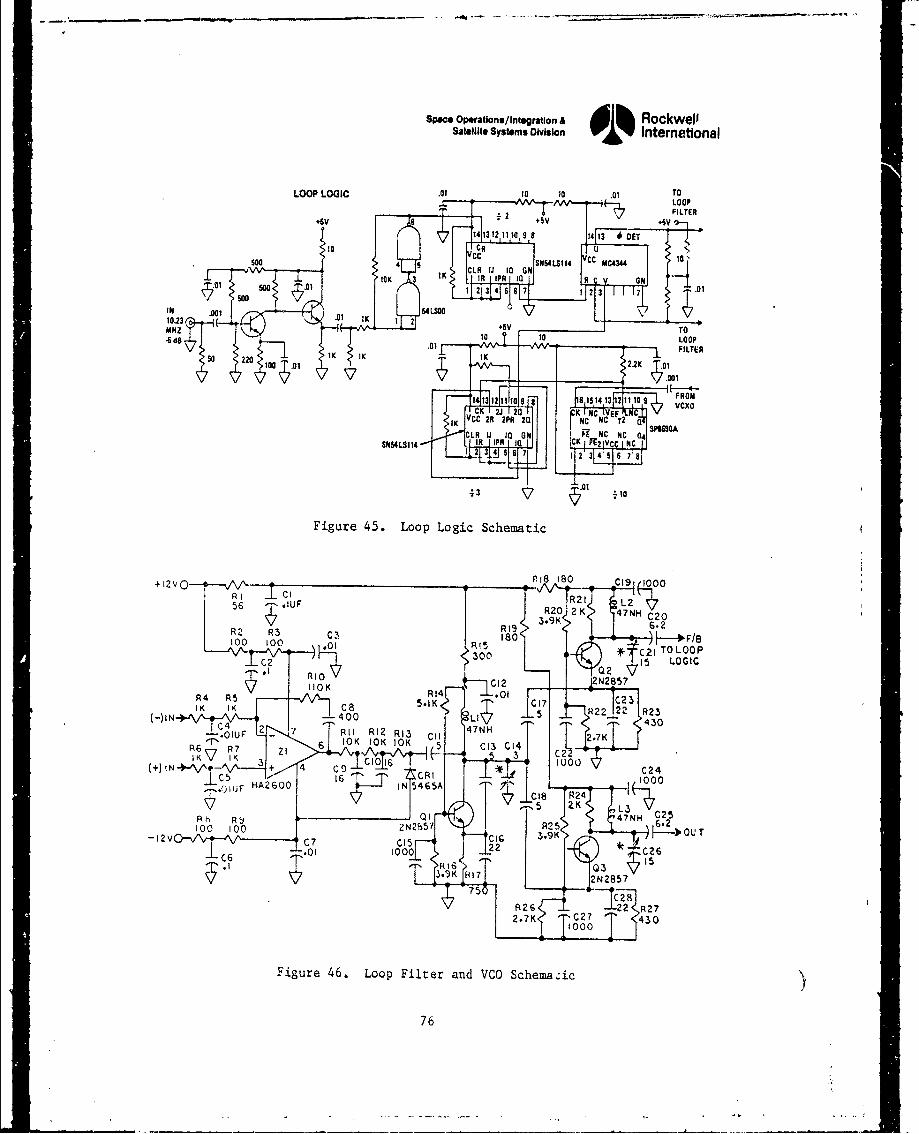
Spac Operations/ Integration & l RockwellSatellite Systems Division 01% International
LOOP LO43iC .0 IQ.01T
14131 1110, 8 141 B OE
100.23
Figur 4. Loo Logc Sch matic 4CCC4
RI~~~
UC IL2(54 *UF CC R2 :2A3NHC
10 R C9 .2
.6C2I TO LOOP
so 12 JK 4-I N2.2K
5.1K I+ J R22_ R2L7N
2NCK5 IIKI CoVEu
I.K VC R2P17 CN T2Na5
010
Figure 46 . Loop F LoegadicO Schematic
412VOP18 80 C1 100C I I U R2176
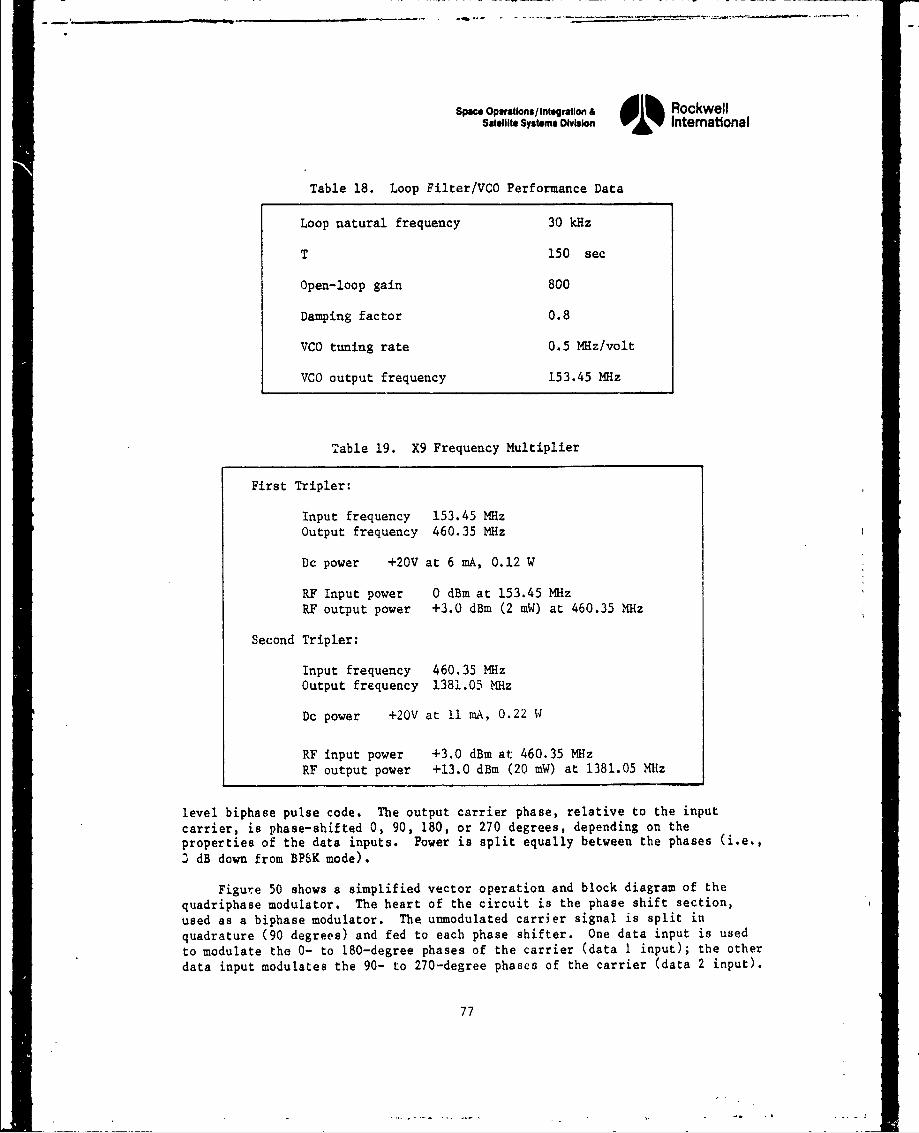
SpWc. Opmeations/Intogiation & RockwellSatellite Systems Division International
Table 18. Loop Filter/VCO Performance Data
Loop natural frequency 30 kHz
T 150 sec
Open-loop gain 800
Damping factor 0.8
VCO tuning rate 0.5 MHz/volt
VCO output frequency 153.45 MHz
Table 19. X9 Frequency Multiplier
First Tripler:
Input frequency 153.45 MHzOutput frequency 460.35 MHz
Dc power +20V at 6 mA, 0.12 W
RF Input power 0 dBm at 153.45 MHzRF output power +3.0 dBm (2 mW) at 460.35 MHz
Second Tripler:
Input frequency 460.35 MHzOutput frequency 1381.05 MHz
Dc power +20V at 11 mA, 0.22 W
RF input power +3.0 dBm at 460.35 MHzRF output power +13.0 dBm (20 mW) at 1381.05 MHz
level biphase pulse code. The output carrier phase, relative to the inputcarrier, is phase-shifted 0, 90, 180, or 270 degrees, depending on theproperties of the data inputs. Power is split equally between the phases (i.e.,3 dB down from BPSK mode).
Figure 50 shows a simplified vector operation and block diagram of thequadriphase modulator. The heart of the circuit is the phase shift section,used as a biphase modulator. The unmodulated carrier signal is split inquadrature (90 degrees) and fed to each phase shifter. One data input is usedto modulate the 0- to 180-degree phases of the carrier (data 1 input); the otherdata input modulates the 90- to 270-degree phases of the carrier (data 2 input).
77
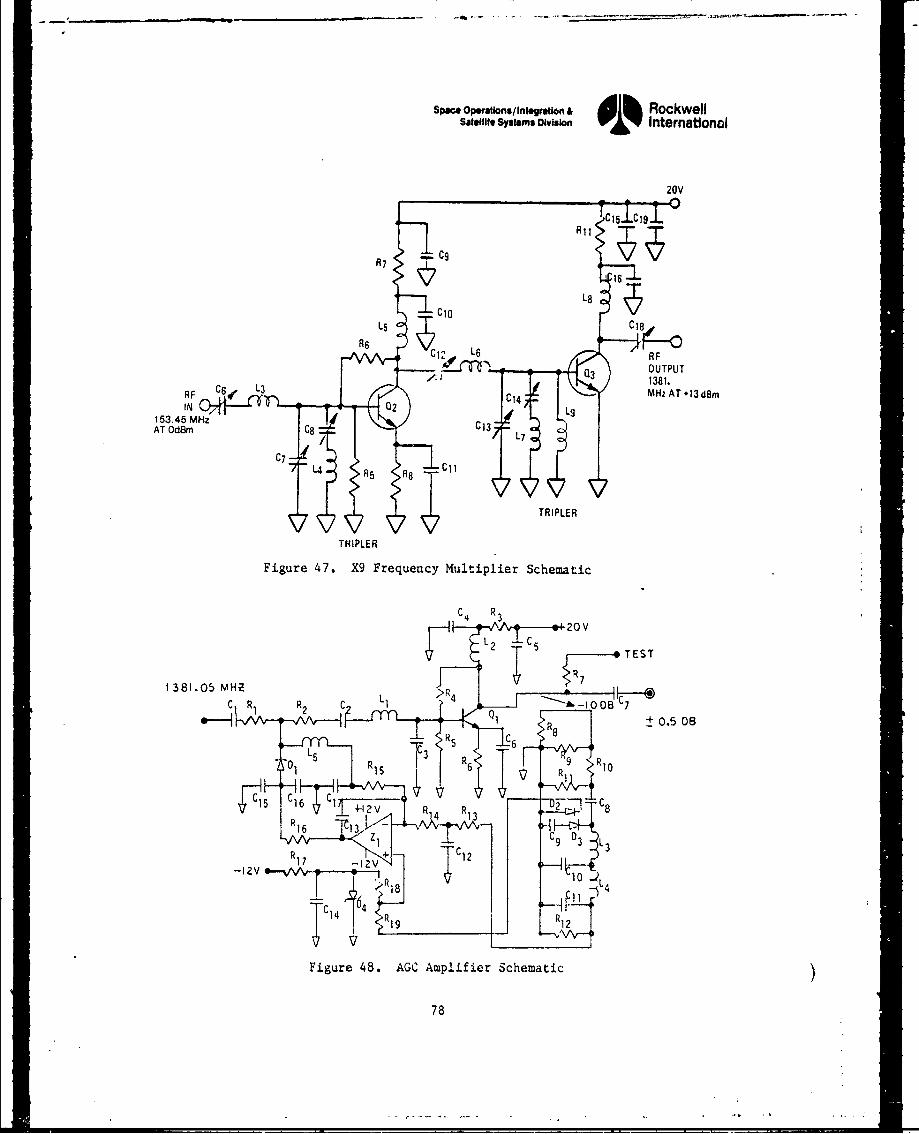
Space Operatlons/Integraton & dlh RockwellSateflie systems Division International
20V
1C15 LC191
R7 C
1
N 16
L L8L5o C -8r -
R6 ý-. " -
(1-3 OUTPUT
/:" 1381.RF C 3 \13 :FC4,L r.C1 MHz AT +13 d~m
IN Q 2 -,153.45 MHzAT OdBm C8 C13
C7 L4 R5 R8 TRIPLE
S] ~TRIPER~ll
THIPLER
Figure 47. X9 Frequency Multiplier Schematic
C4 -RA 3 20V
L TEST
1 3 8 1.0 5 M H - > R 7 - ý
R± 0.5 DB
T7 z I _ I6_ r / _ 9 !_ _ L 3Rv 16 13 !R/ -• /ý I 6-1l
-I ZV <"1 !1- I ,•,P
Figure 48. AGC Amplifier Schematic
78
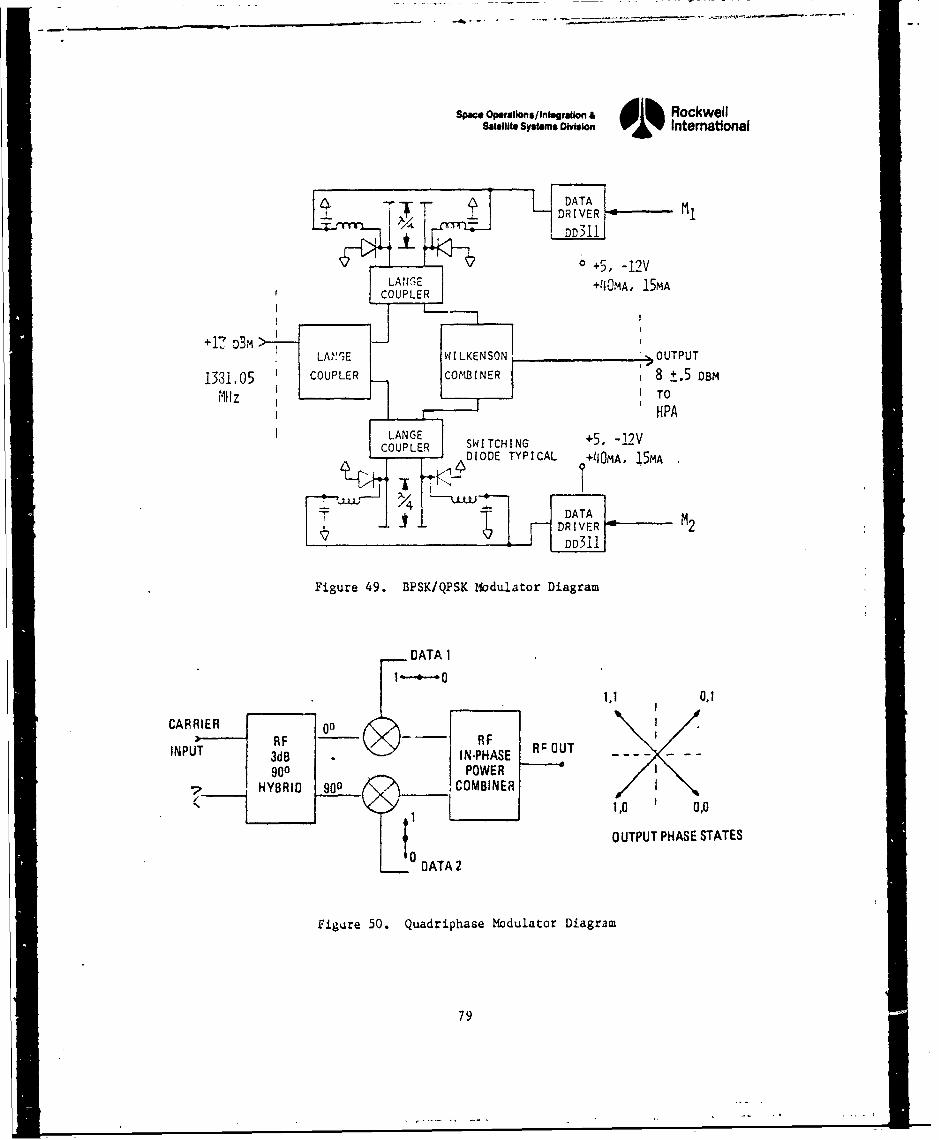
Space Operations/Integrsaon & lb RockwellSatellite Systems Oltaioni International
DATA
DD311
S"ill I ', • •+5, -12VSCOUPLER
+1.. D3M >LAV17'E W p ILKENSON ', OUTPUT
i ; i o sCO U PL E R C O MI N ER'-= 8 ± 8 .5 D• m11z , I0TO
RF I
SHPA
PORE "'L
RIGE ____ SWITCHING +5,C-12V
OUTPUT PHSRSAE
m~Ct C ,"J•IODE TYPICAL ý+II0MA, ]•SMA.
DATA 2
Figure 49. BPSK/QpSK Modulator Diagram
7DATA I
1,1 0,I
3 RF --- RF R U
900 POWER /
,• _ HYBRID 900 COMBINER
: 1,0 i 0.0
O UTPUT PHASE STATES
0DATA 2
Figure 50. Quadriphase Modulator Diagram
79
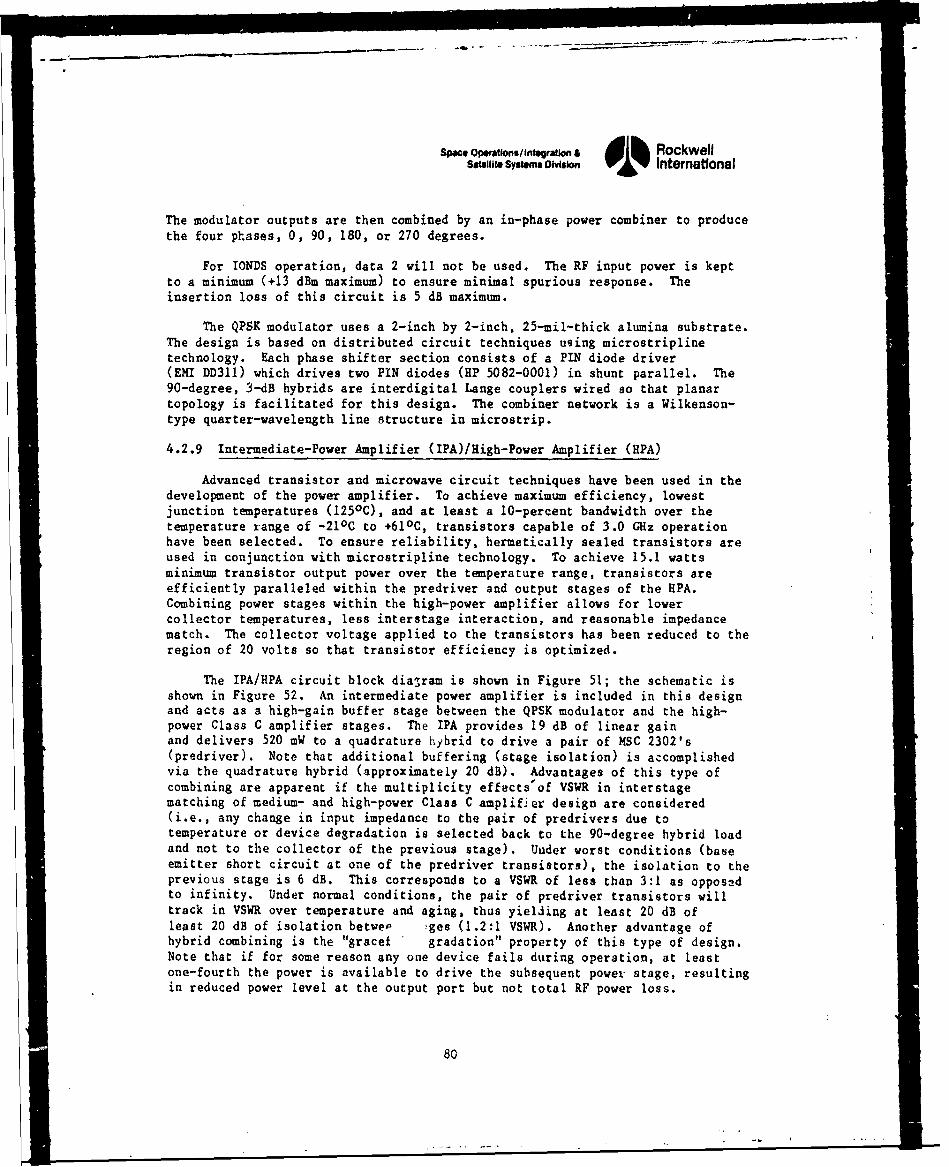
Space Operst.ons/Integraton & Ilk RockwellSst.it. Systems ODivisi Intemational
The modulator outputs are then combined by an in-phase power combiner to producethe four phases, 0, 90, 180, or 270 degrees.
For IONDS operation, data 2 will not be used. The RF input power is keptto a minimum (+13 dBm maximum) to ensure minimal spurious response. Theinsertion loss of this circuit is 5 dB maximum.
The QPSK modulator uses a 2-inch by 2-inch, 25-mil-thick alumina substrate.The design is based on distributed circuit techniques using microstriplinetechnology. Each phase shifter section consists of a PIN diode driver(EMI DD311) which drives two PIN diodes (HP 5082-0001) in shunt parallel. The90-degree, 3-dB hybrids are interdigital Lange couplers wired so that planartopology is facilitated for this design. The combiner network is a Wilkenson-type quarter-wavelength line structure in microstrip.
4.2.9 Intermediate-Power Amplifier (IPA)/High-Power Amplifier (EPA)
Advanced transistor and microwave circuit techniques have been used in thedevelopment of the power amplifier. To achieve maximum efficiency, lowestjunction temperatures (125 0 C), and at least a 10-percent bandwidth over thetemperature range of -21 0 C to +610C, transistors capable of 3.0 GHz operationhave been selected. To ensure reliability, hermetically sealed transistors areused in conjunction with microstripline technology. To achieve 15.1 wattsminimum transistor output power over the temperature range, transistors areefficiently paralleled within the predriver and output stages of the HPA.Combining power stages within the high-power amplifier allows for lowercollector temperatures, less interstage interaction, and reasonable impedancematch. The collector voltage applied to the transistors has been reduced to theregion of 20 volts so that transistor efficiency is optimized.
The IPA/HPA circuit block diasram is shown in Figure 51; the schematic isshown in Figure 52. An intermediate power amplifier is included in this designand acts as a high-gain buffer stage between the QPSK modulator and the high-power Class C amplifier stages. The IPA provides 19 dB of linear gainand delivers 520 mW to a quadrature hybrid to drive a pair of MSC 2302's(predriver). Note that additional buffering (stage isolation) is accomplishedvia the quadrature hybrid (approximately 20 dB). Advantages of this type ofcombining are apparent if the multiplicity effects'of VSWR in interstagematching of medium- and high-power Class C amplifler design are considered(i.e., any change in input impedance to the pair of predrivers due totemperature or device degradation is selected back to the 90-degree hybrid loadand not to the collector of the previous stage). Under worst conditions (baseemitter short circuit at one of the predriver transistors), the isolation to theprevious stage is 6 dB. This corresponds to a VSWR of less than 3:1 as opposedto infinity. Under normal conditions, the pair of predriver transistors willtrack in VSWR over temperature and aging, thus yielding at least 20 dB ofleast 20 dB of isolation betwep !ges (1.2:1 VSWR). Another advantage ofhybrid combining is the "gracef gradation" property of this type of design.Note that if for some reason any one device fails during operation, at leastone-fourth the power is available to drive the subsequent power stage, resultingin reduced power level at the output port but not total RF power loss.
80
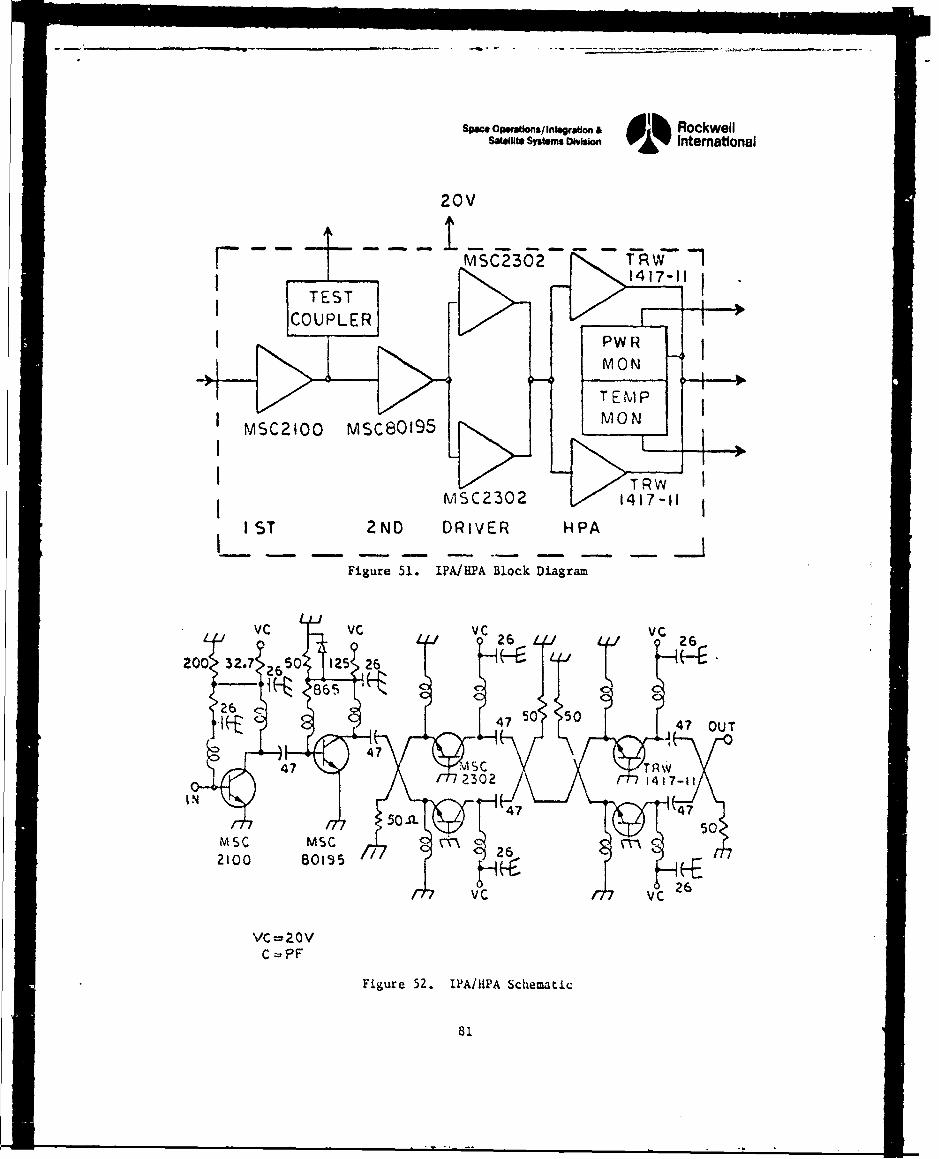
20V
- -- - MSC2302 TRW
>1417-11I
PWRMON
>1 MON
IST - 2ND DRR'ER HPA -
Figure 51. IPA/HPA Block Diagram
'IC IC VC 26 LL C26200 32.7" 50~ 125 26
286
4747 zASCTRm7 230)2147 1
1.4
50 50
2100 SOISS /l
CC VC2
Figure 52. IPA/HPA Schematic
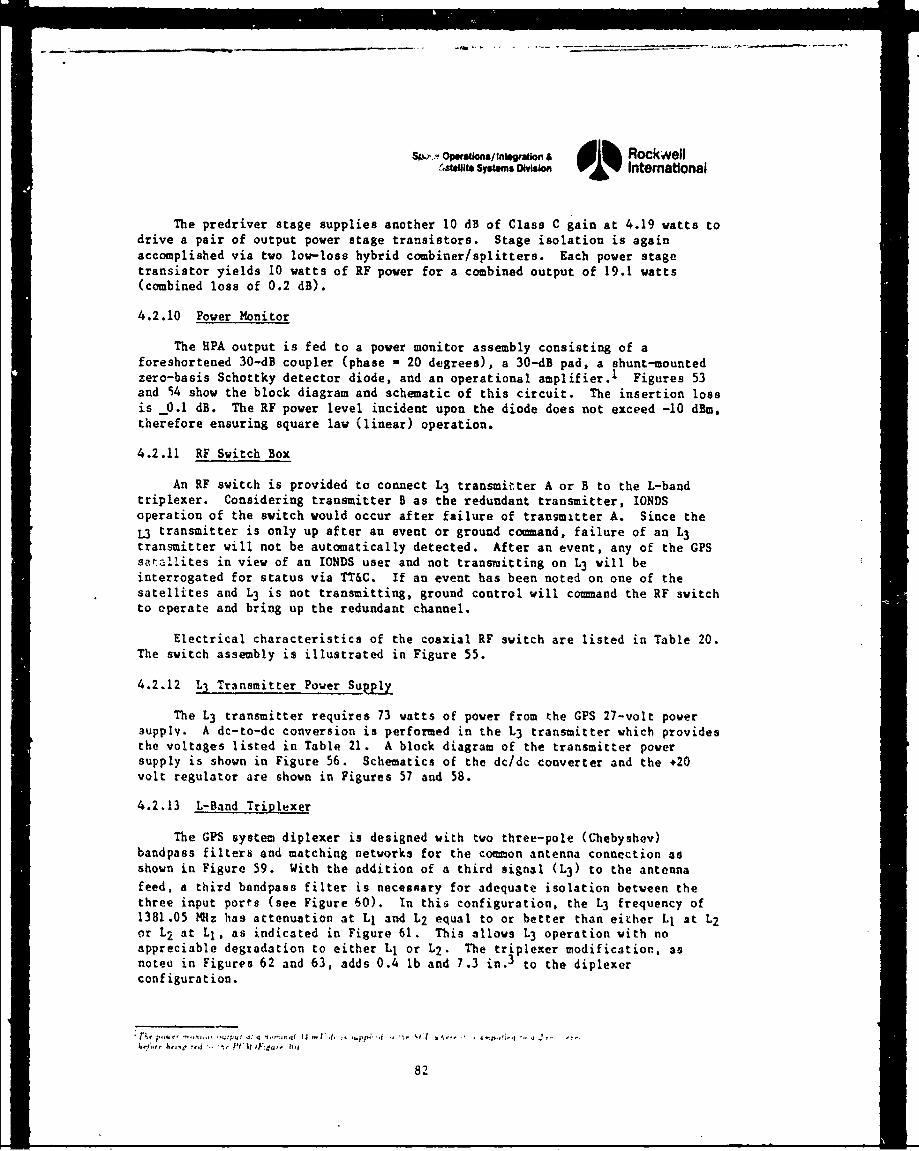
op. stions/naogrMi a I Rock-well'.,W1* syst.m.N OM 0V1 International
The predriver stage supplies another 10 dB of Class C gain at 4.19 watts todrive a pair of output power stage transistors. Stage isolation is againaccomplished via two low-loss hybrid combiner/splitters. Each power stagetransistor yields 10 watts of RF power for a combined output of 19.1 watts(combined loss of 0.2 dW).
4.2.10 Power Monitor
The HPA output is fed to a power monitor assembly consisting of aforeshortened 30-dB coupler (phase - 20 degrees), a 30-dB pad, a shunt-mountedzero-basis Schottky detector diode, and an operational amplifier. 1 Figures 53and 54 show the block diagram and schematic of this circuit. The insertion lossis _0.1 dB. The RF power level incident upon the diode does not exceed -10 dBm,therefore ensuring square law (linear) operation.
4.2.11 RF Switch Box
An RF switch is provided to connect L3 transmitter A or B to the L-bandtriplexer. Considering transmitter B as the redundant transmitter, IONDSoperation of the switch would occur after failure of transmitter A. Since theL3 transmitter is only up after an event or ground comand, failure of an L3transmitter will not be automatically detected. After an event, any of the GPSsai--!Iites in view of an IONDS user and not transmitting on L3 will beinterrogated for status via TT&C. If an event has been noted on one of thesatellites and L3 is not transmitting, ground control will command the RF switchto eperate and bring up the redundant channel.
Electrical characteristics of the coaxial RF switch are listed in Table 20.The switch assembly is illustrated in Figure 55.
4.2.12 L3 Transmitter Power Sup•
The L3 transmitter requires 73 watts of power from the GPS 27-volt powersupply. A dc-to-dc conversion is performed in the L3 transmitter which providesthe voltages listed in Table 21. A block diagram of the transmitter powersupply is shown in Figure 56. Schematics of the dc/dc converter and the *20volt regulator are shown in Figures 57 and 58.
4.2.13 L-Band Triplexer
The GPS system diplexer is designed with two three-pole (Chebyshev)bandpass filters and matching networks for the common antenna connection asshown in Figure 59. With the addition of a third signal (1.3) to the antennafeed, a third bandpass filter is necesnary for adequate isolation between thethree input ports (see Figure 60). In this configuration, the L3 frequency of1381.05 MQlz has attenuation at LI and L2 equal to or better than either LI at L2or L2 at Ll, as indicated in Figure 61. This allows L3 operation with noappreciable degradation to either L1 or L2. The triplexer modification, asnotes in Figures 62 and 63, adds 0.4 lb and 7.3 in. 3 to the diplexerconfiguration.
82
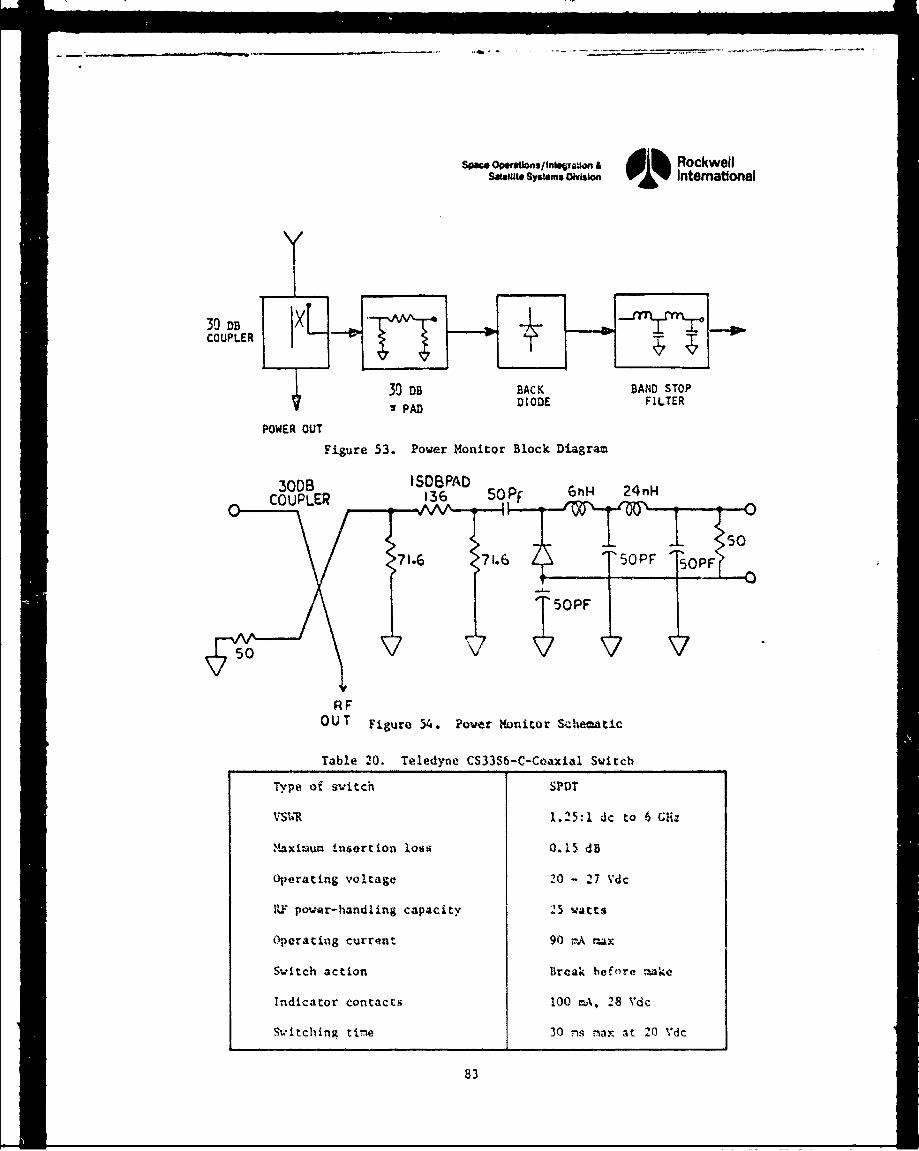
Spa* oestonis/it. on' & i RockwellSmewto Sya.ms, Division Intematlonal
COUPLER
30 DB BACK BAND STOP
I PAD DIODE FILTER
POWER OUT
Figure 53. Power Monitor Block Diagram
30DB ISDBPADCOUPLER 136 50 PF 6hH 24nH
> ... . .SoT T71.6 /j ""5-
"'5OPF ;
RFOUT Figure 54. Power Monitor Schematic
Table 20. Teledyne CS33S6-C-Coaxial Switch
Type of switch SPDT
VS,1.R 1.25:1 dc to 6 GHz
num insertion loss 0.15 dB
Operating voltage 20 - 27 Vdc
I-" power-handling capacity 25 watts
Operating curront 90 A 1=ax
Switch action Break before =ake
Indicator contacts 100 MA, 28 Vdc
Switching time 30 ns max at 20 Vdc
83
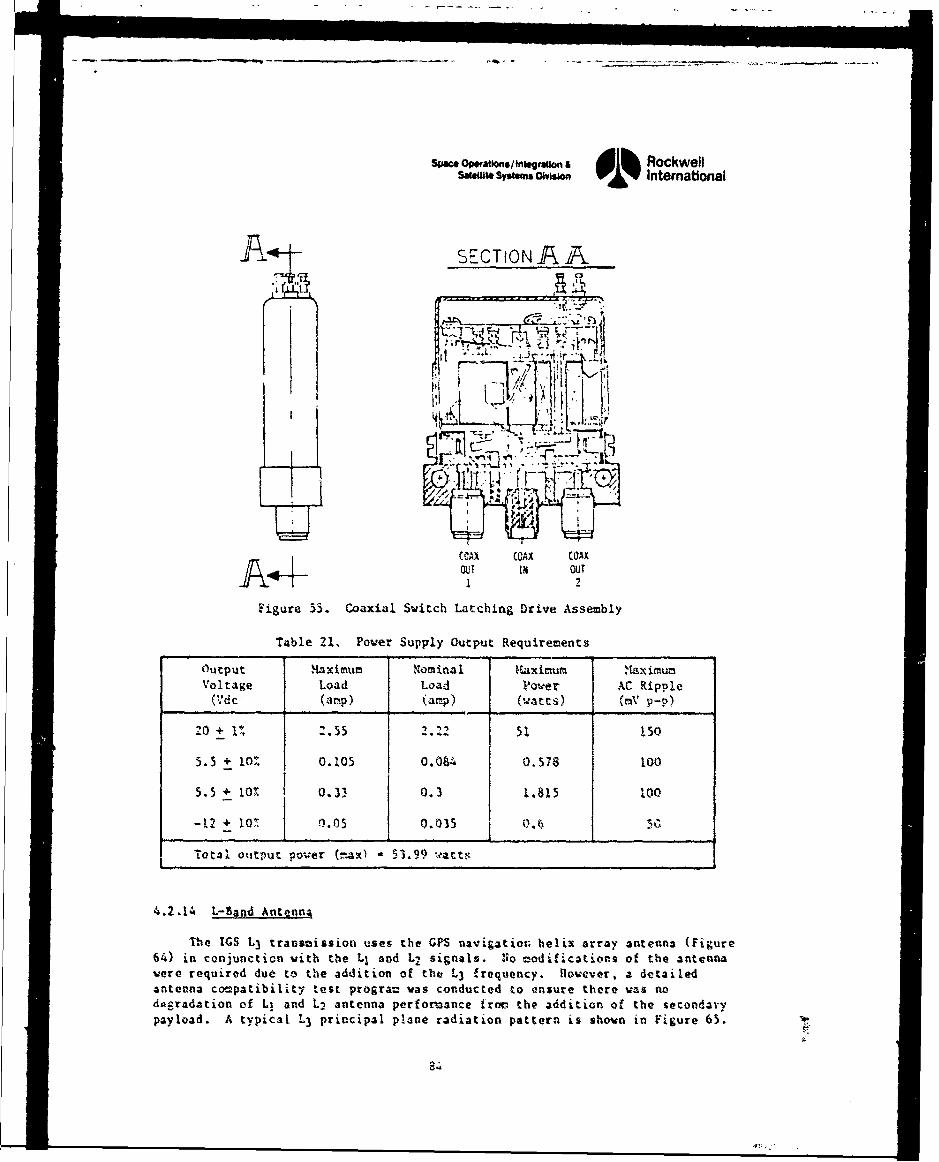
space opations/tnegrs, Au RockwellSRWte sys•t•,M. It'st International
SECTI0N 10 NA
41 .1
Li ip .... --. " _
C OAX COAX COAXOU IN OUT1 2
Figure 55. Coaxial Switch Latching Drive Assembly
Tuble 21, Power Supply Output Requirements
Output ,aximum Nominal ,Laximum MAX imumVoltage Load Load P nter AC Ripple
(Vdc (amp) (Amp) (watts) (mV p-p)
Z0 + IZ 2.55 2.22 51 150
5.5 + 101 0.105 0.044 0.578 100
5.5 + O 0.3I I 0.3 1.815 100
-12 + 1O• { ..05 0.035 016
Total output power (,ax)- 53.99 vattg
4.2.14 L-Band Antenna
The IGS L3 transaission uses the GPS navigation; helix array antenna (Figure64) in conjunction with the Ll and L2 signals. N'o oedifications of the antennawere required due to the addition of tht L3 frequency. However, a detailedantenna cocpatibility test prograz was conducted to ensure there was nodocradation of Li and L2 antenna perfom-ance iron• the addition of the secondarypayload. A typical L3 principal plane radiation pattern is shown in Figure 65.
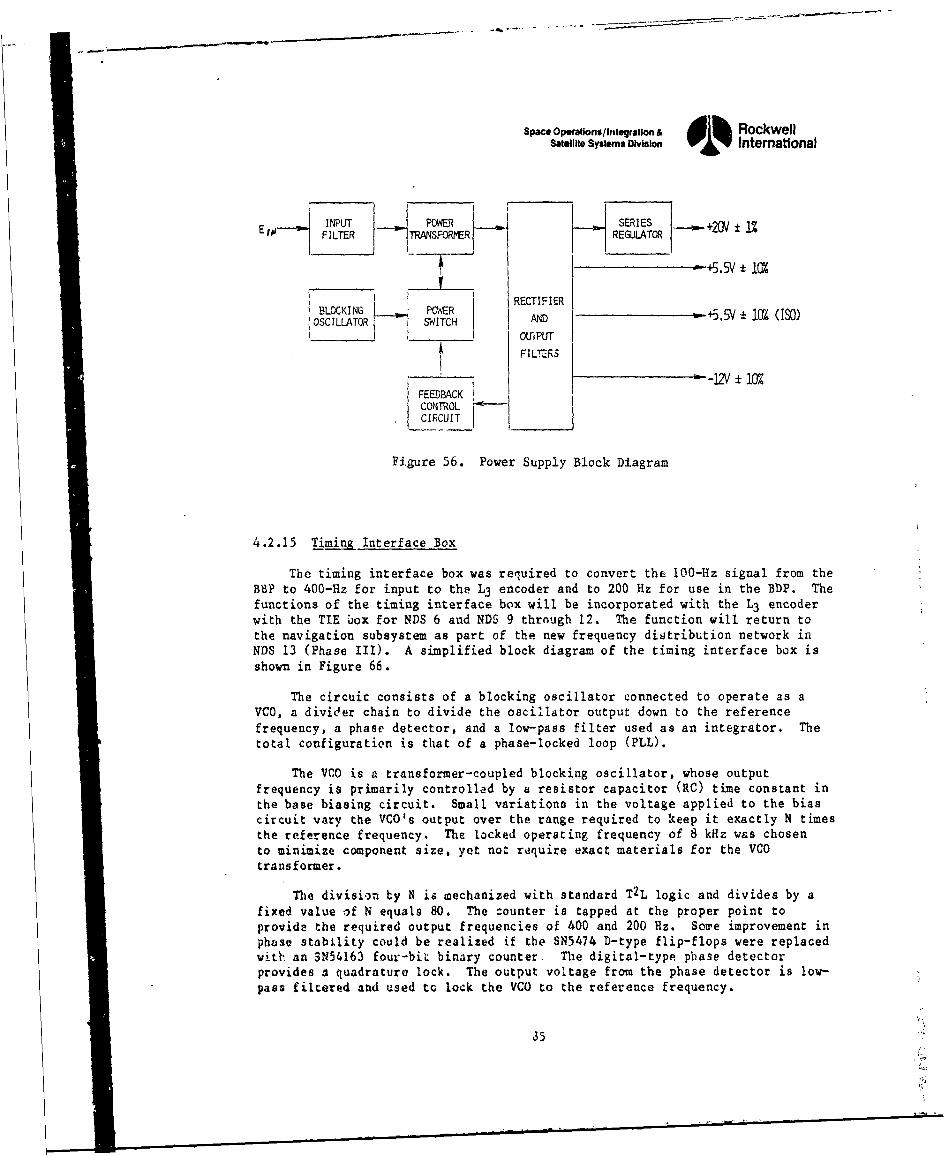
Space Operations/Integration & dih RockwellSatellite Systems Division Intemattonal
INPUT POWER SERIESFILTER TRANSFORMER REGULATOR -
- • +5.5V ± IC
RECTIFIERBLOCKING _swPOWER_____-_,5__
OSC ILLATOR SWITCH AM+.5V *10% (ISO).oLrPUT
FIL.TERS
FEEDBACKCONTROLCIRCUIT
Figure 56. Power Supply Block Diagram
4.2.15 Timing Interface Box
The timing interface box was required to convert the 100-Hz signal from theBUP to 400-Hz for input to the L3 encoder and to 200 Hz for use in the BDlP. Thefunctions of the timing interface box will be incorporated with the L3 encoderwith the TIE box for NDS 6 and NDS 9 thrnugh 12. The function will return tothe navigation subsystem as part of the new frequency distribution network inNDS 13 (Phase III). A simplified block diagram of the timing interface box is
shown in Figure 66.
The circuic consists of a blocking oscillator connected to operate as aVCO, a divider chain to divide the oscillator output down to the referencefrequency, a phase detector, and a low-pass filter used as an integrator. Thetotal configuration is that of a phase-locked loop (PLL),
The VCO is a transformer-coupled blocking oscillator, whose outputfrequency is primarily controlled by a resistor capacitor (RC) time constant inthe base biasing circuit. Small variations in the voltage applied to the biascircuit vary the VCO's output over the range required to keep it exactly N timesthe reference frequency. The locked operating frequency of 8 kHz was chosento minimize component size, yet not require exact materials for the VCOtransformer.
The division ty N is mechanized with standard T2 L logic and divides by a
fixed value of N equals 80. The counter is tapped at the proper point toprovide the required output frequencies of 400 and 200 Hz. Sowe improvement inphase stability could be realized if the SN5474 D-type flip-flops were replacedwith an SN54163 four-biL binary counter. The digital-type phase detectorprovides a quadrature lock. The output voltage from the phase detector is low-pass filcered and used to lock the VCO to the reference frequency.
'35
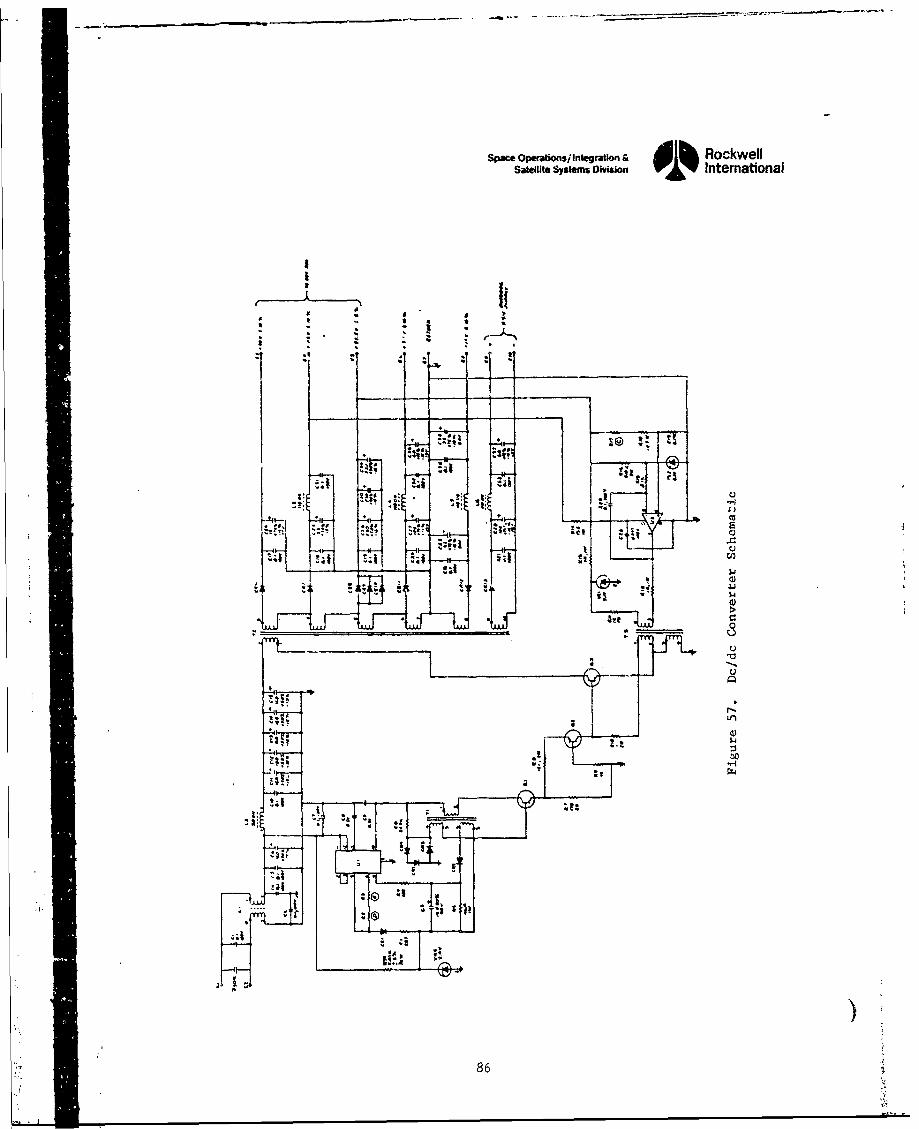
space Operationsitntegration &RockwellSateuito Systems Divsion International
A1 !F - a±.
U)
5-4
>'-
'4) I6
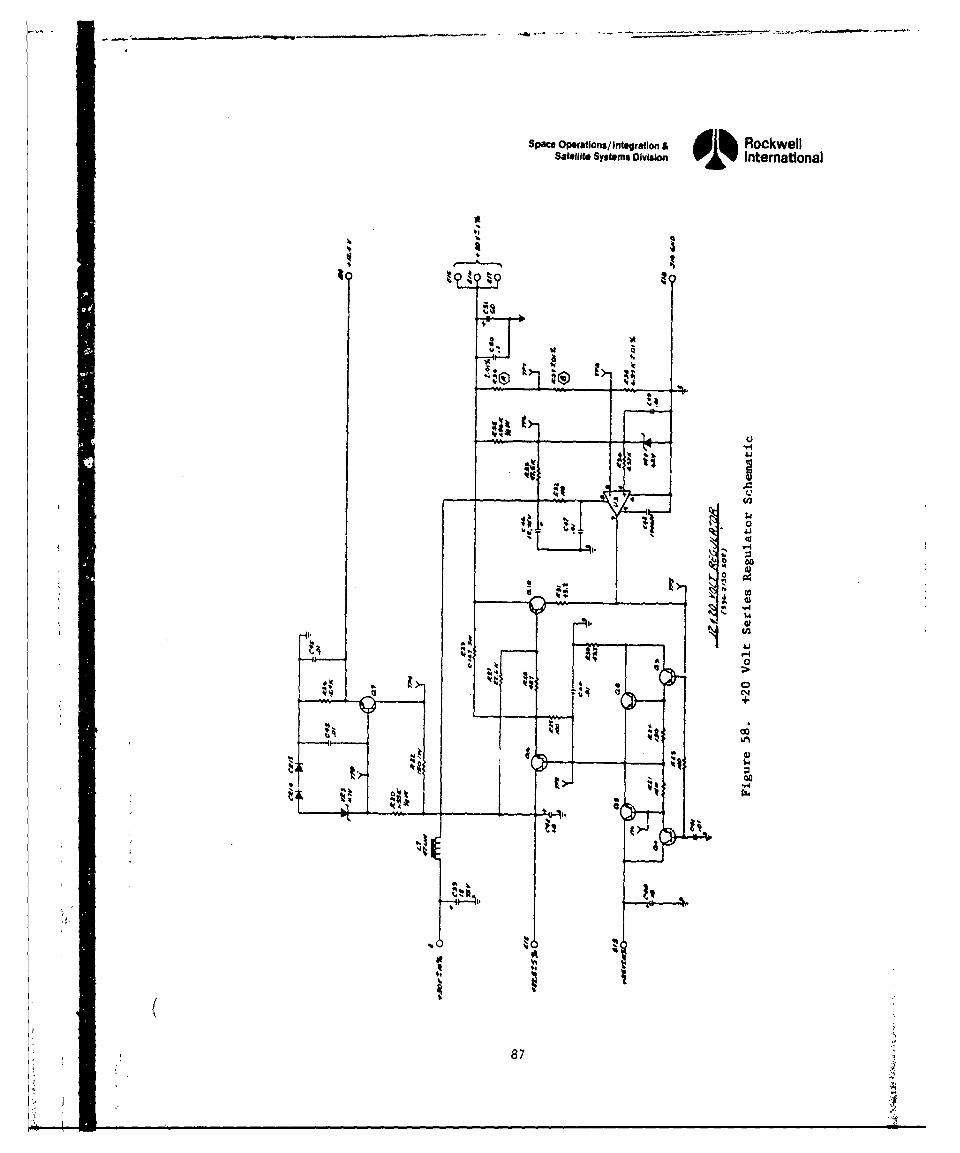
Space Operations/integration & dih RockwellS41e41i. System. Division 0% Intermational
A
to
4Q
44
-'.,. • , •
87 ,;
444
Zo
87~ 1 -
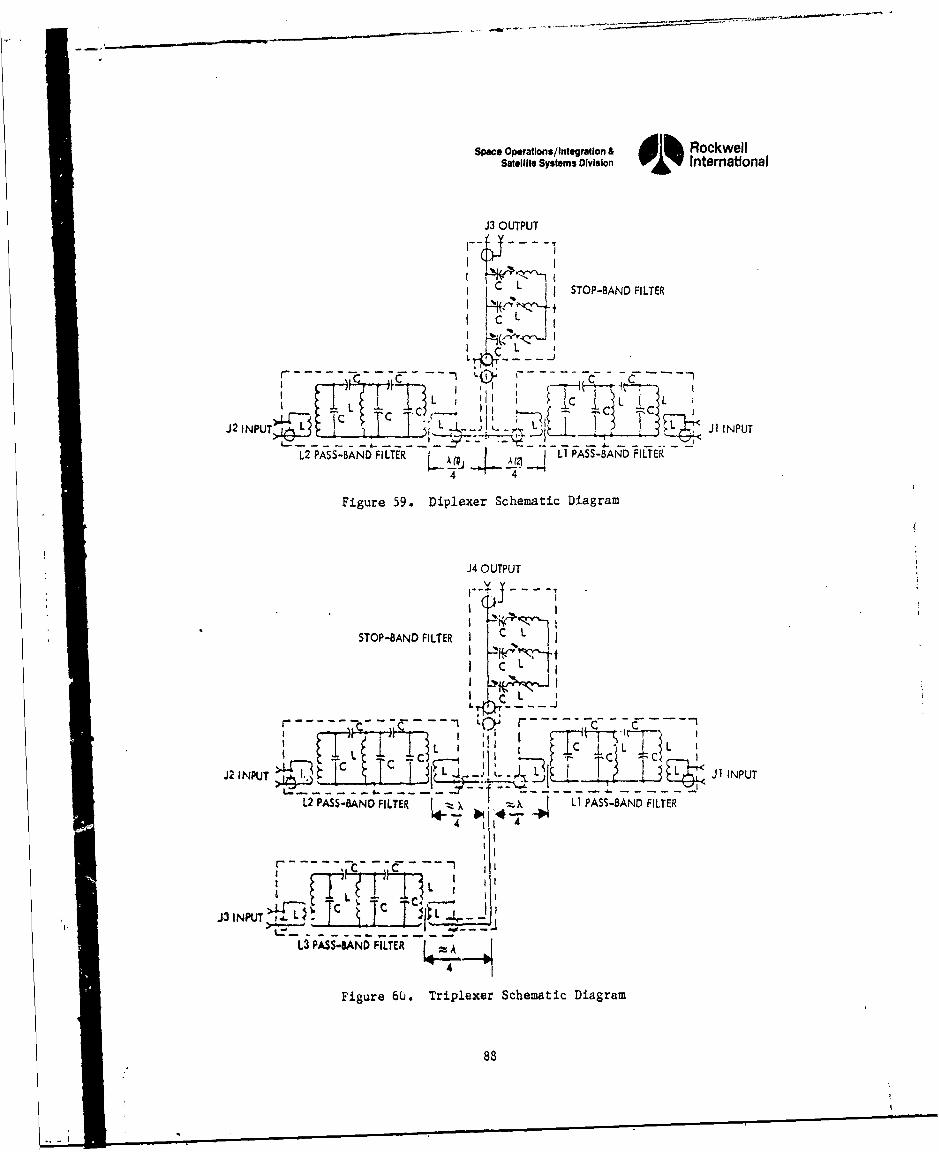
Space Oporations/Integrafion & Alh RockwellSatellite Systems Division W' 4 international
J3 OUTPUT
SC I. STOP-BAND FILTER
C CL
~' C L
Figure 59. Diplexer Schematic Diagram
J4 OUTPUTJi
STOP-BAND FItTER 1 CL
I C
_~~I~ 1C I -C !~PIL~ IJ2 IN1 LjT~~ j~ JJ INPUT
L2 PASS-BAND FILTER 7 x ! LI PASS-BAND FILTER
4 4i
,,
Figure 65. Triplexer Schematic Diagram
8 8
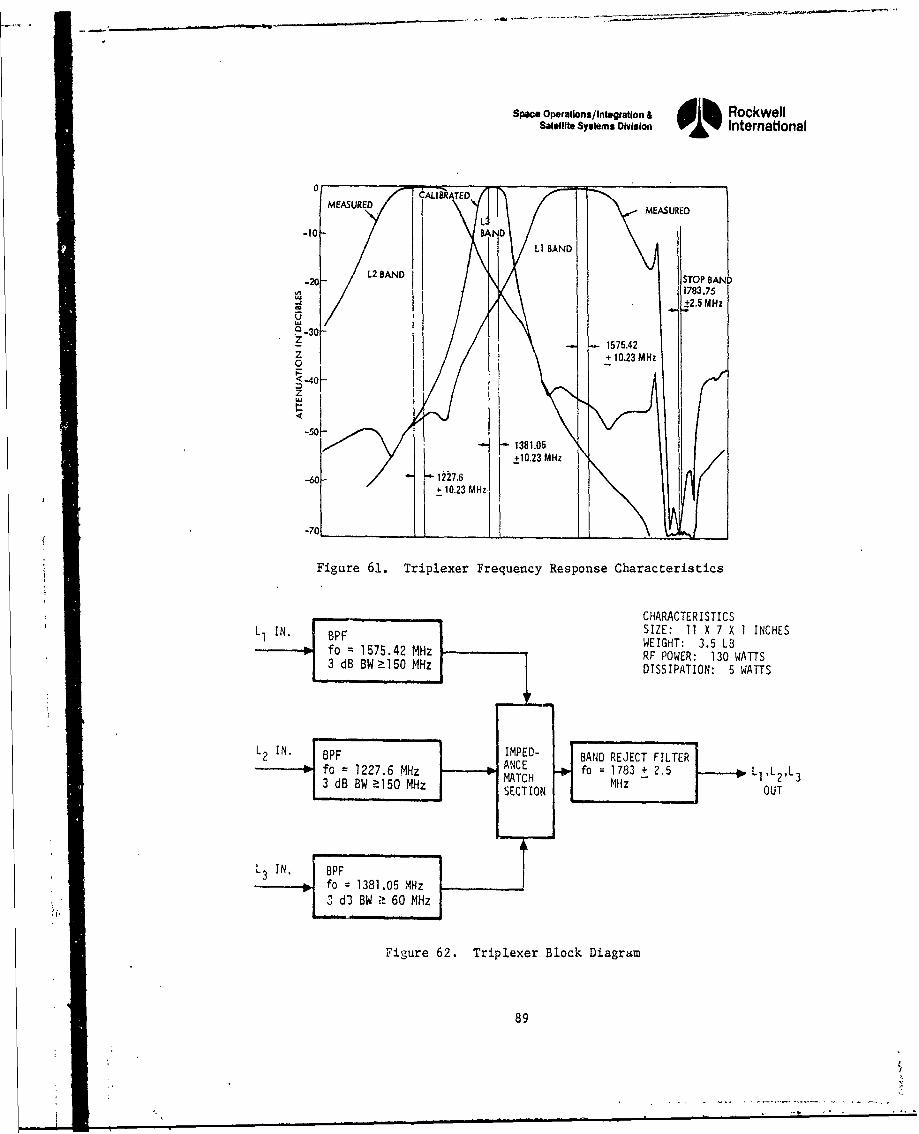
Space Operations/Integration & d lh RockwellSatellite Systems Division International
CARlATEDMEASUREDMEASURED
L-10 BAND
L2 BAND STOP BAND
Z-20 STO 1575N41783.75
I +3±2.5 MHz
O_30-
z I I1575.42
S+ 110.23 MHz
-40 _
-50 1381.05+10.23 MHz
-60-
-70L I_________ ______ _______
Figure 61. Triplexer Frequency Response Characteristics
CHARACTERISTICSLl IN BPFSIZE: 11 X 7 X I INCHESL1 IN. BPF WEIGHT: 3.5 LB
fo 1575.42 MHz RF POWER: 130 WATTS3 dB BW->150 MHz DISSIPATION: 5 WATTS
L2 IN. 8PF IMPED- BAND REJECT FILTER,fo 227.6 MHz ANCE fo 1783 + 2.5 LI,L2 ,L3- 127 MHz MATCH fo 18L2°d BW-~150 MHz SECTION MHz OUT
L3 IN, BPFfo = 1381.05 MHz3 d3 BW . 60 MHz
Figure 62. Triplexer Block Diagram
89
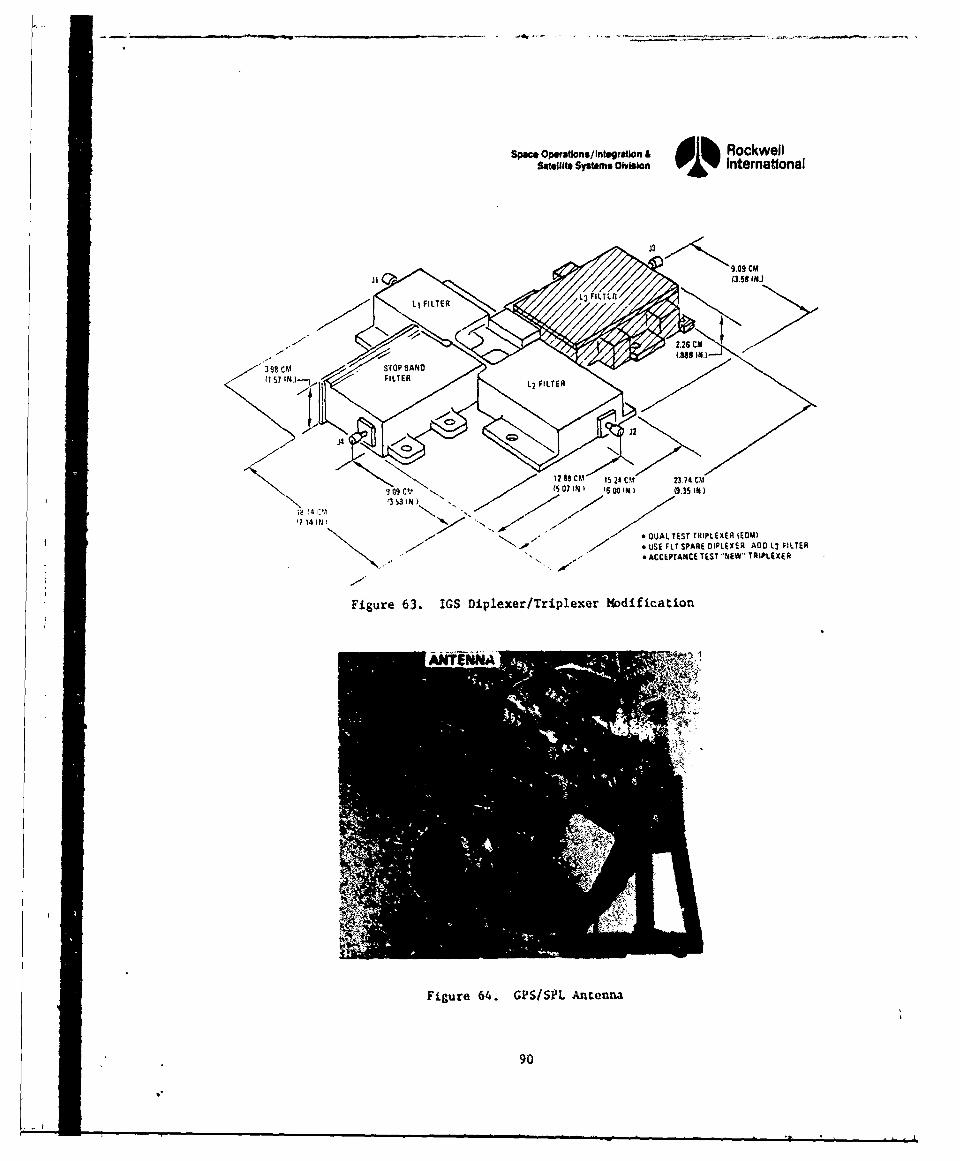
Space Opetstons/l~nhugretionl &l RockwellSateffitt Systems DiviskIn 0 % International
13 ___X 9.09CM
3.98 CI -. STOP $AND
12 asC11 IS24 C" 23174C
1714 IN 77 * DUAL TEST TRIPLEXER (EOM)
-~~~ S A* SE FLT SPARE OIPLE8IER ADD 1,3 FILTER
.ACCEPTANCE TEST -NEW- TRIPLEX( A
Figure 63. IGS Diplexer/Triplexer Modification
Figure 64. GPSISiPL Anenna
90
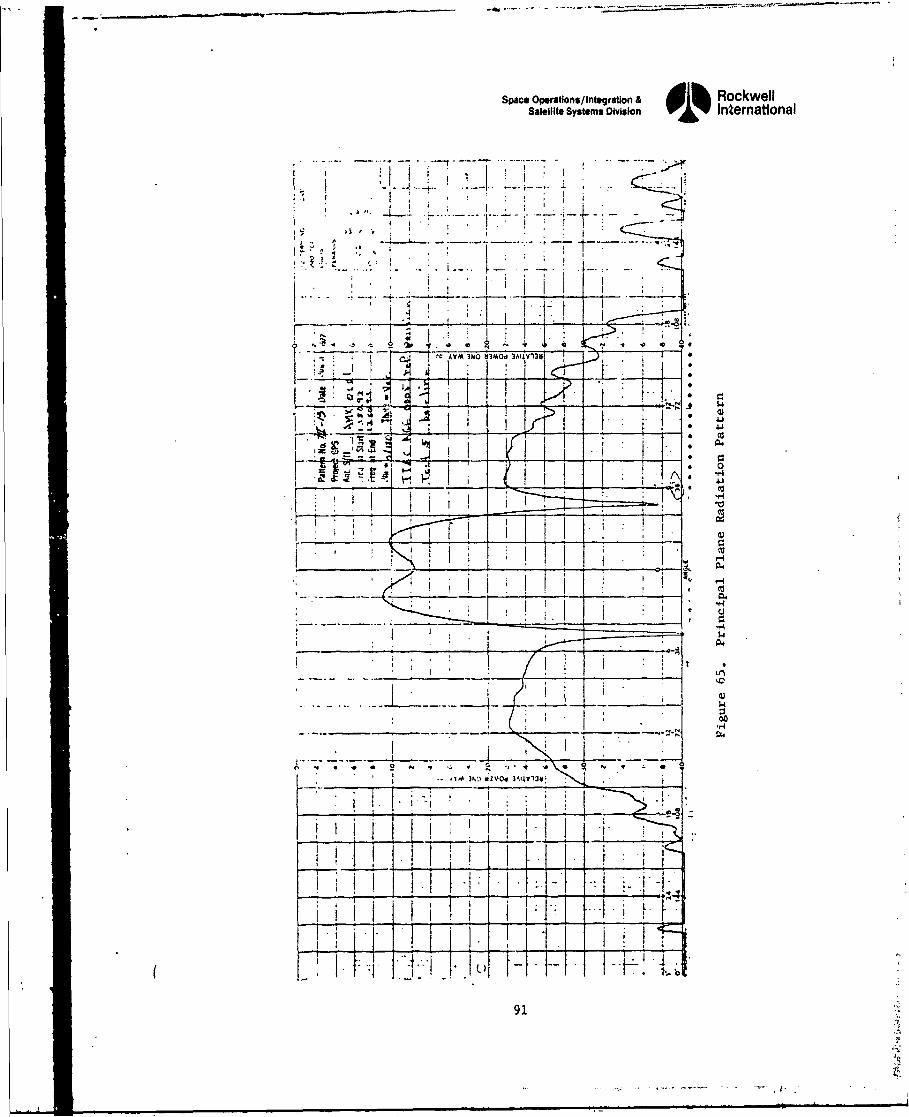
Space Operations/Integration & dlh RockwellSatellite Systems Division International
-, i•
I "" E I ,' I I / ! - .--- -- -'
". ll • " , . i• '. " I , I -
...... _..::d•i k /L K H4 ,.
-"v AV* 3140 PAOd 3Ai 1 13'
-- • , ___I__!__
~~AC • 'A ,.. 9 # , • * : 0! .<, .< i . i "
I, II-i__ -o.. * -_ _ __ _ - • ~ .
- I-
,o
91.
. i .
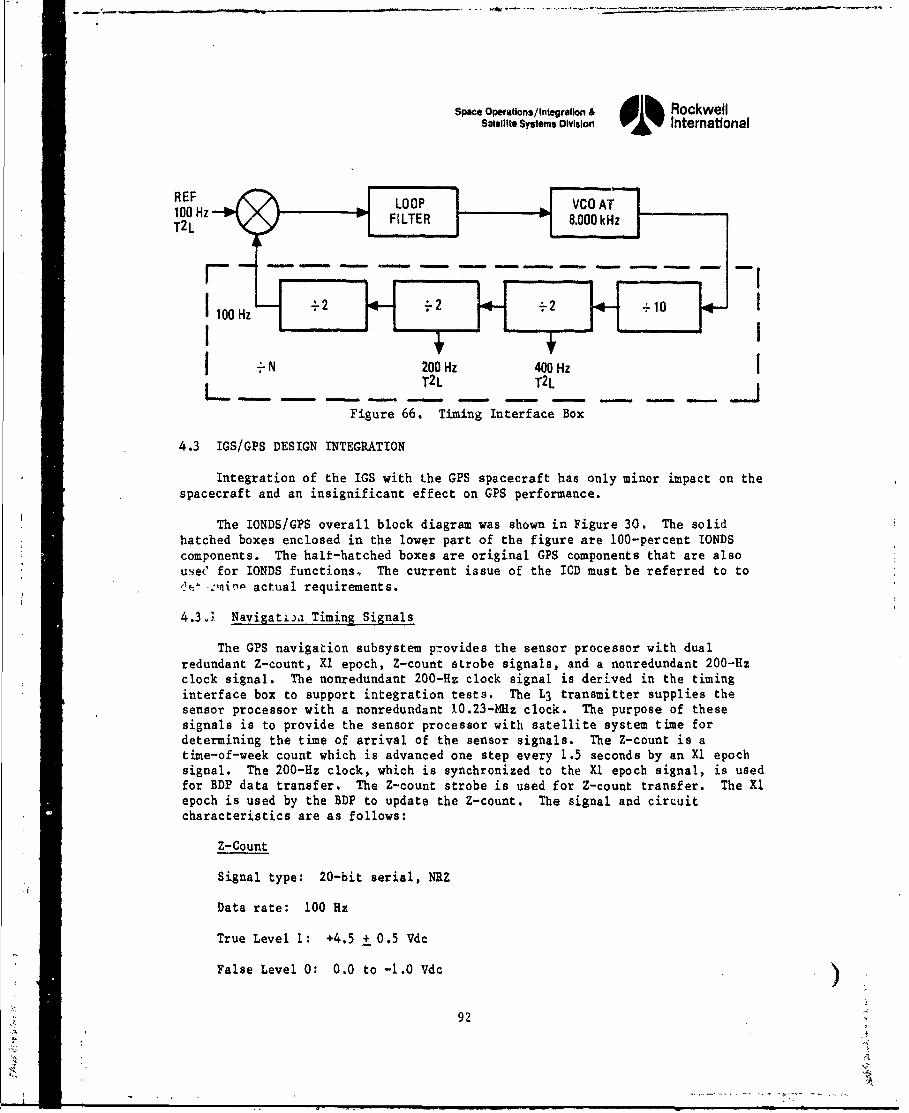
Space Operatlons/Integration & lb RockwellSatellite Systems Division 01% International
REFLOPVOA100REHz-• 1._ FoITE 8.00 v ko zTZL
-00 -H - - - - -. 2 - --0
I 200Hz 400 Hz-_. .. - T21 T2 .L_- - -
Figure 66. Timing Interface Box
4.3 IGS/GPS DESIGN INTEGRATION
Integration of the IGS with the GPS spacecraft has only minor impact on thespacecraft and an insignificant effect on GPS performance.
The IONDS/GPS overall block diagram was shown in Figure 30. The solidhatched boxes enclosed in the lower part of the figure are 100-percent IONDScomponents. The halt-hatched boxes are original GPS components that are alsousee for IONDS functions, The current issue of the ICD must be referred to to'2&-vnii- actual requirements.
4.3.31. Navigatija Timing Signals
The GPS navigation subsystem p:rovides the sensor processor with dualredundant Z-count, Xl epoch, Z-count strobe signals, and a nonredundant 200-Hzclock signal. The nonredundant 200-Hz clock signal is derived in the timinginterface box to support integration tests. The L3 transmitter supplies thesensor processor with a nonredundant 10.23-MHz clock. The purpose of thesesignals is to provide the sensor processor with satellite system time fordetermining the time of arrival of the sensor signals. The Z-count is atime-of-week count which is advanced one step every 1.5 seconds by an Xl epochsignal. The 200-Hz clock, which is synchronized to the Xl epoch signal, is usedfor BDP data transfer. The Z-count strobe is used for Z-count transfer. The X1epoch is used by the BDP to update the Z-count. The signal and circuitcharacteristics are as follows:
Z-Count
Signal type: 20-bit serial, NRZ
Data rate: 100 Hz
True Level 1: +4.5 + 0.5 Vdc
False Level 0: 0.0 to -1.0 Vdc
92
Spac Operatlons/Infgatlon &dih RockwellSatelIt SysIm.s WOO= 01% International
Rise/fall times (between 10% and 90% points): 5 ms maximum
Source impedance: 10 kilohms maximum
Load: 1 kilohm ± 10% in series with low-power Schottky T2L in parallelwith less than 50 pF
Cable and connector: Multiconductor
Xl Epoch
Signal type: Pulse
True level: +4.5 + 0.5 Vdc
False level: 0.0 to -1.0 Vdc
Rise time between 10% and 90% points: 100 us maximum
Fall time between 10% and 90% points: 5 ps maximum
Frequency: 1 per 1.5 sec
Duration: 10 + 0.005 ms
Source impedance: 10 kilohms maximum
Load: 1 kilohn in series with low-power Schottky T2 L in parallel with lessthan 50 pF
Cable and connector: Multiconductor
Z-Count Strobe and 200-41 Clock
Signal type: Clock
Waveshape: Square wave
True level: +4.5 + 0.5 Vdc
False level: 0.0 to -1.0 Vdc (0.0 + 0.5 Vdc from TI box only)
Rise/fail times (between 10% and 902 points): 5 Us =axicuz
Frequency: 100 Us (Z-count strobe, derived from the frequency standard)
200 Uz (clock. synchronized with the Xl epoch and derived fromthe 10.23-MI- frequency standard)
Source inpedance: 10 kilotms maximum (100 11); 50 ohms nacinal (200 itz)
Load: I kilohm 1 10*4 in series with low-power Schottky T2 L in pazallelwith less than 50 pF
93
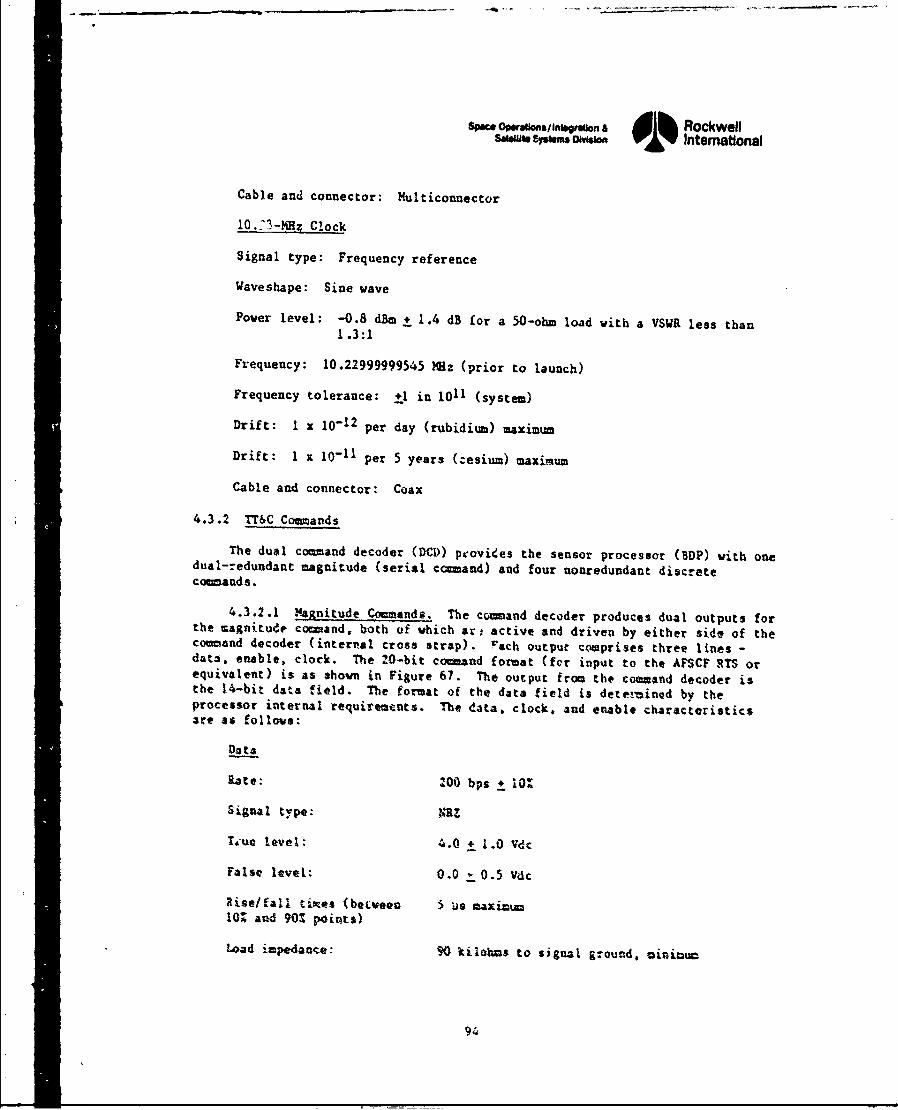
Spec. Opeaon.,.e on A ik RockwellasiUWt. 01% owwiIntemational
Cable and connector: Multiconnector
10.:3-HHz Clock
Signal type: Frequency reference
Waveshape: Sine wave
Pover level: -0.8 dim ± 1.4 dB for a 50-ohm load with a VSWR less than1.3:1
Frequency: 10.22999999545 M1z (prior to launch)
Frequency tolerance: +1 in 1011 (system)
Drift: I x 10-12 per day (rubidium) maximum
Drift: 1 x 10-11 per 5 years (:esium) maximum
Cable and connector: Coax
4.3.2 TT&C Commands
The dual command decoder (DCM) provides the sensor processor (ODP) with onedual-redundant magnitude (serial command) and four nouredundant discretecommands.
4.3.2.1 Hagnitude _Commnds. The command decoder produces dual outputs forthe magnitude command, both of which ar; active and driven by either side of thecommand decoder (internal cross strap). Fach output comprises three lines -data. enable, clock. The 20-bit corand format (for input to the AFSCF RTS orequivalent) is as shown in Figure 67. The output from the command decoder isthe 14-bit data field. The format of the data field is deter'ined by theprocessor internal requirements. The data. clock, and enable characteristicsare as follows:
Data
Rate: 200 bps + 104
Signal ty'pe: 1+Z
Tgue level: 4.0 + 1.0 VdC
False level: 0.0 -0.5 Vdc
Rise/fall tioes (beweec 5 us maxi'nI0Z and 90Z points)
Load impedanee: 90 kilohts to signal ground, minintu
94
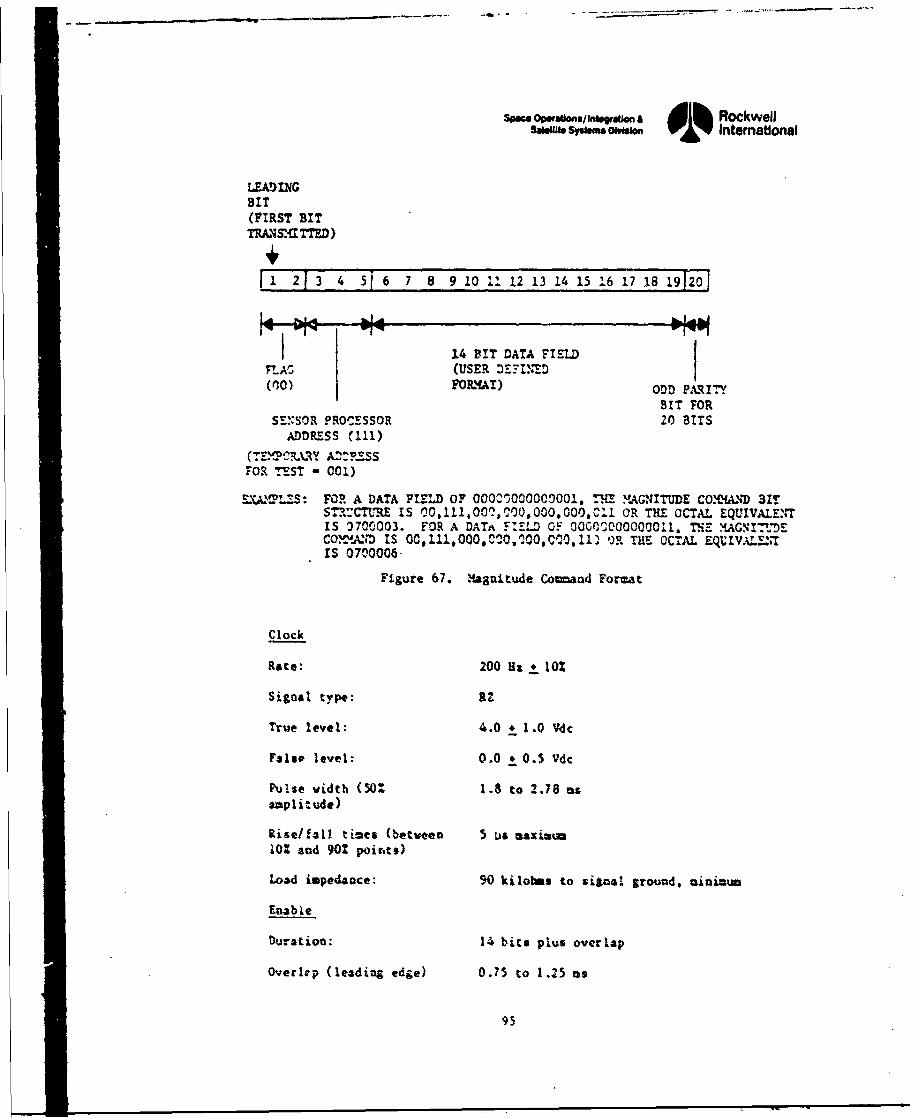
Spac Operaons/tn.sgrauon • d l Rockwell$"%"a omsh International
LEADINGBIT(FIRST BITTHMM(ITTRD)
.1 2 3 4 51 6 7 8 92 13 14.15311576181920
1 14 BIT DATA FIELDFLAG (USER DEYI.ED00 O.)PARIY
BIT FORSE.'SOR PROCESSOR 20 BITS
ADDRESS Cl11)(TE'C OR.ARY A2-" RESS
FOR TEST - 001)
SXX%!?L:S FOR A DATA FIELD OF 000^1000000001, E YMAGN4T1UDE CO.%ftAo.D BITSTf.CTURE IS 00,111,00.Y00,000,000,C1I OR ThE OCTAL EQUIVALETrrIS 3700003. FOR A DAT^ FELD OF 00GO'000000011, n*T EAGNTMCOm.., IS 00.0Q0..O,•00,C•0,11) 'R THE OCTAL EQVIV.A.%T--IS 0700006-
Figure 67. Magnit•die Coman4 Format
Clock
Rate: 200 UH 1 10
Signal type: RZ
True level: 4.0 * 1.0 Vdc
FalIs level: 0.0 * 0.5 Vdc
Pulse vidth (SO 1.8 to 2.78 assaplitude)Rise/-l! tizes (betvcen 5 us maxiatm
10 atsd 90:4 point,)
Load impedacce: 9.0 kilohms to signal ground, miniutm
Enable
Duration: 14 bits plus overlap
Overlrp (leading edge) 0.75 to 1.25 as
95
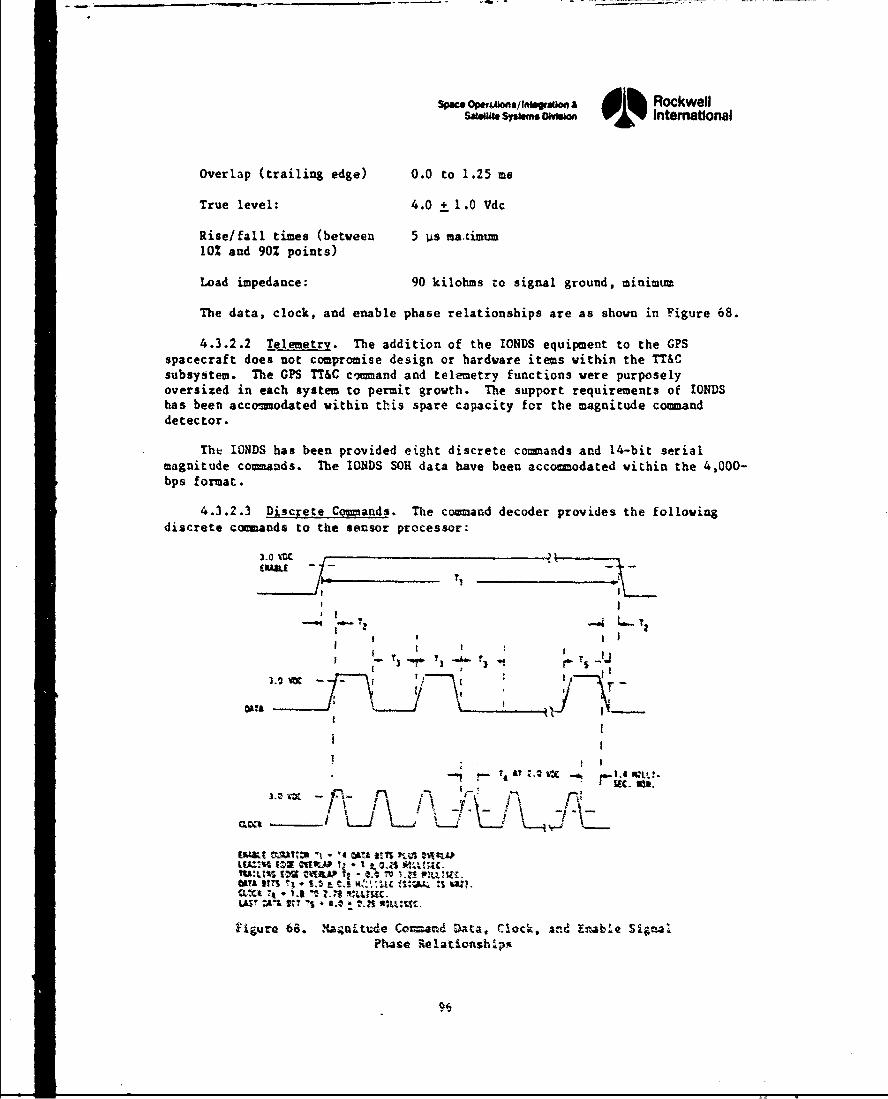
sPa. oa/1nusga,1o"V A dih Rockwellsaaft. SYSt. o.e 01% Intemational
Overlap (trailing edge) 0.0 to 1.25 ms
True level: 4.0 + 1.0 Vdc
Rise/fall times (between 5 4s ma.timtm10% and 90% points)
Load impedance: 90 kilohms to signal ground, minimum
The data, clock, and enable phase relationships are as shown in Figure 68.
4.3.2.2 Telemetry. The addition of the IONDS equipment to the GPSspacecraft does not compromise design or hardware items within the TT&Csubsystem. The GPS TT&C comand and telemetry functions were purposelyoversized in each system to permit growth. The support requirements of IONDShas been acco-nodated within this spare capacity for the magnitude commanddetector.
Tht IONDS has been provided eight discrete comands and 14-bit serialmagnitude comma-ds. The IONDS SOHl data have been accoamodated within the 4,000-bps format.
4.3.2.3 Discrete Co•m•ands. The command decoder provides the followingdiscrete comands to the sensor processor:
OITA
=i -1 L
I "t
W 1P K
a-"TZ.9IMNAIC
Figur 69.oI *'- Co ? nd Data, /n
Phase Relationshaip
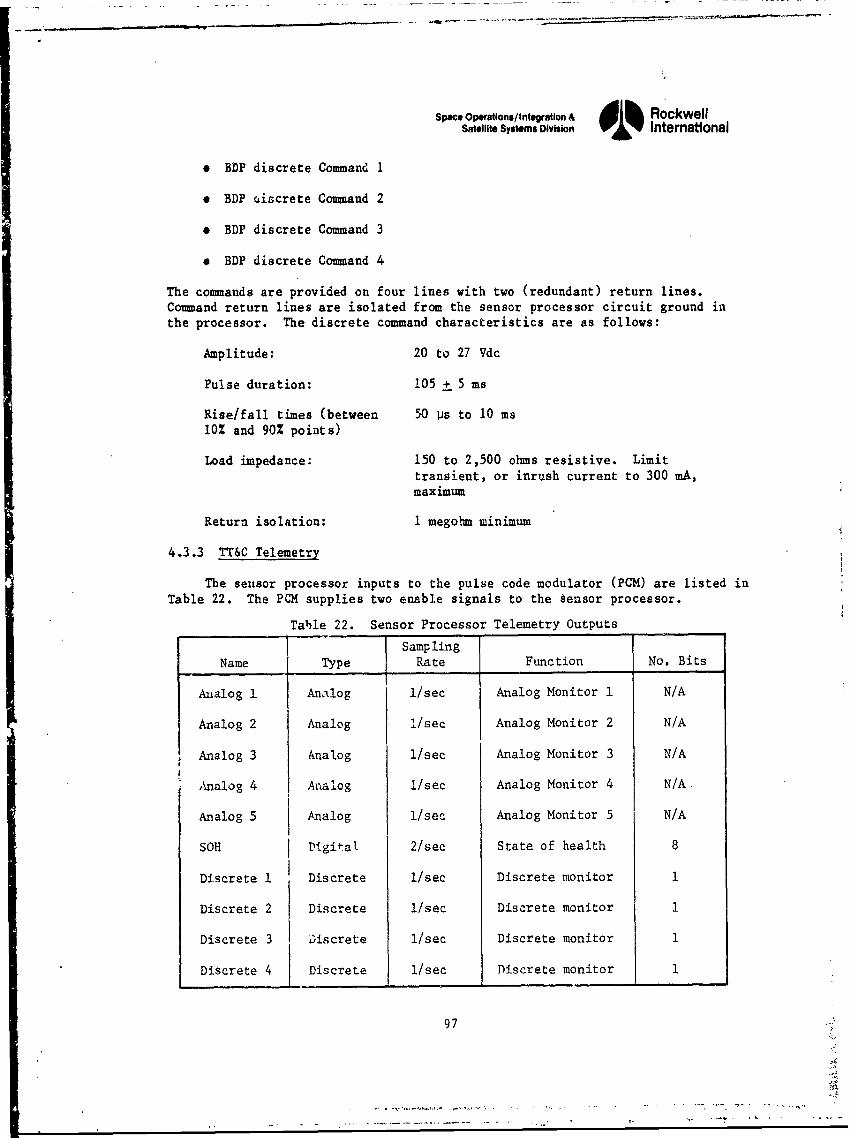
Space Operations/ Integration A d RockwellSatellite Systems Division oi% International
o BDP discrete Command 1
* BDP uiscrete Command 2
# BDP discrete Command 3
* BDP discrete Command 4
The commands are provided on four lines with two (redundant) return lines.Command return lines are isolated from the sensor processor circuit ground inthe processor. The discrete command characteristics are as follows:
Amplitude: 20 to 27 Vdc
Pulse duration: 105 + 5 ms
Rise/fall times (between 50 Ps to 10 ms102 and 90% points)
Load impedance: 150 to 2,500 ohms resistive. Limittransient, or inrush current to 300 mA,maximum
Return isolation: 1 megohm minimum
4.3.3 TT&C Telemetry
The sensor processor inputs to the pulse code modulator (PCM) are listed inTable 22. The PCM supplies two enable signals to the bensor processor.
Tahle 22. Sensor Processor Telemetry Outputs
SamplingName Type Rate Function No. Bits
Analog I Analog 1/sec Analog Monitor 1 N/A
Analog 2 Analog I/sec Analog Monitor 2 N/A
Analog 3 Analog 1/sec Analog Monitor 3 N/A
Analog 4 Analog 1/sec Analog Monitor 4 N/A
Analog 5 Analog 1/sec Analog Monitor 5 N/A
SOH Digital 2/sec State of health 8
Discrete 1 Discrete 1/sec Discrete monitor 1
Discrete 2 Discrete 1/sec Discrete monitor 1
Discrete 3 Discrete 1/sec Discrete monitor 1
Discrete 4 Discrete 1/sec Discrete monitor 1
97
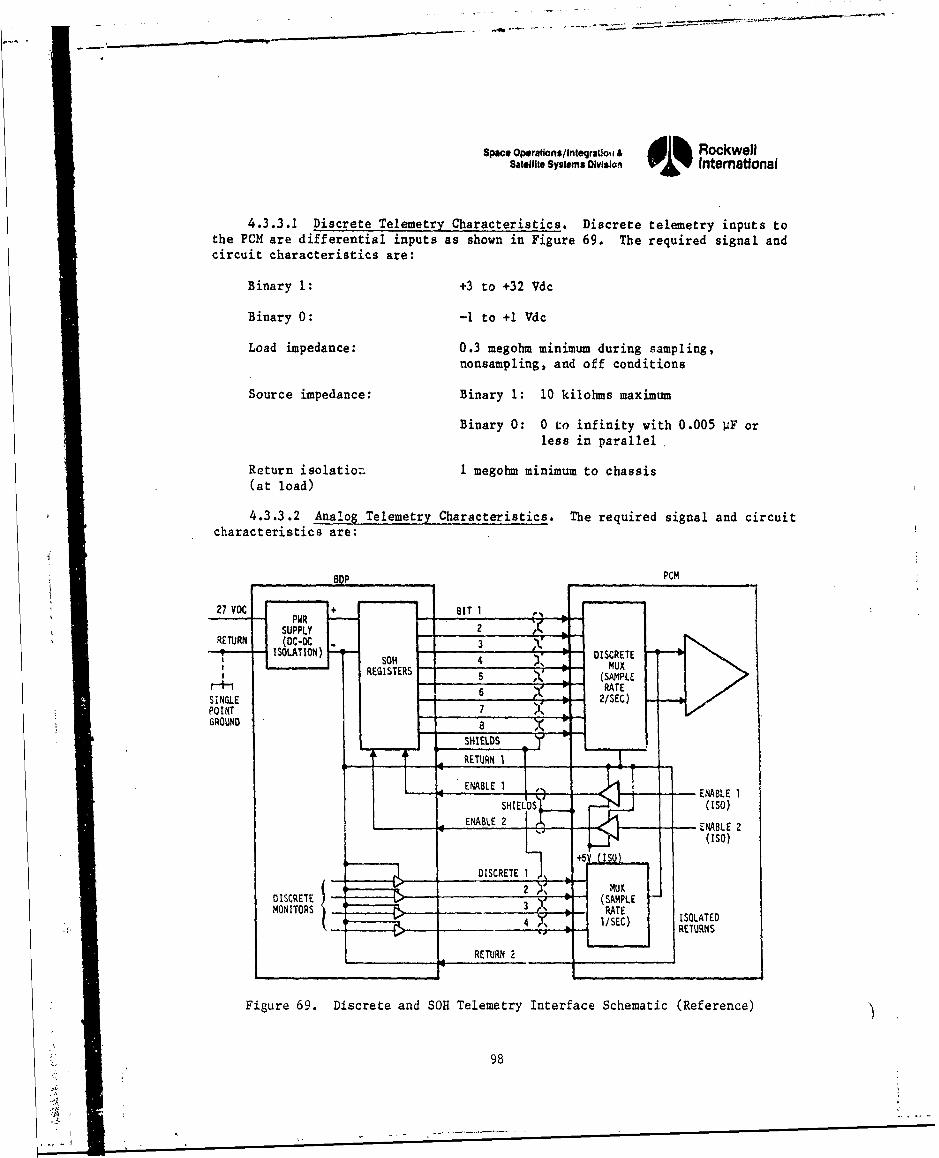
Space Operatlons/InlegralUoi & RockwellSatellite Systems Divisiom 'ilv •Intemational
4.3.3.1 Discrete Telemetry Characteristics. Discrete telemetry inputs tothe PCM are differential inputs as shown in Figure 69. The required signal andcircuit characteristics are:
Binary 1: +3 to +32 Vdc
Binary 0: -1 to +1 Vdc
Load impedance: 0.3 megohm minimum during sampling,nonsampling, and off conditions
Source impedance: Binary 1: 10 kilohms maximum
Binary 0: 0 to infinity with 0.005 PF orless in parallel
Return isolatio. I megohm minimum to chassis(at load)
4.3.3.2 Analog Telemetry Characteristics. The required signal and circuitcharacteristics are:
SOP PCM
27 VDC P + BIT 1I"-' "
SUPPLY2
RETURN (DC.DC 3,,9ISOLATION) DISCRETE
' SOH 4MUSREGISTERS MUX
Fig (ScIPLESiN6 RA•TE
SNL 2/SEC)POIN 7 >GROUND X
SHIELDS6 -TRETURN IT• "
L 4 ENABLE 1 VI-EABLE ISHIELDOS (ISO)
SENABE 2 -- ENABLE 2L (ISO)
DISCRETE 3 (SAMPLEMONITORS 3RATE
4 •iI/SC ISOLATEDx-x---RETURNS
L- - ldý RETURN 2
Figure 69. Discrete and SOH Telemetry Interface Schematic (Reference)
98
. -.-...--.-..- ,-,--
Space Oporations/Integratilon A AlSh RockwellSatellite Systems olvi•gln international
Voltage range: 0.0 to 5.12 Vdc
Input frequency range forvariable signals: Dc to 16 Hz
Load impedance: 10 -aegohms minimum during sampling, and100 megohms minimum during nonsampling andoff conditions
Source impedance: Less than 5,000 ohms in parallel with lessthan 0.001 pF
Return isolation: 1 megohm minimum to chassis(at load)
4.3.3.3 SOB Telemetry. The SOH data are contained in two 8-bit wordsspaced four subfromes apart in the SGLS telemetry (PCM) format. The SOB dataare available for transfer from the sensor processor to the PCM unit when theenable gate is high. Updating of the SOB data is inhibited during the transferperiod.
Data Read Rate. The enable gates are high for one bit either side of eachPCM word (i.e., each enable is 10 bits long). The enable gates are present whenthe PCM is turned on. When the turn-on period is terminated, the PCM remains onuntil the end of the current ma3ter frame. The expected turn-on period is fiveminutes per day for each vehicle. The PCM sampling rate is 4,000 or 500 bps(the same as the selected transmission rate). The 16 data bits are transmittedto the ground stations once each second or once each 8 seconds (there are 4,096bits in a muster frame).
PCM Input. The SOR data is supplied to the PCM as eight differentialinputs (sampled twice a master frame). The required signal and circuitcharacteristics are the same as those for discrete telemetry inputs.
Enable Gates. The PCM provides two enable gates per master frame. Therequired characteristics are:
Wave form: Positive re.tangular pulse
On level: +4.5 ± 1.0 Vdc
Off level: 0.0 + 0.5 Vdc
Output impedance: 500 ohms maximum
Load impedance: Greater than 10 kilohms in parallel with0.005 pF or less
Rise/fall times: 5 ws maximum
(between 10% and90% points)
99
I.
• ,-"
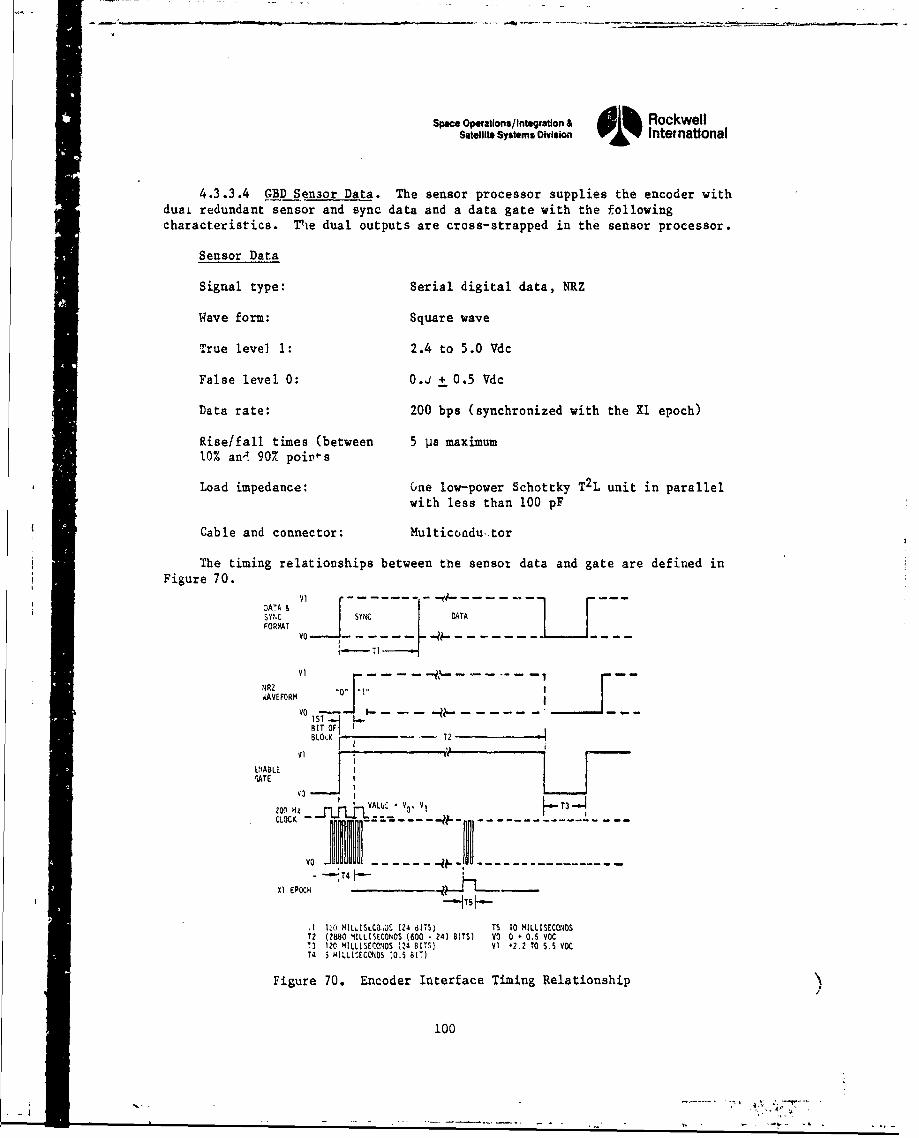
SpWce Op•Iations/Interatlon & dlb RockwellSatellite Systems Division V4,1V International
4.3.3.4 GBD Sensor Data. The sensor processor supplies the encoder withdua. redundant sensor and sync data and a data gate with the followingcharacteristics. The dual outputs are cross-strapped in the sensor processor.
Sensor Data
Signal type: Serial digital data, NRZ
Wave form: Square wave
True level 1: 2.4 to 5.0 Vdc
False level 0: 0.j + 0.5 Vdc
Data rate: 200 bps (synchronized with the Xl epoch)
Rise/fall times (between 5 jis maximum10% anA. 90% poip-s
Load impedance: One low-power Schottky T2 L unit in parallel
with less than 100 pF
Cable and connector: Multicoadu-,tor
The timing relationships between the sensor data and gate are defined inFigure 70.
DA-A &
jSYN.C SYNC DATAFORMAT
Vo --
N RZ"1I4AVEFORM I
Vo- - -
BIT
EN'ABLErATE I
200 H .VALUL V V I VT3CLOCK, ..
vo JIM -....-..-Jfl0-;T4I-.II--,1 EPOCH
,I O MIL .St.C(4,) (24 dITS) TS 10 MILLISECONDST2 (2880 MILLISECONDS (600 - 24) BITS) VO 0 - 0.5 VOCT3 120 MILLISECONDS 14 BITS) VI *2.2 TO 5.5 VOCT4 i MILLI'ECOtS :0.5 BIT)
Figure 70. Encoder Interface Timing Relationship )
100
- .- -. - . ----..-.--- -- - - -. - .L
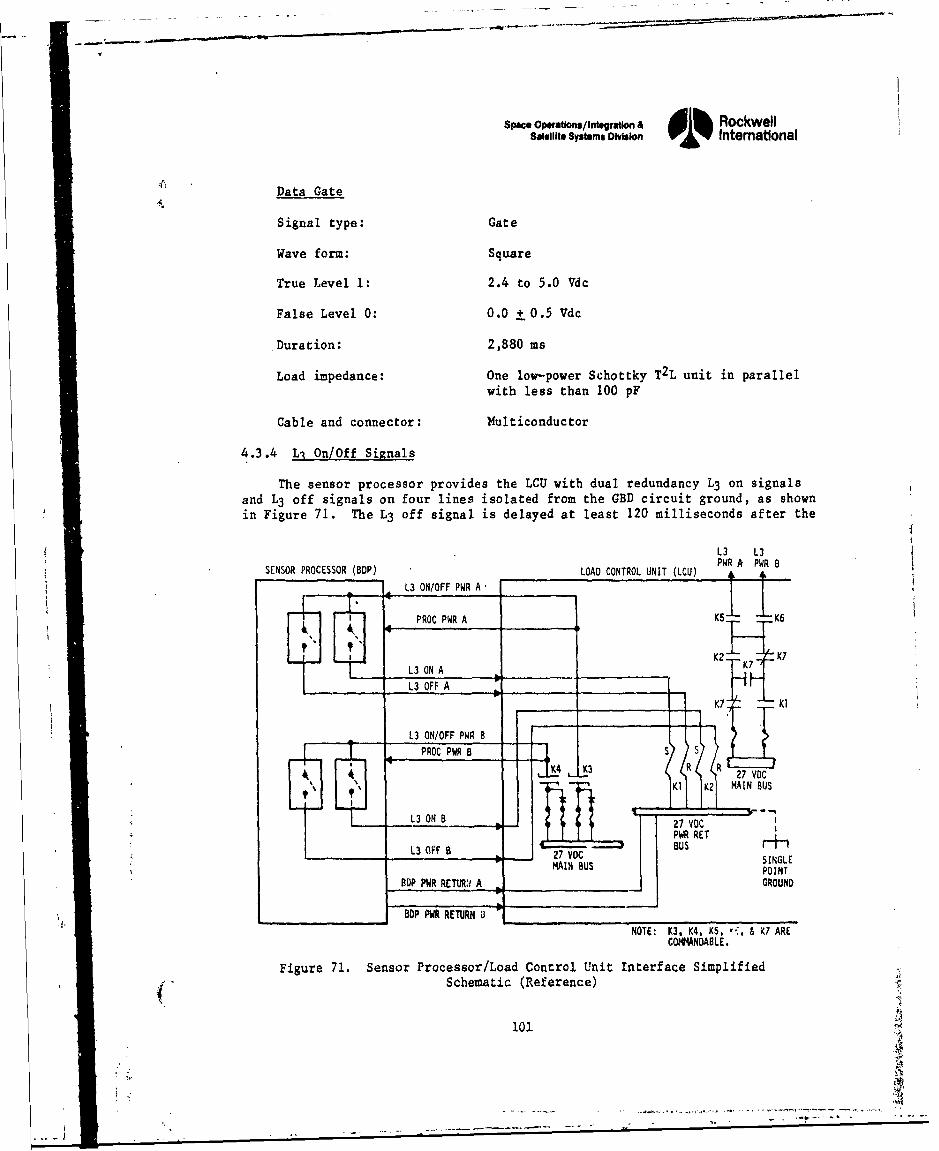
Space Operatlons/intgration RockwellSatellite Systems Division 0 % Intemational
Data Gate
Signal type: Gate
Wave form: Square
True Level 1: 2.4 to 5.0 Vdc
False Level 0: 0.0 t 0.5 Vdc
.Duration: 2,880 ms
Load impedance: One low-power Schottky T2L unit in parallelwith less than 100 pF
Cable and connector: Multiconductor
4.3.4 Li On/Off Signals
The sensor processor provides the LCU with dual redundancy L3 on signalsand L3 off signals on four lines isolated from the GBD circuit ground, as shownin Figure 71. The L3 off signal is delayed at least 120 milliseconds after the
L3 L3PWR A PWR 8
SENSOR PROCESSOR (BOP) LOAD CONTROL UNIT (LCU) 4A ...
L3 ON/OFF PWR A
PROC PWR A K5 1 'K6
K2 K7
13 ON A K
L3 OFF AK7 KI
L3 ON/OFF PWR 8
.PROC PWR 8T S
X4K3 R R4 *27 VOC
tý4KI K2 MAIN BUS
ON3 OB 27 VOC
L3 OF ~ __ 2 VOCPWR RET2 VSINGLEMAIN BUS POINT
BOP PWR RETURNf A _,._GROUND
BOP NWR RETURN 3NOTE: K3, K4, KS,. " K7 ARE
COMPANDABLE.
Figure 71. Sensor Processor/Load Control Unit Interface Simplified"Schematic (Reference)
101
'" . . . -, - . -.- . S.
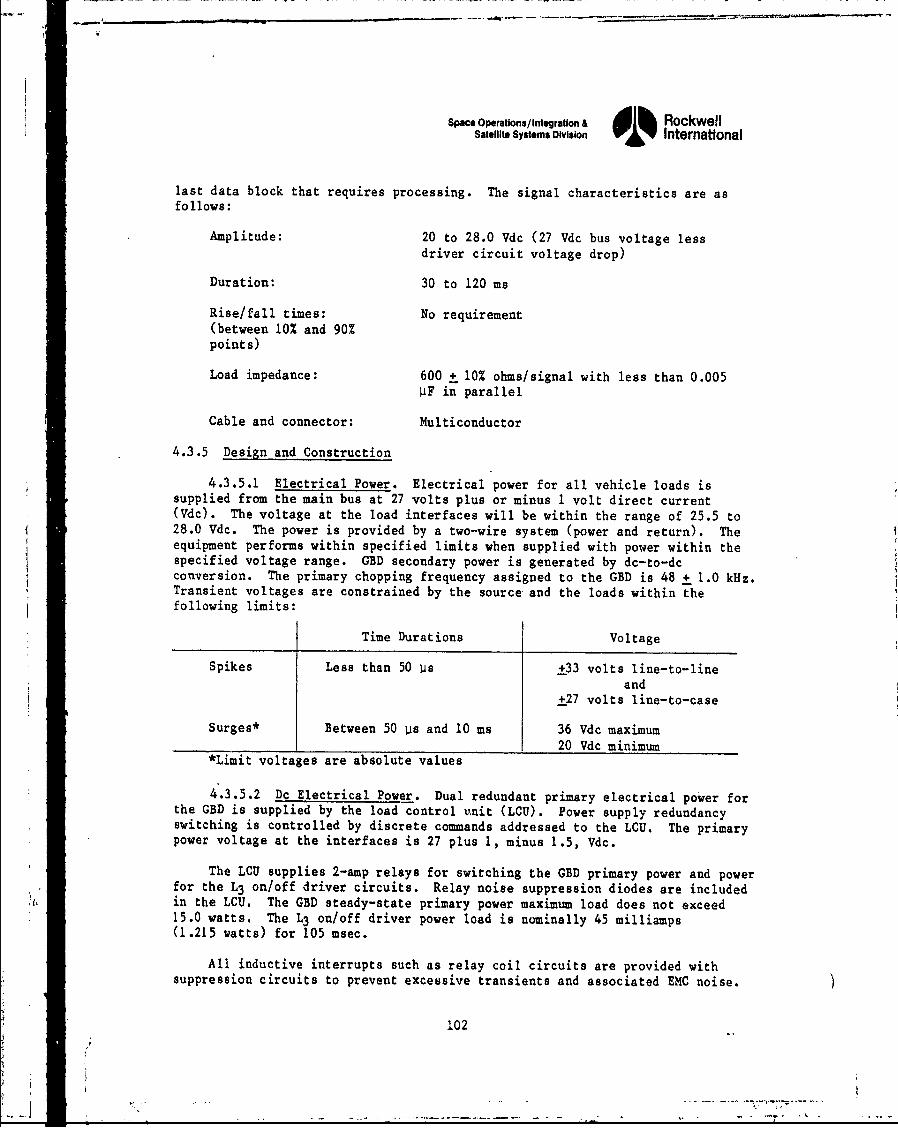
Space Operations/Integration & dl RockwellSatellite Systems Division 01% International
last data block that requires processing. The signal characteristics are asfollows:
Amplitude: 20 to 28.0 Vdc (27 Vdc bus voltage less
driver circuit voltage drop)
Duration: 30 to 120 ms
Rise/fall times: No requirement(between 10% and 90%points)
Load impedance: 600 + 10% ohms/signal with less than 0.005PF in parallel
Cable and connector: Multiconductor
4.3.5 Design and Construction
4.3.5.1 Electrical Power. Electrical power for all vehicle loads issupplied from the main bus at 27 volts plus or minus 1 volt direct current(Vdc). The voltage at the load interfaces will be within the range of 25.5 to28.0 Vdc. The power is provided by a two-wire system (power and return). Theequipment performs within specified limits when supplied with power within thespecified voltage range. GBD secondary power is generated by dc-to-dcconversion. The primary chopping frequency assigned to the GBD is 48 + 1.0 kHz.Transient voltages are constrained by the source and the loads within thefollowing limits:
Time Durations Voltage
Spikes Less than 50 ps +33 volts line-to-lineand
+27 volts line-to-case
Surges* Between 50 .s and 10 ms 36 Vdc maximum1 _20 Vdc minimum
*Limit voltages are absolute values
4.3.5.2 Dc Electrical Power. Dual redundant primary electrical power forthe GBD is supplied by the load control unit (LCU). Power supply redundancyswitching is controlled by discrete commands addressed to the LCU. The primarypower voltage at the interfaces is 27 plus 1, minus 1.5, Vdc.
The LCU supplies 2-amp relays for switching the GBD primary power and powerfor the L3 on/off driver circuits. Relay noise suppression diodes are includedin the LCU. The GBD steady-state primary power maximum load does not exceed15.0 watts. The L3 on/off driver power load is nominally 45 milliamps(1.215 watts) for 105 msec.
All inductive interrupts such as relay coil circuits are provided withsuppression circuits to prevent excessive transients and associated EMC noise.
102
-- .- - -.-- i--..---- . . . . . .. .-- .
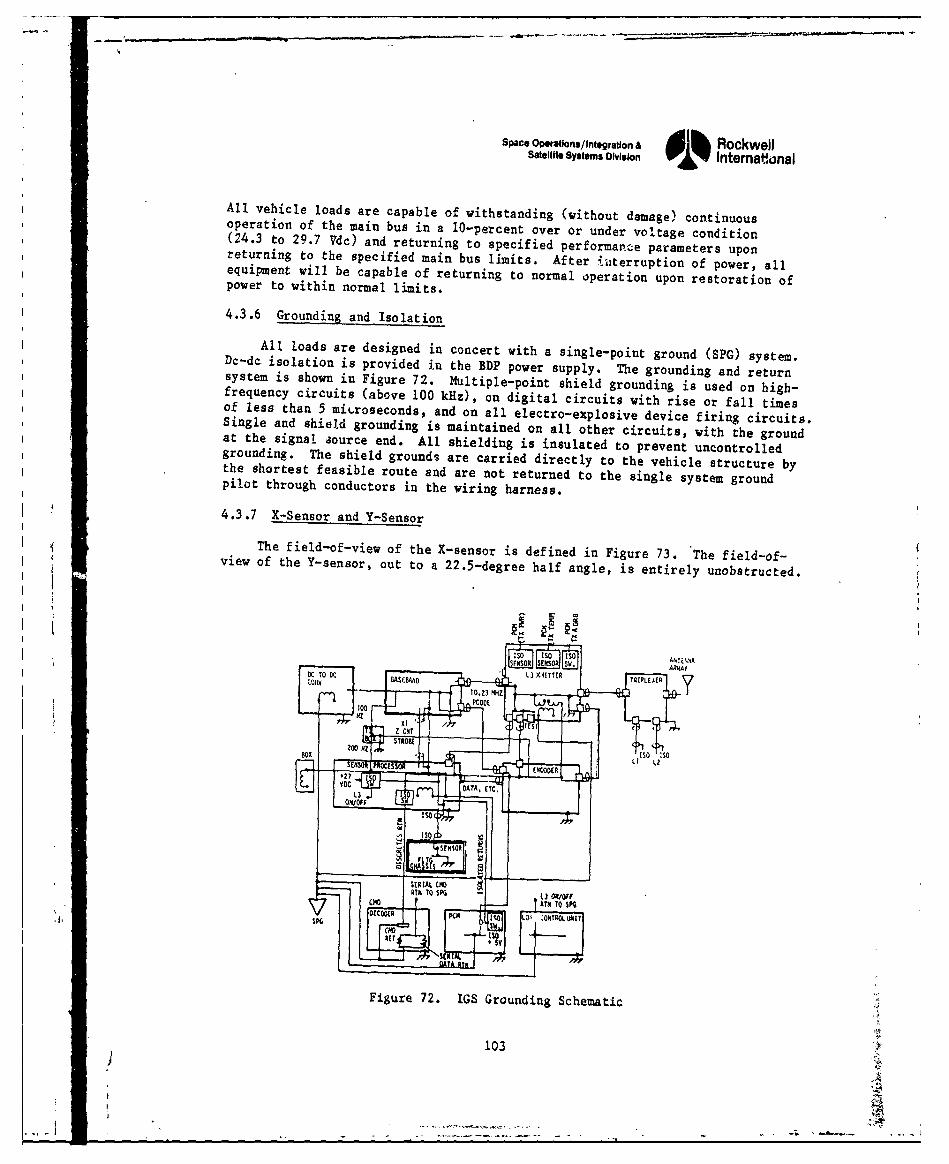
Space OPerations/Integration & dlh RockwellSatellite Systems ODvislon Internatknal
All vehicle loads are capable of withstanding (without damage) continuousoperation of the main bus in a 10-percent over or under voltage condition(24.3 to 29.7 Vdc) and returning to specified performance parameters uponreturning to the specified main bus limits. After i-terruption of power, allequipment will be capable of returning to normal operation upon restoration ofpower to within normal limits.
4.3.6 Grounding and Isolation
All loads are designed in concert with a single-point ground (SPG) system.Dc-dc. isolation is provided in the BDP power supply. The grounding and returnsystem is shown in Figure 72. Multiple-point shield grounding is used on high-frequency circuits (above 100 kaz), on digital circuits with rise or fall timesof less than 5 mic.roseconds, and on all electro-explosive device firing circuits.Single and shield grounding is maintained on all other circuits, with the groundat the signal aource end. All shielding is insulated to prevent uncontrolledgrounding. The shield grounds are carried directly to the vehicle structure bythe shortest feasible route and are not returned to the single system groundpilot through conductors in the wiring harness.
4.3.7 X-Sensor and Y-Sensor
The field-of-view of the X-sensor is defined in Figure 73. The field-of-view of the Y-sensor, out to a 2 2 .5-degree half angle, is entirely unobstructed.
FigureNS 72. OGS Gru Sing Schet
103
-27
ISO• SENSOR
a -MA=-.__..
SEgRe 7 .IA Gr u diHOc e at cL
i03 TOA0Ol/rCHO r AM TO S
W OU ''It O ýXRL0 1T
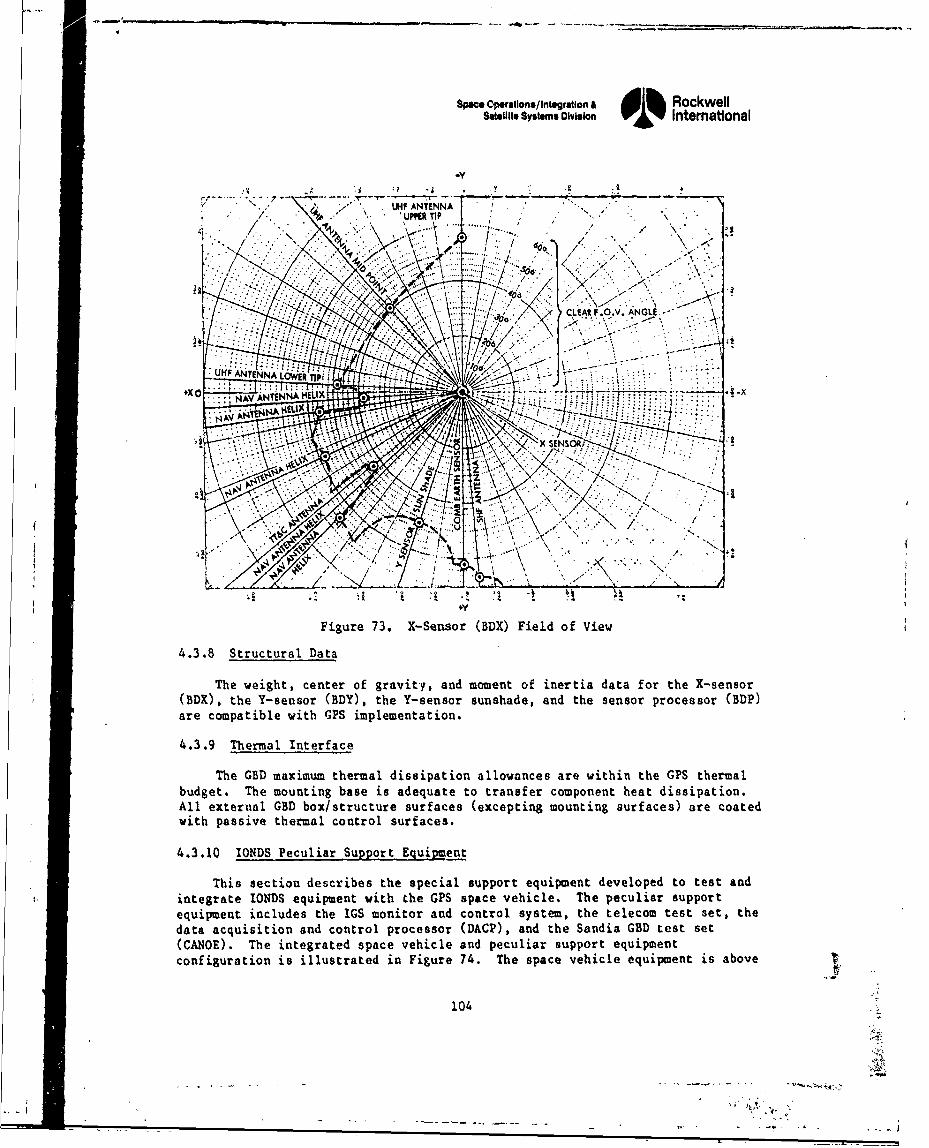
Space Operations/Integration & slh RockwellSatellite Systems Division V01 International
- . - UPP E. ," TIP
i " ' -.. ":,- • " ' . . \• b ". ..........
CLEAR F OV. ANGLE.
F igre73•. 7 S F
Figure 73. X-Sensor (BDX) Field of View
4.3.8 Structural Data
The weight, center of gravity, and moment of inertia data for the X-sensor(BDX), the Y-sensor (BDY), the Y-sensor sunshade, and the sensor processor (BDP)are compatible with GPS implementation.
4.3.9 Thermal Interface
The GBD maximum thermal dissipation allowances are within the GPS thermalbudget. The mounting base is adequate to transfer component heat dissipation.All external GBD box/structure surfaces (excepting mounting surfaces) are coatedwith passive thermal control surfaces.
4.3.10 IONDS Peculiar Support Equipment
This section describes the special support equipment developed to test andintegrate IONDS equipment with the GPS space vehicle. The peculiar supportequipment includes the IGS monitor and control system, the telecom test set, thedata acquisition and control processor (DACP), and the Sandia GBD test set(CANOE). The integrated space vehicle and peculiar support equipmentconfiguration is illustrated in Figure 74. The space vehicle equipment is above
104
...-
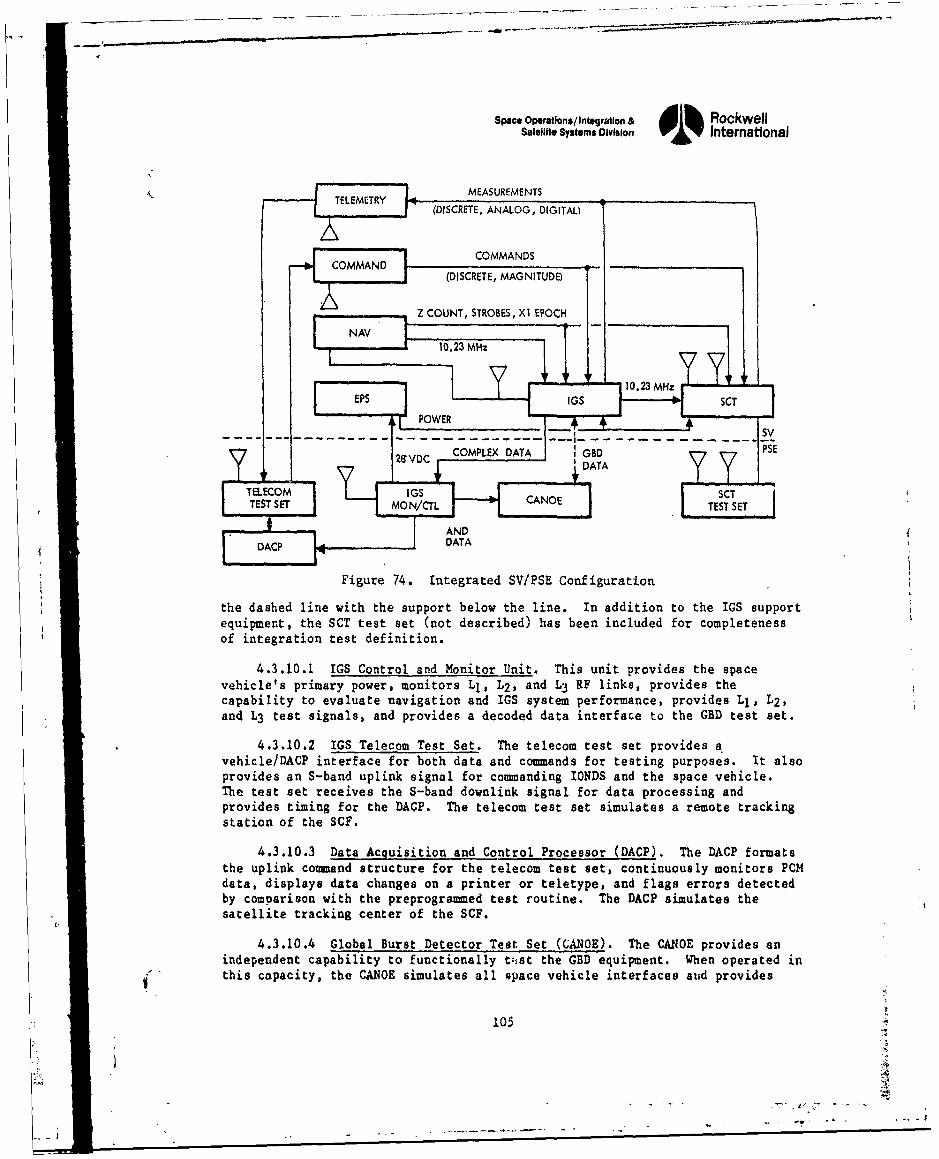
Space Operations/Intsgration & RockwellSatellite Systems Division 01% International
ofintegrationts deiniti
. IGS TELEMETRY MEASUREMENTS
v ices primar p r, m (DISCRETE, ANALOG, DIGITAL)
COMMAN COMMANDS
COMMAND j (DISCRETE, MAGNITUDE)
[.,~~ ~~ ,..,,ZCOUNT, STROBES, X1 EPOCHNAV 102 M- --.... .
J I012323 M z
EPS n gPOWER ad S ss
and~ 2VO COMLE teTt sigals an rvdsadcdddt itraet h etset
4.3.10. IGS Telco SCT
- J AND
vhlDACP i DATA
Figure 74. Integrated SV/PSE Configuration
the dashed line with the support below the line. In addition to the IGS supportequipment, the SCT test set (not described) has been included for completenessof integration test definition.
4.3.10.1 IGS Control and Monitor Unit. This unit provides the spacevehicle's primary power, monitors Li, L2, and L3 RF links, provides thecapability to evaluate navigation and IGS system performance, provides Ll, L2,and L3 test signals, and provides a decoded data interface to the GBD test set.
4.3.10.2 IGS Telecom Test Set. The telecom Cest set provides anvehicle/DACP interface for both data and commnands for testing purposes. It alsoprovides an S-band uplink signal for commanding 10NDS and the space vehicle.
The test set receives the S-band downlink signal for data processing andprovides timing for the DACP. The telecom test set simulates a remote trackingstation of the SCF.
4.3.10.3 Data Acquisition and Control Processor (DACP). The DACP formatsthe uplink command structure for the telecom test set, continuously monitors PCMdata, displays data changes on a printer or teletype. and flags errors detectedby comparison with the preprogramed test routine. The DACP simulates thesatellite tracking center of the SCF.
4.3.10.4 Global Burst Detector Test Set (CANOE). The CANOE provides anindependent capability to functionally tist the GBD equipment. When operated in
•" " this capacity, the CANOE simulates all space vehicle interfaces aud provides
105
7f
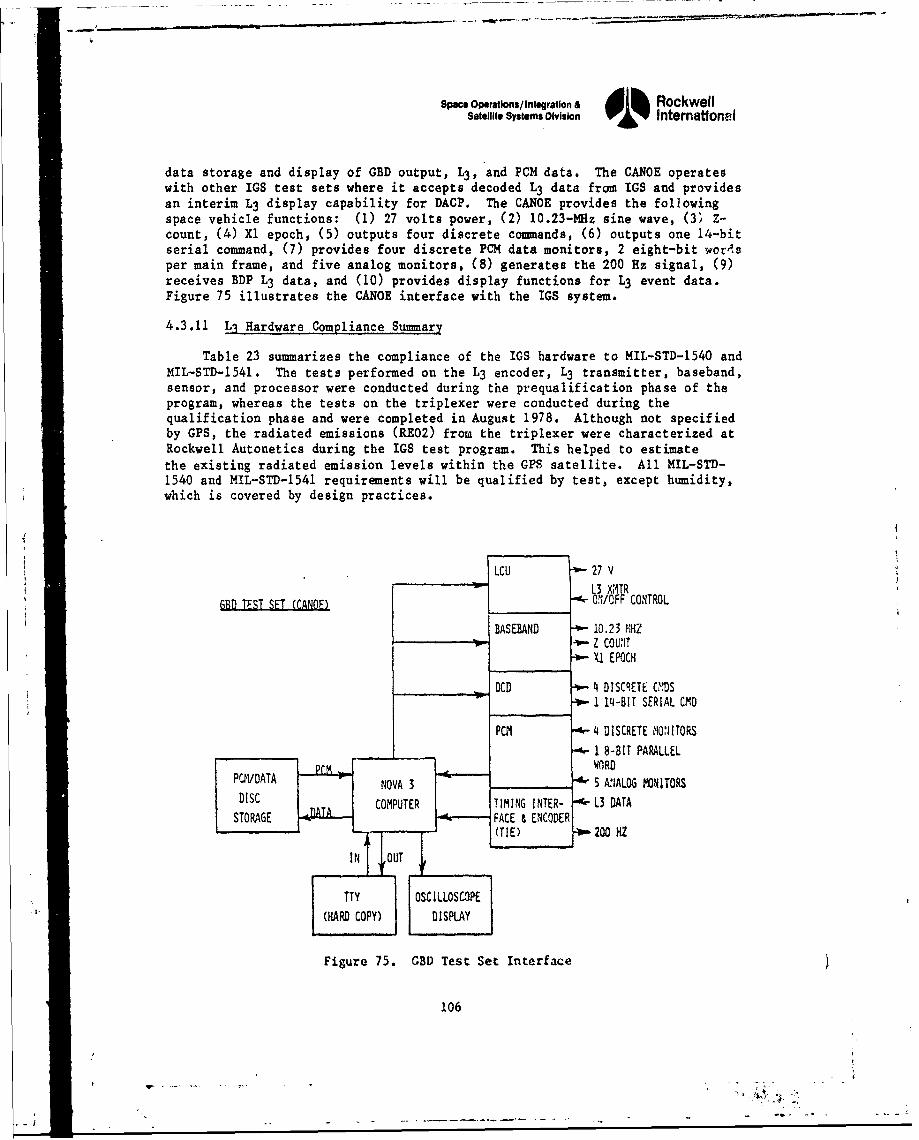
Space Operatlons/lIntegration & i h RockwellSatellite Systems Division 0'1 International
data storage and display of GBD output, L3 , and PCM data. The CANOE operateswith other IGS test sets where it accepts decoded L3 data from IGS and providesan interim L3 display capability for DACP. The CANOE provides the followingspace vehicle functions: (1) 27 volts power, (2) 10.23-MHz sine wave, (3) Z-count, (4) Xl epoch, (5) outputs four discrete commands, (6) outputs one 14-bitserial command, (7) provides four discrete PCM data monitors, 2 eight-bit wordsper main frame, and five analog monitors, (8) generates the 200 Hz signal, (9)receives BDP L3 data, and (10) provides display functions for L3 event data.Figure 75 illustrates the CANOE interface with the IGS system.
4.3.11 Ll Hardware Compliance Summary
Table 23 summarizes the compliance of the IGS hardware to MIL-STD-1540 andMIL-STD-1541. The tests performed on the L3 encoder, L3 transmitter, baseband,sensor, and processor were conducted during the prequalification phase of theprogram, whereas the tests on the triplexer were conducted during thequalification phase and were completed in August 1978. Although not specifiedby GPS, the radiated emissions (RE02) from the triplexer were characterized atRockwell Autonetics during the IGS test program. This helped to estimatethe existing radiated emission levels within the GPS satellite. All MIL-STD-1540 and MIL-STD-1541 requirements will be qualified by test, except humidity,which is covered by design practices.
LCU -1 27 V'
GBD TFST SET (CANOE) ,9- ON/OFF CONTROL
BASEBAND 10.23 MHZ•-Vol Z COUNIT
X• EPOCH
OCO"• 4 DISCRETE CY.DSI 14-BIT SERIAL CMD
PCM •4 DISCRETE MON ITORS
"1 8-BIT PARALLELUDAA r.• • ' WORD
PCPVDATANOVA 3 5m A•IALOG MONITORS
DISC j COMPUTER TIMING INTER- L3 DATA
SO(TIE) 200 HZ
TTY OSCILLOSCOPE
(HARD COPY) DISPLAY
Figure 75. GBD Test Set Interface
106
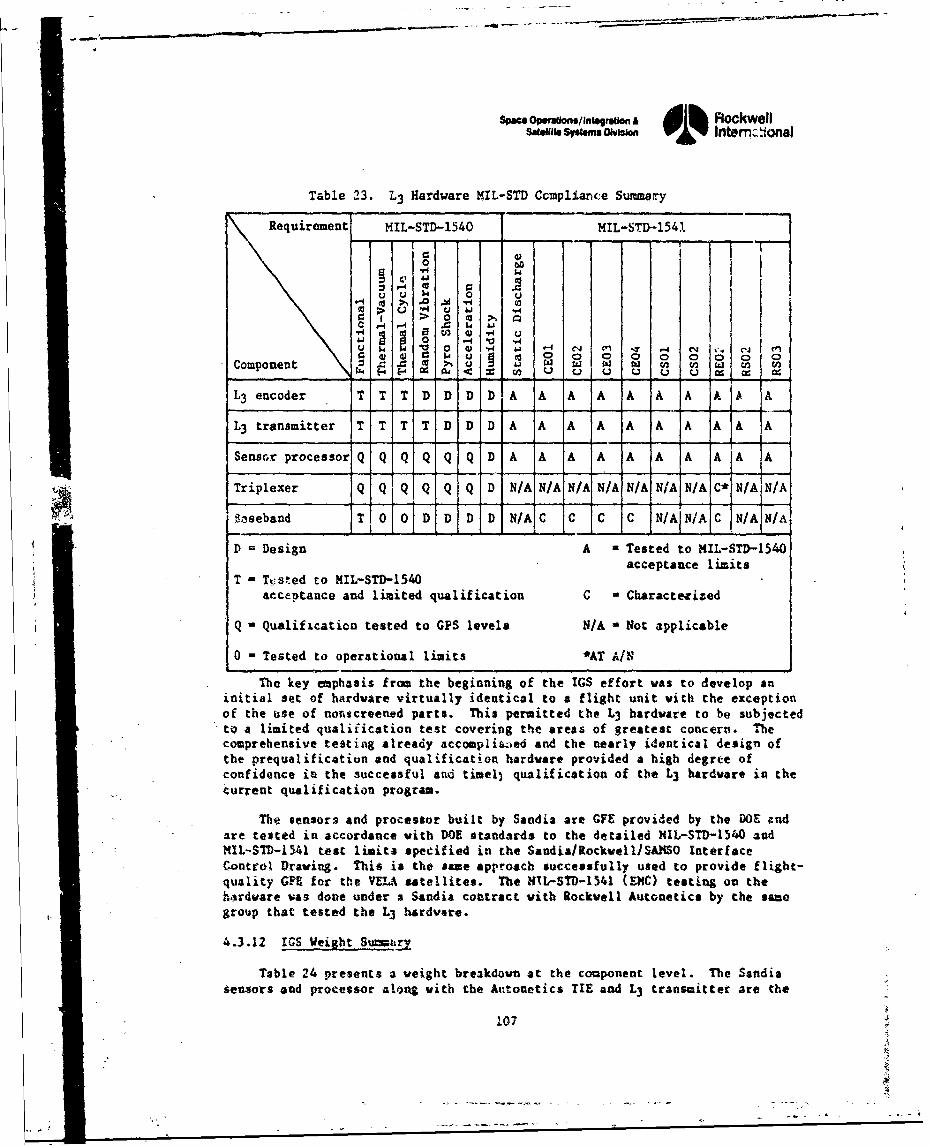
Space OpwaUonsflntofe/tg n A d Rockwellsa.e•,f Ssytms Olsio'01 Intem:.ional
Table 23. L3 Hardware MIL-STD Ccmplianrce Summary
Requirement MIL-STD-1540 MIL-STD-1541
00
\ Requiree nt U Q k 0 o < = U . . •
• ..
L3 ~ ~ ~ ;. Anoe .1 Tý (0 A A A A A•
0 00 Pi0 X U si
4J0 ý-I V
W0 V 00 0 2 1 V4ci 1 4C4 eComponent 0 C M :ý (
L3 encoder T1 T IT D D, D D A A A A JA A A A A4 A
L3 transmitter T T T T D D D A A A A A A A A A A
Sensor processor q q q Q Q Q D A A A A A A A A A A
Triplexer Q Q Q Q Q Q D N/A N/A N/A N/A N/A N/A N/A C* N/A N/A
8z....0d D D D D N/AC C C ,C , A J NA N/A
D - Design A - Tested to MIL-STD-1540acceptance limits
T - Ti-saed to MIL-STD-1540acceptance and limited qualification C - Characterized
Q - Qualification tested to GPS levels N/A * Not applicable
0 - Tested to operational limits *AT A/N
The key emphasis from the beginning of the IGS effort was to develop aninitial set of hardware virtually identical to a flight unit with the exceptionof the use of nonscreened parts. This permitted Lhe L3 hardware to be subjectedto a limited qualification test covering the areas of greatest concero. Thecomprehensive testing already accomplited and the nearly identical design ofthe prequalificatiun and qualification hardware provided a high degrte ofconfidence in the successful ani timell qualification of the L3 hardware ic thecurrent qualification program.
The sensors and processor built by Sandia are GFE provided by the DOE cndare tested in accordance with DOE standards to the detailed MiL-STD-1540 andMIL-STD-i541 test limita specified in the SandiasRockwell/SA1MO InterfaceControl Drawing. This is the same approach successfully used to provide flight-quality GFE for the VEU satellites. The NIL-STD-1541 (SOC) testing on thehardware was done under a Sandia contract with Rockwell Autonetics by the samegroup that tested the L3 hardvare.
4.3.12 IAS Veight S-u~mur
Table 24 presents a weight breakdown at the cooponent level. The Sandiasensors and processor along with the Antonetics TIE and L3 transmitter are the
107
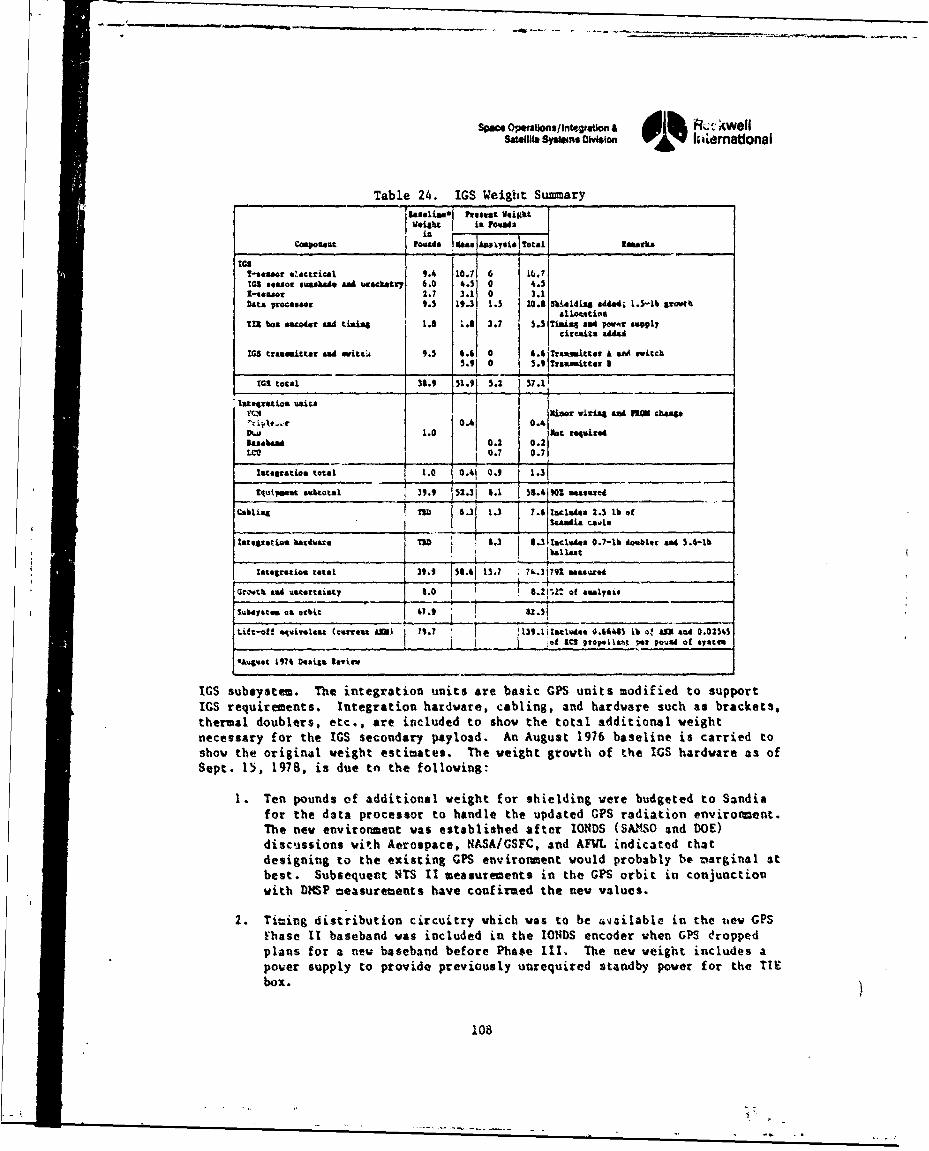
Sp e Opeaon,1/nt..atlWt d&h -. kwellsA,1,1, symums ovtason YWV'IE kiimabonal
Table 24. IGS Weight SummaryiUsisawI Ptresen wog-, tvoighb is yowadn
inCompoat t ,€ e.. hn.4a., To,,l isarks
I--Sel r .4actica.l 9.4 10.7 0 j,5.?1GS aaeor suausads and Ua kerybt 6.0 4.5 0 4.5Z1qe.n 2.7 3.1 0 3.1Data processf 9.5 19.3 1.5 20.8 Shielding aiad4; 1.5-lb sxowth
al110"tiasUII bog escoder "d tiamin 1.8 I.8 3.7 5.5 Timing anad Pw*Ir supplycircuita add4A
M5 transmitter A"d avitci 9.5 6.6 0 46 Traxsaitetr A &a Mitch
15.9 0 5.9 Tras tter I
IGS total 38.9 51.9 5.2 S7.11
ýTtnkgzttioa Units
~ .~ 0.4NiTVrs "M h-S1.0 .2oc requiredRacebam 0.2 0.2
LCO 0.7 0.7
IRCOSCatiGa total 1.0 0.41 0.9 1.3
Equs~ipmnt wavbcon 1 39.9 152.3 8.1 f55.4iZ ..0 . tiauc
Cabling In 6.3 1.3 7.6 Ise"l s 2.4 lb of
I scandia Caslas
tatogratiou hard 's T I• 6J.3Ilacludes 0.7-lb dowbler and 5.-lb
Iatagxstioas total 1 39.9IT54.61 11.? 71.3 791 manur.4
GCit A Aand totaisty . o e4el.alysis
subeystes as orbit 41.9sf
Lift-ott "%'iV*aleat (Catret AM) M9? 139. latrladee 0.4641 Lb a' AM and 0.0254Sof____R___S_ tIoola V* Vais4 Of aYiattn
IGS subsystem. The integration units are basic GPS units modified to supportIGS requirements. Integration hardware, cabling, and hardware such as brackets,thermal doublers, etc., are included to show the total additional weightnecessary for the IGS secondary payload. An August 1976 baseline is carried toshow the original weight estimates. The weight growth of the IGS hardware as ofSept. 15, 1978, is due to the following:
1. Ten pounds of additional weight for shielding were budgeted to Sandiafor the data processor to handle the updated GPS radiation environment.The new environment was established after IONDS (SAISO and DOE)discussions with Aerospace, NASA/GSFC, and AFVL indicated thatdesigning to the existing GPS environment would probably b@ zarginal atbest. Subsequent NTS II measurements in the GPS orbit in conjunctionwith DMSP measurements have confirmed the new values.
2. Timing distribution circuitry which was to be available in the t~ew GPSfhase It baseband was included in the IONDS encoder when GPS eroppedplans for a new baseband before Phase 111. The new weight includes apower supply to provide previously unrequired standby power for the TIEbox.
103
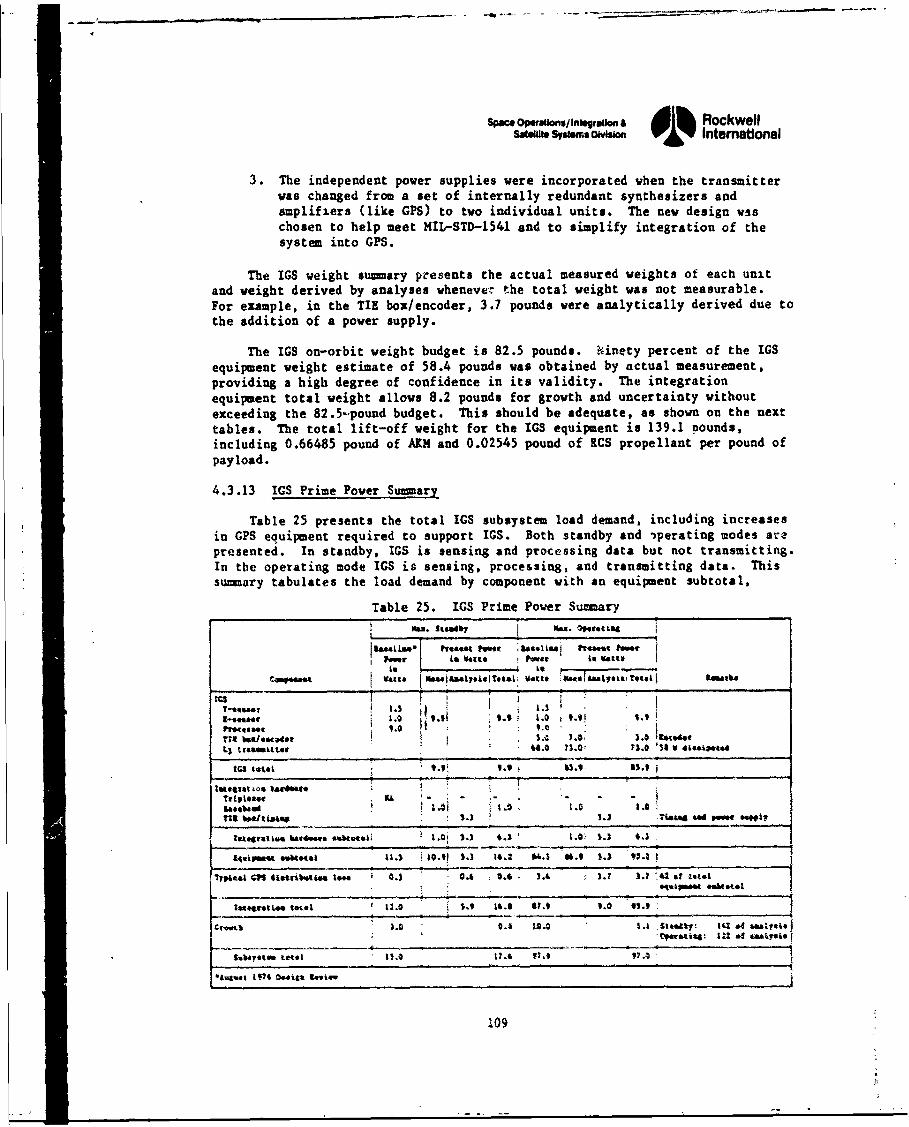
Space Op~ralonsl•/naow & RockwellSM,.o SIMS Wviuio 0 Intemational
3. The independent power supplies were incorporated when the transmitterwas changed from a set of internally redundant synthesizers andamplifiers (like GPS) to tvo individual units. The new design wsschosen to help meet MIL-STD-1541 and to simplify integration of thesystem into GPS.
The IGS weight sumary presents the actual measured weights of each unitand weight derived by analyses whenever the total weight was not measurable.For example, in the TIE box/encoder, 3.7 pounds were analytically derived due tothe addition of a power supply.
The IGS on-orbit weight budget is 82.5 pounds. N.inety percent of the IGSequipment weight estimate of 58.4 pounds was obtained by actual measurement,providing a high degree of confidence in its validity. The integrationequipment total weight allows 8.2 pounds for growth and uncertainty withoutexceeding the 82.5-.pound budget. This should be adequate, as shown on the nexttables. The total lift-off weight for the IGS equipment is 139.1 pounds,including 0.66485 pound of AKM and 0.02545 pound of RCS propellant per pound ofpayload.
4.3.13 IGS Prime Power Summary
Table 25 presents the total IGS subsystem load demand, including increasesin GPS equipment required to support IGS. Both standby and iperating modes arepresented. In standby, IGS is sensing and processing data but not transmitting.In the operating mode IGS is sensing, processing, and transmitting data. Thissummary tabulates the load demand by component with an equipment subtotal,
Table 25. IGS Prime Power Summary
b-ssaIa . 1. .I . 1.0 99I so .
t..... •t S.1 t..•li-o 51.1. i
trl....t ,, - - . - i . -+
$ t ice t
g-s••eft l+ 9 " .9 6 | . 1- • $5.9
r,<ts .btLio 3.3 Ua(r "A •Y ISagebagi 1 1.4 ,1. .01 3.0 lc f
Itad•1 1n.o M4dwow
td . ..1 .. . . .. .... .. ), . 1
TY4t~ V ma4.1tjtW loss 0. 1 0.) 33.3 M. IS.. 44o 1
lUItS, t.. *1 .0 11A Fla
lCt,,vi 3. 0.)•i 3 .0 .0 1.3 £&!~ 33* &i*t
S"&uL'et Ill P t, 0eeit 3.w4r
109
Spec Opetins/intgration A l RockwellS90111 Systems son 'Y Intemabonal
distribution loss, and growth allocatLon. The distribution loss accounts forline loss between the power source and IGS subsystem. A small growth factor hasbeen allocated for power demand uncertainties such as variations from unit tounit.
Growth in power demand has occurred due to moving the timing interfacefunction from the baseband unit to the TIE unit and adding a low-voltage powersupply in the TIE unit to provide standby power rather than parallel loading theGPS dc-to-dc converter. This approach is slightly less efficient but was chosenin accordance with SPL ground rules to avoid potential noise interference withGPS subsystems.
: iC,
Spo" OPWi-dansl1ft1grsUan A l Rockwellsaw. SyS Nfi Intemaonal
5. RELIABILITY
The reliability objectives of the IGS/GPS interfaces would preclude IGS-induced navigation mission failures and GPS failures which would cause IGSmission failure without an accompanying navigation mission failure.
The IGS reliability program included a failure effects analysis used toidentify single-point failure and critical items. Part specification reviewnalso were performod to assure compliance with good reliability engineering andcontract requirements. This review verified that the selection of most pieceparts were in compliance with the program preferred ?arts list (PPPL). Where?PPL parts were not obtainable, screening, burn-in, and other tes. were imposedon those parts to assure selecting parts of equivalent-quality. The reliabilityof IGS was evaluated by comparing IGS predicted values with IGS and GPSapportioned values, providing a uniform approach for attaining a predicted five-year mission life.
5.1 RELIABILITY/COI4PATIBILITY ANALYSIS
A reliability/compatibility analysis was conducted on the IGS systemhardware to determine the possible effects of IGS hardware failures in the GPS.The analy3is was conducted utilizing a combination of failure simulation bycomputerized logic and circuit analysis. In addition to establishing thecompatibility of the IONDS and GPS systems, a failure mode effects analysis(FMEA) was performed.
The computer simulation used during the analysis was identical to thesimulation successfully pioneered for the GPS Program. Inspection of simulationdata indicated single-point failures, command sequences for failure york-arounds, and failure definitions. The results of this IGS reliabillty analysisare contained in Rockwtll report SD 77-GP-0035.
The reliability/compatibility analysis defined 31 interfaces between theGES vehicle and IONDS. There are 16 interfaces with the load control unit;these include the coils and contacts of the eight power transfer relays. Allcontacts are redundantly fused. The analysis determined that a relay coil shortpresents A possibility of negating the GPS load shed capability. This failuremode is a second-order failure since the load shed function is only initiatedwhen one failure has occurred and therefore is not considered a single-pointfailure. Further, the load shed function is made available by the DCD sequencedcommands. In addition, relay coil shorting has a low probability of occurrence.
The DCD has six interfaces with IGS. Eight of these commands haveindividual d iver amplifiers and thus isolate the GPS from the IGS. The tworedundant commards (enable command) share the same output amplifier as the GPS.An IGS short coul.d force the GPS commands into its redundant mode which is notconsidered a single-point failure.
131:
Space Opations/Integration & dlh RockwellSatelilte Systems Division W0 International
The baseband/processor has seven interfaces with the IGS. The XI epoch,Z-count, and Z-strobe each have an isolation inverter amplifier as a source,thus protecting the GPS system. The P code is derived from the Q side of theP code flip flop, providing the CPS P code, thus isolating the GPS system.Finally, the 10.23-MHz clock signal is routed through a series of cascadedhybrid frequency power dividers. An IGS short or open in the clock signalcircuit will not unbalance the source sufficiently to cause system degradation.
The triplexer has one interface with the IGS - the L3 transmitter. Thehigh isolation of about 50 dB from port 1 to port 3 and from port 2 to port 3will result in a negligible effect on the operation of L1 and L2 in case thecable between the L3 transmitter and the triplexer is shorted or opened.
From the above reliability analysis, it was determined that single IGSfailures, opens, or shorts in the IGS system which could reflect through theinterface and cause a failure in the GPS vehicle do not exist.
5.2 RELIABILITY PREDICTIONS AND FAILURE MODE EFFECTS ANALYSIS
The reliability predictions and FMEA of the baseband/processor werereviewed. Thr logic diagrams and predictions for the transmitter and L3 encoderqre 'resented in Figure 76. The calculated numbers are RT = 0.988178 for thetransmitter and RE = 0.99419 for the encoder.
The logic diagram and results for the baseband and triplexer are presentedin Figures 77 and 78. The calculated numbers are RB - 0.990494 for the basebandand RT = 0.996502 for the triplexer.
An analysis was performed to assure that the IGS L3 channel reliabilitypredictions were comparable to predictions derived from the GPS L1 and L2channels. The calculated numbers were RLI - 0.9687, RL2 - 0.9694, and
=R, = 0.9705. The logic diagrams and results of this analysis are presented inFigures 79 and 80.
The FMEA emphasized high-power transistor junction temperatures. Forthe L3 encoder and transmitter, the transistors in the high-power amplifier arerated at 2000C and derated not to exceed a junction temperature of 1250. Onejunction's temperature is 106.60C, two are 1020C, and the remainder arebelow 85 0 C. The remaining transistors, hybrids, and diodes are rated at 125 0 C,and the highest temperature reached is less than 850C. All components arestress derated at least 50 percent of rated value.
For the baseband assembly, the maximum semiconductor junction temperatureis 940C for four transistors. The next highest junction temperature is 89 0 C forthree components, and all the remaining are below this number.
The FMEA's thus demonstrate that semiconductor junction temperature doesnot rise above 1250C in normal operation and that no other components areoperating at more than 50 percent of their rated capacity.
112
S... . 3
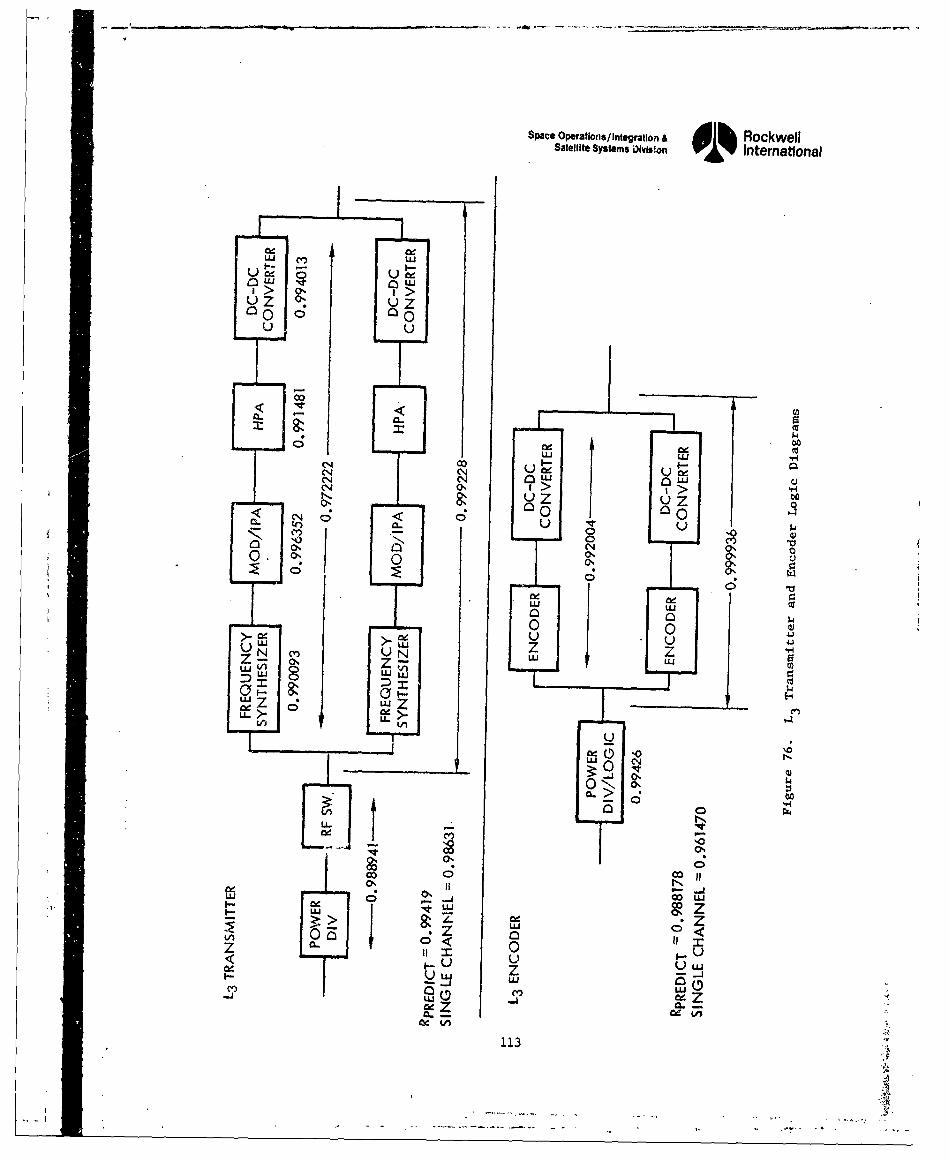
Space Operations/ Integration & RockwellSatellite Systems D)Ivis~on International
ui LU
00 no
n 0
1'4 0%S.-U
041. >4
uA Z bnCI1=u-X
0..
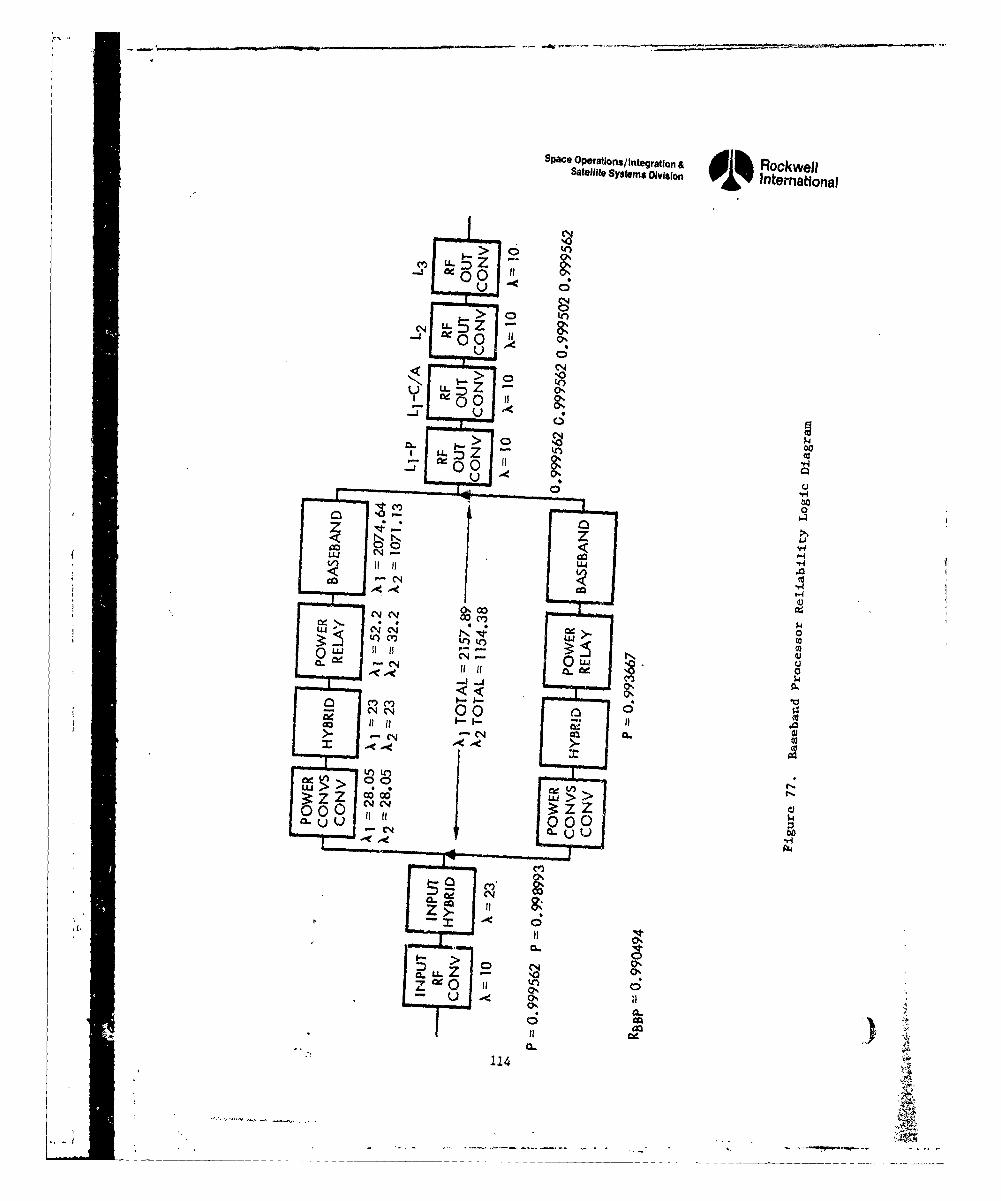
Space Operationls/ integration & ~L RckwellSatellite Systems Division International
0
0500
< > 10
=) Z
-j 00
A 0
zH
000
0 3:
a. 0
_Jj
N C0000
04 00
C"It
It It
CL U U 0 00
9L adZ 114 &
* -~~~-------------------------___ - - - - -
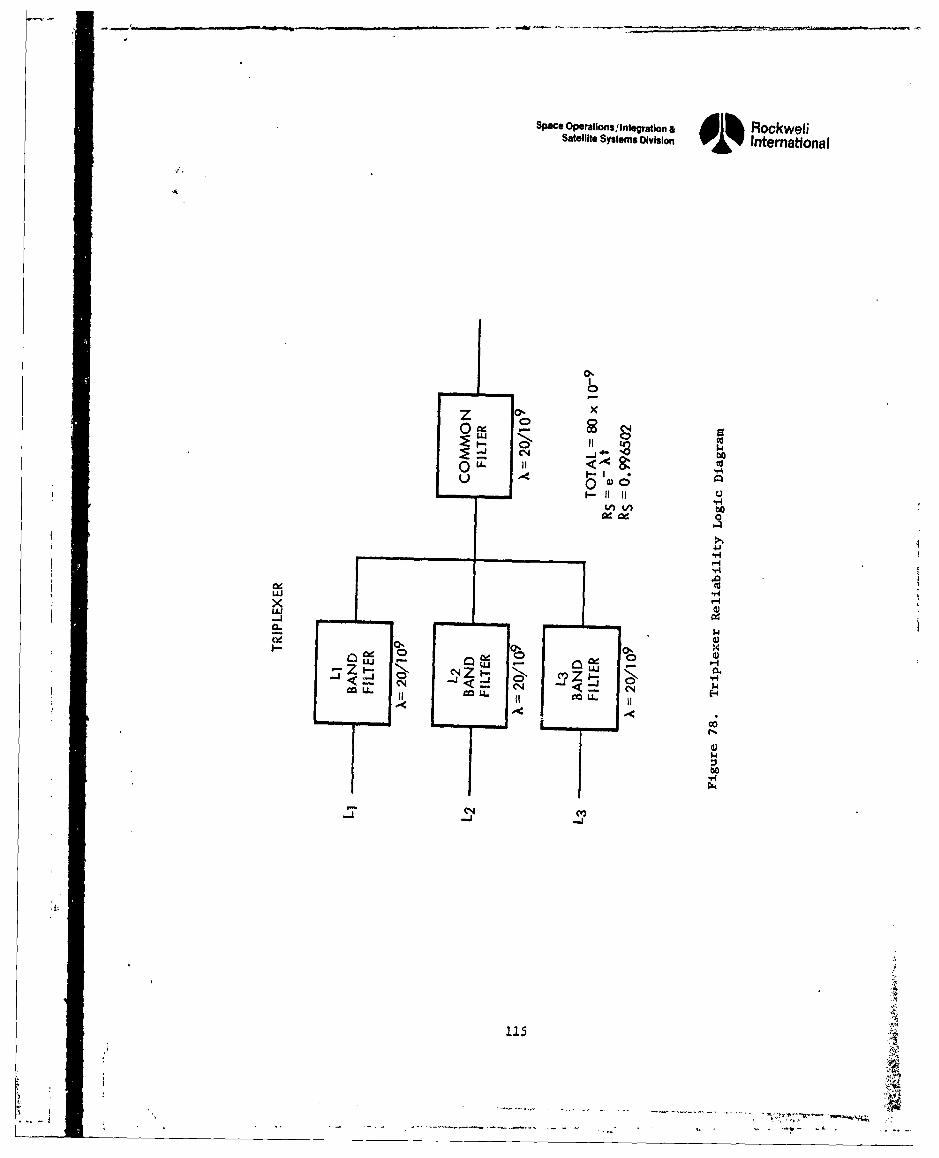
Space Operations,'inlegratlon & RockweliSatellite Systems Division 0 % International
000'
0 U. 11<u 00
"-r4
xU.1wj
-J I..
cc -NCND < - 10
00
CINII
115
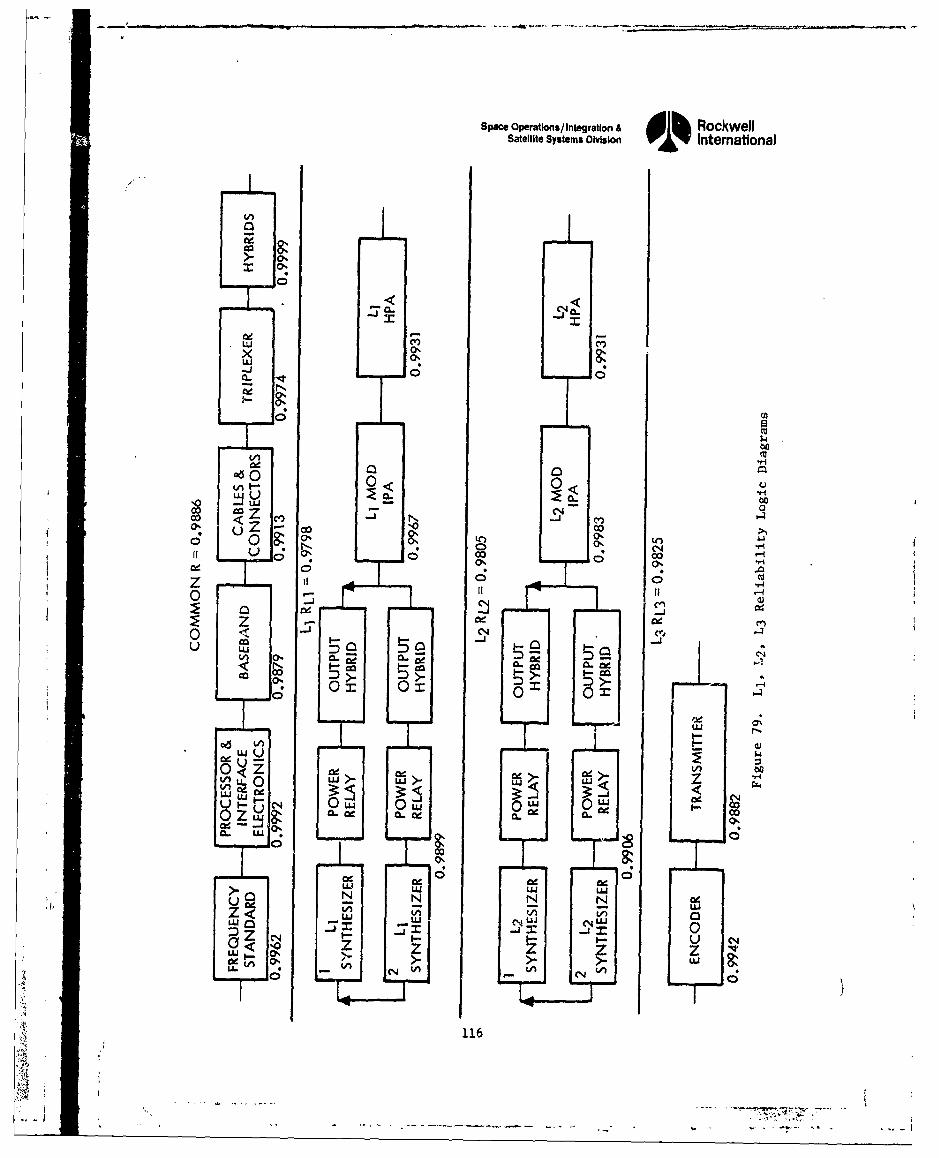
Space Operations/ integration A diRockwellSatellite Systems Division International
(Al0UCV
00%
0A 1
'40%4A 0 < 00 0
- IN
0 t
U 000
0< 0<
0% < C14
00 0.
0000
Ce c', 0
0 <0 Z0 -Je cd
Ln 0
tUO iz) adUi-j. a. O cc Lg x aCI
0 z%
000
N N N N
WO 34 -j' 0
<~ 0% z ZoU 1.- 0,%-zz0
116
*4 7*
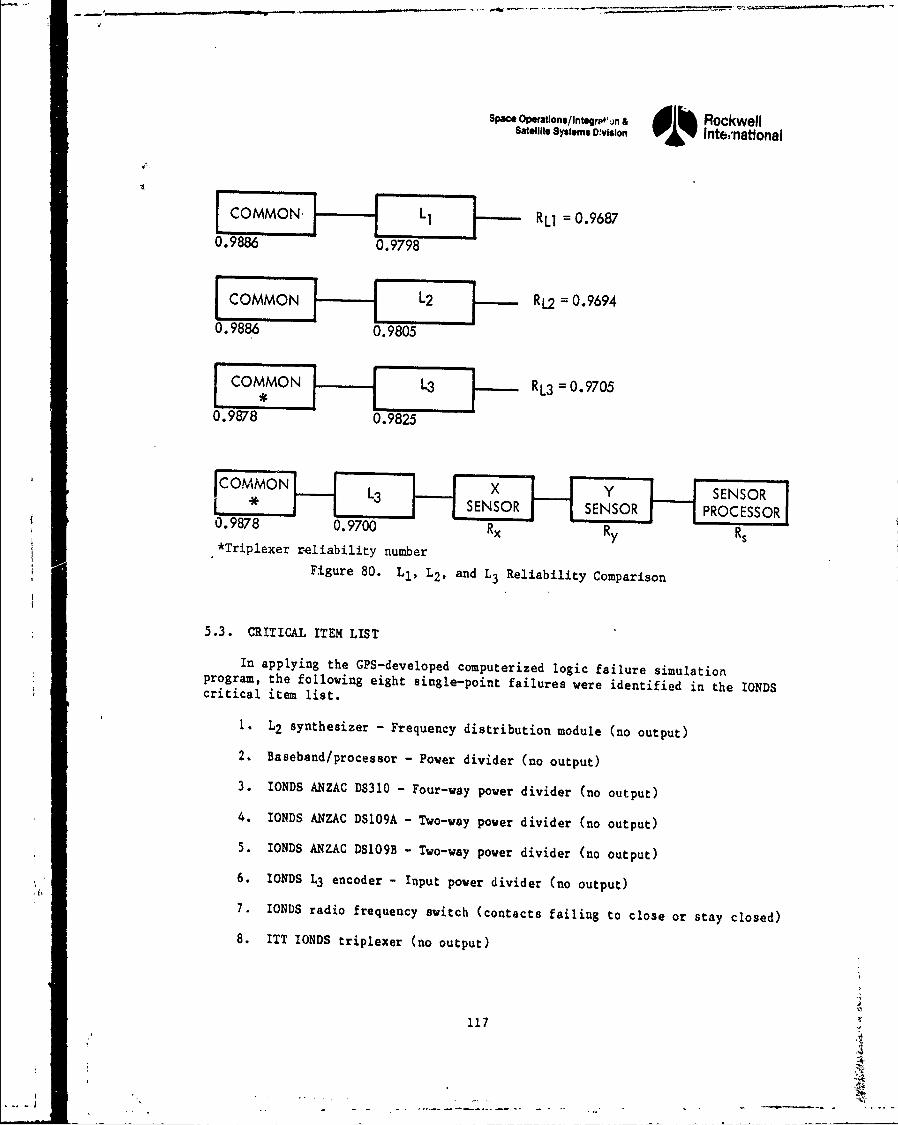
Space Operationa/Integrn & , RockwellSatellit SYseMS Dvlsion li% Intenattonal
COMMON L1 RL1 =0.96870.9886 0.9798
[ COMMON j L2 RL2 =0.9694
0.9886 0.9805
COMMON L3 = 0.9705
0.9878 0.9825
CO N L3 X Y SENSOR*SENSOR SENSOR PROCESSOR
0. 9878 0. 9700 Rx Ry Rs
*Triplexer reliability number
Figure 80. LI, L2 , and L3 Reliability Comparison
5.3. CRITICAL ITEM LIST
In applying the GPS-developed computerized logic failure simulationprogram, the following eight single-point failures were identified in the IONDScritical item list.
1. L2 synthesizer - Frequency distribution module (no output)
2. Baseband/processor - Power divider (no output)
3. IONDS ANZAC DS310 - Four-way power divider (no output)
4. IONDS ANZAC DS1O9A - Two-way power divider (no output)
5. IONDS ANZAC DS1O9B - Two-way power divider (no output)
6. IONDS L3 encoder - Input power divider (no output)
7. IONDS radio frequency switch (contacts failing to close or stay closed)
8. ITT IONDS triplexer (no output)
117
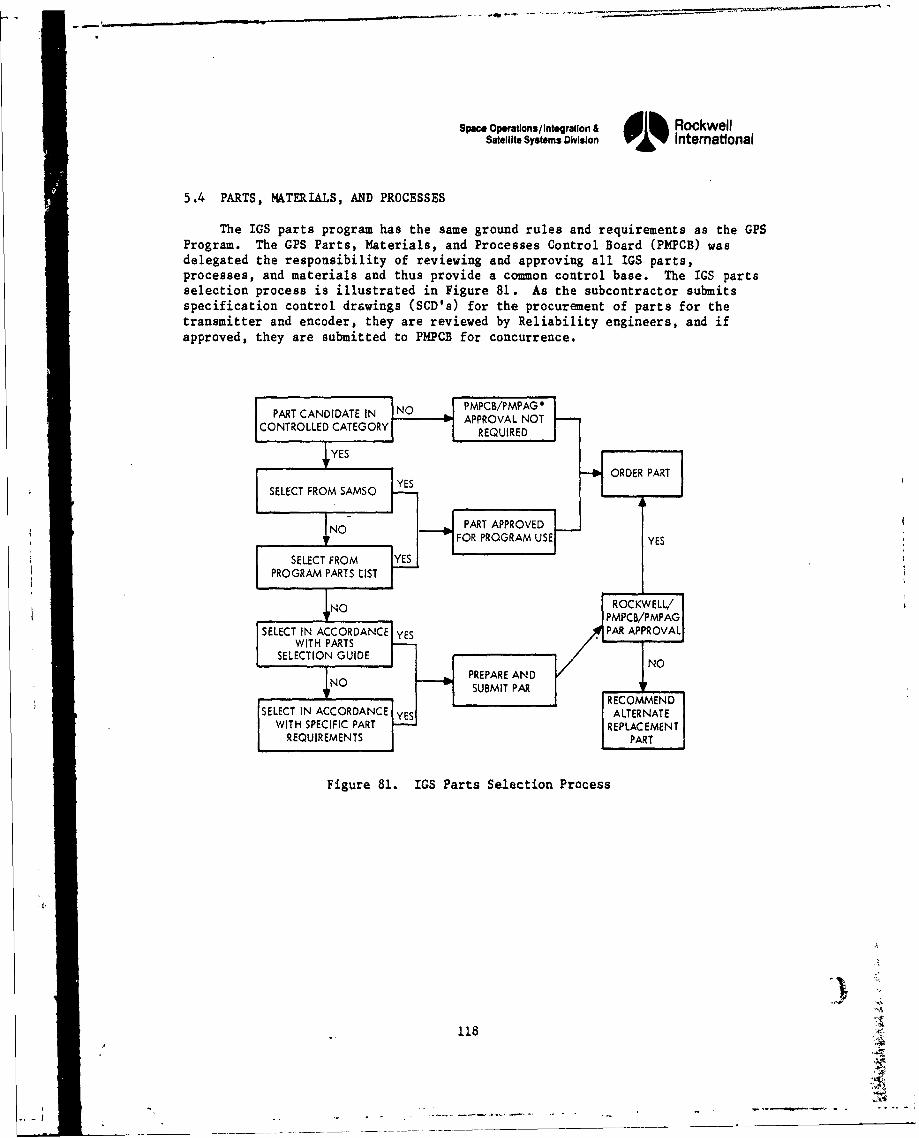
Space Operations/Intogration & RockwellSatellite Systems Division International
5.4 PARTS, M&TERIALS, AND PROCESSES
The IGS parts program has the same ground rules and requirements as the GPSProgram. The GPS Parts, Materials, and Processes Control Board (PMPCB) wasdelegated the responsibility of reviewing and approving all IGS parts,processes, and materials and thus provide a common control base. The IGS partsselection process is illustrated in Figure 81. As the subcontractor submitsspecification control drawings (SCD's) for the procurement of parts for thetransmitter and encoder, they are reviewed by Reliability engineers, and ifapproved, they are submitted to PMPCB for concurrence.
l PRT ANDDATE IN INO PMPCB/PMPAG" __
PART CAPART APPROVEDNO
CONTROLLED CATEGORY APVLREQUIREDNO
SJYES ORDER PART
SELECT FROM SAMSO
N FOR PROGRAM USE YES
SELECT FROM YESPROGRAM PARTS LIST
NNO ROCKWELL/NO 1 PMPCB/FMPAG
Fi Cr E 1 GE S PartsR Se e t oIrc s
SEEC IN ACCORDARE YENRAPROA~WT PARTSITPA
l ,~~~~~~~SELECTION GUIODANE 'RCMEDALRNE
A
-A
SWITH SPECIFIC PART REPLACEMENTSREQUIR*EMENTS PART
Figure 81. IGS Parts Selection Process
118 -i
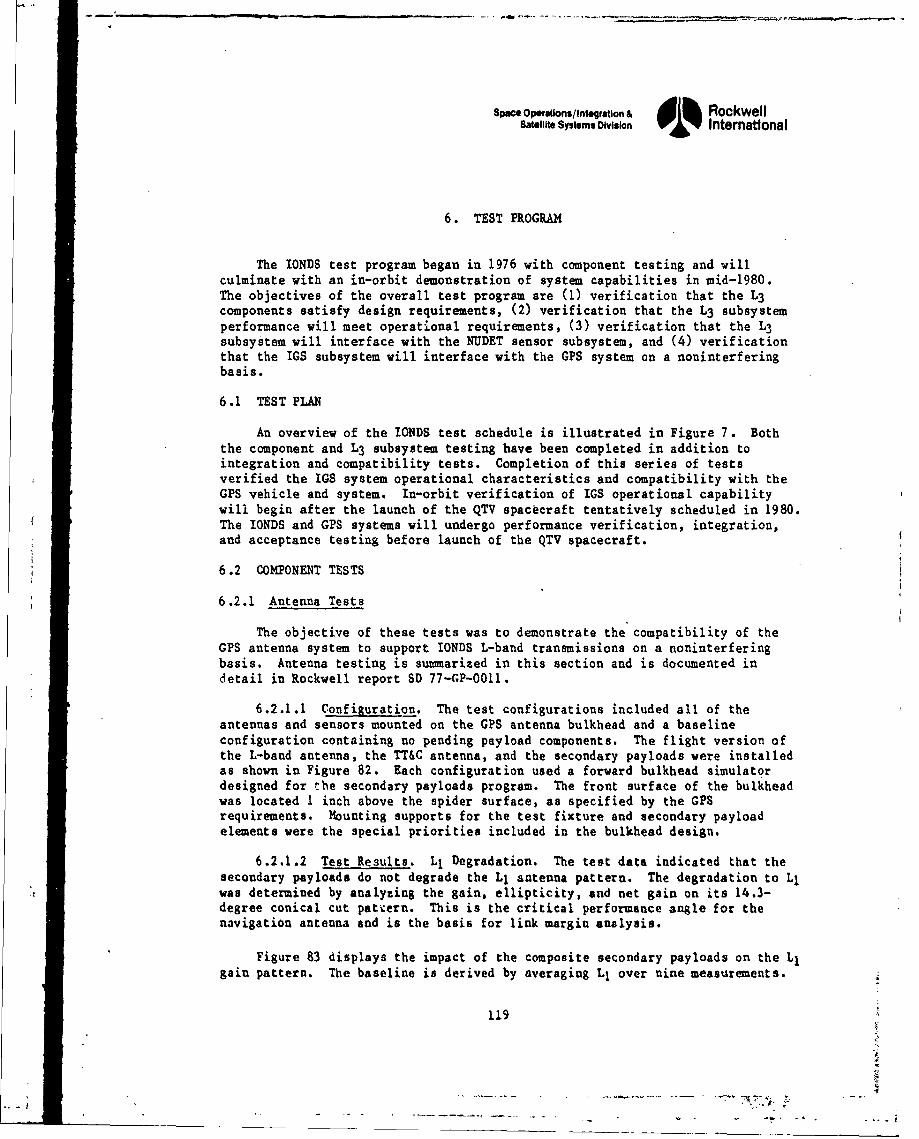
Space Op.'ations/Integration & RockwellSatellite Systems Division 01% International
6. TEST PROGRAM
The IONDS test program began in 1976 with component testing and willculminate with an in-orbit demonstration of system capabilities in mid-1980.The objectives of the overall test program are (1) verification that the L3components satisfy design requirements, (2) verification that the L3 subsystemperformance will meet operational requirements, (3) verification that the L3subsystem will interface with the NUDET sensor subsystem, and (4) verificationthat the IGS subsystem will interface with the GPS system on a noninterferingbasis.
6.1 TEST PLAN
An overview of the IONDS test schedule is illustrated in Figure 7. Boththe component and L3 subsystem testing have been completed in addition tointegration and compatibility tests. Completion of this series of testsverified the IGS system operational characteristics and compatibility with theGPS vehicle and system. In-orbit verification of IGS operational capabilitywill begin after the launch of the QTV spacecraft tentatively scheduled in 1980.The IONDS and GPS systems will undergo performance verification, integration,and acceptance testing before launch of the QTV spacecraft.
6.2 COMPONENT TESTS
6.2.1 Antenna Tests
The objective of these tests was to demonstrate the compatibility of theGPS antenna system to support IONDS L-band transmissions on a noninterferingbasis. Antenna testing is summarized in this section and is documented indetail in Rockwell report SD 77-GP-0011.
6.2.1.1 Configuration. The test configurations included all of theantennas and sensors mounted on the GPS antenna bulkhead and a baselineconfiguration containing no pending payload components. The flight version ofthe L-band antenna, the TT&C antenna, and the secondary payloads were installedas shown in Figure 82. Each configuration used a forward bulkhead simulatordesigned for the secondary payloads program. The front surface of the bulkheadwas located I inch above the spider surface, as specified by the GPSrequirements. Mounting supports for the test fixture and secondary payloadelements were the special priorities included in the bulkhead design.
6.2.1.2 Test Results. LI Degradation. The test data indicated that thesecondary payloads do not degrade the Li antenna pattern. The degradation to Llwas determined by analyzing the gain, ellipticity, and net gain on its 14.3-degree conical cut patt.ern. This is the critical performance angle for thenavigation antenna and is the basis for link margin analysis.
Figure 83 displays the impact of the composite secondary payloads on the LIgain pattern. The baseline is derived by averaging Ll over nine measurements.
119
"-j "
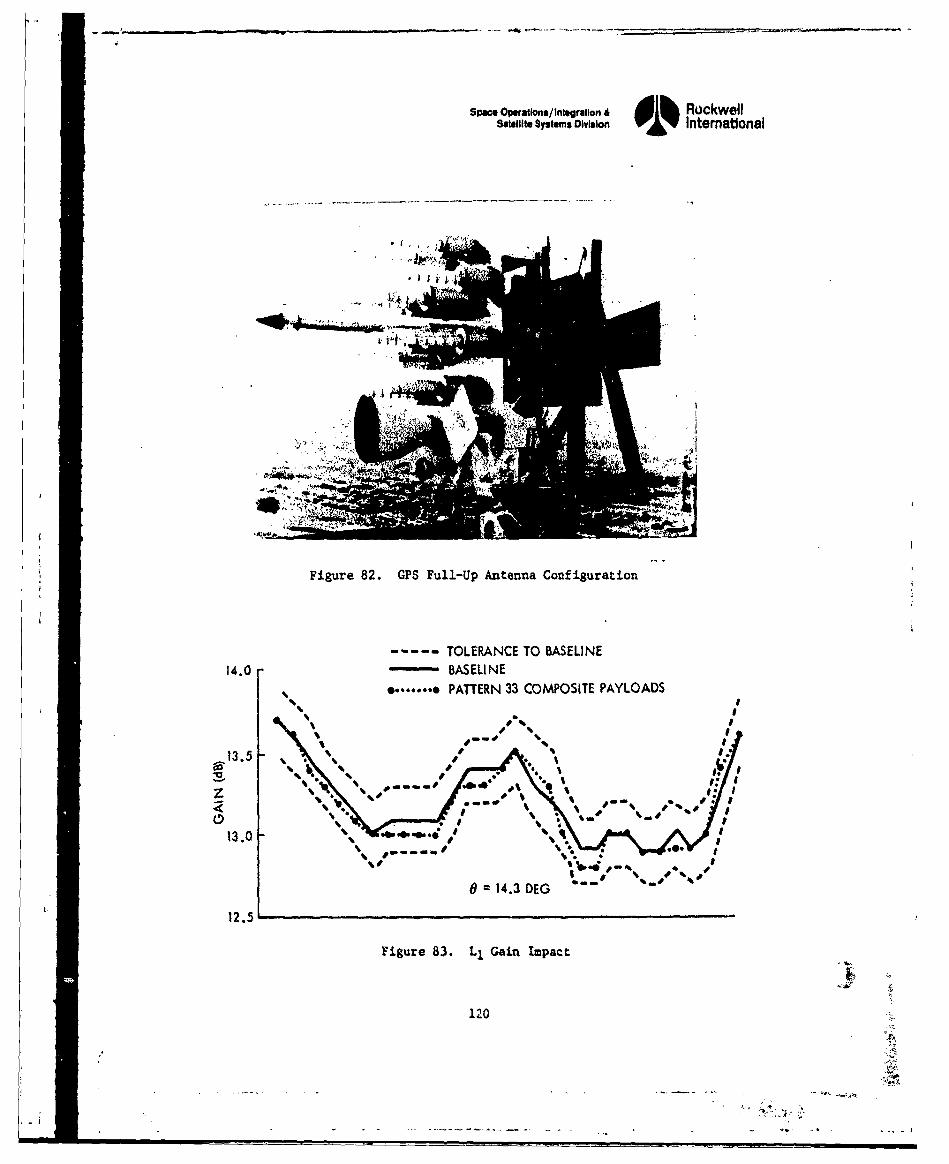
Space Operations/Integration & RockwellSatellite Systems Division Oi% International
Figure 82. GPS Full-Up Antenna Configuration
TOLERANCE TO BASELI NE14.0 -BASELI NE
% .. '..... PATTERN 33 COMPOSITE PAYLOADS
~13.5 - 0
0 %b
13.0-%%4 *%So
B 14.3 DEG \,/ %
12.5L
Figure 83. Ll Gain impact
120
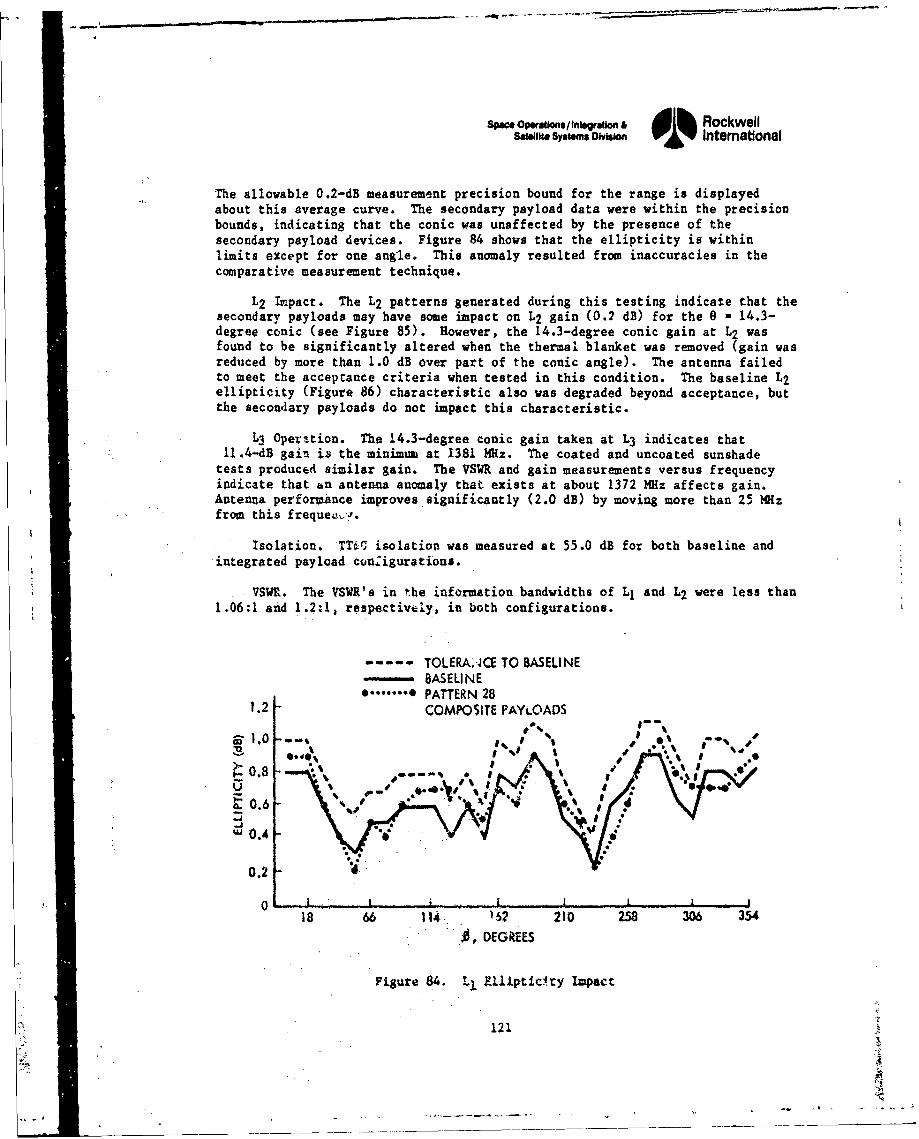
Space Opeailons1nIbgration & I ll RockwellSatel1 S1ystemm OdonW oi% International
The allowable 0.2-dB measurement precision bound for the range is displayedabout this average curve. The secondary payload data were within the precisionbounds, indicating that the conic was unaffected by the presence of thesecondary payload devices. Figure 84 shows that the ellipticity is withinlimits except for one angle. This anomaly resulted from inaccuracies in thecomparative measurement technique.
L2 Impact. The L2 patterns generated during this testing indicate that thesecondary payloads may have some impact on L2 gain (0.2 dB) for the 0 - 14.3-degree conic (see Figure 85). However, the 14.3-degree conic gain at LZ wasfound to be significantly altered when the thermal blanket was removed (gain wasreduced by more than 1.0 dB over part of the conic angle). The antenna failedto meet the acceptance criteria when tested in this condition. The baseline L2ellipticity (Figure 86) characteristic also was degraded beyond acceptance, butthe secondary payloads do not impact this characteristic.
L3 0peration. The 14.3-degree conic gain taken at L3 indicates thatll.4-dB gain is the minimum at 1381 MHz. The coated and uncoated sunshade
tests produced similar gain. The VSWR and gain measurements versus frequencyindicate that un antenna anomaly that exists at about 1372 MHz affects gain.Antenna performance improves significantly (2.0 dB) by moving more than 25 MHzfrom this frequeL-,, ,
Isolation. TTOI isolation was measured at 55.0 dB for both baseline andintegrated payload configurations.
VSWR. The VSWR's in .he information bandwidths of Ll and L2 were less than1.06:1 and 1.2:1, respectively, in both configurations.
TOLERA.ACE TO BASELINEBASELINE
. •PATTERN 281.2 COMPOSITE PAYLOADS
- " 1.0 - - -j00.8 % 4"0" .•,
0.6% %
t' 0.4
0.2 :
18 66 114 1.2 210 258 306 354
SoDEGkES
Figure 84. W1 Weipticity Impact
121
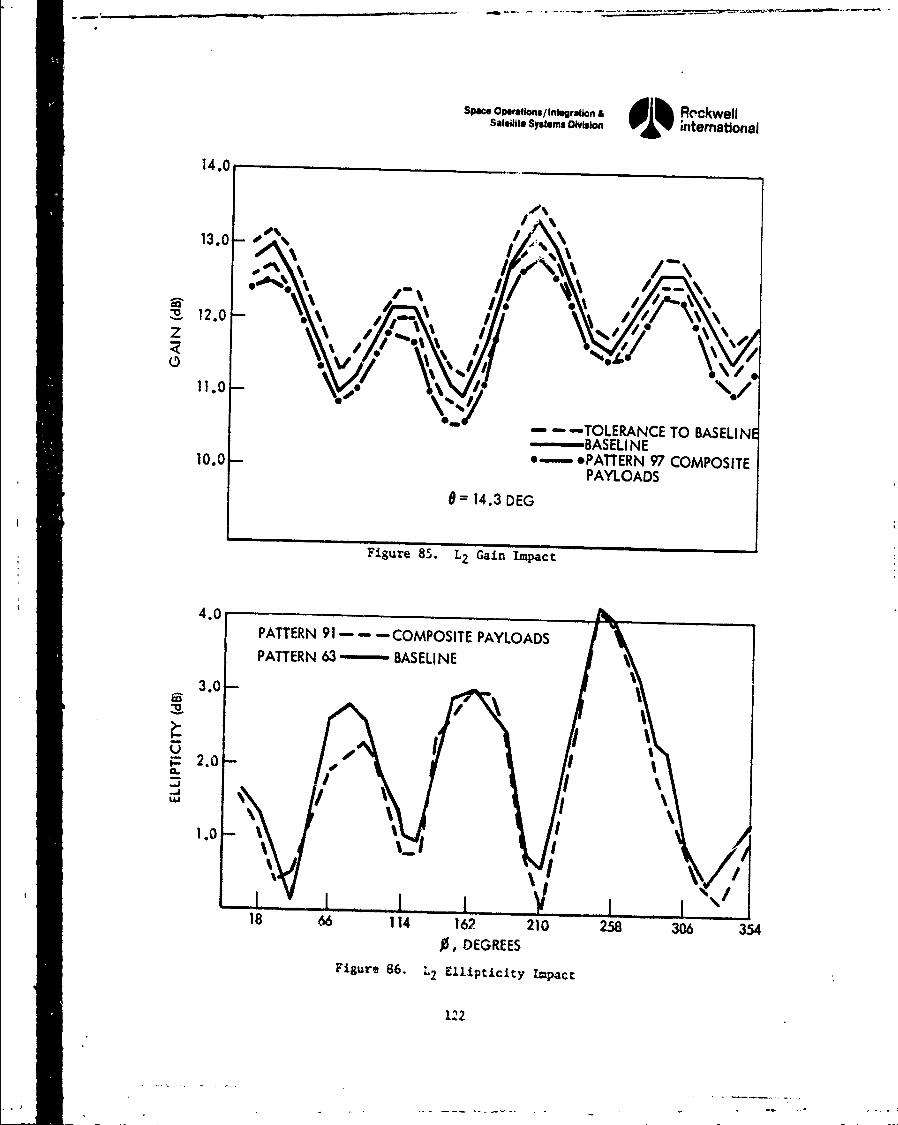
SpWac OeOns/In0,gration & RockwellSaellile Systems Divislon hiternational
14.0
13.0 - 00/
S12.0 \z /' ,••11.0
- -TOLERANCE TO BASELINEBASELI NE10.0= *-. PATTERN 97 COMPOSITEPAYLOADS
9=14.3 DEG
Figure 85. L2 Gain Impact
4.o
PATTERN 91-- -COMPOSITE PAYLOADS
PATTERN 63 . BASELINE
3.0
/ I1.0- IA
\1
18 66 114 162 210 258 306 354
,0, DEGREESFigure 86. "2 Ellipticity impact
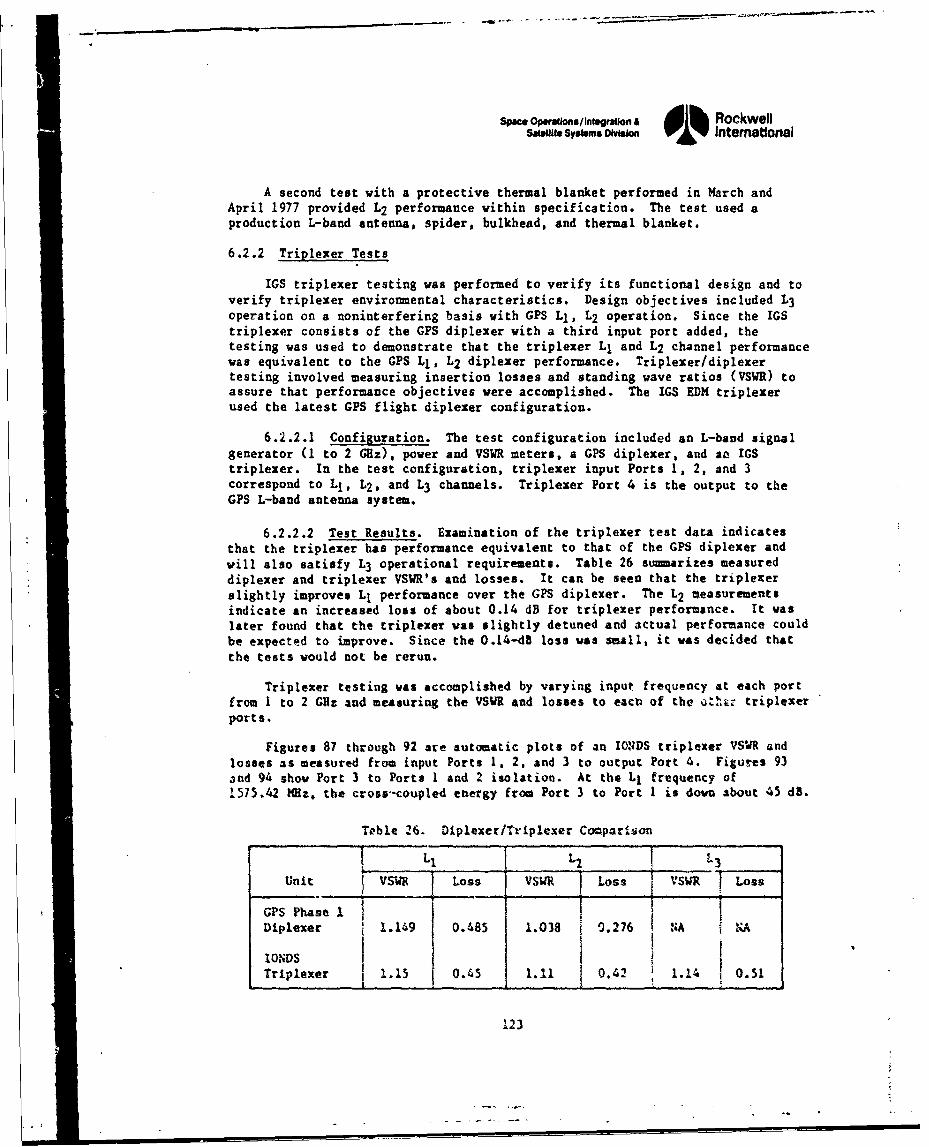
Space OperatonsflIntIgrMlon & IL Rockwellswfue. sYsU.. o1oWn 01% International
A second test with a protective thermal blanket performed in March andApril 1977 provided L2 performance within specification. The test used aproduction L-band antenna, spider, bulkhead, and thermal blanket.
6.2.2 Triplexer Tests
IGS triplexer testing was performed to verify its functional design and toverify triplexer environmental characteristics. Design objectives included L3operation on a noninterfering basis with GPS L1 , L2 operation. Since the IGStriplexer consists of the GPS diplexer with a third input port added, thetesting was used to demonstrate that the triplexer Ll and L2 channel performancewas equivalent to the GPS L1, L2 diplexer performance. Triplexer/diplexertesting involved measuring insertion losses and standing wave ratios (VSWR) toassure that performance objectives were accomplished. The IGS EDM triplexerused the latest GPS flight diplexer configuration.
6.2.2.1 Configuration. The test configuration included an L-band signalgenerator (1 to 2 GHz), power and VSWR meters, a GPS diplexer, and an IGStriplexer. In the test configuration, triplexer input Ports 1, 2, and 3correspond to Lj, L2 , and L3 channels. Triplexer Port 4 is the output to the
GPS L-band antenna system.
6.2.2.2 Test Results. Examination of the triplexer test data indicatesthat the triplexer has performance equivalent to that of the GPS diplexer and
will also satisfy L3 operational requirements. Table 26 suarizes measureddiplexer and triplexer VSWR's and losses. It can be seen that the triplexer
slightly improves L1 performance over the GPS diplexer. The L2 measurementsindicate an increased loss of about 0.14 dB for triplexer performance. It waslater found that the triplexer was slightly detuned and actual performance couldbe expected to improve. Since the 0.14-dB loss was small, it was decided thatthe tests would not be rerun.
Triplexer testing was accomplished by varying input frequency at each portfrom I to 2 GHz and measuring the VSWR and losses to eacla of the ot triplexerports.
Figures 87 through 92 are automatic plots of an IONDS triplexer VSWR andlosses as measured from input Ports 1, 2, and 3 to output Port 4. Figures 93
and 94 show Port 3 to Ports I and 2 isolation. At the Ll frequency of1575.42 MHz, the cross--coupled energy from Port 3 to Port I is down about 45 dB.
Tlble 26. Diplexer/Triplexer Comparison
Li____ L 2 '-3____
Unit VSWR Loss VSWR Loss {VSWR LOss
GPS Phase 1Diplexer 1.149 0.485 1.038 0.276 ' ,'a N
IONDSTriplexer I 1.15 0.&5 1.11 0.42 1.14 0.51
123
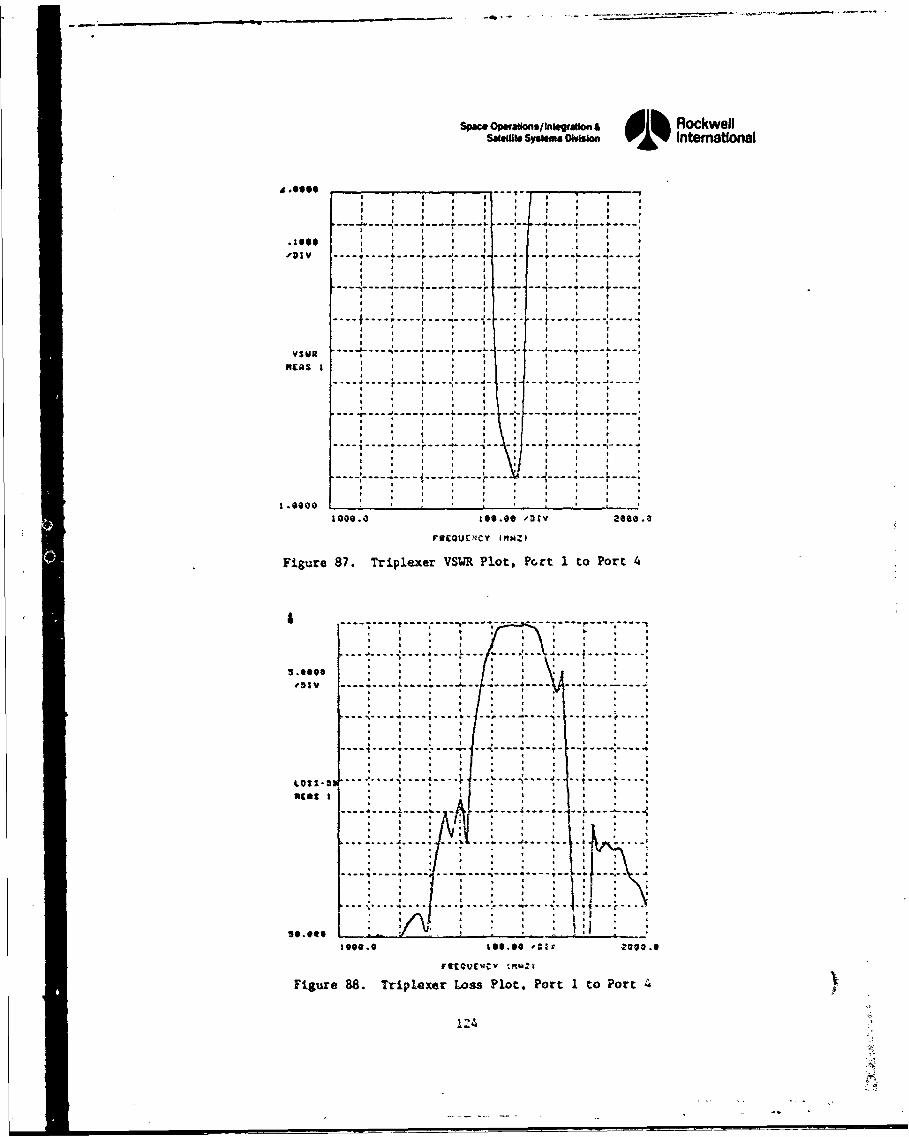
s~m. sa..1o International
i IL I I I I
I o i I
I I5
I 5Io S
I I o .
I I 5
! If.
* o I I
nL..s1. S .. ,S
5 I 5 £
* I S
5 I 5 5
I i 5
tI S
I i i 5 I
5 5 o Il 5
* * i 5 l I
* I S i
i i I i
13C0U!CY IMN
Figure ... "87..rp e r VS..... lot..... .... 1 to.. .. or .. .
i * i * i .
5.000O 0 . a , * ' a ,' ._ -
5OO. O0 5 5Dv20 .
5 5 i * 5U 5 5 " 5
Figre87 T*pee VS * P 5t Por 1 5oPr
5 I * I 5
mii *! 5
,.+. ... 4 .. J..+* --S
* * *v: * t i
5 5 . i
L SI" I.. ." . . . . I. .. . -. . .
seet. I K A rff f • i .
...i.. .. ......" .88..,Ti lo e ' 'o s'' ' P. ...''+..o,'' .t*. P or 1 t' " ort " " 4
' . .. : .... + .,2... .
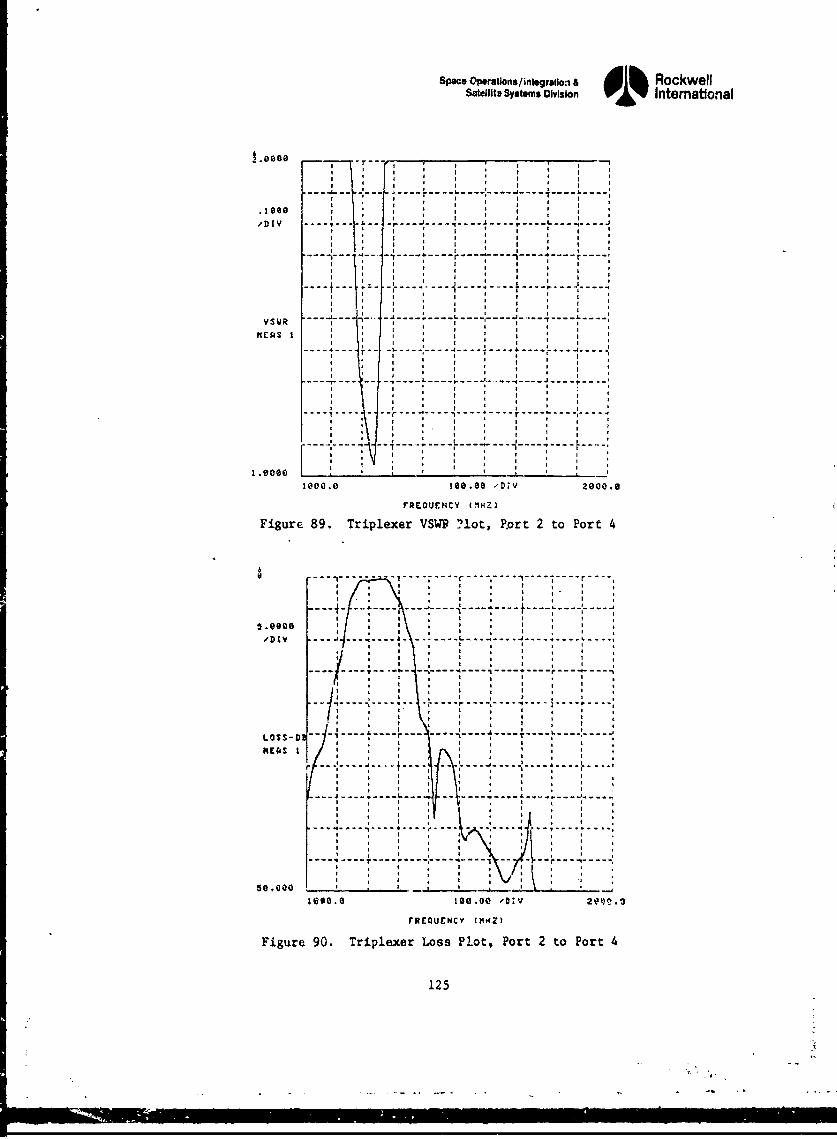
Space Operations/ integratio.i & ah RockwellSitillita Systems Division International
-o--- --- - -
- ---
EI ,Ii L I
-- ~ --
000 1 , 2a I I
0V-------------------------
. I I * o
T r
,$DIV ... . .- .. ." . . ... . ... .0. . °. . ..
LOS- I --- *--- -a--A-- -- ...
a I i
I a
I i
- - - -, E IS I
0.0000 ____________ __
1000.0 100.00 ,D.V 0.
rR:auF.Ncy C 1Hzi
Figure 890. Triplexer Loss Plot, P~ort 2 to Port 4
t I 1I 5 I
------..--.......- -€ i I I
I i I a i aIII * I , I a
a aI I a I
I I a I Ii ia I I I
- -.... ..... :....-- -. ..-- -...-- ....
a I
* . I I ahC. 4S I I ', I * ,' ' '
a R F. £1 I a ,I * I
-... .- •, -- . .. . ..4- - - - . -..-.. •...i. . . .£ a I I , I I
.•I I i I I
i , i I ! I i
i II i i I
a * i IIo *I , I
SI a I Iii
SI S
.... 00 a."....±i., i i
ioo~ i.000'I
iR i u i~ , i i~
Fiue 0 Trpee Lo Plot Pot 2 toPr
,125
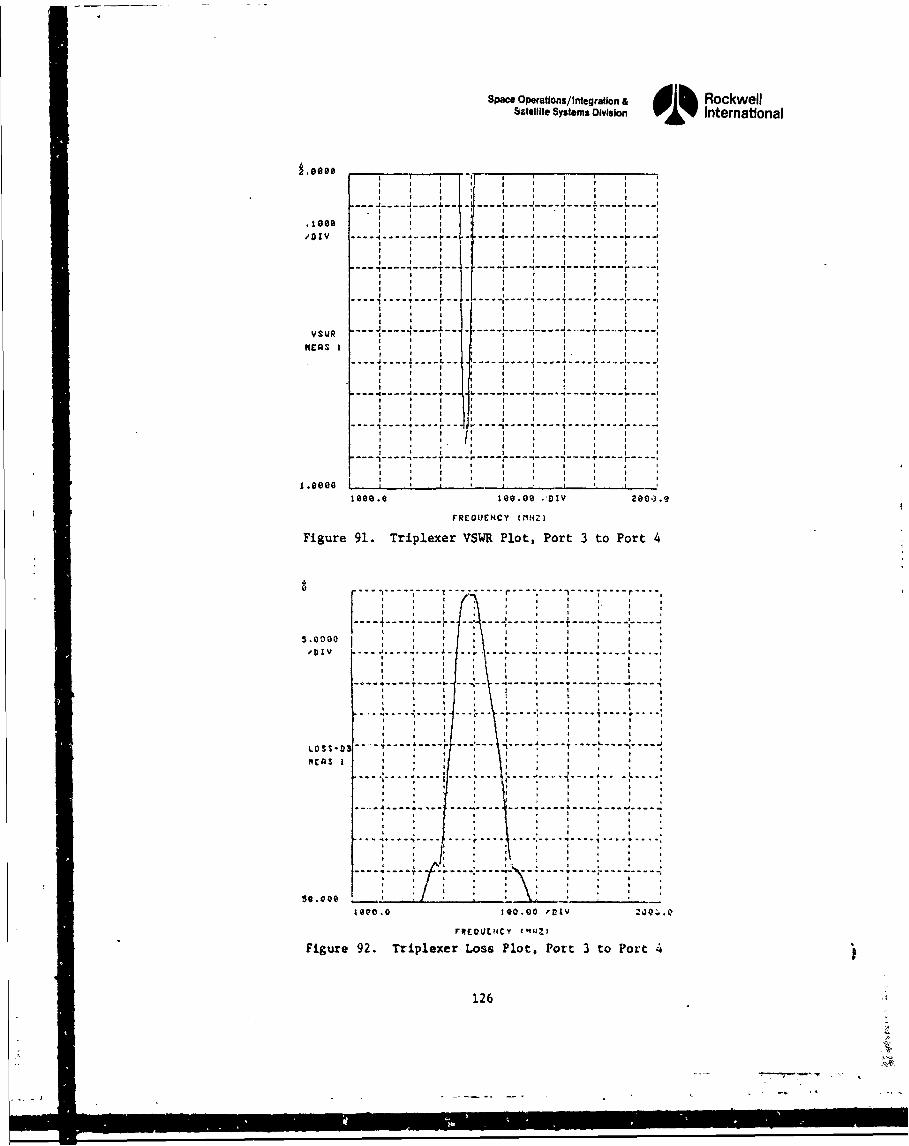
Space Operations/Integration & RockwellSatellite Systems Division International
/DI I 4 -
.-- .I . . .. . . . .... - - - --- - - - = - - - - - - - •. . . . . . . . .i
rI - I - 4- -
I t i l I ! tMH I
I 4 4 I i 4 &
i I 4 4 4
' i" ....... .....'
I I I 4
I 4 I I 4 4 4I 4 4 i i 4
I 4 4 4 4 l 4 l
.3----------- ------. -----------
I I I I I I 4 I I
S, .... J..... i.... . . ...... L.... .... ------------. . .. .
HES 4 1 4
I I4 4 4 Ii 4 I i I
I 4 .
I 4 4 1 i 4 4 iI i I 4 I i 4I4i
4 I l 4 I 4I I 4 I 4
'~10 0 --.DIV ' '
4 I r j i i
I I 4 I i I 4 iI I i I 4 I 4
i ie1eo 1 I 4
1800.0 $08.00 *.DIV 200,3.0
rREOUEHCY IMHT ZIFigure 91. Triplexer VSWs Plot, Port 3 to Port 4
I 4 I 4 4 4 4 1
4 4 4 3 I i "
i 4 i i 4
4 4 i i
I I4 - 4 4 4 4i 4 /. 4 i 4 4
4 44 4 4, ,4. . .. . .
.o, -t ... o "• l -~--- - -/ 4
4 4
-
, 4.. . . . . . -
12
i l I I l
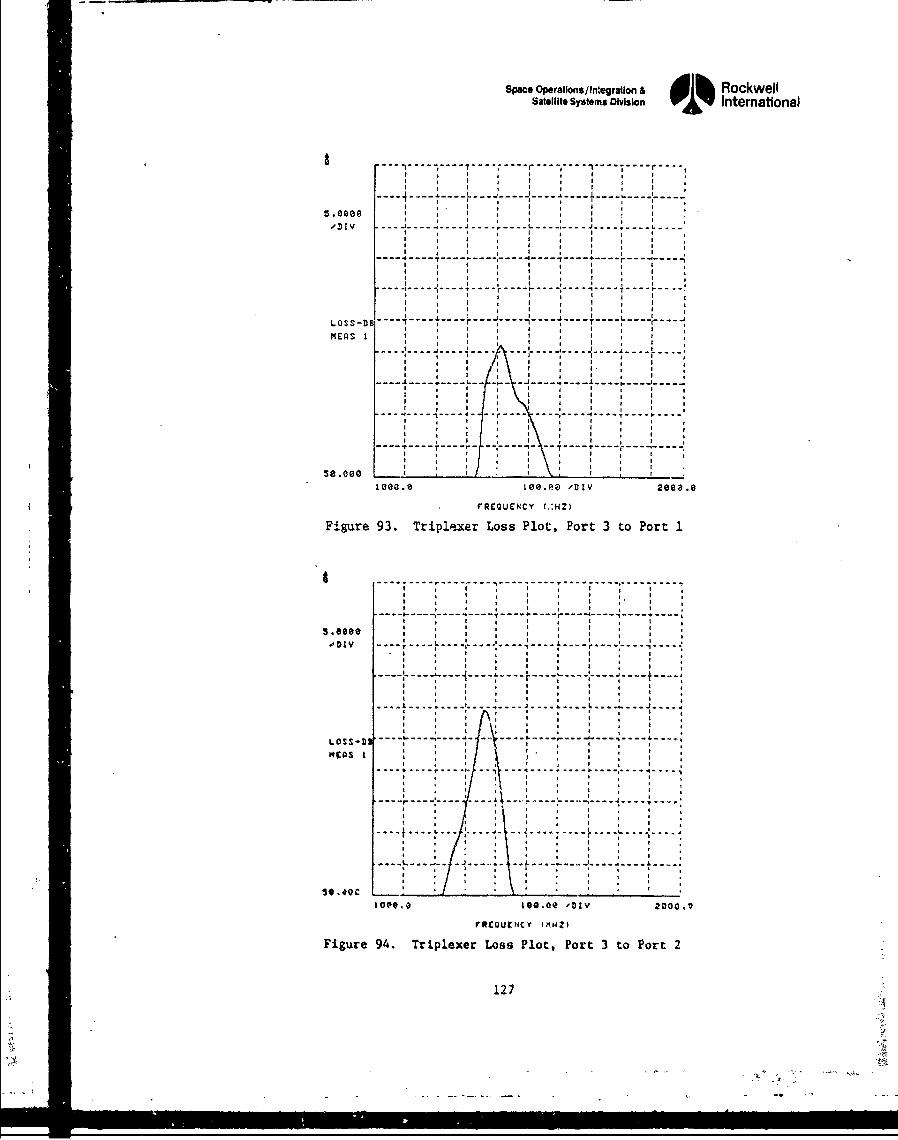
Space Operations/ nWegration & d Il RockwellSatellite Systems Division International
I i I 4 ! 4
/ 4 4 I I
----------------- --------- --------- ---
S . I 4s.eeoe , 4 , .
'DIV-------------------------------..
Ai 4 4
It I 4 I 444 I I I
---- --- --- --- ---- --- --- --- 4-- -_--A ---
I i I
4 I 4.
Figur 9. , P F
.OS-DI ------ 4
"COS I
..~~ ~... .. . . . . .)V °...........................
I - . I- - - - - - - - -.
4 4 I 4 I 4
I g I I 4 4
. .... . I .. .4 I . . ....... .- .
s 40- / it
4 4 I 4 4 4 4 4
10 10 te~a tot I 00 I .
4 4 I 4 I 4
Fiue 4 Tiplr Los Plt Por 3 to Pot
5e. oQ ,. , i,2leea.e I ee.•. ')iv 28e0<.e
fReQUENCY I,:Hz)
Figure 93. Triplexer Loss Plot, Port 3 to Port 1
4 4 4 I 4
4I 4 4 4 I
: 4 - - . . . .•. .4 4
4 4 4 I 4
4 i 4 4 I 4 4 4I t I t t
4 4 4 44. + . . . 4.. . 4 . . - 4. . J 4.. 4 .. 4. . 4. . . ..i 4 4.li 4 4 4 4 4
I 4 4 4 i 4 4 4 4 4i 4 i i - - - I- - - I .
4 4'-l l , , 4 , 4 ,4 4 4 i+ • 4 4 4 4I
"tc 4 . 4
SI 4 * 4 4
' 4 . . . . .*4 * I * i 4
4 , 4 i 4 I , 4 4
* .4C. , . . *
Figure 94. Tripiexer Losis Plot, Port 3 to Port 2
127
1
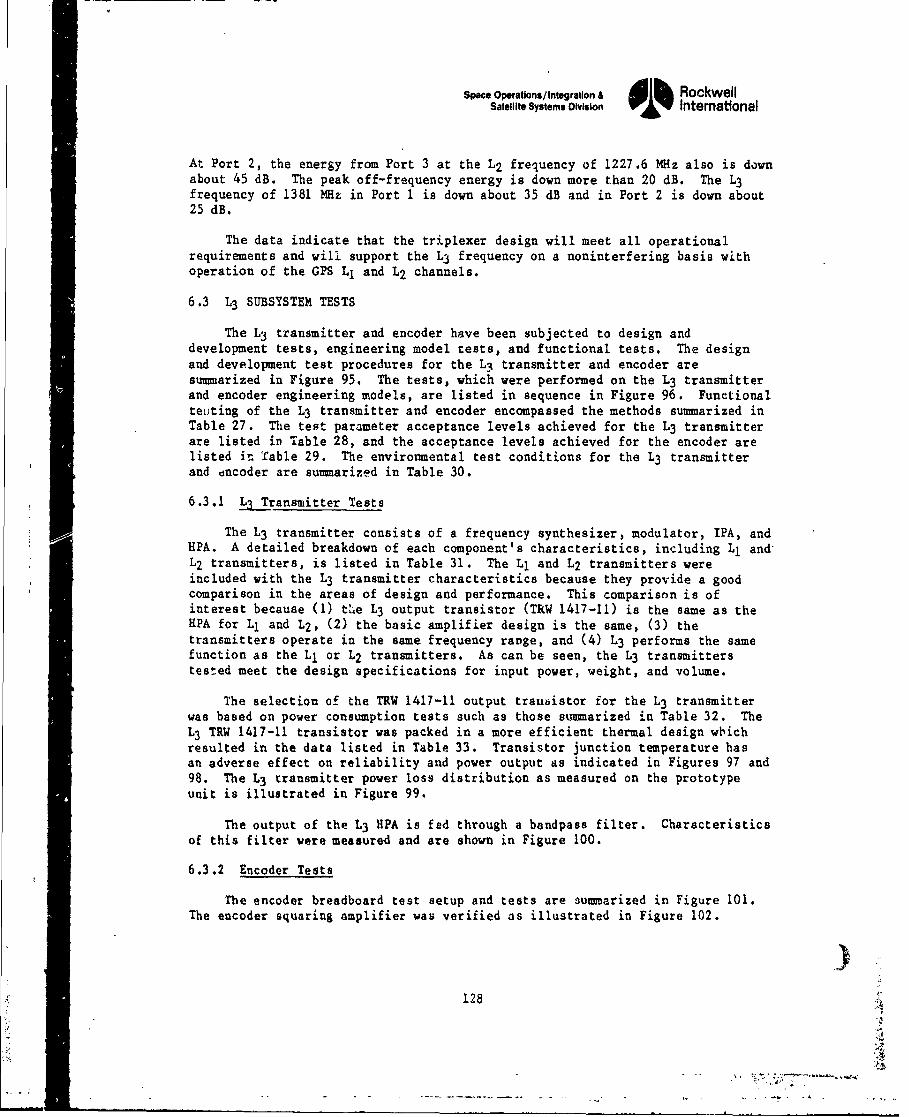
Space Operations/ Integration& Ad& RockwellSatellite Systems Division International
At Port 2, the energy from Port 3 at the L2 frequency of 1227.6 MHz also is downabout 45 dB. The peak off-frequency energy is down more than 20 dB. The L3frequency of 1381 MHz in Port I is down about 35 dB and in Port 2 is down about25 dB.
The data indicate that the triplexer design will meet all operationalrequirements and will support the L3 frequency on a noninterfering basis withoperation of the GPS L1 and L2 channels.
6.3 L3 SUBSYSTEM TESTS
The L3 transmitter and encoder have been subjected to design anddevelopment tests, engineering model tests, and functional tests. The designand development test procedures for the L1 transmitter and encoder aresummarized in Figure 95. The tests, which were performed on the L3 transmitterand encoder engineering models, are listed in sequence in Figure 96. Functionalteuting of the L3 transmitter and encoder encompassed the methods summarized inTable 27. The test parameter acceptance levels achieved for the L3 transmitterare listed in Table 28, and the acceptance levels achieved for the encoder arelisted in Table 29. The environmental test conditions for the L3 transmitterand encoder are sumnarized in Table 30.
6.3.1 13 Transmitter Tests
The L3 transmitter consists of a frequency synthesizer, modulator, IPA, andHPA. A detailed breakdown of each component's characteristics, including L1 andL2 transmitters, is listed in Table 31. The L1 and L2 transmitters were
included with the L3 transmitter characteristics because they provide a goodcomparison in the areas of design and performance. This comparison is ofinterest because (1) tLe L3 output transistor (TRW 1417-11) is the same as theHPA for L1 and L2, (2) the basic amplifier design is the same, (3) thetransmitters operate in the same frequency range, and (4) L3 performs the samefunction as the L1 or L2 transmitters. As can be seen, the L3 transmitterstested meet the design specifications for input power, weight, and volume.
The selection of the TRW 1417-11 output trattaistor for the L3 transmitterwas based on power consumption tests such as those summarized in Table 32. TheL3 TRW 1417-11 transistor was packed in a more efficient thermal design wbichresulted in the data listed in Table 33. Transistor junction temperature hasan adverse effect on reliability and power output as indicated in Figures 97 and98. The L3 transmitter power loss distribution as measured on the prototypeunit is illustrated in Figure 99.
The output of the L3 HPA is fed through a bandpass filter. Characteristics
of this filter were measured and are shown in Figure 100.
6.3.2 Encoder Tests
rhe encoder breadboard test setup and tests are 8utmarized in Figure 101.The encoder squaring amplifier was verified as illustrated in Figure 102.
128
S1
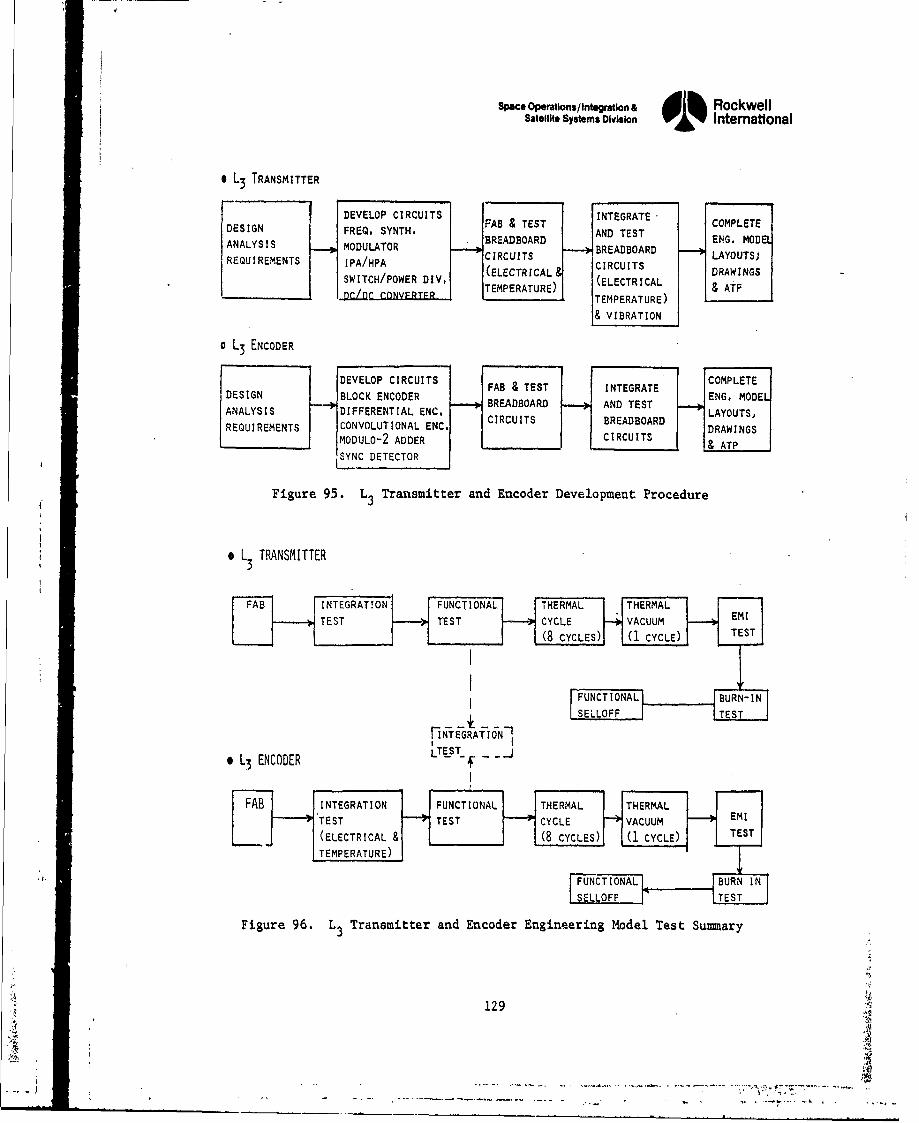
Space Operations/ Integration& RockwellSatellite Systems Division Intemational
* L3 TRANSMITTER
DEINDEVELOP CIRCUITS INTEGRATE COMPLETEDESIGN FREQ, SYNTH, FAB & TEST CMLTLUREENT SYNTHPA BREADBOADAND TESTENG. MODANALYSIS MODULATOR lBREADBOARD ANDTOES
REQUIREMENTS ICIPA/HPA CIRCUITS LAYOUTS)
SWITCH/POWER DIV. (ELECTRICAL CIRCUITS DRAWINGSTEMPERTURE) (ELECTRICAL&AF
I.DLL~rCONVFRTFR TEMPERATURE) TEMPERATURE) & ATP
& VIBRATION
o L3 ENCODER
DEVELOP CIRCUITS FAB & TEST INTEGRATE COMPLETEDESIGN BLOCK ENCODER BREADBOARD AND TEST
ANALYSIS DIFFERENTIAL ENC. C B OLAYOUTS,REQUIREMENTS CONVOLUTIONAL ENC. CIRCUITS BREADBOARD DRAWINGS
MODULO-2 ADDER CIRCUITS I& ATPSYNC DETECTOR
Figure 95. L3 Transmitter and Encoder Development Procedure
e L TRANSMITTER3
FAB INTEGRAT!ON FUNCTIONAL THERMAL THERMAL
TEST TEST CYCLE VACUUM I(8 CYCLES) I(1 CYCLE) TS
IFUNCTIONALý IBURN-IN1SELLOFF TEST
* L3 ENCODER LTET - j
FABINTEGRATION -FUNCTIONALI THERMAL • THERMAL • EsT
' • TEST TEST CYCLE VACUUM 0 EM{I
L--- (ELECTRICAL & (8 CYCLES) (1 CYCLE) TS
•TEMPERATURE) -
|SELLOFF .I TEST"
Figure 96. L3 Transmitter and Encoder Engineering Model Test Sumnary
129
............................
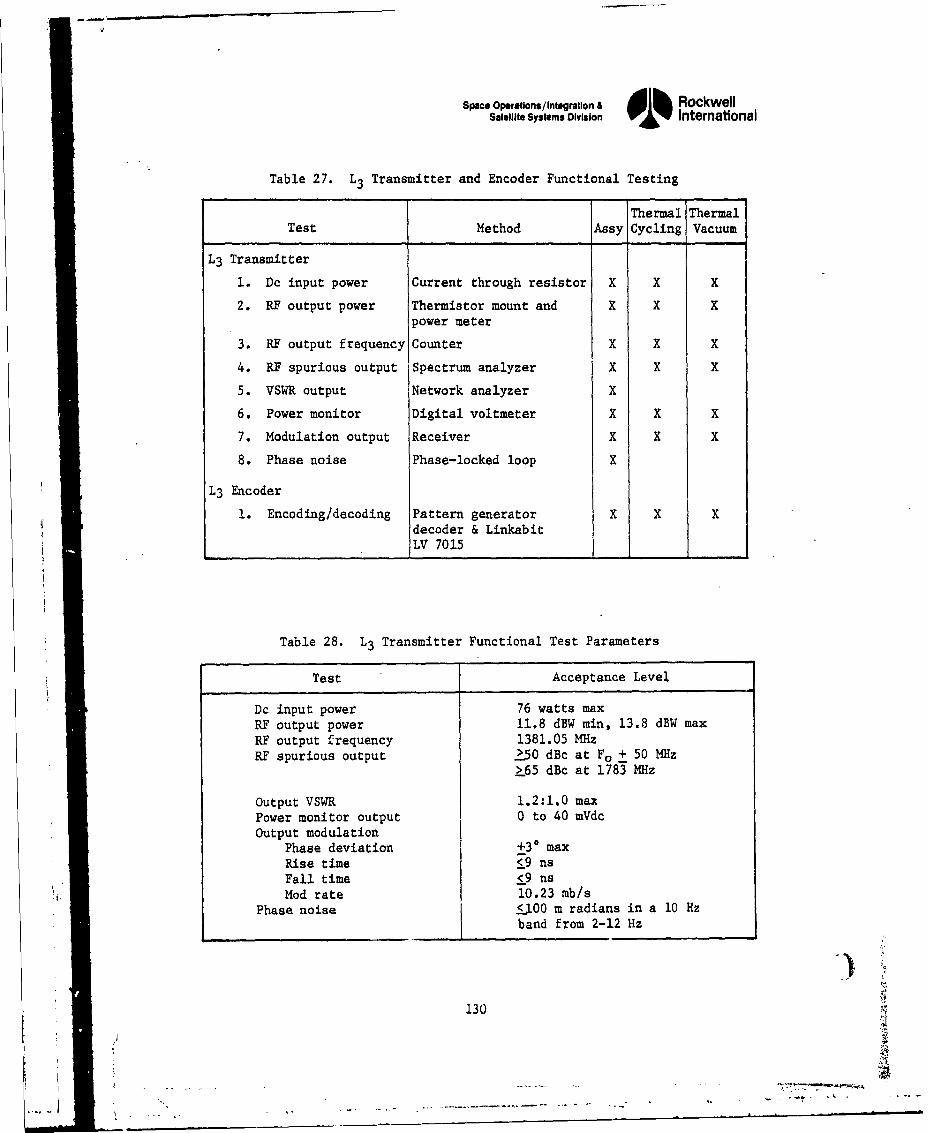
Space Operations/Intogration & JIh RockwellSatellite Systems Division w1% International
Table 27. L3 Transmitter and Encoder Functional Testing
Thermal ThermalTest Method Assy Cycling Vacuum
L3 Transmitter
1. Dc input power Current through resistor X X X
2. RF output power Thermistor mount and X X Xpower meter
3. RF output frequency Counter X X X
4. REF spurious output Spectrum analyzer X X X
5. VSWR output Network analyzer X
6. Power monitor Digital voltmeter X X X
7. Modulation output Receiver X X X
8. Phase noise Phase-locked loop X
L3 Encoder
1. Encoding/decoding Pattern generator X X Xdecoder & LinkabitLV 7015
Table 28. L3 Transmitter Functional Test Parameters
Test Acceptance Level
Dc input power 76 watts maxRF output power 11.8 dBW min, 13.8 dBW maxRF output frequency 1381.05 MHzRE spurious output >_50 dBc at F. ± 50 MHz
k_65 dBc at 1783 MHz
Output VSWR 1.2:1.0 maxPower monitor output 0 to 40 mVdcOutput modulation
Phase deviation +30 maxRise time <9 nsFall time <--9 nsMod rate 10.23 mb/s
Phase noise <jlO00 m radians in a 10 Hzband from 2-12 Hz
130
.. . . . . ...... - .-- ~ - -. ... ...... r .c -- 4
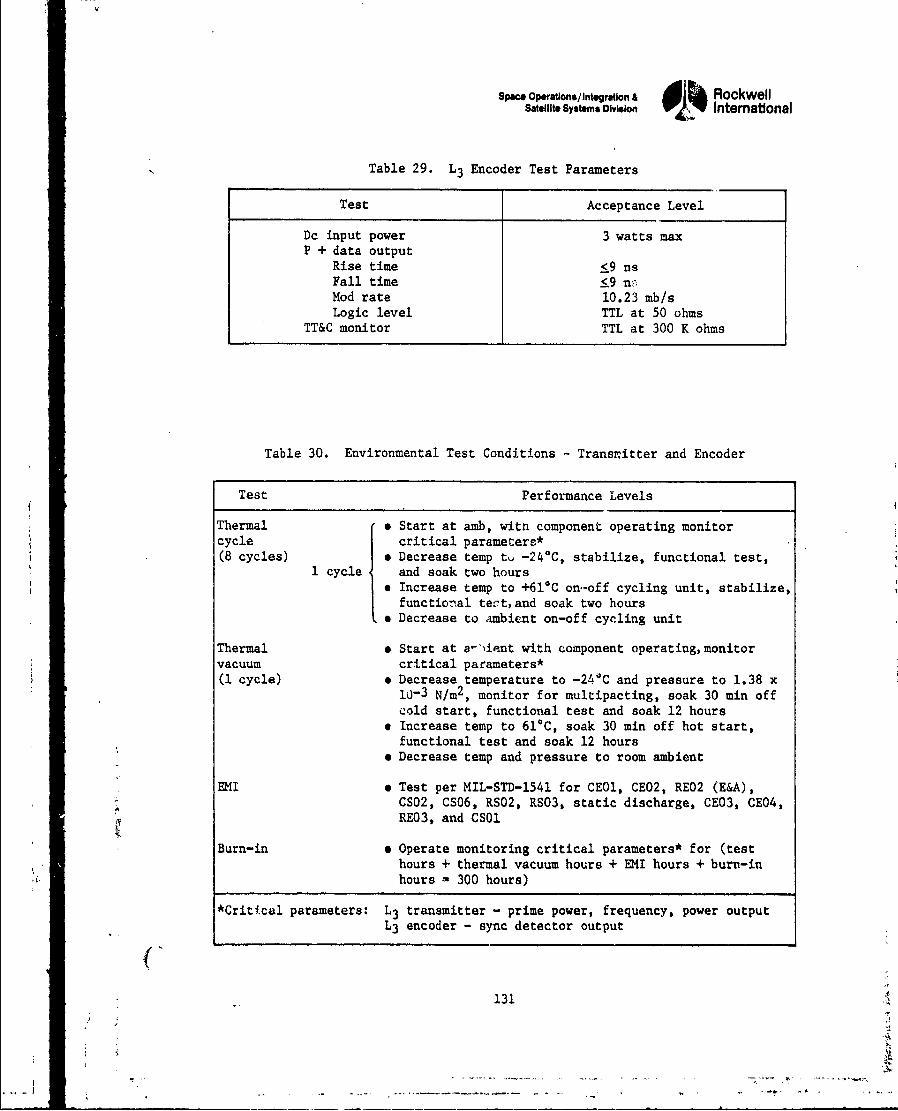
VA
Space Operatlons/Integrallon & RockwellSatellite Systems Division Intemational
Table 29. L3 Encoder Test Parameters
Test Acceptance Level
Dc input power 3 watts maxP + data output
Rise time <9 nsFall time <9 n--Mod rate 10.23 mb/sLogic level TTL at 50 ohms
TT&C monitor TTL at 300 K ohms
Table 30. Environmental Test Conditions - Transnitter and Encoder
Test Performance Levels
Thermal * Start at amb, witn component operating monitorcycle critical parameters*(8 cycles) e Decrease temp t, -24*C, stabilize, functional test,
1 cycle and soak two hourse Increase temp to +610C on.-off cycling unit, stabilize,
functional teot, and soak two hourso Decrease to ambient on-off cycling unit
Thermal # Start at a-'lient with component operating, monitorvacuum critical parameters*(1 cycle) e Decrease temperature to -24%C and pressure to 1.38 x
10- 3 N/m2 , monitor for multipacting, soak 30 min offcold start, functional test and soak 12 hours
* Increase temp to 61'C, soak 30 min off hot start,functional test and soak 12 hours
9 Decrease temp and pressure to room ambient
EMI e Test per MIL-STD-1541 for CE01, CE02, RE02 (E&A),A CS02, CS06, RS02, RS03, static discharge, CE03, CE04,
RE03, and CS01
Burn-in * Operate monitoring critical parameters* for (testhours + thermal vacuum hours + EMI hours + burn-inhours - 300 hours)
*Critical parameters: L3 transmitter - prime power, frequency, power outputL3 encoder - sync detector output
(-131
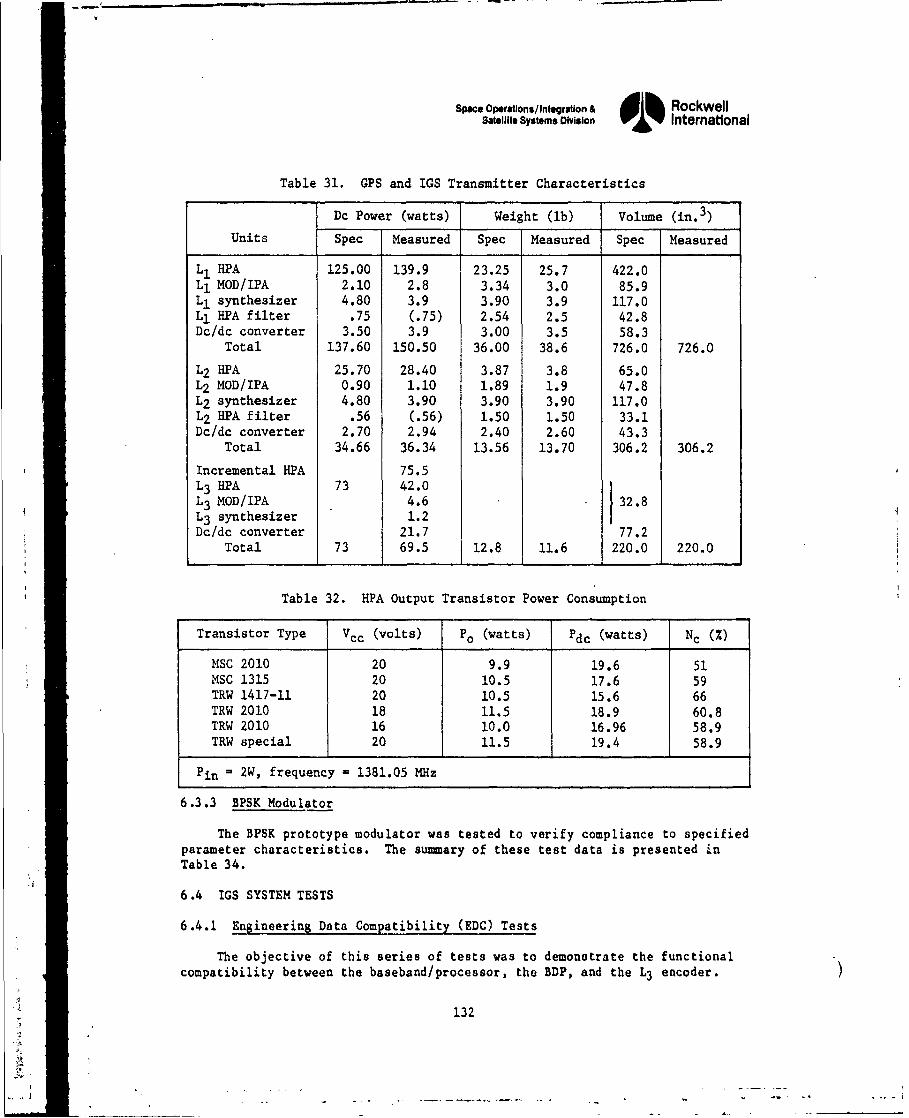
Space Olerstlons/Integration a I1h RockwellSatellite Systems Division 01% International
Table 31. GPS and IGS Transmitter Characteristics
Dc Power (watts) Weight (ib) Volume (in. 3 )
Units Spec Measured Spec Measured Spec Measured
L, HPA 125.00 139.9 23.25 25.7 422.0L1 MOD/IPA 2.10 2.8 3.34 3.0 85.9L1 synthesizer 4.80 3.9 3.90 3.9 117.0L1 HPA filter .75 (.75) 2.54 2.5 42.8Dc/dc converter 3.50 3.9 3.00 3.5 58.3
Total 137.60 150.50 36.00 38.6 726.0 726.0
L2 HPA 25.70 28.40 3.87 3.8 65.0L2 MOD/IPA 0.90 1.10 1.89 1.9 47.8L2 synthesizer 4.80 3.90 3.90 3.90 117.0L2 HPA filter .56 (.56) 1.50 1.50 33.1Dc/dc converter 2.70 2.94 2.40 2.60 43.3
Total 34.66 36.34 13.56 13.70 306.2 306.2
Incremental HPA 75.5L3 HPA 73 42.0L3 MOD/IPA 4.6 32.8L3 synthesizer 1.2Dc/dc converter 21.7 77.2
Total 73 69.5 12.8 11.6 220.0 220.0
Table 32. HPA Output Transistor Power Consumption
Transistor Type Vcc (volts) Po (watts) Pdc (watts) Nc (%)
MSC 2010 20 9.9 19.6 51MSC 1315 20 10.5 17.6 59TRW 1417-11 20 10.5 15.6 66TRW 2010 18 11.5 18.9 60.8TRW 2010 16 10.0 16.96 58.9TRW special 20 11.5 19.4 58.9
Pin - 2W, frequency - 1381.05 MHz
6.3.3 BPSK Modulator
The BPSK prototype modulator was tested to verify compliance to specifiedparameter characteristics. The sunmary of these test data is presented inTable 34.
6.4 IGS SYSTEM TESTS
6.4.1 Engineering Data Compatibility (EDC) Tests
The objective of this series of tests was to demonstrate the functionalcompatibility between the baseband/processor, the BDP, and the L3 encoder.
132
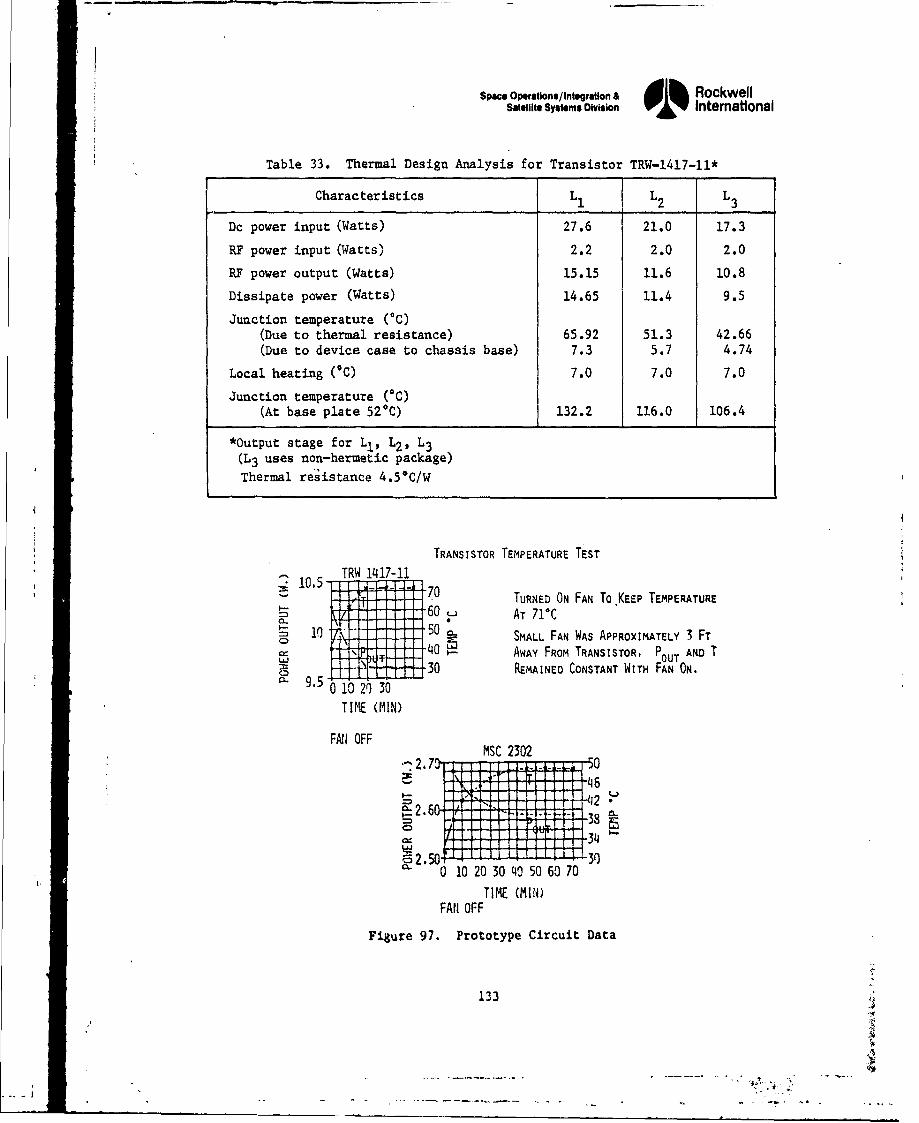
Space Opa'tions/Intogration & RockwellSatellite Systems Division International
Table 33. Thermal Design Analysis for Transistor TRW-1417-11*
Characteristics L1 L2 L_ 3
Dc power input (Watts) 27.6 21.0 17.3
RF power input (Watts) 2.2 2.0 2.0
RF power output (Watts) 15.15 11.6 10.8
Dissipate power (Watts) 14.65 11.4 9.5
Junction temperature (*C)(Due to thermal resistance) 65.92 51.3 42.66(Due to device case to chassis base) 7.3 5.7 4.74
Local heating (0C) 7.0 7.0 7.0
Junction temperature (*C)(At base plate 520C) 132.2 116.0 106.4
*Output stage for LI, L2 , L3
(L3 uses non-hermetic package)
Thermal resistance 4.5*C/W
TRANSISTOR TEMPERATURE TEST
TRW 1417-11-70 TURNED ON FAN TO KEEP TEMPERATURE
AT 71C1- - ----- 501D 0 5 0 - - SMALL FAN WAS APPROXIMATELY 3 FT04
, p - -- 4AWAY FROM TRANSISTOR. POUT AND TU T -- OUT
CDT2 -11 1 -30 REMAINED CONSTANT WITH FAN ON.
TIME (MIN)
FAIN OFF MSC 2302.T279 h .J. L,---,"50
,6...
1 3054250 10 20 30 40 50 60 70
TIME (MIN)FAN OFF
Figure 97. Prototype Circuit Data
133
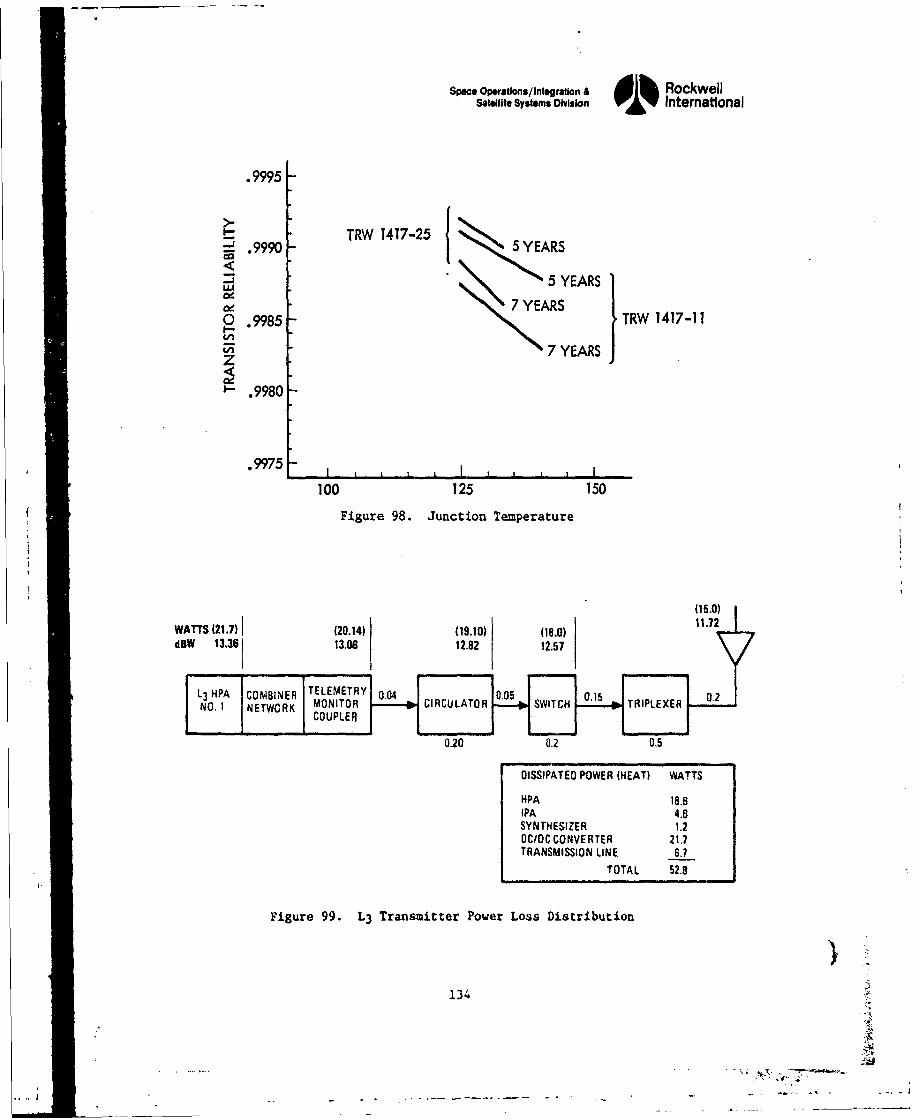
Space Opstions/Integration A RockwellSatellite Systems Division oi% International
.9995
TRW 1417-25S.9990 -ý 15 Y EAR S
-j 5 YEARS
7 YEARS0 .9985 TRW 1417-11
SI- 7 Y EA RS
.9980
.9975 ,[ ,
100 125 150
Figure 98. Junction Temperature
WATTS (21.7)I (20.14) 19.10) (18.0).
dBW 13.36 13.06 12582 12.57
L3HACOMBINER TELEMETRY ao0.5 .1N.I NEWR MOIR CIRCULATOR SWITCH bTRIPLEXER
0.20 0.2 0.5
0ISSIPATED POWER (HEAT) WATTS
HPA 18.6IPA 4.6SYNTHESIZER 1.2OC/OC CONVERTER 21.7TRANSMISSION LINE 6.7
TOTAL 52.8I.
Figure 99. L3 Transmitter Power Loss Distribution
134
7 .--.---
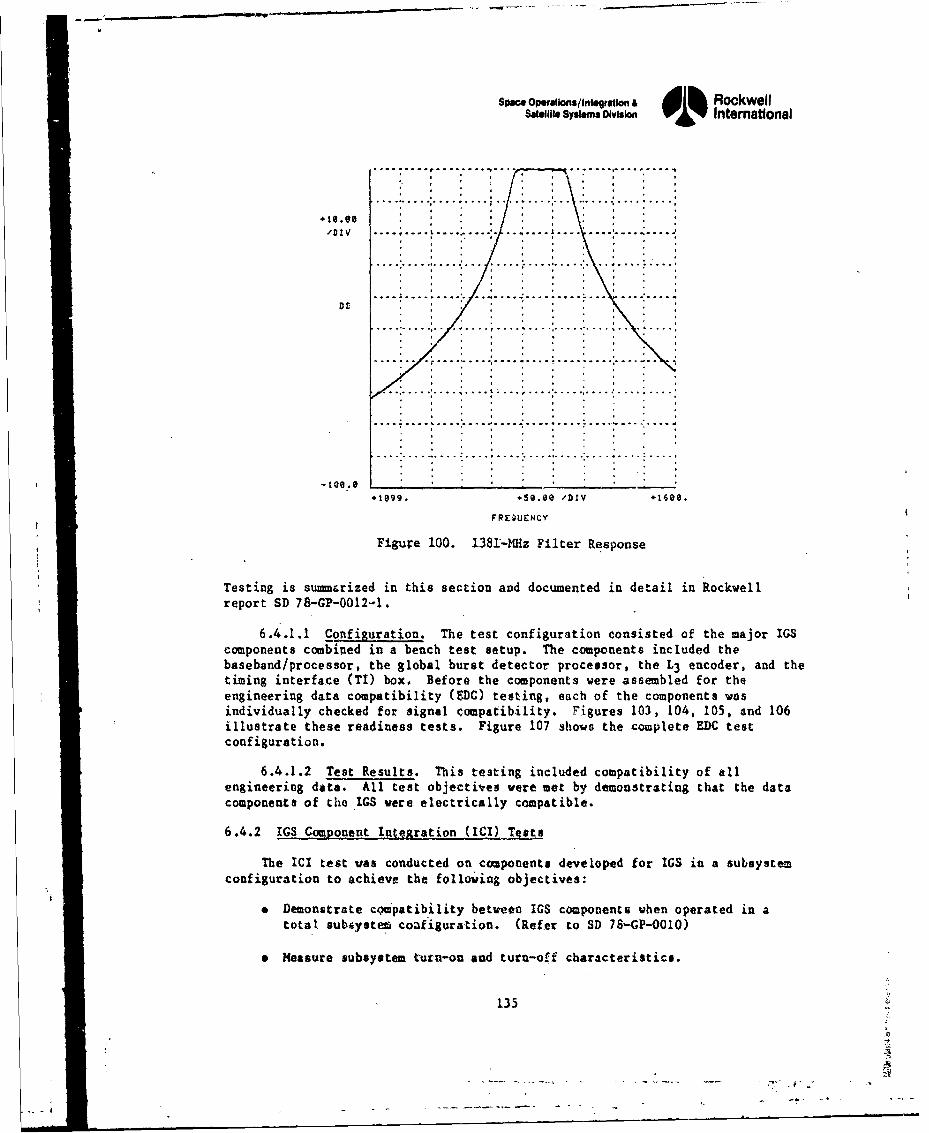
--- ul-
Soe. Opet.ions/lnt."eran & l RockwellS.t•O, Systes DiVISIn 01% Intemattonal
/DIV . ... . .. . . . . . . ..
"" . . .... . . .... . ...... .... . ....... .
Dtt
. ......o ...,o ....... .. . .... .o~ I . ..... o. .... "....
-100.9
+1099. +56.8e /DI V *1600.
FREOUENCY
Figure 100. 1381-MHz Filter Response
Testing is su-m-rized in this section and documented in detail in Rockwellreport SD 78-GP-0012-1.
6.4.1.1 Configuration. The test configuration consisted of the major IGScomponents combined in a bench test setup. The components included thebaseband/processor, the global burst detector processor, the L3 encoder, and thetiming interface (TI) box. Before the components were assembled for theengineering data compatibility (EDC) testing, each of the components wasindividually checked for signal compatibility. Figures 103, 104, 105, and 106illustrate these readiness tests. Figure 107 shows the complete EDC testconfiguration.
6.4.1.2 Test Results. This testing included compatibility of allengineering data. All test objectives were met by demonstrating that the datacomponents of the IGS were electrically compatible.
6.4.2 IGS CSMponent Integration (ICI) Tests
The ICI test was conducted on components developed for IGS in a subsystemconfiguration to achieve the following objectives:
* Demonstrate c~mpatibility between IGS components when operated in atotal subsystem coafiguration. (Refer to SD 7S-GP-0010)
* Measure subsystem turn-on and turn-off characteristics.
135
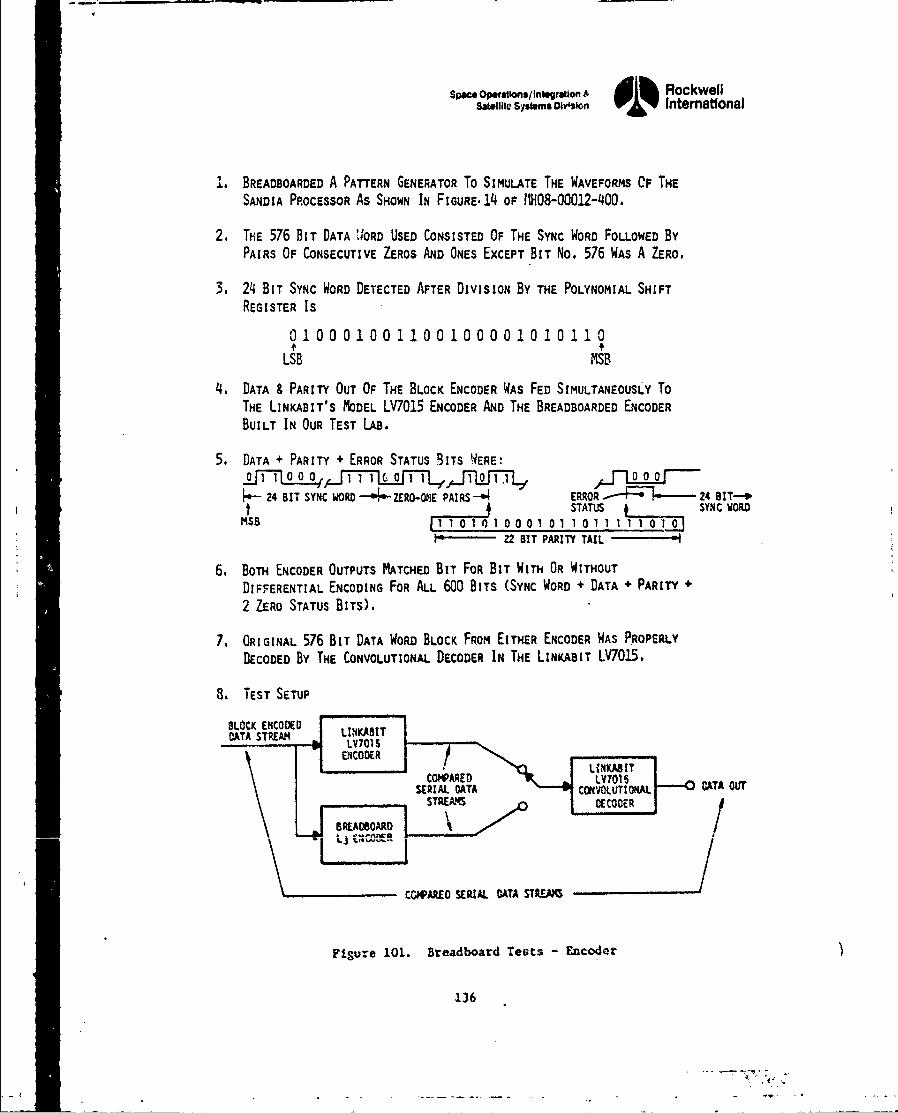
Spaceopw~s/lnw/g,• w di RockwellSatellite Systems Division I F International
1 BREADBOARDED A PATTERN GENERATOR To SIMULATE THE WAVEFORMS CF THE
SANDIA PROCESSOR As SHOWN IN FIGURE. 14 OF IH08-00012-400.
2. THE 576 BIT DATA 1;ORD USED CONSISTED OF THE SYNC WORD FOLLOWED ByPAIRS OF CONSECUTIVE ZEROS AND ONES EXCEPT BIT No. 576 WAS A ZERO.
3. 24 BIT SYNC WORD DETECTED AFTER DIVISION BY THE POLYNOMIAL SHIFTREGISTER IS
O10001001100100001010110LSB MSB
4. DATA & PARITY OUT OF THE BLOCK ENCODER WAS FED SIMULTANEOUSLY ToTHE LINKABIT'S MODEL LV7015 ENCODER AND THE BREADBOARDED ENCODER
BUILT IN OUR TEST LAB.
5. DATA + PARITY + ERROR STATUS 3ITS WERE:
24 BIT SYNC WORD --4 .ZERO-ONIE PAIRS-- ERROR - 24 BIT--*t 4 STATUS SYNC WORD
MSB 11 O1 0 1a 0001 0110111 T1100J1; - 22 BIT PARITY TAIL -4
6. BOTH ENCODER OUTPUTS MATCHED BIT FOR BIT WITH OR WITHOUT
DIFFERENTIAL ENCODING FOR ALL 600 BITS (SYNC WORD + DATA + PARITY +
2 ZERO STATUS BITS).
7. ORIGINAL 576 BIT DATA WORD BLOCK FROM EITHER ENCODER WAS PROPERLY
DECODED BY THE CONVOLUTIONAL DECODER IN THE LINKABIT LV70OI.
8. TEST SETUP
BL OC K E N C O DEDQ T S T E A " _ K i
CATA SII•AH | LLINM.ITCOWA'EL LV701.
SERIAL D)ATA •- CONVOLUTt ,. ATA OUT
/C -- OARE SERIAL OATA ST.LAN .
Fisure 101. Breadboard Tests - Encodor
136
•.;,-. ., .
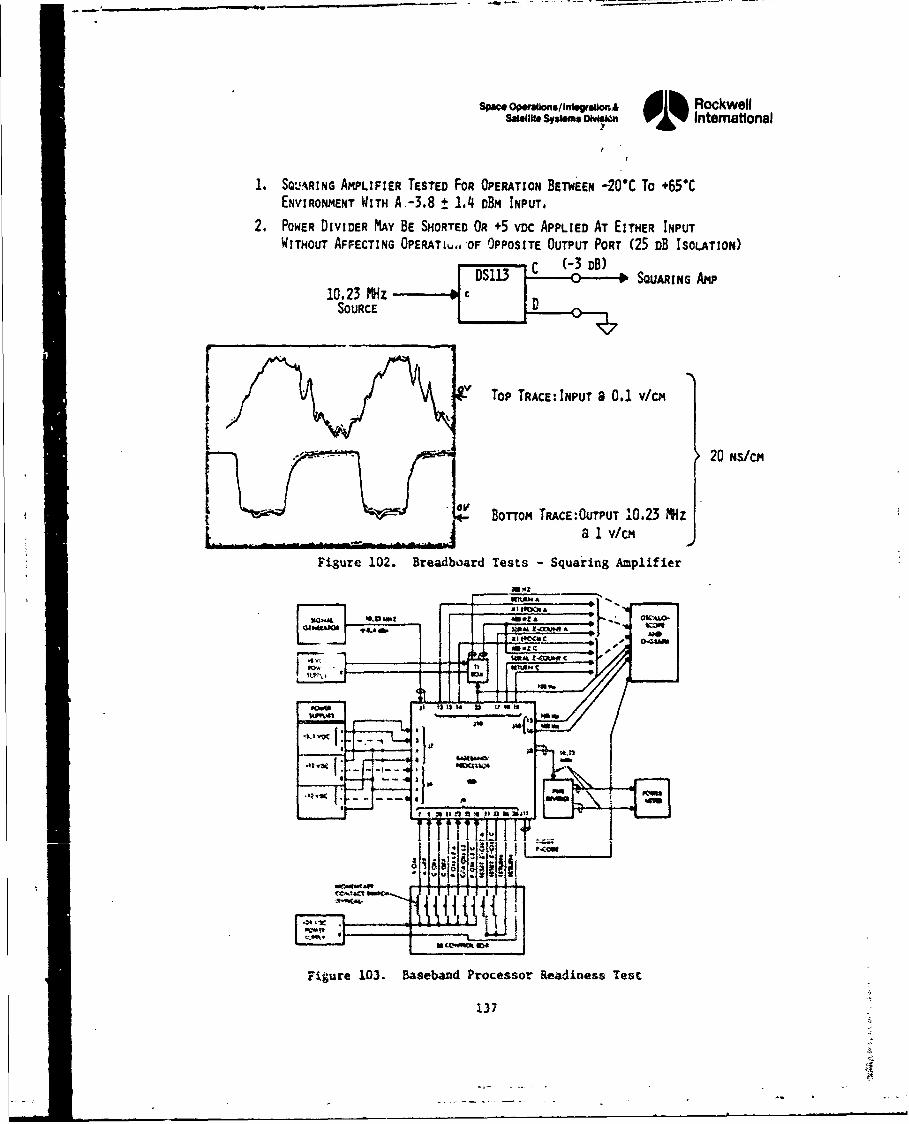
Space OpersansfIn,.gtaonAdl RockwellSaIeIte Sysems wDm"J A Intemational
1. SQUARING AMPLIFIER TESTED FOR OPERATION BETWEEN -20% To +65*CENVIRONMENT WITH A.-3.8 t 1.4 DBm INPUT.
2. POWER DIVIDER MAY BE SHORTED ORt +5 vDC APPLIED AT EITHER INPUTWITHOUT AFFECTING OPERAT1u,,'OF OPPOSITE OUTPUT PORT (25 DB ISOLATION)
DS113 C (-DB SQUARING AMP
10.23 M~lzSOURCE
D - -R
Top TRACE:INPUT 9 0.1 v/CM
20 MS/CM
BOTTOM TRACE-OUJTPUT 310.23 M9~za1V/CM
Figure 102. Breadboard Tests - Squaring Amplifier
am pi
"rak
lox 40t,
*0is
UMI W*~
FIue 10. Bsbn rcKsrRaiesTs
137
-_f
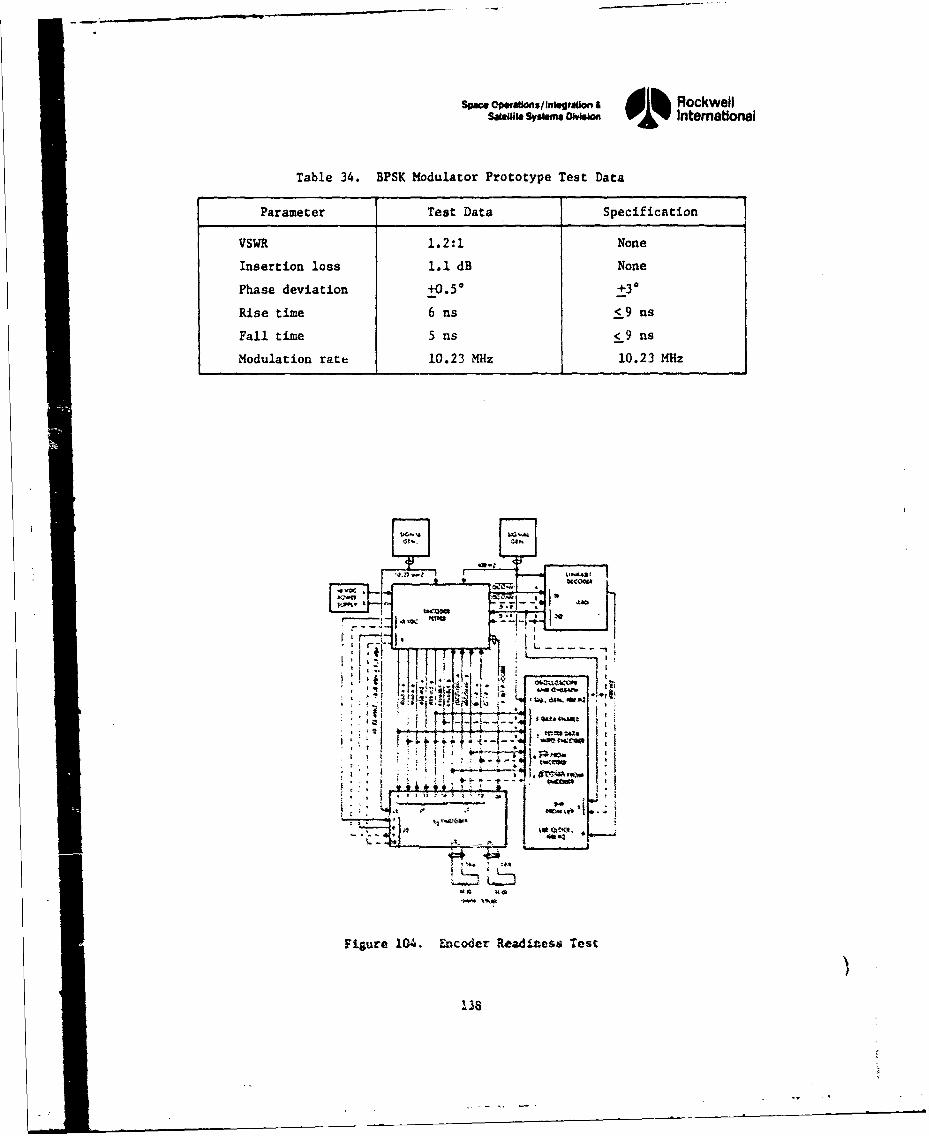
SPW 0W WS1"lgn 4" RockwellS"11 SYWMS WWW 01% International
Table 34. BPSK Modulator Prototype Test Data
Parameter Test Data Specification
VSWR 1.2:1 NoneI
Insertion loss 1.1 dB None
Phase deviation 05+3
Rise time 6 na <S9 ns
Fall time 5 ns < 9ns
Modulation rate 10.23 MHz 10.23 1fHz
; ~ (40"t*~ :WOW
Figure 104a. Encoder Readitaess Test
136
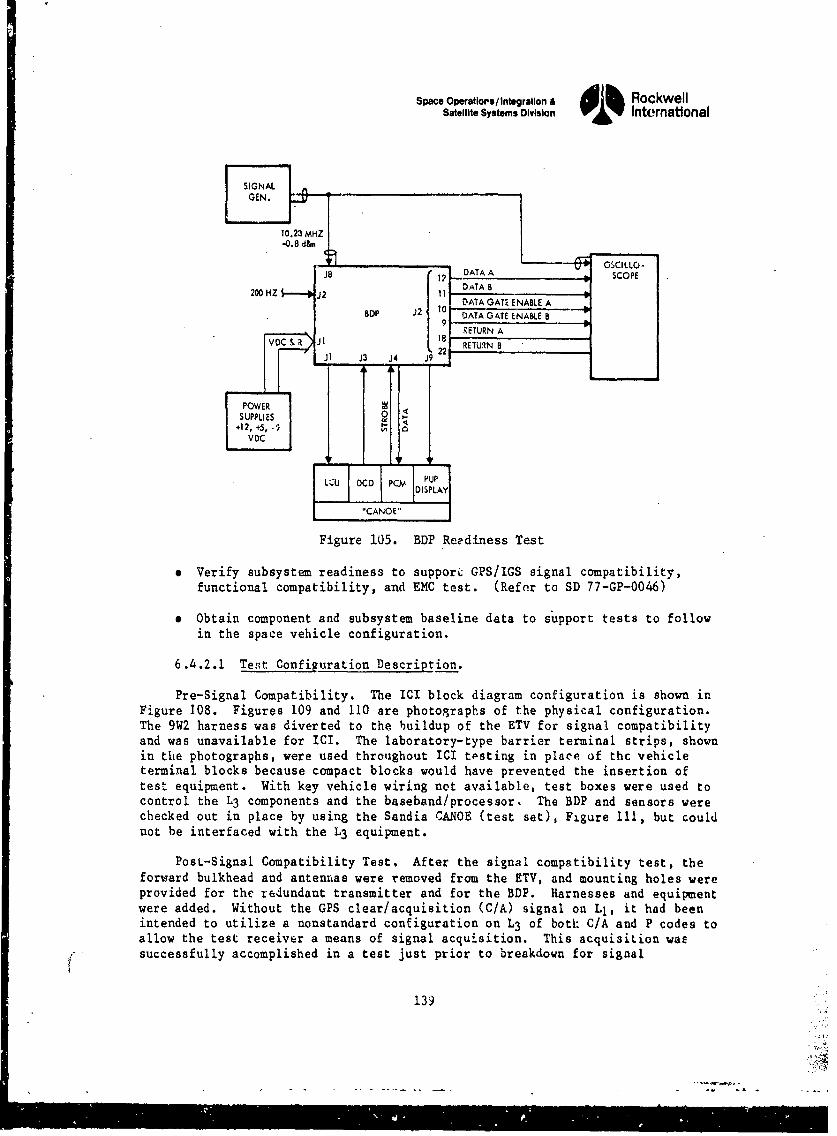
Space Operatiors/ Integration & RockwellSatellite Systems Division International
SIGNALGEN.
10. Fu 1 Pe-0.8 d~m
I OSClLLO.-
J8 an 1C DATA A t SCOPE
2006HZ. J2t o i DeTAs 5DATA GATE ENASLE A .Iv
BFP 12 10 DATA G piE ENABLE BVDC A 1 RETURN A
JA J3 J4 J9 22 RTR
POWERURN r
S UPPLI ES 4+12, +5,-'
VDC
C 1U
Figure 105. BDP Reediness Test
9 Verify subsystem readiness to support GPS/oGS signal compatibility,functional compatibility, and EMC test. (Refer to SD 77-GP-0046)
i Obtain component and subsystem baseline data to support e s tto followin the space vehicle configuration.
6.4.2.1 Tetqt Configuration Descrip iont
Pre-Signa l Compatibility. The ICI block diagram configuration is shown inFigure 108. Figures 109 and th0 are photographs of the physical configuration.The 9W2 harness was diverted to the buildup of the ETV for signae compatibilityand was unavailable for ICI. The after-the signbarrier terminal strips, shownin the photographs, were used throughout ICI t hsting in place of th o vehicleterminal blocks because compact blocks would have prevented the insertion oftest equipment. With key vehicle wiring not available, test boxes were used tocontrol the L3 components and the baseband/processor. The BDP and sensors werechecked out in place by using the Sandia CANOE (test set), Figure 111, but couldnot be interfaced with the L3 equipment.
Post-Signal Compatibility Test. After the signal compatibility test, theforward bulkhead and antenuas were removed from the ETV, and mounting holes were
provided for the redundant transmitter and for the BDP. Harnesses and equipmentwere added. Without the GPS clear/acquisition (C/A) signal on Ll, it had beenintended to utilize a nonstandard configuration on L3 of both C/A and P codes toallow the test receiver a means of signal acquisition. This acquisition wassuccessfully accomplished in a test just prior to breakdown for signal
139
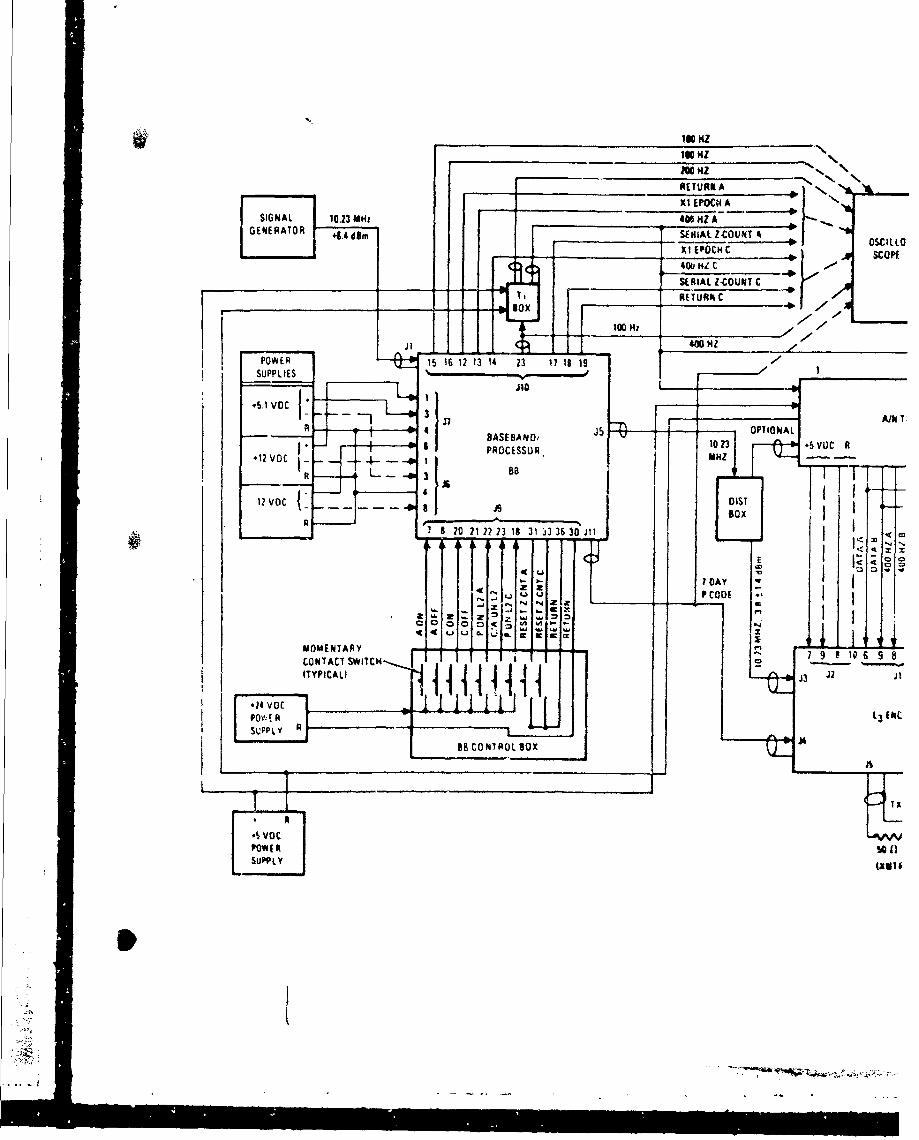
__________101GHZ
tooZ N
I" N.
Xt__ TIrnA "ilN
SIGNAL 10.23 MHt 400 HZ AGENERATOR 4.4 d~m SE1IAL Z-COUNT 4
XI E'OCH C OSWILLO400 fill c.I
SERIAL I-COUNT C
____ ___ ____ ___ ___ ___ __ - ETURIIIC
I 1 100 Hi .40 0 I
POWE-R-'• - 1 5 16 12 13 t4 23 17 18 19 Ile/
+5.1?VOC { -n A/%R -4 J -- OPTIONAL. • m ~ ~PROCESSOR vc
#12 VOC • 1 .4 _ . M z -'"
b 0N9
ITYPIC:AL) , 13 J2 J
-OV ! A C•..cSUPPLY RA AY
88 CONTROL BOX
I 5voc I
-.. Ti
K-T(-
II• m Il I 1l I iSUPPLiY iI"••I i l i•il•iiii[]i, ,rsam ~i/ ,,,16
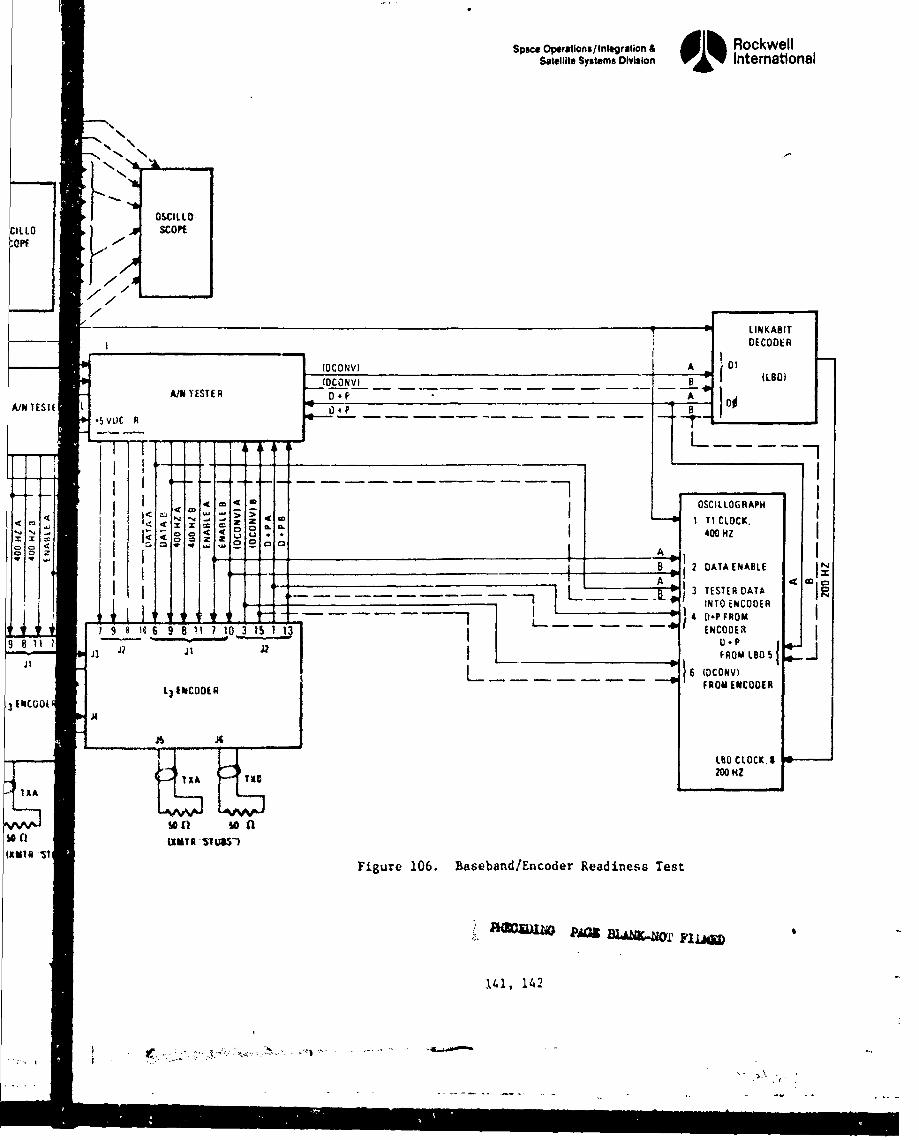
Space Operations/Intlegirtion & RockwellSatellite Systems Division International
"• ) OSCILLO.
]NILLO jSCOPE
O'-7
¶ - LINKABIT
OECODER
( Ota NVI A O
LJDCONV (LBO)AIN TESTER O ".F
A _
AJNTESTE L A B
SSvC R-
S ,,OSCILLOGRAPH
z l TI CLOCK.I M 6 < 400HZ
Ii I A_________________________B 2 DATA ENABLE
- iI1 L. . . 3 TESTERDATA1 17 IN T O EN C O DE R
--v - -IV 4 n.P FROM1 9 8 10 6 9 a 11 7 10 3 151 1 3, ENCOOE'i
9 8 it I - IJIJ3 F1 . . . .. . . . . . ROM LBO$f
6 WCOWV
3tINCOW t3 I WCODE R FROM ENCODER
A
LBO CLOCKI
11 IA TED 200 HZ
hi) so inhulA '
'
11111116 "STI
Figure 106. Baseband/Encoder Readiness Test
141, 142
i.
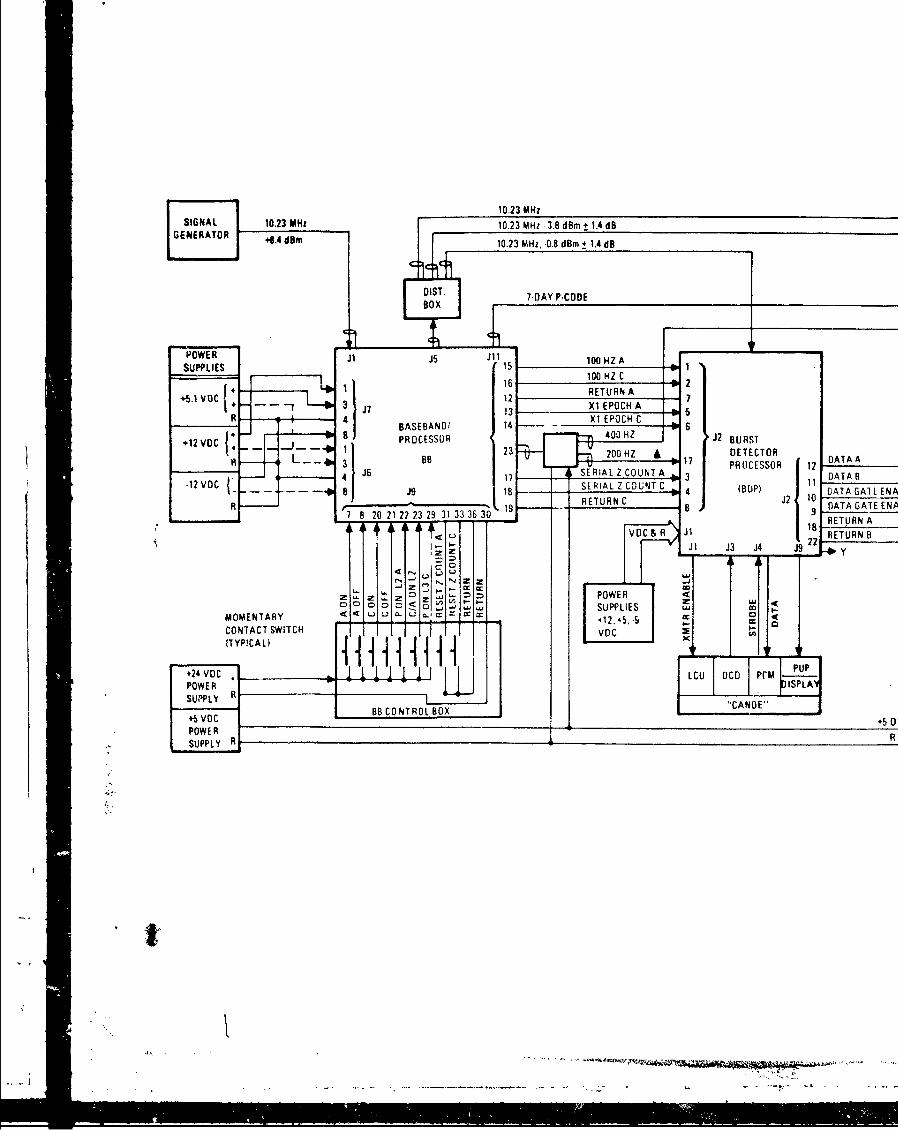
10.23 MHz
SIGNAL 10.23 MHz 10.23 MHz 3.8 d~m t 1.4 dB
GENERTOR 4 d~m10.23 MHz, -0.8 dBM 4 1.4 dB
POWERZJ5 100EHTOAPROCESSOR 12 DAA5
+5.1~~REUR Ao 2REUN
J 2 BýASE BRETURN14B
3MOMENTARESOR 12DAAY
COTC SWITCHA CUTC OP)DT G1 N
IVD ____ J 1
VOCO &BRCONTROLBOXRN
Z Y
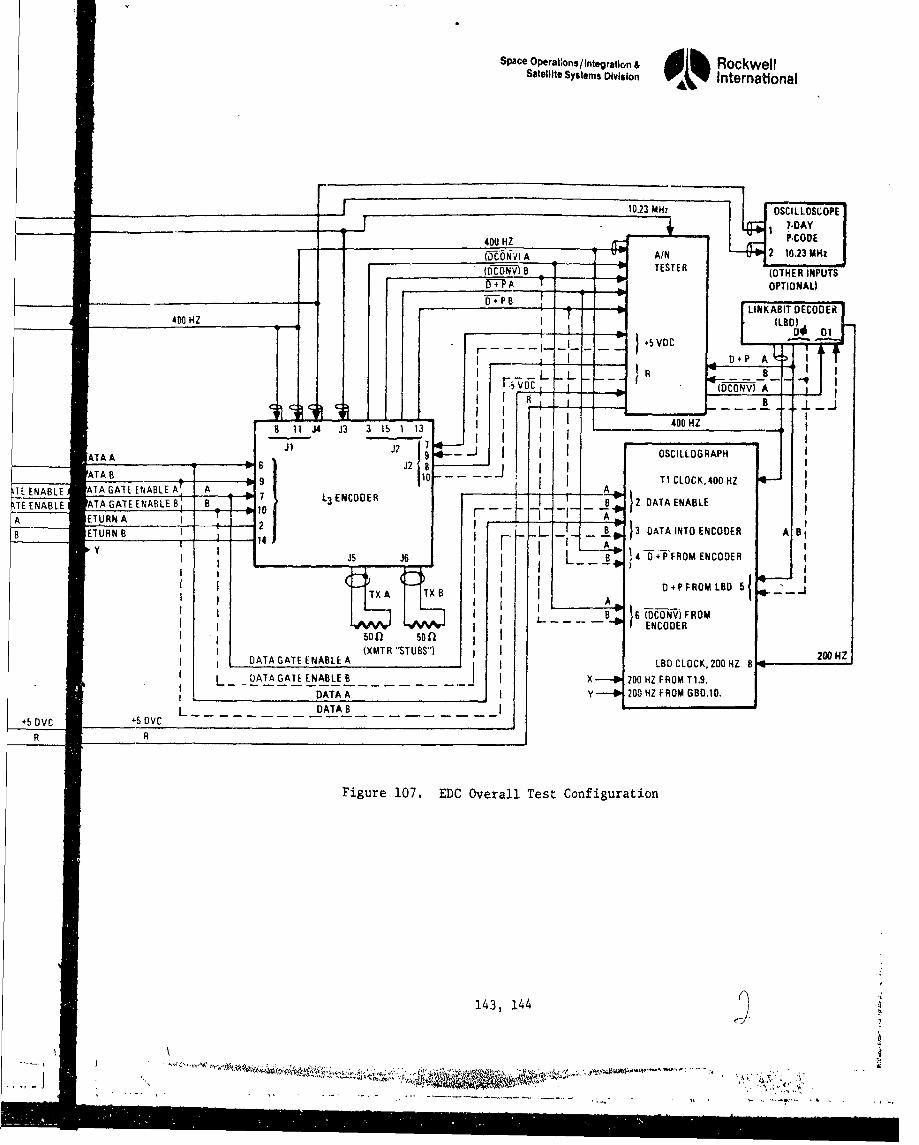
Space OPerat~ons/Integration & RockwellSatellite Systems Division 0 International
400 HZHZOD
AA A OSPTLONAA)
A4A0 TZ (LBO)0 HZ
1LE?~~~A8LE+ ATG1~~BE
TEENAB1.i ATGAEEABE B L3ENCODEA
IL A
ETURA A1' 9 4h -L B DATA ENABLE
isENBL _AAENB B' 8 7 L3ENCODER A0 AAEAL
Y Af{'X I
I- I 6DCONV)FROM
500l 50 AECOE
(XMTR "STUBS' 20 NI DATA GATE ENABLE ALBCOK,20H8
IDATA A 20HZFO O..
+ V+6O L DATAB 8
Figure 107. EDC Overall Test Configuration
143, 144
44, MI~iING-4 il0ý1,L, A
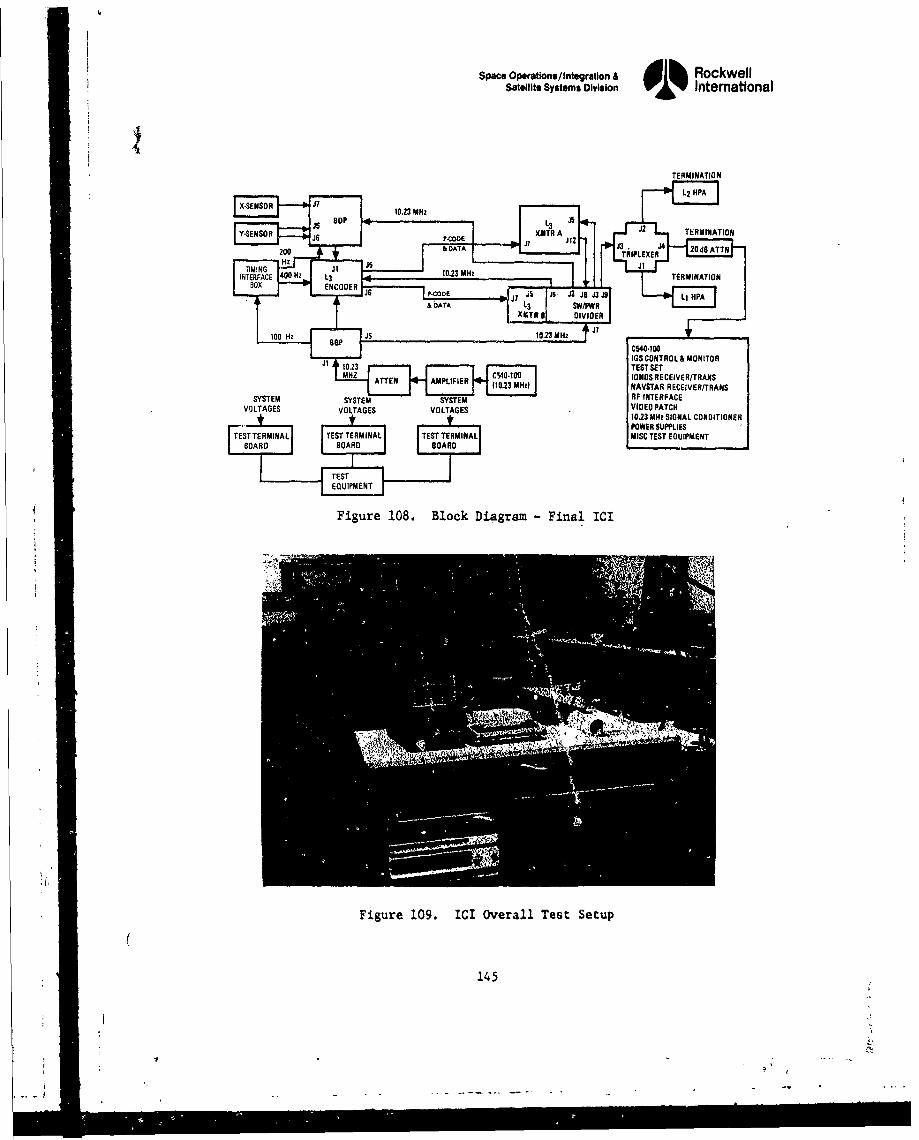
Space Operations/ Integration A i RockwellSatellite Systems Division Itmtoa
TERMINATION
L2 HPA
Y-ENOR i BP 3J2 TERMINATION
J121
TERMINATION
0O C O TO L M O NI T O
A20E AMPLIFIER 2100 dBz NASAR CEVR TRAN
Box 00H103.232 MHz S ERIGNAL OTION R
POEEUPLE
Figure ~ ~ ~ T 108 Blc Digrm inl C
Figur 109 CI Oveal Tes23 Setup
145-10
41ISCNRO OIO
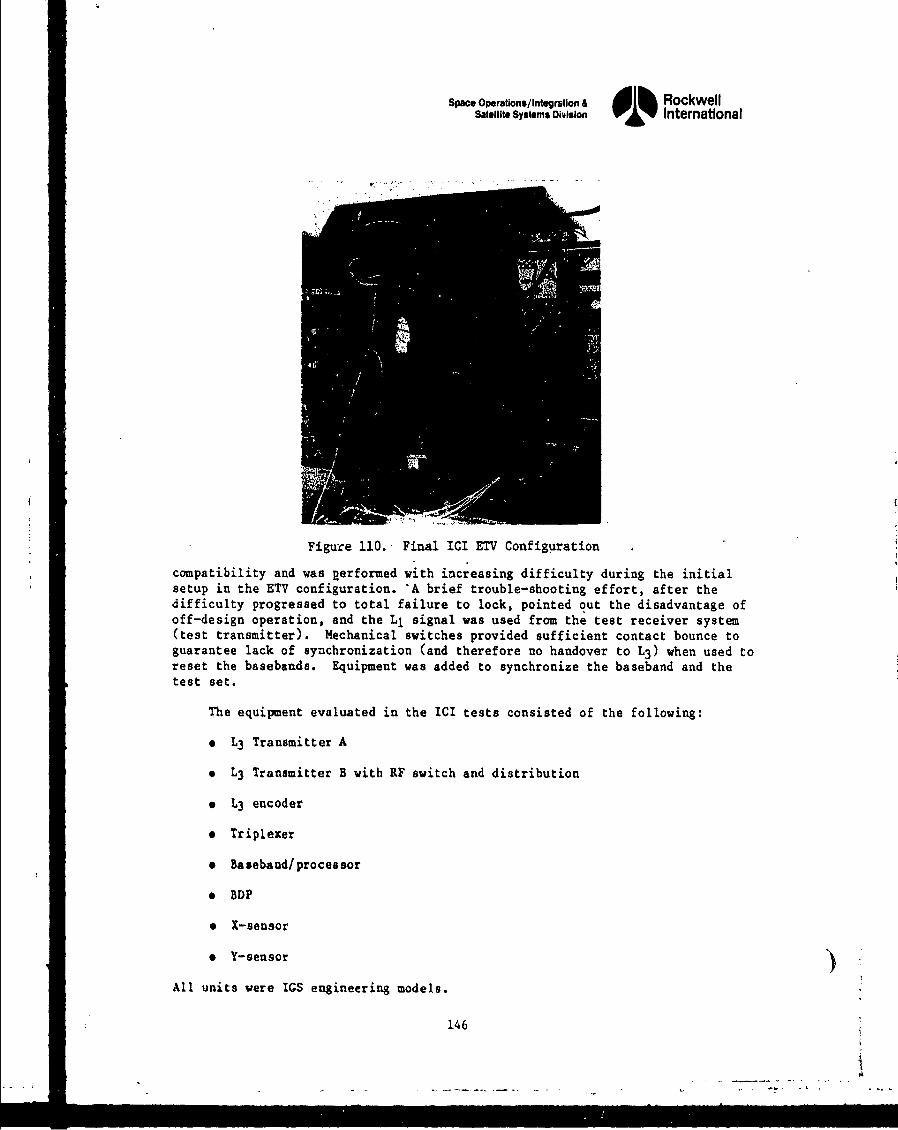
Space Operations/Integratlon & dlh RockwellSatellite Systems Division International
Figure 110. Final ICI ETV Configuration
compatibility and was pRerformed with increasing difficulty during the initialsetup in the ETV configuration. 'A brief trouble-shooting effort, after thedifficulty progressed to total failure to lock, pointed out the disadvantage ofoff-design operation, and the Ll signal was used from the test receiver system(test transmitter). Mechanical switches provided sufficient contact bounce toguarantee lack of synchronization (and therefore no handover to L3 ) when used toreset the basebands. Equipment was added to synchronize the baseband and thetest set.
The equipment evaluated in the ICI tests consisted of the following:
* L3 Transmitter A
e L3 Transmitter B with RF switch and distribution
* L3 encoder
* Triplexer
* Baseband/processor
* BDP
* X-sensor
a Y-sensor
All units vere IGS engineering models.
146
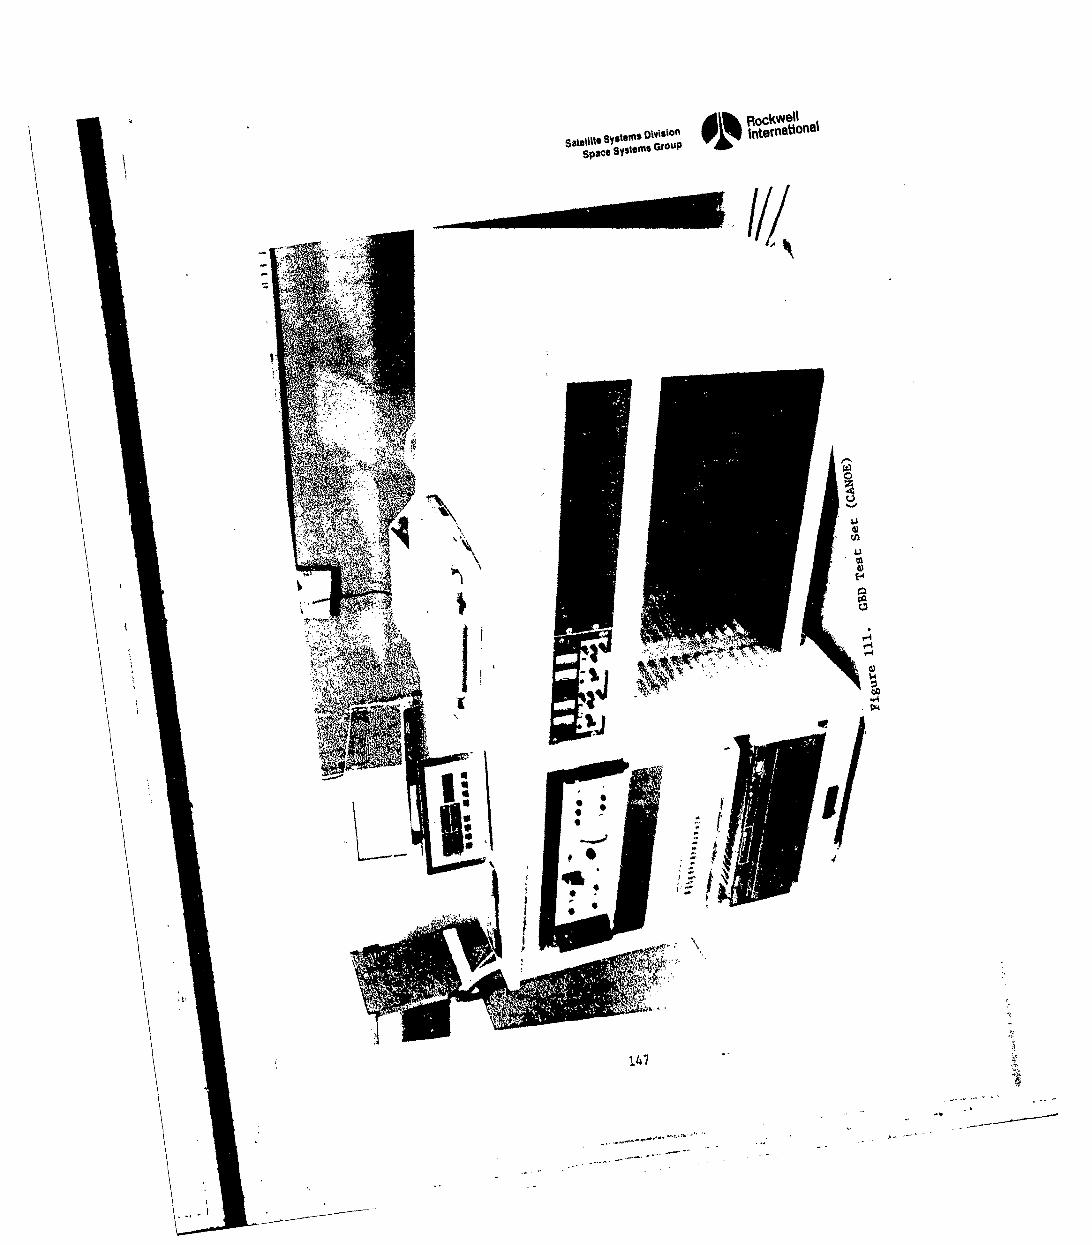
SStII Ssems GWSO~ *
A-,,
r4
147
Space Operations/Integration & I lh RockwellSatellite Systems Division 01% International
The IGS load control unit and vehicle harnesses were also in test, althoughnot identified as primary test items. The test also included the use of the ETVframe as built up for the signal compatibility test, but without side panels,forward bulkhead, and antennas.
Items omitted from the test as originally planned include the breadboardrubidium frequency standard and items of wire harness (primarily harnesses forinterfacing terminal strips with PCM, DCD, and signal conditioner equipment).
The B transmitter exhibited slightly higher harmonic output than theA transmitter. In addition, the B transmitter exhibited occasional delay incoming up to normal power output near the end of ICI testing.
Timing Interface (TI) Box. The TI box was found to exhibit overshoot andringing characteristics when interfaced with the BDP circuit. An external90-ohm or 50-ohm load reduced the overshoot and ringing effects and provided ausable waveform. The unit is to be deleted in future equipment where thefunction will be incorporated into a flight design TIE assembly.
Baseband/Processor. The baseband/processor modified for IGS tests includesan internal A string and a C string (B was replaced with IGS circuitry). The100-Hz IGS A output driver failed between the initial and final ICI setup.Tests were all performed using the C string. A subsequent engineering'testutilizing an external 100-Hz did not show differences in signals produced byusing the A string.
C540-100, IGS Test Set. The stability of the IONDS test receiver systemexhibited considerable variation during testing, due to problems with RFinterference from other tests in the facility and apparent high sensitivity tonoise on ac power lines. It should be noted that the receiver used was IONDSNo. 1, which served in the interim until the full IONDS receiver was delivered.Other known anomalies existing in the Navetar receiver (required to operateIONDS No. 1 receiver) did not affect IONDS operation.
6.4.3 ICI System Testing
Overall IGS component compatibility was demonstrated by successful end-to-end operation. Calibration signals developed in the GBD sensors were processedby the BDP, encoded and transmitted by the L3 equipment operating under controlof the BDP, received and demodulated by the test receiver, and the data verifiedby the GBD test console (CANOE). Redundant channels were verified with theexception of the baseband/processor A string, which contained a failed 100-Hzoutput driver. The A side was operated using lOO-Hz supplied by the BDP, and nodifference was noted between A and C baseband output signals (other than themissing 100-Hz output).
A basic discrepancy was found in the interfaces between the inputs to theBDP and the output circuits of the baseband/processor and the timivg interfacebox. The TI box, constructed to supply an interface for test purposes in lieuof circuits not yet incorporated into the IGS hardware, did not provide asuitable output impedance to match the 1000-ohm series resistance required bythe ICD on the BDP inputs. The overshoot and ringing on the 200 Hz to the BDP
148
Space Opeatlons/Integration & dl RockwellSatellite Systems Divlsion 01% Intematlonal
caused incorrect operation. External loads of 50 to 110 ohms corrected theoutput to a usable signal. However, the amplitude of the signal was below theICD value. Approximately 1 microsecond of leading and trailing edge ringing wasmeasured on the Xl epoch line from the baseband to the BDP. No anomalies werenoted while operating with the loaded 200 Hz nor were any detected that were dueto the Xl epoch ringing, but the flight configuration interfaces, including thecable impedance, must be positively controlled for final hardware designs. TheXl epoch ringing may have been in the test leads and breakout access any may notbe inherent in the system; however, the observation still emphasizes the needfor tight control of these signal interfaces.
6.4.3.1 Subsystem Turn-on and Turn-off Characteristics. The turn-on andturn-off characteristics were measured by using a Honeywell 1612 Visicorder with8-kHz response channels. The results show no characteristics which wouldpreclude further system tests. Main bus, L3 transmitter, and BDP currents andvoltages were monitored as well as commands and the data enable signal from theBDP test connector and from the IONDS receiver output. Runs were made at40 inches per second during operational cycles with each string of BDP/L 3 chainoperating and with the BDP and L3 chains cross-strapped.
Discrete command signals exhibited slight ringing characteristics, whichwere attributed to the long leads required to the recorder and which would notbe detrimental to system operation. The main bus exhibited a drop of about5 volts approximately 8 milliseconds after the "L3 on" command was initiated bythe BDP coincident with application of L3 power on. The drop was accompanied bysome ringing and required approximately 25 milliseconds to recover. The busdrop was also reflected as a drop in the command pulse level. Thischaracteristic did not affect ICI subsystem operation but would not beacceptable for a flight bus, since the transient exceeds the bus specificationto which equipment is tested.
The bus regulator in this case is dependent on the regulations of the powersupply in the C540-100. A flight bus would be regulated by the power controlunit (PCU) in the vehicle. The power supply has been returned for calibrationand adjustment. It should also be noted that later tests will have additionalloads on the supply, which is expected to improve regulation.
The only other unexpected results consisted of activity on the BDP L3 onand off lines during BDP initialization. Sandia advised that these outputs area function of initialization software only and have no effect on normaloperation of the subsystem.
Although detailed EMI tests were performed on L3 components duringacceptance and engineering laboratory testing, a survey was performed on theoverall ICI configuration. Current probes were used on power lines to check forexcessive steady-state signals below 50 MHz. The oscillograph records werechecked within their limitations of approximately 6 kHz.
Radio frequency (RF) emission was checked using EMI probes (broadbandantennas) with Airborne Instrument Lab (AIL) and Hewlett Packard spectrumanalyzers. The ranges observed were from 10 MlOz to 10 GHz. Due to the openconfiguration of the laboratory, numerous RF signals were observed in almost allfrequency ranges. The test was performed by observing the spectrum over a given
149
Space operations/ Integration & RockwellSatellito Systems Division International
range of the analyzer with the test setup off, and then operating the IGSthrough a cycle of the BDP going active, turning the L3 equipment on,transmitting data, and then turning the L3 off. The spectrum was monitored forany changes during this cycle. The checks were performed with both A andB strings, as well as with cross-strap operations.
Although several repeat operations were required because of the method ofoperation, the majority of spectrum changes noted were due to changes in theambient RF environment. Signals were observed at approximately 150 MHz and at alevel of -90 dBm which was determined to be from the CANOE test set when it wasoperating the BDP. The signals were isolated to the CANOE by observing thatthey were present when the CANOE was operated with the IGS equipment off. Also,an increase in level was noted when the probe was moved away from the ETV andturned to the CANOE. Signals at the fundamental operating frequency of1381.05 HHz were noted. However, these were expected under the open operatingconditions of the ICI test, with the RF loads and test consoles in the same roomwith the equipment under test. Second and third harmonic signals were alsodetectable when using the B transmitter. Again, these were consistent with datafrom the transmitter tests.
No signals were detected which would preclude proceeding with the vehicle-level EMI testing. Although the enviromnent of the ICI test precludes accurateEM! measurements, any problems which may have been masked by the background andwhich show up during formal vehicle tests should be at a level which can becontrolled by wire routing and/or additional shielding of cable segments. Thistype of correction could be made at the time of the Vehicle-level test withoutrequiring equipment redesign.
6.4.3.2 Component and Subsystem Baseline Data. The data obtained duringICI generally verified the measurements made at the individual equipment level.Additional baseline data consisted of the waveform at the BDP interface and datataken using the IONDS test receiver. The IONDS receiver was difficult to use inthat the receiver exhibited stable periods of operation alternating with periodsin which noise and/or instability would override attempts to performmeasurements. Some of the initial ICI operational problems were traced to EMTfrom RF testing in the same building. Later problems could not be positivelyidentified. However, considerable noise was observed on the power lines to thetest set. In addition, it was noted that connecting or disconnecting test'equipment from power lines in the same room (although not the same line with thetest set) would generate errors in measurements or cause the recover lock torecycle. Power isolation units were not available during the ICI test, andtherefore, measurements were made during stable periods.
The following items summarize the measurements performed with the testreceivers.
"* Li Variations. The maximum shift from the value set at t5.0 volts withthe BDP off was 0.1 dB.
"" L3 Variation. Correlation was identical at all voltages with the BDPon, and wth the BDP off at 25.5 volts. Values measured with the BDPoff at 27.0 volts and 28.0 volts were plus and minus 0.3 d8.respectively.
150
Spac OPM/IOns/IntegraOn & RockwellSawfelt systm Oftvion 01% Intematlonal
* Carrier Phase Noise. Phase noise was measured on L1 and on L3 at ETVbut voltages of 25.5, 27.0, and at 28.0 volts with the BDP on and off.Ll phase noise varied from 100 to 200 milliradians with the variationsapparently time-dependent rather than related to ETV voltage or on/offcondition of the BDP. L3 phase noise was stable at 38 to40 milliradians.
* Carrier IAM. Carrier incidental amplitude modulation (IAM) was measuredon Ll and L3 for the three ETV bus voltages and for the BDP on and off.Values obtained ranged from 6.75 to 8.0 milliradians for L3 and 3.35 to4.0 milliradians for Ll. Although values appear to increase with thebus voltage, the range is within the drift of the measurement.
The checkout equipment for the ICI test included the IGS monitor andcontrol test set which housed the ETV 28-volt dc supply, the Navstar receiver,and ancillary test equipment (see Figure 112).
Figure 112. Checkout Equipment fit the ICI Test
151
SPA opm'ions/Ingration & l RockwellSatellite System,% *hi 01% International
The Navstar receiver was available for checkout of the simulated navigationsubsystem, if required, and for checkout of the L3 transmission system. Thisreceiver is equivalent in performance to the PSE receiver utilized in the GPSnavigation test set.
The general IGS monitor and control sec contains transmitters forcalibrating the Navstar receiver which can operate LI, L2 , and L3 signals andthe various special test devices including RF power meters, oscillographs,spectrum analyzer, frequency-time center, digital voltmeter, and the ETV 28-Vdcpower supply.
The console was upgraded to include a full sensitivity IONDS receiver forthe system/EMC test in March 1978. This receiver was developed specifically forthe IGS test program. Panel components are shown in Figure 113. The consolefunctions are listed in Table 35.
6.5 GPS INTEGRATION TESTS
GPS integration tests were undertaken to satisfy two basic requirements:(1) verify that the addition of IGS hardware to the CPS does not impact theprimary GPS mission and (2) verify that the GPS is supportive of the IGS payload.
These objectives were satisfied by means of a comprehensive test programwhich involved the use of the GPS development test vehicle (DTV) and thecreation of an ETV together with use of the GPS telecom simulator, GPS userreceivers, GPS test sets, a new IGS test set, and GPS software and documentation(including the creation of new software and documentation pertinent to the IGSpayload).
The integration program utilized the DTV for tests involving physicalcharacteristics and the ETV for tests involving electrical characteristics forboth CPS and IGS. The DTV and IGS configurations varied for each test.Consequently, :est configurations were delineated separately for each test.
The GPS integration test program consisted of the folloving tests:
"* RU compatibility test
"* Intermodulation noise test
"* System test
"* E14C test
"* lGS threshold sensitivity
"* Acoustics
The objectives, locations, key parateters measured, ti.e period, and vehicle areoverviewed in Table 36.
: - -- --- -: -= -= ::- = = ----=---- ---= -- - - --- -- - -- - -= - -_-- -- -.• - '.-- _ • 2 __ -_ . . . . C- .. . ..
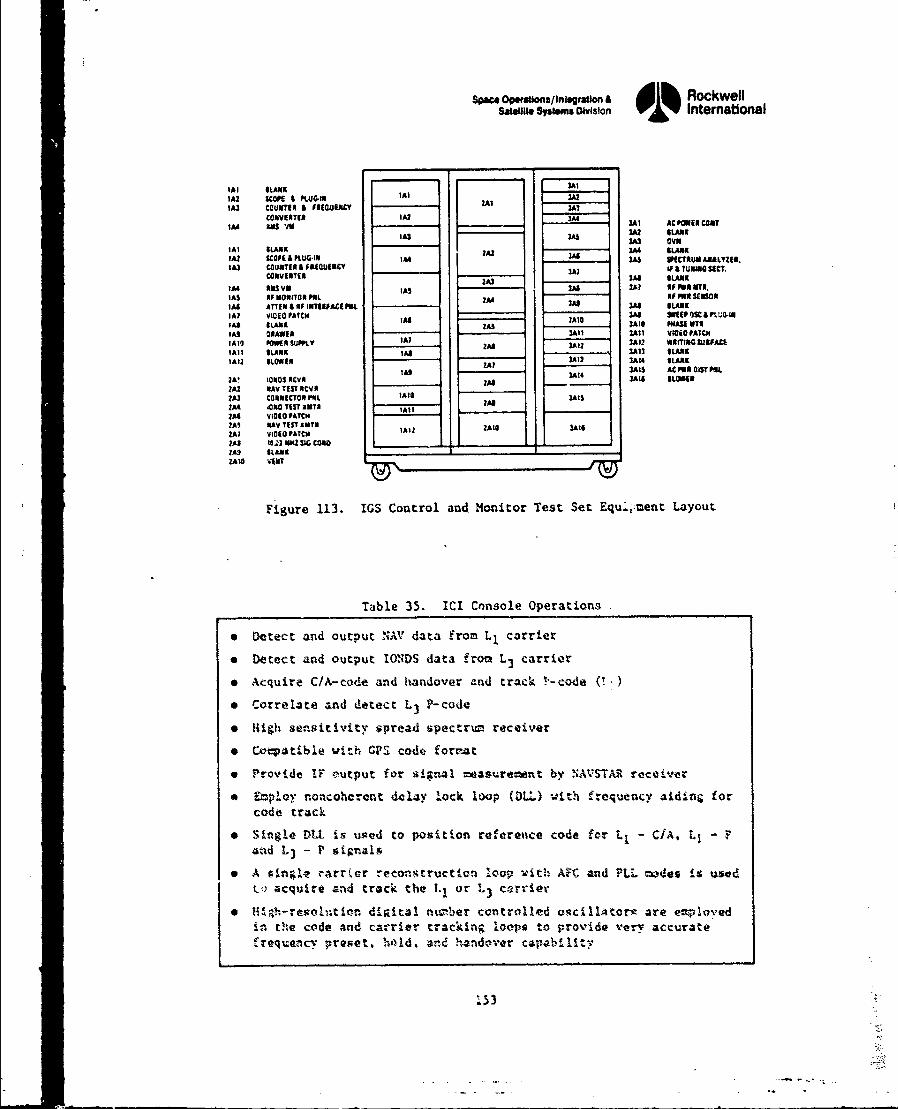
Space Opwiatonsflnistun ~ Rockwell
lA3 COUNTER 4 ME(OW=E ZAICONV MT92 1*2 3*1 ACPOES COXT
lA4 aWs !ih 1U2 ILAIA3*4 U 0"W
'A] SLANK ZAI 3M StANK'Al SCOPE a KUlG-11 3AA us5 SPECTRUM ANALYZES.W* COUNTER & ISRO3ISNCY 3A1 1F & ?USU4IC?.
3*VRTXJ3 2*1 SLANKWM INS V11 IAS 3MX? of IWA MITI,
'AS IF NONITOR PRI. 2A4 WiFFIPUNW'A ATTEX IRFINTERDUDIM SU A u LNK
IAS IE $LA lNK *5 3*10 IAS3I PHS 0710
*52 ONAIA ]Al MT1 3* 1 11000 tA7ON.A*1 PMAESUPftY IA, I 3*13 3A12 uAMIG&SURPAC*
WA to050$ 5045A ]W LW13*2 RAV TEST RCVAJAI CONNICTON P*lLTW IS2A4 ONO TEST IMssAJA4 VIOEOPATCH2*5 %AV 71ST lETS e2IW* V41010 PATCHII
Z*5 toll) Wa SIG CmN _____ _____
Z*5 $LANK _______
ZA10 WENT
Figure 113. IGS Control and Monitor Test Set Equ.,:ment Layout
Table 35. ICI Console Operations
"* Detect and output NAV data from L, carrier
"* Detect and output IONflS data from L 3 carrier
*Acquire C/A-code and handover and track T--code()
*Correlate and detect L3 P-code
9 Hligh sensitivity !;pread spectrto receiver
e Gtocatible with CPS codt, forn--t
*Provide IF eoutput for *ignal me*-urement by NAVSTAR receiver
* ~ploy noncoherent delay lock loop (DLL-) with frequency aiding forcode track
e Single DUI is ulted to position reference code ifor L, - C/A. L; - P4oaid L3 - P signals
* A singlA- carrier rcongtruction Icoon vith ANK and I'LL twdes it usedu) acquire and track the I., or '3 ",rrier
e Ht1ah-resalution digital nuj-ler controlled oscillato"r, are eze-oved4if the code and carrier tracking Ice-p. to provide ve,,- accuratefrquencv prenet, haid, and aindc-N'er capatbilit::
1.3
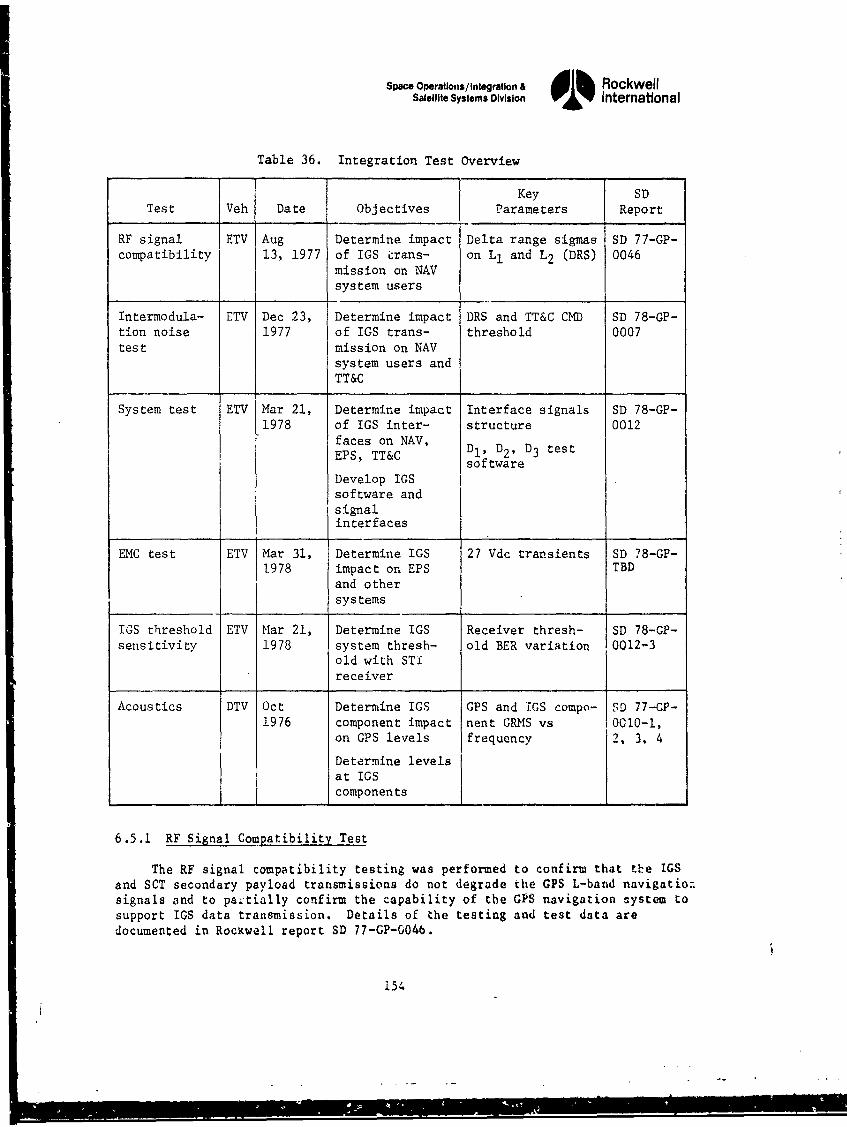
Space Operations/integration & dl RockwellSatellite Systems Division 01% International
Table 36. Integration Test Overview
Key SDTest Veh Date Objectives Parameters Report
RF signal ETV Aug Determine impact Delta range sigmas SD 77-GP-compatibility 13, 1977 of IGS ýrans- on L1 and L2 (DRS) 0046
mission on NAVsystem users
Intermodula- ETV Dec 23, Determine impact DRS and TT&C CMD SD 78-GP-tion noise 1977 of IGS trans- threshold 0007test mission on NAV
system users andTT&C
System test ETV Mar 21, Determine impact Interface signals SD 78-GP-1978 of IGS inter- structure 0012
faces on NAV,EPS, TT&C D1 , D2 , D3 test
softwareDevelop IGSsoftware andsignalinterfaces
EMC test ETV Mar 31, Determine IGS 27 Vdc transients SD 78-GP-1978 impact on EPS TBD
and othersystems
IGS threshold ETV Mar 21, Determine IGS Receiver thresh- SD 78-GP-sensitivity 1978 system thresh- old BER variation 0012-3
old with STI
receiver
Acoustics DTV Oct Determine IGS CPS and 1iS compo- SD 77-GP-1976 component impact nent GRMS vs 10010-1,
on CPS levels frequency 2, 3, 4
Determine levelsat IGScomponents
6.5.1 RF Signal Compatibility Test
The RF signal compatibility testing was performed to confirm that the IGSand SCT secondary payload transmissions do not degrade the GPS L-band navigationsignals and to paitially confirm the capability of the GPS navigation system tosupport IGS data transmission. Details of the testing and test data aredocumented in Rockwell report SD 77-GP-004b.
154
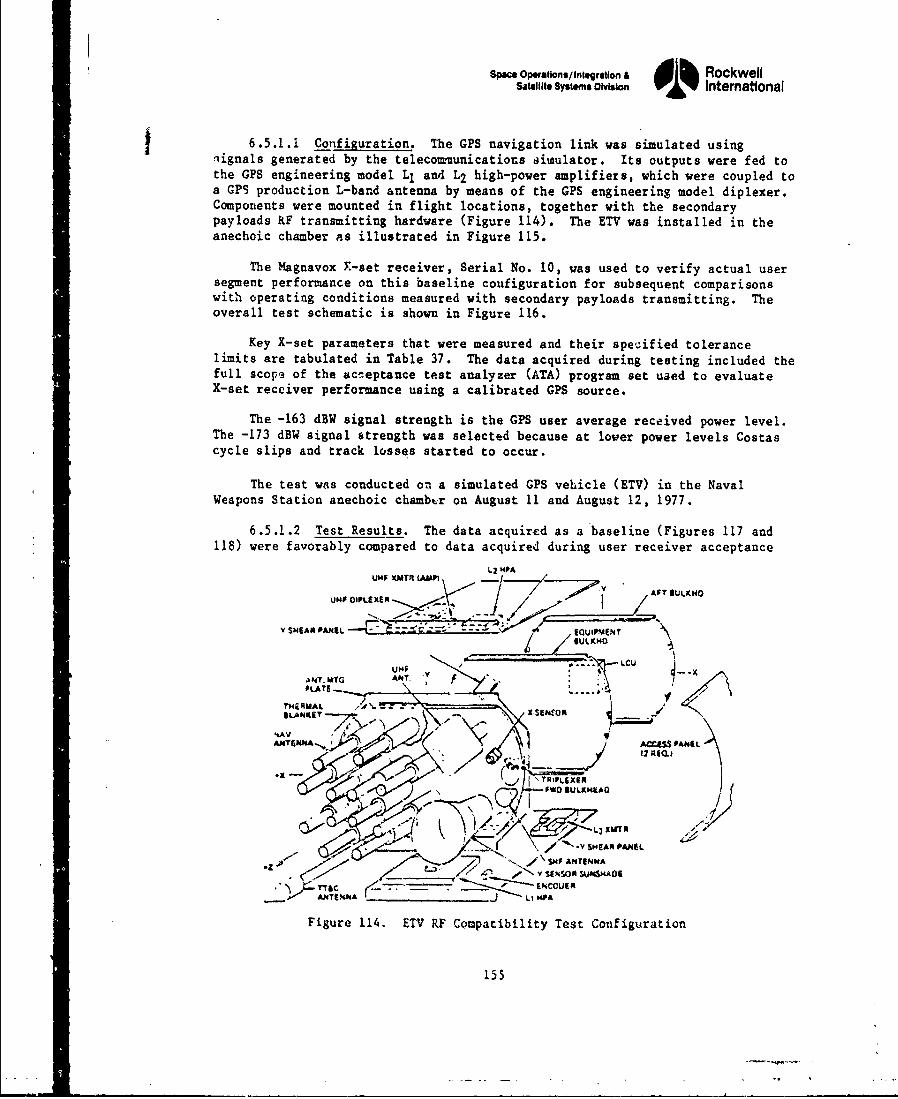
Space Oeationsl/Integration & dlh RockwellSatellite Systems Division V01% International
6.5.1.1 Configuration. The GPS navigation link was simulated usingnignals generated by the telecoummunications aisulator. Its outputs were fed tothe GPS engineering model LI and L2 high-power amplifiers, which were coupled toa GPS production L-band antenna by means of the GPS engineering model diplexer.Components were mounted in flight locations, together with the secondarypayloads RF transmitting hardware (Figure 114). The ETV was installed in theanechoic chamber as illustrated in Figure 115.
The Magnavox F-set receiver, Serial No. 10, was used to verify actual usersegment performance on this baseline coufiguration for subsequent comparisonswith operating conditions measured with secondary payloads transmitting. Theoverall test schematic is shown in Figure 116.
Key X-set parameters that were measured and their specified tolerancelimits are tabulated in Table 37. The data acquired during testing included thefull scope of the acceptance test analyzer (ATA) program set uaed to evaluateX-set receiver performance using a calibrated GPS source.
The -163 dBW signal strength is the GPS user average received power level.The -173 dBW signal strength was selected because at lower power levels Costascycle slips and track losses started to occur.
The test was conducted on a simulated GPS vehicle (ETV) in the NavalWeapons Station anechoic chambtr on August 11 and August 12, 1977.
6.5.1.2 Test Results. The data acquired as a baseline (Figures 117 and118) were favorably compared to data acquired during user receiver acceptance
L2 0PAUHF XMTR*AMF_
i /'•"
}A.v .z .Y S9A4PANL t SUP~NT
ANT SHFG ANT. ft
'K•ANTEN•4A r- " - "O R
Figure 114. ETV RF Corspatibility Test Configuration
155
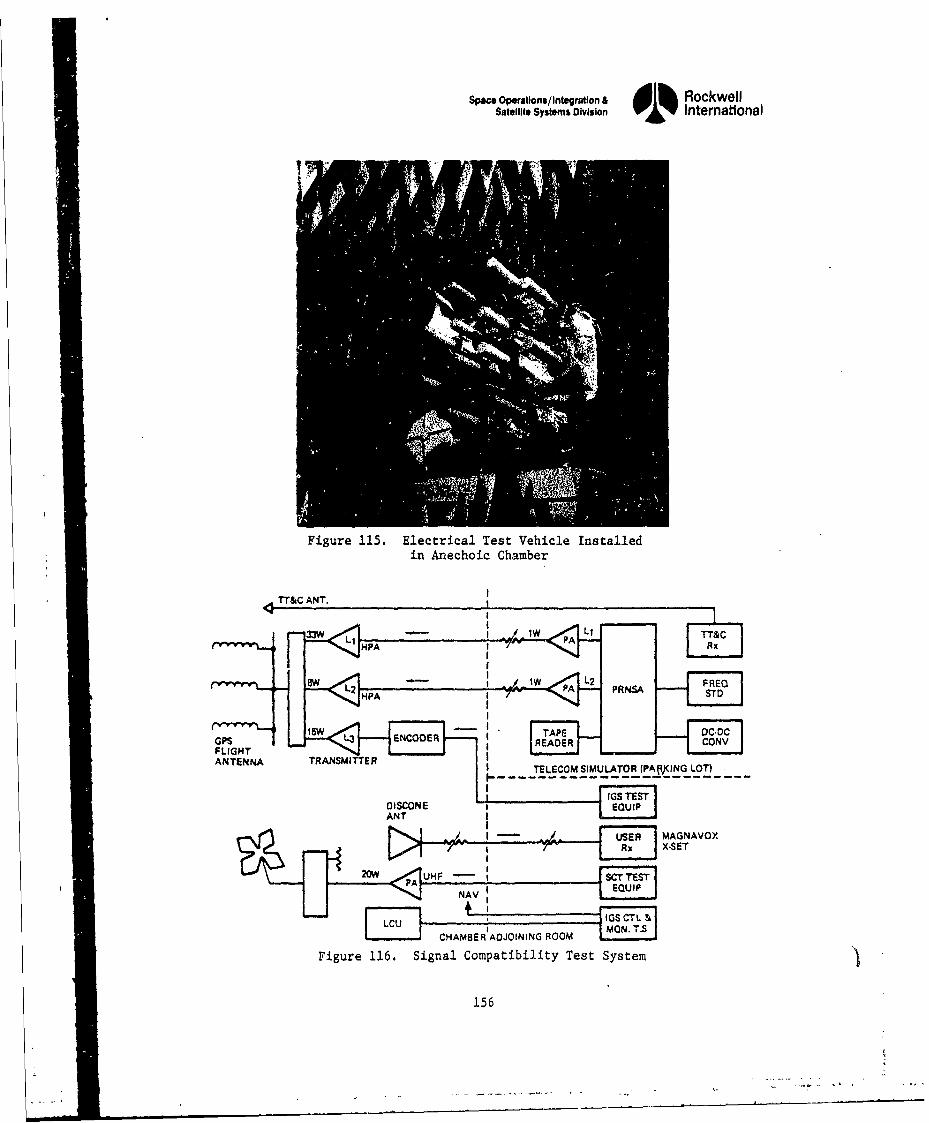
Space Operations/ Integration & d h RockwellSatellite Systems Division o % International
Figure 115. Electrical Test Vehicle Installedin Anechoic Chamber
TT&C ANT.
3 3W ENCDE TAP
IYWW,-- ------------------
Figur 116. Sinl paiilt Ts Sse
15W O156
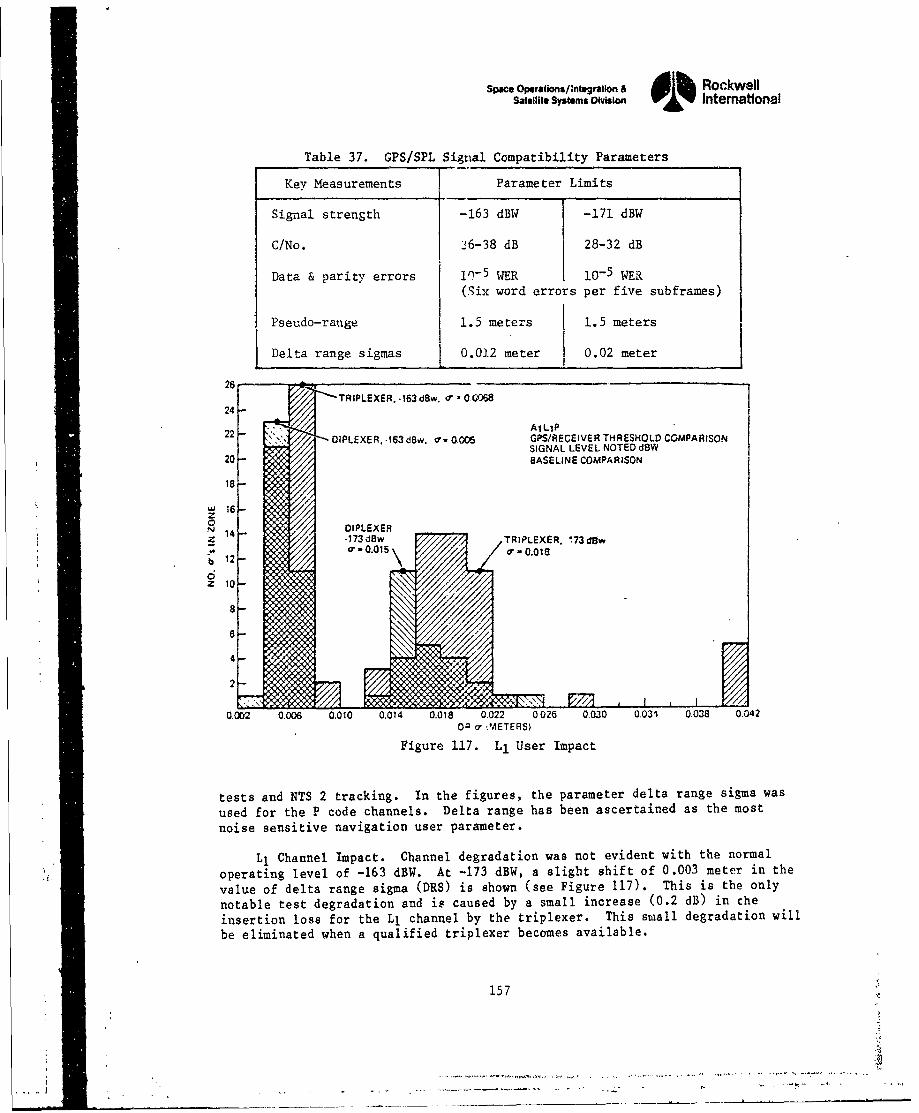
Space Operatlons/2nt gratlon 6 IML RockwellSatellite Systems Division oi% Intemational
Table 37. GPS/SPL Signal Compatibility Parameters
Key Measurements Parameter Limits
Signal strength -163 dBW -171 dBW
C/No. 36-38 dB 28-32 dB
Data & parity errors 1j-5 WER 10-5 WER(Six word errors per five subframes)
Pseudo-range 1.5 meters 1.5 meters
Delta range sigmas 0.012 meter 0.02 meter
26 "" TRIPLEXER. -163 d8w, 0-0-068
24
AILIP22 DIPLEXER, .163 d ~w. 0 GPS/RECEIVER THRESHOLD COMPARISONSIGNAL LEVEL NOTED dBW20 BASELINE COMPARISON
18
W 16z0N 14- IPLEXER
:-173 d \w TRIPLEXER. ,73 dow.. ! ~~~o'-0.015 \o .tb 12i -\- .1
6-
0.002 0.006 0.010 0.014 0.018 0.022 0026 0.030 0.031 0.038 0.042Oz 7 ,'AETERS)
Figure 117. L1 User Impact
tests and NTS 2 tracking. In the figures, the parameter delta range sigma wasused for the P code channels. Delta range has been ascertained as the mostnoise sensitive navigation user parameter.
L1 Channel Impact. Channel degradation was not evident with the normal
operating level of -163 dBW. At -173 dBW, a slight shift of 0.003 meter in the
value of delta range sigma (DRS) is shown (see Figure 117). This is the only
notable test degradation and is caused by a small increase (0.2 dB) in the
insertion loss for the L1 channel by the triplexer. This small degradation will
be eliminated when a qualified triplexer becomes available.
157
S..-.p...,,~., . ~ .. . . . . . . . . .
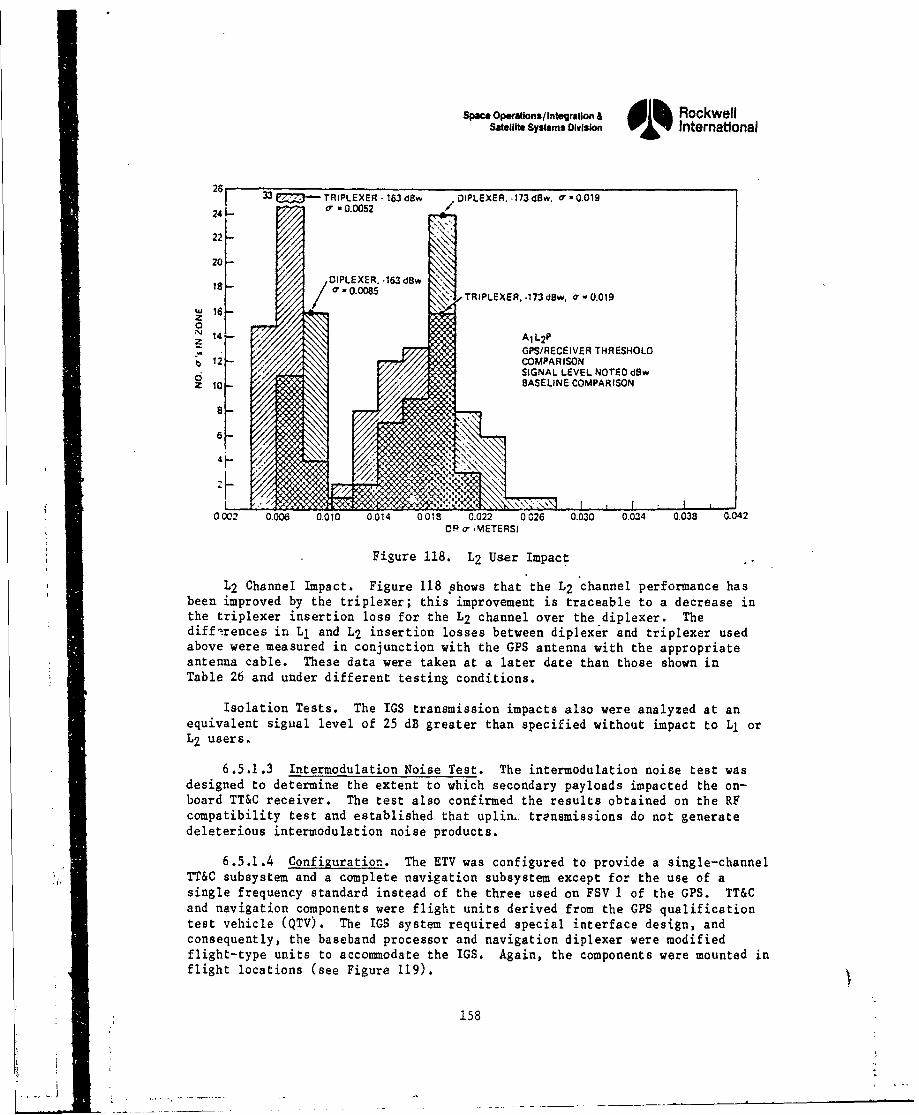
Space Operations/ Integration & RockwellSatellite Systems Olvision 0 % International
26t 33 TRIPLEXER - 163 d8w DIPLEXER .173 dew, " -0.019
24 I- o -00.0052 /
22 /20/
/OIPLEXER -163, d8w181 o-. 0.008508/ ,TRIPLEXER..173d~w, 0-0.019
14" A1 L2 P
GPS/RECEIVER THRESHOLD' b 12- COMPARISON
SIGNAL LEVEL NOTED dBwz 10 BASELINE COMPARISON
6
0 002 0.006 0.010 0.014 0018 0.022 0-026 0.030 0.034 0.038 0.042OP oa iMETERS)
Figure 118. L2 User Impact
L2 Channel Impact. Figure 118 shows that the L2 channel performance hasbeen improved by the triplexer; this improvement is traceable to a decrease inthe triplexer insertion loss for the L2 channel over the diplexer. Thedifferences in 1. and L2 insertion losses between diplexer and triplexer usedabove were measured in conjunction with the GPS antenna with the appropriateantenna cable. These data were taken at a later date than those shown inTable 26 and under different testing conditions.
Isolation Tests. The IGS transmission impacts also were analyzed at anequivalent sigual level of 25 dB greater than specified without impact to 11 orL2 users.
6.5.1.3 Intermodulation Noise Test. The intermodulation noise test wasdesigned to determine the extent to which secondary payloads impacted the on-board TT&C receiver. The test also confirmed the results obtained on the RFcompatibility test and established that uplin., trensmissions do not generatedeleterious intermodulation noise products.
6.5.1.4 Configuration. The ETV was configured to provide a single-channelTT&C subsystem and a complete navigation subsystem except for the use of asingle frequency standard instead of the three used on FSV I of the GPS. TT&Cand navigation components were flight units derived from the GPS qualificationtest vehicle (QTV). The IGS system required special interface design, andconsequently, the baseband processor and navigation diplexer were modifiedflight-type units to accommodate the IGS. Again, the components were mounted inflight locations (see Figure 119).
158
...1 . .
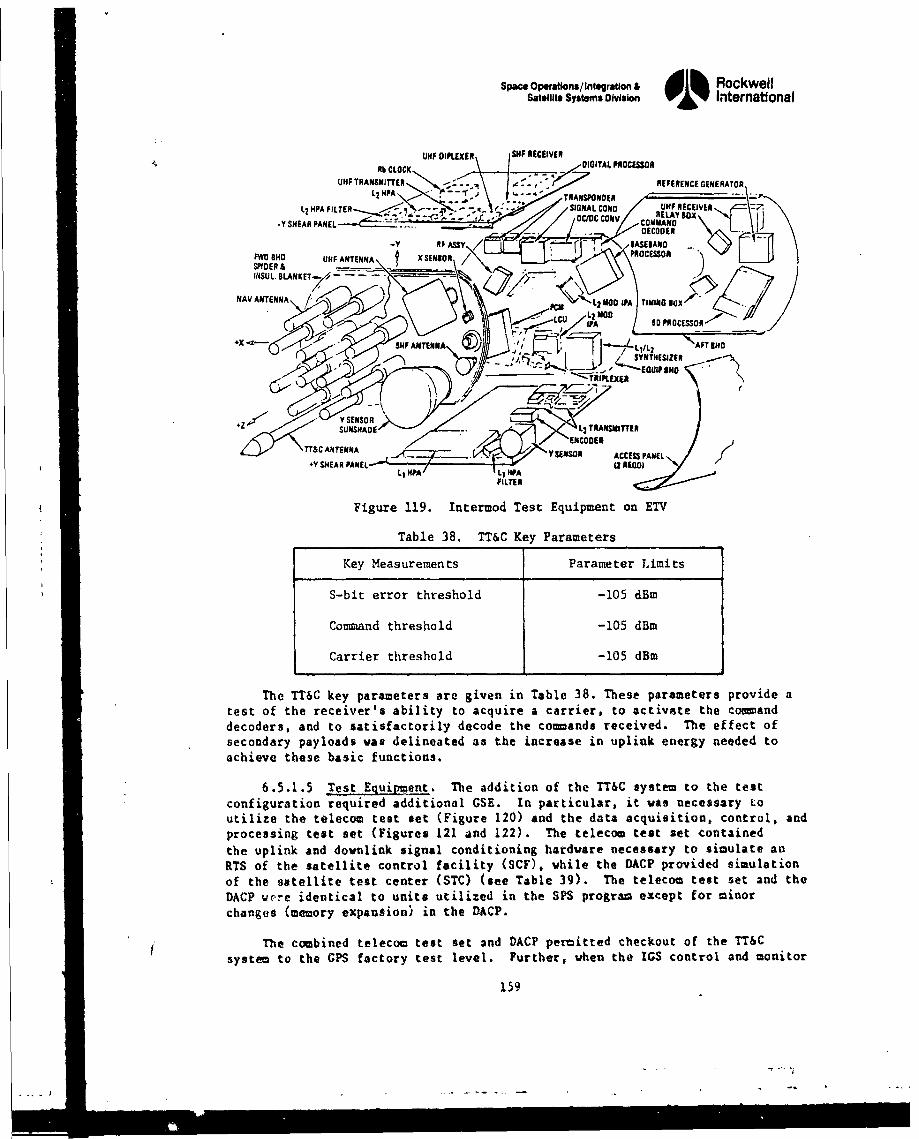
Space OperatIons/Integration & dlh RockwellSatellite Systems Division V�Y International
UHF DIPLEXER SlIP RECEIVERRb CLOCK ��OIOITAL PROCESSOR
UHFTRANSMITTER � � REFERENCE GENERATORL2HPA J � -
- - TRANSPONDER RELAY LOX-. SIGNAL COMa UHF RECEIVERL2 I4PA -� - - �. -, otmc co�v COMMAND
-YSHEARPANEL-----.-6�Z�....� DECODER
-Y R�ASSY / � PRFWO RHO UHF ANTENNA N SENSOR /SPIDERS �
INSUL. BLANKET- / - - -�- - /71
NA V ANTE NNA / � "�'-L 2MOO IDA tIMlNOI,�x'�
.. ,.- , WA IDPROCESS0R�A i'
SHFANTENNA.\� 7_-. �-.t--i/�---EOUID SlID
.27TT&C ANTENNA _____ r YSENSOR ACCESS PANEL
(28(001
FILTER
Figure 119. Intermod Test Equipment on ETV
Table 38. TT&C Key Parameters
Key Measurements Parameter Limits
S-bit error threshold -105 dBm
Command threshold -105 dBm
Carrier threshold -105 dBw
The T¶&C key parameters are given in Table 38. These parameters provide atest of the receiver's ability to acquire a carrier, to activate the co�aaddecoders, and to satisfactorily decode the co�.nda received. The effect ofsecondary payloads vas delineated as the increase in uplink energy needed toachieve these basic functions.
6.5.1.5 Test Equipment. The addition of the TT&C system to the testconfiguration required additional GSE. In particular, it was necessary Lo
utilize the telecom test set (Figure 120) and the data acquisition, control, andprocessing test set (Figures 121 and 122). The telecom teat set containedthe uplink and dovnlink signal conditioning hardware necessary to simulate anRTS of the satellite control facility (SCF). while the DACP provided simulationof the satellite test center (STC) (see Table 39). The telecom test set and theDAC? vrre identical to unite utilized in the SPS prograSS eXcept for minorchanges (memory expansion) in the DACP.
The combined telecom test set and DACP pert�itted checkout of the TT&C
system to the CI'S factory test level. Further, when the IGS control and uon�tor
159
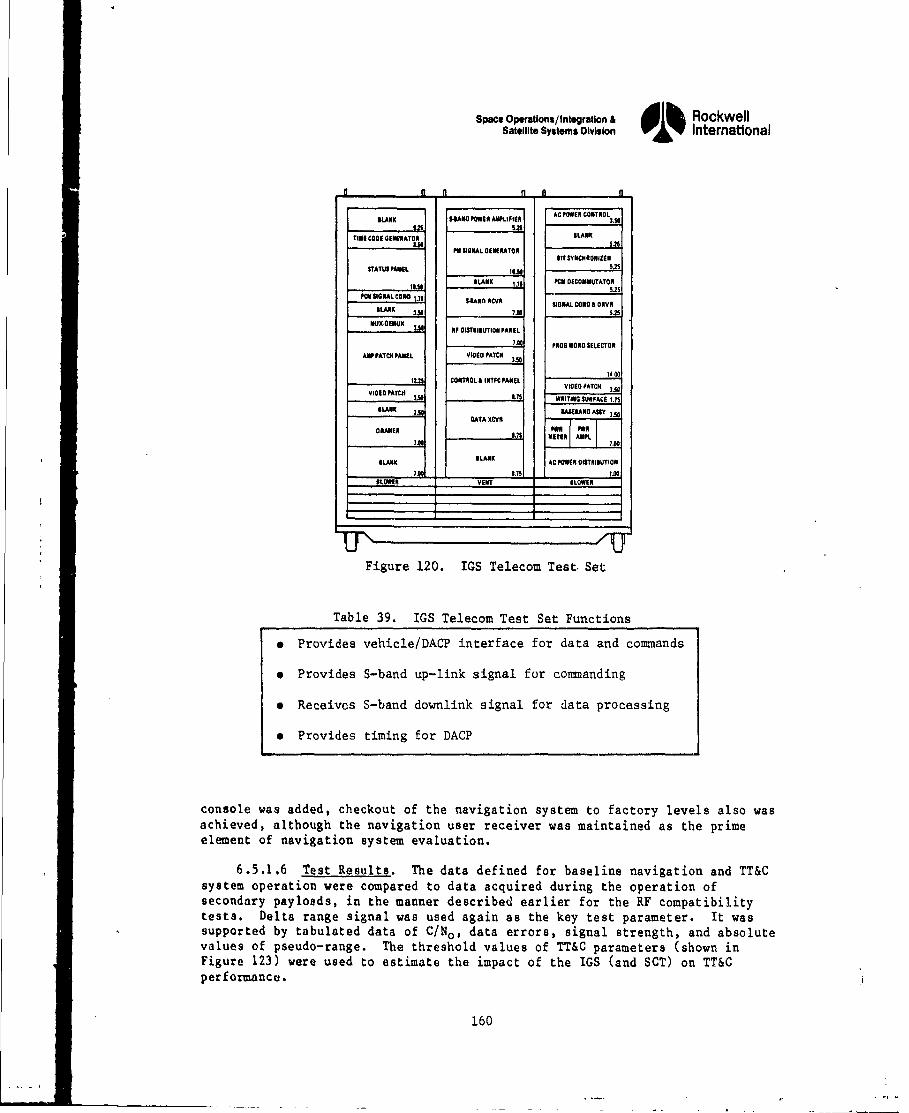
Space Operations/ Integration & RockwellSatellite Systems Division 0% Internatlonal
RC POE ONR
lILAN tRANO POWER AMPLIFIER ACPOE CNTO
TIME CODE GENERATOR $ANK2 PM SIGNIAL GENERATOR
SIT SYNCH A ONIZENSTATUS PANIEL 105.25
Is $LANK I.7 PCM DICONNUTATORS'
PcONIONALCOND *.7 $-"No mlCVA SIGNAL COMO A RVRSLAMS 23 7.0162NIISORIISX 3 3M AFP OISTSISUTI ON PAN EL
APAT2IPAEL VOEOPTR 7.501 PROS WORD SELECTOR140
I19 PA S4 22 CONTROL & ISPC PANELVIE AC 34VIDO PTCI 075 WRITING SURFACE 1.75
$LANK DATAXS8""ANO ASSY 3.500
DRWE 1.7 SETE AMPL
RUNXGLNE AC POWERODISTRIBUTION
71 8-.7 11.07
SL.OWER VENT SLOWER
Figure 120. IGS Telecom Test-Set
Table 39. lOS Telecom Test Set Functions
* Provides vehicle/DACP interface for data and commands
e Provides S-band up-link signal for commanding
* Receives S-band downlink signal for data processing
Is Provides timing for DACP
console was added, checkout of the navigation system to factory levels also wasachieved, although the navigation user receiver was maintained as the primeelement of navigation system evaluation.
6.5.1.6 Test Results. The data defined for baseline navigation and TT&Csystem operation were compared to data acquired during the operation ofsecondary payloads, in the manner described earlier for the RF compatibilitytests. Delta range signal was used again as the key test parameter. It wassupported by tabulated data of C/N0, data errors, signal strength, and absolutevalues of pseudo-range. The threshold values of TT&C parameters (shown inFigure 123) were used to estimate the impact of the IGS (and SCT) on TT&Cperformance.t
160
Space Operations/Integration & RockwellSatellite Systems Division International
Figure 121. Data Acquisition, Control,and Processing Test Set
Figure 122. DACP Peripheral Equipment
161
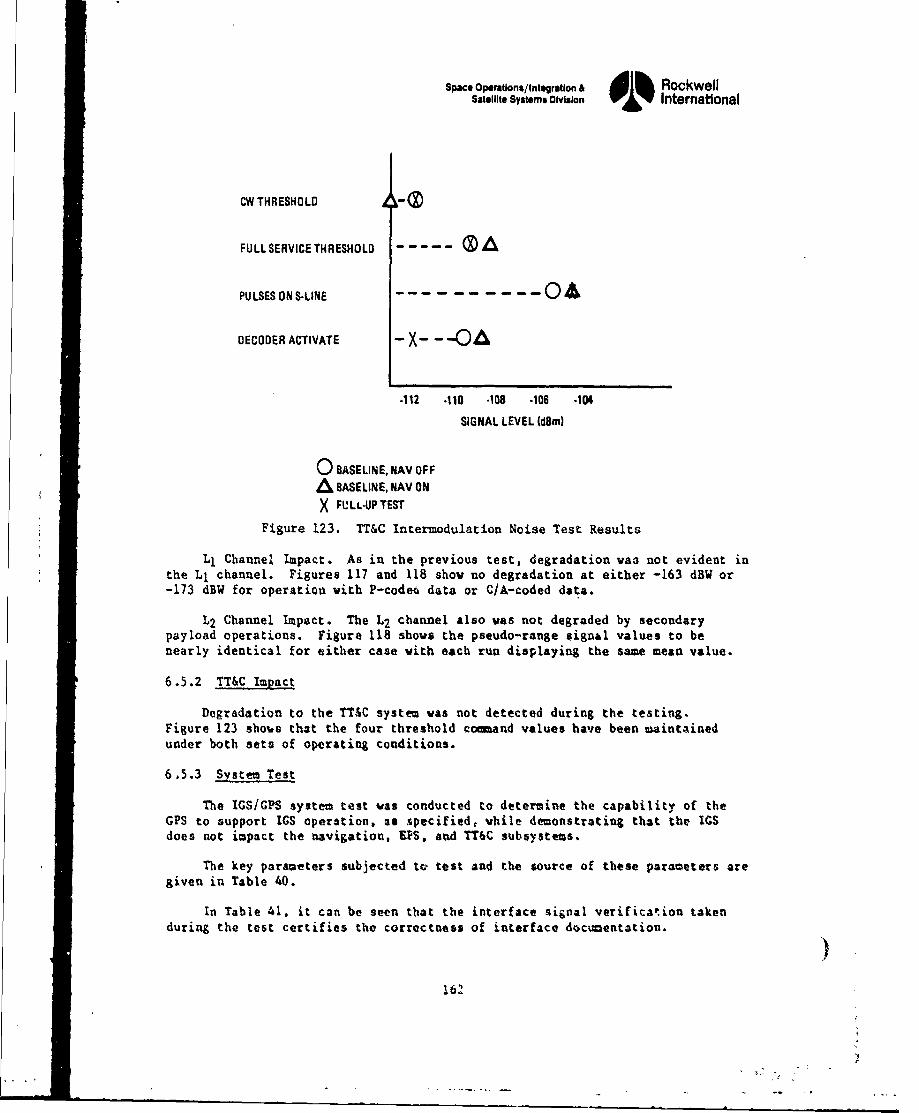
Space Operations/Integration & dl RockwellSatellite Systems Division oi% International
CW THRESHOLD
FULL SERVICE THRESHOLD
PULSES ON SLINE 0-
DECODER ACTVATE -- X- --- A
.112 -110 -108 -106 -104
SIGNAL LEVEL (dBm)
0 BASELINE, NAV OFF
& BASELINE, NAV ON
X FULL-UP TEST
Figure 123. TT&C Intermodulation Noise Test Results
L1 Channel Impact. As in the previous test, degradation waa not evident inthe Ll channel. Figures 117 and 118 show no degradation at either -163 dBW or-173 dBW for operation with P-coded data or C/A-coded data.
L2 Channel Impact. The L2 channel also was not degraded by secondarypayload operations. Figure 118 shows the pseudo-range signal values to benearly identical for either case with each run displaying the same mean value.
6.5.2 TT&C Impact
Degradation to the M&C system was not detected during the testing.Figure 123 shous that the four threshold coand values have been maintainedunder both sets of operating conditions.
6.5.3 System Test
The IGS/GPS system test was conducted to determine the capability of theGPS to support IGS operation, as specified, while demonstrating that the ICSdoes not impact the navigation, EFS. and TM"C subsystems.
The key parameters subjected to test and the source of these parameters aregiven in Table 40.
In Table 41, it can be seen that the interface signal verificat.ion taken
during the test certifies the correctness of interface documentation. )162
S.? ,'4
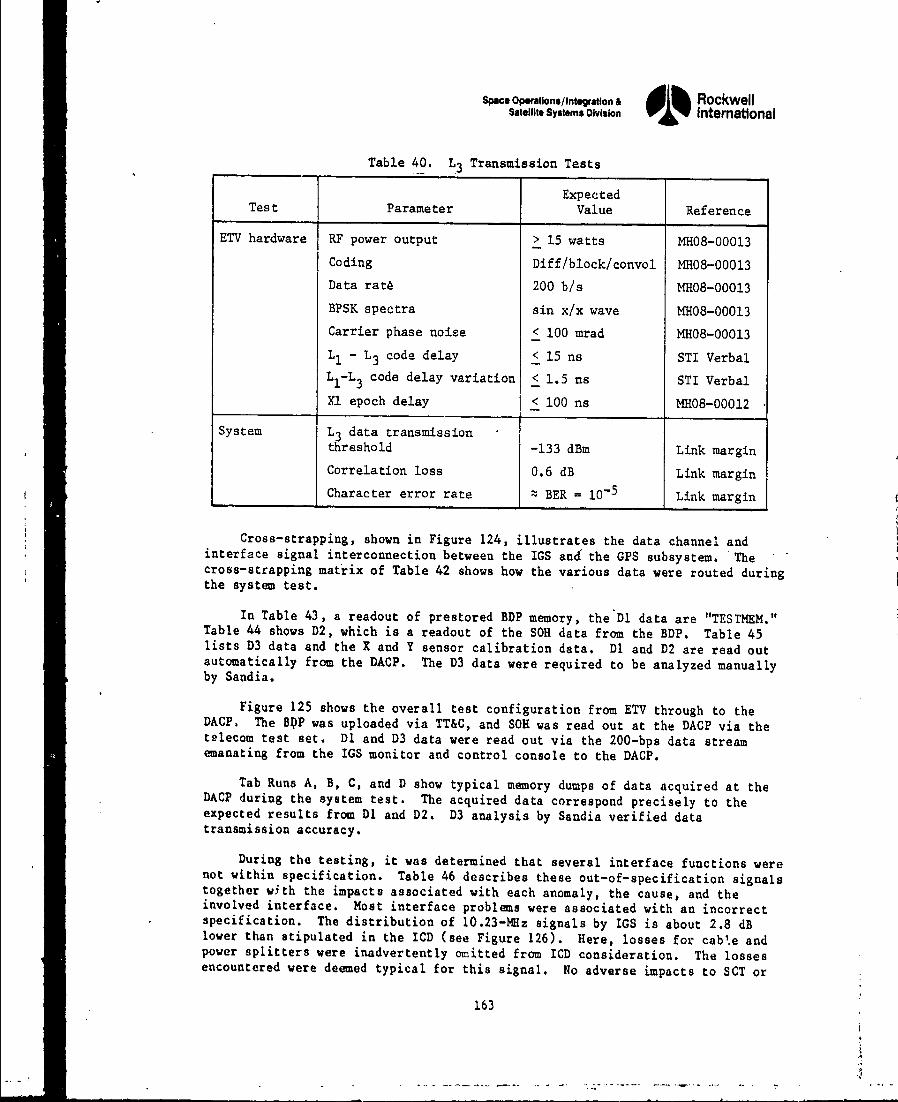
Space Operations/Int"ration & $I RockwellSatellite Systems Division Intemational
Table 40. L3 Transmission Tests
ExpectedTest Parameter Value Reference
ETV hardware RF power output > 15 watts MH08-00013
Coding Diff/block/convol MH08-00013
Data rate 200 b/s MH08-00013BPSK spectra sin x/x wave MH08-00013
Carrier phase noise < 100 mrad MH08-00013
LI - L3 code delay < 15 ns STI Verbal
L -L3 code delay variation < 1.5 ns STI VerbalXl epoch delay < 100 ns MH08-00012
System L3 data transmissionthreshold -133 dBm Link margin
Correlation loss 0.6 dB Link margin
Character error rate - BER= 10-5 Link margin
Cross-strapping, shown in Figure 124, illustrates the data channel andinterface signal interconnection between the IGS and the GPS subsystem. Thecross-strapping matrix of Table 42 shows how the various data were routed duringthe system test.
In Table 43, a readout of prestored BDP memory, the Dl data are "TESTMEM."Table 44 shows D2, which is a readout of the SOH data from the BDP. Table 45lists D3 data and the X and Y sensor calibration data. Dl and D2 are read outautomatically from the DACP. The D3 data were required to be analyzed manuallyby Sandia.
Figure 125 shows the overall test configuration from ETV through to theDACP. The BPP was uploaded via TT&C, and SOH was read out at the DACP via thetelecom test set. Dl and D3 data were read out via the 200-bps data streamemanating from the IGS monitor and control console to the DACP.
Tab Runs A, B, C, and D show typical memory dumps of data acquired at theDACP during the system test. The acquired data correspond precisely to theexpected results from Dl and D2. D3 analysis by Sandia verified datatransmission accuracy.
During the testing, it was determined that several interface functions werenot within specification. Table 46 describes these out-of-specification signalstogether with the impacts associated with each anomaly, the cause, and theinvolved interface. Most interface problems were associated with an incorrectspecification. The distribution of 10.23-Mlz signals by IGS is about 2.8 dBlower than stipulated in the ICD (see Figure 126). Here, losses for cab.e andpower splitters were inadvertently omitted from ICD consideration. The lossesencountered were deemed typical for this signal. No adverse impacts to SCT or
163
4
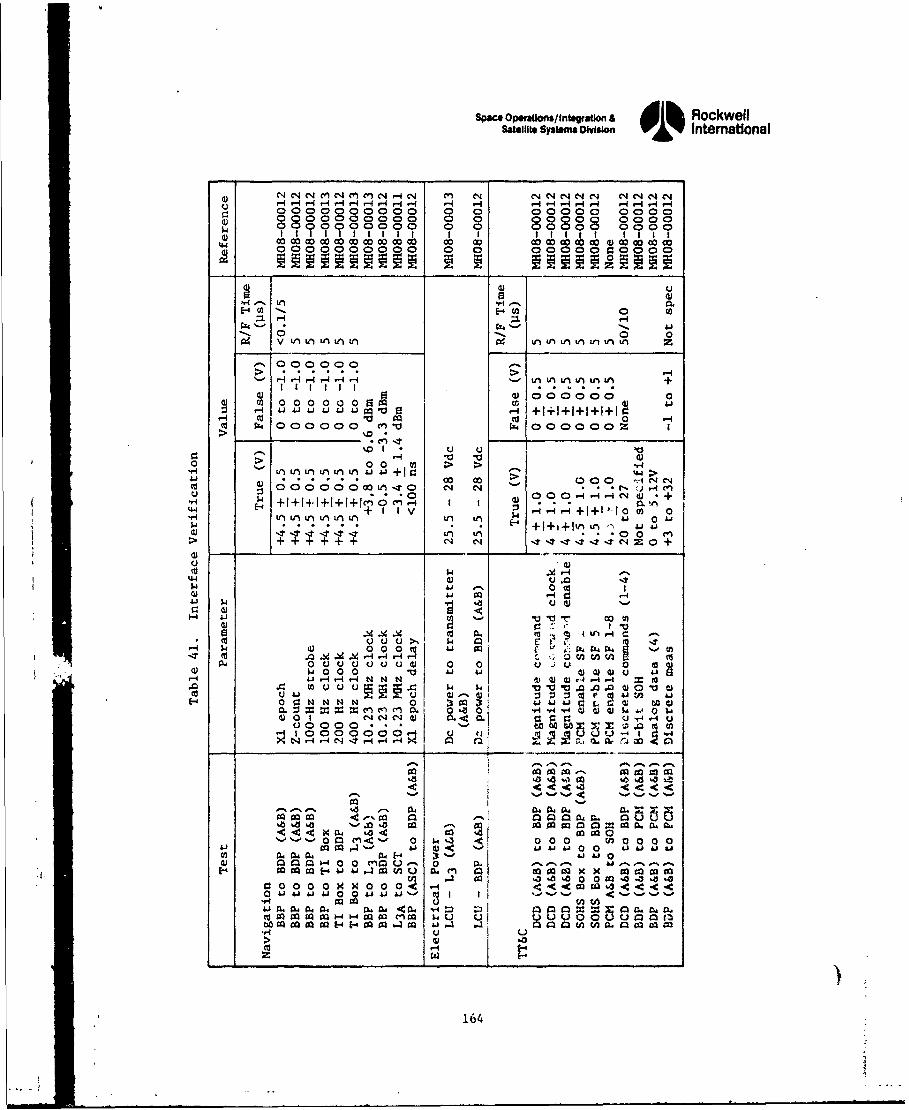
Space Opomtions/ Integation A di RockwellSatellite Systems Division 01%A~ International
IN N C4 CnC4Me 0 4C C1,11CqIN N C14 C4N N C'4H H H1iH H H -4 " H 14-I1 4 4ý HH H -4 IHH0000000000 0 0 00000 0000080 C 0 00 0 0 8 0 8 0C
$4 0000000000 0 0 000000000
0 0 0
0 0 c, 0 0D
H- H 4-4H H 0- in L 0 t L +
0 0 00 00 0 o
0M 000000O0Z~~~~~~~C -(-.1~~~ H + ++IlI
0 >~ c 0 M H>V~~0 00 00 00 -X O O OO
u 0!- -
O~o Okie-'* +c'+t 4ni *- 1W -W*n 0n OOOH HC 0 .+M> + + +I++Ik0, C1 C11 T-1-*-?- 0. +
-c -4 -a ur. - - -cc
0I- 0 010 t k ..0 -1 4 4- 00 C ICAt
W 0 u 4
.0 C 0Qu u W~ $4 V Vt~ V cU0
dH 01 4 0 4 C4 4) L aU 4JJ -4 '-'0000000 0 0 - to a)
0 $100000000000 4.-1 0* HH4 ! OOO .-.- r- 4 4X
-2, 0,NN 07 W, N
0000 .4A 4 . 4 (*2M
-~04 04. 9 60-. 90 Ca A go 0C
-'0x - 0 La Do00 no oo0 0 (n.404~- 0 w- W a-C00 no 0a
40 0 CzQ -4 0 0 MI0U-' 0 0. a-- j-.-s-
0j ýJ -a -31. 0 0 ca -o .I a -a
a "j~ 1W a*42 j j& -0 ýý < -44 go IsWA(A40 4a 6a < . N 3C AM_ _ _200g -ý4t 0 1 IO!1 _ __u
164
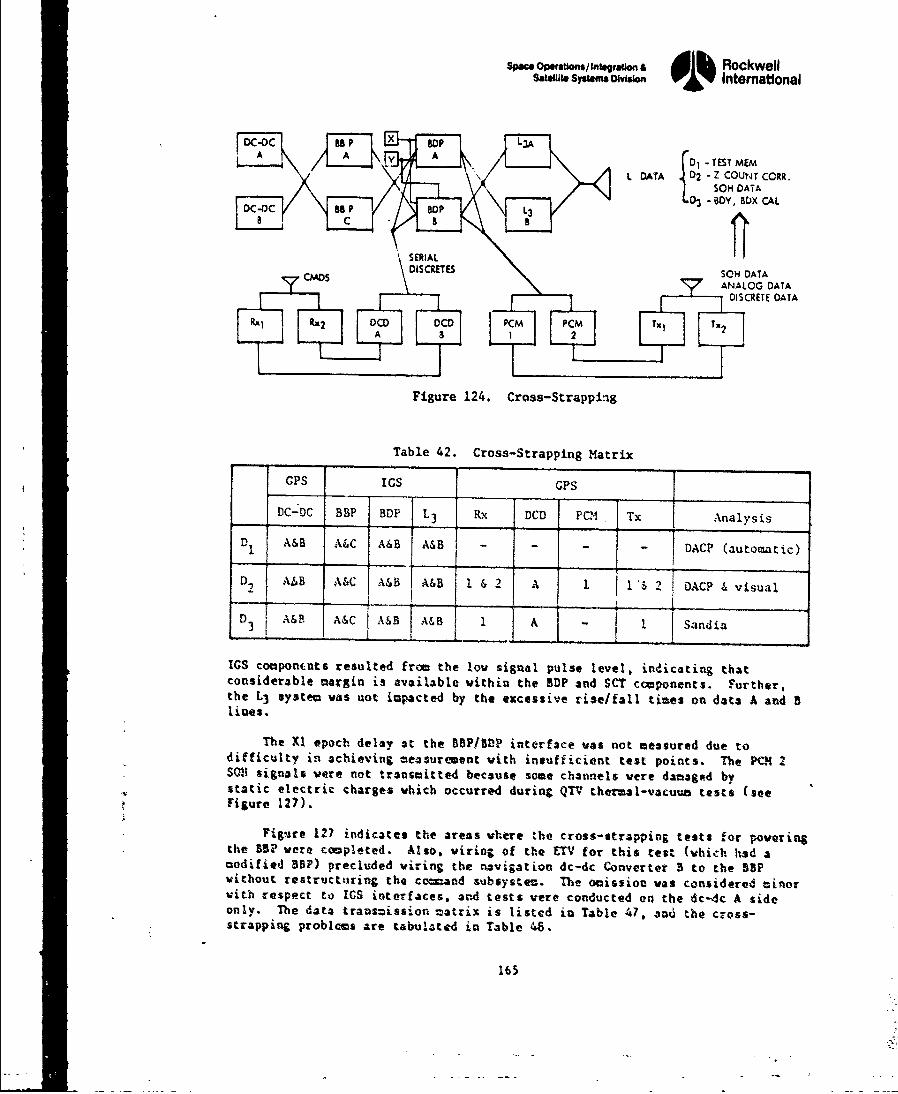
space OptiOns/ Inl.groion i& RockwellS",., sYuIOMWs o•i% Internatonal
A [3- TEST MEM
SOHl DATA
- BOY, BCX CALC &SSERIAL
--DISCRTES SON DATACMDS ANALOIG DATA
DISCRETE DATA
R R2 DCD OCD PCM PCM Nx m
Figure 124. Cross-Strapping
Table 42. Cross-Strapping Matrix
GPS IS CPS
DC-DC BBP BDP L3 Rx DCD PCM Tx Analysis
D1 A&B A&C A&B A&B . . .. DACP (automatic)D') Aw'B A&C A.;*&B A&B l&2 A 1 1 "$ 2 DACP . visual
f _D3 A&B A&C A&B A 6a I. Sandia
IGS componrnts resulted from the low signal pulse level, indicating thatconsiderable margin is available within the BDP and SCT components. Further,the L3 system was uot impacted by the excessive rise/fall times on data A and BI noe s.
The XI epoch delay at the BBP/BDP interface was not ueasured due todifficulty in achieving measurement with insufficient test points. The PCH 2SO1 signals were not transmitted because some channels were damaged bystatic electric charges which occurred during QTV thar=a1-vacuua tests (seeFigure 127).
Figmre 127 indicates the areas where the cross-strapping teats for poerin,
the BBP were completed. Also, wiring of the ETV for this test (which had amodified 3B?) precluded wiring the navigation dc-dc Converter B to the 55Pwithout restructuring the coeand subsystem. The ocission was considered Minorwith respect to IGS interfaces, and tests were conducted on the dc-dc A sideonly. The data transmission matrix is listed in Table 47. *a4 the cross-strapping problems are tabulated in Table 46.
165
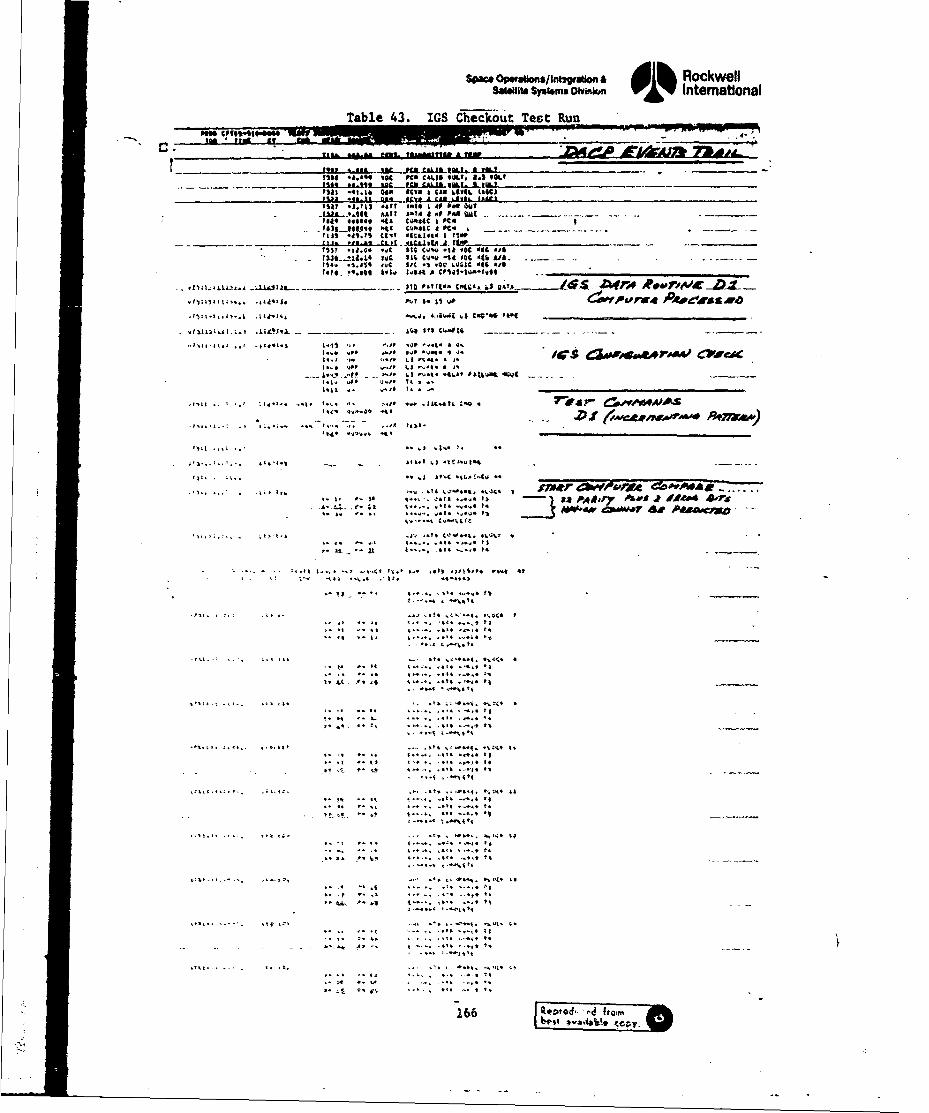
SPWAc OpersUonslW~iraUon RockwellsaaWUt ShI~MSOit 01%V~ International
Table 43. IGS Checkou't Test Run-
C. 122 4-90W -ME
fill 12b k. £t41AL1 a iaLIwIL tiKIT11*) .41.1 "a 100 1 1 CA LAV .41* 060a
I'll .iniU !V,1 aii , wait4u- ..I.14 .*..9..i "It i4410 got PO4 Gat *..
1149 tgStl i CG~I":C a P4
Til 1 .1 CS - il jl U IE -A, t
31) .1.4. *.C SIC00t CC4 .t# A/:t1Ik.4 4V SC -.a C CJ4.4-14 C A45 Ate -. -... ~.Iii .. 41 ,C tC 144 AQL iOU.10-104Pl
340.~*wI4V~lM* 00(4 MCA.4J,# -1 ________________________D_______
.. 7'.14.44.:If .. 44C I1 . 6.PO ' . p. .. .. .
Itt.~~~~~t~ .. P~x W "Vti ~4P4 ~ /~ u~~.Lr.4
14-4.4A.44..f LI r.41. I i
1.11 ~ ~ ~ ~ 11 .%6.!4v _____________________________
4~~~~~ 23 PA4. A41y Oft. A4 4* 111 Cr ~ ~ -~~~J44'.4~4 4..3*Pa
* ~ ~ ~ 0 I%*.- 4 L .*a* 4. 4...X4t ti .. .4 ig.,f.~4 .37*.
1t4
Jfv, ft
'1.1 . .44 .1 1 66 4
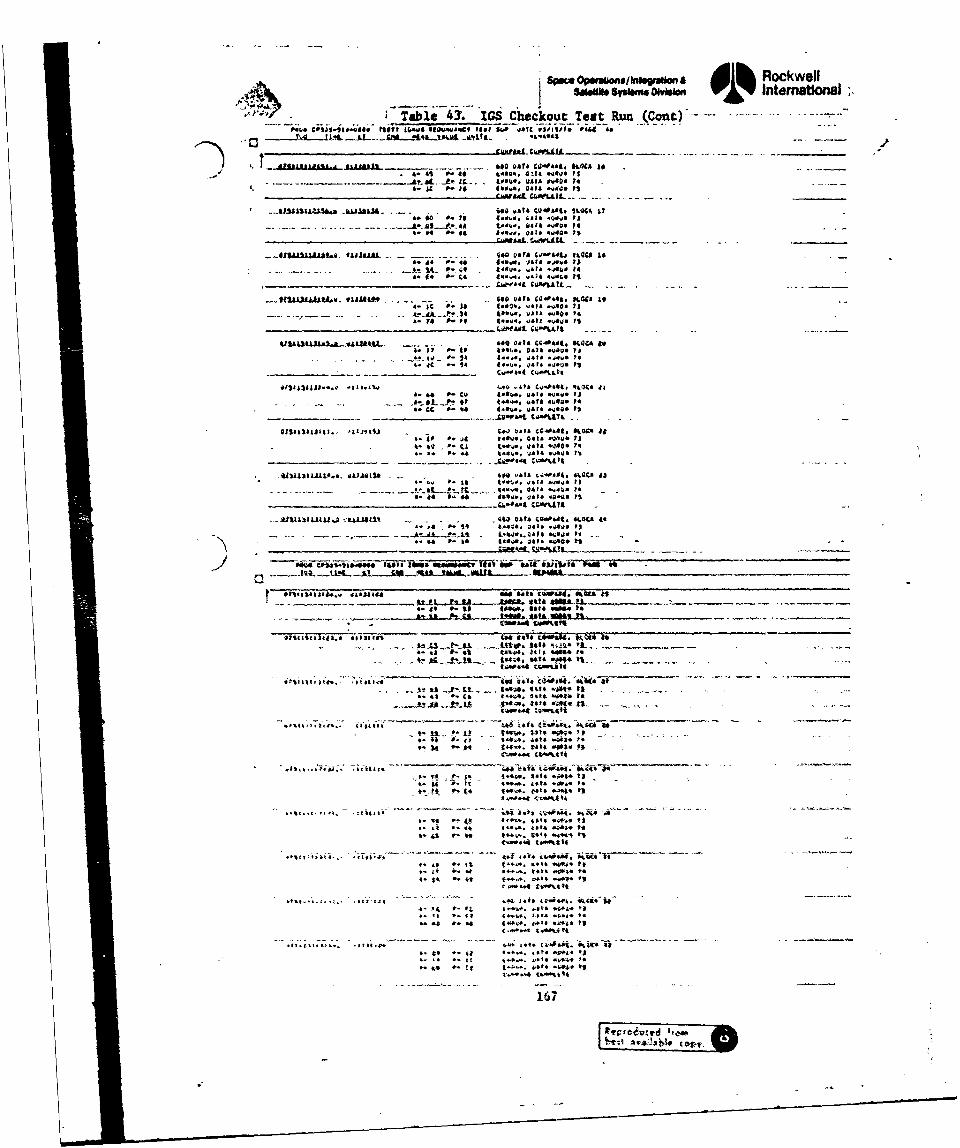
Smome SW" WWWInternational
Checkout Test Run Cn)--wal. ',.And$0-
- ~~ ~ r .- t, 's" fC. 10.014*480k4. P4 . to Oaf&* 0 .*44.4 t$
&a ~ '4.*.. ;arm -Q4 IsL
4* 00 30 4*.4. Wit4 .906 453... * .a-.. no0 #44o'. 041A ."a*0 Is
as 44801. t.4*LLI ... 7$ .. -
.*IIUIAIAA~~~t.4. SjjJokvj. ... .. . . .400v30 041 1400Sto a4 - Ca 44840 0 4148,44 ?II
4,.. .. . . f IC. v-. .40.1 4 a. 4 1 ..4 $1v. -A& 0-1! 4 4044 43 4.0 1.
£M1'.V*4 Cli4*0040- -... I .- -. .
4- .4aa 4C 1 414 ,.404 7)
OV4314IOUJ*....A). -t-11. a"0 o*IS Wa*44 004,RLC 41A- 6 o- Cu 04*o. unt4 *gJvo 13
a- CC - to 1*.' 4FA 34448 Is
915111111111- __________ (4**4 oa&( -Ps.. ' u..It
*31s~hU.. o.4.0 44 4 tdovq oat& of44, qy3C 44. C15 ( 441444483
** a. .- "t (.44*. r44.**0
-~~o *.... -- t. o- .......0-*5a C. Q t)
a- 44 m.* s0o. )at O.. FA~41
4* 4.4 5- 4. 0*4#8 *3 0 *4448 WI)
- -- .4. .14P4v t a&,. ago 1i
4tiA4.IL l~o. .1344414 - -. . 64* 41*44**4, ; .0 4
as..,gaa.ro to -11 "*
*ftIS%1 kA*z..4Z wsli,411 m#. Ws . N. 0.&43 04 d0. 44.4( 4*4* *4 .5- 4 ~.*a lots *%"a. to
owl'M4.....04 I .4*,44~43p44. - -0 4** 44a*.1
*11S1441314o*.~4 44)4444104d014 Od"t
-~ ~ .. . . . . - 44*3* j.42-4 . 4,-
4. a . to ta4-4*.: 3.44 0*4
Ct.4. co'At o
5 t.. : t ?: *% , 164o1. 2.44 4*; 3
0. "at .- 4 . (44 .44*443
1704*-4 ( *&+4.4
.3*... .344,. *443418 44 3.30 j *L*04.4 to
5-34 5-34_ 4.;44 3*34 6 14aii 33i4* ~ ~ ~ ~ ~ ~ o a4 *** 8*5 44 j*
t4~ 5- 1 oso.-.. . ,wrjo3
soot*-ootto
"133, 44 .44~J 34 44*434,04*. 0410 I
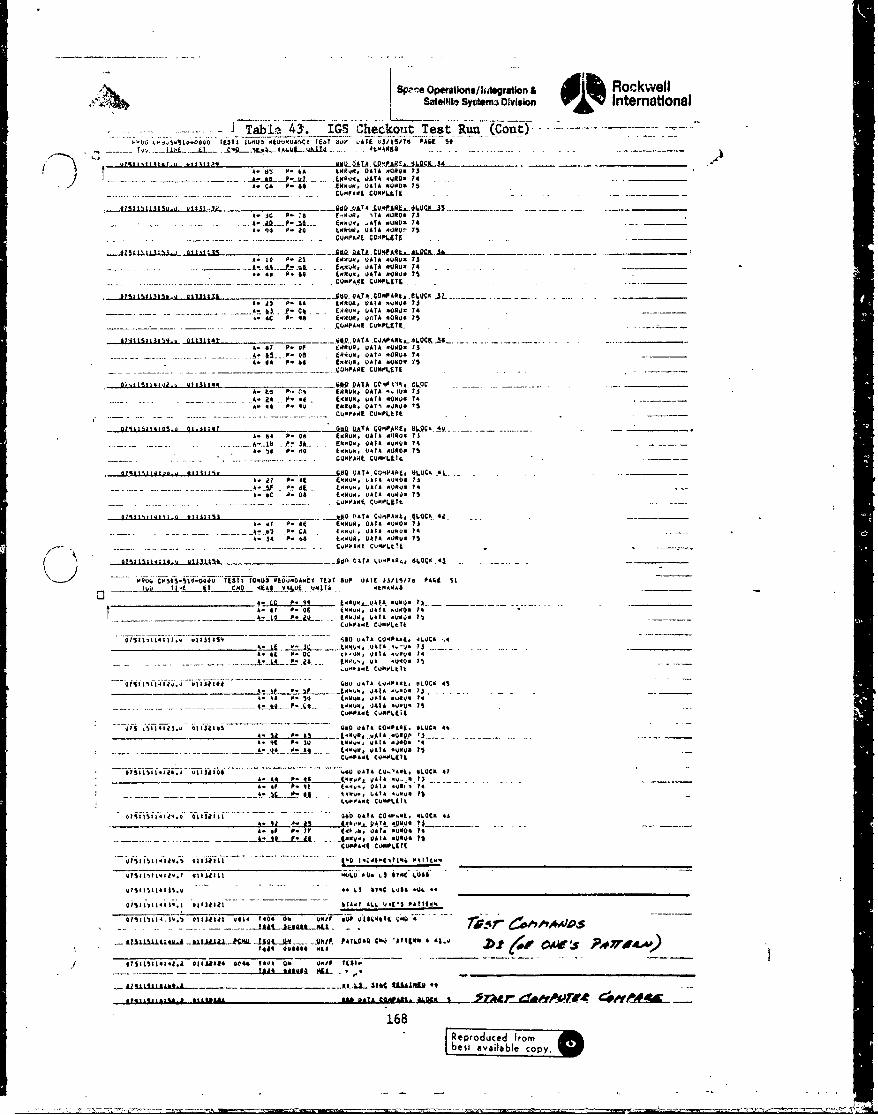
SP-0 operations/ 144grationt & RockwellWON*lit Syctm3 011vision international
-.. ~Tab1 43. IGS 'Jheckout Test Run (Cont) -- --
9 ~ rj90 57.40 1 17 1,3 iJUU0h'.C1 749 300 ,AFE 'JS/71517 E99 59
11411,111111- 43 -1121 1Aj9 0971A am040. & V A -
ob 0-b F... * vit, DATA A490. 73A2% &4-Pw44 A9944, P4AT 449 VSQ-1
01912ASZ13SI-d U I S-4_Q_031__
A- A-- p- -16- 9..UqJ, 'A& I 44 0 7S-- - . A- 91) .3 p40. .otkR AVA .9404 74
.. 00 9. 49 404 . 0474 4401 7
. . ..I-At. . .4_A19.0 DATA 0.41
A. 10 0. 41 04404, 4474 4UR9* IsA . - gmM4,07 JAA 40VRU 74
A* A9 9444 £4AW. JAVA -0404 7
A. JS P-- - - - tCQ"9A, OACC4 N Q8VI ?3____
0743~ ~ ~ ~ ~~C Emh9.4 1114 .. S0 QATA 409A4. 6Q. L--- . . .s. 1 9.AA0AA,09 0 A4S7
A. p.. 44 IUR on -. 40, A 404: 74
_____. . .~......... DAT *OROS40 40 . 71
-.-.. . - A- 93* 0- .ý E9494, DATA4 10A0 74
A. 44 P. 44 E.0. VA 7 OAI U0* 7
.-. A- 64 ... t.. R. U.A40 4024 C4$. 1 3
AM AV 3&- CANON*9, 0AA41.4 9 75Uý1
A. be 0. 60 lAR A, 07 .008* IsCIA*PAME CUMPLLIVI .
3. 4 v 0 u.4
A4, 4PAPt 471404 A L
A. 34 . Aos 14.N, UA7A 473*04 VS......-. 49901 CW49L47
di711,7t41t,Q 01M M74 -A§O I04T44734944, OLQCA. 44.~ . . .a. A7 P. 6C 4A44A, 1474I 9494 73
A. 37 9 4 4 14994, 447 '440' 73U.
A.T gut.49 149, 0AAV 031*94 71 i
4- C P .9 . A £994 1 £4,4 Q9 A ll~~ll~ ft 999 l~~4 A L l, . 9 4 4QW 4 . . .
A-~L 77 TC 4 79 49.0. OE k 94 A Q ,
t~~~~~ ___0__DCM.. AIP47..0......I90,97 9 A0 VS
9l577~7J471s. o773709' 140 9474 * 7044. , AO
4- . 44f .4. *04 9 80 940 450 944949 )A £447
071 37411.9 973370 94 447 44A99 7L3C9 4
Ck P474 CV4064447
071 ,5747009 ~7ij794 90 W4A U0O44 LCK 44
A. ~ ~ ~ ~ I 4401444m,47 49 4
971757414.4 473074 49. 0941 C04-.9, 41.OC- 44
I. (0,& 4A I9 .. 047 . 14 4 7
5" .L...fr U- . -mv.. V974 -0044 Is4949441 C4497,474
47701770. 0773477
o4.01 41 . Ut4a t im - 's 44A *30 7 .............. - .
A. 9 . 7 49,.f AL. V o41- " 714
.- tli.1. P 01111 Vt T40 ON.... .A7it.....7.L ii CAD"'' 97 944
0757711S4417.i 011.1 443 V404 409 0 p TWA
.. - -- $A*IL Ada9JUlJML
ILIL~i~i141 .iJILL2497. 10LJ'7 777j P47.09 444 9'7Af **&.
7444~ ~ ~ ! 044914. ~ J c'
168
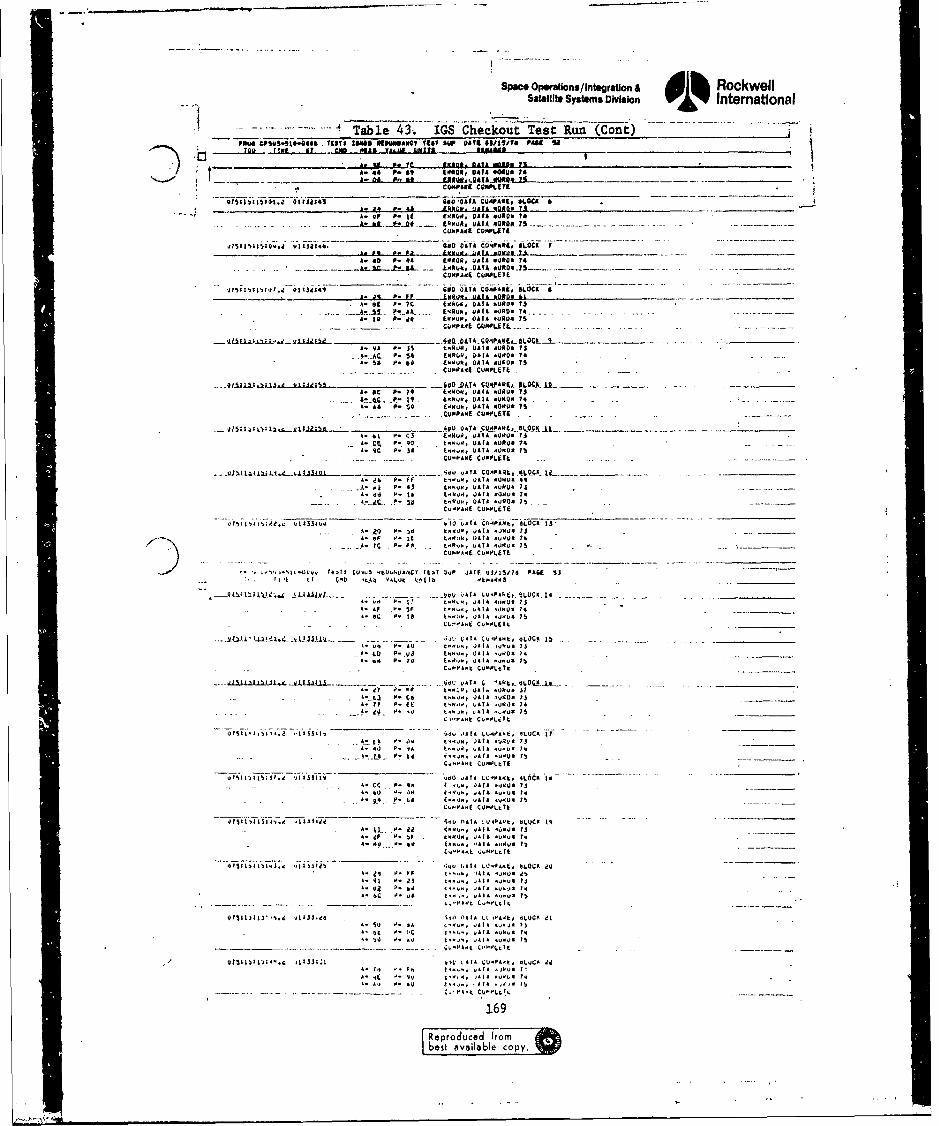
Specs Operations/ Integration A RockwellSAtellite Systems Division Internatlonal
- = i Ta-ble 4. GSCeku TstRun (Cont)PiOW CPSGS.0l*-011414 7(87T11 ZOABs MkIUMANCI V96 SAO 0117 #3119/TB PAN! W
It 4 .* 1910 i, DATA 40011 74A
A El E. 92 E .LRWk.M. uA 1..tOAL.Ij....-~~~4 ITA.O . 111 (111,1, 01171 1107301 74
CU.011tE COMPLETEAI
.l1 11. 71 0.*.N. "AtLAiZUiOI ?3 . .... .. -~* -
- . -P.O AA 7AA C 1 * . -------A
.- A 10 P.A- '141'10 "111 V 1110 A
11.~~ ~ A1 Is AV(110. )1T O1111 73-- ~ ~ "CUN OAF tF1,1C1M kT. . . . . . ..4
A1 -A 4 So ER (11 1,07* 1**A. SS1 P. 114 E11111, IIAIA 4011041 13
SCUPPA-01 COMFICTt
o......_600 SATA CQ4?A11Co AL.QCA.J ........ . .. . - _____
&-" _C _01101, 1 111 D 0101 TiRQ
11. A*1 0. so C11Uk, 01171 110"Us1 isCJJ-PAOE CU111114TE
A- 61 P. r3 EgR110, 111111 .0414. 13 -A:.C1" . 01- 90 (11,1 01111 60111* 79a1 qC 0. 311 E-O.., O11AT .011* 711
.................. . GI'~AO CV-.#Lgr( ..
Allot__ VA *71 COMP011,0. .4LQ40_124.. _____- .A. : 6 1: Fl' 0*011 4111 11101 1
A Bh P-1 .I! o0 1111111*1 411 IT
(.110", OAT$1 ORO. P)..
1111111.Y ý 133. . ..4 111 C,* ATA1 C01101.t, L OC
a-~ of1 it.0. E 1*33u..1
~. 1 0 4. 011 t...o, .4T71 JRU1. TO_______
4. (3 001 1,0,,, d01111 :,"101 ;.3
k-.1101( C1 10. " _____
-.~ C6oý11. C, A(,1IO'i.it.. .. . .. ._________
- .1.(~ 0 C,~ 4t-* 41111 .01101 7 15
A-. .9 P. -.4 (.1...1 UAIA J..11 114T _____C .- h-t C04PLC1(
40~l1101111 .1011, 0o,1111.041111 OO At ~iT* . . ...... _____
.11.(O 4. 4* t.1-11, 41AI1 ' 1*7
A- t.. 4..L 0. 04 411411*0111 'All 011 7 ______2 P 9A I A, CU114LV
41311*ll.3.02_4 0lill t4 .111401 1 'U 10C 0.
C-0'4-10 CO-OL.tA
0 ' 1X,131 141 U It1 An 014.LO10,1(1 1 0 U 404 t , BLCK
A. It_ 0. J'? A111311 * 10.0410 7.
;Qu LAI, CO""oLOI( 4ii
*l0Sll~l,3l.0. .13311 '110111 .",A 0, 1114OO11
11.114) I1e ýJjse nAI LL0" PA* t, 44oCA4 74: oC0 1 0: 1,0,
1 1
*0)AI& 1 73J.I1gb1'*1 CC"I$LL0 A N. F%____
40 311,l ~11 )11334;1 1.~ 11 *11* 01170 7UP.1.1 , OLO.-C 2.1
rd 0. t. (1 0
p *111, *0"0* 79A.,~ -* '4, 411 1**7
169
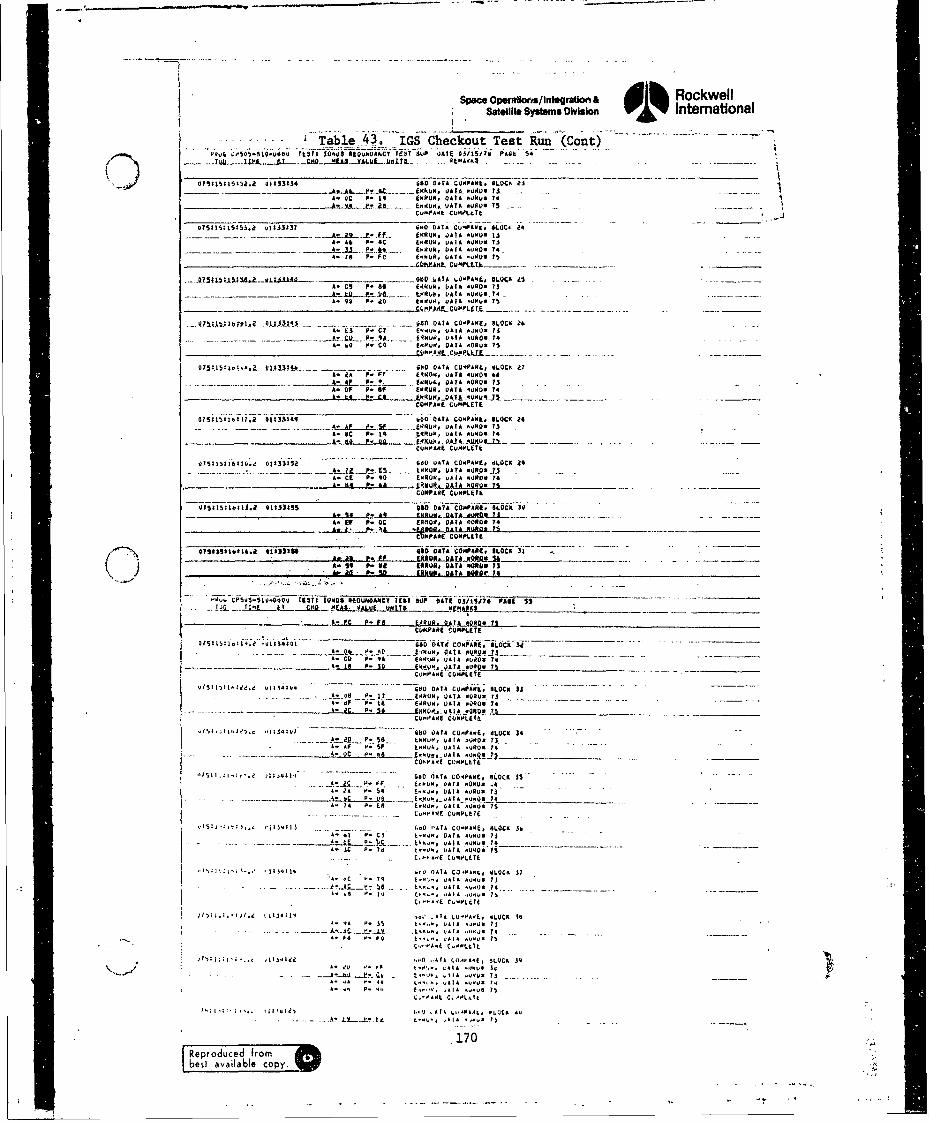
Space Operains/ Integratlol, & Adh RoCkwellSatellite Systems DIVISion International
Table-43. IGS Checkout Test Run (Cont)P ~ ;6 SO.1. 0 70300l 10&02$ RLOUXA&ACY TE37 ZUP 2000 iiiIjI7A PAWE S
2750~~ 3 7. liOAADOtCUPAAIk.,ALOCA 23
_____________ A*A t~j 040.AfA-"AUSt2 73.
A. 1C P* ERROR10, OAT& -ORO- 7.____ - A .3~E 2L -- LnIU,0. LOAYA *01WA4 75------
O7S~591A:jS0S~ vit33:37 4.6 DATA CU-A2AAA SL.OC. 24-- At 22 tr' ERROR. DATA *4*0* 13
A. AS P. 4C OA*OJA, U410 *2000* 7$
-A-J -L -jO E.$vk. DATA .4*09 74.A. to 7 P. Fe E01, EOATA -20U. 15
_________________________________________. QChtAx.L CA"PLLtS ....- -______
S00oAAA UO-PAAO. OLOQ9 d5 - -A- Cl P- of ENRON. L0*04 -OR0* 73
A. 90, P_ 20o J.142, 02000 -ORO 75,
A7~~~00770.J81 D3~ 4 - - - - A Tl At CO-PAVE, A0.0C1 20A- es P. CY E44u.. 4202 A4*2. ?3
__L ERUO D.C *12 ATA 01*74
075:7:L**.. 0.~34 CO 0 0NW, CDATAA -R CA I'S
A. ~ CH DAPP (14ATA C*450*, VIA a
A OP P. Fr LAND", OATS -U20* 74
A AC W 1 UR(, DATA AWItOS T*
CAMPAAC CUPPLETE
CPACCOMAPLNtv
20515i010013.a i 411305 #00 DATA CPA I, LOCK 36
A- &a P. DO (10,DtASl.7
--COMPAQ( CUMPLE IL
AýTSAE-SAiAA0A.2 ,IAJSAI -15AT OAAE GLO-C-X" 33 -
- 4 $ P. c (1010090, DATA 4010. 73
COAPAAOE COMPLETE
A. COk P. FAF AlOt .2v7
- - A. 04 IN. It .E0AON, DATA *04007A.-aP P. so 440122, DATA *21b 7
A. Fe P. FA (024t.~O~7 _____
COMPARE COMAPLETE T'
~~ - - - 0 DATA C0APAAI, 8LOCK 33- -
-A.- 8 2 _1 APk ON D. (4 0 SAi .010* 74-- ~ ~~~ CF A : I'l EN-U Dj..j. ATA URUQ~i i.- - ____
COOPAOE CC*PLOT
*'75u-.;:-",--.2o D.VO' . ATA CO*PAwC, ALOCA 3$A.~C P. P- -6 (.00*, SOYtA AQR* ?I4
A- AF P'. SF L.R4, DIATA VRO05 73
-~ ~~~ .C 0 0 . 4PA.AA N 42 74 IL____
40GD OAA 0'- ( 0.42 , sARAi is'- 7
A 0 - FF. E.NUR, DATA ONUS* . _
-.. . ... .. . . . . . . - L C 0 l ~ . , A I . 02 5 * 7 5
P-S CST t--, N( DA.A 7t0 EC 1'.79 A N , YAIA *UNU. 73
A JC P.:: ?a- - -
C .*A.6 CUOPL07AC*'A a .04
2A2k, 4OL. 31 0
A.0* 0' 379 UON UA .0 * 703
AC _e, N 6 Es 0-u, oSIA **o.* 7
- ~ ~ ~ ~ O. so'P.t *'LY
-0 1.ATA SS2AO LUCI 34
I- d5 1. iA t-R!,N. IAIA 1.).IV. Se
A. 1" P''' 42,,IAl -41): 7C.,'AAO CAO2LORA
70,3 ~~~- AT% -;.. '0'O7..7.7 ,.PAAC, OLUC4 4.
170
bes vailab~e copy. -W
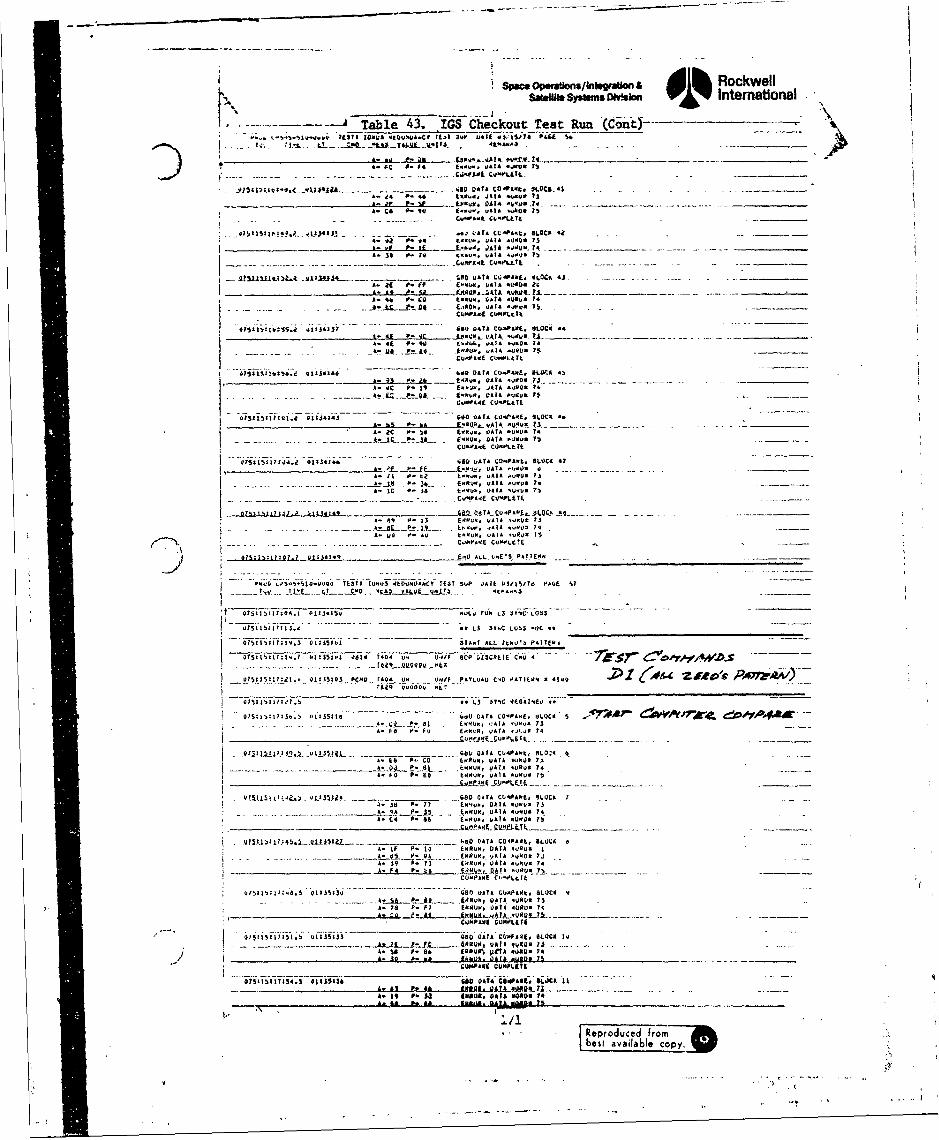
Spec. opmuuons/1nW.gaUan A l Rockwells~.u. syian D~s~flInternatlonal
"----------------~Table 43. "iGS6eck Teat: Run(~x) -- ____
~'..~~5-24Ao TESTS7 10403 *t0.'SOO.CT It.1 3WP 3,458 OVISA74 ft"~ se:::~ ~4 :- A..3
A;- IF-f SF .LpWWo1. DATA -VU _4_5 . 4 ____ _______
C.ý .4- C ,OFLTt
.4. L4l UFAOO AUNT; . 0 I S - ____ht it -AI ".1W il ----~ 43~
_______Wl imýA_ vZ"L__ 00 .8T ( *' L -.t. 374 ,3~ 100 f.- 5
0- cc t'u W. 0 .OI .0tuaI . .~"A. _r'9 C 1100 0.tg. 00141 .,Wv. 74l
It,00 411 p07v 4C E- ! --0 LL
'7145:1b30. WO343 04. 047 04A0I1. 74504
41 - 43 40.00 DATA 0 .037IN~4 '*444 C.ASO E ALIN 7 ______
t-N.A30441 #;45 v- I
473oAt .% *1144 Mg..oV 014 2L..4V7. s
A- 2C I. ta £o'4., ) .. I
0,3-80, CO.'I7
-- . 0- t2!.. & E- k A~0' 01A o-34 73
U04 A.1 U08L17
I, 0.AI ooW4 7 - __T___________F.9' QA-- - - - 49 0- 13 0.80g. ViAT (ito 7.Q
1_ I - .A 1"400 0450 IQ047
A-D--A R U. 0 CoY A l A .R,)x 137 0 CNE 54;44 -
- - . -- --- - -- - A! 13 10 '. `-O L ,3 $IE 703
A. 30 44 k440, 3,470 40404 75
6> C.mt__A41'44 CO .OATIE1 .1Q P '0g PW7ýý
A --Of ~ ~ i F374 a' 03.5 FU VA oT~
liW Wit I.- I3AILS ?I-7 E,P N~ ~ S/ 7 00 . ...
Q7375;3;44,~j5oZS ,.S tuk00 ?A
of0 U.,00 U5. A --A0 ý
-- 07S~i~!i77So.5 4&51010504 DA7A C04PAolk $LUCA - 6~ ~~*A IFO P. FO EWR.8, DATA -*4/4 74
A- S9 P. Y3 1ko40, 014 A 444 73U ?
A- -- - - A j S p -to _Sttyp4, 0470 4004 74
005.I~hI;~5.1..1135tOL D.44 ATA CUXPA41, BLOCK0 V
A- 78 p- 73 WNW04 0400 OR.0 A4__________ . r4 P.URL-1 -4 A.s.Q A 400 -7
CU04PAN48 CUMPL1
11
-- ~-- - i -- - - ~ i /Oi ,c4gFA RI BLOCK3 73 Q
A. 70 F- Fl JR8804, 0400 MURT. 70___________&_ . t a.3 .- s- -
- ~COMPARE 00485.170
-- ~ ~ ~ & " "'pafr L£ ~ 0~ , DATA8~0 3
A. 1, P-.4 1, 00 a 01 A. 04
Rep~roducdfrofj
6es av ilbl -' ->
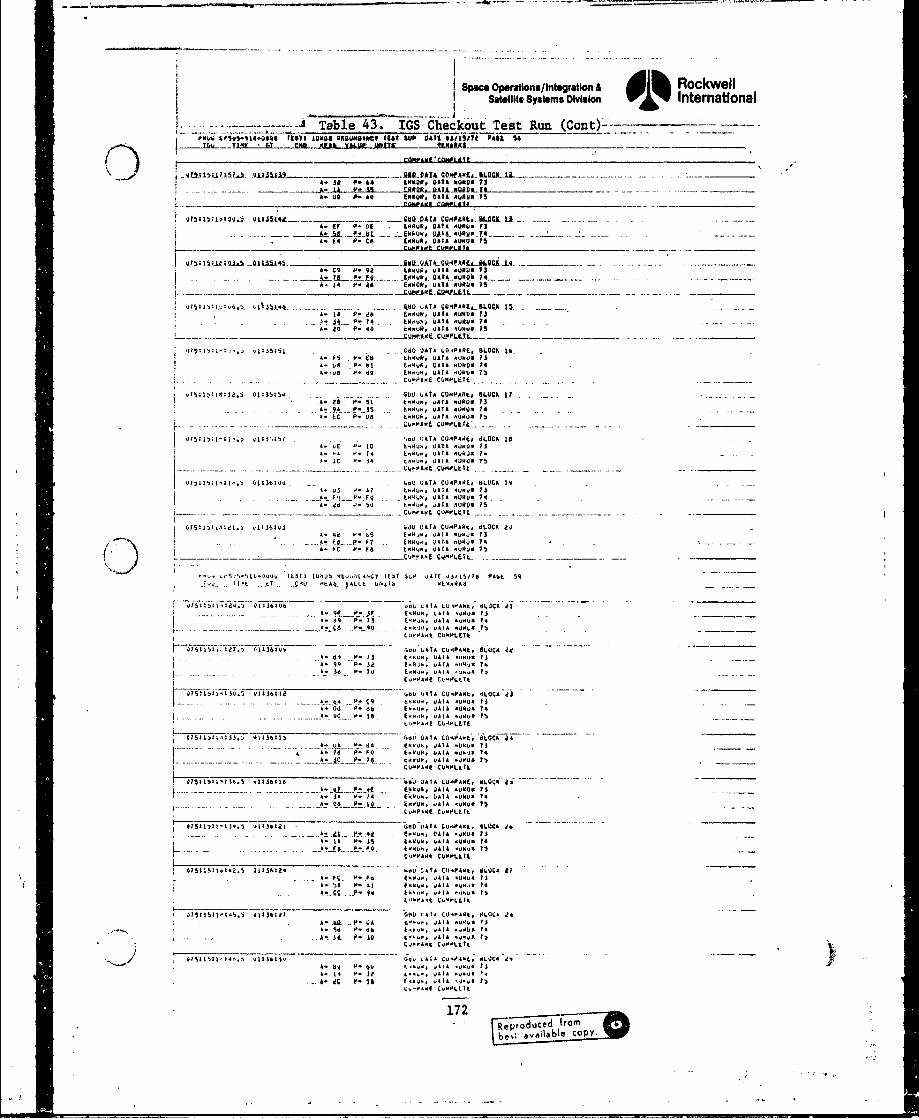
ISpace Opeastons/lnteagratlon & RockwellI Satellite System$ DiVISIon International
I01%--- -- -- -- .--- ~---4Table 43. IGS Checkout Test Run (Cont)- -
P0*V' SPS05-Sl*.06VI tk$1* lONUS 294UDANO*CI TIST SUP OATI **IBSJ?*1 PASI 5I
COKFlAAWCONPLAtt
A- IA P. 35 . 6DB Efl 1* 60*05 3IDI#A-. 00l P- AD Eft 0, DATA ABODE 75
...LmE*0 camAla. h_________
75 o:o L0 ; CJILIAL.._ .... I AA 09.. &"CIL 1.3.
A- _a 9.t~' 01 - 001,01**0067
A. E6 P. Cl *1EA 1 DATA *06 15
A. C9 P.* 90 E*40*. VASA 4*90. 13A, 14 P. 24 EKAO* 0*1* 4007U 75
A. i P. 40 0.4*, 001* 40U*0 i3
7.1~5101 - 760 DATA 10,4PABO, BLOCK to
A. *. P.71.01 49E. , A UWVN 7t3
A. 0 150 0.*jBI, 01 * . 0*0KMF LUK42i P.* k' 4* TAK . 00 6 35
A. * P 013 L.0Au0, vAT* all*0K 14
A- L.C P- 06 07xK0*, W*1 080.1* 751
I.00 77*0* C00406O, BLO0CK 10-
S* C A"14 7.0I0 A CO..).*0 11"!. A- k- E.7 ' C "A0LOt I_____E__
775.*;7577;1* 7713;3o;u 6.0 3 *7 UITA C039*40, BLOCK IY
V3 0 0. A? E.4U., ,AT* UkV*K 70
0 tKjWgk V*7* OUKOK 74
A. F P. PB -- I UK.... 0** O K7
-. .47,')0 I'S7 10SI I-0775 O077wqA.CT [EST sup .47E q3,15,06 P**o 5q
1-0 5 ;-h.i T84. -0 AI, 107 3 b1010T LU*8**0," *1.UCK 21
A. IF .7. 3F O.K. A IOWI* .. o~K73 t.
C77A9,'# CIOEPLETI
A. 9q P. 32 *7.* I. u*7* 70-,,v 74
I----------------0_4"_0 70 E.1-mVIA '-.4.0 7)
U77s777. 1II*112 *00 0T A C0*90*0, 4L00* 83
*6 0 P. 0* 00.",. ORO* 4 . 747 . A 0. 14 E0.I.7, AIA* QWU.6 7
I-------- -* FjP0 k.m*0, 0*7*A V..*3 147 ~ ~ ~ ' ----- A vm) 74110.0****67CO0KP*41 C11%o.070
A- JA _7 P.0 14 E" ., 0*7 U 0000 1A' 0* 0' 7 0 -I.: f007* K.,*. 7
- -- ~ ~ ~ A~m VAS Av!v Ill-*40,o7*4*60Co*P.41! CoOPLkft
_-- - - - - - -- *. 1 f0.4a - .W.*0. DATA .,)*o# 1.5h. 7* . 5 00*, 0*7* U.N.0 F4
A. PC . P- F6 ' ,,. 7 6f ,K 14
- ~ ~~ ~~ -A; U'-..-# 0 ~ , ** 's0 13
AI74 9 0? U ,I "O*70 0 0 100 !d
Aý t . 3 L....*o "'A IS.7
172
Rerdue7(o
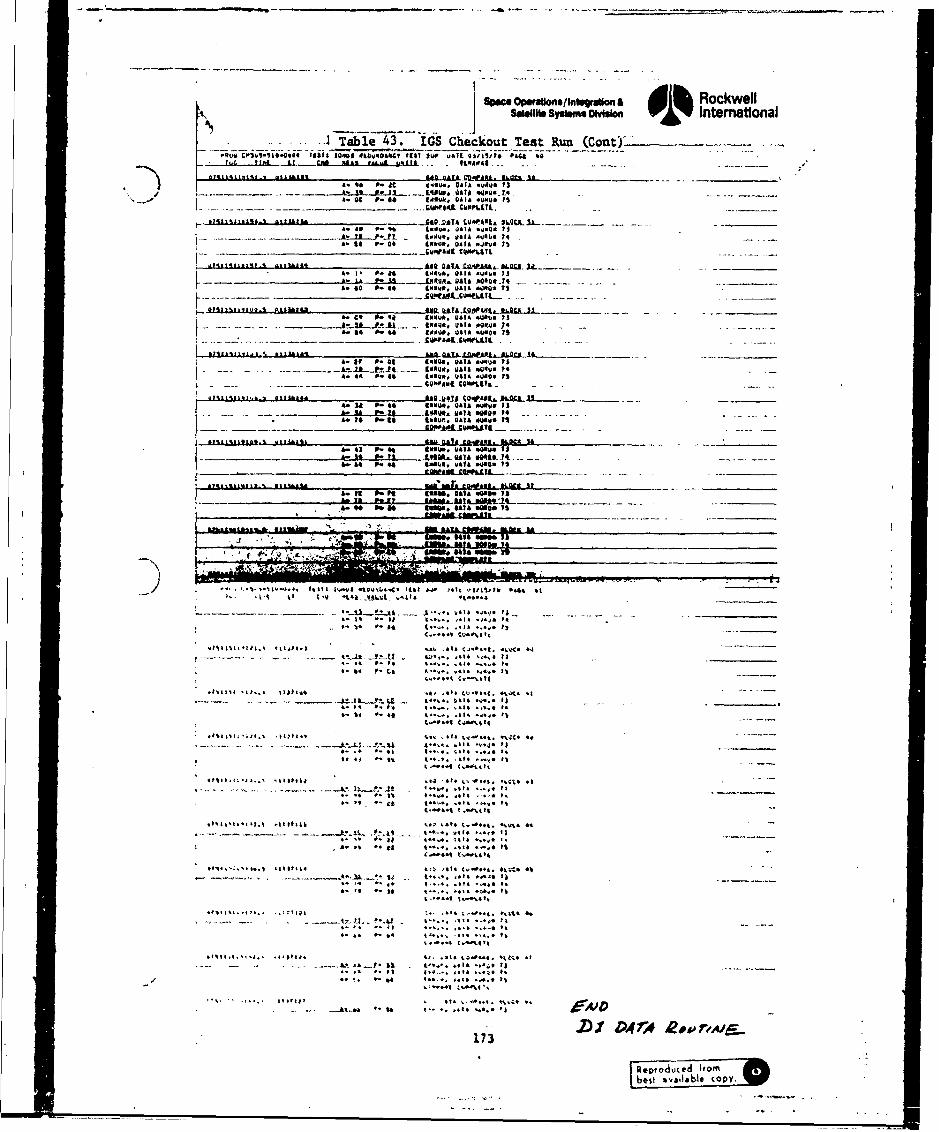
sp.c oper.os/ndraan RockwellS~suhi. SYSUMm oMWloiW~ International
-- ~..1. Table 43. IGS Checkout Test Run_(Cont)-f1r. 1IL LId UNAil .a. -- -- 9.-1--- .
a. V6 0-A p.*" 0410 Q,4Q. lu ItsI .~ . .. o 95 - '....-. LqPU. .41 .0t #6.g s1.4.
to 10911. .rW OKI CUMP1111. SQ. L
-a. ~ ---- z--p-: if I A -.Qho It P. 94 1449. 01A tUars 74
A to P. Do *9971*. OA1* Jews0 Is
-- ~ f to P.. ?. .. r. J. 14 991ta. 901* Pas44 O 4 -1,1
a- 54 . '14 (9"Qu. Vats 9997)5 71
4. p . 9 .99~ *1*vats iua 11$
A- 44 P. too,4"9. M&11 t1)pS PS
A.. IF____ 0 -04 M AJ. OAT&1*11140i
A. 44 0. 44 194m 99* )At&-90 IS
A. IA P- seL......Uo 0$)A 945467 .* A. 4 9-4 4IhOW. 911* one4: P4
I- I- ".5 1911. *9595I1.I .12 .. Lt.QA14 9OPEIL7.. Pt-A4- 94 P. 44 Walk9 9*1)9 .41 is
A-. to 0- Vt is5, 9*05.1
* 4 * 9 . 14 071
ot#t al tsit.(.*L1oC
I.. . . . .o#,.to
S II I .. t -74 v',.5 I.
44 **~*. 010 44j5 09
-.. l t.~* to k."4.14 k"9 t
* *~ 11...5 I
-- 3.*11t- 9t I.. * t..
1730
1 t~ ~ t . ~ - l . * l t . . 1E R w jV9o du1e 4n,
9 . C I t * . 9M6 5-. ~~ ~ ~ ~~~~~ c..opy...1 . *.* a JA4
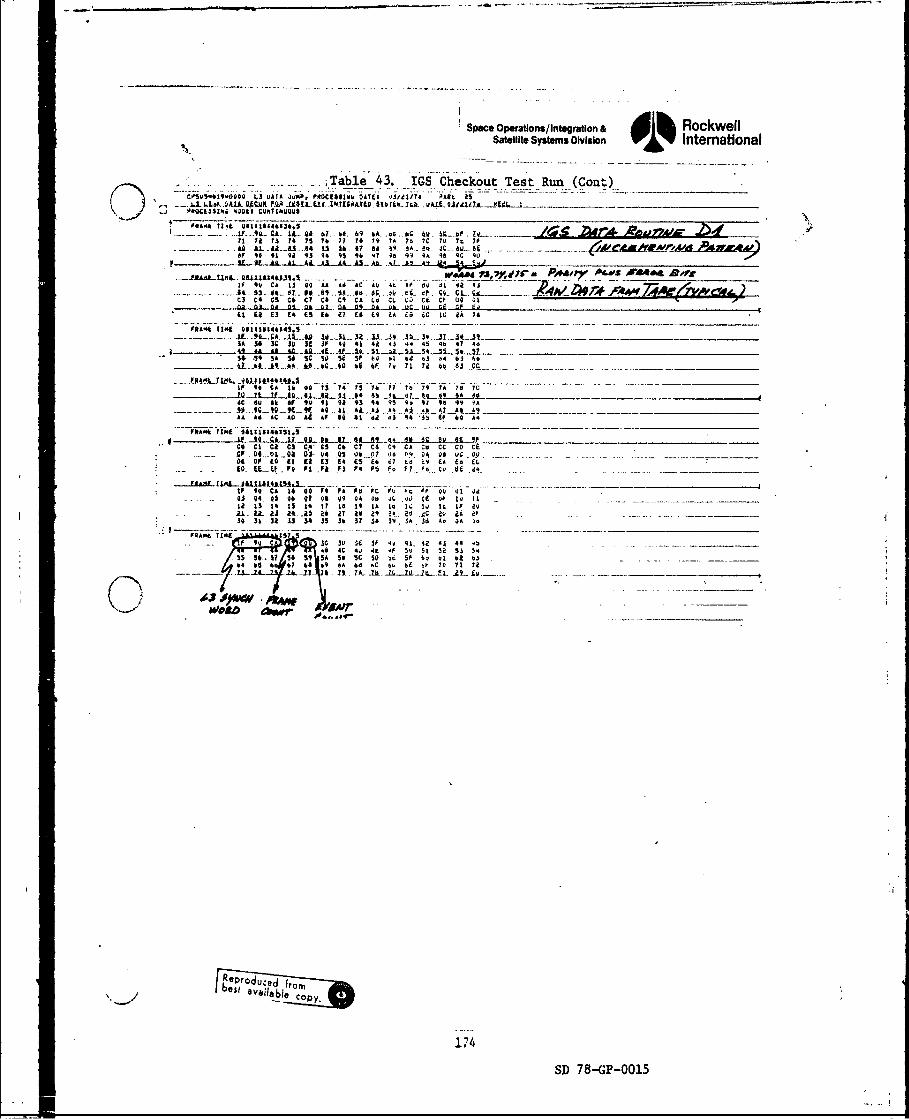
Space Operations/integration & RockwellSatellite Systems Division V Y International
.,Table 41. IGS Checkout Test Run (Con.)_____Plv.41.O04 .3UATA J9010, PI(OCISS044 OATE0 oS i1? PASS, aS
____ LA. A4f..L t0.J0&t.. IV- I ttli Al. 41.U .4 I4 14.4 F f!Ik . .5P .Uailk...~.__
10 1 I 7 3 14 15 76 1? 74 79 ? 74 ?b C TV 7.. 71
AF 94 91 92 43 14 95 9 4 17 40 94 99A 48 9C 40)
P ._jL1LFAA..At A41 Al&A4 l- A*- .,L 45 44 '1____________________
lit44 C . ii go44Ad AO V040 ~d 41y
CI C4CS , C A Ce 9 CA ca CL k; ý Ct CP 00 at0
&I C8 Ea 3 E4 IS £4 Z7 E6 E9 EA F.. &C IC l.A 74
IA 36 30: 30 3e 3F40 44 1 44 43 44 45 4b 47 44
54,.595916U 1C 5')3059 S 61 4 * 03.)4463 Akt 4_A .ý-V .0 AjO 7.* t .. .17
V I 1..A.3 C...- - __I__-----_---
if It CA 1*00913-14IS764777?b79IA74747C
40 6U It 6F 99 401 99 93 914 95 9. It 99 49 9AS.10'_96-10 -f( I ALq 40_.41. Aj& 9.5 A44A .3..4tA.9... ______________AA Ad AC A0 Ai 9F 64 *1 44 . -4 4! If S,0 4 A*4
CA 1 CZ CAO C4'050C6 C? CA C9 CA CC CU CDGF 04_01 -00 4. V4._0 060.f7 o0)9.~ 04 00 u'C 09 ..........- __St01 Of EG It £23 E4 IS Ea £0 ~4c 04 1A Ed EIQ- CC_.. ..4F-9 PI Fj f3 F4 F5 f. F7 F6... Cu BE C _______
V1? 9 CA to04 499 FA449 FC FU Fr 0)E AD 01 3£
Is 94.50 41 of041 04 A0404c q0. .,3 of to~ it0___09 13 09 1 5 1 4 1 07I 0 1 19 A I0 0 1 4 14 I IF 20.21. 0. ld -4.5 44 47 Z6 9 a oo A ~ 4?q at 2
3 30 3 3 I 34 35 36 37 3# IV, 54 36 A6 A) )
A0 30 J If 4 v 41 49k 4 44 44 -br- 46 4C 44 49 SO St 41 S5 % 54 0
65 4 67 44 4 9 6A Ad bý b40 6 7Q 71 7U
1,74
SD 78-GP-0015
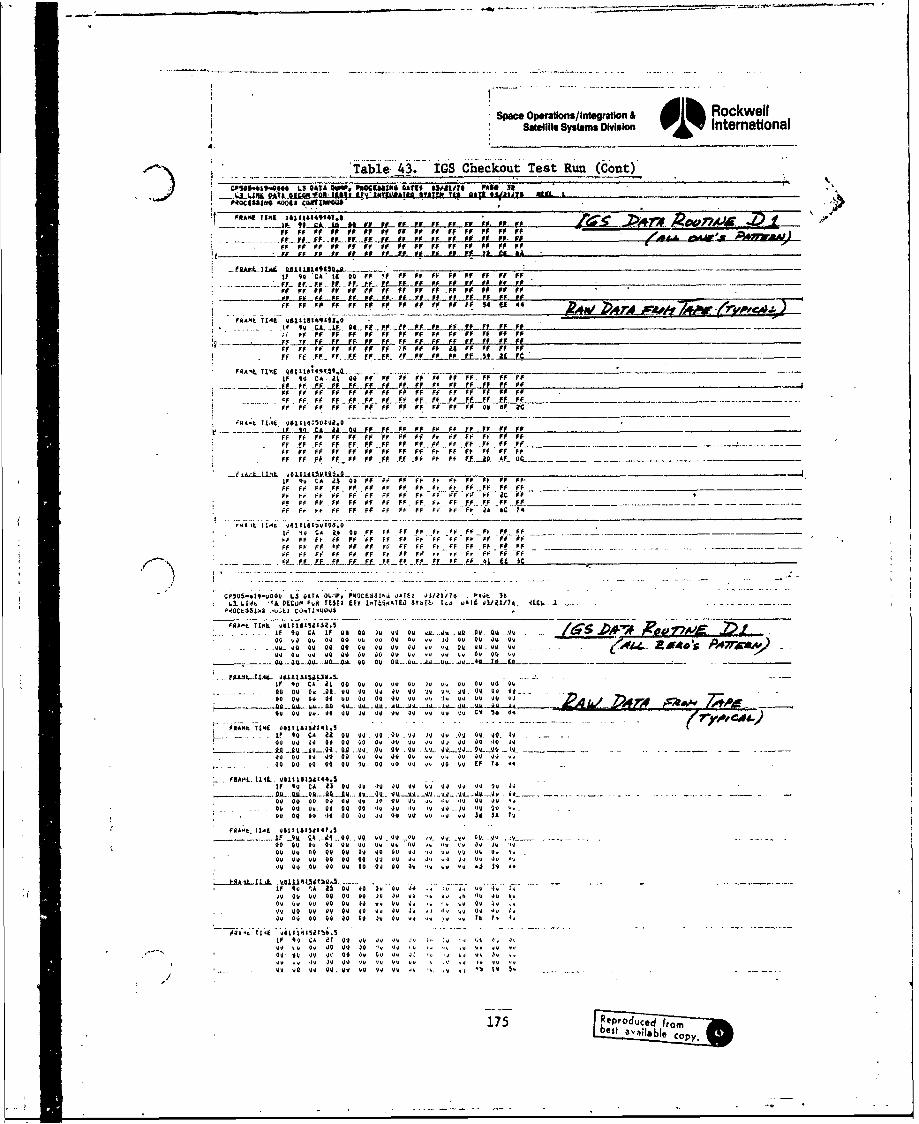
Space Opmflons/lntegration & RcwlSatellite Systems Division International
__ Table. 43. IGS Checkout Test Run (Cout)CPS49~a-61"J46 L3 VATA 34MW. fuOC9IMfh 40111 0300076 PA" so
F 10F FF F FFFFFofFFfFffFofI
.-... F --- -- FfF Of EF. ff. If.. £ L 1 .. L I L L .0
ff E& ff ____ ___ _____ _____FF FFF ff If FF FtfV FtFt #I IFF Ff FfF F Ff
at4 ofBof o to I'd0
if 90'A t Ft FF P f F F f FF Ft t ft Ff ft Ft F Ft~ ~.. .. f..FF.E.f-F-FfL.I .IL..ft. ft Fl 11 If Ft FF FFFF FF FF FF FF FF Pt Ff 1t ft .1 Ft Ft F F
1F 01 0 COl 00 FF FF 1F FF FF I, Ff. Ft 1FF
IL7- . Ft' 9 -.IF. If- Ot-FEL.Ef..I..L E --f FIf FF FFf f Ft F FtFt FF Ff Ff FF F FF FF FF FF. Ff FF
FI FF FF FF FF FF FF F OFt Fa Nt 00F P
;F ft F-F. f f 0P M-f-FE-f t
IF 10 CA. it 00 ff tO I Ft Ft Ff FF Ff.Ft I f
FF F f Ft FtF I FF FF FF Ff: FF FFt F_ IFt FtF____Ft ff. Ft F F tF Ff. -ff- ftf- 0 F t C F
FFf IFt F; F FF F t FF 'Ff FO f F,. ff Ft. Ftý Ft0 F3OF f. tI Ff FtF t " .Ft Ff Ft I- ff FF A AC 7
FF Ft Ft Ft Ft FF FF FF FF Ft ftI Ft Ff FF F,ff.. IF FooF o Ff00 Ff FtFt f t. J FF. jfFU _Ft DC- .... .... .. - _____
Ft Ot FF Ft F F F F Ft FF i0f -UFf FL F FF..1 FF .E F f. £FFf IF FF f.- Ft Fft .1..Ff
FF F,00,0o0 L I FF0 G ~F, Ff FF FF FF F0712 'it'1 4A06C FOWt.
if ,0 CA 4 0 IF Ff FFf0.F0I; I F F
00 FF FF FF 0 F $0 Ff F: eo FF f.o F#. FF 00 -ooFF FF Ff 00 I0 IJ 00 FO 00 FF Fr P 0 F 0 F 00 FF
i go000 0A N,0 00 go 0. 00 00 au 0. do0o. 00 -o 00v 0000 00 00 00 00 00 00 00 00 00 ou am Q00 .0 1 ~
I o 00 ,000 00 Jo oU 00 00 )0 00 o Cv go0o -00 ... 00a .. oO...0-00 0 0. .00o 0 0 " .0 .1.L 4o.00. Oo.Q 0 0. .ov--.-..
.00 DA 00 -00 -QL 00 u.0 0.A 000Pf.r .
- .. 0 00 00. g0 00 IQ 00 00 050 00 e0 v Ct so 0.
tOI: &Iia *I. 01.. .00 0 0 . . 0 00 3, 00. -
IF 4 0 CA 03 00 00 v, 00 00 .00 0 g0 M Q
-- IN -29 -9...0..0.A0...00..U...q QY gy Av 2...o... .0.A..O 0............. -V-M - -00 o 00 0 0 00 00 00 J0 00 00 .oS oO 00 40 'so
* 00 go 00 JO 00) 00 QO 00 000 00 0 "O 30 00 -4
IO.' Io *oI A 04 yv a) go 4 o o l 4
0g 00 0 00 u 0 0 00 00 00* QV ., 00 .10 ov 00 '0000o0000Do 0go 00 " 4V ? 30y .J -)Q 0000 'o
00 00 .00 0),0 00 00 00 00 00 " 00 '0 St U 7v
it 00 Do Ov 00) g0 vv 00 0,0 04 oo .1100 00 g 0 00 00 g 00 Q 0 00 00 v , Vo v0 QJO 000) 0) v0 00 00 '00 a-) 00 "o '.0 00 00so go 00 00 00 00 go 00 Jo J4 A'0 0 ~~
-it 4oJ ý* 15 00 40 00 .pu .'Oo s 0 0 .
0000 00 0000 0 0 Q , I O 'g jo v%
00 0 0 04 0 00 0 0 j '0 0 00 000Ov f O 30 00 J1 O 00 v . '.0 ,o sQv 00 00 00.) 1 0 Z 0 0I d0 I IQ 0 Q .
0.) ov go 11. 4. 1.d ucam l 11 41754 T141IabtLIIip.
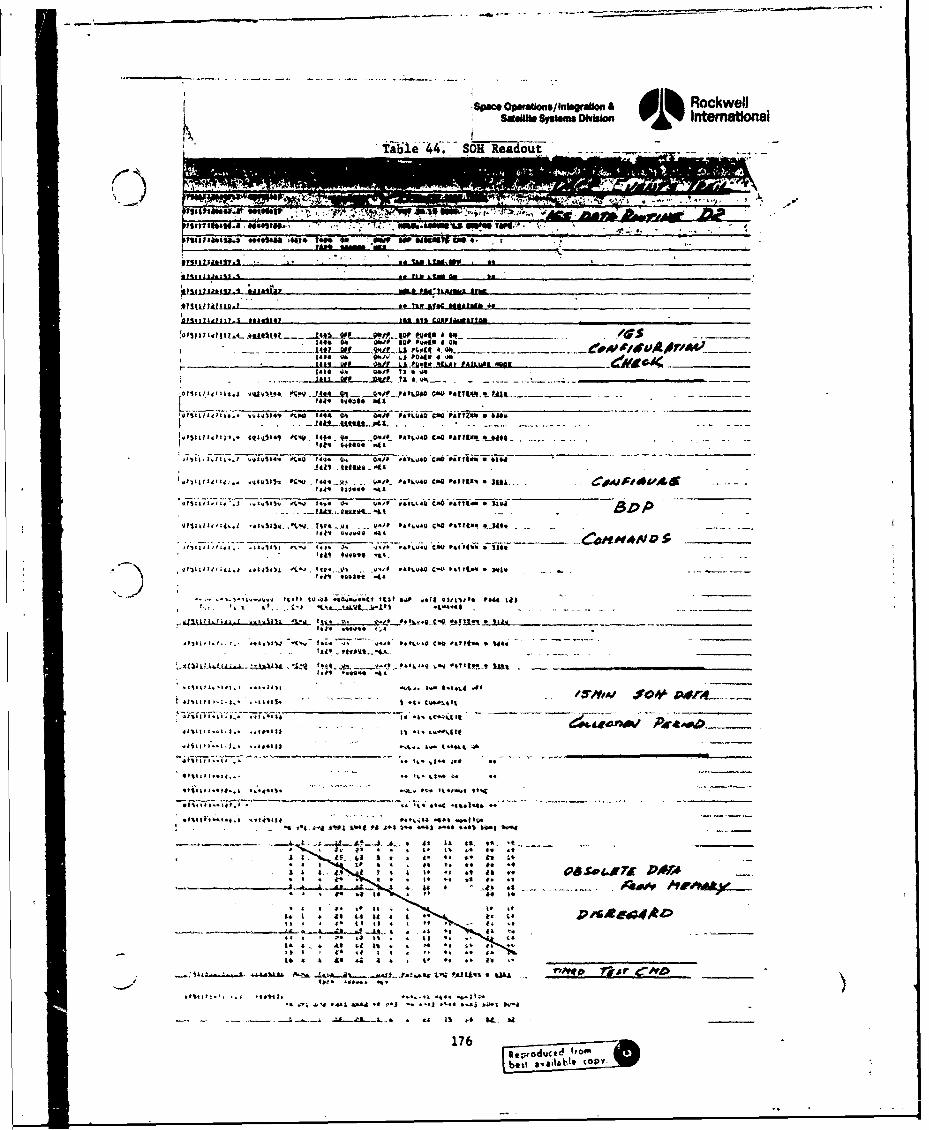
-Spgc ovst"fn ngraWin & RockwellSato" Sysi~ms obiwon 01% Ifternational
Tfa~be _44. SOR Readfout
;03 t'?I 1 .~4- J tZ~~tjjh16I _______________
t~ ~ guppy"* all
C --f.t 4.LA p ____.140 JO 00/vis ye P( *4
* ~ ~ ~ I 14YkFOAF L -g-0.4Vi~I40
'0118111111119.4 -. -WW. . -Coo
44044#4406 .14 _
0C~~~.. .. 4 . (4 Y40. 0." ox"F Jift.M440 A oaitll 61"
241 044644 -t
-. ý - ytI~4iW4. I4 jT-v tz -
Isv guis -*a .~ . _____
"Pit If It 1:4,.1 t%9 4 4 -m V10*.4o- ~ ~ fl 064 4 w.qq. "4a.
i;#6 .4.6404 C'4pt03
4~~~~-0.*~tua -- '.--.-- 0&lit.%I ~O 'Dd~f0 i*C.*i4
*I,'... .4 t it i tv.0 *0Si"C It' P ac o.41 eo l
ef~~~~ttdt ...II * t* *
t0~toI..0e*i *...t) *.a,. 40 *0.*M 0f 4.4_
... L L 4. & .~ L..... 0".&4. 4 44 .4444-
)1.&~~.t~~t..3- 41"140A 16"d PIS k...* 4J .. 44 took4-0 at-0o0 414.1 Vb i ' o _ _ _
tilit Is*
I I.' to 04. 4 4.1 i46. t ,44
44 4... .L..A L..... o it 4* a4.
176---- -
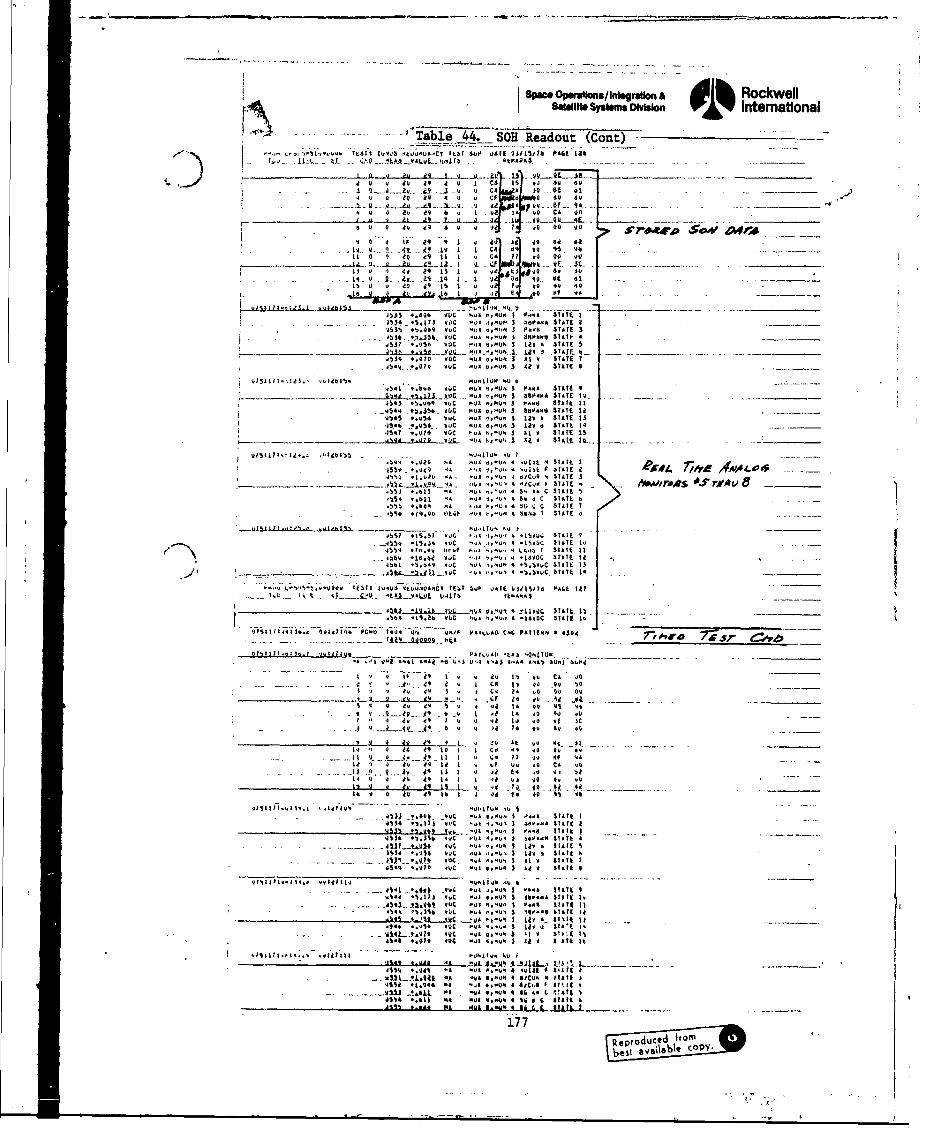
SPeO pefatins/Intsr~on A RockwellSalneli Systems DiWsonW~ International
------ Tbl e_-44 -SO& Readout (Cont)_
- U. 81 . 1s- .fl8 ý8La-cy8 A1
F84 Sol ?-A -0Aft Let
~. ,,,. f4 U 48 48 4 1 CA 8A 3 1 8 .. 01
4 8 a 48 98 4 U C , a 61) doI-
i V -4 V- -. F -94._ _ __
1AL ' 24.48 21 CA U2 88 85 3 -II 4 48 48 II . I4 7 4 U
9 0 0 I 29 13 vs o 44 &2
40. 3 q ITa Ia 1 C a ?7 a 41 0 4 1
154- U 2-4 - .48 15 -I .!0 0 1 Q- AA E 808 0 d 1 881 14 .23TV o 01) .
.5$'8 .173 WOC U.4 I ýU.8s i "8'L. S 3Al 1 163% +-J.469 vuC -v8 d,83,8 S P.9848 STA r 3
'iti. s. VJ8 UC .4U8 48,88 5 488huf384. T88 A _____45 A? ..056 VC t'8 .88 3 1ew A STATE S4
5.539 -. 010 U4C 881 8,888 3 As 8 STATE 7V-88 .:.07Q 881 -UK 8,878 3 aQ A STATE 41
a!)*1 8.Il88 VOC 88 , .8 3 PAAA STATE V____11- 8584 1!'873.3.Ci. 1 g8U
8
a 3 S84 T $ATE IV.
.838 83.558q l8C 888 8,488 S 8.431 11454815 #.Us4 VSAC 843 A,-.- 3 188 A STATE IS
%or8 M.87 bCC 38 84 412V Sat I 1-- ~ ~ ~ -Vf 38..±413a.8 k t"85. -,83 84 v STAEItII_. _______
qg8 8.4 A -88.8 4 - 881 3888 F It A i 71- - -W33 -8*U V 4 48 PU
3'U 4 81151 4 ST8TE 3 It ?A~SO
A'"" "I87 48A . E8 A, AVVIAMA AX r/1A . 8855.4.L 1,385..bi ~*83 4 a. 4./CIA Ta IF ,
-N"53 .8114A 88-A AV5, A A C 18881S5%6 8.1980 t' t 448,48 4 4 st-. I. 31811E
SS4__ -7 . .. -1 ' 418 6fLto TAEI
- ý1i .-- 4 8 1.).842 8 V . 4 . 16V, 4 t184 A71 14 I4t561 *5.0.4 UUC I'.1 *,'U. A*.5AUc 5888t1 83
.588 .18.48 l't .4 I,4 8,8, A -I O 3.1 8OYSIIII~.1..4 8178 1.3 84 4, I./8 P8831888 1-4A P8111 3838 ~k _
V8"148 8-41 8884 A8 4.3 U--4 8.83 848.A A854881 58843,
1~ ~ 8l V IU4 8 -8 CA 48--- 4 j. 48 4 I CF 1'. 4a 48 5
e .. . A--43 vu ' 4 4 4 4 -i - ________84 ~ d 5 ~ 4 4~~ 18 48 85
.- - 3....4 41'.. - 48. 1 44 0A43 8 404. 8 4 88 84 4t 1 8C
aJ J ~ I V 82 14 74 8 3
8 11 1 -4 C8 8... L -4 1 88" .l - - - - - - -_______
8 4 : -- 40 Ca I I C 4 8 8 8T- 1..8 1..4 .. 4l "1 1 4 3 4 48 881 8 4 481 44 14 1 8 1 88 88 'IV CA 884 4 it 1 18- Vii 84 I 4 ,8 .19 88 884 1
88 V 8 a4 48I IFt 1 4 44 to 0 4 ) i5t8
Vast I f- I 18.4 a 3483,8v'41.114M U8 I
453 8538 C V8 4.'8 A 3 8888SAll AT
-q.. 41?...t.1 Av 88 I ,8 14U I I * 18888 , "
-In .. a .....U~4.3 8C 88 4.8 3 At 8 4838t I
48S68 8.88 11AC "88 8,.U8 1 at V 38888i 4
-- - - 41§1- -8 .488 -71 to 43V A.88` A P..8 at,?( It
J84811 8.08 881 -41t 8,.8h 3 A& 1 88 if 8t
It8St58 1.1428 V4 888 .88 4 88808A 4 I8'8$8
. .AI.L~t 8 % 8.84 4 8841 1 " 88 I ti
4144 8.88 8144 4 *U8S 8.V 4/%1. 0 4 1aift 6
Rj~epfd eItomWI
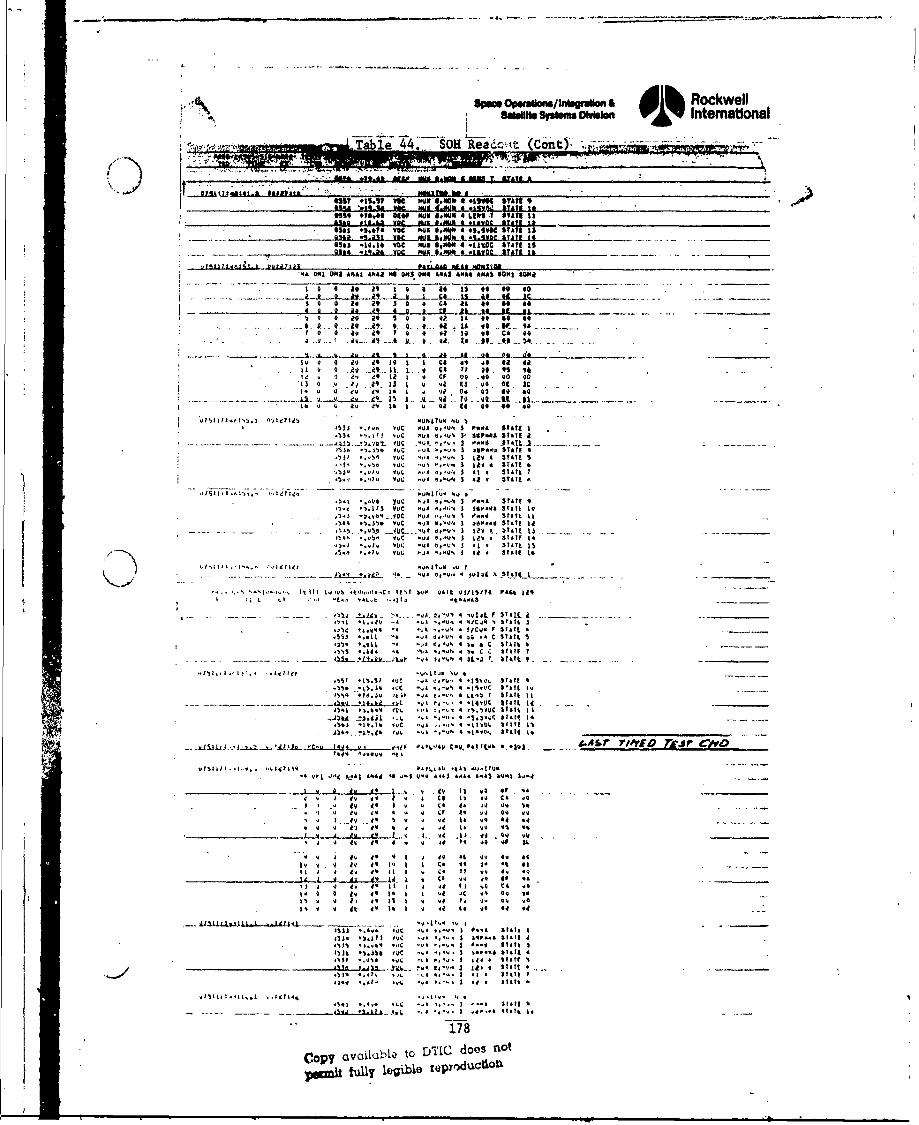
6pm .~n~griin aRockwellsamm sysisms Maimvisionin
Tale I4t. SO ed (Cont)< -.)
"r **0 *`4J0f v a S. . t
tI .1440, 5 W WOK 8.04tg 4 LOS .15 STAI It...A ... 1, One HU* .I *#4 A #$ tilt 0.1Is
KIS *?bl 9ffNUN. too" 4 .195 SI~ Is111POAA *lA2 IO *1 im* AA 0* itlt1
IN.1 0 5. 4A 0 AA OC 0143014 1,4 9 A S M4 AM.50 IN) ll ISot 0 a .4.1.10 010 toLii~.. t 0aLSI 00
054 at .0 SIC 3 O SqM*C4 a *it f 1* 1.
If... *1* .11, 11,400 19, rj.o.3L t10 O t~ l 0 0 -.
9_011 2 9**62*082 0,4 -0. 4 *0* 1114 ANv or0 VA
10 * 11*9 0 0 * 10449
______I It *%£a a r ,A .j t a14 1 24 0 4 5 0 0) C 1* .0 90 *
7 0 0 2 ao a9 7 * 0 0 A 0
Lb 0 1; iI 01 19 1 u Cl to it 0* *
..,4, 49 1 IV 6.* CF 00 OM STAT a0 0- ~ ~ ~ ~ ~ U IUA 03 0 . O .i 5 0 * o 3 .0.-0 I
vV "U 1.- 04 10.. SI 4 * 0 0P 4
-3, *.0 qV(. -A,' *.o .- o' v 0 StAfk £
.'1; -9 3-% 1 180 v STATE 0
-. 0**oo 0 o YVC 0 o~.* 3 *04-;A.,& 11 1.3o~*.** *4: *0 *.*.2 5 * :; 1*1 IV
I.lb vv .I 61.0%* 3 STATE III1
-..3 .)'05-0 .40C _ u 0
O .-U4
4. I 2.1. 4 1"t. :0I" ftM~ C 'Ao 1 2V o 3 03.1 S TIl 14
V*' 00* *.V4Vo~ Sltiff 11'Lit;*~1 II': 11. 1,,*' i I'lI STIARI to
1A.. *.ol,. 0*' .o 4. 14 % 00 3*1
1330 .01!4 V "`. -. .:qA %ZP 4 "'I 1 1CI tZ V - A *,. *' 4 ,' /CI: STT
~ '*1 kt . 1 *1 $1 411 S l it
4541 2.* l. ', *l.10.. 0C Itlt 2
At'. ?.11.44 * Iv, f
l 0j2_~ 144 0 .0* 4 10 01t"L (9 Q *41 00 l 4 -1 0
0 40L 1, 1 1 11 1 * ( 0 0 4 0 3
-4 vL i0 ALA 044 04 .-. 0's 4 41 0 04 J-4
d..4 .4- dy * 1. o 04 do
*~~~~1 1 34 0 *0 3
o~ ~ #v* 4 o o * 0 4 4
- ~~~ ~6 q ,040 921 ~ ~ ~ ~ V 0 *0 0 44 0 Clof
to 1 f ' 2 44 to go U4 .4
-tift. L20 4 .C l .- 2 .0 Stl
03Jy civu 0 I,01.I 100 4 does 4 no
legbl 2*43 **: * o *d0 *51*1
ve 90. *-I....33.. * 1*43 8 0*1
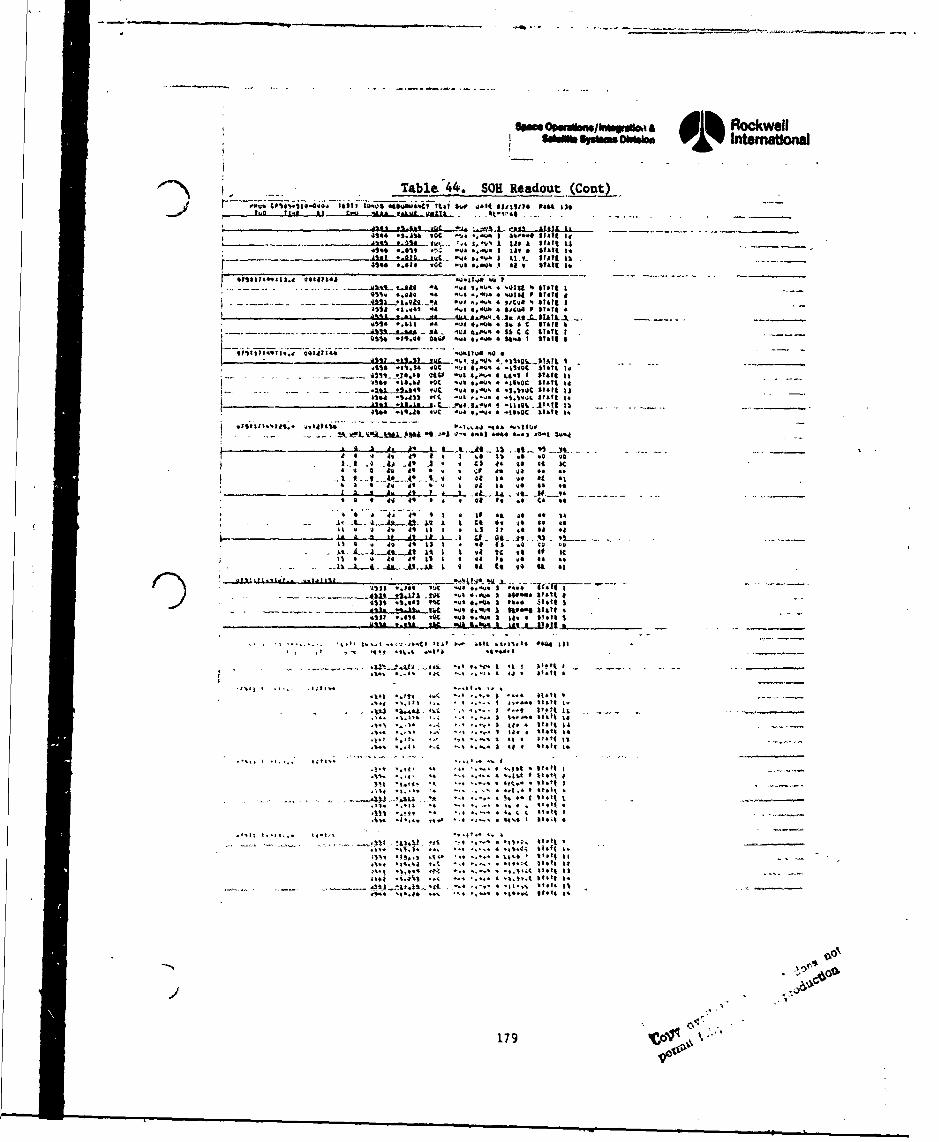
some ,pi@~ Epafwww ,a Rockweff$d~wsli kkb YIntemattonal
K~ThM:4 4tO 4144 o;:Table 44g. -SOH Readout (Coat)- ___
V still tumus .0%"AA It, .,44* O 4,111111 to" 936
r~k i~w ta a, Start Is41416 ..Oi*. . o ..S -0 1 i lag 0 1 Satit
1)4 4.4* wC 4 *.4t 40 v Tat? to
- ---- ... M...*1ii.t.9"d -4 -V* ~44 4 1st ft starl I0%*. 4.040 -6 ...a -,1 4 W1,14 F 11.1 a
.............AIL.1.L -v * II4& 4 V/C-0 4 $141t I-$* *~t 4 .. a ;. -- J,% so (44 L 1 -144 4
-***.-.. Ift -.-. At-.L*044 No44 44 -a *. 4. at 4 C $I&? , 4Im4S.4*.a,. AsI4.poa.II1C C $1,111
0$IU 4*t.40 01468 -". *." -% U"* I $wti 4
.1504 *4.1.4 44C .',4 0.*9% * 'IvaC 141 I.rtt
4)01J~*4 -Us6 .4.0 I.1 4 ;O ""tS 1 11&M4G *I4.4 VC ý4* U44 *I4a c trti
-- -%J-..4* 4' a49 "C -U *.".* *S.11VOC 1v4441IJ4S.A -5. %1 v-, .4 **.* o I.SO Stt a14 1
4444 *44*4 L44 f.8 . 4 *11iltO 11 10
4U4~444. .444.46 *VC -T.4J *.N.4 -10.0c 0410
11. A 2. !-- 4 m A 1 t .j -6 ... ..0.4 P CS 44 to4 * II . .0 4
a 1. 4 All 49 . 4 C) 44 so 0 It 0:
4i 4 4 1 41 1 06 it .40 4, .4
.0 i %I 1 94 It -001 4I 4 a A. 9T L .1.4 Oc toL .0.~, I -. . . .
40 4 4 04 1 4 4 40 Is to 44 .9
__A 4ID *,ft js I"A Stt II 4 9*03 -S~..L.L . 06..3.I V14 1.4 Ct vs. I9 I
40 4 . 4 I .04 II W " 90tt '
I-__W__ 4 I 11.144 64j4 1
45 4 I 9 I I 1 41 .1 Vote I
:- f :1~.0 % t 1 4 4 * . 110 t
2 ý,,.4 4,- 4 ...a it -
-~~~~~~ it:. .~ ~ 3 4 4 I 14 a .0 4*. I~ts~t Is~$I ..92 0% '4 * 10 14 . tt444 $ i t
.1)1~~~~~~I 1.1101.* &~'$4'4 11
""~~ ~ ~~ 1 a 4.LiLL..t.Li$t s t.t I
Ot.4... .*...4C 14 . 41 44*4 44 4
S44. 4 .4~* * 1 WIt4* - -_______
.144 **~4 *4< .4 ~ $ A4i*it a
... .~ta * a .... f.f
.10* .. *4 ~ . ..-.. I 44 11.4*~~~.04 Oros.%.. 4%4'..~. 4
*. . . .. . . . . . . . . . 17 9 1 k ' 4
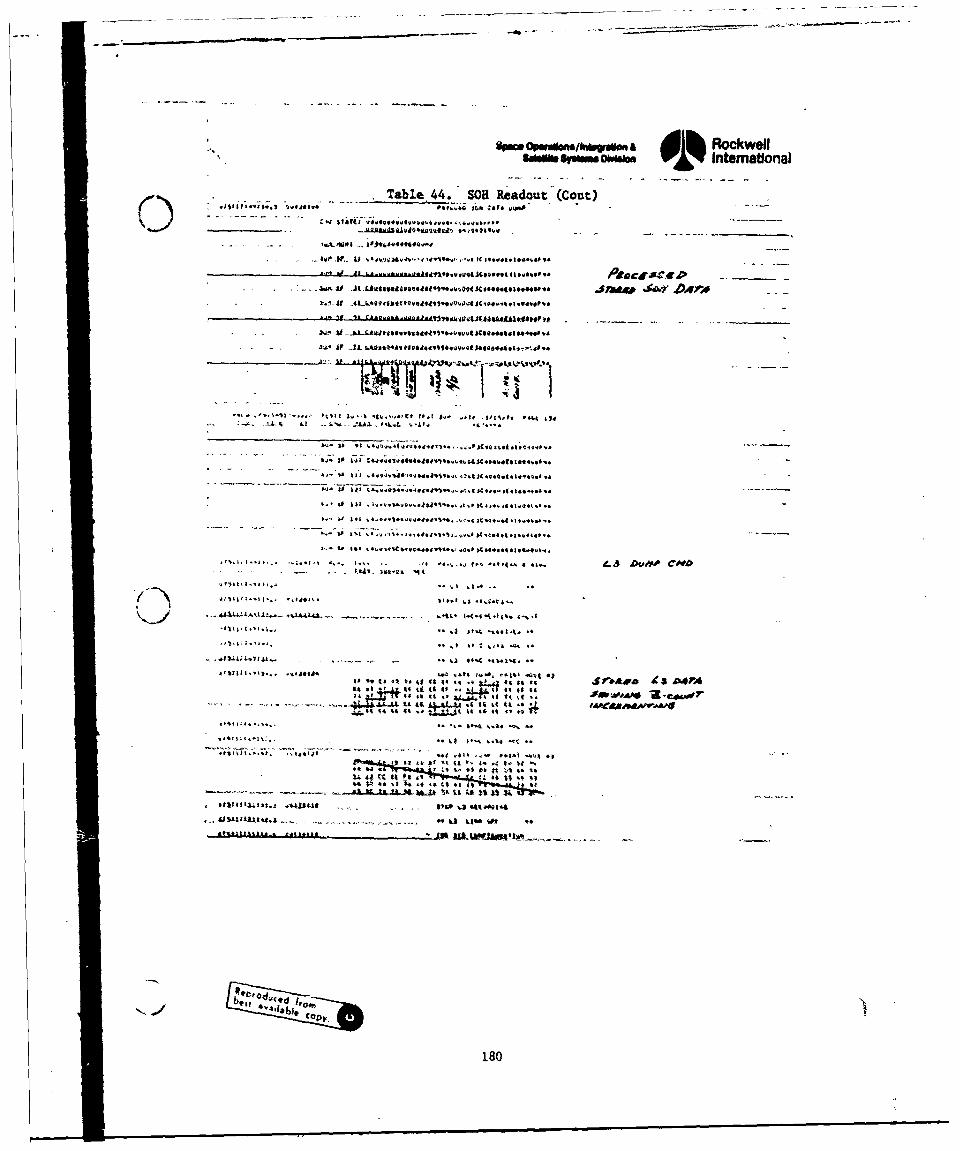
'..p4 o.-.IRockwell
,,m 0. 1% International
Table 44. SOH Readout (Cont)
* . .. ).. . .y . L L�P . gt 4j t L 4t.•,.).,.•I ACt ...... .# I * O4ster*
* s+•, . • ,. .. 11., + .. * ,, . .. 9E .*,t .3 *'*.-,,,..v -,t )CI.4,4141, 9 •. .*9* p
S.. .. . 2,! .. ALM - . I 2iL il#
ll-.- i (54 * 'l'.ltt'¶ ws.AS t,[*., ut•L ,,..*Ue(,.
ijVl+It *a.,S • tl, .. ,+ 2., .'5 f .lIt4
C.4. **,+l+s . .4,. Li Dy
It8
jtjk'f .s. '24
%a its*4*6*44
J.- S 22 I. ... -LA.1 C .. 4
to it 44 ~~~4'. toa 41AAA aA rit to t9 44 64 is*#~
*~4 %425l~.. to154 -.. .. *2i.# iS
4442 %a 44 4 '4 41t~9
"". -.- 1 .
1.80
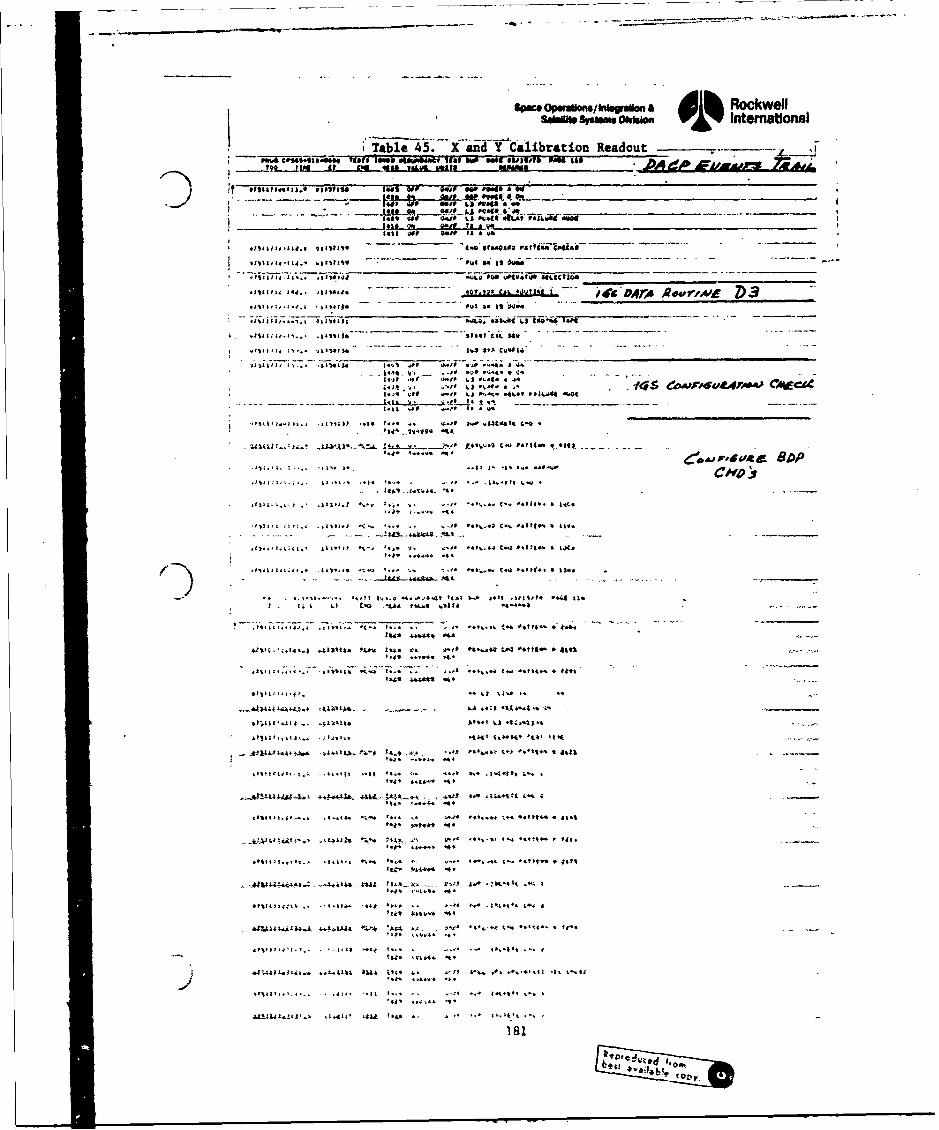
SPmO Operabn/In.Uaan & Rockwell
iTable 45. Xa-&'ndýYCilibration Readout .-.
~~~ ~Cte.- IS& ii.aaysvu WAHKM5ut, PtL i.-Ad
*10114414. _________________up__"A'__"r_"ME__a__MW
'-Out sm is -. __ ___ _
6,6,-."ei si - -- -, -* -
Sj*,,t - ig. - .,0 *;O - S '3.1411 ý f -I.. Lj "A. . .
ft *...4. a' 6 " 8.04
.. U-4 .13. It C.. .
J4-! flWU.J t.. t4 4 *, *t,#*'.I*t4,S Lt
ha4-. *.t.44 **A
'4*4 ).4 06-1 ;ffi ftftsa - - -
I ~ ~ ~ 7 A 64tA . tt*40 uk t4. .).
.I4,& ~tid,4 .aftU, 44 tt-.4
. ' &.W ik ~ 'till. tt* -
1(44 44* 4
t34. .54*49 .4#
ft..,, -O-f tj 445
*6)IU*U44i' *4. .! 4tI*
I#IL~~a,,UI a,..,- -4... . . t~ 5*4 f5
#t$4A4t~-.-s4. -4
k~U.~* .1.*. -1 1'1. -. ti I t.t * 4k
aulta Ait... *I..f*4 4 at**l%.4 :ASA t *. t1 fr..
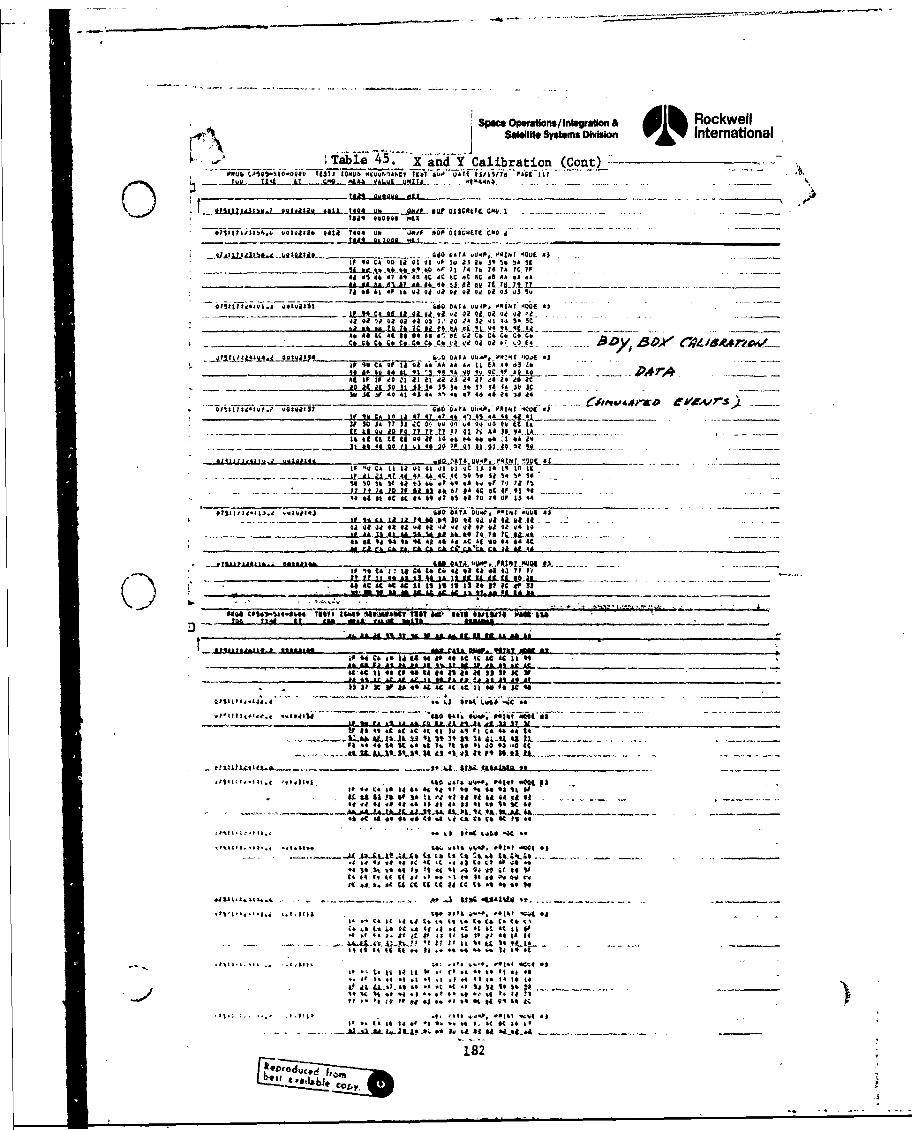
Spece Oparains/Inisgation & RockwellSatellite Systemfs Divison V YInternational
k. 2 ~~~~Tabie' 475*. _X "aad Y Calibration (Coat) -_ _______-
CAU -00 4isr -4 444 1 __ _ _ _ _ _...
.. l1.ajjdC~L4&L -40. .43 _S-
-0--1asl, 'I 1-444 CA -4D 1 iWbltr CUD .4I 0 4 9 4 01
.. ~ .3 4* A .. 4 ~ 4 A.!! D ' 7 7 7 74T .0:0 F 7C,1 Q 7444 00 444 44 1 tC AC S1 a 39 45 , 59
Ad0 4464 47 49 4 8 4C 44 0 44 AA 4 0 AS A
-1 to " 11 "11 -1 &. A44D4 440 01A4 , 4418.40 5V
_"D_04______' 0it'04. . . . . . . ..AS__
444 1 ~* 4 044 05 1.' JO /4 3?41 440 5!C
_______ Ch l lb 1 14. 4 4 144 A41A i4 _:T .......4 144 A, 4:14 to 04 *4 ý at. cal C4, C4 Co Co CA
.jjtA5A .. j.3.jj*3J6,0. DATA A01,40"V011 '40.4 43if 94 CA OVCf 0 4 1 A* AA A. IT C44 A A*443 i
.1 4*1401 "41*1 i 9 2 4 V do12$ 9* AC-- ~ ~ 2 - a 4111 3L1j 35 !4 o- .3' S4 g~ n4 I
340 11, if 4* 4 43 44 4% 447 44 44 44 544
10 144 CA it 1*44 4 _____
3 4 I t 0 1 7 I t I t 0 4 a t 4o 0. 0 4 4 4 4 A D 4 . 1 6 A t .
14 1 1 $,1 44 _29 IAI4 44 6 14 *9q~j . -ft_
to -9 CA It la ot 1 ol 01 Ill C is 16 It to 14- .. . .- t 2 .... L.LL4tALSA.ALý44( "4 54 S4 5 14 540 4
so 50 'it It 44 t-3 466 o7 44 of44 to of 7. 00 1-. ~ ... LJ.2*JL.Z.AL 44 $A* 4C 6C 101.41 '4 . .
CC 44 01 AC 41 $A a9 I? S as 10 4 04 a,03 44
pst is01 1,441S.* .1041443 600 D4TA CU*P. M4141 4 *A 4
04 44LA 11 A&4 -14 .64 10 41 4.1 4? 01- A t 44it4 A Q! 4,1 44 ta 5 VA #a *044 lilt .1 4 ff, ..ait 44. 1 -4.
140$4. It 04 4 4 C . It44 to444 ?? Ac
4441444841 14011150103114$30
I 4 f ot 1 o4 46 i.* *A ga #44 *a 71 it_________________
A4461 1 Z 4 It 4 As A' It* ACI4 3? 4CMA-1-2
40. 034 C &C AC as 4 4s Is Is4 Is 4to It C 4043
A, A.... Lb-LAL .a it- 2 MAd444 asi 6a. .LJ A..4..-
04 4 CA *t W 14 44 do 44 $C 44 AC LC 4I4t0
1~4aa1 '".1 1 it U441 "ait 11....a44444it to 4444of U 41 04.1 1 1C
-..... ASt IL .3.)AA A l.j~1V1 4044f W43I ... 4..-
444 44 140 'A 6 44 1% It $0 11 (O 41 410 O
IM4&~.4. YA it3 4X vI I 4.44 WA(.4
x44441. &4 . 444444*49 ;4f* WOO4, PAW~ 0M4 44
a.*...J .3..LOA4 OR1 It ". "... 1~.4 . - - -I_____.._-__.
44 #4.t 04 40 #4 It 44 to $2AtA 41 44 V ICo
(4 &C to 44 A4d, A# 6A4% C& Co coo4* j
_U *0 44 A. A"* (4 to0 4 41 4 44
44144C 4 st41 .* I 4 t4 I4 *A 4
to ,444.t .,, w .44 ifi "s oI of *44. "C44
X44 *.4 At * (iD C4 4. 44 Vt C1 441 41 1.4 44
I- 14 It It .4F *4 to .4 .1 4,M .4 * 44 44
at ". U .4 4' .4.( -,4 .,6, .44 44.it so
44 4* 4 t 4 14 40 is It to t* it 44 Is #4
it Ia 41iL444 44 .0 444-4.4 ~ - - . .
__t_ 14444 Is .. It to. ~ ..
SpW&e Open r.ItrdsWmIon A O)WIS~~~~a.,- SIao~o ~ ntematdonal
Tabl 45 .Xand CalibrationReadout (Cont) '
3* t do34'I ý4 44 40 4 .4 .040 044 As 04 as0a
_____v do 00 WO 39 4 04 $ 0 U. to C4 sO o to at Co.
It41 40 Ile 44 40 04 .0 44 g4 to4 * 40
4.*0Ot0 00 at 00 S 4 t0*0 4.. of 00 00 Oil 5.oC
if C4 A 2L 0,; .03 94 to so go tv 0'..14 Is* 40 40 409 .- o40k o 1 4 to to 4t 10044
0*0 . o40 044 o 0 4 V 1 "0 do go* 4.4 00 s4
.4iiLOiAA XAOA - 404 4V0 go.004 0 9 .4C.~3it 404. 40 0 S 00DO Is go0*10 to SoIV2 IF 0 76
39 44 I 4 Ia -t 14. .-0*4 0 4 1. q4 a4 4
44 So A4 40.4 44 -J. US 2 4 0 qo4 ý 4 *4 00~~~42Ug ............ i* Q 0*A.3 44m 0 .40 94 do 00*4440I*30 04 *4*00000 4* 444 of 30 !L. IF 6
_____ Q A t3 Qt..o q0 * I's 0* 4 44 a* S 40_*
4* * 04900 )o419 40 *4 4. 44. "a900 44 ov 09
440*4 40 4 4)v 300 do 00 044 . *040 04 so 0o40
___1_C_ Il *00 'Oa 0 -. ", p 0 !r 0 0 aj* -o g#_ __ __of
34 g IC . ,S 7 o * q4 .* 40 094 go .44____________-o ________.A.3iq100.9..0.A -N3 4000-.09 4
4v01 34 go 093 90 '3* 4, .0 *4 I4N0 40 04 4)004
*4 *4 4 40 * 44 V. 4* go 4 0 04 I 4* ,43*
_______________ ~ I 2904 CA Z5 12 09 go. 40 Q4 OP IN 40 ' 40. do 90-_______34 ~ ~ ~ ~ ~~IA 4* 440 43 4 *4 )4 0 *4 44t4
00444*43 .0 30"114000V"I V 90 01 01~~__ _ _ "1
a __1_v__ds1_T__-a 0 t ..- gIL4L*.4.0 3*04 44 3.0 44T *9.P QIftT00tIa
PW*ZPi- -04 !.T W-0 Q - 10 £.3 40*9 T4* P WE0 1 437 P&"C 129___ET *4a .1 A9 431 0* * 40 k 9* 0
0494 40 *8 4 04 *og 0 904 0* 43 4 44 0491........................ 4t3 0.11.0.0golao*.00 49 go 40 *0 0*, 'a 40,0
*030 go 94* 4* *9 00 3* 44 43.1 !1. 40, 3Cl 44 r
435I23 1 64* 33. *0*33243 40 Co1A U4.0*9 04070 '-0*6 as -
000 o 0g 9000Oyo 3*4Q 04 0&3..L .0 94 0
0 3.00 ~ -
('43* ~ ~ ~ ~ ~ ~ ~ ~ ~ O UP0311.30 vu33 1043 0(*334C dOT07 32 3 o 9*44 dq *
0 do0 go 0V~.0 0 4 o 4 do 0 *4 *- 0 0. 40 44
_________0___________go_______ 4 *00*0go 3 t9.00
1" 4 C "1A7a[, a', 0.30 It438 a3 a*3 444 4*141 .0E 83
44 43 0* *3 44 *4 00 44 04 00 04 YO 104 40 00
....4L.I.20.*.2. ..0 M 4* 0 Ov *4 *3. 4* *4 40 9*3*04 0* *4 90* 00 4*.1 go .3 0 2 409 0o 84 do 4A
1* 0* CA 00 14 go 00 30U *0 no .400 4 *00go. Q9,92 .k.4. 0 4* *0 .* 409 4.4 go 04.
OU 4* go 44 *4 40 4g 0 4 *4 v * 4 1 *0 0 40 g 0 *0.40 4 0* 0* do 4* g* 0404 00 **0 0 **
*392232432*4.3B 4*2333 VVKPT*3*2, PO1W 4001 #1
IF 90 CA4 A ig 0 0 ** 00 0* 03 4* 44 Q9 *400 04
6,.9 3 0. . 3 L . 44. 'a 0 0 .0*k'-O *. go 4* *9 *9 40.IV 14PQ
*0 4* *4 49 00 44 00 34 3.. 0, 44 0 4* 0*
09 go L2&5.go...4.3Thcc.30 . 0*3 g4o2* 4 go9 v04 000 v
I. o3 CA .* 14 03 40 0*go * 00 00 0 00 44) go 4
4044at *of j3.* ...* 90** 4490 O3.10..$0 ..-.... .
IF20434. 3*2C*ac2934 0*3g 00* 90*00,g 4400 40 00
00 *4 0* 43 O g* *0 40 03 104 U* 4* 0 0, 140 00
39 Q 09 CO 01 100 40 *4 00 g0 00 *400 40 84 &
40 00 *4 *9 00 *0 04 44 00 00 04 0 *0 09 go4#
04 90 *0 Go 04 0 410 g4 0*4 *o *0 00 go to go
(~~6 04/ 44 A&21433. U32*42I
:.183-
'p.*. 4 C"
b*4%3 4e ,,ýy
Spoce Operallns/inlegroatin & 1h RockwellSaellite Systems Division V Y International
_ Table 45. X and Y Calib-ratfo-n (Cont) ____
.it 0h3 GAI 0J/go il1.,o .11 1. INjj00 .109. v -u 0 0- -0 -U
________________ 1 4* C 1( O 0000 -9,4-Q. 00 0-19..'it9.403 00 U. * 00 0 O0 0 00 9 0* 0*g 00 0.) *9 0 ou
_______ 00. 00 00 G 00 0.4.Q qq0.GO 49 ___.so OV 09i 00 00 00 09 00 00 (40 00 go, 01) *0 *0
-QV~ ..- A 0_0jO.Qg4o vo 9 ouo 0o 0: 00 0000 op 00 .. .-
04 00 0. 00 4*-Q 09 0* O0 Of 00 00 00 15 08 70
-. -- 19 90 CO SO 00 OL0A4vu 9,v U 04 0 00-04200 00 ___________
Q4 09 00 *0. 06 00 00) 00 *0 00 C4 00 00 00 00
go00 000000 40 goW 9ý)04 0 00 '3000 GO 900
~~ 0* ~~~00 00 0G 00 00 0Q 00 _______go 00 oil o* 00 do 00 ou 00 00 go 04 00 vO *
00 0g go 00 00 go0 O~Ot~GuJiz..9 00 no ___ilit__
Q.,104:11L -OAT,3 3.035 -foCk~io 0
09 400d 00 s0 Ag 00 04 00 *00 00go0000*080I0040 00...0a.44 .00 '40 00 Ad go -049-000 ou __
0* 00 0*, 20. 00 .0 0 00 Do 0 00 GO 00 00 on00d
99 0. A.J)J.. 03G (0 3 003Ad 46 qu0 0.1 . - -
1-6 u3 0/ *, 0ý0*3 *Uk a ..
- 1.O'* A. -".f L3 P.0*,
-- .- . . A i~j~l... ,./p T, I J
*0l~~ilto~~1~~k.I....1 ,.1V.b .... .. .. 0 AIA 3000001Oý UFF
0L5J~iIi.~Ih.... 0* L3 3.0*0 394 .(1112) IZ511Zoi. - Eoi0...... .. CALSO
O7~~A,,l.3404~~ ~ moA) .L.9934A.0 0
3L.Ci34-------- - - -
1f84
~~~~~ - -~v4 ~
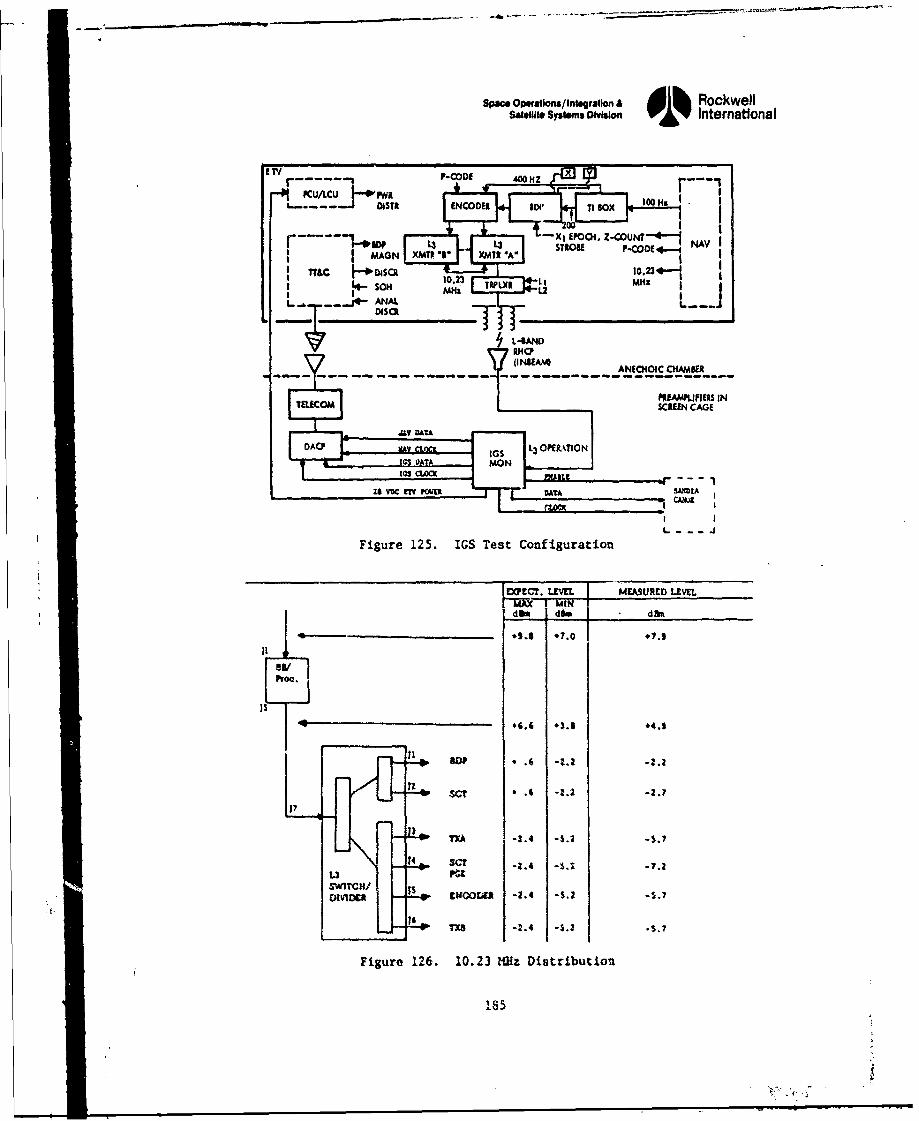
Space Opemlions/ IntegratIon & Rockwellsatellite SYSteflu Diision 0 % Internatlonal
r - - - i-w L L3 -XI EPOcN, Z-COuNT-- 4-- 1 NAVIL3 L3 ~sitos P-WODE 4..
MAGN XMIN*8 XMTIA A
I Ixcr uvr MAmiE EEL..&-T-__j* ANA Twi
CHSCRd~
(IIA A IH ICCA N
PRAML3/RSIProC. MSANCG
TEAL -3. or.I
nI~wE* -I.I.I
Figure 126. 10.2 Test Conigurabtion~
185.
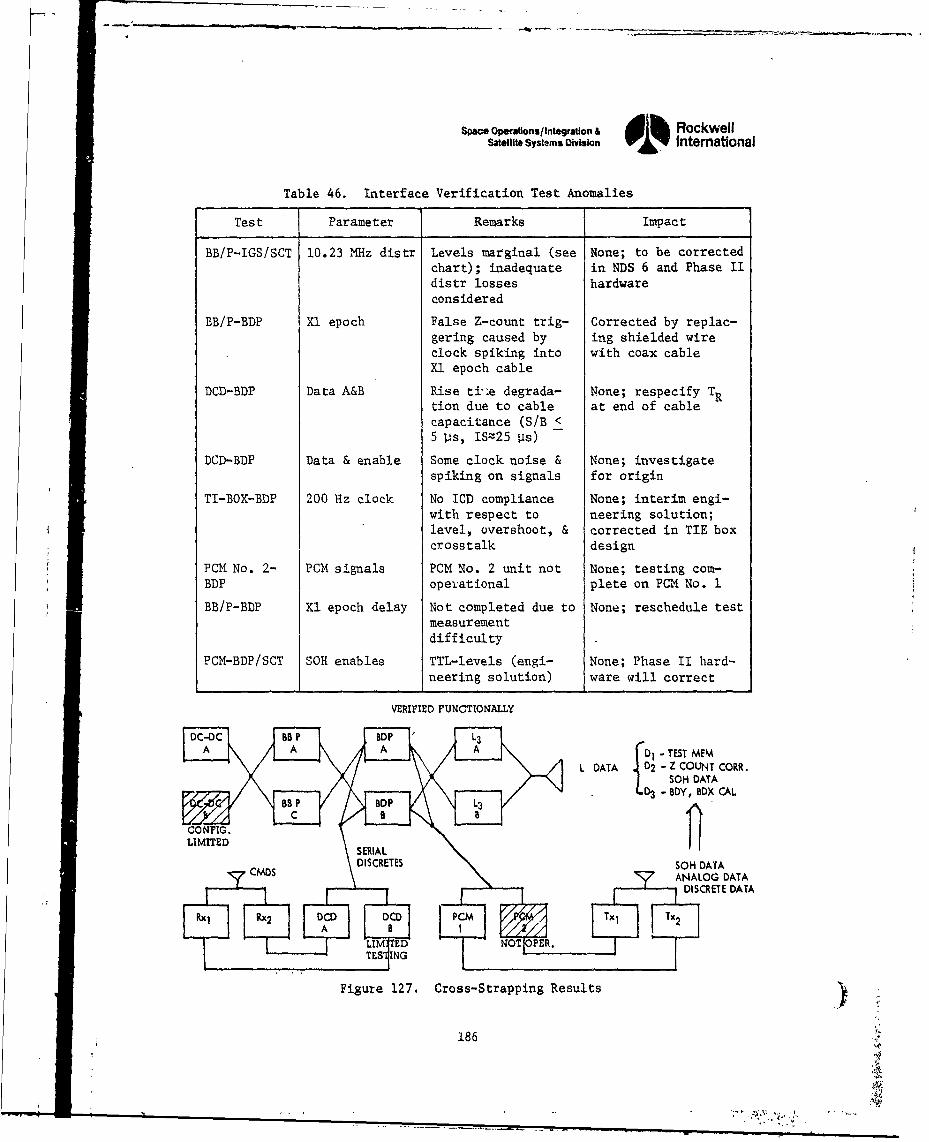
Space Operations/lntegration & dlh RockwellSatel.te Systems Division IF•7 International
Table 46. Interface Verification Test Anomalies
Test Parameter Remarks Impact
BB/P-IGS/SCT 10.23 MHz distr Levels marginal (see None; to be correctedchart); inadequate in NDS 6 and Phase IIdistr losses hardwareconsidered
BB/P-BDP Xl epoch False Z-count trig- Corrected by replac-gering caused by ing shielded wireclock spiking into with coax cableXl epoch cable
DCD-BDP Data A&B Rise ti :e degrada- None; respecify TRtion due to cable at end of cablecapacitance (S/B <5 'Ps, IS425 vs)
DCD-BDP Data & enable Some clock noise & None; investigatespiking on signals for origin
TI-BOX-BDP 200 Hz clock No ICD compliance None; interim engi-with respect to neering solution;level, overshoot, & corrected in TIE boxcrosstalk design
PCM No. 2- PCM signals PCM No. 2 unit not None; testing com-BDP operational plete on PCM No. I
BB/P-BDP Xl epoch delay Not completed due to None; reschedule testmeasurementdifficulty
PCM-BDP/SCT SOH enables TTL-levels (engi- None; Phase II hard-neering solution) ware will correct
VERIFIED FUNCTIONALLY
A , A - TEST MEITL DATA 402 - Z COUNT CORR.
SOH DATALD3 -BDY, BDX CAL
LIMITED FFigure2. s SOH DATA
CANALOG DATADISCRETE DATA
R DCD DCD PCM Tx, Tx2
LIM ED NOTO0PER.
TES t'G
Figure 127. Cross-Strapping Results
186
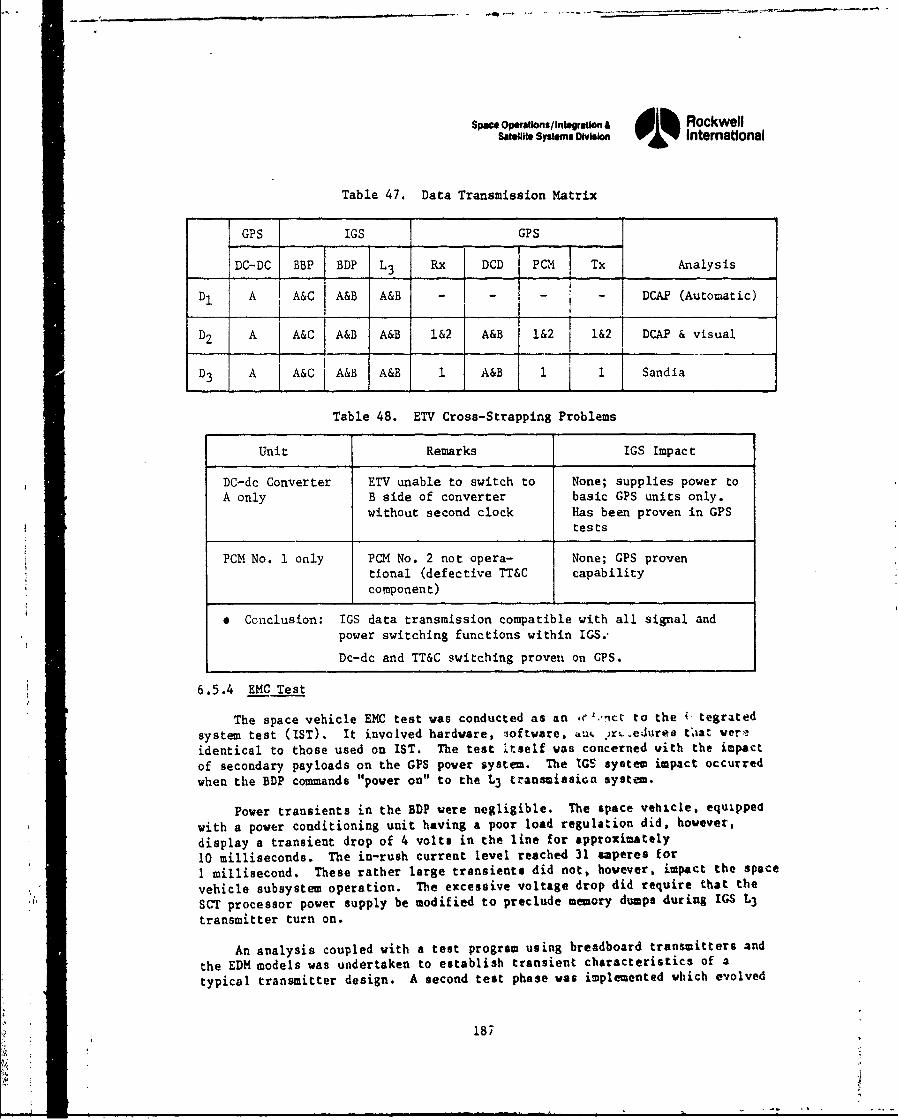
spae Opeations/I.ntegra.n A ilh RockwellSatlite Sy*nms OWlon 01% Intematonal
Table 47. Data Transmission Matrix
GPS IGS GPS
DC-DC BBP BDP L3 Rx DCD PCIM Tx Analysis
Dl A A&C A&B A&B - - - DCAP (Automatic)
D2 A A&C A&B A&B 1&2 A&B l&2 l&2 DCAP & visual
D3 A A&C A&B A&B 1 A&B 1 1 Sandia
Table 48. ETV Cross-Strapping Problems
Unit Remarks IGS Impact
DC-dc Converter ETV unable to switch to None; supplies power toA only B side of converter basic GPS units only.
without second clock Has been proven in CPStests
PCM No. 1 only PCM No. 2 not opera- None; GPS proventional (defective TT&C capabilitycomponent)
* Conclusion: IGS data transmission compatible with all signal andpower switching functions within IGS.,
Dc-dc and TT&C switching proven on CPS.
6.5.4 EMC Test
The space vehicle EMC test was conducted as an ,el,'ncc to the ; tegratedsystem test (IST). It involved hardware, software, au. jr.edures that wer•identical to those used on IST. The test itself was concerned with the impactof secondary payloads on the GPS power system. The IGS system impact occurredwhen the BDP commands "power on" to the L3 transmission system.
Power transients in the BDP were negligible. The space vehicle, equippedwith a power conditioning unit having a poor load regulation did, however,display a transient drop of 4 volts in the line for approximately10 milliseconds. The in-rush current level reached 31 amperes for1 millisecond. These rather large transients did not, however, impact the space
vehicle subsystem operation. The excessive voltage drop did require that the
SCT processor power supply be modified to preclude memory dumps during IGS L3transmitter turn on.
An analysis coupled with a test program using breadboard transmitters andthe EDM models was undertaken to establish transient characteristics of a
typical transmitter design. A second test phase was implemented which evolved
187
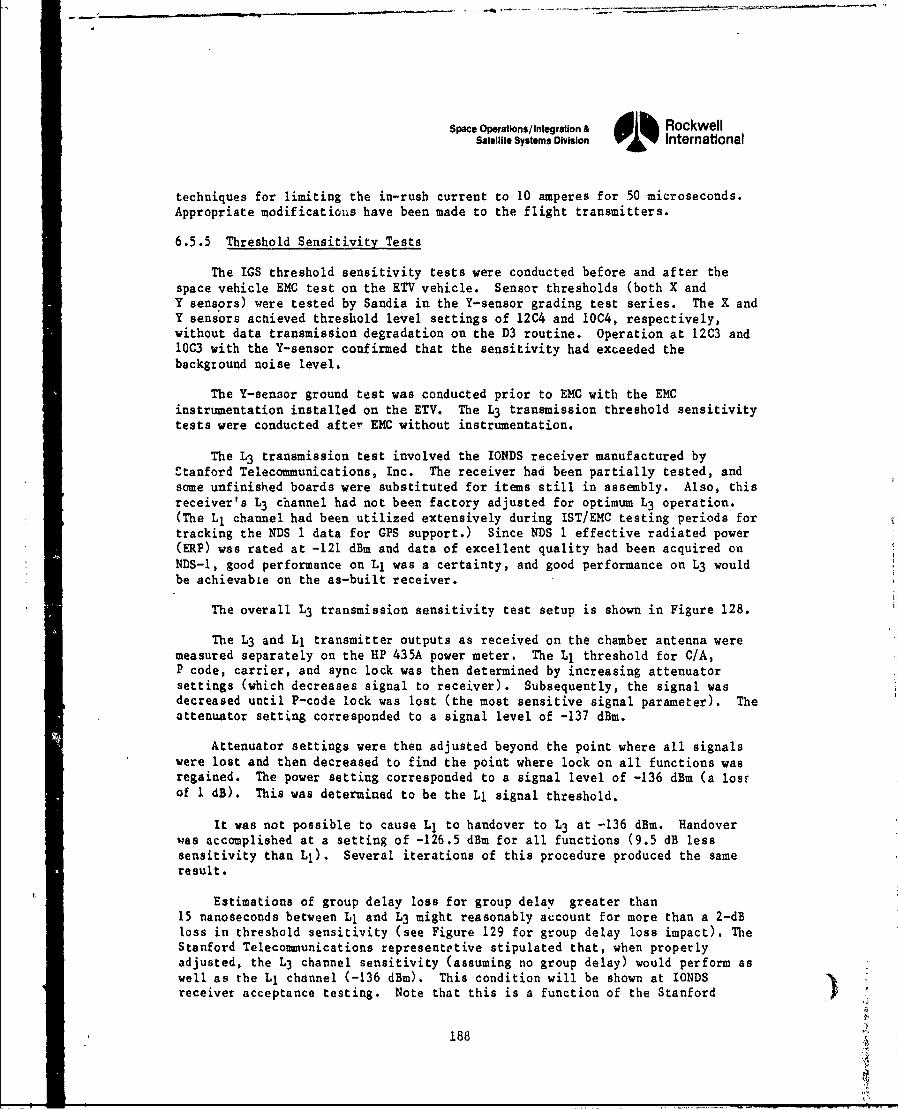
Space Operations/Integration & dl h RockwellSatellite Systems Division 01% International
techniques for limiting the in-rush current to 10 amperes for 50 microseconds.
Appropriate modificatious have been made to the flight transmitters.
6.5.5 Threshold Sensitivity Tests
The IGS threshold sensitivity tests were conducted before and after thespace vehicle EMC test on the ETV vehicle. Sensor thresholds (both X andY sensors) were tested by Sandia in the Y-sensor grading test series. The X andY sensors achieved threshold level settings of 12C4 and 1OC4, respectively,without data transmission degradation on the D3 routine. Operation at 12C3 and10C3 with the Y-sensor confirmed that the sensitivity had exceeded thebackground noise level.
The Y-sensor ground test was conducted prior to EMC with the EMCinstrumentation installed on the ETV. The L3 transmission threshold sensitivitytests were conducted after EMC without instrumentation.
The L3 transmission test involved the IONDS receiver manufactured byCtanford Telecommunications, Inc. The receiver had been partially tested, andsome unfinished boards were substituted for items still in assembly. Also, thisreceiver's L3 channel had not been factory adjusted for optimum L3 operation.(The LI channel had been utilized extensively during IST/EMC testing periods fortracking the NDS 1 data for GPS support.) Since NDS 1 effective radiated power(ERP) was rated at -121 dBm and data of excellent quality had been acquired onNDS-I, good performance on Li was a certainty, and good performance on L3 wouldbe achievabie on the as-built receiver.
The overall L3 transmission sensitivity test setup is shown in Figure 128.
The L3 and LI transmitter outputs as received on the chamber antenna weremeasured separately on the HP 435A power meter. The L1 threshold for C/A,P code, carrier, and sync lock was then determined by increasing attenuatorsettings (which decreases signal to receiver). Subsequently, the signal wasdecreased until P-code lock was lost (the most sensitive signal parameter). Theattenuator setting corresponded to a signal level of -137 dBm.
Attenuator settings were then adjusted beyond the point where all signalswere lost and then decreased to find the point where lock on all functions wasregained. The power setting corresponded to a signal level of -136 dBm (a losrof 1 dW). This was determined to be the Li signal threshold.
It was not possible to cause Ll to handover to L3 at -136 dBm. Handoverwas accomplished at a setting of -126.5 dBm for all functions (9.5 dB lesssensitivity than Ll). Several iterations of this procedure produced the sameresult.
Estimations of group delay loss for group delay greater than15 nanoseconds between Li and L3 might reasonably account for more than a 2-dBloss in threshold sensitivity (see Figure 129 for group delay loss impact). TheStanford Telecommunications representetive stipulated that, when properlyadjusted, the L3 channel sensitivity (assuming no group delay) would perform aswell as the L1 channel (-136 dBm). This condition will be shown at IONDSreceiver acceptance testing. Note that this is a function of the Stanford
188
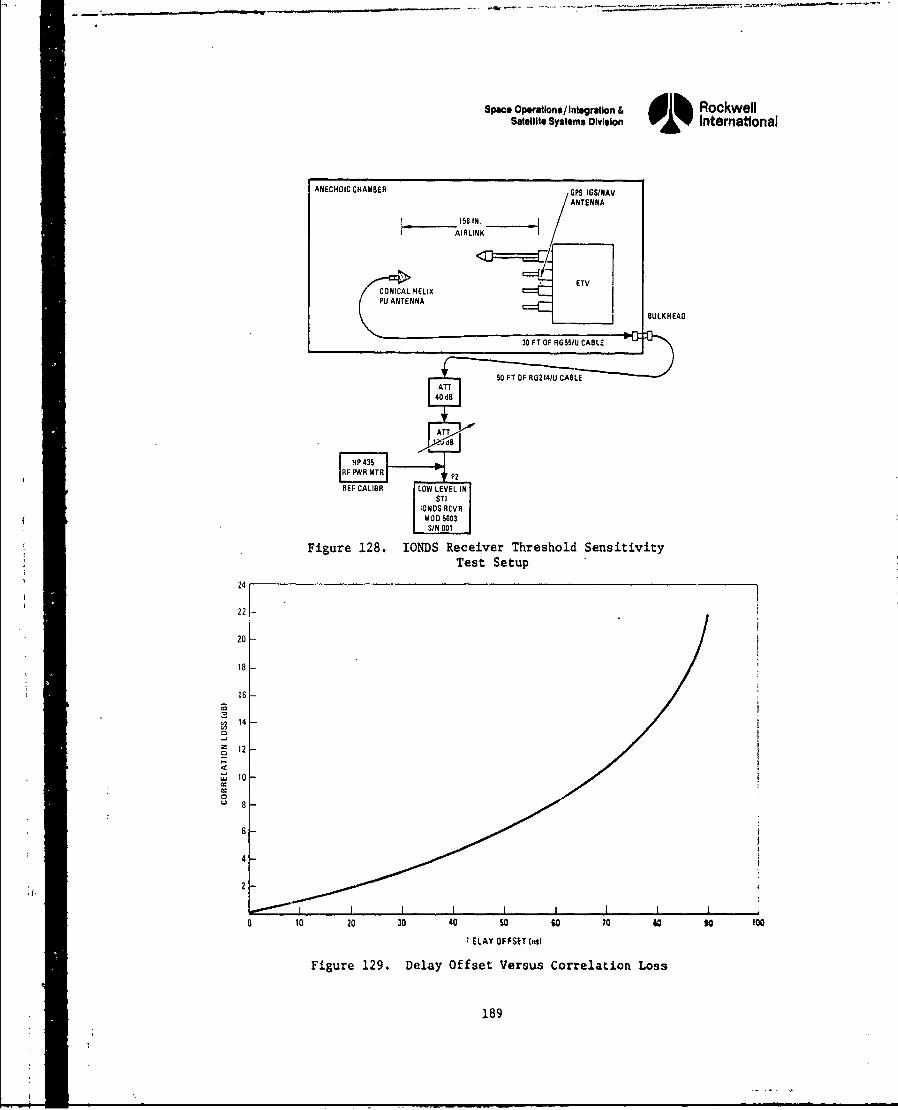
Space Operatlons/ Integration & RockwellSatellite Systems Division International
ANECHOIC CHAMBER OPS OS/NAy
ANTENNA
! 158 IN.j , AIRLINK -
NA • • •,,•BULKHEAD
A,
RF~WRMTR P2REF CALI8R LO EVLI
ICA ONOS HELRIMI 5oo003I
[SIN 001
Figure 128. IONDS Receiver Threshold SensitivityTest Setup
20
18
16
S14
z 10
,-TT
40d
L) 8
2
to1 20 30 40 50 80 10 11o 100
6ELAY 0FFS[T lt)tR
Figure 129. Delay Offset Versus Correlation Loss
189
HP 435
Spc Ope./on/tIn~r.to.n & Rockwells.aWii sYslema on.ai• International
*relecommunications design because it uses a single delay lock loop to positionthe reference code for LI-C/A, L1 -P, and L3 -P signals. Other sets, such as theMagnavox X-set, are not sensitive to this delay.
The group delay (L1 to L3) was not measured due to test hardwarelimitations which could not be overcome during the IST schedule. The groupdelay could account for the entire 9.5-dB loss if the actual delay were of theorder of 65 nanoseconds (refer to correlation loss versus group deldy plotted inFigure 129).
The group delay measurement is scheduled for July 1978 to confirm thesensitivity loss and to establish receiver sensitivity capability in the eventthat the Li receiver performance meets the -133 dBm power level specificationduring the acceptance test.
The procedure used on threshold sensitivity included sending test routineDl and adjusting the attenuator until the transmission became errorless on allthree routines. This occurred at the same setting, -126.5 dBm, establishingthat performance was limited by RF signul amplitude, not bit data content.
The procedure was then altered to add D2 and D3 test routines to establishthat all data transmission could be successfully achieved at threshold on boththe A/A (transmission and processor systems in A channel) and B/B (transmissionand processor set to B channels) configurations.
6.5.6 Y-Sensor Grounding and Threshold Tests
The X- and Y-sensor thresholds were set to 12C8 and 10C8, respectively.(Sandia asserted that these will be the sensor threshold level settings inoperation.) Oscilloscope probes were attached to monitor frame-to-circuitcoamon noise at the BDY detector and to monitor sensor signal and noise at theYMOA S6 analog amplifier. The S6 amplifier output had an amplificaciou of 69 dBabove the actual silicon diode optical sensor output. Traces on these twooscilloscopes were monitored during various ETV configurations and tests. Theseconfigurations included STC on and off, L, L2. and L3 on and off, and D3 GBDoperational modes and sensor excitation.
During Mrv full-up configuration, the CPS optical trigger sensitivitieswere lowered to determine the noise and background levels which would passtrigger thresholds. Those signals pasu'ng the trigger test conditions generatedL3 event data outputs.
A comparison oa previous Sandia bench tests and ETV tests was made todetermine if any major degrading occurred on the ETV. No serious degrading,becausa of systea noise, was noticed. These tests were made with the low lightbackground of the anechoic chamber. Future testing say require an artificiallight source to siculate the earth ulbedo.
During soe of the ETV configuration changes, the GBD was configured in 3sensitive trigger code (IGS serial comands IOC4 and 12C4). Although these GBDtrigger levels were near the level at which noise and background triggers wouldoccur, no false triggers were experienced,
190
Space Operations/Integration & RockwellSatellite Systems Division 1% International
The link margiu analysis stipulates that L3 operation be accomplished at asignal level of -133 dBm. While the results of the above test were extremelyencouraging from a total system viewpoint, the test will be repeated (onhardline coaxial cables) when the TONDS receiver is completed. A summary of thepreliminary threshold test results is listed in Table 49.
6.5.7 Vehicle Acoustic Test
The GPS forward bulkhead design allowed for installation of additionaldevices for both primary and secondary missions. The spider, which is thevehicle forward load bearing surface, was considered to be stressed by thesesecondary payloads. At best, the payloads were considered as additional weightwhose mass reduced the vibration levels on the panel and, at worst, a load whichcould impact design integrity. Further, it was necessary to determine thevibration environment for all secondary payload components at the space vehiclelocations planned for orbital operation.
The vehicle acoustic test was performed at the B-1 Division of RockwellInternational in the same manner as the three previous GPS tests performed onthe GPS development test vehicle. Instrumentation, facilities, and testprocedures duplicated these of the third test of the DTV series.
The acoustic test consisted of five separate acoustic runs devised toevaluate alternative secondary payload configurations that may exist on the GPSspacecraft. The variation in the resultant spectrums was small for theconfigurations of the IGS hardware tested. In all cases, the componentsexperienced relatively benign environments, with the exception of a few lowenergy peaks at structural resonance frequencies.
During the equalization run before the first test ron at qualification testlevels, a failure of one of the Y-sensor sunshade baffles occurred. The bafflering had partially separated at its bond inside the sunshade. It wassubsequently bolted to the sunshade, and the tests were carried out. In thelast run, the bolts were removed to determit~e whether they caused any deviationto the test results; no noticeable differenca in the sunshade spectrum wasdetected and total separation did not occur. Subsequent failure analysisrevealed that the baffle was slightly oversized, preventing the baffle frombeing fully seated prior to bonding per design. None of the other baffles hadthis problem, and no problem is anticipated with the flight sunshade. Completetest data and procedures are published in Rockwell report SD 77-GP-O010-1, 2, 3,and 4.
6.5.7.1 Configuration. The test configuration consisted of the GPSdevelopm,:t test vehicle with mass simulators of the GPS and secondary payloadhardware installed. Figure 130 shows the secondary payload hardware mounted onthe forward bulkhead (i.e., the IGS sunshade, the X-sensor, and the AFSATsingle-channel transponder antennas).
Five tuns made up the total acoustic program. Table 50 describes the testconfiguration of each run. During the first two runs (Runs A and B), the IGSand SCT payload hardware were installed on the DTv. Two runs were necessary tomake all of the accelerometer measurements required. The Y-sensor sunshadeconfiguration differed in Runs A and B. During Run B, the sunshade was attached
191
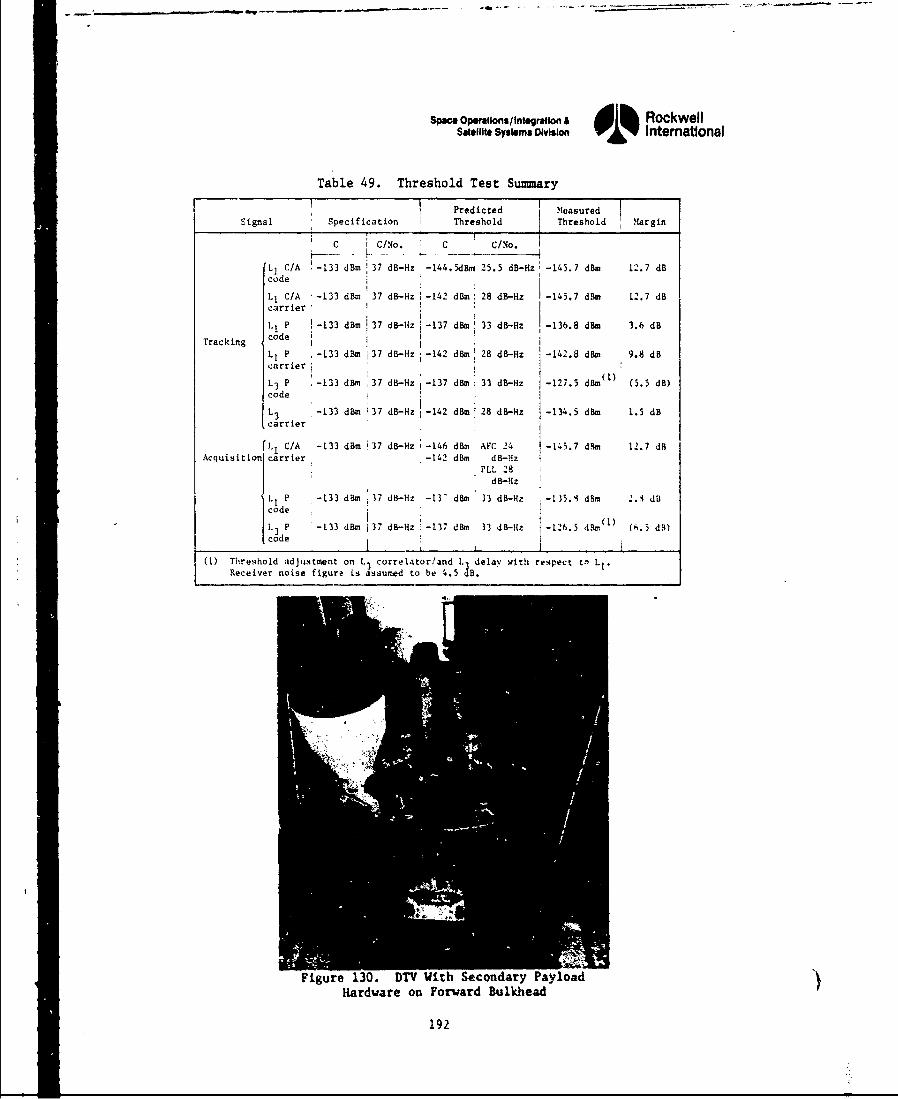
Space Operations/Integration & RockwellSatellite Systems Division International
Table 49. Threshold Test Summary
Predicted measuredSignal Specification Threshold Threshold Margin
C F C/No. C C/No.
L1 C/A !-133 dBn i37 dB-Hz -144.5dBe 25.5 dB-Hz -145.7 dBm 12.7 dBcode
L1 C/A -133 dBM 37 dB-Hz -142 dBm 28 dB-Hz -145.7 dBm 12.7 dBcarrier
SP 1 -133 dBm !37 dB-Hz -137 dBm 33 dB-Hz -136.8 dBm 3.6 dB
Tracking code ;L, P -133 dBm i37 dB-Hz -142 dBm 28 dB-Itz -142.8 dBm 9.8 dBcarrier
(1)L3 P -133 dBm 37 dB-Hz -137 dBm 33 dB-Hz -127.5 dBm (5.5 dB)code j i
L3 -133 dBm 37 dB-Hz -142 dBm 28 dB-Hz -134.5 dBm 1.5 dBcarrier
LI C/A -133 dBm i37 dB-Hz -146 dBm AFC 24 -145.7 d9n 12.7 dRAcquisition carrier -142 dBm dB-Hz
PLL 28dB-Hz
L P -133 d8m 37 dB-Hz -13- dBm 33 dB-Hz -135.4 dBm .2..i dBcode
I.3 P -133 dBm j 37 d8-Hz -137 dam 33 rB-Ie -126.5 dBm() 1 (6.5 d3)code I
(1) Threshold adjustment on L3 correlator/and I. delay with respect c-, Lt.Receiver noise figure Ls assumed to be 4.5 3B.
Figure 130. DTV With Secondary PayloadHardware on Forward Bulkhead
192
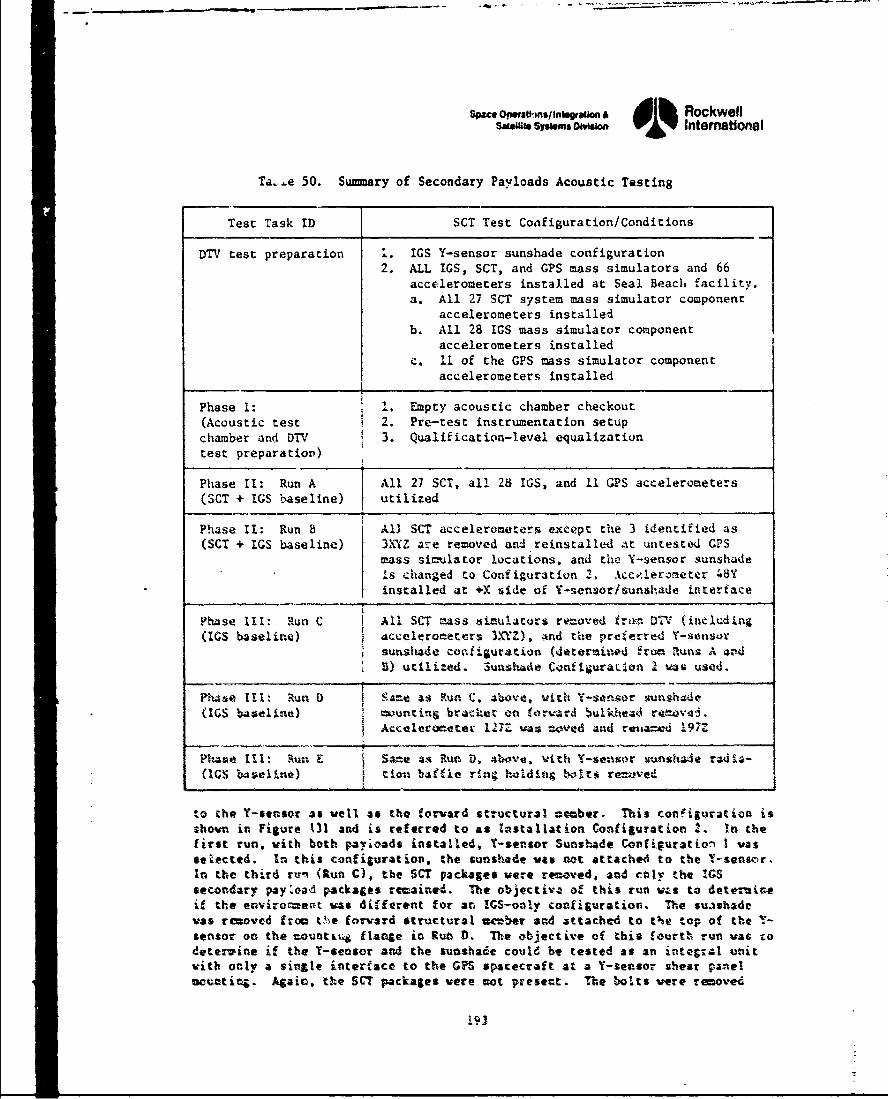
SW*e Oenti"nmflnbration & RockwellseW1a ssms DVson 0% International
Ta..e 50. Suary of Secondary Payloads Acoustic Testing
Test Task ID SCT Test Configuration/Conditions
DTV test preparation .. IGS Y-sensor sunshade configuration2. ALL IGS, SCT, and GPS mass simulators and 66
accelerometers installed at Seal Beach facility.a. All 27 SCT system mass simulator component
accelerometers installedb. All 28 IGS mass simulator component
accelerometers installedc. 11 of the GPS mass simulator component
accelerometers installed
Phase 1: I. Empty acoustic chamber checkout(Acoustic test 2. Pre-test instrumentation setupchamber and DIV 3. Qualification-level equalizationtest preparation)
Phase II: Run A All 27 SCT, all 28 IGS, and 11 GPS accelerometers(SCT + IGS baseline) utilized
Phase 11: Run B All SCT accelerometers except the 3 identified as(SCT + 1GS baseline) 3XYZ are removed and reinstalled at untested GPS
mass si=ulator locations, and the Y-sensor sunshadeis changed to Configuration 2. Acc.lerometer '48installed at +X side of Y-sensor/sunshade interface
Phase III: Run C I All SCT mass simulators rezoved irt-.. DIOV (including(IG baseline) accolerometers 3XVlZ). and the preferred Y-sensotn
-sunshade configuration (determinod fro Runs A andB) utilite-d. Sunshade Confi;uracion 1 va'a used.
Phase IlI: aun U 1 Same as Run C, above, with Y-sensor sunshade(1GS baseline) wunting bracket en forw.rd bulkhead re.oved.
Accelero=eter 1-7Z was zoved and rena=-d 197Z
IPhe II: Run E Sa=e as Run 0, 4bove. vith Y-senasor tunshaJe ral4-(10 baseline) tio~n baffle ring. 'holding bholts removed
to the Y-sensor as well as the forward structural, ah•er. This configuration isshown in Figure 131 and is referred to as Installation Configuration 2. In thefirst run. with both payioads installed, Y-sensor Sunshade Configuration I wasselected. In this configuration, the sunshade was not attached to the Y-sensOr.In the third run (Run C), the s$t packages were removed, and roly the IG$secondary payload packages rewaine4. The objectivo of this run was to detetin.if the enviror-uent was different for an IG$-only configuration. The sutshadewas removed from the forward structural ccmber and attached to te top of the Y-sensor on the --ouatct& flange in Rut D. The objective of this fourtt run was codetem-ine if the Y-sensor and the sunshade could be tested as an integral unitwith only a single interface to the GPS spacecraft at a Y-sensor shear panel
acunting. Again, the SCT packages were not present. The bolts were removed
£93
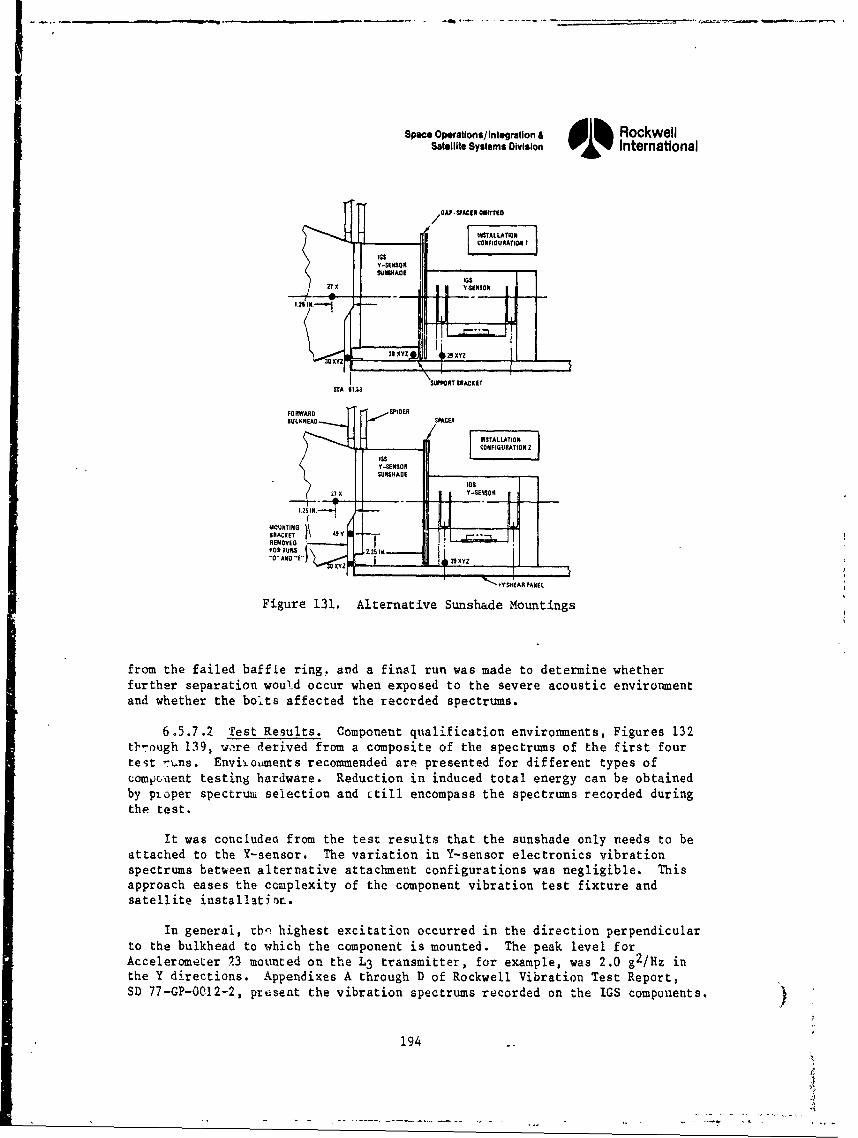
ISpace Oporations/lntegratlon & Rockwell
Satellite Systems Division International
S/ O•A. SPACER O~fTTlD
S-A hWA 1
12 IN,.A-,-TOI
Figue 13. Aterntiv SunFIhUadeO Montng
BULKNUEAO SPCE
v X YSENSORI
1.25/' -,LI
BRCE 4$9Y•A IRCE
XYCONFIGIRATION 2
•k•fSHIEAR• PANEL
Figure 131. Alternative Sunshade Mountings
from the failed baffle ring, and a final run was made to determine whetherfurther separation would occur when exposed to the severe acoustic environmentand whether the bolts affected the reccrded spectrums.
6.5.7.2 'rest Results. Component qualification environments, Figures 132t"-ough 139, were derived from a composite of the spectrums of the first fourte't rvns. Enviioaments recommended are presented for different types ofcompc, aent testing hardware. Reduction in induced total energy can be obtainedby pioper spectrum seiection and ctill encompass the spectrums recorded duringthe test.
It was concludea from the test results that the sunshade only needs to beattached to the Y-sensor. The variation in Y-sensor electronics vibrationspectrums between alternative attachment configurations was negligible. Thisapproach eases the complexity of the component vibration test fixture andsatellite installatir•n.
In general, tb'ý highest excitation occurred in the direction perpendicularto the bulkhead to which the component is mounted. The peak level forAccelerometer 23 mounted on the L3 transmitter, for example, was 2.0 g2 /Hz inthe Y directions. Appendixes A through D of Rockwell Vibration Test Report,SD 77-GP-0012-2, present the vibration spectrums recorded on the IGS components, .
194
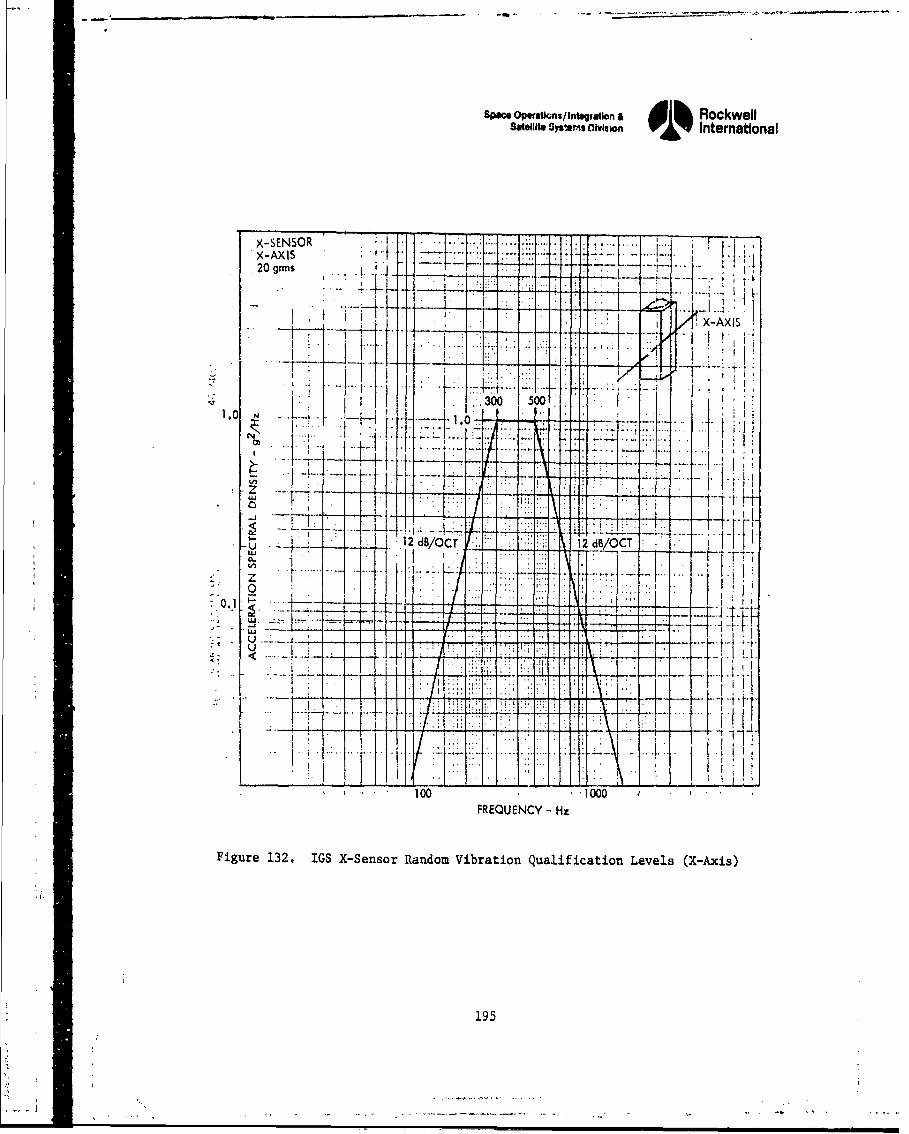
SPace Opmtknx/lntagratlon & RockwellSa0tellt Sys.,mS ivit *on International
x-SENSOR :,:.
X-AXIS •'.20ogrms H, ... .- ' :L"i
S" ... - ..-- LzL I .
-- ~~ ~- - 4
I i i -Tx A~
S.... .. .--. . . .."
-. .. T-i- z : . .. z
.. K ;' -.;..:z.
1195
... _ 1.. - - - --.--....- 2 dB/O T" LM - i ....
• :. . .. :.... l... _Al.
100 - '1000FREQUENCY - Hz
Figure 132. IGS X-Sensor Random Vibration Qualification Levels (X-Axis)
195
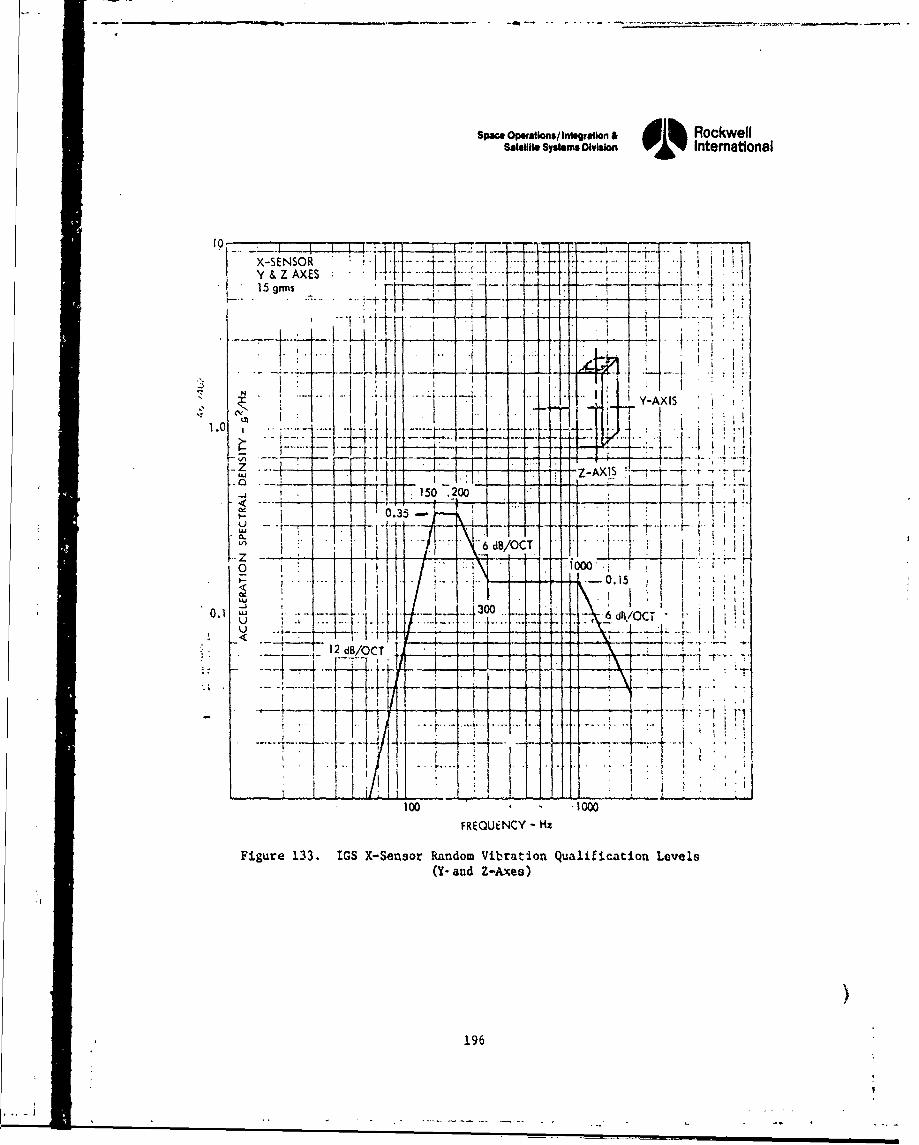
Spce op.ations/In.gratn & dik Rockwellsatfit. Sysims DIvImSo' International
X-SENSQR 4: iY & Z AXES L-L- - .
-. 4.. ..-...... .it ;"1 rlI T --
It - IIr -- I r.Ti"
< -.-...
6. dB/O CT i' '
• i.. •. -. *2. ". t ..... 0.15
0.1 LU .. .. '.T.C...
•' - ~~~12.dB/OCT ' "
r T
100 low1000
FREQUENCY - Hz
Figure 133. IGS X-Sensor Ra-ndom Vibration Qualification Levels(Y- and Z-Axes)
), 196
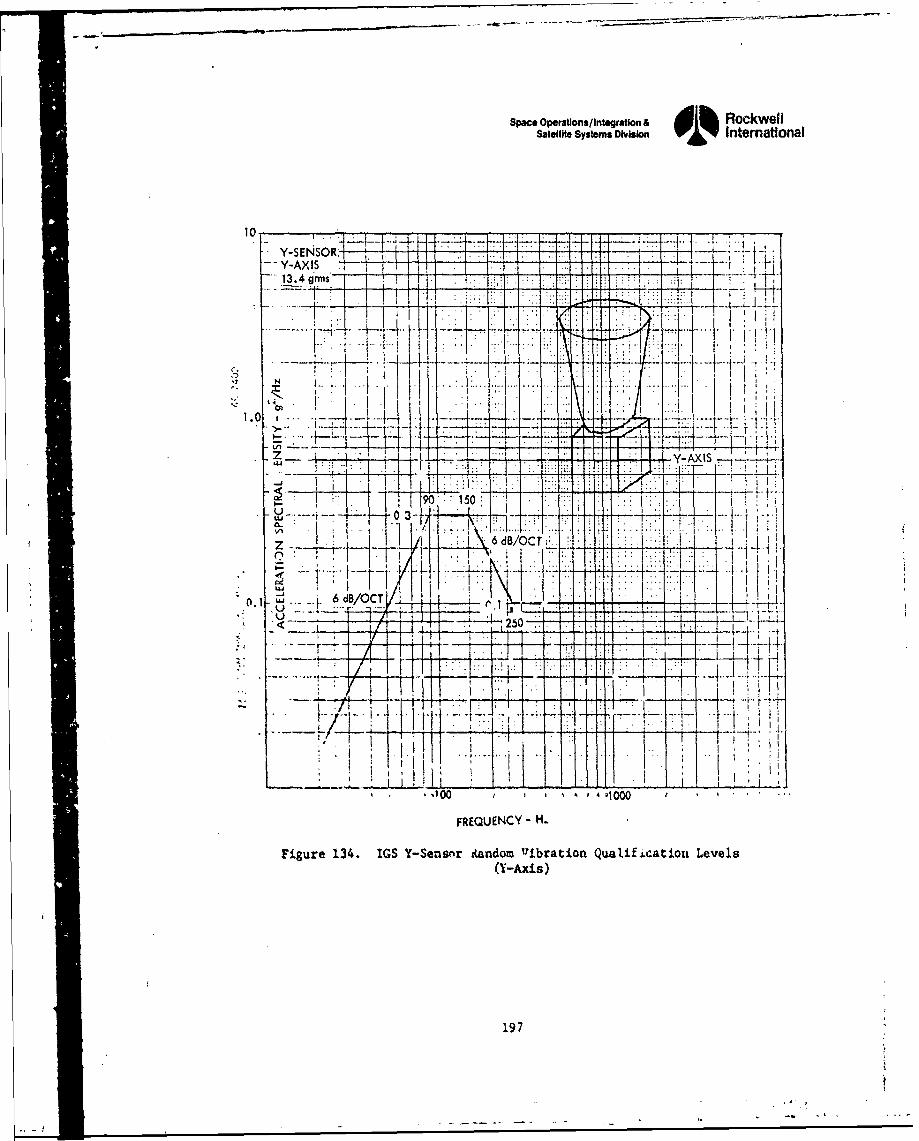
Space Operations/Integration & j RockwellSatellite Systems Division International
Y-SENSOR -.. -j
13.4grms-- - .- - "
..0
1. - .... +T- I
1 * .( -- ---' '- . .. ..2
~. :-I
90 150I
Z "& 6 IBOCI.:.,'.... .. .. .
S6 dB/OCT
0.1 .. ..-- L I'
• ! ,z____ ,..--L 2 o-_ -20.&
S... . . . . . . . . . .,,--.
I....... ..................-.
Fu 134. -G- iS. ... zx_.•.. I--.i
FREQUENCY - 14.
Figure 134. IGS Y-Sensor Random Uibratiohn Qualif~cat±ou Levels
(Y-Axis)
197
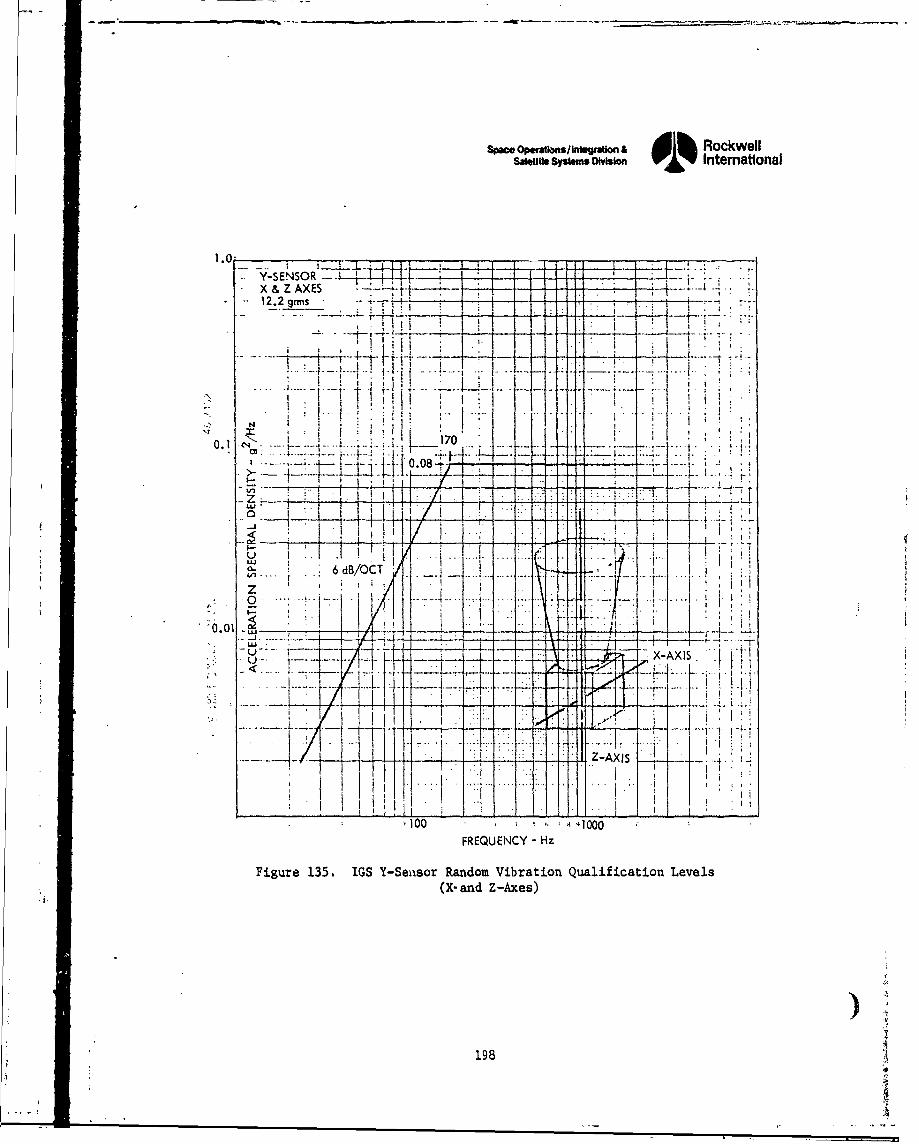
SpaceOpw*Dons/InWg~aon RockwellSawlal Sysems OWalon 01% International
1.0 L Tt~____I
Y-SENSOR -4---4LI -X &Z AXES ___1I.
12.2gns.: + -
L -
LU
o '
LU
LUL
.1100 10
FREQUENCY -Hz
Figure 135. IGS Y-Seasor Random Vibration Qualification Levels(Xand Z-Axes)
198
-1A
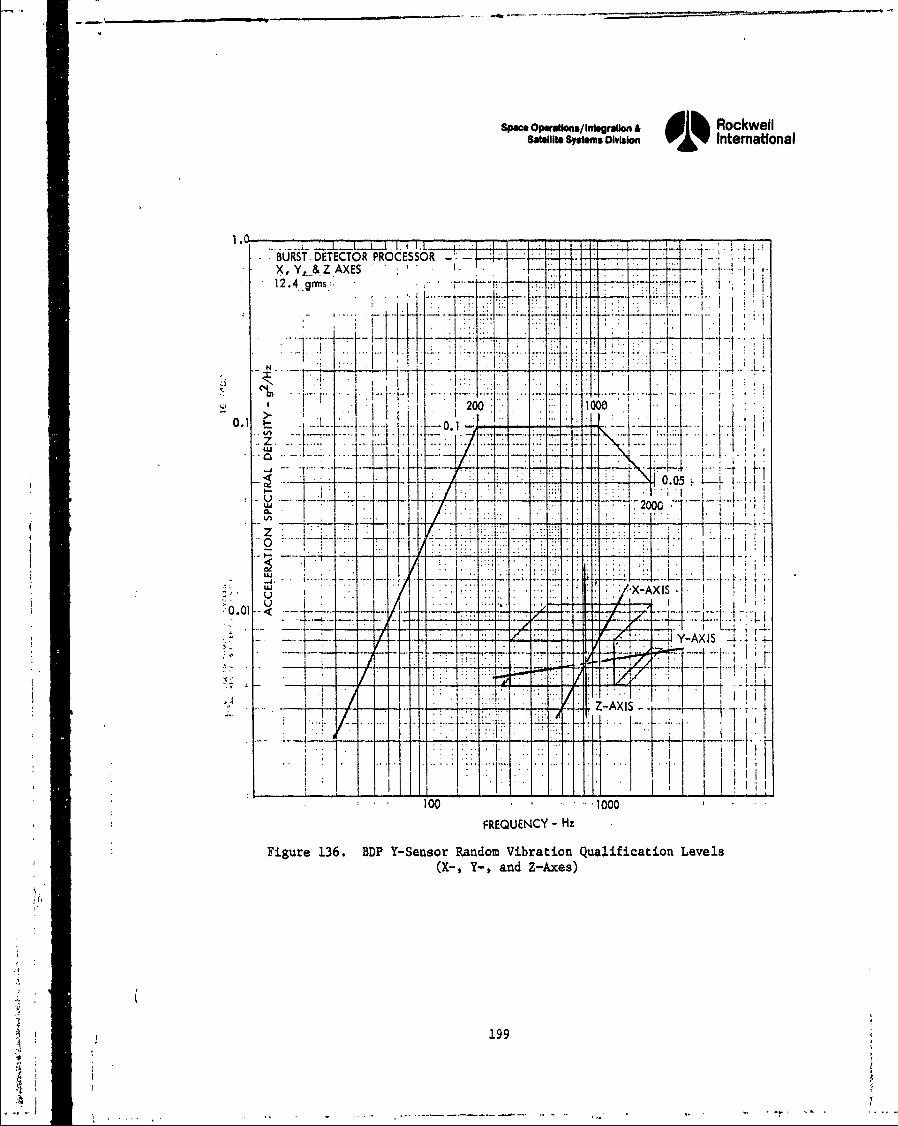
Space Operations/Ifflegrauion A RockwellSatellite Systems OlVlSIM 01 International
1r~ ~~~~1LLL -. 1 1~. L.~L....L I 44 2-..BURST DETECTOR PROCESSOR m. '7X, YL&ZAXES12.4grs 1 - -
0.I .. ... 4.. .. . .. .. . *XA2S 1K.o
0. 0...
.. .. ..T
z
+7-
10 *1000~
FREQUENCY Hz
Figure 136. BDP Y-Sensor Random Vibration Qualification Levels(X-, Y-, and Z-Axes)
199
A.-
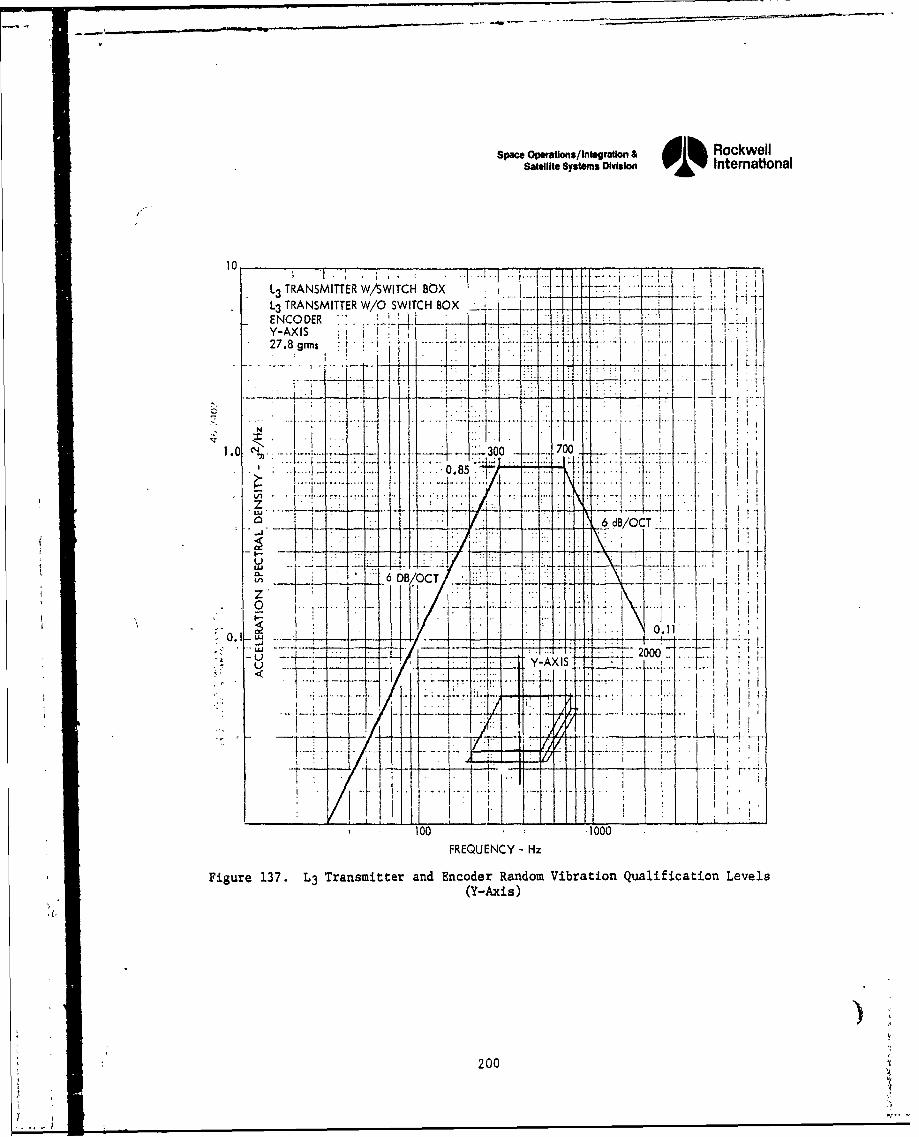
Space Opwrationsl Integration & 1hRockwellsatellite systems Division o % International
10
L3 TRANSMITTER W/SWITCH BOX -
L3 TRANSMITTER W/O SWITCH BOXENCODER ]iiiiiziILt27.8 gris 7 '
1.0 __ _ 0 )
6DB/OCTC
U4-4
2 00
7~.77 .... I I
100 00FREQUENCY - Hz
Figure 137. L3 Transmitter and Encoder Random Vibration Qualification Levels(Y-Axis)
200
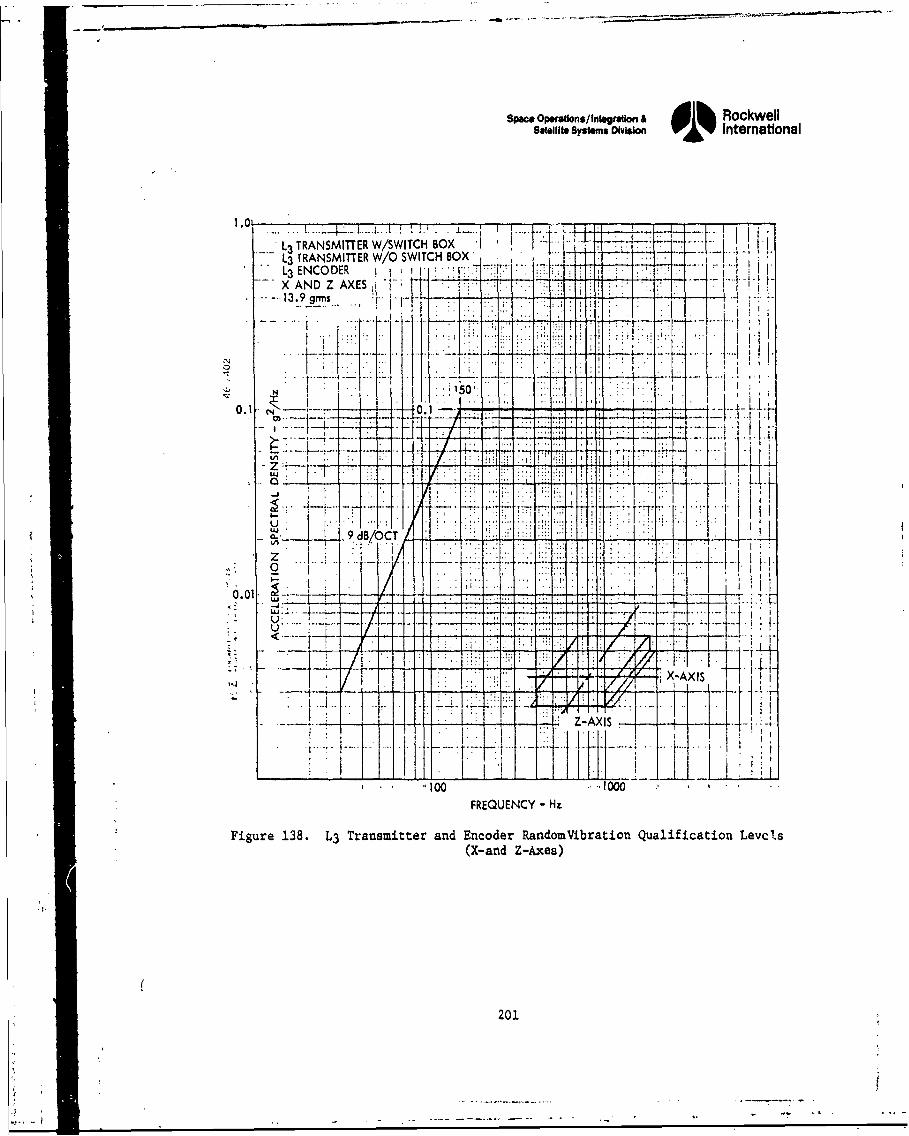
Space Operaflons/Integraton & 1 Rockwellsatellite Symtms olIVSIMo 01 International
L3 TRANSMITTER W/SWITCH BOX 1~'L3 fRANSMITTER W10 SWITCH BOX 7.I-
* L3 ENCODERX ANDZ AXES 'f
- --13.9 grmis ri ..
0...[7 Tz*!1 ......... I~
.- -. .I I ......... :~:I': I T
0.0 §1iNV 9dB/CT ,I
7±f
FREQUENCY - Hz
Figure 138. L3 Transmitter and Encoder RandomVibration Qualification Levcls
(X-and Z-Axes)
201.
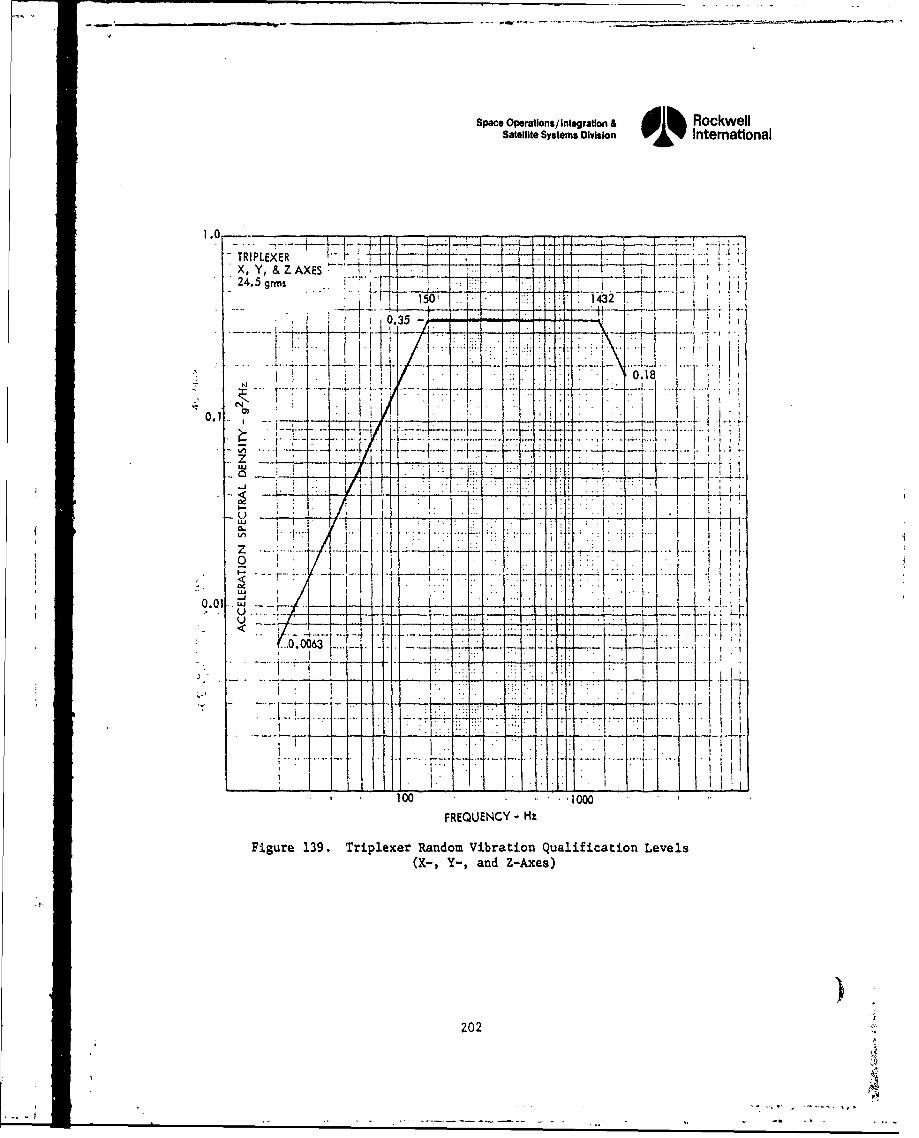
Space Operations/ Integration A Rockwell
Satellite Systems Division oInternational
TRIPLEXER tH-jX, Y, &ZAXES I124.5 grms F . 1
ti 150, i1432
0.1 _ I.............1
r I
CLI
- U . rt
- --t---7-0063I~IV -7~~---~Ilt
- ---. .-T
100
FREQUENCY Hz
Figure 139. Triplexer Random Vibration Qualification Levels(X-, Y-, and Z-Axes)
202
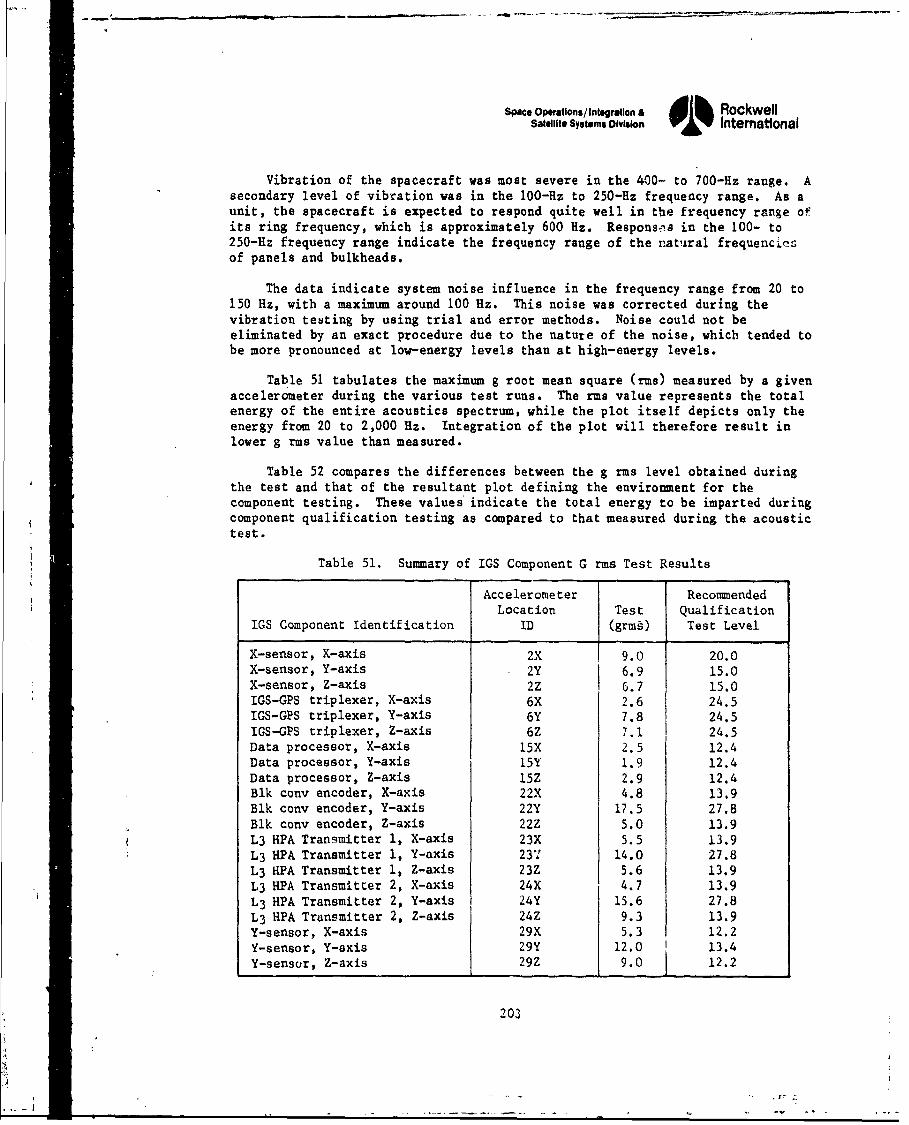
Space Operations/ Integration & di RockwellSatellite Systems Division V & Internatonal
Vibration of the spacecraft was most severe in the 400- to 700-Hz range. Asecondary level of vibration was in the 100-Hz to 250-Hz frequeacy range. As aunit, the spacecraft is expected to respond quite well in the frequency range ofits ring frequency, which is approximately 600 Hz. Responsns in the 100- to250-Hz frequency range indicate the frequency range of the natural frequenciesof panels and bulkheads.
The data indicate system noise influence in the frequency range from 20 to150 Hz, with a maximum around 100 Hz. This noise was corrected during thevibration testing by using trial and error methods. Noise could not beeliminated by an exact procedure due to the nature of the noise, which tended tobe more pronounced at low-energy levels than at high-energy levels.
Table 51 tabulates the maximum g root mean square (rme) measured by a givenaccelerometer during the various test runs. The rms value represents the totalenergy of the entire acoustics spectrum, while the plot itself depicts only theenergy from 20 to 2,000 Hz. Integration of the plot will therefore result inlower g rms value than measured.
Table 52 compares the differences between the g rms level obtained duringthe test and that of the resultant plot defining the environment for thecomponent testing. These values indicate the total energy to be imparted duringcomponent qualification testing as compared to that measured during the acoustictest.
Table 51. Summary of IGS Component G rms Test Results
Accelerometer RecommendedLocation Test Qualification
IGS Component Identification ID (grmb) Test Level
X-sensor, X-axis 2X 9.0 20.0X-sensor, Y-axis 2Y 6.9 15.0X-sensor, Z-axis 2Z 6.7 15.0IGS-GPS triplexer, X-axis 6X 2.6 24.5IGS-GPS triplexer, Y-axis 6Y 7.8 24.5IGS-GPS triplexer, Z-axis 6Z 7.1 24.5Data processor, X-axis 15X 2.5 12.4Data processor, Y-axis 15Y 1.9 12.4Data processor, Z-axis 15Z 2.9 12.4Blk cony encoder, X-axis 22X 4.8 13.9Blk cony encoder, Y-axis 22Y 17.5 27.8Blk cony encoder, Z-axis 22Z 5.0 13.9L3 HPA Transmitter 1, X-axis 23X 5.5 13.9L3 HPA Transmitter 1, Y-axis 23" 14.0 27.8L3 HPA Transmitter 1, Z-axis 23Z 5.6 13.9L3 HPA Transmitter 2, X-axis 24X 4.7 13.9L3 HPA Transmitter 2, Y-axis 24Y 15.6 27.8L3 HPA Transmitter 2, Z-axis 24Z 9.3 13.9Y-sensor, X-axis 29X 5.3 12.2Y-sensor, Y-axis 29Y 12.0 ,I 13.4'-sensor, Z-axis 29Z 9.0 J 12.2
203
,1{
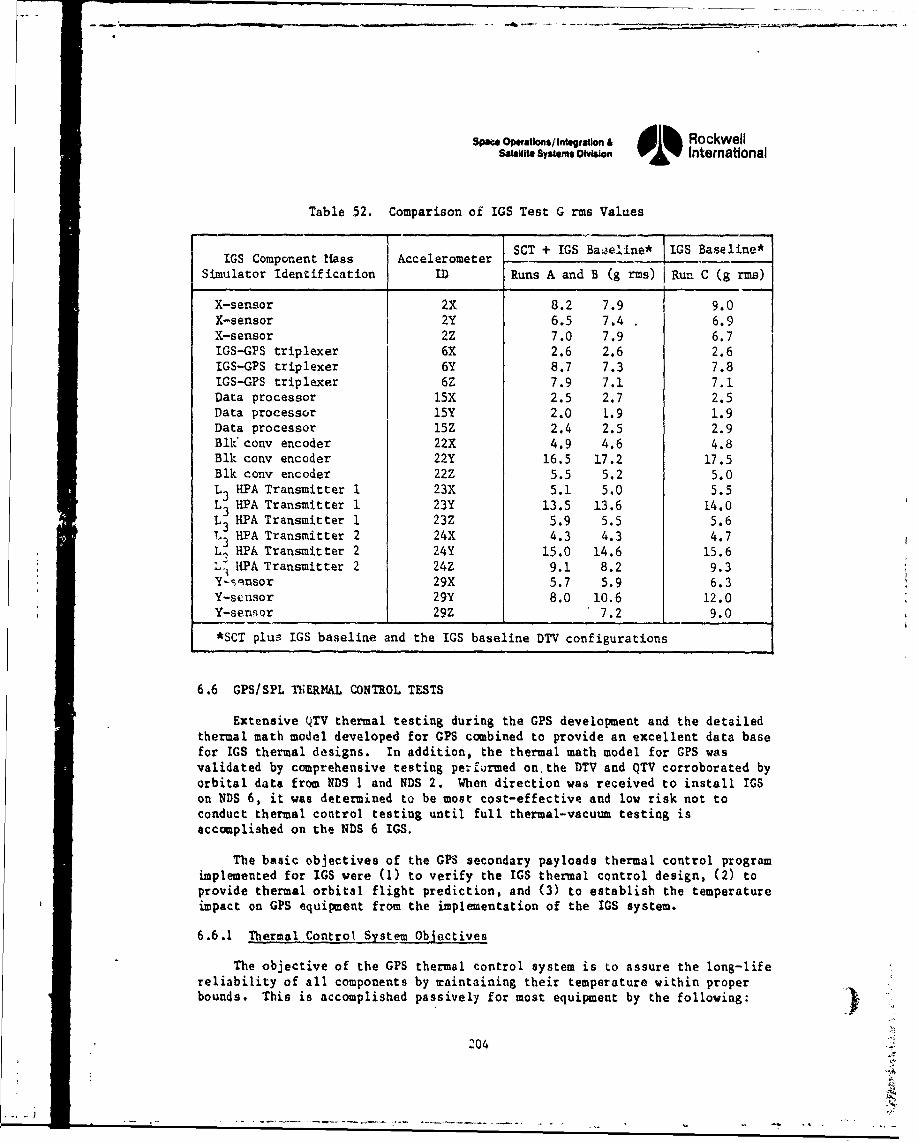
sWA O9Matlos/Integration & Ilk RockwellSatellite Systems Olvision 01% International
Table 52. Comparison of IGS Test G rms Values
SCT + IGS Baoeline* 1GSBaseline*IGS Component Itass AccelerometerSimulator Identification ID Runs A and B (g rms) Run C (g rms)
X-sensor 2X 8.2 7.9 9.0X-sensor 2Y 6.5 7.4 . 6.9X-sensor 2Z 7.0 7.9 6.7IGS-GPS triplexer 6X 2.6 2.6 2.6IGS-GPS triplexer 6Y 8.7 7.3 7.8IGS-GPS triplexer 6Z 7.9 7.1 7.1Data processor 15X 2.5 2.7 2.5Data processor 15Y 2.0 L.9 1.9Data processor 15Z 2.4 2.5 2.9Blk cony encoder 22X 4.9 4.6 4.8Blk cony encoder 22Y 16.5 17.2 17.5Blk conv encoder 22Z 5.5 5.2 5.0L3 HPA Transmitter 1 23X 5.1 5.0 5.5L3 HPA Transmitter 1 23Y 13.5 13.6 14.0L3 HPA Transmitter 1 23Z 5.9 5.5 5.6T3 HPA Transmitter 2 24X 4.3 4.3 4.7L, HPA Transmitter 2 24Y 15.0 14.6 15.6LU HPA Transmitter 2 24Z 9.1 8.2 9.3Y-,,qnsor 29X 5.7 5.9 6.3Y-sensor 29Y 8.0 10.6 12.0Y-sernor 29Z 7.2 9.0
*SCT plus IGS baseline and the IGS baseline DTV configurations
6.6 GPS/SPL ThERMAL CONTROL TESTS
Extensive (TV thermal testing during the GPS development and the detailedthermal math model developed for GPS combined to provide an excellent data basefor IGS thermal designs. In addition, the thermal math model for GPS wasvalidated by comprehensive testing pe:formed on, the DTV and QTV corroborated byorbital data from NDS 1 and NDS 2. When direction was received to install IGSon NDS 6, it was determined to be most cost-effective and low risk not toconduct thermal control testing until full thermal-vacuum testing isaccomplished on the NDS 6 IGS.
The basic objectives of the GPS secondary payloads thermal control programimplemented for IGS were (1) to verify the IGS thermal control design, (2) toprovide thermal orbital flight prediction, and (3) to establish the temperatureimpact on GPS equipment from the implementation of the IGS system.
6.6.1 Thermal Control System Objectives
The objective of the GPS thermal control system is to assure the long-lifereliability of all components by maintaining their temperature within properbounds. This is accomplished passively for most equipment by the following:
204
Space Operations/I ttgratlon& RockwellSatellite Systems Oivlsioi International
* Thermal control louvers which regulate the heat rejection to space as afunction of space vehicle temperature
* Thermal control coatings and thermal blankets, which establish thetemperaLure level of the space vehicle
* Thermal doublers and the basi,' structure of the space vehicle todistribute and store thermal energy
The RCS wetted surfaces, the batteries, the RCS motor, and the LI-MOD/IPAare controlled by thermostatically controlled heaters.
The thermal design was verified at various stages in the program bythermal-vacuum tests on the development test vehicle, the RCS breadboard, andthe qualification test vehicle. Flight test data )n NDS 1 and NDS 2 have shownthat the thermal control system is performing within requirements and asexpected.
To incorporate secondary payloads into the GPS vehicle, a thermal analysiswas perfoimed to define the SPL thermal control design modification anddetermine the temperature effects of adding the piayloads to the GPS satellite.The analysis indicated that temperature changes for GPS components were minorand all components remain within their specified temperature limits. Theminimal temperature impact of secondary payloads on the GPS satellite is due toan optimized thermal control design which requires a minimum-of modifications tothe satellite and .establishes a high level of assurance that the GPS/SPL thermalcontrol~design will perform as expected.
6.6.2 Thermal Requirements
The SPL thermal control subsystem (TCS) requirements are to integrate theSPL equipment into the GPS thermal control design and maintain SPL and GPSequipment temperatures within specified limits. To eliminate the need fortemperature requalification of GPS equipment, the integration of SPL equipmentmust not modify the GPS thermal control design or significantly impact theenergy balance. The SPL TCS also must provide a reasonable margin incontrolling component temperature extremes to account for uncertainties orvariations in equipment dissipation, mounting interface conductances, satelliteorientation, solar radiation, and degradation of thermal control surfaceproperties durir. the life of the mission.
The SPL equipment will be qualified according to MIL-STD-1540 componenttemperature limits of -340C to +710C. The GPS equipment qualification limitsare more restrictive. In particular, the cesium clock and rubidium frequencystandard temperature variation must be controlled to less than 40C per orbit.This temperature variation requirement muat be met during various satelliteoperational modes in which equipment power dissipation varies considerably.
6.6.3 Thermal Control Configuration
The SPL thermal control design for IGS and IGS/SCT configurationsemphasizes the placement of equipment in locations that minimize conduction and
205
Spac Opetons/Inweratwo & Rockwellsatlr. SySUmS DGion 01% Intemational
radiation exchange with GPS equipment and thereby minimize impact on GPScomponent temperatures. The design philosophy is to couple equipmentconductively to radiator areas or exterior panels and thereby reduce energyexchange coupling between SPL and GPS equipment. High heat dissipatingequipment is located on the shear panels to take advantage of their optimum heatrejection capability due to minimal solar exposure. Mounting equipment on shearpanels also reduces thermal doubler requirements and weight impact.
1"he remaining equipment, mainly the low heat dissipating components, arelocated on the aft bulkhead and require nc heater control. An additionalradiator on the aft bulkhead is utilized for the IGS/SCT configuration tomaintain SPL equipment (UHF and SUF receivers) within temperature limits. Theaft bulkhead radiator utilizes silverized Teflon tape and is sized fordegradation of surface properties due to plume impingeaent. and solar exposure.The thermal control design of the IGS and IGS/SCT configurations is identicalexcept for the aft bulkhead radiator required for the UOF and SIF receivers onthe IGS/SCT configuration.
6.6.4 Component Mounting
The SPL component mounting requirements are divided into two categories:high and low heat dissipating components. The high heat dissipating equipmentis mounted on the shear panels to take advantage of their optimum heat rejectioncapability. The existing GPS shear panel doubler areas are enlarged to providemounting areas for the SPL equipment, giving required mounting interface surfaceflatness and conduction fin efficiency foi proper temperature control. The lovheat dissipating equipment is mounted on the aft bulkhead and requires nothermal doublers since the structural bulkhead is adequate in conducting the lowlevel of heat dissipation.
6.6.5 Thermal Doublers
The GPS thermal control design relies on doublers to assist in theconduction of equipment heat to the shear pane! radiator areas. The designrequires only minor enlargements of existing doublers to accommodate themounting of SPL equipment and provide the required conduction fin efficiencies.The weight of the additional doubler areas required for SPL is 1.55 pounds. TheSPL doubler requirements (eniargements of existing GPS doublers) are illustratedin Figure 140.
6.6.6 Thermal Control Coatings
The SPL thermal control design relies solely on the use of CPS-approvedthermal coatings and tapes and requires no modifications of the therel co.atrolutilized on the CPS satellite. The exterior surfaces of SFL electroniccomponents are coated vith a high-emittance black paint to enthance internalradiation exchange and minimize temperature gradients vitbin the spacecraft.The aft bulkhead radiator is covered vith silverited Teflon to aid in cooponentheat rejection and reflection of incident solar radiation. S-13 GLO vhite paintand cultilayer insulation are utilized on the t,%F and SHIF antenna exteriors asvell as on the X-sensor and Y-sensor surchade to reduce temperature excursions.
fool
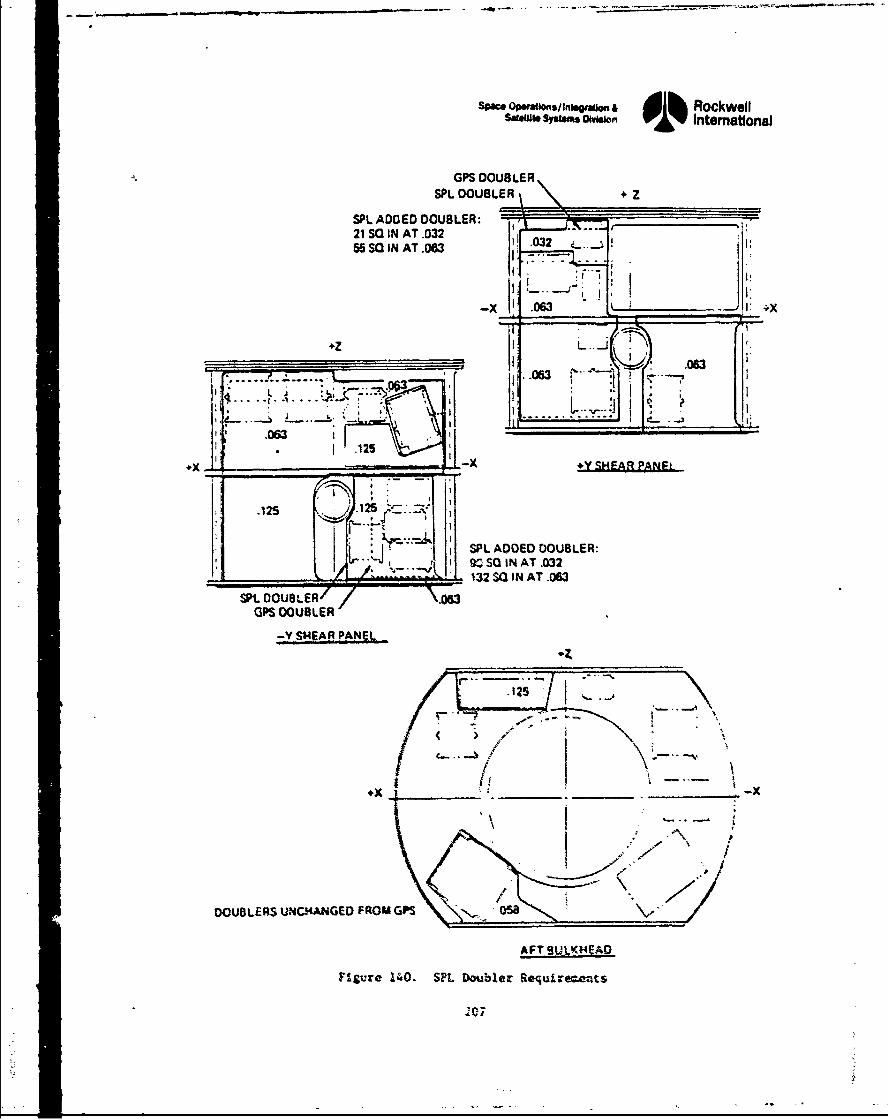
Sofe. Opemaionfs/InsGUo dA RockwellSNm tS oiSi. VY International
GPS DOUBLERSPL DOUBLER + Z
SPL ADCED DOUBLER: __,_____________
21 S- IN AT .032 j
55 SO IN AT.063
-X .063 3X
,__, ___ _ ,1..32 " ' .. . SQ IN AT. .0, 0
.063OER06
X. _, X +Y SHEAR PANE
.125 .125 . ..
I SCI I
/ DOBLR \45
GPS DOU13LER
-.. SHE.A R PAN EL_
DOUBLERS U6NCI4ANGED FROMGPS oua
AFT SUL.HEAD
FPlure 14.0. SF•L Doubler Reiuurezets
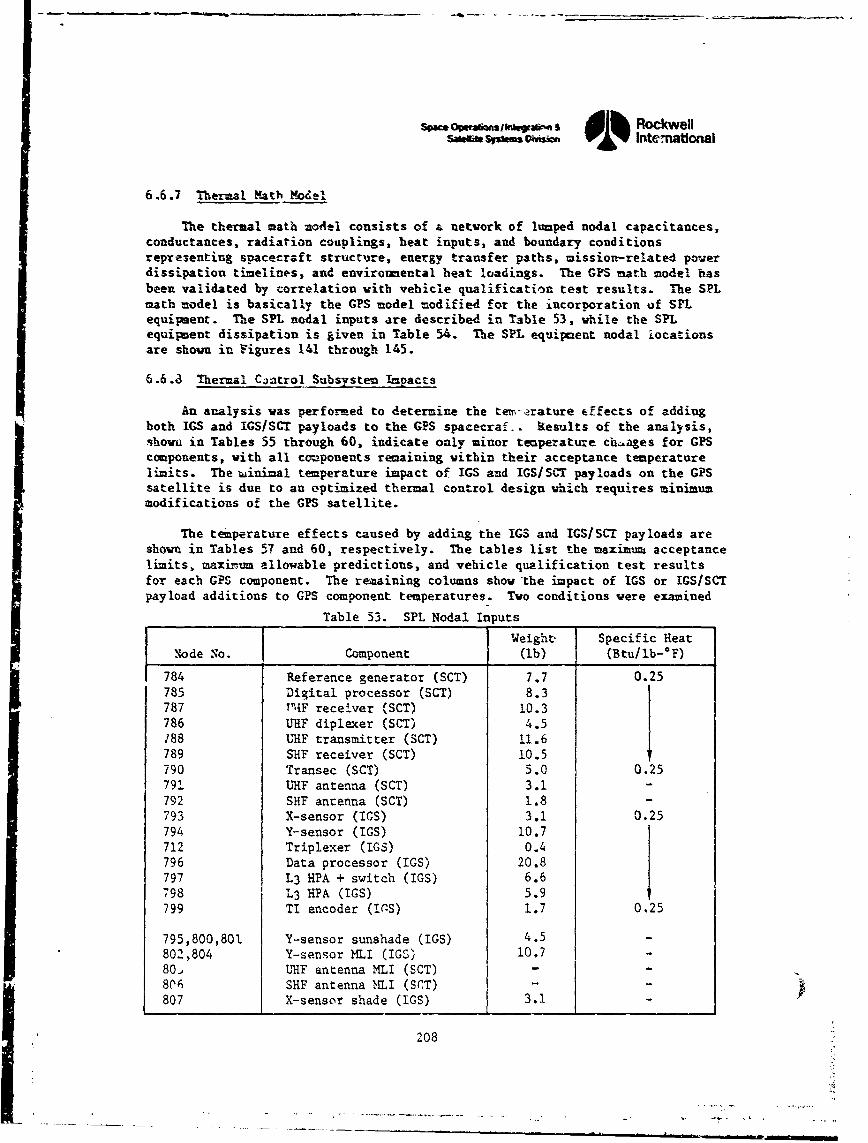
Set OoSiWr gn*3f ,,, S d Rockwells*WftjkOW 01%sm p~ua Y Intemnational
6.6.7 Thermal Math Model
The thermal math model consists of a network of lumped nodal capacitances,conductances, radiation couplings, beat inputs, and boundary conditionsrepresenting spacecraft structure, energy transfer paths, mission-related powerdissipation timelinos, and envirornental heat loadings. The GPS math model hasbeen validated by correlation with vehicle qualification test results. The SPLmath model is basically the GPS model modified for the incorporation of SPLequipment. The SPL nodal inputs are described in Table 53, while the SPLequipment dissipation is given in Table 54. The SPL equipment nodal iocationsare showu in Figures 141 through 145.
6.6.3 Thermal Control Subsystem Impacts
An analysis was performed to determine the tem-erature cffects of addingboth IGS and IGSISCT payloads to the GPS spacecraf.. kesults of the analysis,showu in Tables 55 through 60, indicate only minor temperature ch.ages for GPScomponents, with all ccmponents remaining within their acceptance temperaturelimits. The iinimal temperature impact of IGS and IGS/S;-.t payloads on the GPSsatellite is due to an optimized thermal control design which requires minimummodifications of the GPS satellite.
The temperature effects caused by adding the IGS and IGS/SCT payloads areshown in Tables 57 and 60, respectively. The tables list the maximum acceptancelimits, maximum allowable predictions, and vehicle qualification test resultsfor each GPS component. The remaining columns show the impact of IGS or IGS/SCTpayload additions to GPS component temperatures. Two conditions were examined
Table 53. SPL Nodal Inputs
Weight- Specific HeatNode No. Component (1b) (Btu/Ib-°F)
784 Reference generator (SCT) 7.7 0.25785 Digital processor (SCT) 8.3787 VU{F receiver (SCT) 10.3786 UHF diplexer (SCT) 4.5/88 MF transmitter (SCT) 11.6789 SHF receiver (SCT) 10.5790 Transec (SCT) 5.0 0.25791 UHF antenna (SCT) 3.1 -792 SHF antenna (SCT) 1.8 -793 X-sensor (IGS) 3.1 0.25794 Y-sensor (IGS) 10.7712 Triplexer (IGS) 0.4796 Data processor (IGS) 20.8797 L3 HPA + switch (IGS) 6.6798 L3 HPA (IGS) 5.9799 TI encoder (Ir-S) 1.7 0.25
795,800,801 Y-sensor sunshade (IGS) 4.5 -802,804 Y-sensor MLI (IGS) 10.780- MHF antenna MLI (SCT) -806 SHEF antenna MLI (SCT) -807 X-sensor shade (IGS) 3.1-
20208
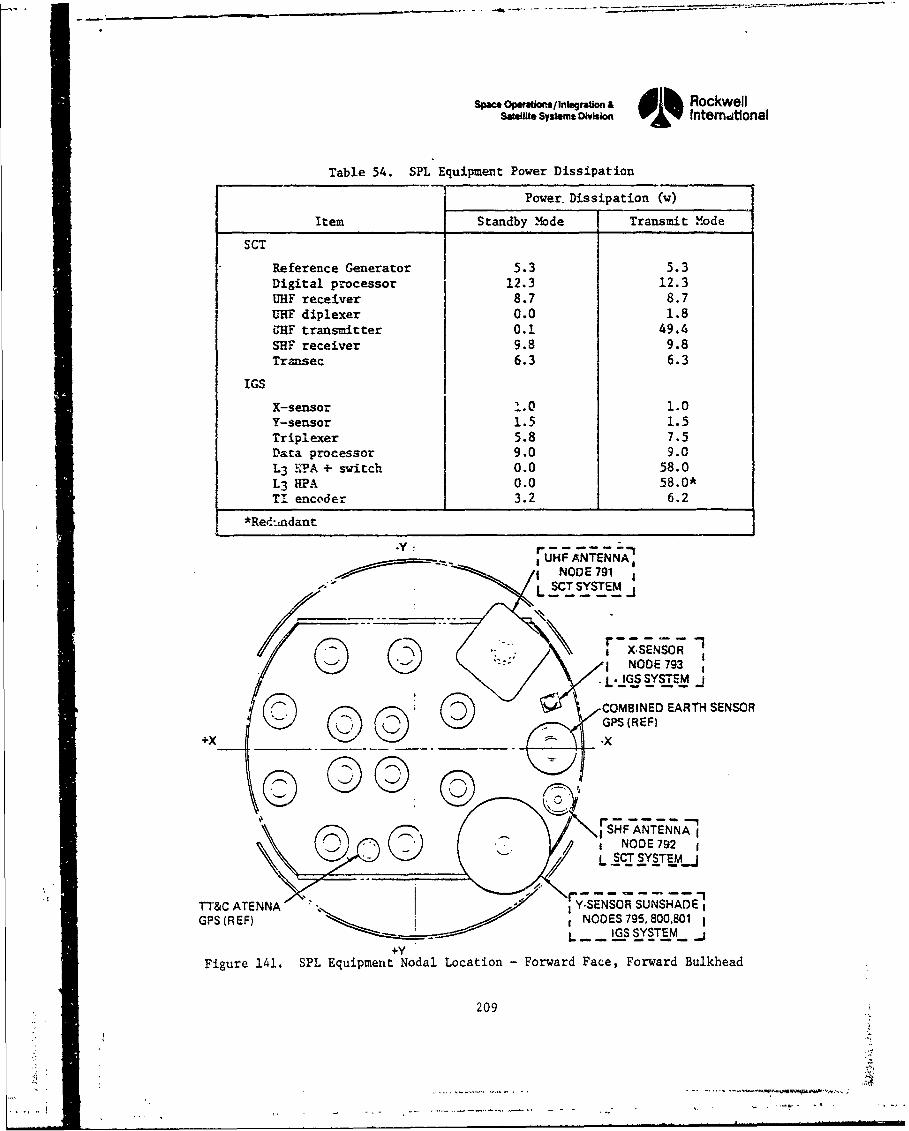
Space Opeiation/In/egration & d1h RockwellSatellite Systeme DWIsion International
Table 54. SPL Equipment Power Dissipation
Power. Dissipation (w)
Item Standby .Mode Transmit mode
SCT
Reference Generator 5.3 5.3Digital processor 12.3 12.3UHF receiver 8.7 8.7UHF diplexer 0.0 1.8URF transmitter 0.1 49.4SEF receiver 9.8 9.8Transec 6.3 6.3
IGS
K-sensor i.0 1.0Y-sensor 1.5 1.5Triplexer 5.8 7.5Data processor 9.0 9.0L3 12A + switch 0.0 58.0L3 UPA 0.0 58.0*TI encoder 3.2 6.2
*Redundant
1UHF ANTENNA1NODE 791S• ,h SOT SYSTEM
0 0 NODE 793IGS SYST EM _
.N COMBINED EARTH SENSORGPS (REF)©X(. _)-_+ ©©
NODE 792/ L SCT SYSTEM-j
TT&C ATENNA Y.SENSOR SUNSHADEGPS (REF) NODES 795,800,801
L IGS SYSTEM .+Y
Figure 141. SPL Equipment Nodal Location - Forward Face, Forward Bulkhead
209
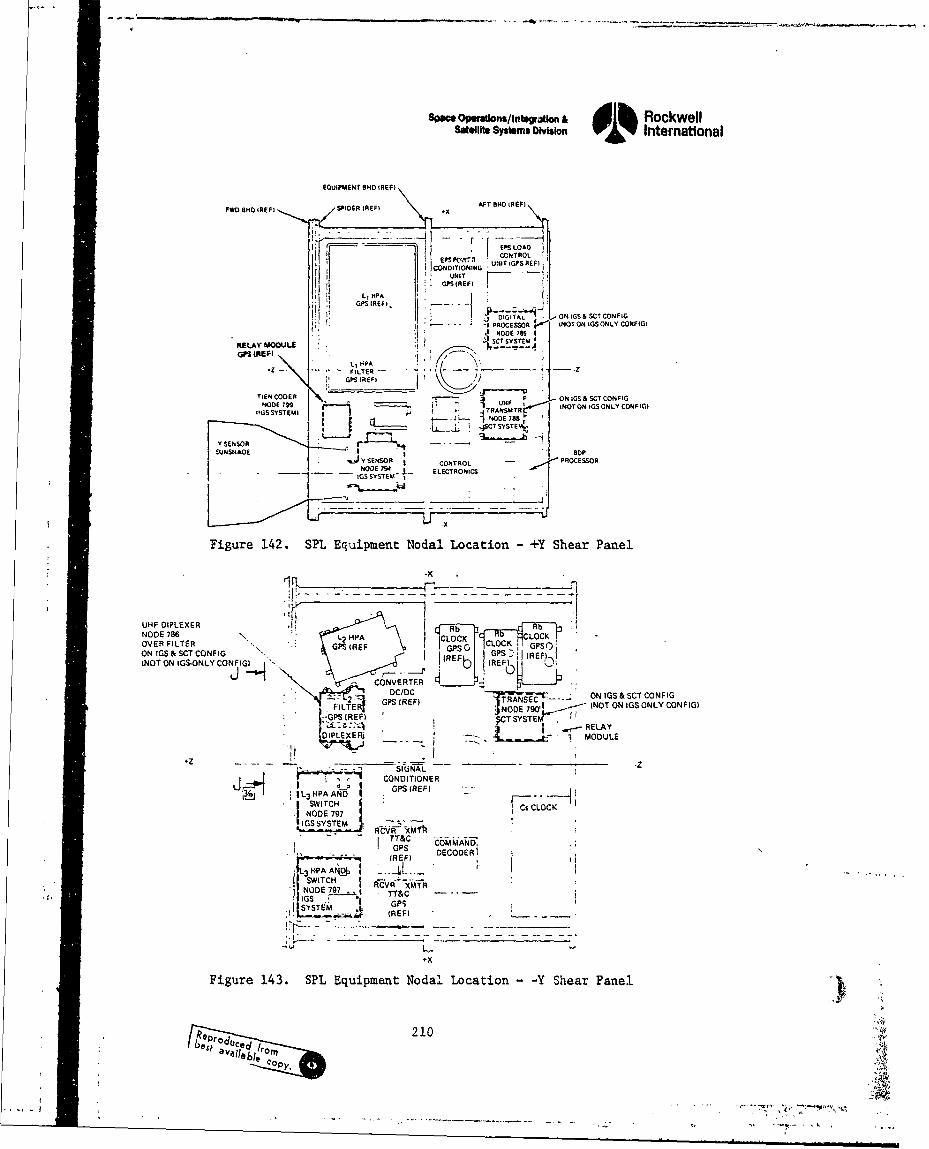
SpaceOpeations/Inlegtwauons,~ 1 RockwellSatelite Systems Division International
EQUIPMENT ONO IREP)
FWDSO 8)4 I SP~IDER IREFI ATBH
CONTROLCCOFIEP.1~ UNISYTE -, PRCSSOR NF1 N SOLYCNPG
OPSIREPI ).
ON OGS & SCT CONF '0NOOE0 (8 HEI NOT ON IGSONLY CONFIG)
IIOSSYSNODE 1?R 5 1
_ _ SYSTEM~
V ~ ~ ~ ~ L SESSPA___ ~ -
.z.FILTEN~R COTO--POCSO
NODE 7" 'T. L 2 HIOA CLOC ONLY OCK.
OVERSO FITE SOPSRF LO
ON OE ECNCDFE 7W ELECTRONIC
-, CONVTF.RV
IjHF~~ DC/DCE R
SCT COLFEG GPS (R EF ~ .--.- ONGripsONF0
(NOTREF ONOE9O- tGNOTONIGSONLYCONFIGI
J-HCONDIRTIOER 3
2~HAN GPSIREF1SIC TRANC I (OTOOCKONYIOFGNOD 79TE1 R)ND 7
I ~ ~ ~ X IGSYTE RVRME
IRRELAY
.z.
V.~iLa/, AND
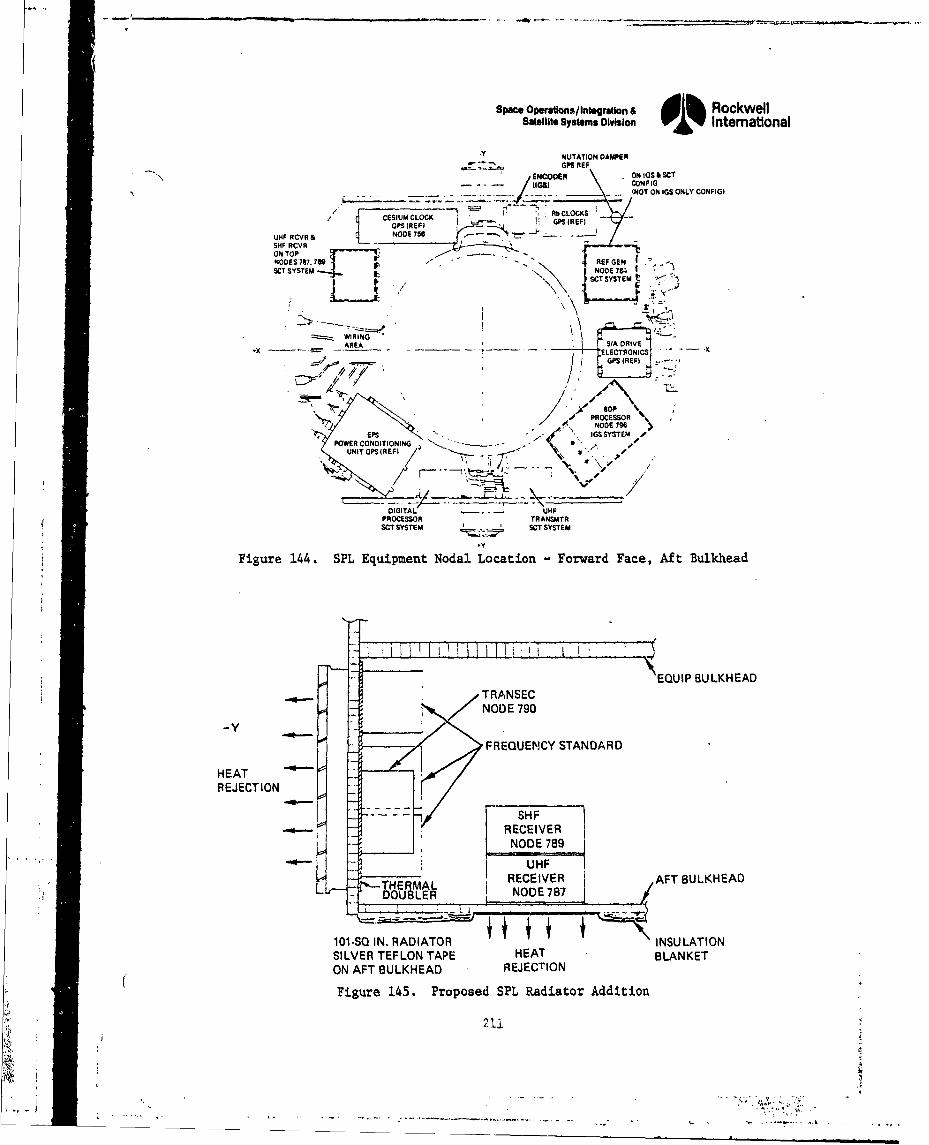
Space Operations/ Integration & dlh RockwellSatellite Systems Division 01% International
"-Y NUTATION DAMPERGPS REF
S ENCO R . ON IUS SCT\ ... / U~l \ CONe IG. .. . ... __ (NOT ON IGS ONLY CONFIG)
CESIUM CLOCK RbCLOCKS _ _
GPS(EFI PS (REFI
UHF RCVR & OES -
SI4F RCVRON TOP . - -.NOOES 77 77 129 - - REF GENSCT SYSTEM I NOOE7G
-\ \ CT SYSTEM t '- < '
SWIRING.xAREA - ____ __ S/A DRIVE
EL.ECTRONICS
* •- .~ " ' s1,• ,DIGITIPS -'REU H
SOPTPROCESSOR
11 NODE 790
'PSIGSSYSTEM ePOWER CONTDIIONING
UNIT DIPS IRE)
r~
DIGITAL UHFPROCESSOR TRANSMTRSCT SYSTEM SCr SYSTEM
Figure 144. SPL Equipment Nodal Location Forward FaceS Aft Bulkhead
EQUIP BULKHEADTRANSECNODE 790
FREQUENCY STANDARD
HEATREJECTION
SHF-~ RECEIVER
NODE 789
UJHFRECEIVER AFT BULKHEAD
THEIMAL I NODE 787
Figure 145. Proposed SPL Radiator Addition
L2 1 .7
1 IN.... R.AD.AT.. INSULATION
SIVE TELO T.,P,, HEABLNKE
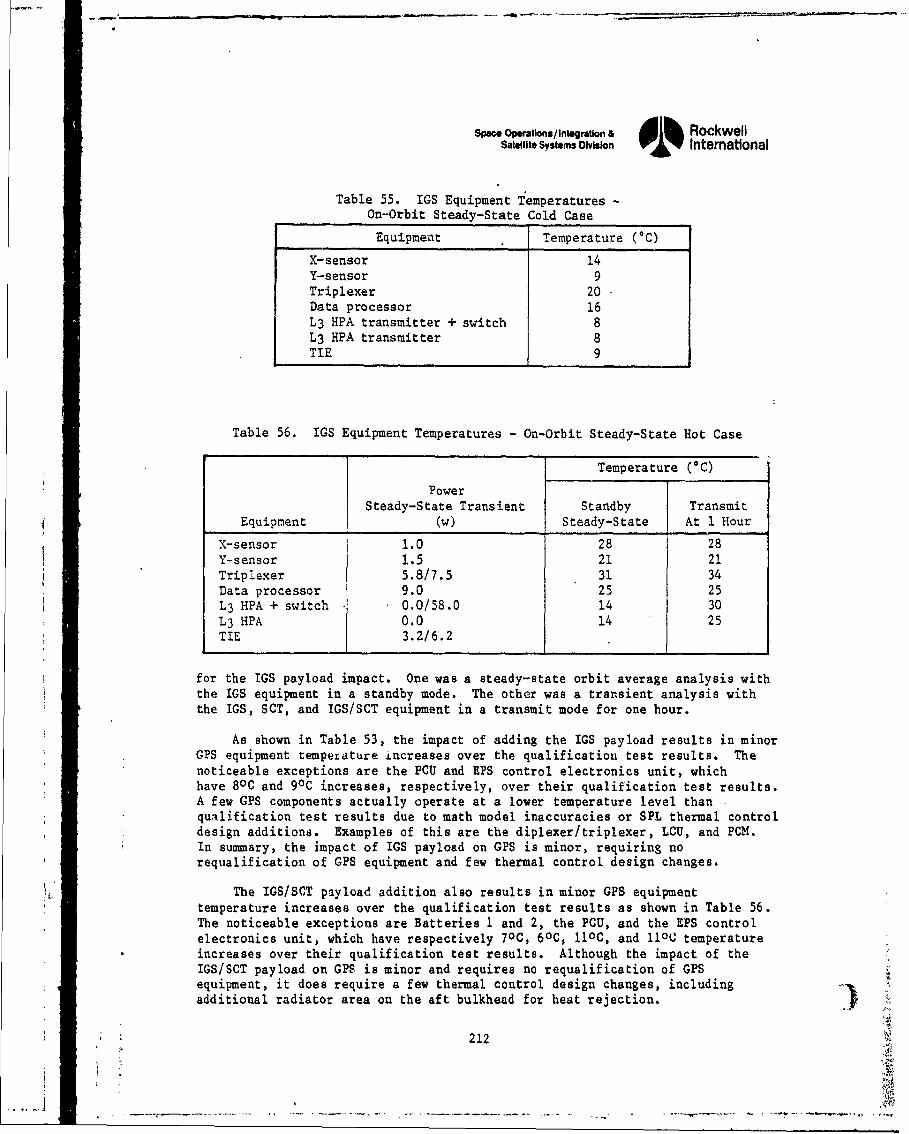
Space Operations/ Integration a dib RockweliSatellite Systems Division i% International
Table 55. IGS Equipment Temperatures -
On-Orbit Steady-State Cold Case
Equipment Temperature (*C)
X-sensor 14Y-sensor 9
Triplexer 20Data processor 16L3 HPA transmitter + switch 8
L3 HPA transmitter 8TIE 9
Table 56. IGS Equipment Temperatures - On-Orbit Steady-State Hot Case
Temperature (*C)
PowerSteady-State Transient Standby Transmit
Equipment (w) Steady-State At 1 Hour
X-sensor 1.0 28 28Y-sensor 1.5 21 21
Triplexer 5.8/7.5 31 34Data processor 9.0 25 25L3 HPA + switch 0.0/58.0 14 30L3 HPA 0.0 14 25TIE 3.2/6.2
for the IGS payload impact. One was a steady-state orbit average analysis withthe IGS equipment in a standby mode. The other was a transient analysis withthe IGS, SCT, and IGS/SCT equipment in a transmit mode for one hour.
As shown in Table 53, the impact of adding the IGS payload results in minorGPS equipment tempexature increases over the qualification test results. Thenoticeable exceptions are the PCU and EPS control electronics unit, whichhave 80C and 90C increases, respectively, over their qualification test results.A few GPS components actually operate at a lower temperature level thanqualification test results due to math model inaccuracies or SPL thermal controldesign additions. Examples of this are the diplexer/triplexer, LCU, and PCM.In sumary, the impact of IGS payload on GPS is minor, requiring norequalification of GPS equipment and few thermal control design changes.
The IGS/SCT payload addition also results in minor GPS equipmenttemperature increases over the qualification test results as shown in Table 56.The noticeable exceptions are Batteries 1 and 2, the PCU, and the EPS controlelectronics unit, which have respectively 70C, 60C, 11oC, and lOC temperatureincreases over their qualification test results. Although the impact of theIGS/SCT payload on GPS is minor and requires no requalification of GPSequipment, it does require a few thermal control design changes, includingadditional radiator area on the aft bulkhead for heat rejection.
212
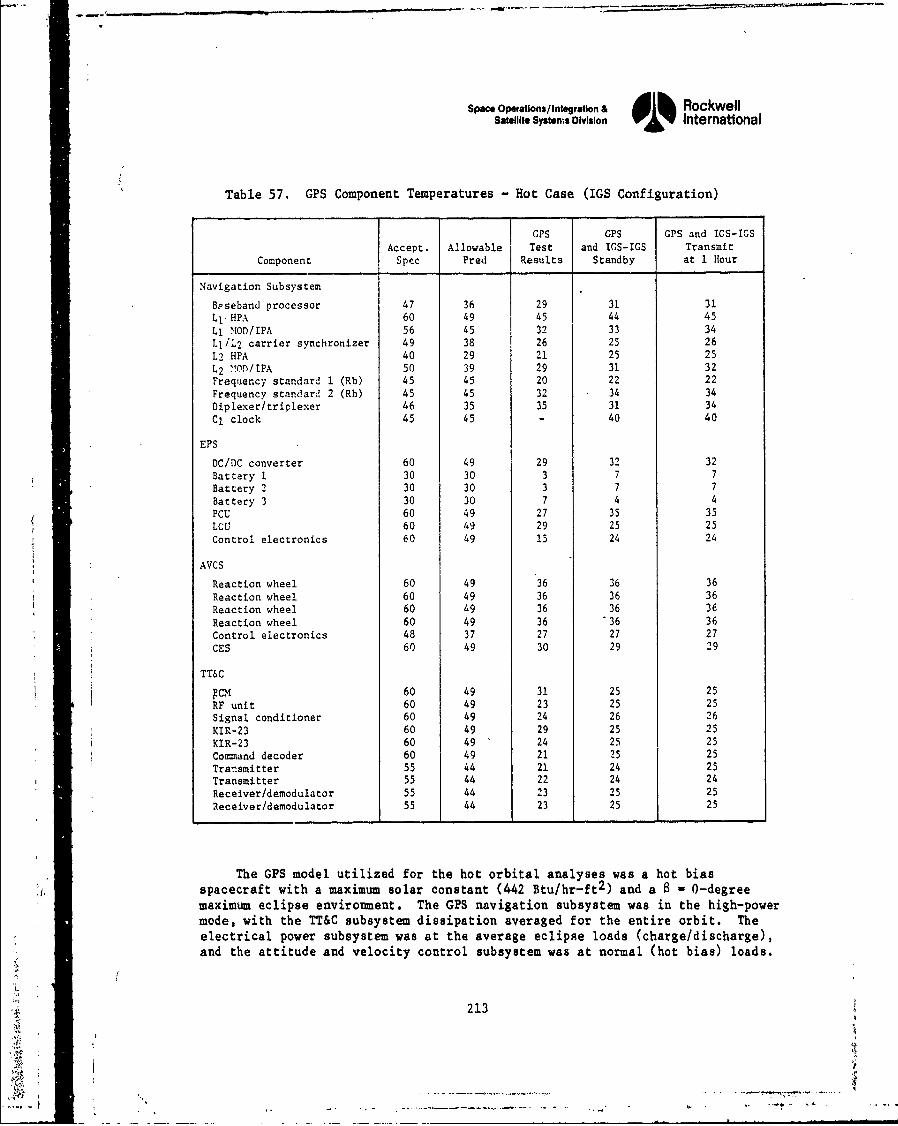
Space Opestaons/Inta•ratlon & RockwellSatellite Systemns Division 0, International
Table 57. GPS Component Temperatures - Hot Case (IGS Configuration)
CPS GPS GPS and ICS-IGS
Accept. Allowable Test and ICS-IGS TransmitComponent Spec Pred Results Standby at 1 Hour
Navigation Subsystem
Bpseband processor 47 36 29 31 31
L1 HPA 60 49 45 44 45
Ll MOD/IPA 56 45 32 33 34
LIiL2 carrier synchronizer 49 38 26 25 26
L2 HPA 40 29 21 25 25
L2 ..OD/IPA 50 39 29 31 32Frequency standard 1 (Rb) 45 45 20 22 22Frequency standard 2 (Rb) 45 45 32 34 34
Diplexer/triplexer 46 35 35 31 34
Cl clock 45 45 - 40 40
EPS
DC/DC converter 60 49 29 32 32Battery 1 30 30 3 7 7
Battery 2 30 30 3 7 7
Battery 3 30 30 7 4 4
PCU 60 49 27 35 35
LCU 60 49 29 25 25
Control electronics 60 49 15 24 24
AVCS
Reaction wheel 60 49 36 36 36
Reaction wheel 60 49 36 36 36
Reaction wheel 60 49 36 36 36Reaction wheel 60 49 36 36 36
Control electronics 48 37 27 27 27CES 60 49 30 29 29
TTUC
PCM 60 49 31 25 25
RF unit 60 49 23 25 25Signal conditioner 60 49 24 26 26
KIR-23 60 49 29 25 25
KIR-23 60 49 24 25 25
Cormand decoder 60 49 21 25 25Transmitter 55 44 21 24 25Transmitter 55 44 22 24 24Receiver/demodulator 55 44 23 25 25
Receiver/demodulator 55 44 23 25 25
The GPS model utilized for the hot orbital analyses was a hot bias*( spacecraft with a maximum solar constant (442 Btu/hr-ft 2 ) and a 0-degree
maximum eclipse environment. The GPS navigation subsystem was in the high-powermode, with the TT&C subsystem dissipation averaged for the entire orbit. Theelectrical power subsystem was at the average eclipse loads (charge/discharge),and the attitude and velocity control subsystem was at normal (hot bias) loads.
213
-il k
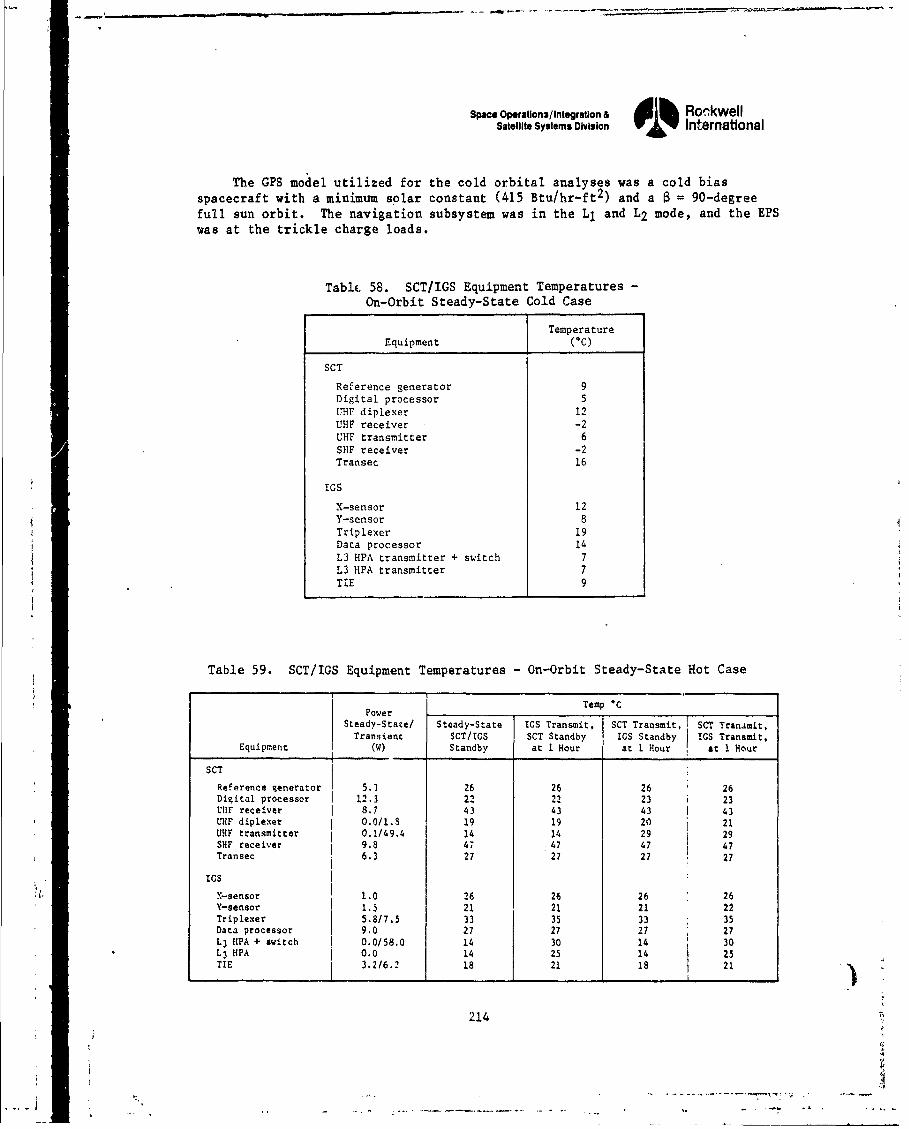
Space Operations/Integration & Alh RockwellSatellite Systems Division V•& International
The GPS model utilized for the cold orbital analyses was a cold biasspacecraft with a minimum solar constant (415 Btu/hr-ft 2 ) and a a = 90-degreefull sun orbit. The navigation subsystem was in the L1 and L2 mode, and the EPSwas at the trickle charge loads.
Tablc 58. SCT/IGS Equipment Temperatures -
On-Orbit Steady-State Cold Case
Temperature
Equipment ( 0 C)
SCT
Reference generator 9Digital processor 5
LHF diplexer 12UHF receiver -2UHF transmitter 6SHF receiver -2Transec 16
IGS
X-sensor 12Y-sensor 8Triplexer 19Data processor 1.L3 HPA transmitter + switch 7L3 HPA transmitter 7TIE 9
Table 59. SCT/IGS Equipment Temperatures - On-Orbit Steady-State Hot Case
r rPower
Temp C
Steady-State/ Steady-State IGS Transmit, SCT Transmit, I SCT Transmit,Transient SCT/lGS SCT Standby IGS Standby IGS Transmit,
Equip(ent W(W) Standby at 1 Hour at 1 Hour at 1 Hour
SCT -
Reference generator 5.3 26 26 26 26Digital processor 12.3 22 22 23 i 23U11F receiver 8.7 43 43 43 1 43UHF diplexer 0.0/1.3 19 19 20 j 21UHF transmitter 0.1/49.4 14 14 29 29SHF receiver 9.8 47 47 47 47Transecee 6.3 27 27 27 27
IGS
X-sensor 1.0 26 26 26 26Y-sensor 1.5 21 21 21 22Triplexer 5.8/7.5 33 35 33 35Data processor 9.0 27 27 27 27L3 HPA + switch 0.0/58.0 14 30 14 30L3 HPA f 0.0 14 25 14 25TIE 3.2/6.2 18 21 18 21
214
-----------------------------------.-.-,-.-~
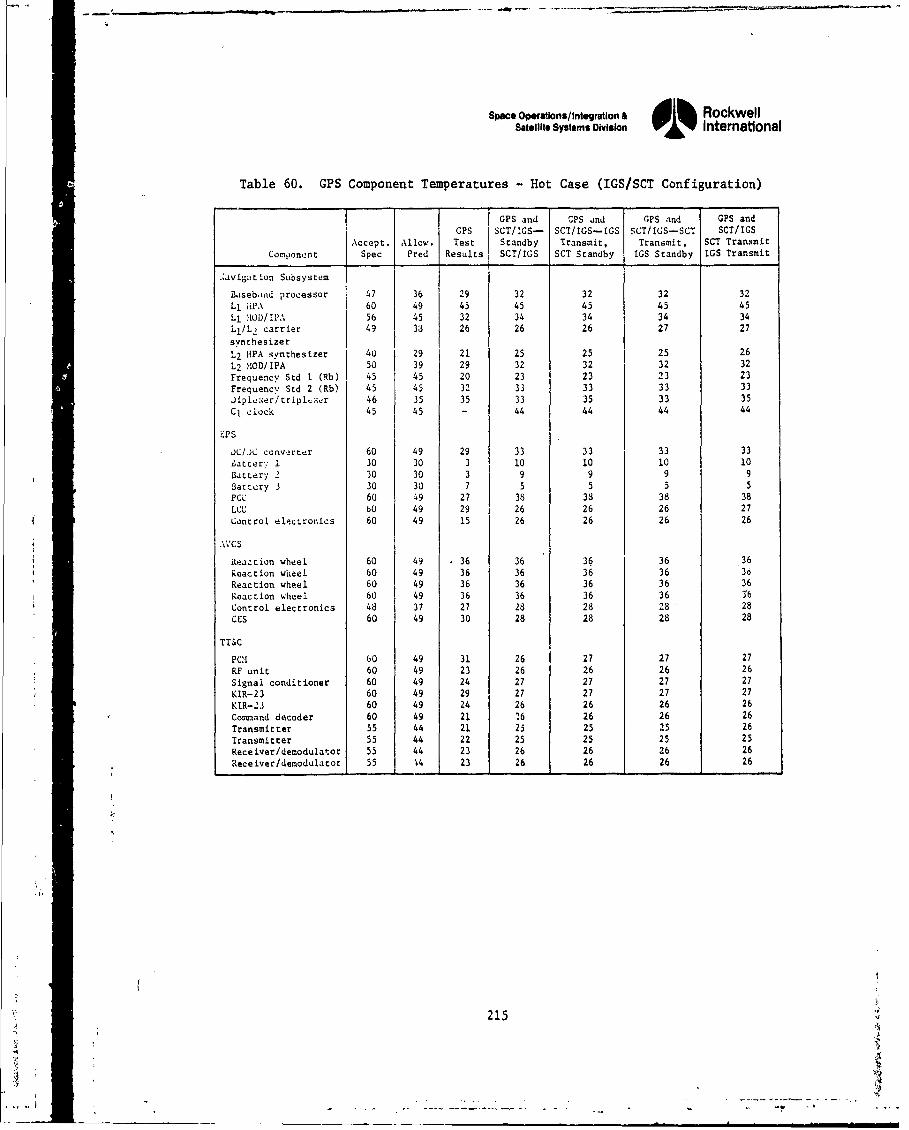
Space Operations/Integration & dik RockwellSatellite Systems Division International
Table 60. GPS Component Temperatures - Hot Case (IGS/SCT Configuration)
GPS and CPS and CPS and GPS and
GPS SCT/LGS- SCT/IGS--GS SCT/IGS-SCT SCT/IGS
Accept. Allow. Test Standby Transmit, Transmit, SCT Transmit
Component Spec Pred Results SCT/IGS SCT Standby IGS Standby IGS Transmit
.ýdvigation Subsystem
Baseb~iad processor 47 36 29 32 32 32 32Ll iiPA 60 49 45 45 45 45 45
LI MOD/[PA 56 45 32 34 34 34 34Ll/L, carrier 49 33 26 26 26 27 27synthesizer
L2 HPA synthesizer 40 29 21 25 25 25 26
L2 XOD/IPA 50 39 29 32 32 32 32
Frequency Std 1 (Rb) 45 45 20 23 23 23 23Frequency Std 2 (Rb) 45 45 32 33 33 33 33
diplvxer/tripl.xer 46 35 35 33 35 33 35Cl clock 45 45 - 44 44 44 44
EPS
JC/JC convorter 60 49 29 33 33 33 33Latter" 1 30 30 3 10 10 10 10Battery 2 30 30 3 9 9 9 9Battery 3 30 30 7 5 5 5 5PCU 60 49 27 38 38 38 38LCU 60 49 29 26 26 26 27Control electronics 60 49 15 26 26 26 26
,VCS
Reaction wheel 60 49 36 36 36 36 36Reaction wheel 60 49 36 36 36 36 36Reaction wheel 60 49 36 36 36 36 36Reaction wheel 60 49 36 36 36 36 16Control electronics 48 37 27 28 28 28 28CES 60 49 30 28 28 28 28
TT&C
PC'I 60 49 31 26 27 27 27RF unit 60 49 23 26 26 26 26
Signal conditioner 60 49 24 27 27 27 27
KIR-23 60 49 29 27 27 27 27
KIR-23 60 49 24 26 26 26 26Command decoder 60 49 21 26 26 26 26
Transmitter 55 44 21 23 25 25 26
Transmitter 55 44 22 25 25 25 25Receiver/demodulator 55 44 23 26 26 26 26Receiver/demodulator 55 1 '4 23 26 26 26 26
215
S. . . ... .. 2.. . .2"2 L - . . ..
Space Operatlons/Integration A dli RockwellSatellite Systems Olvision oi% International
7. CONCLUSIONS AND RECOMMENDATIONS
7.A CONCLUSIONS
The validation test has verified that the SPL IGS/GPS operates as specifiedwithout impact to the basic GPS navigation mission.
The test program involved integration and testing of the. complete SPL IGSsystem installed on the GPS vehicle. Anechoic chamber tests were run with bothpayloads operating and with all transmitters operating at full power. Nodetectable cross coupling of transmitter/receiver combinations was observed. -
The following conclusions have been derived:
9 Minimum modifications to GPS to accoimnodate IGS achieved
- Timing, power, TT&C, and antenna interfaces provided without impact tothe GPS navigation payload or mission
9 The IGS system does not impact the navigation system performance
- Tested using the GPS X-set receiver and no effect on the navigationsystem was verified
- Antenna pattern testing verified no impact otn-navigation patterns withIGS added
- Anechoic chamber tests with all transmitters operating at full powerverified that there were no undesireable intermodulation products thataffect the IGS/GPS mission
# IGS design goals achieved
- Ll/L 3 handoff workable and proven
- Weight and power within specifications and budget
- Environmental levels verified and tested
- Vibroacoustic and thermal levels established
- EDM tested to qualification levels- Full qualification tests completed
- L3 should not impact the radio astronomy service due to low power andduty cycle. A radio astronomy filter is planned for extended dutycycle.
217
- pO / --BUM,=
So-.
Space Operations/Integration & dik RockwellSatellite Systems Division "i% International
7.2 RECOMMENDATIONS
The performance of a full-up test on FSV 6 is recommended.
"* EMI: The ETV survey indicated minor problems which were corrected;should have full-up test with all GPS and IGS systems operating.
"* Thermal: Math model indicates no problem; needs augmented (performanceversus design/workmanship) thermal-vacuum test on FSV 6 for verification.
I2
218 .4
Space Opetons/Integration & RockwellSatellite Systems Division 01% International
APPENDIX. RADIO ASTRONOMY INTERFERENCE STUDY
The GPS space vehicle with the IGS secondary payload radiates three spread-spectrum modulated carriers designated L1 (1575.42 MHz), L2 (1227.6 MHz), and L3(1381.05 MHz) which contain spectra within two radio astronomy bands allocatedworldwide. This appendix contains the background, requirements, measurements,and data analyses relevant to evaluating the potential radio astronomy signalinterference levels.
BACKGROUND
Radio astronomy is primarily the passive observation of radio frequencysources in our own and distant galaxies at various frequencies ranging from afew megahertz to a few tens of gigahertz. The characteristics of these radiosources vary from broadband continuum-type radiation to narrow line emissions,all of vhich show practically no modulation other than random noise.Observations of these signals generally fall into two broad classes. Class Aobservations, often used in the study of cosmic emissions of relatively highintensity, are those in which the sensitivity of the equipment is not a primaryfactor. Many observations fall into this class, and continuity is a primaryfactor.
The nature oA Class B observations is such that advanced low-noisereceivers, long integration times, and wide receiver bandwidths are usuallyinvolved, and their tignificance is critically dependent on the sensitivity ofthe equipment used in making them. Potential interference with this latterclass of observation is the primary emphasis of this appendix.
The sensitivity of a rad.io astronomy observation can be defined as thesmallest power level change that can, with high certainty, be detected andmeasured. International Radio Consdltative Committee (CCIR) Annex 7-I notesthat the smallest detectable change
depends on the bandwidth used for th'i observition, on the total effectivenoise temperature of the radiometer and .ntenna, and on the length of timeover which the power in a single observation is integrated. In simpleterms, the most sensitive observatious are those made with the smallestsystem noise temperature, the largest bandwidth and the longest integrationtimes. Good techniques can reduce the system temperature, integrationtimes of a large fraction of a day can be used if the telescope tracks thesource, but the bandwidth must be chosen to suit the experiment. Forexample, when an observation of a source spectrum is needed, and it isbelieved that the spectrum is regular, operation with large bandwidths andfor long integration times is feasible when no harmful interference ispresent, with consequent increase in sensitivity. But when the spec~rm• ofa fairly narrow line is being observed, the fine detail in the spectruTr mayonly be observable if a narrow bandwidth is used; such observations arethen less sensitive.
219
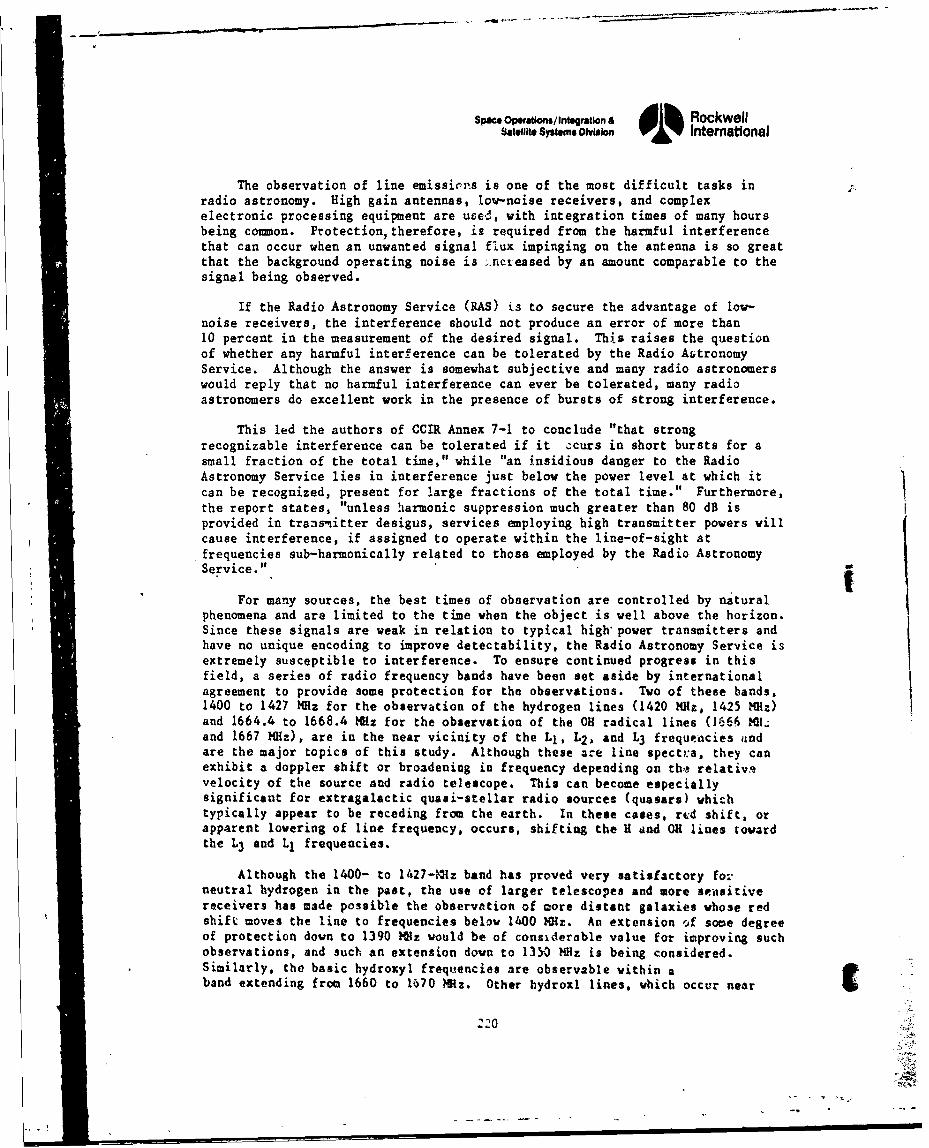
Space Opeatlons/Inliegrallon & di RockwellSatellte SySSs Dision 01% International
The observation of line emissions is one of the most difficult tasks inradio astronomy. High gain antennas, low-noise receivers, and complexelectronic processing equipment are used, with integration times of many hoursbeing common. Protectiontherefore, is required from the harmful interferencethat can occur when an unwanted signal flux impinging on the antenna is so greatthat the background operating noise is .ncteased by an amount comparable to thesignal being observed.
If the Radio Astronomy Service (RAS) is to secure the advantage of low-noise receivers, the interference should not produce an error of more than10 percent in the measurement of the desired signal. This raises the questionof whether any harmful interference can be tolerated by the Radio AbtronomyService. Although the answer is somewhat subjective and many radio astronomerswould reply that no harmful interference can ever be tolerated, many radioastronomers do excellent work in the presence of bursts of strong interference.
This led the authors of CCIR Annex 7-1 to conclude "that strongrecognizable interference can be tolerated if it zcurs in short bursts for asmall fraction of the total time," while "an insidious danger to the RadioAstronomy Service lies in interference just below the power level at which itcan be recognized, present for large fractions of the total time." Furthermore,the report states, "unless harmonic suppression much greater than 80 dB isprovided in transmitter designs, services employing high transmitter powers willcause interference, if assigned to operate within the line-of-sight atfrequencies sub-harmonically related to those employed by the Radio AstronomyService."
For many sources, the best times of observation are controlled by naturalphenomena and are limited to the time when the object is well above the horizon.Since these signals are weak in relation to typical high'power transmitters andhave no unique encoding to improve detectability, the Radio Astronomy Service isextremely susceptible to interference. To ensure continued progress in thisfield, a series of radio frequency bands have been set aside by internationalagreement to provide some protection for the observations. Two of these bands,1400 to 1427 MHz for the observation of the hydrogen lines (1420 M1z, 1425 MHz)and 1664.4 to 1668.4 Mz for the observation of the O radical lines (1666 MH.Land 1667 MHz), are in the near vicinity of the L1 , L2 , and L3 frequencies andare the major topics of this study. Although these are line spectr:a, they canexhibit a doppler shift or broadening in frequency depending on th,& relativtvelocity of the source and radio telescope. This can become especLallysignificant for extragalactic quasi-stellar radio sources (quasars) whichtypically appear to be receding from the earth. In these cases, red shift, orapparent lowering of line frequency, occurs, shifting the H and OR lines towardthe L3 and LI frequencies.
Although the 1400- to 1427-Mz band has proved very satisfactory forneutral hydrogen in the past, the use of larger telescopes and more seasitivereceivers has made possible the observation of more distant galaxies whose redshift moves the line to frequencies below 1400 MHz. An extension of some degreeof protection down to 1390 Mlz would be of considerable value for inproving suchobservations, and such an extension down to 1350 WIz is being considered.Similarly, the basic hydroxyl frequencies are observable within aband extending from 1660 to 1570 Miz. Other hydroxl lines, which occur near
220
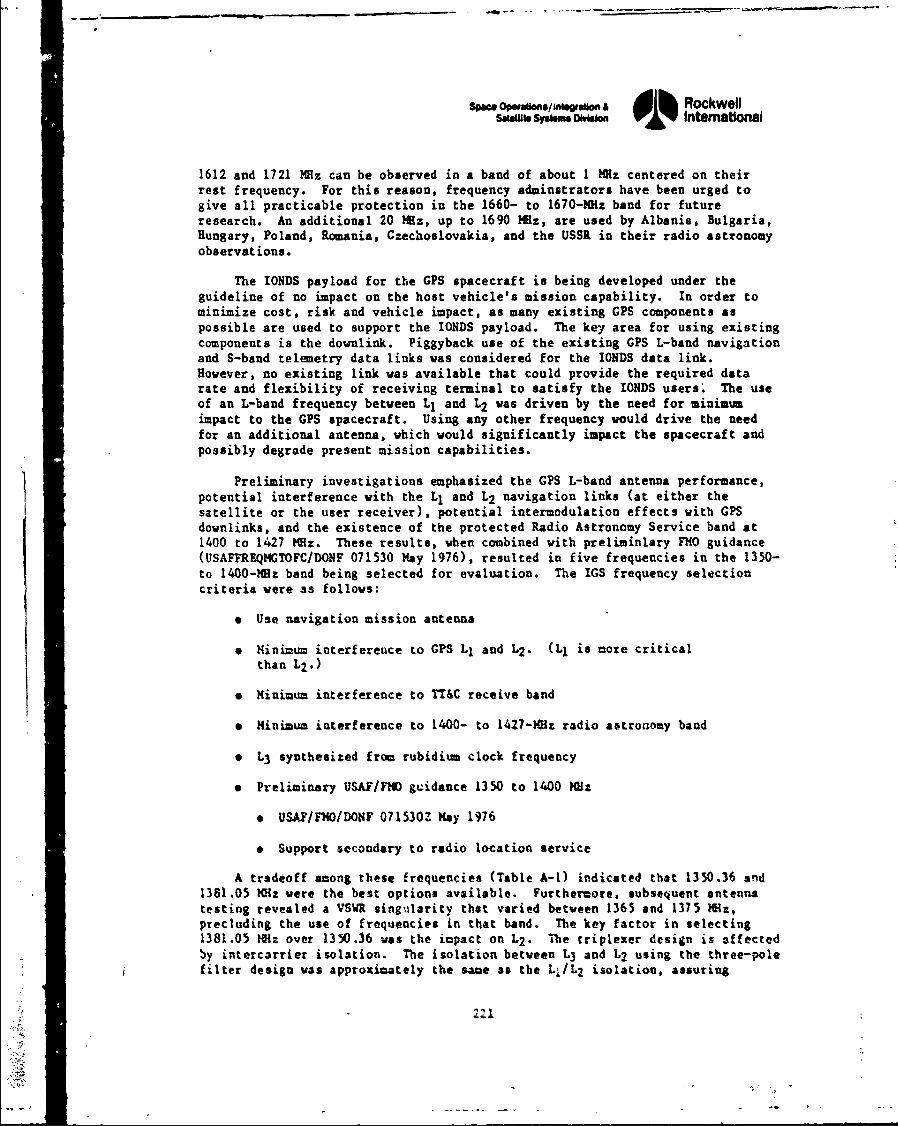
Spceop n•/tuic & ILRockwell9-MWs sys.. OWuim 0V'% IntematinlaI
1612 and 1721 M•z can be observed in a band of about 1 M0z centered on theirrest frequency. For this reason, frequency adminstrators have been urged togive all practicable protection in the 1660- to 1670-MHz band for futureresearch. An additional 20 Mlz, up to 1690 MHz, are used by Albania, Bulgaria,Hungary, Poland, Romania, Czechoslovakia, and the USSR in their radio astronomyobservations.
The IONDS payload for the GPS spacecraft is being developed under theguideline of no impact on the host vehicle's mission capability. In order tominimize cost, risk and vehicle impact, as many existing GPS components aspossible are used to support the IONDS payload. The key area for using existingcomponents is the downlink. Piggyback use of the existing GPS L-band navigationand S-band telemetry data links was considered for the IONDS data link.However, no existing link was available that could provide the required datarate and flexibility of receiving terminal to satisfy the IONDS users' The useof an L-band frequency between Ll and L2 was driven by the need for minimumimpact to the GPS spacecraft. Using any other frequency would drive the needfor an additional antenna, which would significantly impact the spacecraft andpossibly degrade present mission capabilities.
Preliminary investigations emphasized the GPS L-band antenna performance,potential interference with the 1. and L2 navigation links (at either thesatellite or the user receiver), potential intermodulation effects with GPSdownlinks, and the existence of the protected Radio Astronomy Service band at1400 to 1427 MHz. These results, when combined with preliminlary FMO guidance(USAFFREQHGTOFC/DONF 071530 May 1976), resulted in five frequencies in the 1350-to 1400-10z band being selected for evaluation. The IGS frequency selectioncriteria were as follows:
"* Use navigation mission antenna
"* Minimum interference to GPS L1 and L2. (LI is more criticalthan L2 .)
* Minimum interference to TT&C receive band
* Minimum interference to 1400- to 1427-M0z radio astrocomy band
* L3 synthesized from rubidium clock frequency
* Preliminary USAF/FNO guidance 1350 to 1400 10*:
* USAF/FMO•/DONF 071530Z May 1976
* Support secondary to radio location service
A tradeoff among these frequencies (Table A-0) indicated that 1350.36 and1381.05 MHz were the best options available. Furthercore, subsequent antennatesting revealed a VSR singularity that varied between 1365 and 1375 Ma1,precluding the use of frequencies in that band. The key factor in selecting1381.05 1z over 1350.36 was the iopact on L2 . -the triplexer design is affectedby intercarrier isolation. The isolation between L3 and L2 using the three-polefilter design was approxlately the sane as the L1/L2 isolation, assuring
42
SPO Opra/I•nwlr on a, 81w1 Rockwells"Ule s61WS MO~M 01% nternatonml
Table A-1. Frequency Selection Summary
L1 L2 TT&C SynthesizerIsolation Isolation Interference Mechanization
Candidate Fc (39 dB) (39 dB) (1783.84 MHz) 10.23 Ratio
1381.05 Mlz -51 dB -44 dB 1769.79 Mlz 135
1375.935 MHz -52.5 dB -42 dB 1774.90 MRz 134.5
1370.82 Hfz -54.5 4B -40.5 dB 1780.02 MHz 134
1364.0 MHz -55.5 dB -38 dB 1785.84 MRz 133-1/3
1350.36 MHz -57 dB -30.5 dB 1800.84 Ml:z 132
Note: Subsequent antenna testing identified VSWR singularity whichessentially precludes use of 1365-1375 Mlz band
minimal L3 impact on the navigation mission. The isolation at 1350.36 wasalmost 10 dB less than the -39-dB criteria that had been selected based on theGPS design to assure no impact on user equipment. Although 1381.05 MHz resultedin a signal level approximately 14 db higher in the 1400- to 1427-Mz region,discussions with radio astronomers in the Los Angeles area indicated that theinfrequent, short IONDS transmissions should provide negligible interference."½ addition. a radio astronomy band filter should bring the L3 signal level.below the -238 dBW/m2 /Hz criteria used in th'i GPS design. Similarly, frequencysynthesis was not a major factor since 1381.05 and 1350.36 MHz are equallyimplementable. Using a frequency in the 1240- to 1290-MIz band was consideredas requested (UqAFFRE )TOFC Wash DC/FHO 3010OZ June 1977) but is nottechnically feasible because of its probable impact on L2.
The L3 selection process is outlined as follows:
* Five frequencies in preliminary guidance range
* Only 1381.05 McI has attenuation at Ll and L2 equal to or better than Llat L2 and L2 at LI
* 1350.36 M•z puts least energy in TT&C band. 1381.05 M•I nearly as good
* 1350.36 MI: puts least energy in 1400- to 1420-HI: band. 1381.05 MI:approximately 14 dB above radio astronomy threshold
* ITT proposes five-pole L3 filter for radio astronomy protection ('14-di
protection). Minor triplexer weight change. 1-dB L3 impact
* 1381.05 and 1350.36 ,llz equally synthesizable
Since the compatibility testing compieted in August 1977 indicates there isno interference between the c-arrant 1381.05-MI: L3 and the existing 1227.6-161z L2 downlinks, the use of 1350.36 MI: may be more technically feasible than law"
1~~1
Space Operations/Integration & RockwellSatellite Systems Division Internatlonal
analytically estimated. The effort to validate the feasibility of using 1350.36MHz would appear appropriate if the use of that frequency would significantlyreduce lh~itations on the use of IONDS which would be imposed for 1381.05 MHz.Eliminating restrictions that would require a change in frequency after arelatively short time (i.e., 5 to 10 years) and/or effectively preclude thescientifiz community from deliberately using the system to observe severeweather may be worthy of consideration. Use of the 9ystem in a scientificlightning mode could result in 10 or more random triggers per day during certainweather conditions.
The IONDS system is designed to be dormant unless an event triggers thesensor system. The spacecraft system is being sized to permit up to 60 minutesof transmission per orbit under extreme (i.e., war) conditions. Normaloperations would consist of scheduled calibration commanded from ContinentalU.S. (CONUS) ground stations and random triggers due to natural (i.e., lightning"superbolt") events. Memory for readout at prescbeduled times for I to5 minutes in CONUS may also be expected about once a week. Precoordinated testsof satellites in CONUS which would involve transmission periods of 60 to90 minutes may be requested several times during the first few years ofoperation.
The predominate source of random triggers will be lightning "superbolts"which have been observed by similar sensors on the VELA and other satellites.The IONDS sensors will have multiple trigger criteria that will be bothautomated and selectable by command to control the random false trigger rate asnear to zero as possible. The VELA satellite system with its unique worldwidefull-time observation capability has recorded a large number of terrestriallightning signals each year. A small number of these, estimated to be 10-8 ofthe %orldwide flash rate of about 100 per second, could potentially cause randotitriggers that would not be rejected by trigger logics. Since there is a largeprobability that the direct line-of-sight between the satellite and thelightning flash will be obscured by clouds, the satellites would detect only afraction of the lightning flashes. This fraction has been estimated from thenumber of single- and dual-satellite lightning observations in which two VELAsatellites were within view of the lightning stroke.
From the ratio of dual- and single-satellite detections, one can estimatethat only 20 percent of these intense lightning strokes will be detected by thesatell~te system. Since the VELA data indicates the number of superboltsgene-a.!d per year to be about 25, there should be less than one superbolt perweek that will generate random triggers even if the IONDS trigger rate is afactor of two or so greater than VELk. Also, since the VELA data indicates onlya 0.2 probab 'ility of a dual observation, only one of the four to six GPSsatellites that would be within the appropriate zenith angle of the lightning islikely to observe the bolt. Although these superbolts have been detectedworldwide, their most frequent occurrence is over Japan and the northeastPacific Ocean. They are located in regions of strong convective activity andhave been correlated with severe thunderstorms.
STUDY OVERViEW
The Rockwell investigation was conducted to ascertain the magnitude of
potential interference introduced by the three GPS SV modulated carriers (LI,
223
Space Operatlons/Integration & RockwellSatellite Systems Division oi% International
L2 , and L3 ) into the two radio astronomy bands allocated worldwide. Theoreticalspectrum power density levels referred to the earth's surface were calculatedbased on GPS transmissions and compared to harmful radio astronomy interferencelevels as defined by CCIP. Annex 7-1. Actual spectral measurements made on theEngineering Test Vehicle (ETV) confirmed these computations.
Results indicated that both LI and L3 exceed CCIR levels. Of these, the L3spectrum is of most conce--n since the calculated power levels within the radioastronomy bands can significantly exceed the desired minimum level if nospecific filtering for the 1400- to 1427-MHz radio astronomy band is used. Thispotential detrimental effect of L3 interference on the radio astronomy data isnot only a function of the instantaneous energy levels, but also a function ofthe interference duty cycle (i.e., interference in band time to radio astronomyintegration). Since less than five minutes of L3 transmission per day persatellite, including both the normal and tebt and calibration modes is planned,L3 interference is not expected to affect radio astronomers, who integrate overlong periods of time.
In the event this is unsatisfactory to the RAS, two approaches to reducepower density, on a worst-case basis, below the specified harmful interferencelevels were pursued. They included using either an in-line eight-pole bandreject filter or modifying the triplexer L3 bandpass filter from a three- to afive-pole design for increased seleqtivity. The possibility of shifting thefilter center frequency down from 1381.05 MHz to a point where the filter skirtsreduce the 1400- to 1427-•z spectral energy to the desired level was alsoconsidered. Since this approach must be consistent with maintaining specifiedcode track sensitivity, experimental test data using a tunable five-pole filter !was taken to demonstrate that sufficient tracking sensitivity could bemaintained.
All three frequencies have received developmental approval. The GPS L1 andL2 navigation frequency assignment notifications, AF Forms 135, were transmittedto Rockwell on December 29, 1975, providing authority to radiate. Tle IGS L3
frequency of 1381.05 + 12 MHz was approved for developmental use by the MilitaryCommunications Electronics Board (MCEB), Joint Frequency enclosure 12/4607 onNovember 16, 1977. However, this approval of L3 requires a coordinated test ofthe first- IONDS/GPS vehicle with the Radio Astronomy Service to confirm minimalinterference exists. To date, the L3 transi-Itter has been operated at fullpower with the Navstar antenna only during RF compatibility tests within ashielded anechoic chamber at the Seal Beach Naval Weapons Station (NWS).
REQUIREMENTS
The MCEB approval of the L3 frequency had four stipulations to be metbefore an operational frequency was approved. Two have been met. Based onactual measurements, the maximum L: power flux density at the earth's surfaceshould be -203 dBW/m 2 /Hz which is below the -144 dBW/m 2 /4 KRz (-180 dBW/m 2 /Hz)level specified to aid in coordination with other nations. Furthermore, the L3RF downlink hardware is compliant with MIL-STD-461A. The spurious emission,which was the primary concern, of -73 dBc at the transmitter output is wellwithin the -68.76 dBc (-57 dBW with 11.76 dBW transmitter) requirement, and isfurther reduced to -119 dBc by the triplexir filtering. A third stipulation, anECAC survey of potential interference, is in progress and should be completed by
224
-I'jrrIlll ll rrIr ll llll I1nlI'JI ' 1T!r I!I!I
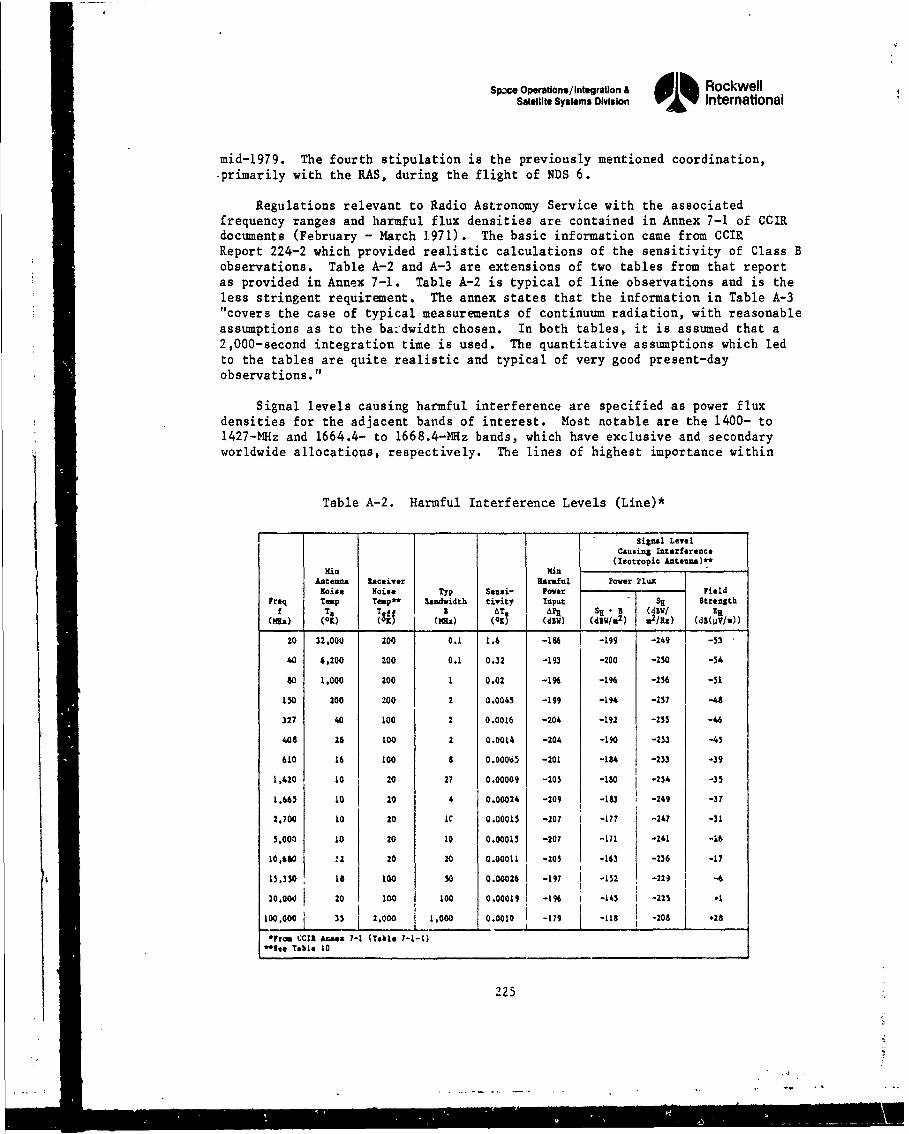
Space Operations/Integration & dlh RockwellSatellite Systems Division International
mid-1979. The fourth stipulation is the previously mentioned coordination,-primarily with the RAS, during the flight of NDS 6.
Regulations relevant to Radio Astronomy Service with the associatedfrequency ranges and harmful flux densities are contained in Annex 7-1 of CCIRdocuments (February - March 1971). The basic information came from CCIRReport 224-2 which provided realistic calculations of the sensitivity of Class Bobservations. Table A-2 and A-3 are extensions of two tables from that reportas provided in Annex 7-1. Table A-2 is typical of line observations and is theless stringent requirement. The annex states that the information in Table A-3"t1covers the case of typical measurements of continuum radiation, with reasonableassumptions as to the ba:dwidth chosen. In both tables, it is assumed that a2,000-second integration time is used. The quantitative assumptions which ledto the tables are quite realistic and typical of very good present-dayobservations."
Signal levels causing harmful interference are specified as power fluxdensities for the adjacent bands of interest. Most notable are the 1400- to1427-MHz and 1664.4- to 1668.4-MHz bands, which have exclusive and secondaryworldwide allocations, respectively. The lines of highest importance within
Table A-2. Harmful Interference Levels (Line)*
Signal LevelCausing Interference
i m K (Isotropic Antenna)-*
Antenna Receiver Harmful Power riuxNoise Noise Typ Sensi- Power Field
Freq Tamp Teaps Bandwidth tivity Input H StreosthT ,a T.f S AT AP sR•s (dW/ 3H(mil) (oK) *$2• oi dY ( V,) g/11) (dB(11V/U))
20 32,000 200 0.1 1.6 -186 -199 -249 -53
40 6.200 200 0.1 0.32 -193 -200 -250 -54
80 1.000 200 1 0.02 -1% -16 -256 -51
150 200 z00 2 0.0045 -199 -194 -257 -48
327 40 100 2 0.0016 -204 -192 -255 -46
408 26 100 2 0.0014 -204 -190 -253 -45
610 16 100 8 0.00005 -201 -184 -253 -39
1,420 10 20 27 0.00009 -205 -160 -254 -35
1,65 10 20 4 0.00024 -209 -183 -249 -37
2,700 10 20 11 0.00015 -207 1 -177 -247 -31
S.000 10 20 10 0.00015 -207 -171 -241 -16
10.660 .2 20 20 0.00011 -205 -163 -236 -17
5.3SO 16 100 so 0.00026 -197 -152 -22B -.30,00N j 20 1 00 100 0.0019 -19 1 -145 -225 -1
I -16 -45 -2
12,000 35 2,000 1.000 0.0010 -179 [ -118 -208 -28
*From CIC Annex 7-1 (Table 7-1-I)'See Table 10
225
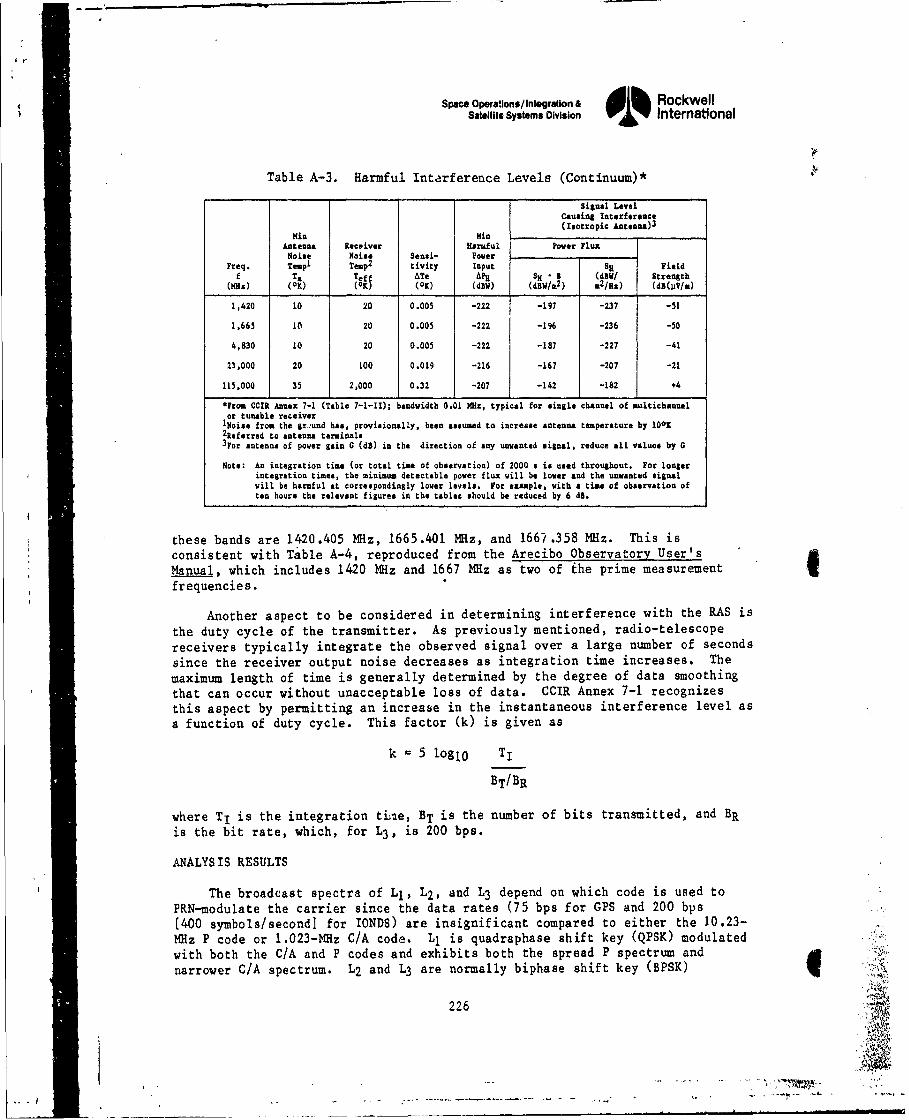
Space Operatlons/Integration & RockwellSatellite Systems Division oi% Intemational
Table A-3. Harmful Interference Levels (Continuum)*
Signal LevelCausing Interference
(Isotropic Anteanna)3
Mil IinAntenna Receiver Harmful Power FluxNoise Noise Sensi- Power
Freq. Tempi Temp2
tivity Input SF field
f Ta Teff ATe AP S(H • (dBW/ Strength(H () (-K(oK) (OK) (dw) (dBW/m
2) a1
/Hg) (dB(uV/m)
1,420 10 20 0.005 -222 -197 -237 -51
1,665 10 20 0.005 -222 -19% -236 -50
4,830 10 20 0.005 -222 -187 -227 -41
23,000 20 100 0.019 -216 -167 -207 -21
115,000 35 2,000 0.32 -207 -142 -182 +4
*From CCIR Annex 7-1 (Table 7-1-I); bandwidth 0.01 MNz, typical for single channel of multichannel
or tunable receiver'Noise from the gr..und has, provisionally, been assumed to increase antenna temperature by lOoK2Referred to antenna terminals3
For antenna of power gain G (dG) in the direction of any unwanted signal, reduce all values by G
Note: An integration time (or total time of observation) of 2000 a is used throughout. For longerintegration times, the minimum detectable power flux will be lover and the unwanted signal
will be harmful at correspondingly lower levels. For example, with a time of observation of
ten hours the relevant figures in the tables should be reduced by 6 dg.
these bands are 1420.405 MHz, 1665.401 MHz, and 1667.358 MHz. This isconsistent with Table A-4, reproduced from the Arecibo Observatory User'sManual, which includes 1420 MHz and 1667 MHz as two of the prime measurementfrequencies.
Another aspect to be considered in determining interference with the RAS isthe duty cycle of the transmitter. As previously mentioned, radio-telescopereceivers typically integrate the observed signal over a large number of secondssince the receiver output noise decreases as integration time increases. The
maximum length of time is generally determined by the degree of data smoothingthat can occur without unacceptable loss of data. CCIR Annex 7-1 recognizesthis aspect by permitting an increase in the instantaneous interference level asa function of duty cycle. This factor (k) is given as
k = 5 logl 0 TI
BT/BR
where T, is the integration tiiie, BT is the number of bits transmitted, and BR
is the bit rate, which, for L3 , is 200 bps.
ANALYSIS RESULTS
The broadcast spectra of LI, L2 , and L3 depend on which code is used toPRN-modulate the carrier since the data rates (75 bps for GPS and 200 bps[400 symbols/second] for 10NDS) are insignificant compared to either the 10.23-MHz P code or 1.023-MHz C/A code. L1 is quadraphase shift key (QPSK) modulatedwith both the C/A and P codes and exhibits both the spread P spectrum andnarrower C/A spectrum. L2 and L3 are normally biphase shift key (BPSK)
2264•
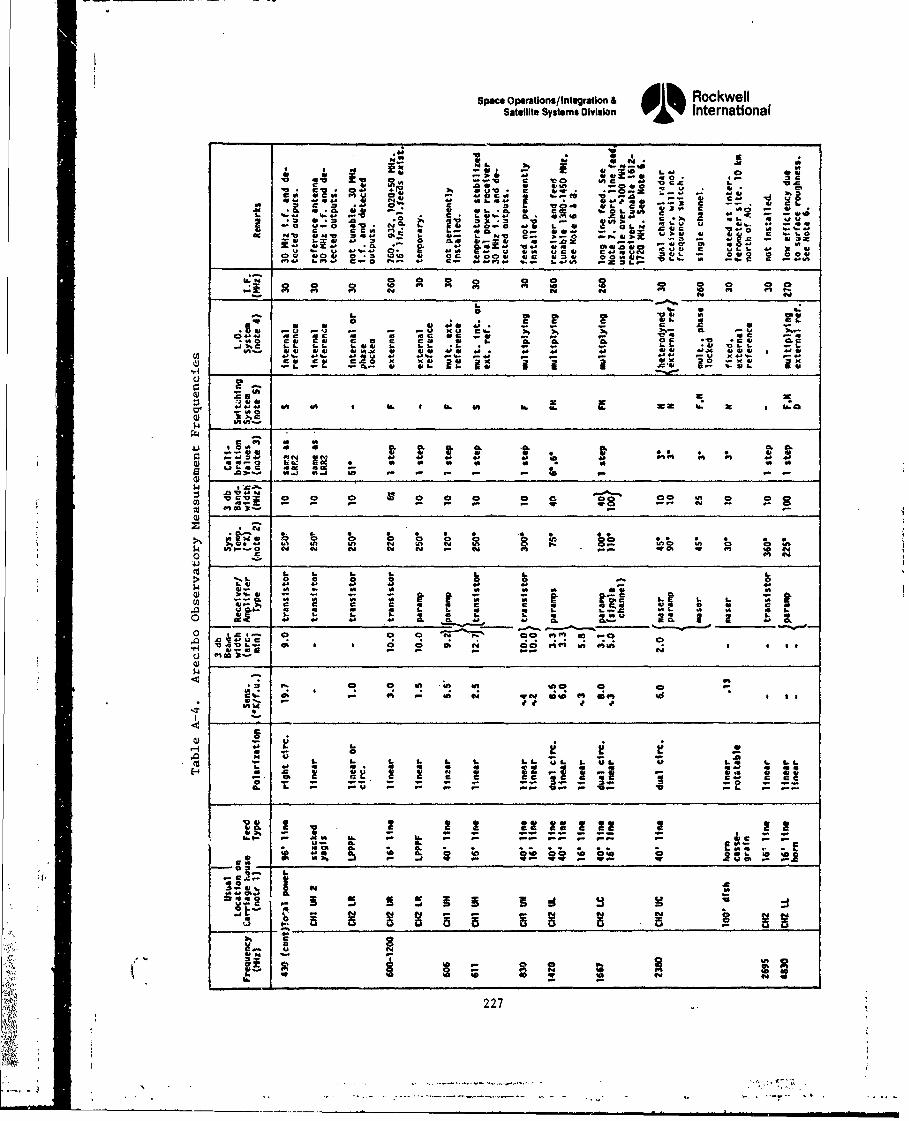
Space Operations/integration & dbRockwellSatellite Systems Divsion oInternational
Z, V
1 -4
14 p.S T. 9a.. 41 *- I4~~ ro ý W ,j Z o4
C W.06 40 V' x4* 40 1 A
-C~S C 0,~ L -. u
ft. 4L 'V 4.m 0 4 3? & 3',ta V *. 0 oo = '04, 4S CC,
V .-. 4 .- o 0. a 0 14
l 460 0 0 10
N on fS.d
4164 4b.
j . C 10,
-j zc Li.0 Li. i.1-s S. LI. *L . - - Li. .41 -i~ L4.V 1IM 4 4. ?1 44 t!." 4P44 V .4
414 -.. 4.U! VIC 4.4 . .4..
4V An, 54, 3.5 56 11 U.13 3C 1 3
24, MqY4 VS.ULU4, 5's a
0) 0
C - C
C W
sea *. 16 0.1 . 0.6
4.1 436 .0i
P10~'!!. -
0 0 bb
00 r . 041 4P 0 0
L. I S. .S4-.az -0 L. L. 01 L. 16 16 L
X~ 4' Wo -2 4.- - -. -4
.- ~. C C a C C a e.E 34 3 4 C C
0 -r-~ or 0 CI* -
a 0-
o MleT)
U2, -WE 2
a. * . . . . 227C
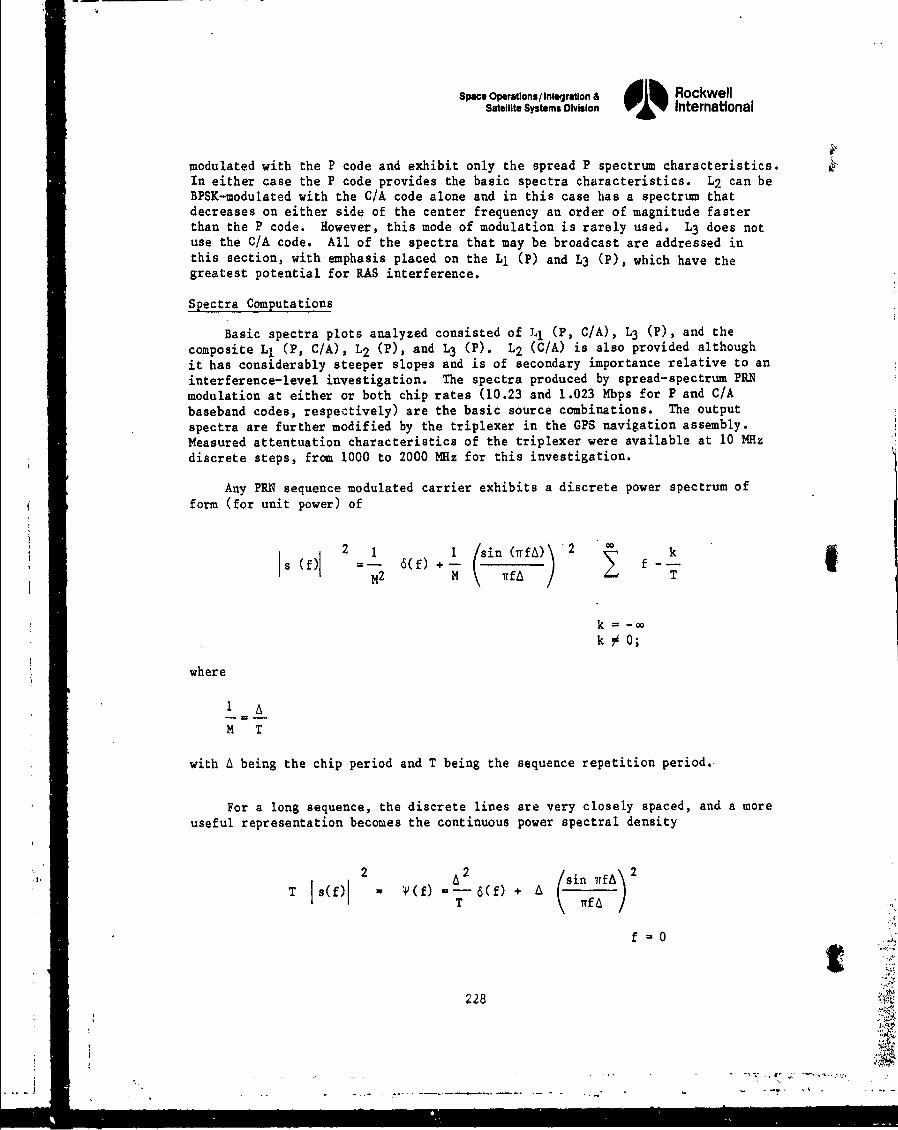
Space Operations/ Integration & dJI RockwellSatellite Systems Division W01 International
modulated with the P code and exhibit only the spread P spectrum characteristics.In either case the P code provides the basic spectra characteristics. L2 can beBPSK-modulated with the C/A code alone and in this case has a spectrum thatdecreases on either side of the center frequency an order of magnitude fasterthan the P code. However, this mode of modulation is rarely used. L3 does notuse the C/A code. All of the spectra that may be broadcast are addressed inthis section, with emphasis placed on the L1 (P) and L3 (P), which have thegreatest potential for RAS interference.
Spectra Computations
Basic spectra plots analyzed consisted of L1 (P, C/A), L3 (P), and the
composite L1 (P, C/A), L2 (P), and L3 (M). L2 (C/A) is also provided although
it has considerably steeper slopes and is of secondary importance relative to an
interference-level investigation. The spectra produced by spread-spectrum PRNmodulation at either or both chip rates (10.23 and 1.023 Mbps for P and C/A
baseband codes, respectively) are the basic source combinations. The output
spectra are further modified by the triplexer in the GPS navigation assembly.
Measured attentuation characteristics of the triplexer were available at 10 MRz
discrete steps, from 1000 to 2000 MHz for this investigation.
Any PRN sequence modulated carrier exhibits a discrete power spectrum ofform (for unit power) of
2 11 2si 00) kIi s 0 1 - (f) + - f~* ,,-
M2 M k IvfA T
k -oo
k 0;
where
1 A
M T
with A being the chip period and T being the sequence repetition period.
For a long sequence, the discrete lines are very closely spaced, and a moreuseful representation becomes the continuous power spectral density
2 -2 fsin 2fA)
T I sAf)l T f
f =0
228I
---. '
Space Operations/Integratlon & RockwellSatellite Systems Division 2l International
For practical purposes, theA2 6(f) is ignored and the spectrum runs
continuously through f - 0, using 0(f) ( sin ifA , watts/Hz, for unit'rrf A/
power.
In multiple source cases, the combined spectrum is written as
IP~f 2 ~ P~~A~j(_sin 7T (f-fi)_A 2•(•)=PijAij~j
i WTf \-(-f fi f
where
fi is the ith carrier
Aj is the jth chip period
Pij is the source power
Aij is the attenuation, including antenna gain
Spectral plots were computed for the configurations listed in Table A-5using a navigation antenna gain of 12 dB. The spatial spreading loss,
was 157 dB (R = 2 x 10⁷ meters).
Table A-5. Carrier/Code Configurations
Figure Carrier, Code Power Level
A-i, A-5 LI (P, C/A) 15.85 W, 12 dBW (P)39.81 W, 16 dBW (CIA)
A-6 L2 (P) 10 W
A-9 L2 (C/A) 10 W
A-2, A-10 L3 (P) 17 W
A-l1 L3 (C/A) 17 W
A-12 Li + L2 (P)
"A-3 L1 + L2 (P) + L3 (P)
A-13 Li + L2 (P) + L3 (C/A)
Li 1575.42 MHz L2 = 1227.6 MHz L3 = 1381.05 MHz
229
..--- ~ ____ - - - - -o
Space Operations/Integration & RockwellSatellite Systems Division oi% International
Triplexer attenuation values were interpolated from the discrete networkanalyzer measured values shown in Table A-6 (refer to Figure A-i).
The LI bandpass, L2 bandpass, and bandstop filter characteristics areidentical for the current GPS diplexer and the GPS/IONDS triplexer. The L3bandpass filter is unique to the triplexer.
Figure A-2 shows the combined L1 (P, C/A) plus L2 (P) spectrum radiatedfrom the GPS satellites for the basic navigation mission. The CCIR requirementsfor the 1420-MHz and 1665-MHz bands are provided for reference. This spectrumis a combination of the individual L1 and L2 spectra shown in Figures A-3 and A-4. The 1750-MHz to 1825-MHz notch in the spectrum is generated by the triplexer
Table A-6. Discrete Triplexer Values
Insertion Loss (d0) Insertion Loss (dW)Frequency - Frequency
(MHSz J1 to J4 J2 to J4 J3 to J4 (MB:) Jl to 4 J2 to J4 J3 to J4
1000 63.19 35.72 71.27 1530 0.71 40.94 44.311010 57.11 33.00 65.77 1540 0.66 40.67 44.981020 58.99 30.48 67.40 1550 0.53 40.86 45.721030 56.03 29.02 64.11 1560 0.46 40.74 47.011040 54.01 28.08 60.71 1570 0.50 41.57 48.151050 53.97 26.90 60.69 1580 0.54 42.06 49.221060 54.70 24.85 70.52 1590 0.48 43.17 50.331070 53.79 22.07 68.76 1600 0.41 44.13 51.411080 53.29 19.05 61.28 1610 0.41 45.01 54.941090 51.15 16.78 62.00 1620 0.52 45.92 54.591100 51.52 15.22 60.92 1630 0.61 47.12 56.461110 49.89 13.22 58.44 1640 0.77 48.42 59.69 J I1120 49.60 10.34 56.22 1650 1.43 . 48.10 48.941130 48.88 6.75 56.91 1660 2.99 48.36 60.651140 49.45 3.98 58.23 1670 4.76 47.65 59.201150 52.04 2.30 59.11 1680 6 .22 46.51 59 .251160 56.02 1.85 62.12 1690 7.67 45.08 57.65
1170 53.13 0.91 57.88 1700 9.55 45.07 57.271180 53.54 0.55 59.33 1710 10.92 44.42 57.941190 51.41 0.63 55.59 1720 9.84 41.50 54.611200 50.29 0.67 53.87 1730 7.04 37.17 49.441210 48.88 0.57 53.09 1740 19.89 48.24 59.631220 47.69 0.46 50.50 1750 30.84 58.05 65.821230 47.41 0.40 49.66 1760 42.50 63.35 71.331240 47.46 0.45 47.93 1770 56.71 69.42 71.201250 46.27 0.45 45.90 1780 73.90 74.87 70.701260 46.12 0.51 44.66 1790 64.52 69.17 77.801270 46.80 1.03 43.73 1800 60.75 69.00 81.551280 48.32 2.09 44.36 1810 57.72 81.53 73.731290 49.23 3.08 43.50 1820 52.43 66.89 77.911300 45.14 3.70 38.06 1830 31.80 52.25 68.771310 40.27 4.64 30.68 1840 36.03 55.98 71.011320 36.85 6.36 24.51 1850 36.43 55.42 66.831330 34.52 8.14 18.63 1860 35.56 53.92 72.211340 31.63 9.22 11.73 1870 34.96 52.23 65.431350 30.14 11.25 4.90 1880 35.46 52.21 67.081360 33.12 17.41 1.87 1890 36.08 52.53 61.241370 34.03 21.74 0.78 1900 36.24 52-83 72.641380 31.96 22.79 0.49 1910 36.13 51.76 67.361390 29.81 23.68 0.58 1920 36.51 52.58 64.821400 28.13 25.03 0.77 1930 38.14 52.74 67.751410 30.59 30.47 2.23 1940 39.60 53.70 68.931420 35.68 38.76 5.30 1950 40.48 $3.35 65.691430 23.93 30.35 8.24 1960 40.84 52.90 63.711440 17.99 27.45 11.73 1970 41.45 54.94 68.921450 15.02 27.70 16.19 1980 42.42 54.74 64.621460 12.30 28.42 20.06 1990 43.60 56.62 65.551470 9.25 29.15 23.30 2000 45.58 58.60 71.681480 6.55 30.54 26.681490 4.93 33.40 31.251500 3.55 37.37 36.60 41510 2.04 40.93 41.421520 0.97 41.67 44.04
230
•J
Space Operstions/Intqration & I RockwellSatellite Systems Division International
L1 Input
I J
-N Triplee12 input Otu
toJ3 * Antenna
L3 Input
Figure A-I. Triplexer Diagram
-189
1420 M z 1665 MHz LI (10, C/A) .•2 (P)
I 10 K~x BANDWIDTHREQUIREMENT UVEL
I- AI. , ,27MM:
I1 REQUIREMENT LEVEL
1000 i00sm0FREQUENCY W1H
Figure A-2. Ll, L2 Spectra Plot
231
-A-
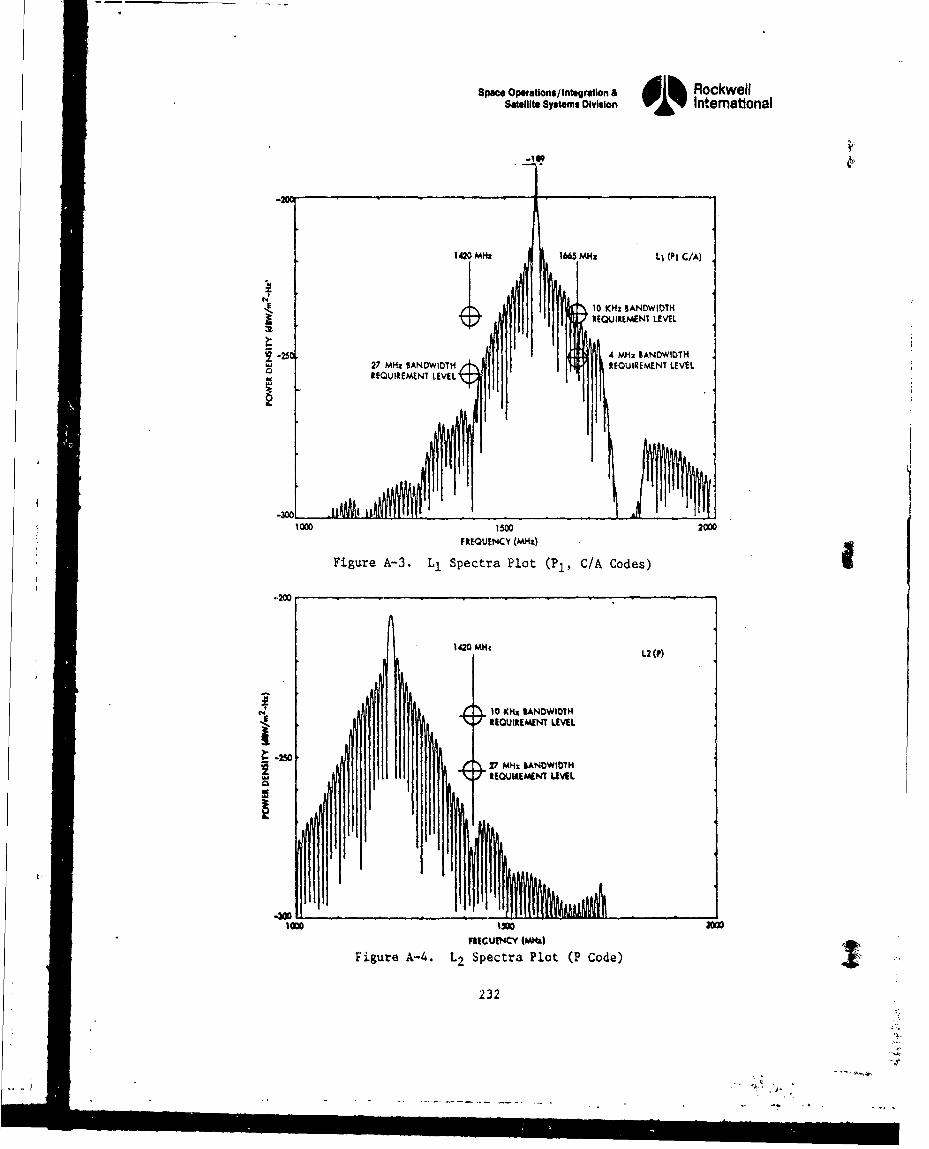
Space Operations/Integration & RockwellSatellite Systems Division 01% Intemational
JE 10 KHz BANDWIDTHREQUIREMENT LEVEL
S-250. 4 MHz BANDWIDTH
27 MHz BANDWIDTH REQUIREMENT LEVELREQUIREMENT LEVEL
1000 1500 2000FREQUENCY (MHX)
Figure A-3. Ll Spectra Plot (Pl, C/A Codes)
'.200
1420 MHt L2(P)
10 -K44 &ANOWIOTH4 R EQUIREMENT LEVE.L
-20V27 MHz IANAWI0TH
1EQUME/ANT LEVIEL
1100 two am
FIECUENICY |uI~) •
Figure A-4. L2 Spectra Plot (P Code)
232
-•.
I • lll lllllll'l 11 '--. '
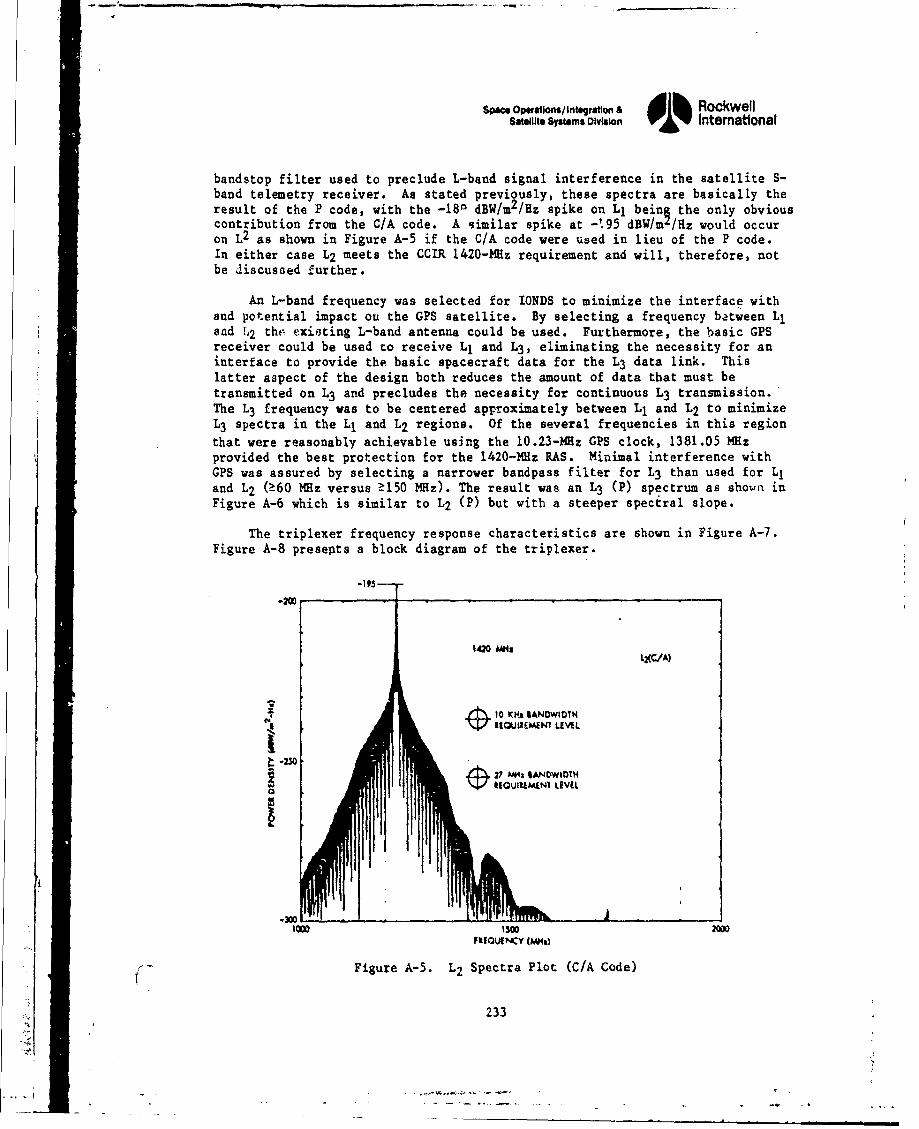
Space Operationslintagrotio & RockwellSatellite Systems ODvision 01% International
bandstop filter used to preclude L-band signal interference in the satellite S-band telemetry receiver. As stated previously, these spectra are basically theresult of the P code, with the -180 dBW/m 2 /Hz spike on L1 being the only obviouscontribution from the C/A code. A similar spike at -195 dBW/mn/Hz would occuron L2 as shown in Figure A-5 if the C/A code were used in lieu of the P code.In either case L2 meets the CCIR 1420-MHz requirement and will, therefore, notbe discussed further.
An L-band frequency was selected for IONDS to minimize the interface withand potential impact on the GPS satellite. By selecting a frequency batween LIand *12 the, existing L-band antenna could be used. Furthermore, the basic GPSreceiver could be used to receive L1 and L3 , eliminating the necessity for aninterface to provide the basic spacecraft data for the L3 data link. Thislatter aspect of the design both reduces the amount of data that must betransmitted on L3 and precludes the necessity for continuous L3 transmission.The L3 frequency was to be centered approximately between Ll and L2 to minimizeL3 spectra in the LI and L2 regions. Of the several frequencies in this regionthat were reasonably achievable using the 10.23-M~z GPS clock, 1381.05 MHzprovided the best protection for the 1420-MHz RAS. Minimal interference withGPS was assured by selecting a narrower bandpass filter for L3 than used for L1and L2 (a60 MHz versus Ž150 MHz). The result was an L3 (P) spectrum as shown inFigure A-6 which is similar to L2 (P) but with a steeper spectral slope.
The triplexer frequency response characteristics are shown in Figure A-7.Figure A-8 presents a block diagram of the triplexer.
-195 - -
-2W3
1420 WM4
0t~ 10 PKH& SANDWIDTN'.4 UECUAhMEN7 LEVEL
I!
Vt V. Wx ANOWI.TH
Fk1OIk*WCY (W41)
Figure A-5. L2 Spectra Plot (C/A Code)
233
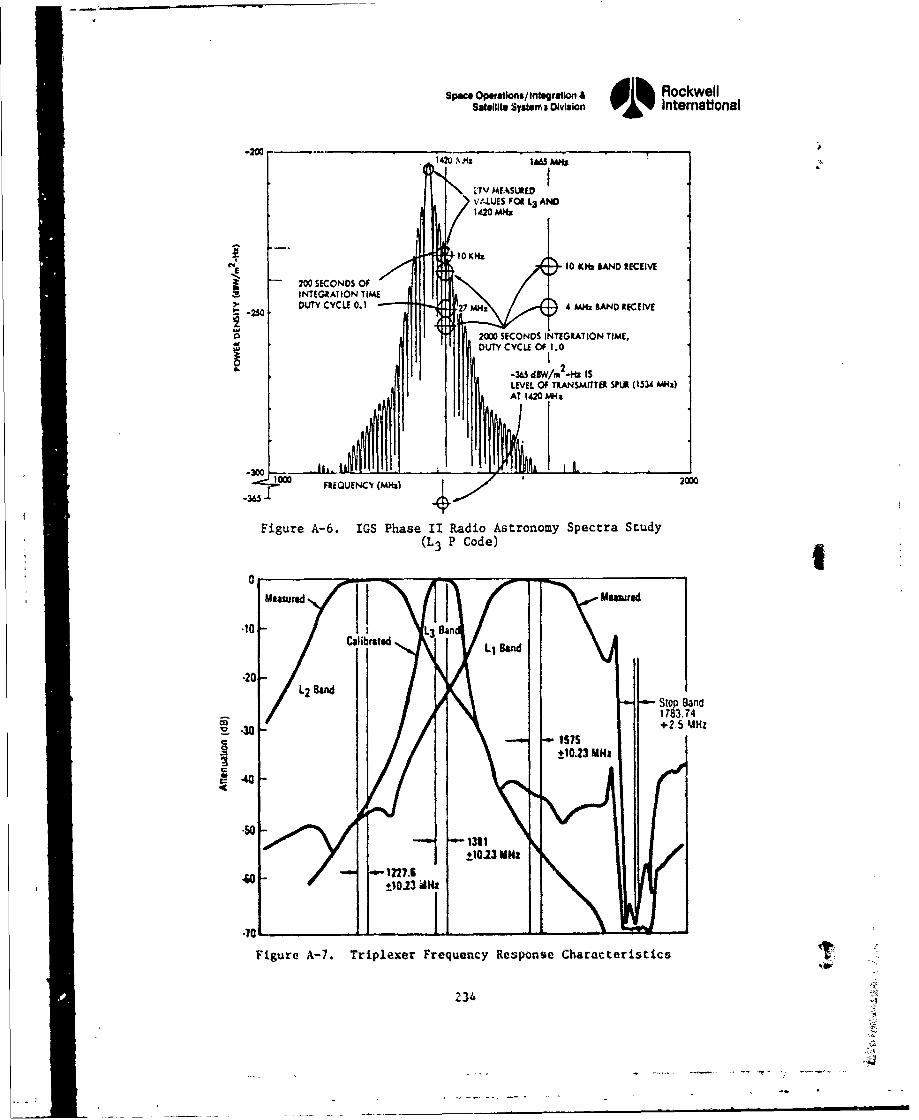
Space Operattons/IntegratIon & RockwellSatellite Systern DiOvision o % International
-200 ----WS142U z I MSi'ts
-TV AAEASIEDVALUES FOi L3 AND
C% f0M 10 KH: IIAND RECEIVE
200 SECONDS OF
3 INTEGRATION TIME
-250 DUTY CYCt 0.I 7 A4 MHz BAND RECEIVE
2000 SECONDS INTEGRATION TIME,DUTY CYCLE OF 1.0
-365 d8W/m -HZ IS
LEVEL OF TRANSMITTER SPLIR (134ý MM:)Ii AT 1420 MW:
"1000 FREQUENCf (M•M) 20D0
Figure A-6. IGS Phase II Radio Astronomy Spectra Study(L3 P Code)
0Measured {.JMeasuredB10n
Calibrated L3 BBn
.20 L2 8andStop Band
san1 783.74+2.5 MHz
S+±10.23 MHz
S4.
-50""1311 •
±1013 MHz
.60 - 127.6
±1023 AHZ
Figure A-7. Triplexer -Figue A7. TiplxerFrequency Response Characteristics
2434
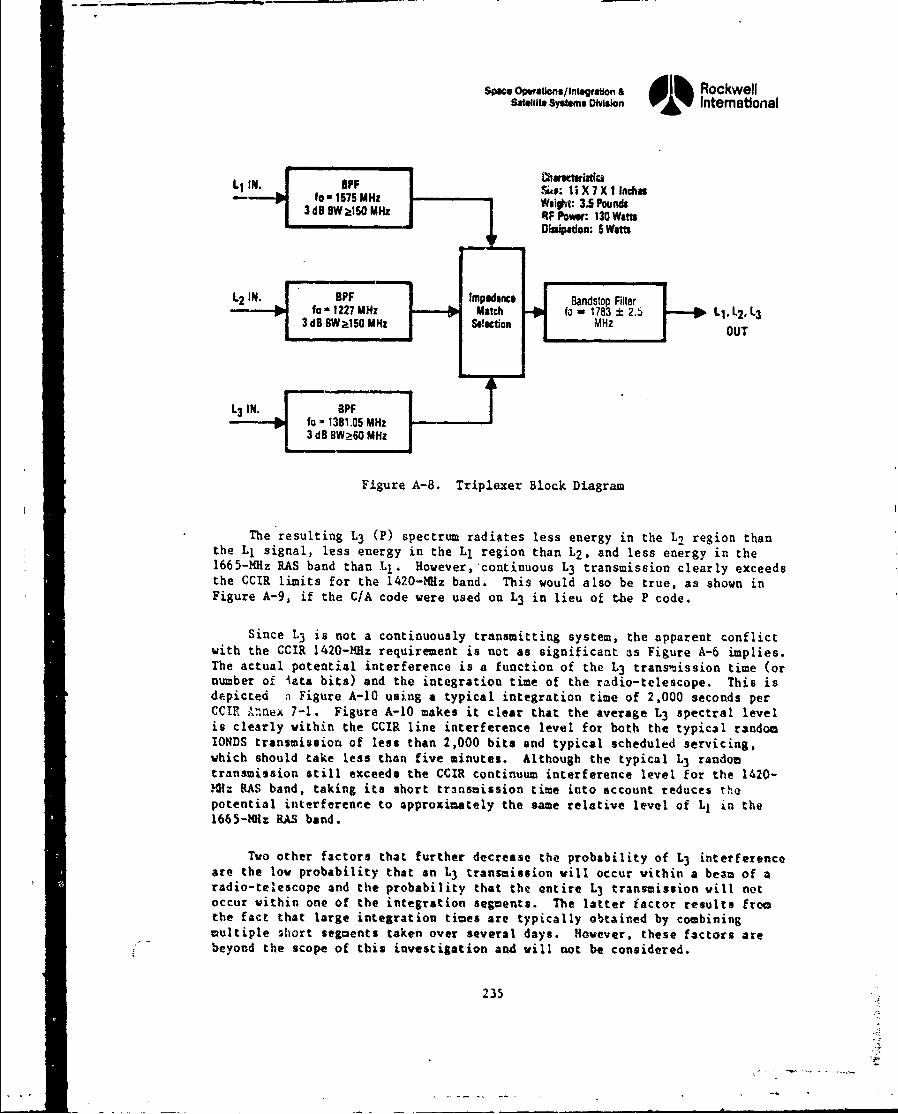
Spa e, OW .,ons/Integraton & RockwellSaullit. Systems Division 01% International
f 1 a 1PF Me: 11 X 7 X I Inch"s3 fod 1575 MHz Weight: 3.5 Pounds3dB 9W •15R MHz RF Powe: 130 Waen
Oisipation: 5 Was
lBPFfoa 1227 MHz Match to - 2 1783 t 2.5 .L1 L2. L3
3 dB BW>150 MHz Stion MHz OUT
L3 IN. aPFfo - 1381.05 MHz
3dB BW>6O MHz
Figure A-8. Triplexer Block Diagram
The resulting L3 (P) spectrum radiates less energy in the Li region thanthe Ll signal, less energy in the L1 region than L2 , and less energy in the1665-MHz RAS band than Ll. However,'continuous L3 transmission clearly exceedsthe CCIR limits for the 1420-MH1z band. This would also be true, as shown inFigure A-9, if the C/A code were used on L3 in lieu of the P code.
Since L3 is not a continuously transmitting system, the apparent conflictwith the CCIR 1420-141z requirement is not as significant as Figure A-6 implies.The actual potential interference is a function of the L3 transmission time (ornumber of data bits) and the integration time of the radio-telescope. This isdepicted ;1 Figure A-10 using a typical integration time of 2,000 seconds perCCTR A.-nex 7-I. Figure A-10 makes it clear that the average L3 spectral levelis clearly within the CCIR line interference level for both the typical randomIONDS transmission of less than 2,000 bits and typical scheduled servicing,which should take less than five minutes. Although the typical L3 randomtransmission still exceeds the CCIR continuum interference level for the 1420-Mlz RAS band, taking its short transaission time into account reduces thepotential interferenc'.e to approximately the same relative level of L1 In the1665-NH: RAS band.
Two other factors that further decrease the probability of L3 interferenceare the low probability that an L3 transmission will occur vithin a bean of aradio-telescope and the probability that the entire L3 transmission will notoccur within one of the integration segments. The latter factor results fromthe fact that large integration times are typically obtained by combiningmultiple short segments taken over several days. However, these factors arebeyond the scope of this investigation and will not be considered.
235
4.-
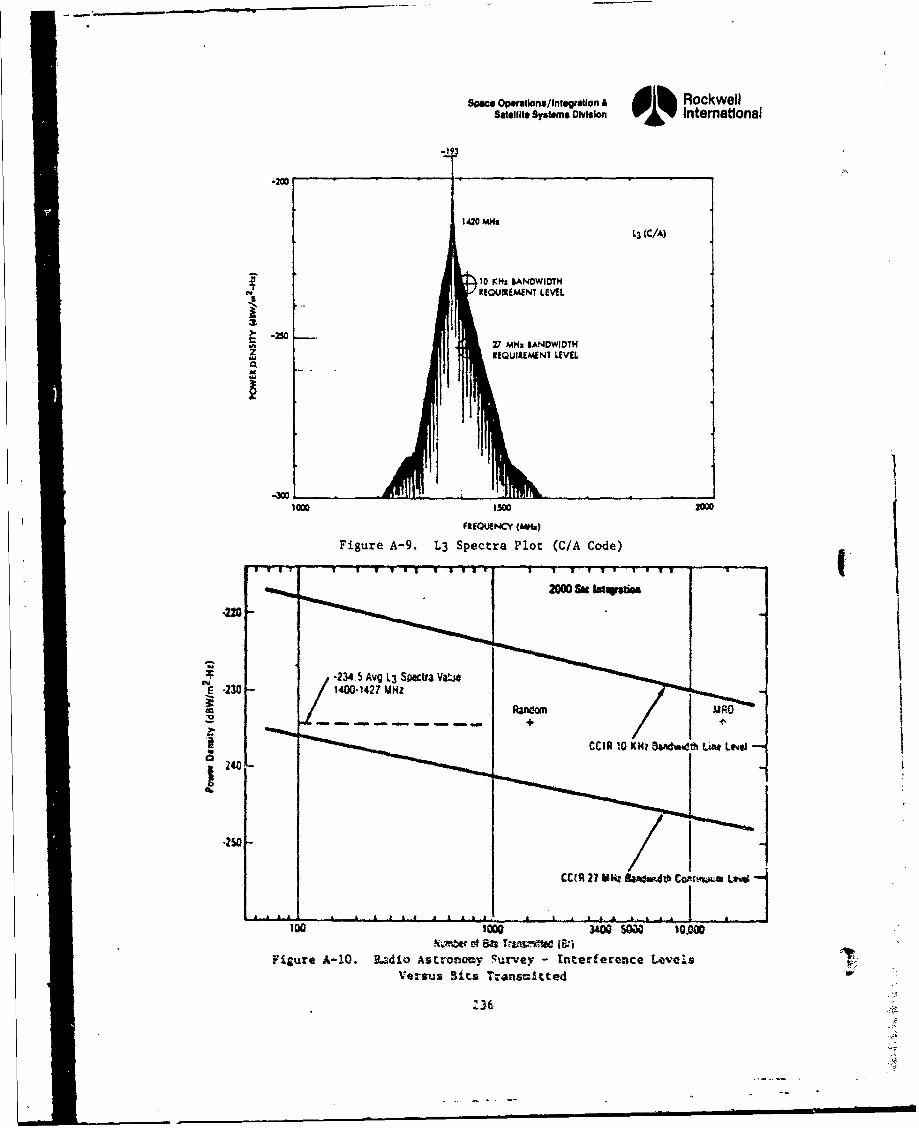
Spwa Operations/Interalon A l RockwellSatellite Systems Division 0 % Intemational
-193
.200
1420 MHz1L3 (C/A)
10 KH2 SANOWIOTH- -. 5REAUIRIMENT LEVEL
3t
>- -2!027 MHz SANDWIOTHREQUIREMENT LEVEL
logo00 2W0 200
FREQUENCY (Whz)
Figure A-9. L3 Spectra Plot (C/A Code)
20 S a0s
324 1%*21100I awthL" N
CUR~ 21 Wki Bamzw.4h Coaimuma Lsva
lo Um SI 10= I & I~II
Ftiure A-10. Radio Astronomy Furvey - Interference Level~sVersus Bits Transcitted
m36
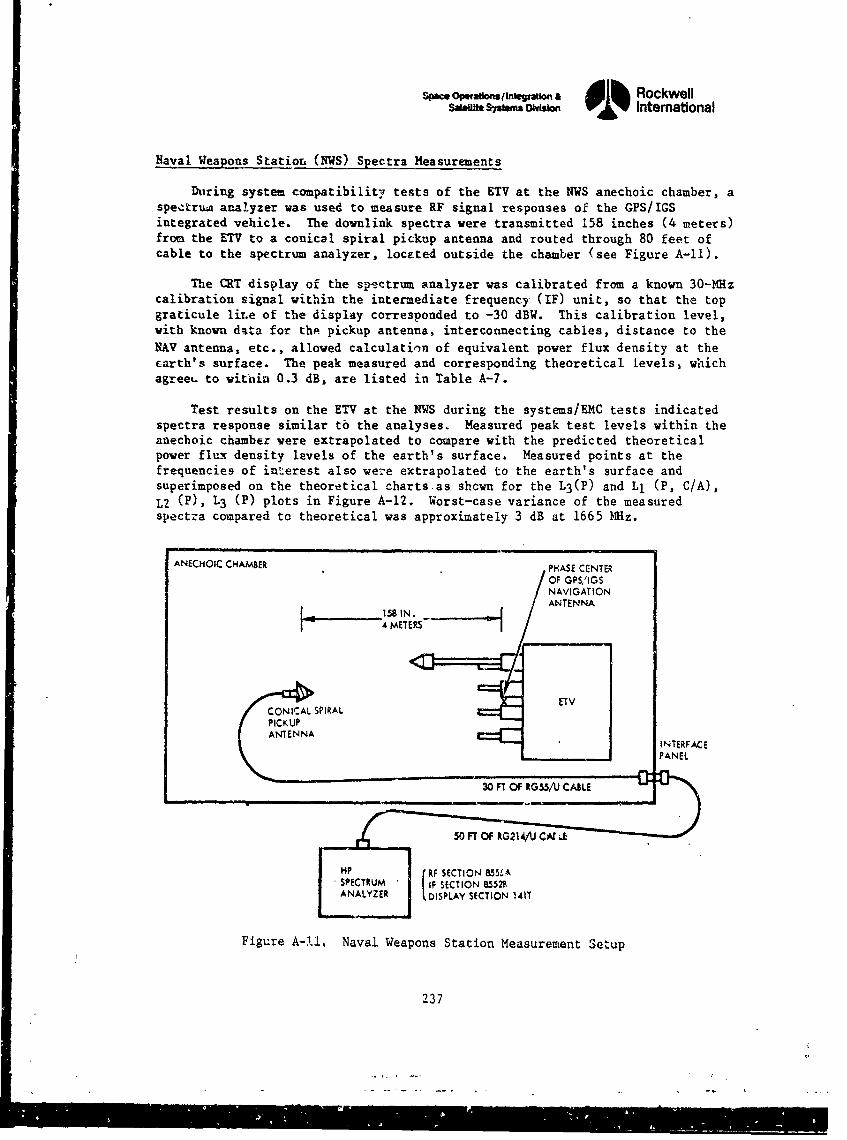
Sp.a Opefaf/lte,.,iof & Ab Rockwellsat"Ift orewu onwsi Intemational
Naval Weapons Station (NVS) Spectra Measurements
Dring system compatibility tests of the ETV at the NWS anechoic chamber, aspeetruw analyzer was used to measure RF signal responses of the GPS/IGSintegrated vehicle. The downlink spectra were transmitted 158 inches (4 meters)from the ETV to a conical spiral pickup antenna and routed through 80 feet ofcable to the spectrum analyzer, loczted outside the chamber (see Figure A-lI).
The CRT display of the spectrum analyzer was calibrated from a known 30-MHzcalibration signal within the intermediate frequency (IF) unit, so that the topgraticule liLe of the display corresponded to -30 dBW. This calibration level,with known data for the pickup antenna, interconnecting cables, distance to the
NAV antenna, etc., allowed calculation of equivalent power flux density at theearth's surface. The peak measured and corresponding theoretical levels, whichagreeL. to within 0.3 dB, are listed in Table A-7.
Test results on the ETV at the NWS during the systems/EMC tests indicatedspectra response similar tb the analyses. Measured peak test levels within theanechoic chamber were extrapolated to compare with the predicted theoreticalpower flux density levels of the earth's surface. Measured points at thefrequencies of inZerest also were extrapolated to the earth's surface andsuperimposed on the theoretical charts.as shcwn for the L3 (P) and Ll (P, C/A),
L2 (B), L3 (P) plots in Figure A-12. Worst-case variance of the measuredspectra compared to theoretical was approximately 3 dB at 1665 flz.
ANECHOIC CHAMBER PXASE CENTER
OF GPS/IGSNAVIGATION
158 IN. "ANTENNA
SMETERS- -
reCONIC:AL SPIRALETPIC K.UPANT ENNA
S~INTERFACE
PANEL
S30. F7OFR5W CABLE g
50 IFT OF RG214/U C.•r A
HP RF SECTION 855;ASPECTRUM IF SECTION 8552SANALYZER ( DISPLAY SECTION 141T
Figure A-1I. Naval Weapons Station Measurement Setup
237
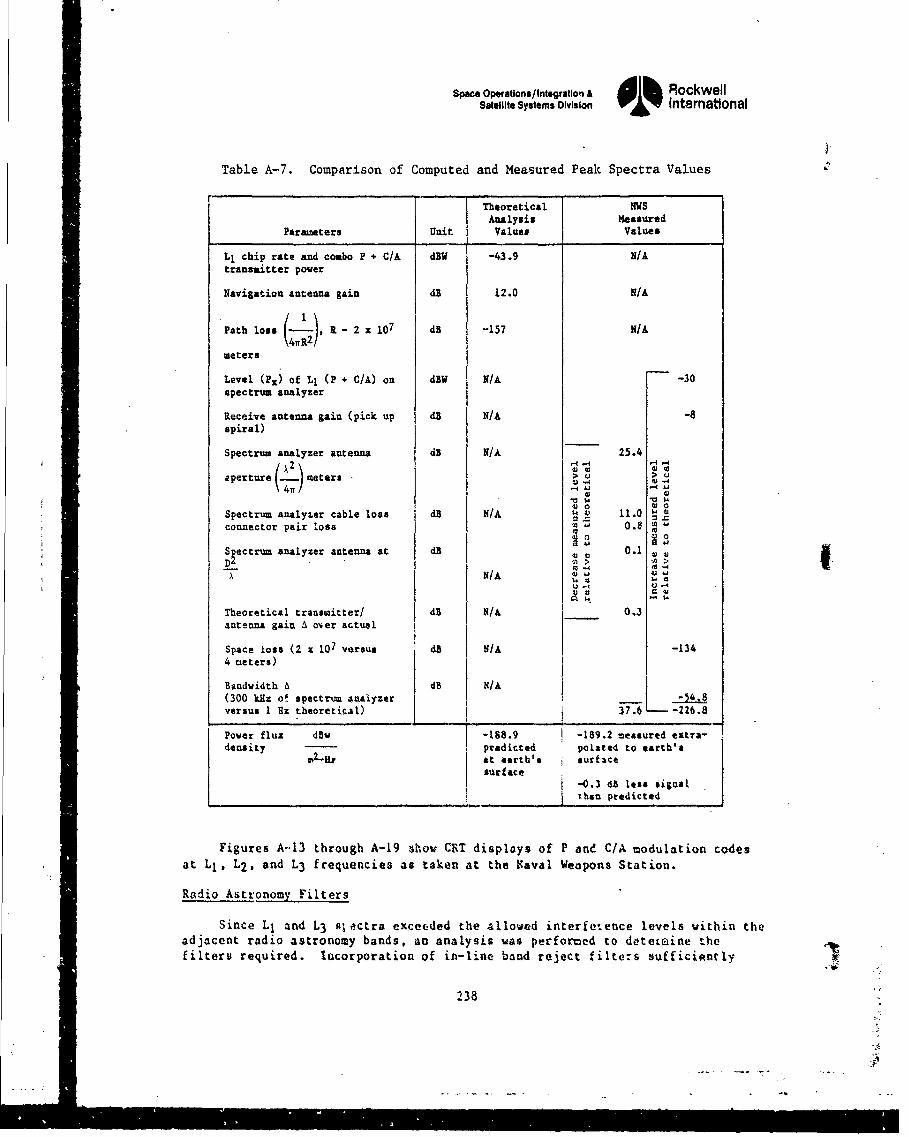
Space Operations/Integration & A RockwellSatellite Systems Oivision I I International
T3
Table A-7. Comparison of Computed and Measured Peak Spectra Values
Theoretical IWSAnalysis Measured
Parameters Unit Values Values
L1 chip rate and combo P + C/A dBW -43.9 N/A
transmitter power
Navigation antenna gain dB 12.0 N/A
Path loss R- , .- 2 x 10⁷ dB -157 N/A\4irR2/
meters
Level (Px) of Ll (P + C/A) on dBW N/A -30spectrum analyzer
Receive antenna gain (pick up dB N/A -8
spiral)
Spectrum analyzer antenna dB N/A 25.4
aperture meters >
Spectrum analyzer cable loss dB N/A 4 11.0connector pair loss 0.
S~ectrum analyzer antenna at d.B 0 0.1 0D,' ,> -a>!
N/A
Theoretical transmitter/ dB M/A 0.3antenna gain A over actual
Space loss (2 z 107 versus dB N/A -1344 aeters)
Bandwidth A dB N/IA(300 kEz of spectrum 4aalyzer I54.versus I Rz theoretical) i7, L -226.8
Power flux dBv -188.9 -189.2 measured extra-density pradicted polsaed to earth's
a2-tr at eorth's surfacesurface
1 -0.3 43 lses siRnal
thsn predicted
Figures A-13 through A-19 show CRT displays of P and C/A modulation codes
at L1 , L2 , and L3 frequencies as taken at the N~aval Weapons Station.
Ridio Astronomy Filters
Since Ll and L3 s ectra exceeded the allowed interfoaence levels vithin theadjacent radio astronomy bands, an analysis was performed to detetmine thefilters required. Incorporation of in-line band reject filters sufficienrly
238
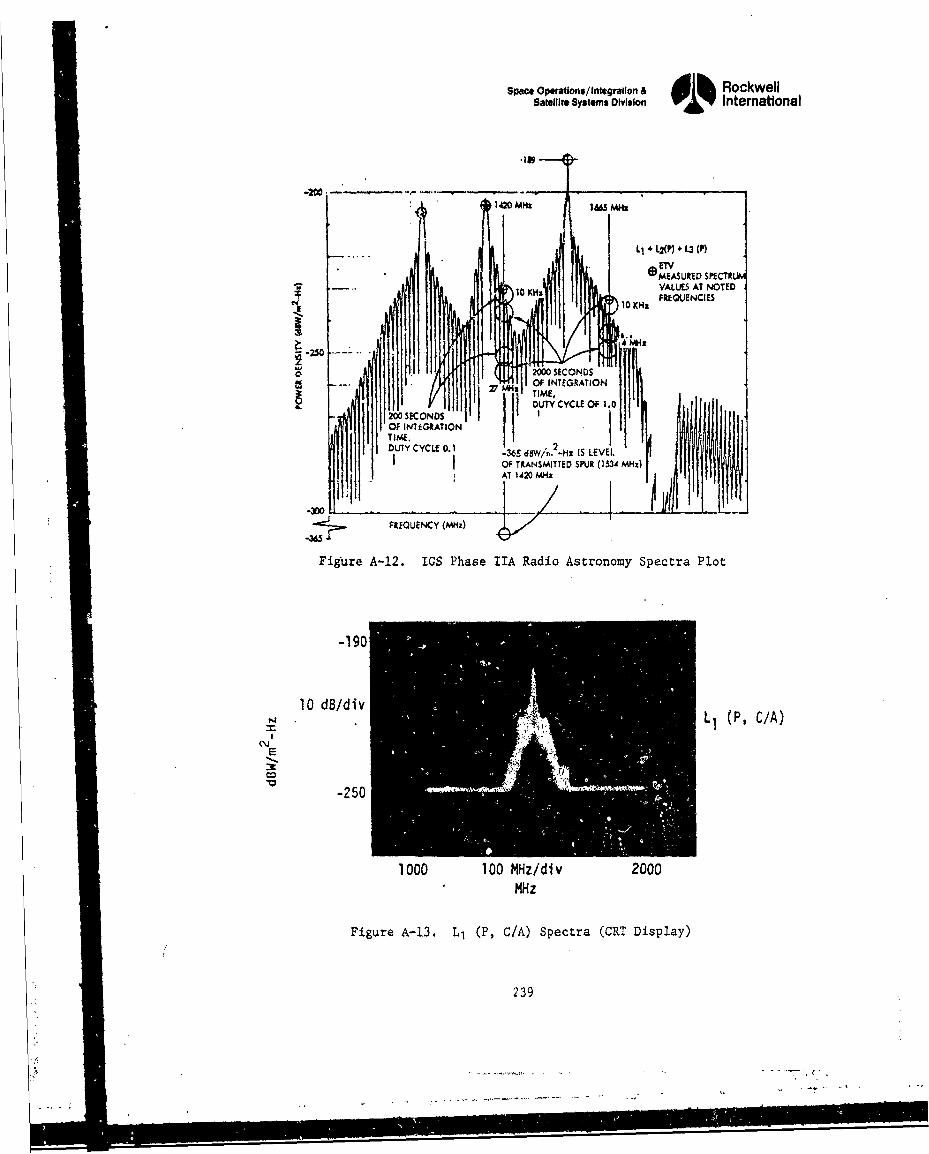
Spwe Operatlons/ Integration & RockwellSatellite Systems Division o• International
1420 1665 M z
Lj * L2(P) + 13 (M)
ETV
MEASUREDSPECTR10-H VALUES AT NOTED
N FREQUENCIES
10 K*
2 0 02 0 0 S EC OC O N D SOF INTEGRATION
TTIME,200 SECONDS I~i ii
TIME. l 11DUTY CYCLE 0. 1 -365 dBwin.2-Hz IS LEVEL,
I I OF TRANSMITTED SPUR (1534 MHz)
fAT 142 OMHz
FREQUENCY (MHz)
Figure A-12. IGS Phase IIA Radio Astronomy Spectra Plot
-190
10 dB/div (.C)
-250
1000 100 MHz/div 2000MHz
Figure A-13. L, (P, CIA) Spectra (CRT Display)
"239
S-zs
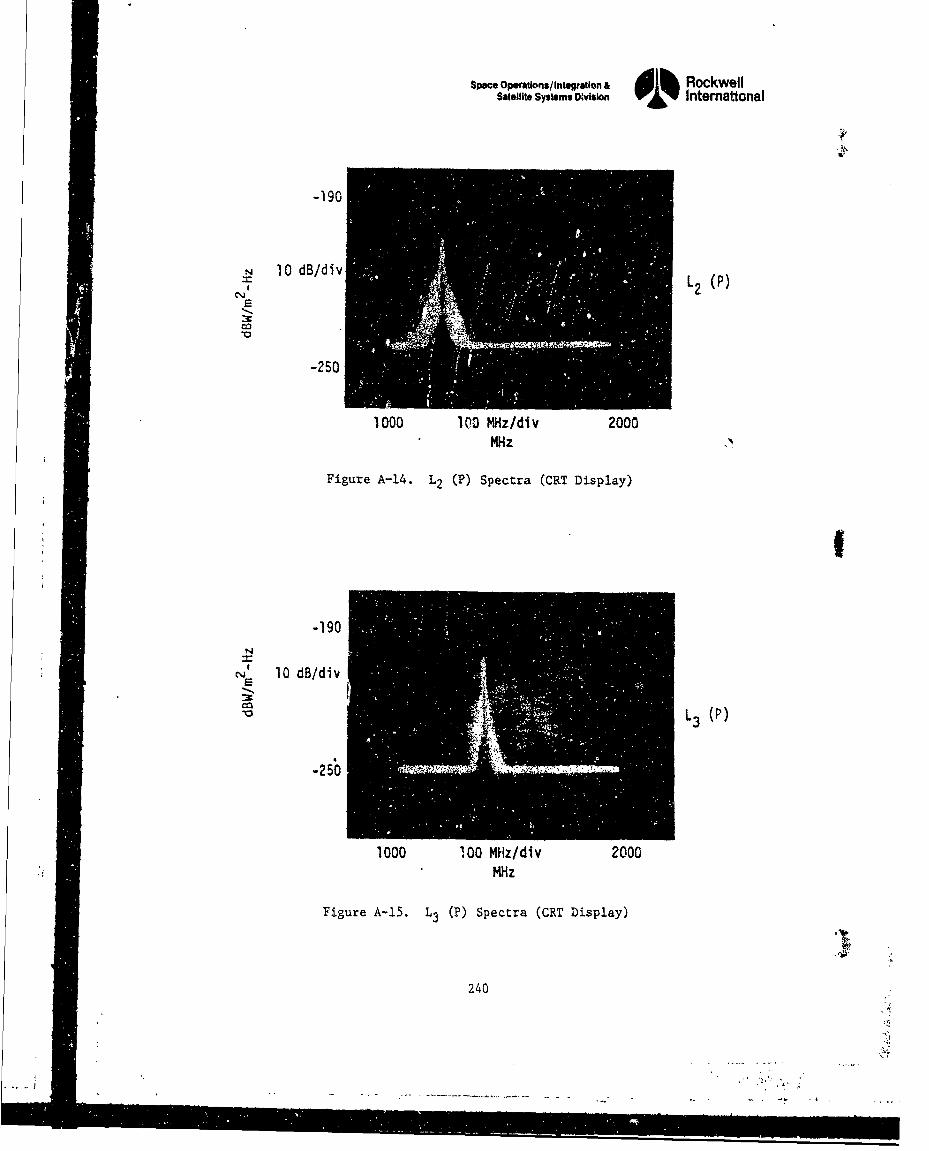
Space Operatlons/Integtation & Alk RockwellSatellite Sysiams Division International
-190
10l dB/div,2 (P)
-250
1000 100 MHz/div 2000MHz
Figure A-14. L2 (M) Spectra (CRT Display)
-190N
2 10 dB/divE
V L3 (P)
-250
1000 1.00 MHz/div 2000MHz
Figure A-15. L3 (P) Spectra (CRT Display)
240
----------
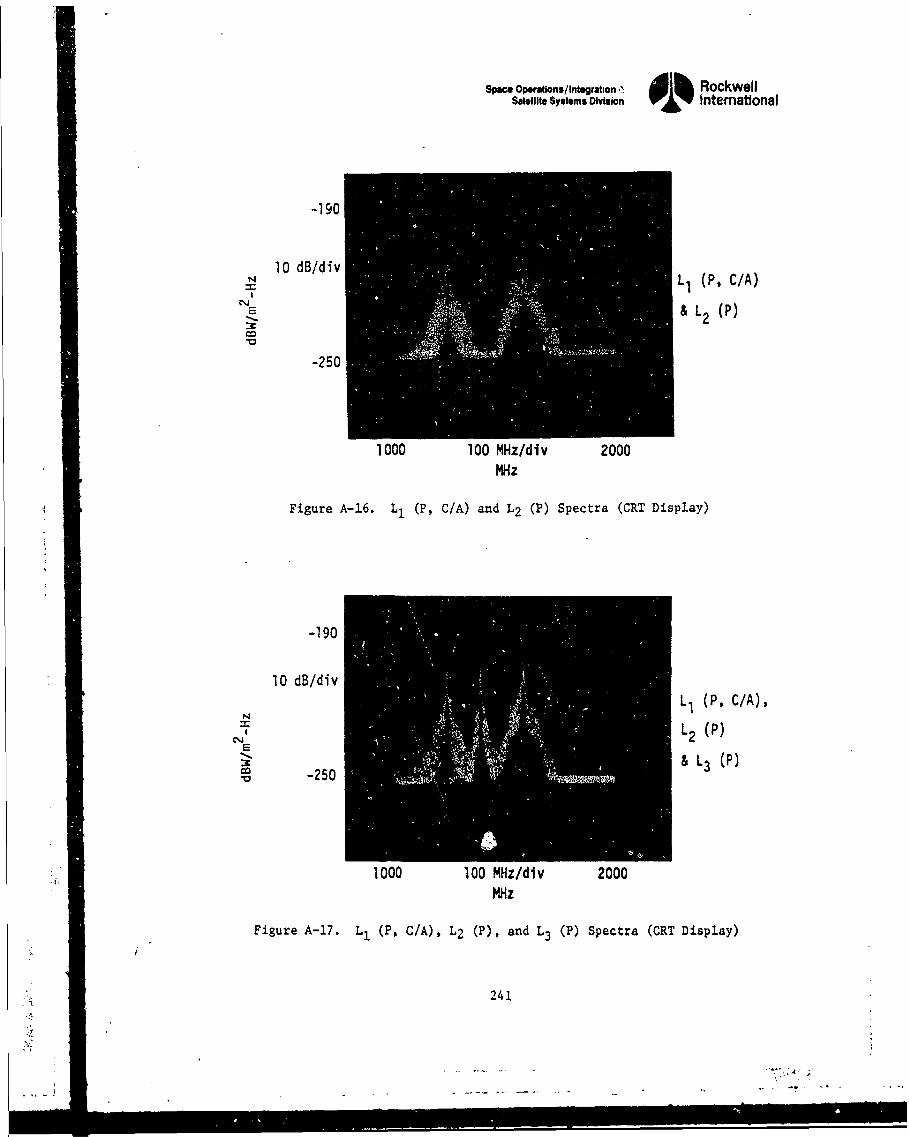
Space Opeations/Integrahon . lh RockwellSatellite Systems Division International
-190
10 dB/div L .-r- L1 (P, C/A)
& L2 (P)
-250
1000 100 MHz/div 2000MHz
Figure A-16. L, (P, C/A) and L2 (P) Spectra (CRT Display)
-190
10 dB/divL, (P, C/A),
N o,,' 2 (P)
-250O L3 (P)"V -250
1000 100 MHz/div 2000MHz
Figure A-17. L, (P, C/A), L2 (P), and L3 (P) Spectra (CRT Display)
2 241
-I • i i I I I ' I nnn pl*.. .. -* . . .
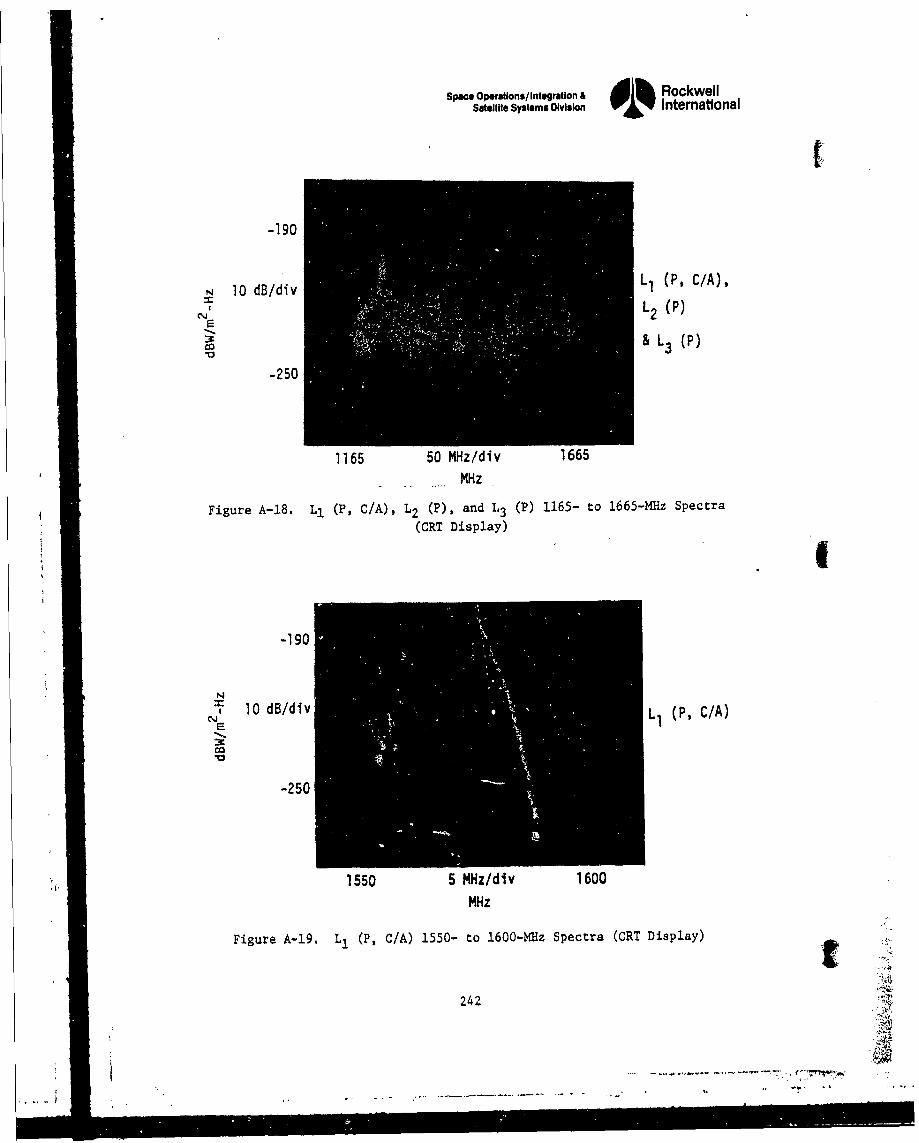
Space Operations/ Integration & dik Rockwell
Satellite Systems Division International
t
-190
10 dB/div L1 (P, C/A),
L2 (P)32
:o& L3 (P)
-250
1165 50 MHz/div 1665
MHz
Figure A-18. L1 (P, C/A), L2 (P), and 1.3 (P) 1165- to 1665-MHz Spectra
(CRT Display) I
-190
, 10 dB/div LI (P, C/A)
V3
-250
1550 5 MHz/div 1600MHz
Figure A-19. L1 (P, C/A) 1550- to 1600-MHz Spectra (CRT Display)
242
S"A
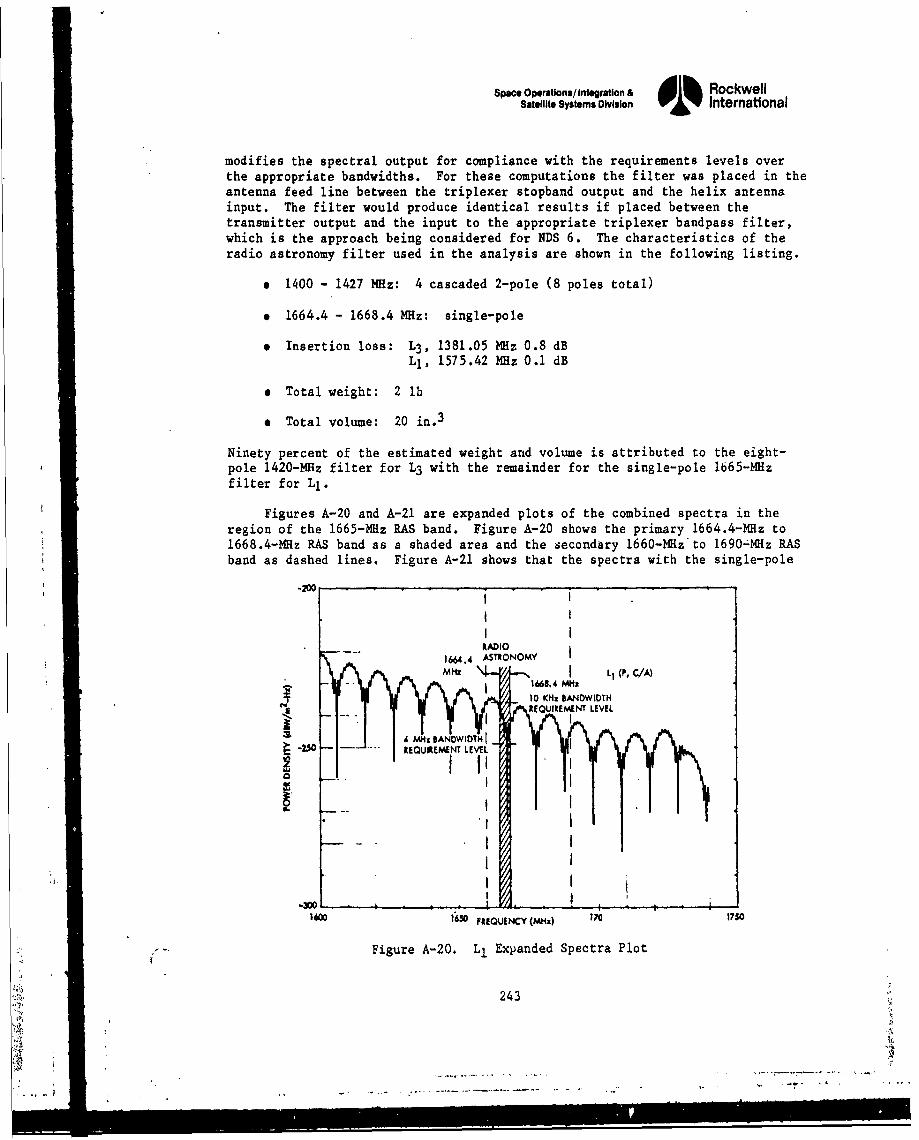
Space Operations/Integration & ili RockwellSatellite Systems Division oi% International
modifies the spectral output for compliance with the requirements levels overthe appropriate bandwidths. For these computations the filter was placed in theantenna feed line between the triplexer stopband output and the helix antennainput. The filter would produce identical results if placed between thetransmitter output and the input to the appropriate triplexer bandpass filter,which is the approach being considered for NDS 6. The characteristics of theradio astronomy filter used in the analysis are shown in the following listing.
* 1400 - 1427 MHz: 4 cascaded 2-pole (8 poles total)
* 1664.4 - 1668.4 MHz: single-pole
e Insertion loss: L3 , 1381.05 MHz 0.8 dBL1 , 1575.42 MHz 0.1 dB
* Total weight: 2 lb
* Total volume: 20 in. 3
Ninety percent of the estimated weight and volume is attributed to the eight-pole 1420-MHz filter for L3 with the remainder for the single-pole 1665-MHzfilter for Ll.
Figures A-20 and A-21 are expanded plots of the combined spectra in theregion of the 1665-MHz RAS band. Figure A-20 shows the primary 1664.4-MHz to1668.4-MHz RAS band as a shaded area and the secondary 1660-MHz to 1690-MHz RASband as dashed lines. Figure A-21 shows that the spectra with the single-pole
.2W0
RADIO
~~^EURM NT5 LEVQELMNTLEEI ,
_• ~ ~ MHz BANDWIDTHC/A
SREQUIREMENT LEVEL
1650 FR-QUNENCY (Mz) L 1750
Figure A-20. L. Expanded Spectra Plot
243
C40t••FEUNY(~) 1• 7$
:: ,-- Figure A-20~~. L xane pctaPo
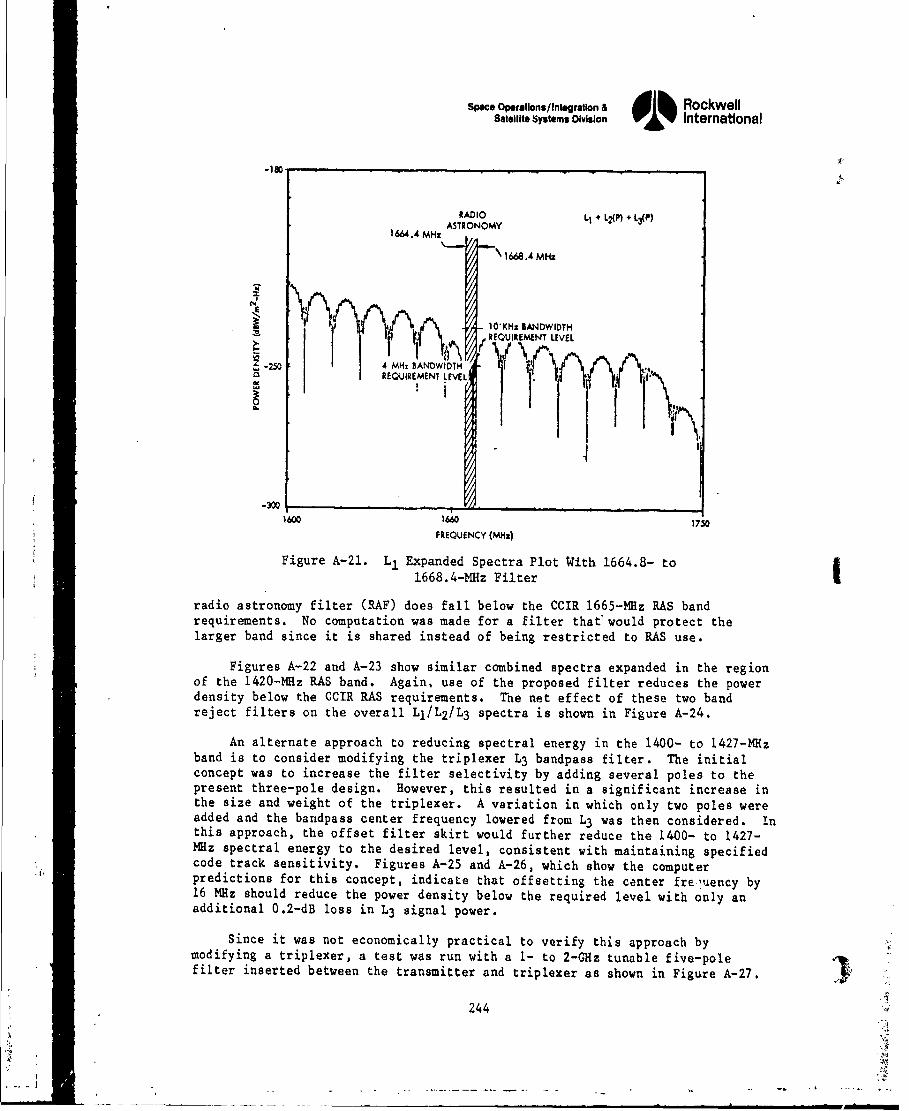
Space Operatlons/Integratlon A RockwellSatellite Systems Division 01% International
RADIO LI+ L() L
1664.4 MHz ,O
-1668.4 MHz
I 1O-KHi BANDWIDTHREQUIREMENT LEVEL
i ' I !REQUIREMENT LEVEL
-300
1600 1660 15FREQUENCY (Milz)
Figure A-21. L1 Expanded Spectra Plot With 1664.8- to
1668.4-MHz Filter
radio astronomy filter (RAF) does fall below the CCIR 1665-MHz RAS bandrequirements. No computation was made for a filter that would protect thelarger band since it is shared instead of being restricted to RAS use.
Figures A-22 and A-23 show similar combined spectra expanded in the regionof the 1420-MHz RAS band. Again, use of the proposed filter reduces the powerdensity below the CCIR RAS requirements. The net effect of these two bandreject filters on the overall LI/L 2 /L 3 spectra is shown in Figure A-24.
An alternate approach to reducing spectral energy in the 1400- to 1427-MHzband is to consider modifying the triplexer L3 bandpass filter. The initialconcept was to increase the filter selectivity by adding several poles to thepresent three-pole design. However, this resulted in a significant increase inthe size and weight of the triplexer. A variation in which only two poles wereadded and the bandpass center frequency lowered from L3 was then considered. inthis approach, the offset filter skirt would further reduce the 1400- to 1427-MHz spectral energy to the desired level, consistent with maintaining specifiedcode track sensitivity. Figures A-25 and A-26, which show the computer"predictions for this concept, indicate that offsetting the center freuency by16 MHz should reduce the power density below the required level with only anadditional 0.2-dB loss in L3 signal power.
Since it was not economically practical to verify this approach bymodifying a triplexer, a test was run with a I- to 2-GHz tunable five-polefilter inserted between the transmitter and triplexer as shown in Figure A-27.
244
3,,
- . , --
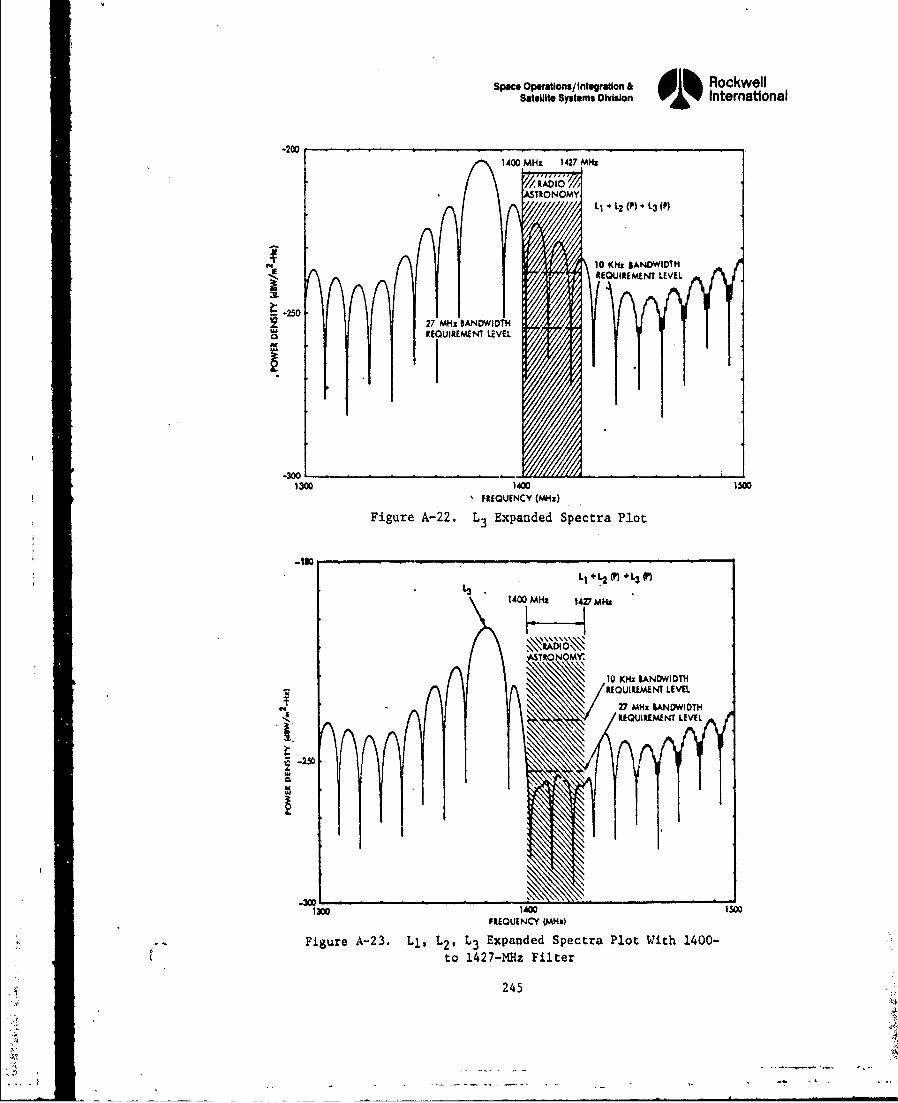
Space OpMations/Integration & RockwellSatellite Systems Division 01% International
-200
1400 MHz 1427 MHz
TRONOMY*L L2 (P) + L3 (P)
C427 MHz 1ANOWIDTH0RUEQUIREMENM LLVEL
.250
.30011300 1400 150
FREQUENCY (MHz)
Figure A-22. L3 Expanded Spectra Plot
L1 + L2 M L3(
1400 MHz 1427 MHz
ASMNOMY'
10 MI~z 9ANDWIDTHREQUIREMENT LEVEL
REQUIREMENT LEVEL
~-250
I3D 1400 1500FREQUENCY (Mz)
Figure A-23. LI, L2 , L3 Expanded Spectra Plot With 1400-to 1427-MHz Filter
245
-9)
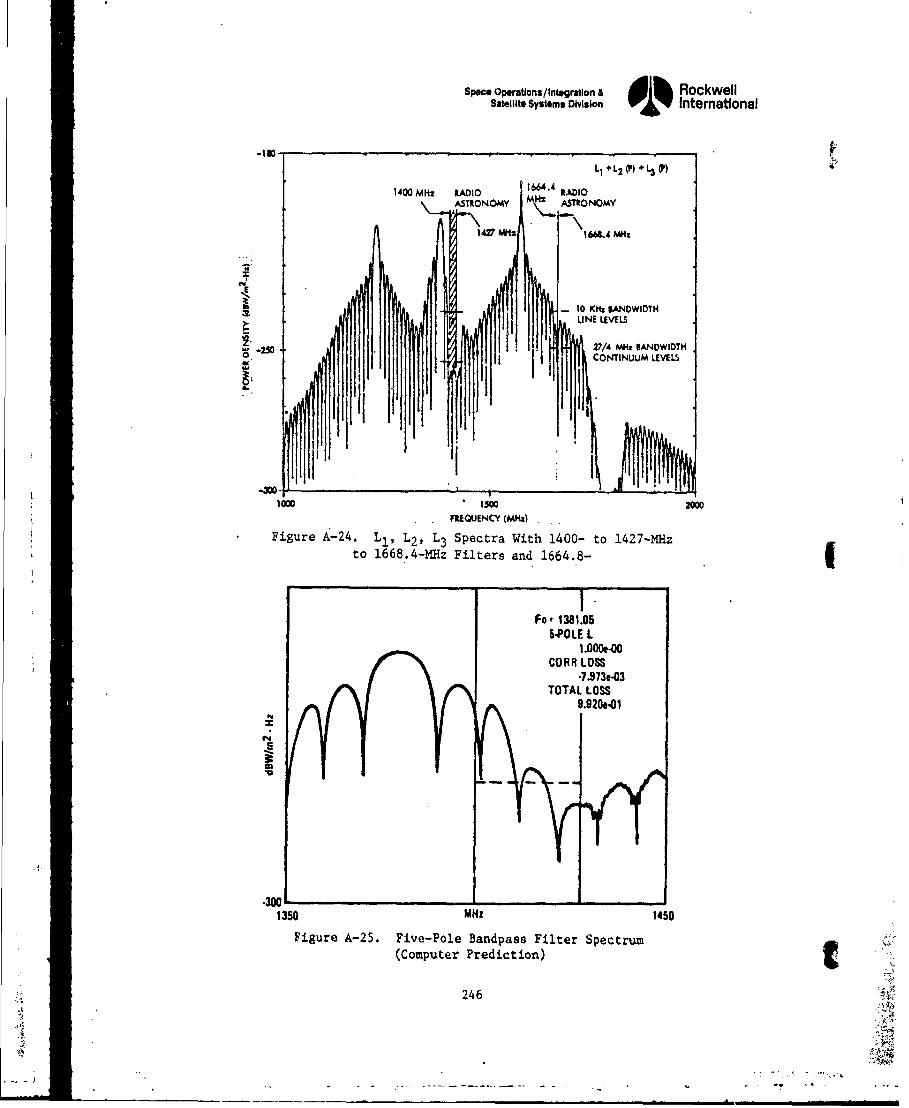
Space Operations/Integration & I RockwellSatellite Systems Division International
-ISDLI 4+ L2 (P) +L3 (P) •r
1400 MHz RADIO M RADIOASTRONOMY Mx ASTRONOMY
1427 MW 16t4:~
1E
I A
10-~ SANDWIDTH S~LINE LEVELS
'-250 27/4 MHz GANDWIDTH
owl CONTINUUM LEVELS
Iwco 2ýo OcFREQUENCY (MHz)
Figure A-24. Ll, L2 , L3 Spectra With 1400- to 1427-MHzto 1668.4-MHz Filters and 1664.8-
Fo, 1381.055-POLE L
1.0001-00CORR LOSS
-7.973e.03TOTAL LOSS
9.9204-O1
1350 MHz 1450
Figure A-25. Five-Pole Bandpass Filter Spectrum 2•(Computer Prediction) ••
246 ••€
44
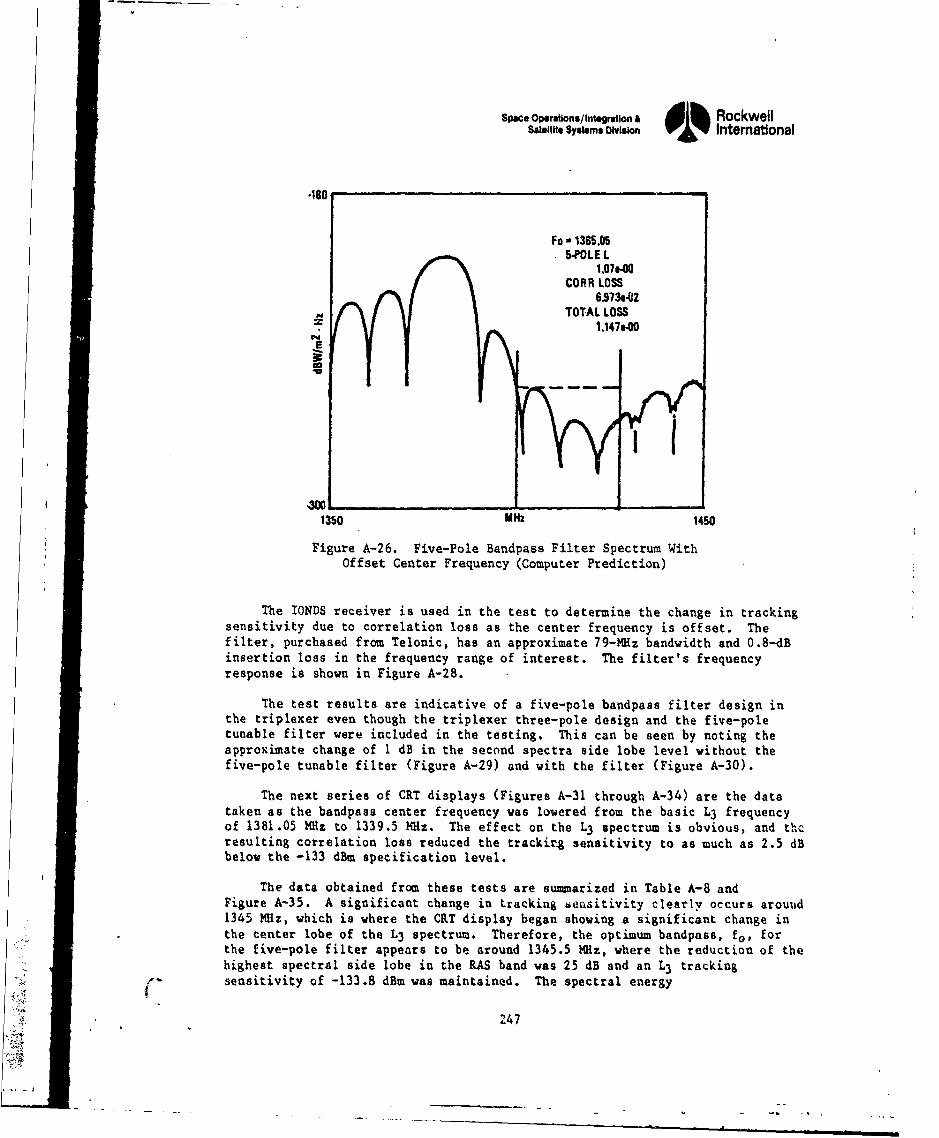
Space Operations/Integration & RockwellSatellite Systems ODvision 0 International
*-180-
Fo 1365.055-POLE L
1.07.40CORR LOSS
6.973e-02TOTAL LOSS
1.147400
SIi
1350 MHz 1450
Figure A-26. Five-Pole Bandpass Filter Spectrum WithOffset Center Frequency (Computer Prediction)
The IONDS receiver is used in the test to determine the change in trackingsensitivity due to correlation loss as the center frequency is offset. Thefilter, purchased from Telonic, has an approximate 79-MHz bandwidth and 0.8-dBinsertion loss in the frequency range of interest. The filter's frequencyresponse is shown in Figure A-28.
The test results are indicative of a five-pole bandpass filter design inthe triplexer even though the triplexer three-pole design and the five-poletunable filter were included in the testing. This can be seen by noting theapproximate change of 1 dB in the second spectra side lobe level without thefive-pole tunable filter (Figure A-29) and with the filter (Figure A-30).
The next series of CRT displays (Figures A-31 through A-34) are the datataken as the bandpass center frequency was lowered from the basic L3 frequencyof 1381.05 MHz to 1339.5 MHz. The effect on the L3 spectrum is obvious, and thcresulting correlation loss reduced the trackirg sensitivity to as much as 2.5 dBbelow the -133 dBm specification level.
The data obtained from these tests are sunarized in Table A-8 andFigure A-35. A significant change in tracking seasitivity clearly occurs around1345 MHz, which is where the CRT display began showing a significant change inthe center lobe of the L3 spectrum. Therefore, the optimum bandpass, fe, forthe five-pole filter appears to be around 1345.5 MHz, where the reduction of thehighest spectral side lobe in the RAS band was 25 dB and an L3 tracking"sensitivity of -133.8 dBm was maintained. The spectral energy
1247
.;:F1
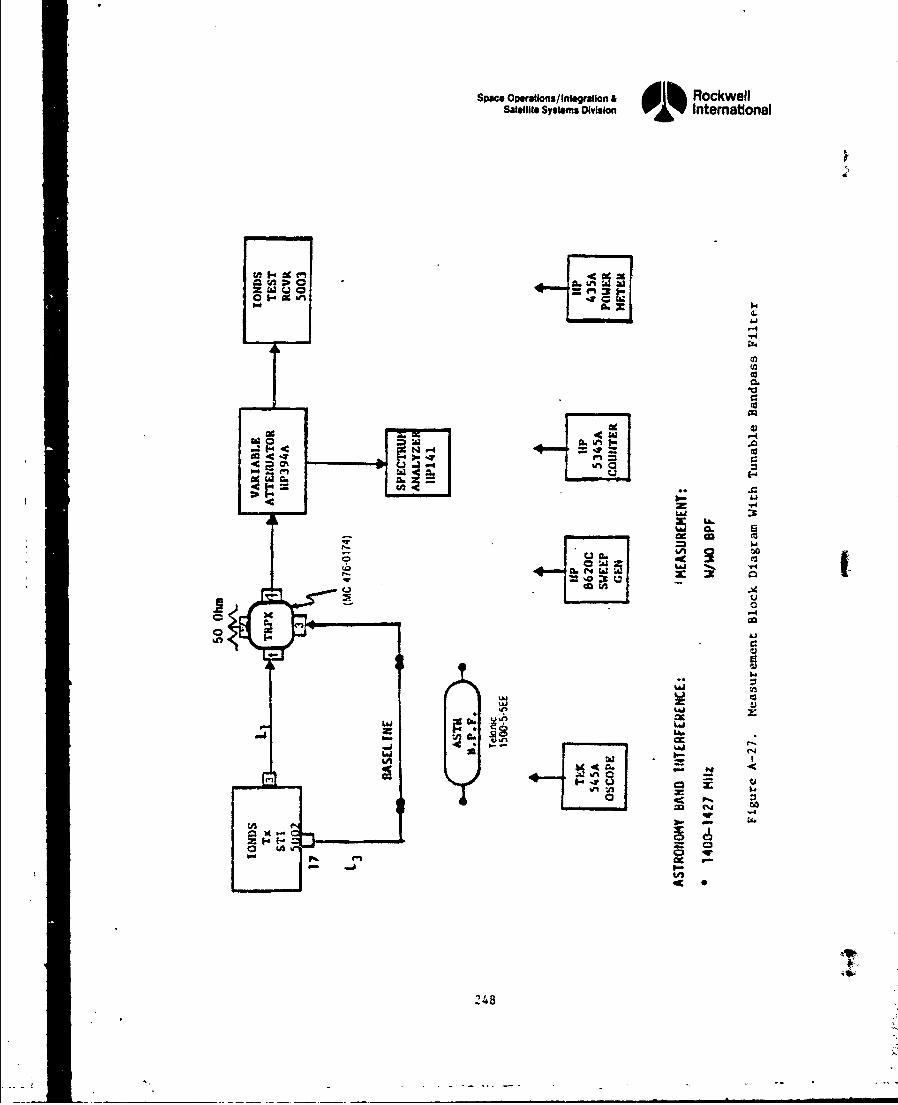
Space Operstlana/ Integation a bRockwellSatellite Systems otviseuo 01 Internatlonal
A..
N -4
on. 00
cc 0
uc-c
U4U
L4LWi
2488
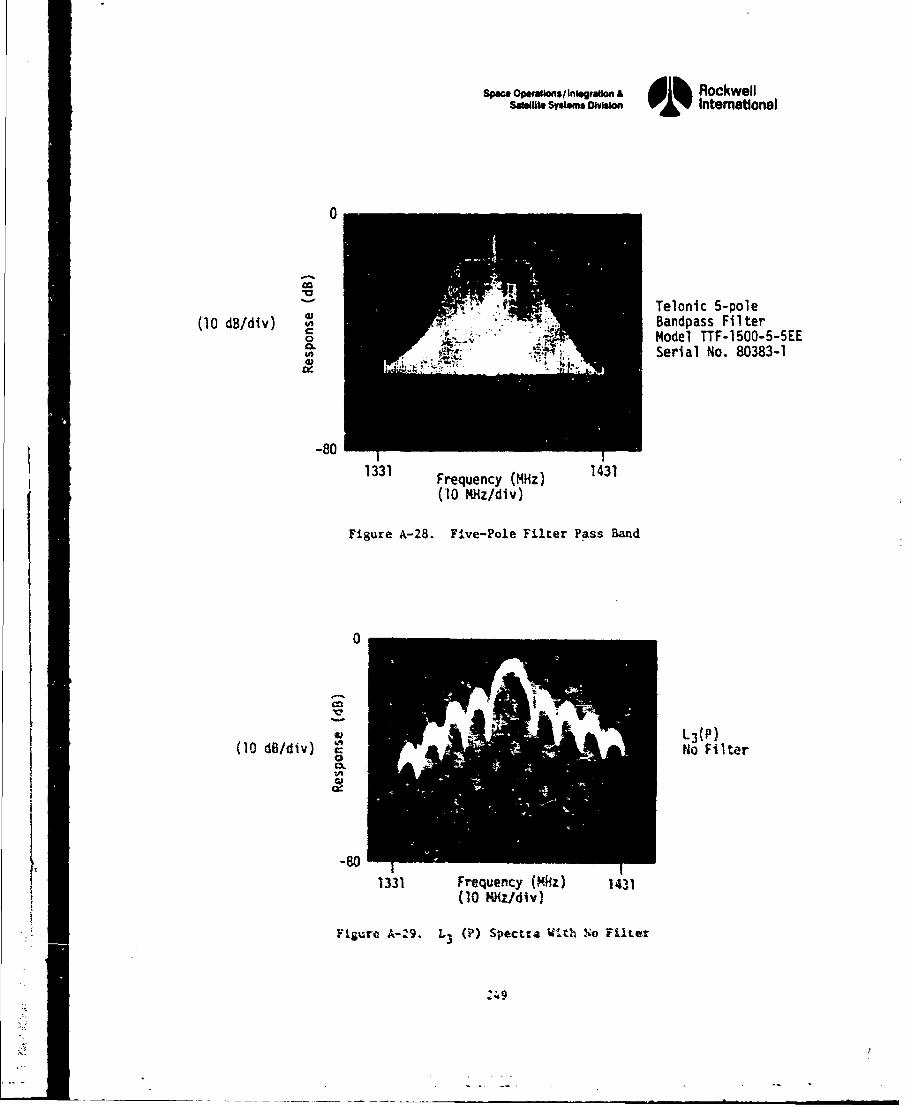
Spwo Op mns/InigrIon A d RockwellSau.• S ns so 01 International
0
"Telonic 5-pole(10 dB/div) Bandpass Filter
o Model TTF-1500-5-5EE,,, ,,Serial No. 80383-1
-80 1331 Frequency (MHz) 1431
(10 MHz/div)
Figure A-28. Five-Pole Filter Pass Band
0
S~L3(P)"(10 dB/div) No Filter
-801331 Frequency (mhz) 1431
(10 MJz/div)
Figure A-29. L3 (P) Spectra vith I'o Filter
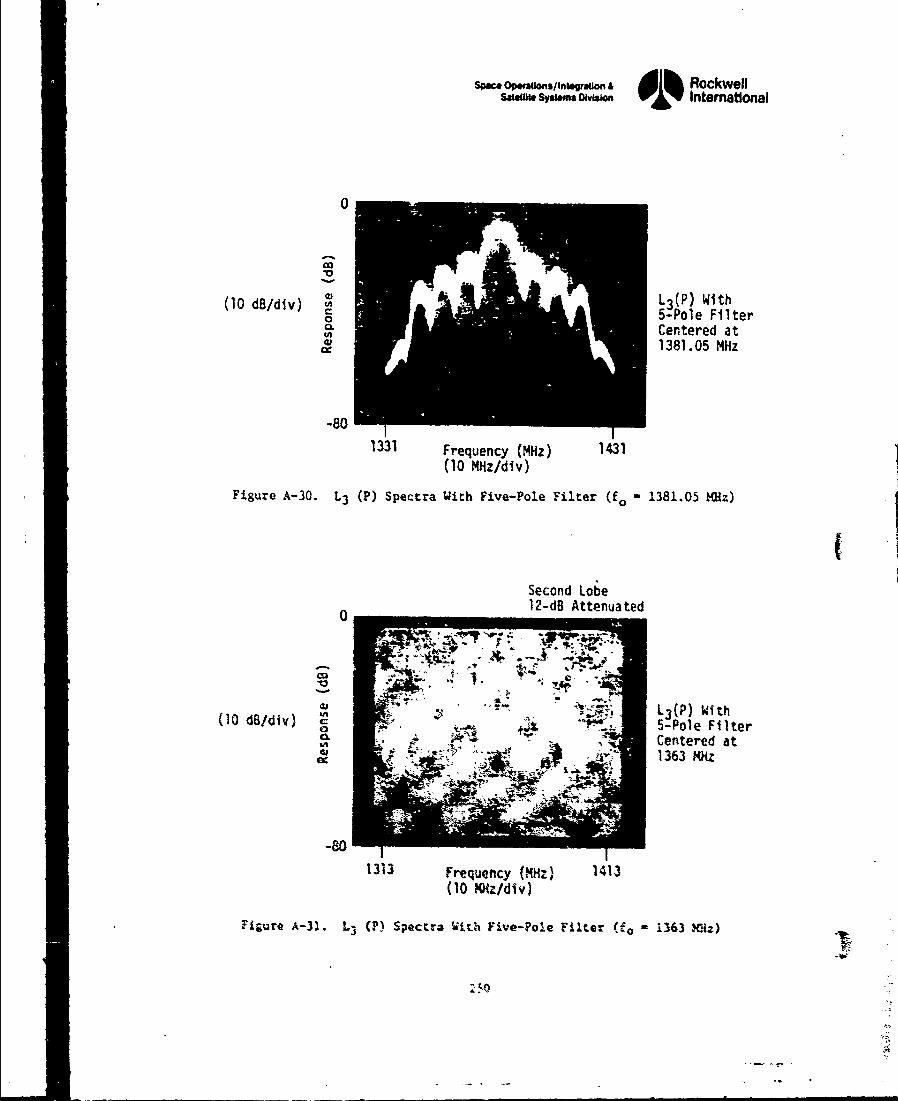
SPec. OpetaUon9/tng~gu'Uon£ Rockwellsat"uii sysw mswwis 01% International
0
(10 d/divL 3(P) With5-Pole FilterCentered at1381.05 MHz
-80
1331 Frequency (MHz) 1431(10 MHz/div)
Figure A-30. L3 (P) Spectra With Five-Pole Filter (f. 1381.05 MHz)
Second Lobe
0 12-dB Attenuated
ýD L3 (P) With(10 dB/div) 5-Pole FilterCL Centered at
AJ 1363 MHz
-80
1313 Frequency (MHz) 1413'10 1Mz/div)
Figure A-31. L3 Q) Spectra UWith Five-Pole Filter (f * 1363 Mz~)
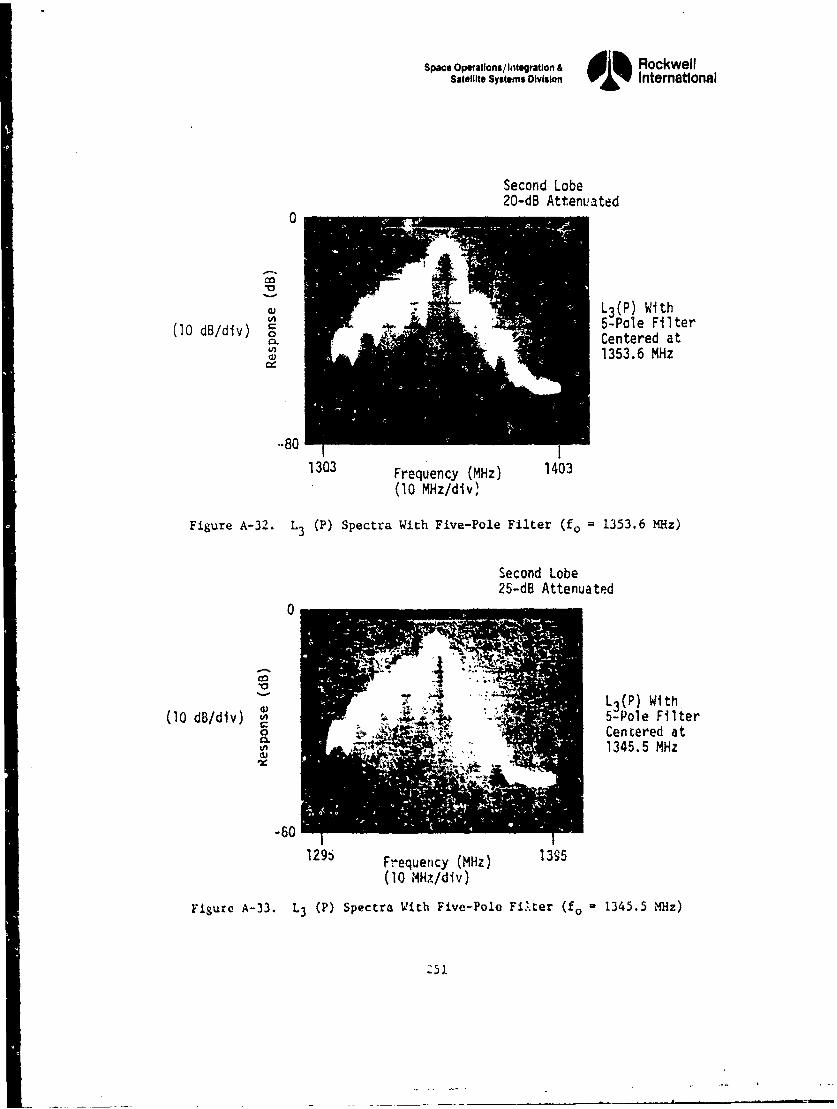
Space Operations/Integration & RockwellSatellite Systems Division 01% International
Second Lobe20-dB Atten•ated
0
1 5-Pole Filter(CL Centered at
wl 1353.6 MHz
._80
1303 Frequency (MHz) 1403(10 MHz/div)
Figure A-32. L3 (P) Spectra With Five-Pole Filter (f. - 1353.6 MHz)
Second Lobe25-dB Attenuated
0
L3(P) With(10 dB/div) 44 5-Pole Filter
2. - Centered at
-60
1296 Frequency (MHz) 1395(10 ?Vi/div)
Fisure A-33. L3 (P) Spectra Vith Five-Pole Filter (f. 1345.5 MHz)
Z51
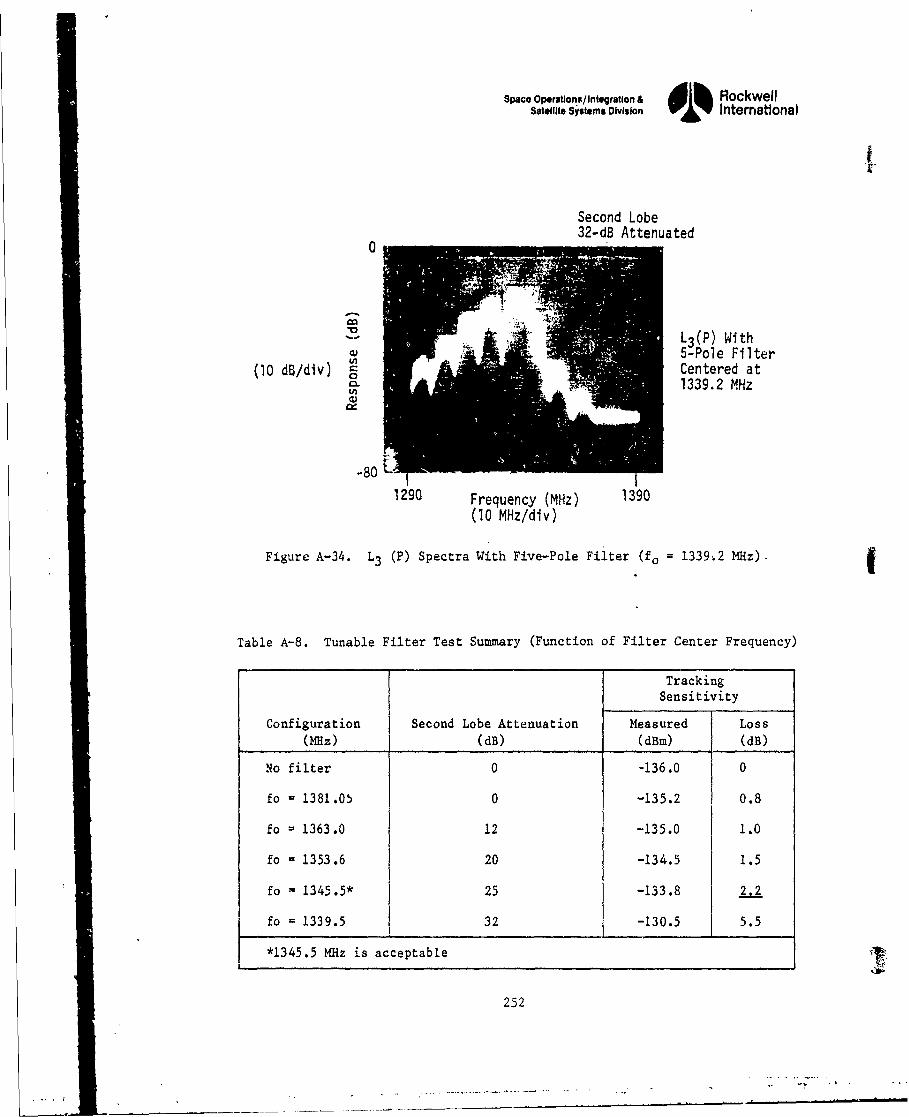
Spaco Operations/Integration & d1m RockwellSatellite Systems Division Y"iY International
Second Lobe32-dB Attenuated
0
L3 (P) With5-Pole Filter
(10 dB/div) • Centered at0.CL 1339.2 MHz
-801290 Frequency (MHz) 1390
(10 MHz/div)
Figure A-34. L3 (P) Spectra With Five-Pole Filter (fo 1339,2 MHz). (
Table A-8. Tunable Filter Test Summary (Function of Filter Center Frequency)
TrackingSensitivity
Configuration Second Lobe Attenuation Measured Loss(MHz) (dB) (dBm) (dB)
No filter 0 -136.0 0
fo = 1381.05 0 -135.2 0.8
fo - 1363.0 12 -135.0 1.0
fo - 1353.6 20 -134.5 1.5
fo - 1345.5* 25 -133.8 2.2
fo = 1339.5 32 -130.5 5.5
*1345.5 MHz is acceptable| _ _.. . ..... 0_
252
S. .. . • .. . -----
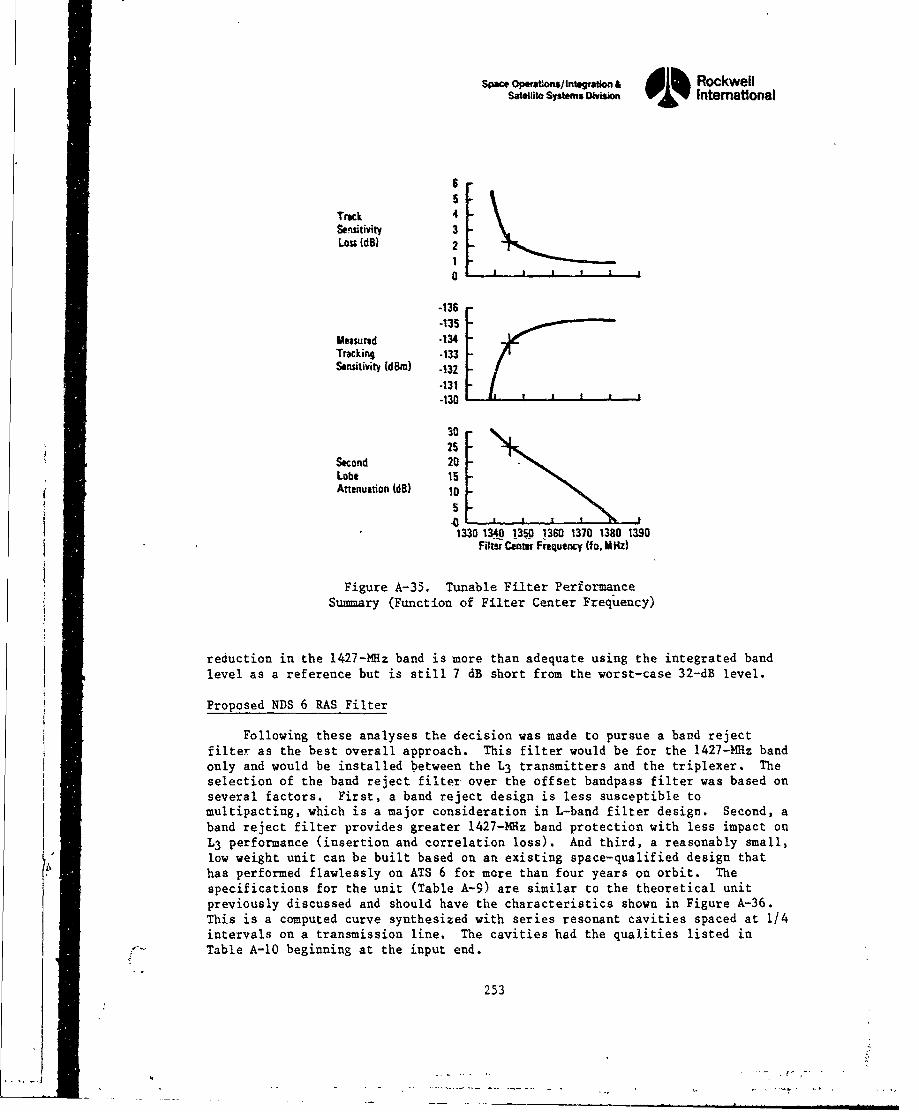
spas. Op•ef•/tnsi Inteaion a Rockwellsawtllo spsmas •w'ison Intemational
5
Track 4Sesitivity 3
Loss (dB) 2
0
-136 r-135
Measured -134Tracking -133Sensitivitv (dW ) -132
-131-130
3025
Second 20Lobe 15Anenuation (d) 10
S-0 r
Fu0 130t 1350 1360 1370 1380 1390Filtr Cete Frequency (re, M•z)
Figure A-35. Tunable Filter PerformanceSummary (Function of Filter Center Frequency)
reduction in the 142 7-Mz band is more than adequate using the integrated band
level as a reference but is still 7 dB short from the worst-case 32-dB level.
Proposed NDS 6 RAS Filter
Following these analyses the decision was made to pursue a band rejectfilter as the best overall approach. This filter would be for the 1427-m~z bandonly and would be installed between the L3 transmitters and the triplexer. Theselection of the band reject filter over the offset bandpass filter was based onseveral factors. First, a band reject design is less susceptible tomultipacting, which is a major consideration in L-band filter design. Second, aband reject filter provides greater 1427-MHz band protection with less impact onL3 performance (insertion and correlation loss). And third, a reasonably small,"low weight unit can be built based on an existing space-qualified design thathas performed flawlessly on ATS 6 for more than four years on orbit. Thespecifications for the unit (Table A-9) are similar to the theoretical unitpreviously discussed and should have the characteristics shown in Figure A-36.This is a computed curve synthesized with series resonant cavities spaced at 1/4intervals on a transmission line. The cavities had the qualities listed inTable A-10 beginning at the input end.
253
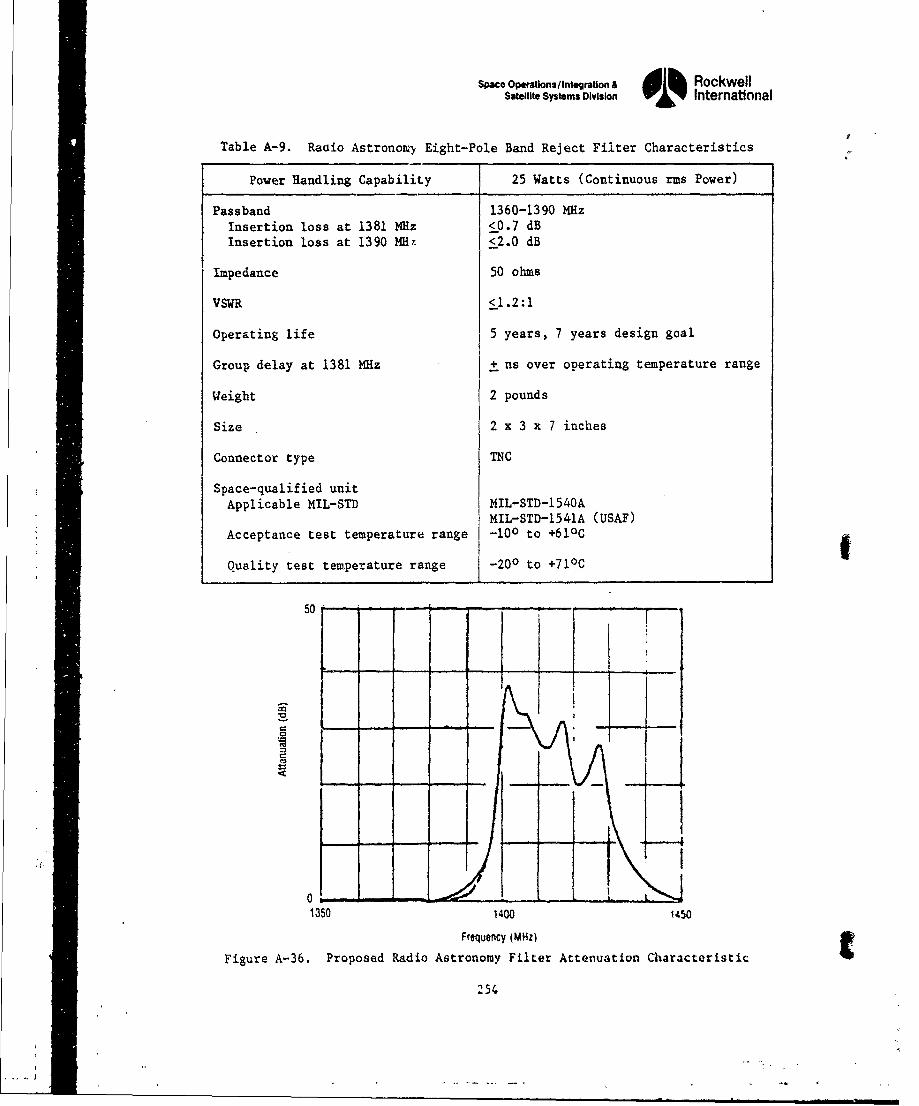
Space Operations/Integration & dlh RockwellSatellite Systems Division '•Y International
Table A-9. Radio Astronouý Eight-Pole Band Reject Filter Characteristics
Power Handling Capability 25 Watts (Continuous rms Power)
Passband 1360-1390 MHzInsertion loss at 1381 1Hz <0.7 dBInsertion loss at 1390 tH <Z2.0 dB
Impedance 50 ohms
VSWR <1.2:1
Operating life 5 years, 7 years design goal
Group delay at 1381 MHz ± ns over operating temperature range
Weight 2 pounds
Size 2 x 3 x 7 inches
Connector type TNC
Space-qualified unit
Applicable MIL-STD MIL-STD-1540AMIL-STD-1541A (USAF)
Acceptance test temperature range -100 to +610 C
Quality test temperature range -200 to +710 C
50 " - -.... .. .-
50
0 L L
1350 1400 14so
Frequency (MHz)
tC
Figure A-36. Proposed Radio Astronomy Filter Attenuation~ Characteristic
"254
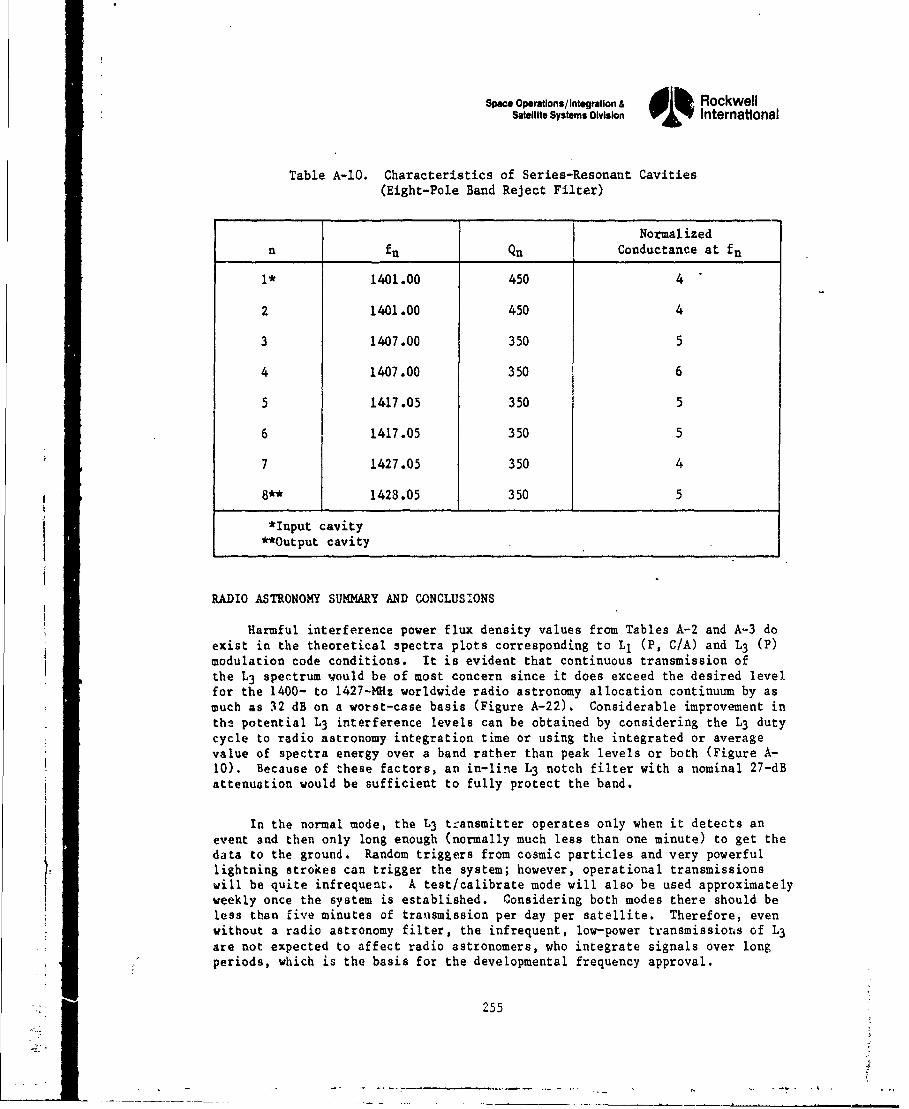
Space Operations/ Integration & RockwellSatellite Systems Oivlsion IvF lW International
Table A-1O. Characteristics of Series-Resonant Cavities(Eight-Pole Band Reject Filter)
I Normalized
n fn Qn Conductance at fn
,* 1401.00 450 4
2 1401.00 450 4
3 1407.00 350 5
4 1407.00 350 6
5 1417.05 350 5
6 1417.05 350 5
7 1427.05 350 4
8** 1428.05 350 5
*Input cavity**Output cavity
RADIO ASTRONOMY SUMMARY AND CONCLUSIONS
Harmful interference power flux density values from Tables A-2 and A-3 doexist in the theoretical spectra plots corresponding to Ll (P, C/A) and L3 (P)modulation code conditions. It is evident that continuous transmission ofthe L3 spectrum would be of most concern since it does exceed the desired levelfor the 1400- to 1427-MHz worldwide radio astronomy allocation continuum by asmuch as 32 dB on a worst-case basis (Figure A-22). Considerable improvement inthe potential L3 interference levels can be obtained by considering the L3 dutycycle to radio astronomy integration time or using the integrated or averagevalue of spectra energy over a band rather than peak levels or both (Figure A-10). Because of these factors, an in-line L3 notch filter with a nominal 27-dBattenuation would be sufficient to fully protect the band.
In the normal mode, the L3 t-ansmitter operates only when it detects anevent and then only long enough (normally much less than one minute) to get thedata to the ground. Random triggers from cosmic particles and very powerfullightning strokes can trigger the system; however, operational transmissionswill be quite infrequent. A test/calibrate mode will also be used approximatelyweekly once the system is established. Considering both modes there should beless than five minutes of traasmission per day per satellite. Therefore, evenwithout a radio astronomy filter, the infrequent, low-power transmissions of IL3are not expected to affect radio astronomers, who integrate signals over longperiods, which is the basis for the developmental frequency approval.
255
Space Operatons/integratlon & RockwellSatellite Systems Division 01% International
The 1. spectrum has much less impact on the worldwide radio astronomy bandof 1664.4- to 1668.4-MHz, as shown in Figure A-20. However, reduction ininterference levels based on duty cycle is not possible since LI is transmittedcontinuously.
GPS L1 transmission can be forecasted over the earth's surface and radioastronomy measurements appropriately eliminated or judged separately at 1665 MEzduring interference periods. Announcements to the radio astronomy communityconcerning schedule and test periods with space vehicle coordinates couldalleviate this potential interference.
One approach to reducing both the L1 and L3 interference is to use filtersin the transmit lines to limit spectra to the desired levels. Band rejectfilters would ;esult in an insertion loss at 1l and L3 of 0.1 and 0.8 dB,respectively. Another method of reducing spectral energy to the desired levelis to modify the existing three-pole bandpass filter in the L3 triplexer arm.Replacing the three-pole bandpass filter with a five-pole design and loweringthe center frequency to approximately 1365 MHz should achieve the results asshown in the computer plot in Figure A-26. The additional insertion loss,compared to the three-pole design, is approximately 0.5 dB, for a total loss ofapproximately 1.2 dB.
2
256,;
i: ~ .


![% :.I COPY AVAILA']RV lj£gIE ~l - DTIC](https://static.fdokumen.com/doc/165x107/631e931825add517740b1bd2/-i-copy-availarv-ljgie-l-dtic.jpg)