Acoustic phenomena and hydrodynamic flow in a water filled nano-porous glass studied by transient...
6
Acoustic phenomena and hydrodynamic flow in a water filled nano-porous glass studied by transient grating spectroscopy This article has been downloaded from IOPscience. Please scroll down to see the full text article. 2010 J. Phys.: Conf. Ser. 214 012032 (http://iopscience.iop.org/1742-6596/214/1/012032) Download details: IP Address: 150.217.156.84 The article was downloaded on 12/04/2010 at 09:19 Please note that terms and conditions apply. The Table of Contents and more related content is available Home Search Collections Journals About Contact us My IOPscience
-
Upload
independent -
Category
Documents
-
view
0 -
download
0
Transcript of Acoustic phenomena and hydrodynamic flow in a water filled nano-porous glass studied by transient...
Acoustic phenomena and hydrodynamic flow in a water filled nano-porous glass studied by
transient grating spectroscopy
This article has been downloaded from IOPscience. Please scroll down to see the full text article.
2010 J. Phys.: Conf. Ser. 214 012032
(http://iopscience.iop.org/1742-6596/214/1/012032)
Download details:
IP Address: 150.217.156.84
The article was downloaded on 12/04/2010 at 09:19
Please note that terms and conditions apply.
The Table of Contents and more related content is available
Home Search Collections Journals About Contact us My IOPscience

Acoustic phenomena and hydrodynamic flow in a water filled nano-porous glass studied by transient grating spectroscopy.
R. Cucini1, A. Taschin1, P. Bartolini1, R. Torre1,2
1 LENS, Univ. di Firenze, Via, N. Carrara 1, I-50019 Sesto Fiorentino (Fi), Italy. 2 Dip. di Fisica, Univ. di Firenze, Via Sansone 1, I-50019 Sesto Fiorentino (Fi), Italy. E-mail: [email protected] Abstract. We present heterodyne detected transient grating measurements on water filled Vycor glass in the range of temperature 20-90 °C at the wave vector q = 1 µm-1. The data have been analyzed with the model of Pecker and Deresiewicz, which enables a consistent physical description of the measured complex dynamics. Our experimental results confirm that the system is well described by hydrodynamic laws in spite of nano-metric dimension of the pores.
1. Introduction The study of acoustic wave propagation and viscous flow of liquids through porous media is an important topic in the physics of heterogeneous matter [1], pertaining not only to fundamental issues but also to a wide range of applications ranging from geophysical investigations to engineering technology. The propagation of sound in a porous solid filled by a liquid can be described by a phenomenological model introduced by M. A. Biot [2, 3], that is still extensively used to predict the essential acoustic properties of a wide variety of porous media.
Nevertheless testing of the Biot theory at ultra/hypersonic frequencies and in porous media with nano-metric scale heterogeneities remains an open issue [4, 5]. Moreover the interplay between the acoustic propagation, the viscous flow of the liquid inside the pores and the heat diffusion represents a complex problem, which characterization is still poor. Concerning the theories, the model of Pecker and Deresiewicz [6] extends the Biot approach to the thermal effects. However, the comparison of this model with the experimental results has been limited to media having semi-macroscopic pores and it has been focused on the very slow dynamics. In fact, the complete experimental investigation of the dynamics is challenging, because the relaxation and transport phenomena in porous media spans over a very large range of time-scales. Using a time-resolved optical spectroscopic technique (heterodyne detected transient grating experiments) we undertaken a series of investigations of transport processes in a nano-porous glass (Vycor 7930) filled by water [7, 8].
2. Experimental Set-Up In a heterodyne detected transient grating (HD-TG) experiments [9, 10, 11, 12], two infrared laser pulses, typically obtained dividing a single pulsed laser beam, interfere within the sample producing an impulsive spatially periodic variation of the dielectric constant. The spatial modulation is characterized by a wave vector q which is given by the difference of the two pump wave vectors
15th International Conference on Photoacoustic and Photothermal Phenomena (ICPPP15) IOP PublishingJournal of Physics: Conference Series 214 (2010) 012032 doi:10.1088/1742-6596/214/1/012032
c© 2010 IOP Publishing Ltd 1
k1−k2. Its modulus is q = 4π sin(θex)/λex, where λex and θex are the wavelength and the incidence angle of the exciting pumps, respectively. The relaxation toward equilibrium of the induced modulation can be probed by measuring the Bragg scattered intensity of a second CW laser beam. The time evolution of the diffracted signal supplies information about the dynamic of the relaxing TG and, consequently, of the dynamical properties of the studied sample. In our case, the transient grating is mainly induced by two effects: the electrostriction and the heating.
The first effect arises from the interaction between the molecular dipoles induced by the pump fields and the same pump fields. The electrostriction produces a pressure grating and consequently a density grating launching two counter-propagating acoustic waves whose superposition makes a standing acoustic wave.
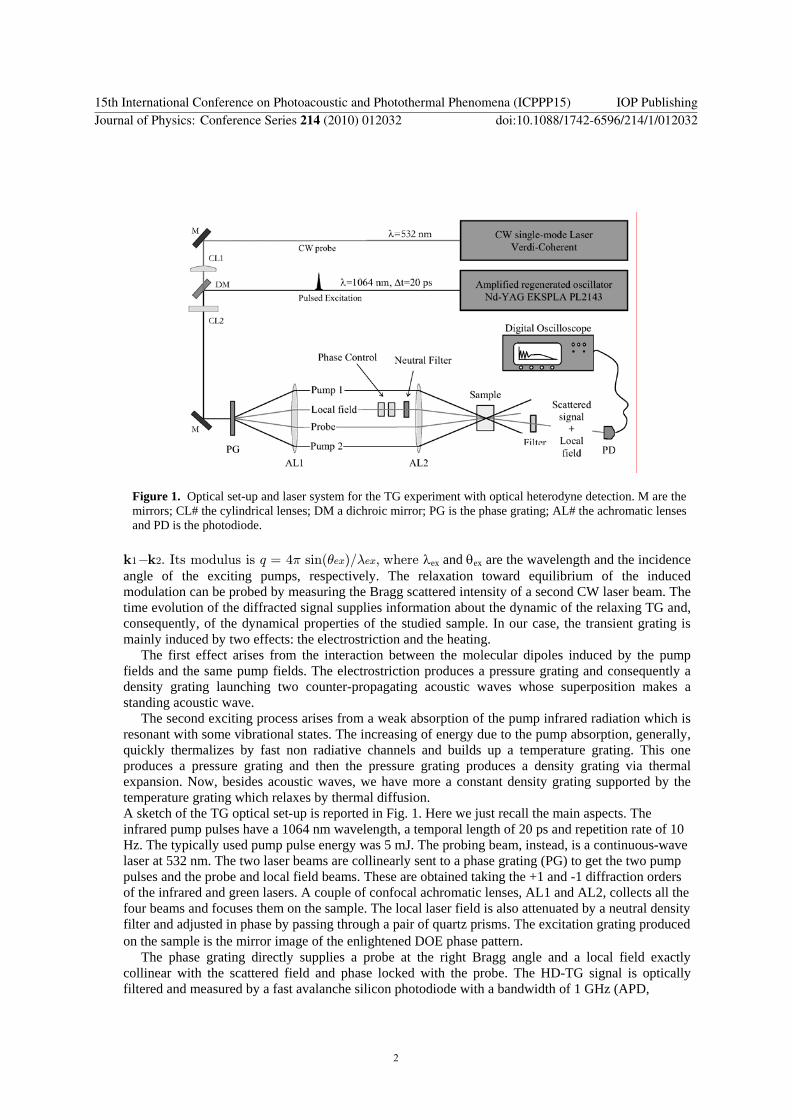
The second exciting process arises from a weak absorption of the pump infrared radiation which is resonant with some vibrational states. The increasing of energy due to the pump absorption, generally, quickly thermalizes by fast non radiative channels and builds up a temperature grating. This one produces a pressure grating and then the pressure grating produces a density grating via thermal expansion. Now, besides acoustic waves, we have more a constant density grating supported by the temperature grating which relaxes by thermal diffusion. A sketch of the TG optical set-up is reported in Fig. 1. Here we just recall the main aspects. The infrared pump pulses have a 1064 nm wavelength, a temporal length of 20 ps and repetition rate of 10 Hz. The typically used pump pulse energy was 5 mJ. The probing beam, instead, is a continuous-wave laser at 532 nm. The two laser beams are collinearly sent to a phase grating (PG) to get the two pump pulses and the probe and local field beams. These are obtained taking the +1 and -1 diffraction orders of the infrared and green lasers. A couple of confocal achromatic lenses, AL1 and AL2, collects all the four beams and focuses them on the sample. The local laser field is also attenuated by a neutral density filter and adjusted in phase by passing through a pair of quartz prisms. The excitation grating produced on the sample is the mirror image of the enlightened DOE phase pattern.
The phase grating directly supplies a probe at the right Bragg angle and a local field exactly collinear with the scattered field and phase locked with the probe. The HD-TG signal is optically filtered and measured by a fast avalanche silicon photodiode with a bandwidth of 1 GHz (APD,
Figure 1. Optical set-up and laser system for the TG experiment with optical heterodyne detection. M are the mirrors; CL# the cylindrical lenses; DM a dichroic mirror; PG is the phase grating; AL# the achromatic lenses and PD is the photodiode.
15th International Conference on Photoacoustic and Photothermal Phenomena (ICPPP15) IOP PublishingJournal of Physics: Conference Series 214 (2010) 012032 doi:10.1088/1742-6596/214/1/012032
2
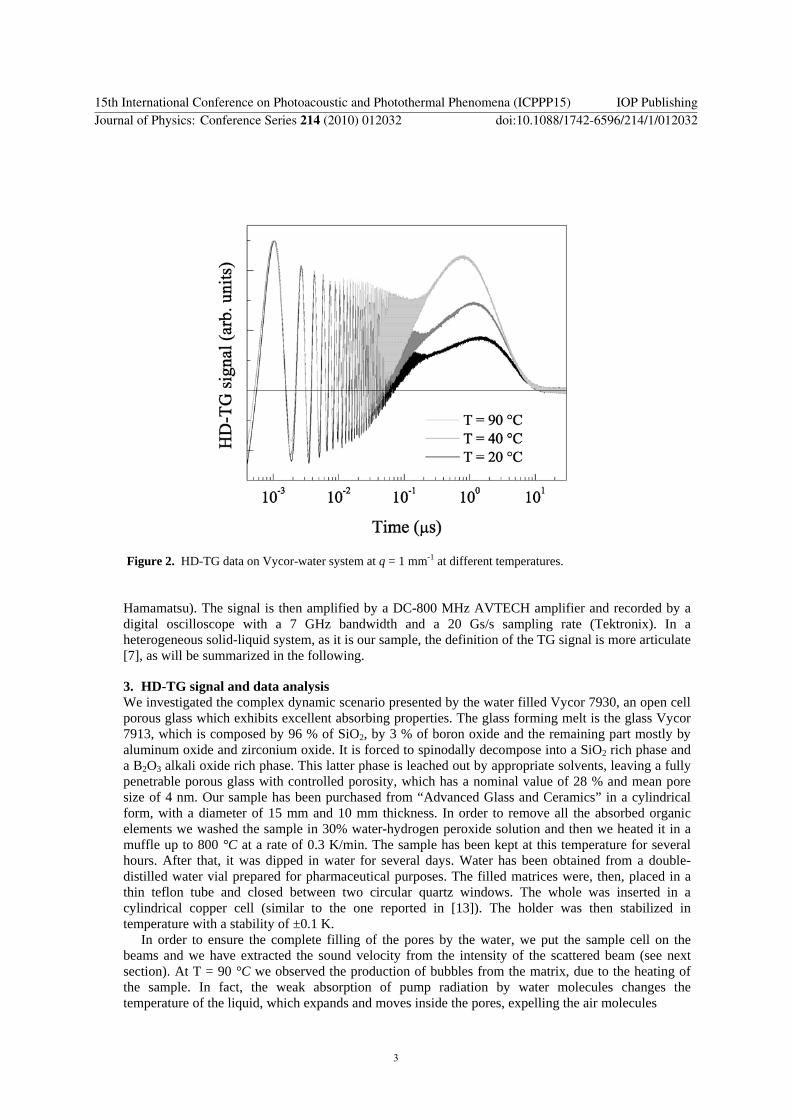
Figure 2. HD-TG data on Vycor-water system at q = 1 mm-1 at different temperatures.
Hamamatsu). The signal is then amplified by a DC-800 MHz AVTECH amplifier and recorded by a digital oscilloscope with a 7 GHz bandwidth and a 20 Gs/s sampling rate (Tektronix). In a heterogeneous solid-liquid system, as it is our sample, the definition of the TG signal is more articulate [7], as will be summarized in the following.
3. HD-TG signal and data analysis We investigated the complex dynamic scenario presented by the water filled Vycor 7930, an open cell porous glass which exhibits excellent absorbing properties. The glass forming melt is the glass Vycor 7913, which is composed by 96 % of SiO2, by 3 % of boron oxide and the remaining part mostly by aluminum oxide and zirconium oxide. It is forced to spinodally decompose into a SiO2 rich phase and a B2O3 alkali oxide rich phase. This latter phase is leached out by appropriate solvents, leaving a fully penetrable porous glass with controlled porosity, which has a nominal value of 28 % and mean pore size of 4 nm. Our sample has been purchased from “Advanced Glass and Ceramics” in a cylindrical form, with a diameter of 15 mm and 10 mm thickness. In order to remove all the absorbed organic elements we washed the sample in 30% water-hydrogen peroxide solution and then we heated it in a muffle up to 800 °C at a rate of 0.3 K/min. The sample has been kept at this temperature for several hours. After that, it was dipped in water for several days. Water has been obtained from a double-distilled water vial prepared for pharmaceutical purposes. The filled matrices were, then, placed in a thin teflon tube and closed between two circular quartz windows. The whole was inserted in a cylindrical copper cell (similar to the one reported in [13]). The holder was then stabilized in temperature with a stability of ±0.1 K.
In order to ensure the complete filling of the pores by the water, we put the sample cell on the beams and we have extracted the sound velocity from the intensity of the scattered beam (see next section). At T = 90 °C we observed the production of bubbles from the matrix, due to the heating of the sample. In fact, the weak absorption of pump radiation by water molecules changes the temperature of the liquid, which expands and moves inside the pores, expelling the air molecules
15th International Conference on Photoacoustic and Photothermal Phenomena (ICPPP15) IOP PublishingJournal of Physics: Conference Series 214 (2010) 012032 doi:10.1088/1742-6596/214/1/012032
3

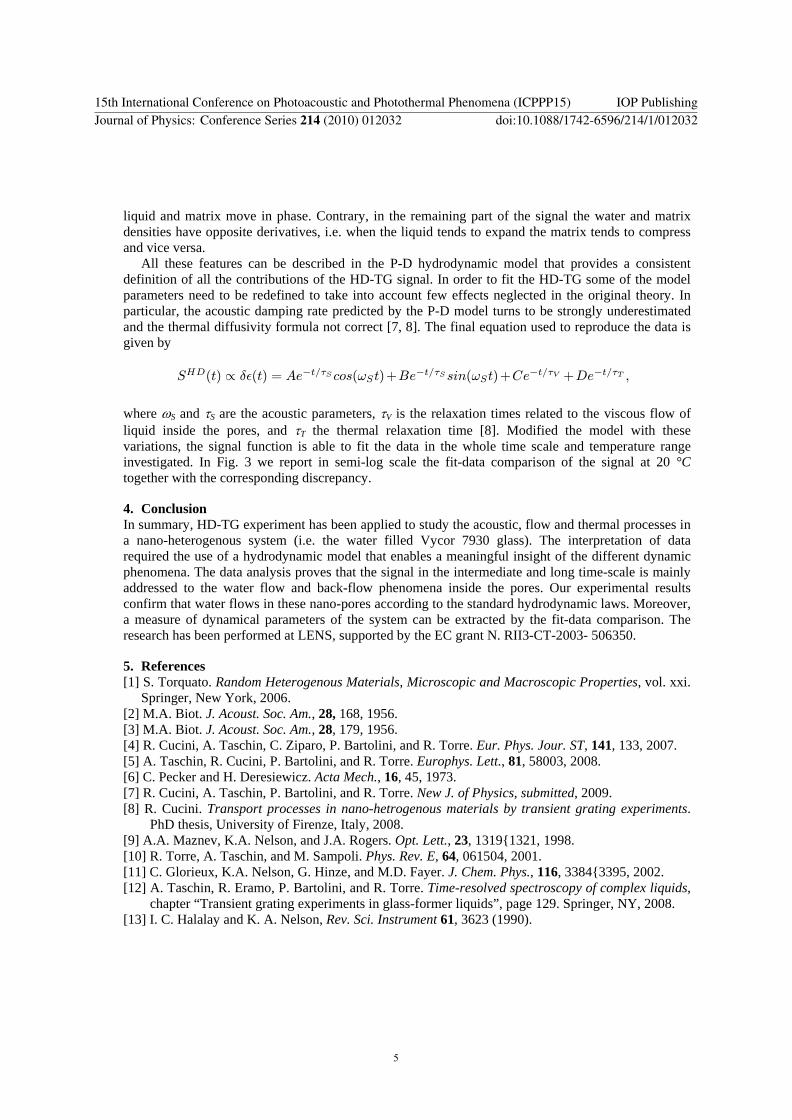
Figure 3. Comparison between data (continuous line) and fit (grey dash line) for the temperature 20 °C with the relative discrepancy.
trapped in the pores. We make different cycles with the cryostat from 90 to 20 °C, and vice versa. After each scan, the sound velocity at 90 °C changed its value. In details, this value increased. After same cycles the production of bubbles was interrupted, and the sound speed stabilized its value. When this condition was reached, we consider the matrix completely filled.
The HD-TG signals on water-filled Vycor have been collect in the range of temperature 20-90 °C at the wave vector q = 1 µm-1. The data at three different temperatures, 90, 40 and 20 °C, are shown in Fig. 2. The addressing of the different contributions appearing in the HD-TG signal is not trivial because of the complexity of the investigated sample. Only a hydrodynamic model can gives a meaningful inside in the experimental data and hence in dynamic features characterizing the sample. This has been achieved using the Pecker and Deresiewicz (P-D) model that enables to describe and calculate the time dependence of the water and Vycor local density and temperature variations, these observables can directly connected to the TG signal [7, 8]. Here we want just recall the main results that turns to have an intuitive physical understanding.
There are two important sample characteristics to be considered in order to understand the dynamics inside the water-Vycor system. The thermal expansion of water is greater than that of the matrix and the bulk modulus of the matrix is higher than the water one, the matrix is stiff. Hence, the expansion of the liquid is reduced by the stiffness of the matrix which exerts a pressure on the liquid. This implies that the acoustic oscillations induced by the temperature grating are substantially prevented and the free liquid expansion can not take place. The liquid can expand and change its density via the outflow from the heated pores; this water flow is driven by the pressure induced by the thermal grating. At later times, owing to the vanishing of the thermal grating for thermal diffusion, the matrix will exerts a negative pressure on the liquid which back-flows into the pores to equilibrate again the pressure.
Summarizing the origin of the TG signal for this nano-heterogenous system we can assert that the acoustic features are mainly generated by the electrostriction excitation and must be ascribed to both solid and liquid phases. The slower signal contributions are mainly due to the densities variations determined by flow and back-flow processes induced by the heating excitation. Another dynamic peculiarity is represented by the phases of matter motions. As regards the acoustic oscillations, the
15th International Conference on Photoacoustic and Photothermal Phenomena (ICPPP15) IOP PublishingJournal of Physics: Conference Series 214 (2010) 012032 doi:10.1088/1742-6596/214/1/012032
4
liquid and matrix move in phase. Contrary, in the remaining part of the signal the water and matrix densities have opposite derivatives, i.e. when the liquid tends to expand the matrix tends to compress and vice versa.
All these features can be described in the P-D hydrodynamic model that provides a consistent definition of all the contributions of the HD-TG signal. In order to fit the HD-TG some of the model parameters need to be redefined to take into account few effects neglected in the original theory. In particular, the acoustic damping rate predicted by the P-D model turns to be strongly underestimated and the thermal diffusivity formula not correct [7, 8]. The final equation used to reproduce the data is given by
where ωS and τS are the acoustic parameters, τV is the relaxation times related to the viscous flow of liquid inside the pores, and τT the thermal relaxation time [8]. Modified the model with these variations, the signal function is able to fit the data in the whole time scale and temperature range investigated. In Fig. 3 we report in semi-log scale the fit-data comparison of the signal at 20 °C together with the corresponding discrepancy.
4. Conclusion In summary, HD-TG experiment has been applied to study the acoustic, flow and thermal processes in a nano-heterogenous system (i.e. the water filled Vycor 7930 glass). The interpretation of data required the use of a hydrodynamic model that enables a meaningful insight of the different dynamic phenomena. The data analysis proves that the signal in the intermediate and long time-scale is mainly addressed to the water flow and back-flow phenomena inside the pores. Our experimental results confirm that water flows in these nano-pores according to the standard hydrodynamic laws. Moreover, a measure of dynamical parameters of the system can be extracted by the fit-data comparison. The research has been performed at LENS, supported by the EC grant N. RII3-CT-2003- 506350.
5. References [1] S. Torquato. Random Heterogenous Materials, Microscopic and Macroscopic Properties, vol. xxi.
Springer, New York, 2006. [2] M.A. Biot. J. Acoust. Soc. Am., 28, 168, 1956. [3] M.A. Biot. J. Acoust. Soc. Am., 28, 179, 1956. [4] R. Cucini, A. Taschin, C. Ziparo, P. Bartolini, and R. Torre. Eur. Phys. Jour. ST, 141, 133, 2007. [5] A. Taschin, R. Cucini, P. Bartolini, and R. Torre. Europhys. Lett., 81, 58003, 2008. [6] C. Pecker and H. Deresiewicz. Acta Mech., 16, 45, 1973. [7] R. Cucini, A. Taschin, P. Bartolini, and R. Torre. New J. of Physics, submitted, 2009. [8] R. Cucini. Transport processes in nano-hetrogenous materials by transient grating experiments.
PhD thesis, University of Firenze, Italy, 2008. [9] A.A. Maznev, K.A. Nelson, and J.A. Rogers. Opt. Lett., 23, 1319{1321, 1998. [10] R. Torre, A. Taschin, and M. Sampoli. Phys. Rev. E, 64, 061504, 2001. [11] C. Glorieux, K.A. Nelson, G. Hinze, and M.D. Fayer. J. Chem. Phys., 116, 3384{3395, 2002. [12] A. Taschin, R. Eramo, P. Bartolini, and R. Torre. Time-resolved spectroscopy of complex liquids,
chapter “Transient grating experiments in glass-former liquids”, page 129. Springer, NY, 2008. [13] I. C. Halalay and K. A. Nelson, Rev. Sci. Instrument 61, 3623 (1990).
SHD(t) ∝ δ²(t) = Ae−t/τScos(ωSt)+Be−t/τSsin(ωSt)+Ce−t/τV +De−t/τT ,
15th International Conference on Photoacoustic and Photothermal Phenomena (ICPPP15) IOP PublishingJournal of Physics: Conference Series 214 (2010) 012032 doi:10.1088/1742-6596/214/1/012032
5